an estimation of anurans species richness and abundance in ... · 1 an estimation of anurans...
TRANSCRIPT

1
An estimation of anurans species richness and
abundance in Sebangau Peat-Swamp Forest,
Indonesia, Borneo
Joanna Klys
05196662

2
Acknowledgements
This research project would not have been possible without the support of many people.
Foremost, I would like to express my sincere gratitude to my supervisor, Dr Caroline Ross,
whose encouragement, guidance and support from the initial to the final level enabled me to
develop an understanding of the subject.
My sincere thanks also goes to, Orangutan Tropical Peatland Project for letting me to
undertake research for my undergraduate honours project.
In particular, I would like to thank a research assistant Iván Mohedano, for his patience,
motivation, enthusiasm, and immense knowledge. His guidance helped me in all the time
during project. I would have been lost without him.
I would like to thank the staff and volunteers of the Outrop project for providing advice and
assistance in data collection.
Also I thank all the Indonesian field guides , without whose assistance I would not have been
able to carry out my research.
Last but not the least, I would like to thank my family: my parents, brother and friends for
helping me get through the difficult times.

3
Abstract
This report presents the results of the effects of selective logging on anurans in the
Sebangau forest in East Kalimantan, Borneo. We assessed the patterns of diversity, richness
and abundance in anuran’s communities for four sites in the Sebangau forest in East
Kalimantan, an important region given the great number of fauna and flora species. The main
objective was to assess anurans community factors relative to different degrees of disturbance
for the habitats of the Sebangau Catchment. Additionally, the results were compared with the
results obtained from other project conducted in the Bawan forest.
The data on anurans was obtained by Visual Encounter Surveys and Active Survey. Anurans
diversity for each habitat was assessed by using Shannon-Wiener index and the relative
abundance were standardized by capture rate (CR) for each species.
A total of 245 individuals and 8 species belonging to the family of Ranidae,
Bufonidae, Dicroglossidae and Rhacophoridae were identified in the Sebangau forest in 27
days between September and October 2010. The highest species richness was in the least
disturbed habitat, in the mixed peat swamp with 1.08 the Shannon- Wiener diversity index
and the lower species diversity obtained in the higher disturbed habitats including a canal in
the secondary peat swamp forest ( 0.28), a regenerating burnt area ( 0.6) and recently logged
gaps (0.53).
Furthermore, anuran species richness between different habitats in the Sebangau forest
and Bawan forest were compared using an independent samples t-test (2-tailed).
There was no significant difference in terms of species richness for the mixed peat swamp in
the Sebangau forest and the mixed peat swamp in the Bawan forest (p=0.1).

4
There was no significant difference in terms of species richness for the mixed peat swamp in
the Sebangau forest and kerangas in the Bawan forest (p=1).
There was no significant difference in terms of species richness for the mixed peat swamp in
the Sebangau forest and the kerangas with stream in the Bawan forest (p=0.09).
There was significant difference in terms of species richness for canal in the secondary forest
in the Sebangau and in the kerangas with stream in the Bawan forest (p=0.024).
There was significant difference in terms of species richness for the regenerating burnt area in
the Sebangau and in the regenerating burnt area in the the Bawan forest (p=0.024).
There was significant difference in terms of species richness for the regenerating burnt area
in the Sebangau and in the recently burnt area in the Bawan forest ( p=0.003).

5
Contents page
Acknowledgements…………………………………………………………....2
Abstract………………………………………………………………………..3
Contents page…………………………………………………………………………………..5
List of Tables………………………………………………………………………………….7
List of Figures………………………………………………………………………………….8
Introduction………………………………………………………………….10
Biodiversity in Borneo………………………………………………………………………..10
Threats faced by Bornean forests……………………………………………………………11
Decline Amphibians…………………………………………………………………………..12
Objectives and Hypotheses…………………………………………………………………..15
Methods………………………………………………………………………16
The study site………………………………………………………………………………….16
Environmental variables…………………………………………………………………......19
Conservation status of found anurans in the Sabangau forest......................................20
Habitat description…………………………………………………………………………....20
Survey design………………………………………………………………………………….22
Visual Encounter Survey………………………………………………………………...22
Active survey………….…………………………………………………………………...23
Other sampling methods………………………………………………………………….24
Measurements of captured animals……………………………………………………...24
Anurans calls……………………………………………………………………………...25

6
Relative abundance………………………………………………………………………25
Species richness…………………………………………………………………………...26
Bawan catchment…………………………………………………………………………27
Results………………………………………………………………………...29
Species composition of Sebangau forest...........................................................................34
Environmental parameters………………………………………………………………37
Species accumulation curves…………………………………………………………......38
Species diversity in Sebangau forest…………………………………………………….40
Relative abundance………………………………………………………………………41
Anurans calls……………………………………………………………………………..45
Results of Anurans species richness in Bawan forest…………………………………..46
Variation in anuran size and weight In the Sebangau forest and the Bawan forest and
the Bawan forest……………………………………………………………………………..50
Discussion……………………………………………………………………..51
Comparison in anurans species richness between the peat swamp lowland forests in
Sebangau and Bawan catchment …………………………………………….......57
Conclusions…………………………………………………………………...60
Evaluation of Project Success……………………………………..................63
Appendix A…………………………………………………………………...64
Appendix B…………………………………………………………………....66
Appendix C……………………………………………………………………69
List of references……………………………………………………………...72

7
List of tables
Table 2.1 Conservation status of anurans from the Sebangau forest in according the IUCN
Red List of Threatened Species.
Table 3.1 Number of individuals that were recorded in and out of transect during VES in four
different habitats including the mixed peat swamp, canal, burnt area and gaps.
Table 3.2 The results for the active surveys in the Sebangau forest.
Table 3.3 The number of individuals and species found at each of the different survey sites
using VES and active survey.
Table 3.4 Environmental parameters for the different habitat surveyed using VES
Table 3.5 Shannon- Wiener diversity and evenness index for anuran species in four different
habitats including the mixed peat swamp, canal, burnt area and gaps.
Table 3.6 The relative abundance per habitat for the main surveyed species (VES date).
Table 3.7 The number of days of collection of anurans and person hours.
Table 3.8 The number of individuals and species found at each of the survey sites using VES
and active survey in the Bawan forest (C = camp, K= kerangas, M-PS = mixed-peat
swamp.
Table 3.9 Comparing species richness Sebangau vs. Bawan forest.
Table 3.10 Parametres for anurans found in the Sebangau forest (in black) and in
the Bawan forest(in red).
Table 3.11 The list of calls anurans recorded in the Sebangau forest.

8
List of figures
Figure 2.1 Map of Borneo.
Figure 2.2. Map of Sebangau Forest in Borneo with Natural Laboratory of Peat Swamp
Forest’ (NLPSF).
Figure 2.3 Some habitats in the study site including mixed peat-swamp forest (upper),
canal in peat-swamp forest (left) and forest sedge (right).
Figure 2.4 The location of transects including mixed peat-swamp forest (green), canal (blue),
regenerating burnt area (red) and gaps (yellow) in the study site The grid system
was designed for orangutans study in NLPSF, Sebangau.
Figure 2.5 Map of Bawan Forest in Borneo.
Figure 3.1 The percentage of species recorded on all VES and active
surveys in 6 habitats including camp, the regenerating burnt area, canal in the
secondary forest, recently logged gaps, the mixed peat swamp and forest sedge.
Figure 3.2 Species abundance of anurans at each of six habitats including camp, the mixed
peat swamp forest.
Figure 3.3 Amphibian species found in the Sebangau forest. From left to right:
Ingerophrynus quadriporcatus (top), Pseudobufo subasper, Hylarana
baramica, Occidozyga, laevis, Limnonectes paramacrodon (bottom), Polypedates
leucomystax, Polypedates colletti, Polypedates macroti.
Figure 3.4 Species accumulation curve of frogs observed in the mixed forest in the
Sebangau forest during 18 days ( interval 30 minutes). Results include data from
VES ( in- transect) and active survey.

9
Figure 3.5 Species accumulation curve of frogs observed in a canal in the Sebangau forest
during 18 days ( interval 30 minutes). Results include data from VES (in transect)
and active survey.
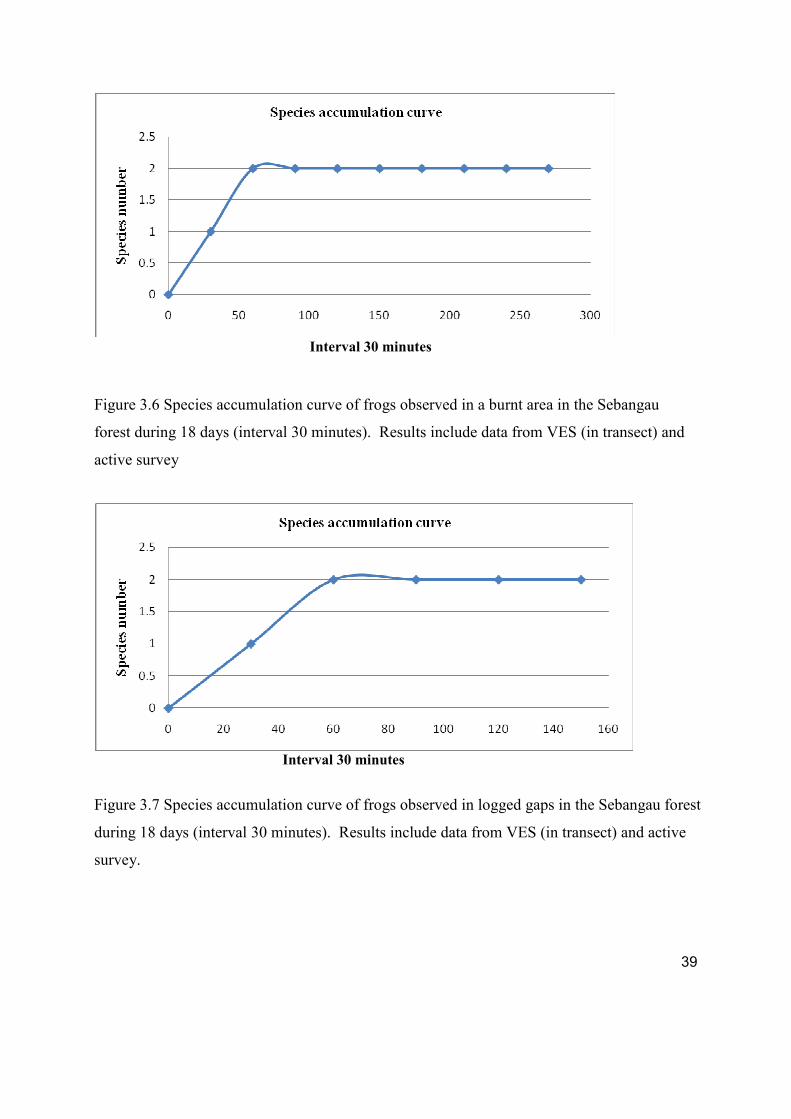
Figure 3.6 Species accumulation curve of frogs observed in a burnt area in the Sebangau
forest during 18 days ( interval 30 minutes). Results include data from VES (in
transect) and active survey.
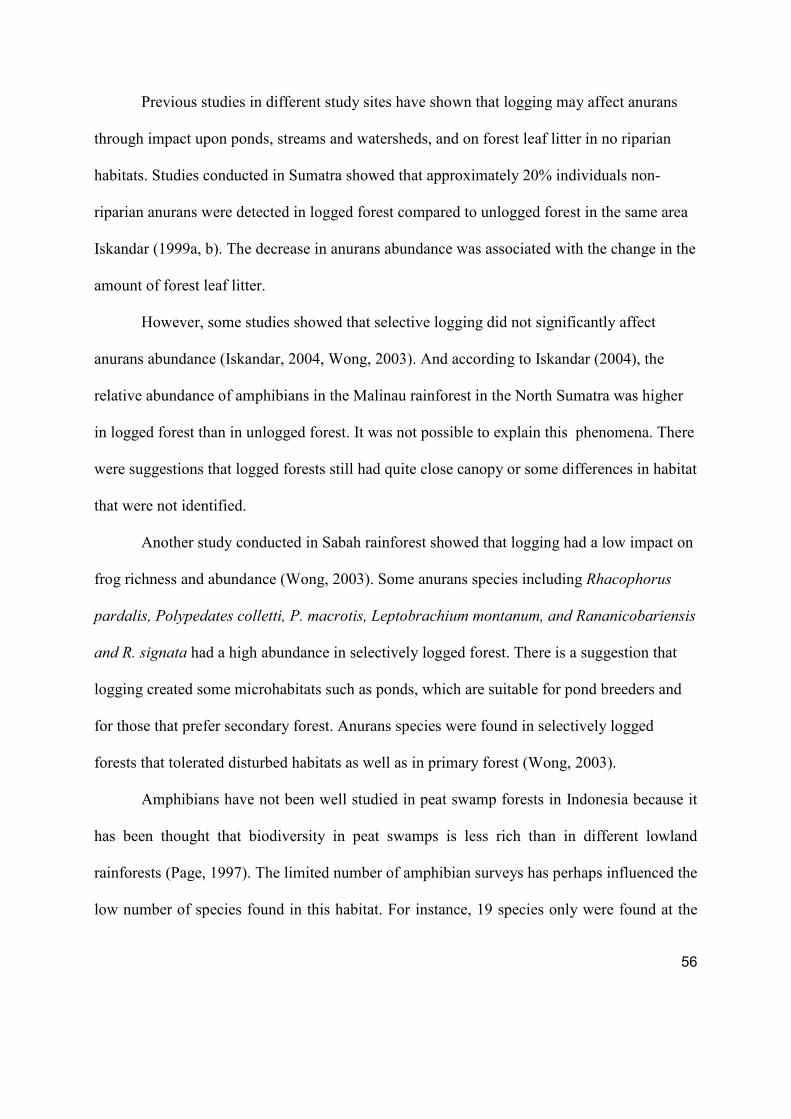
Figure 3.7 Species accumulation curve of frogs observed in logged gaps in the Sebangau forest
during 18 days ( interval 30 minutes). Results include data from VES (in transect) and
active survey.
Figure 3.8 The Shannon- Wiener diversity index for anurans species in four different habitats
including the mixed peat swamp, canal, burnt area and gaps.
Figure 3.9 The relative abundance of five different species in the mixed peat swamp.
Figure 3.10 The relative abundance of five different species in a canal in secondary peat
swamp forest.
Figure 3.11 The relative abundance of five different species in a regenerating burnt area.
Figure 3.12 The relative abundance of species in recently logged gaps.

10
Introduction
Biodiversity in Borneo The one of the major ecological issues, which is currently discussed among
conservationists and researchers worldwide, is whether logging forest influences fauna and
flora species diversity and ecological processes in the rain tropical forests. The description of
biological diversity is crucial to protect and use suitably biological resources (Veith et al,
2004).
Borneo, which is the third largest island on the earth, is one the richest regions of
biodiversity: the flora includes 15.000 species of flowering plants and 3000 species of tree;
222 species of mammal; 420 species of bird, about 145 amphibians (mostly frogs) and 250
reptiles are also found in Borneo (MacKinnon, 1996). This island is also inhabited by 13 non-
human primate species, eight of which are endemic (Groves, 1993). Borneo is home to three
primate species which are described by IUCN as “Endangered” including the Bornean
orangutan (Pongo Pygmaeus), the Bornean southern gibbon (Hylobates albibarbis) and
proboscis monkey (Nasalis larvatus) (Outroop, 2010).
About 140 species of frogs have been identified in Borneo and new species frogs are
found every year. In this area six families of frogs occur including Bombinatoridae,
Megophryidae, Bufonidae (the so-called ‘true toads’), Microhylidae, Ranidae (the so-called
‘true frogs’) and Rhacophoridae (Inger, 2005). Among amphibians, about 65% of the species
are endemic to Borneo. The richness in diversity of amphibians is connected with the location
Borneo on the equator in the humid tropics. Additionally, Borneo was connected and
disconnected from the mainland and other islands many times in the past (Veith et al, 2004).

11
Peatlands cover 3 % of the world’s surface. The Sebangau peat-swamp forest is
located in the south of Borneo Island in the Indonesian province of Central Kalimantan. This
ecosystem is the largest area of contiguous lowland rainforest remaining in Borneo
(Cheyne, 2010). The tropical peat swamp forest, described as a dual ecosystem with a tropical
forest and a peat layer, is the main habitat occurs in this area. A peat soil contents 65% or
more organic matter. The peat deposits are usually at least 50cm thick, but they can be very
deep up to 20 m (MacKinnon, 1996). The Sebangau forest has been illegally and legally
logged and cleared partly as a result of ‘mega rice project ‘between 1997-98 (OuTrop, 2010).
Additionally, the area has been affected by fires used in land clearance and drainage from
building logging canals causing destruction of the hydrological systems (Cheyne, 2010).
Threats faced by Bornean forests
The percentage of the world’s forest in Indonesia was estimated at between 3 and 4
percent in 2001. It was assessed that 2 million hectares of forest in Indonesia are cut down
every year (Williams,2007).
The forest destruction in Borneo, is one of the main causes of the high degree of
biodiversity loss in the world. According to FAO (2010), about 500.000 ha of forest are
logged every year.
The degradation of the Borneo’s forests is caused by agriculture, drainage,
deforestation, fires and pollutions. Forest fires are the results of land clearing for agriculture.
When forest is cut down, fires can easily spread out (Williams, 2007). For instance, the EL
Niño/Southern Oscillation event, which happened between 1997 and 1998, was the largest

12
fire disaster ever in a tropical rainforest and destroyed 5.2 million hectares of vegetation
cover, including 2.6 million hectares of forest. Furthermore, peat swamp forests contain the
high amount of carbon, which during a fire is released vast amounts into the atmosphere,
making Indonesia one of the world’s biggest CO₂ emitters (Veith et al, 2004).
Although the peatland is nutrionally poor, logging of these forests still continues
(Williams, 2007).
The biodiversity in Indonesia is critically endangered because of an increase in the rate
of tropical deforestation. The oil palm industry is one of the main cause that affecting
Borneo’s biodiversity. The expansion of oil palm plantations in Kalimantan, Indonesian
Borneo, has causesd the degradation of native forests, with plantations of oil palm not able to
provide suitable habitat for many species dependent on forests. This situation leads to the
extinction of these species. Other factors which influence on deforestation are the timber and
pulp industries, coal mining and extracting gold. Although international and national
conservation organizations are trying to protect tropical forests, the clearance of the forests is
still continuing (Venter, 2008).
Decline of Amphibians
There are about 6000 known species of Amphbians worldwide. Although, the
discovery of new species is the most rapid among vertebrate group, the knowledge of the
amphibian ecology is still only partial. The greatest amount of amphibians occurs in the
tropical and moist tropical forest of Eastern and Southern Asia, Central America, South
America and Equatorial Africa (Amphibian Web; Frost 2006).

13
Since the late 1980s, herpetologists have reported that the richness of amphibians
declined worldwide and that some of them are being driven to extinction at an alarming rate
(Stuart et al, 2004). For instance, 12% of bird species and 23% of mammal species are
endangered in comparison to 32% of amphibian’s species. Some conservation programs such
as the Amphibian Conservation Action Plan are designed to conserve and protect them
(Mendelson, 2006).
According to IUCN, about 33% of the amphibian species are described as vulnerable,
endangered or critically endangered. In spite of the fact that habitat loss is the main reason for
the decline amphibians, some evidence shows that these vertebrate suffer in apparently
undisturbed ecosystem (Stuart et al, 2004).
Amphibians are generally considered suitable as indicator species in a variety of
systems. Their biphasic life cycle and semi-permeable skin are two justifications often given
for this use of amphibians. Amphibians as ecological indicators may enable to observe the
dramatic changes in biological diversity. This class of vertebrate is really susceptible to any
change in habitat in which they live. The great loss of amphibians is probably caused by a mix
of different factors including infectious diseases, toxins, the introduction of exotic species,
climate change and unsuitable land use (Stuart et al, 2004). Scientists and conservationists
claim that understanding of the correlations between these factors and the amphibians loss is
still unclear. Amphibians that occupy usually small areas are more susceptible to extinction
because of habitat degradation than other vertebrate. They may be used as ecological
indicators because of their complex life cycle and the diversity of species. These
characteristics, in combination with their disappearances worldwide in twentieth century
make them an important model for understanding global change; including climate change,

14
earth warming, pollution or habitat loss and how they affect biodiversity (Stuart et al, 2004).
For instance, global warming generates climatic events such as extreme droughts or heavy
rainfall (Houghton, 2001). Additionally, climate change can cause the growth of disease
transmission. In the past, organisms have reacted to climate change by changing their
distribution. Currently, life forms are limited in their ability to move to different areas by
agricultural development, urbanization or deforestation.
It is important to understand the causes of decline and extinction amphibians by
monitoring amphibian diversity in long- term studies and developing conservation
programmes. Overall, conducting flora and fauna biodiversity surveys in tropical rainforest, it
is crucial to protect existing habitat, preventing habitat degradation and developing habitat
restoration methods (Stuart et al, 2004).

15
My objectives during this study were to:
• Assess amphibian biodiversity in the peat-swamp forest of the Sebangau Catchment
• Compare the amphibians species richness and abundance between different habitats, related
to degrees of disturbance of the Sebangau Catchment
• Compare the Anurans species richness between the peat-swamp forest of the Sebangau
Catchment and on the kerangas ( heath ) forest of Kahayan Catchment, in Bawan District
Hypotheses
1) The abundance and richness of frogs will differ between different sites (with different
degrees of forest disturbance) within peat-swamp forests of the Sebangau Catchment.
2) Species assemblage of frogs will differ between different sites (with different degrees of
forest disturbance) within the Sebangau Forest.
3) Species richness will differ between the Sebangau Catchment and the kerangas (heath)
forest of Kahayan Catchment

16
Methods
The study site
Figure 2.1 Map of Borneo ( Googlemap)
Borneo, which is situated on the equator, has a moist and tropical climate (Figure 2.1).
Temperatures are moderately steady during the year between 25C and 35 C in lowland areas. The
amount of rainfall in equatorial lowland areas account is at least 60mm every month. Two main
types of monsoons appear in Borneo including: a “dry” monsoon from May to October and a “wet
“monsoon from November to April (MacKinnon, 1996).

17
Sebangau Catchment
The study took place at OuTrop’s base camp Setia Alam [2*20’42”S, 114*2’11” E]
within 500km² semi protected ‘Natural Laboratory of Peat Swamp Forest’ (NLPSF) in the
Northern Sebangau catchment (Figure 2.2). NLPSF is located 20 km south-west of
Palangkaraya, the provincial capital of Central Kalimantan (Hamard, 2010). The Sebangau
National Park, which was established in 2004 is located between the Katingan River and the
Kahayan River, Central Kalimantan. Although, NLPSF is not a part of the Sebangau National
Park, this area was established as a research area and it is guarded by governmental decree
(Morrogh-Bernard et al, 2003).
Setia Alam Field Station is within the edge of the forest that has been logged. NLPSF
is directed by CIMTROP (the Centre for the International Cooperation in Management of
Tropical Peatlands), an Indonesian research and conservation organization based at the
University of Palangka Raya (UNPAR).
This area has been logged and drained by the building of logging canals. As result of this, the
area comprises logged, recovering and primary forest. At the time when the study was
conducted this forest was not logged. However, little amounts of non- timber forest products
including bark, rattan, orchids or latex were being harvested (Hamard, 2010).
The lowland forest in NLPSF is classified as secondary closed –canopy evergreen. This area has
a large amount of rainfall during the year and is seasonally flooded, approximately for 9 months.
The Sebangau peat-swamp forest is divided into four classes of forest including the mixed swamp
forest, transitional/ mixed-swamp, the low interior forest and tall interior forest (Cheyne, 2011).The
mixed peat swamp forest occurs up to about 5-6 km between the edges of forest.

18
This type of forest has numerous types of different tree species up to 35 meters height with a closed
layer of canopy from 15 to 25 m. The depth of peat is around 6m. This area is water logged during
the wet season and most of the dry season. As result of logging, the forest is dense with Pandanus
and Freycinetia spp.. There is, however, some illegal logging and the forest is susceptible to fires
(Cheyne, 2011). The most common tree species of the upper canopy are Gonystylus bancanus,
Shorea spp, Cratoxylon glaucum and Dactylocladus stenostachys.
The low interior forest is located between 6km and 11 km within the forest. The height
of trees is from 10m to 15m. The tree species of the upper canopy include Combretocarpus
rotundatus and Calophyllum spp.. Additionally, the large amount of light in the canopy and
high water level in the forest causes the growth of the thick undergrowth of Pandanus and
Freycinetia spp.. Furthermore, the tall interior forest, which is situated between 13 and 23 km
within forest, has the largest number of different tree species, which are up to 45metres. Peat
can be deep up to 13 meters in this forest. This type of forest comprises a large richness of
tree species including species of the genera Agathis Dactylocladus, Gonystylus, Koompassia,
Palaquium and Shorea (Husson, 2004, Morrogh-Bernard et al., 2003).

19
Figure 2.2. Map of Sebangau forest in Borneo with Natural Laboratory of Peat Swamp Forest’
(NLPSF) (Outrop, 2010).
Environmental variables
Environmental variables were measured every night of the survey including temperature (⁰C)
using a thermometer, humidity (%) using a thermo-hygrometer, cloud cover (%) visually as well as
general information about the weather.
Furthermore, all habitats were described to investigate habitat preferences of anurans

20
including canopy height, water depth, water temperature, canopy cover and scrub density. These
were measured at 100 m intervals along each transect, apart from established transects in recently
logged gaps which had 50 meters length.
Conservation status of found anurans in the Sebangau forest There are 8 species of anurans known to be present in the Sebangau forest (IUCN, 2010) (Table
2.1).
Species Family IUCN Red List of Threatened Species
Ingerophrynus quadriporcatus BUFONIDAE Least Concern (LC) Pseudobufo subasper* BUFONIDAE Least Concern (LC) Hylarana baramica RANIDAE Least Concern (LC) Limnonectes paramacrodon DICROGLOSSIDAE Near Threatened (NT) Occidozyga laevis DICROGLOSSIDAE Least Concern (LC) Polypedates colletti RHACOPHORIDAE Least Concern (LC) Polypedates leucomystax RHACOPHORIDAE Least Concern (LC) Polypedates macrotis RHACOPHORIDAE Least Concern (LC)
Table 2.1 Conservation status of anurans from the Sebangau forest according the IUCN Red
List of Threatened Species.
Habitat description
The study was conducted in four various habitats with differing levels of disturbance
of the forest, including secondary mixed peat-swamp forest, canal in secondary peat-swamp
forest, regenerating burnt forest and recently logged canopy gaps. Secondary mixed peat

21
swamp and canals are less disturbed than regenerating burnt forest and logged canopy gaps.
Canals were built to carry logged trunks to the river. As result of which, water was drained
from the peat causing increased forest susceptibility to fires (Morrogh-Bernard, 2003).
The burnt areas developed during fires in the dry season of 2006 and 2007. Gaps were
cut to enable hunting for bats (Harrison, M., 2009).
Additionally, different habitats were chosen to measure the anurans species richness
including the camp area, the flooded sedge and a few other micro-habitats (Figure 2.3).
Figure 2.3 Some habitats in the study site, including mixed peat-swamp forest
(top), canal in peat-swamp forest (left) and forest sedge (right) (pictured by
Ivan Mohedano).

22
Legend
transects
Mixed peat swamp
canal
Burnt area
gaps
Figure 2.4 The location of transects including mixed peat-swamp forest (green), canal (blue),
regenerating burnt area (red) and gaps (yellow) in the study site The grid system was designed
for orangutans study in NLPSF, Sabangau (Harrison, M., 2009).
Survey design
The survey of Anurans was conducted in the downland rainforest in the Sebangau
Catchment in East Kalimantan, Borneo between September and October 2010.
Two different sampling methods were used during the anuran study, including night
transects Visual Encounter Survey (VES) and active surveys. In this site, eight transects were
established in four main habitats.

23
Visual Encounter Survey (VES)
Transects were placed along pre-existing trails designed for orangutans study in the
mixed –swamp forest, NLPSF, Sebangau (Husson, 2004). 8 straight-line transects were
established, using a measuring tape, at length from 50m to 600m and were marked- out with
raffia (following a compass bearing) (Table 3.1). For effective sampling, all transects were
searched more than once during the study to find all the species occurred in the study site
(Heyer et al. 1994) (Figure 2.4).
Specimens were collected by members of the field station and by foreign scientists.
Observers walk along transects slowly at night using headlights, with a gap of approximately
2-4m between each observer. Specimens that could be seen within a (approximately) a 2m
band, along both sides of a transect were counted and captured. Opportunistic contacts were
recorded as well (out of transects). The number of observers varied between two and four
people. Some of them were less or more experienced in searching anurans.
The location of each anuran individual was identified by sight or call and recorded using
GPS.
Surveys were carried out between 6pm and 10 pm every night. The night transect was chosen
because dusk and dawn are the times when most frogs are active and when most
advertisement calling occurs (Inger,2005).
Walking within the study site was obstructed by a high density of vegetation, exposed
tree roots and pneumatophores (mangrove roots). Additionally, the amount of the rainfall
between September and October 2010 was greater than usually in the dry season in this area,
causing water- logged transects.

24
Active survey
Additionally, an active survey was carried out during the anuran study, observers
walked in different areas. This sampling method was carried out out- transects (-
opportunistic) in prescribed time (30min, 1.30min and 2 hours), systematically searching for
animals. Active searches were conducted at night (Table 3.2). The results were added to the
estimation of species richness (Sutherland, 2006).
Other sampling methods
Other methods as such as day transect, trapping, or artificial refuge were not used in the
Sebangau Forest. These methods have been used in the kerangas forest of the Kahayan Catchment
and have been identified as not effective in a tropical environment (Waddell, 2011).
Measurements of captured animals
Each individual was put in a plastic bag and measured. The anurans weight was
measured using a spring balance to the nearest 1g and their snout- vent length was assessed by
dial caliper to the nearest 0.1mm. Animals were then identified based on taxonomic guides
(Inger and Stuebing, 2005). In addition, unknown anurans were photographed and indentified
(photographs from frogs-of-Borneo.com). All captured animals were released and relocated at
the same location as they were found in. The survey wasn’t conducted during storms because
of health and safety procedure. The same transects were not surveyed on consecutive days in
order to ensure independence of samples.

25
Anurans calls
There were identified five different anurans calls. Calls were recorder by a Dictaphone
and identified by field staff.
Relative abundance
Anurans were detected ‘in–transect’ and ‘out-transect’ (opportunistic) during the
performing of the sampling method VES. Only relative abundance could be measured because
amphibians were not marked during their recapturing. VES is not effective method for
accurately estimating population size unless it come together with a mark-recapture (Hill,
2005). The total number of individuals of one species was divided by the total number of
individuals of all species to obtain relative abundance. The average of relative abundance for
each species was determined by conducting repeated surveys for each transect. Survey was
standardized by conducting sampling at the same time of day or by randomized observations
(Hoyer, 1994). However, different amounts of time were spent on each transect and different
sizes of groups people were involved in searching (Cook, 2010).
The total number of individuals recorded was divided by the person hours spent for each
search. Person hours were obtained by multiplying the total amount of time spent searching
by the number of people taking part in the search.

26
CR( capture rate)=the total number of individuals /total time*number of people for each
species( person hours)
Species richness
Data obtained during VES (in- and out-transects) and active survey was used to measure the
species richness. Active survey was employed to obtain a more comprehensive the species
checklist.
The diversity indices used were heterogeneity measures that combine the species richness and
evenness (Magurran, 2004). Shanonn -Wiener richness index was used to measure the
diversity of species for each transects in every habitat.
Shannon-Wiener Index, H’ = - ∑ (p i ln p i)
Pi = proportion of the total number of individuals represented by that species (i.e. n i /N,
where n i = the number of individuals of that species, and N = total number of individuals).
Shannon evenness index: E = H’ / ln S
S = number of species observed.
The maximum value of E = 1, is obtained if all the species are equally abundant. (Seaby&
Henderson, 2006)
The total number of individuals (N) for each habitat was modified by considering in the

27
analysis only animals detected before the accumulating rate reached zero (Heyer, 1994).
Bawan catchment
Figure 2.5 Map of Bawan Forest in Borneo ( Map downloaded by Emily Waddell).
In addition to my own work I also used data from the other amphibian studies
conducted in Bawan tropical rainforest 65km north of Palangkaraya in Central Kalimantan,
Indonesian Borneo between July and August 2010 (Figure 2.5). This anuran survey was
supervised by The Orangutan Tropical Peatland Project and the Centre for the International
Cooperation in Management of Tropical Peatlands (CIMTROP) and was conducted as part of
Emily Waddell’s dissertation (OuTrop and CIMTROP, 2010).
The study area, which was logged and destroyed by fires area, is unprotected and was
studied for the first time. There were studied different habitats including kerangas, kerangas

28
with stream, peat swamp, newly burnt, regenerating burnt, low interior forest (low pole) and
camp for 37 nights and nine days (OuTrop and CIMTROP, 2010).
Sampling methods which were used during this study included Visual Encounter
Surveys, MacKinnon’s List and stream quadrats. MacKinnon’s List include every anuran
found during VES, quadrat and opportunistically. These areas are considerably different from
habitats in Sebangau forest, and include kerangas forest and kerangas with stream (heath)
(MacKinnon et al., 1996) with tall dipterocarp trees (around 15-20 metres) with buttresses, a
little amount of leaf litter and temporary pools. Furthermore, mixed peat swamp habitat was
swampier and more flooded than kerangas habitat with canopy around 20 metres tall.
Additionally, the newly burnt area had mainly regenerating grasses, sedges, a few
pools and the lack of a peat layer. The regenerating burnt area had a lack of a peat layer, the
vegetation included grasses, sedges, few small trees (4 metres). The low interior forest had a
deep peat layer and some pools. The terrain was swampy with large hummocks, aerial roots
and canopy 15 metres high. Overall, the study site in the Sebangau forest was more flooded
than in the Bawan forest.
421 individuals and 18 anurans species were found in 35 days during study in Bawan forest.
Data analysis was based on anurans found during VES and opportunistically searching (Waddell,
2011).
The statistical t-test was used to assess differences in the number of amphibian species found
between different sites in the Sebangau forest and the Bawan catchment.

29
Results
A total of 8 species in 4 families and 6 genera were identified in different habitats
including secondary mixed peat-swamp forest, canal in secondary peat-swamp forest,
regenerating burnt forest and canopy gaps recently logged, camp and forest sedge in the
Sebangau forest.
The study was conducted between 9th
of September and 12th
of October 2010 during
14, non-consecutive, days using VES and 13 days using active survey, and a total of 245
individuals were found. Figure 3.1 shows the number of individuals that were recorded in and
out of transects (- opportunistic).
Transect Date
Length
of
transect
Total
number of
individuals
Number of
individuals
In transect
Number of
individuals
Out transect
opportunistic
Number
of
species
Species
(number of
individuals)
Peat-
swamp I
09-
09-
2010
500m 7 3 4 3
Hylarana baramica(3)
Occidozyga laevis (2)
Polypedates colletti
(2)
Peat-
swamp II
10-
09-
2010
500m
14 6 8 3
Hylaranabaramica(7)
Occidozyga laevis(4)
Limnonectes

30
paramacrodon(3)
Peat-
swamp III
11-
09-
2010
500m
10 3 7 3
Hylarana
baramica(8)
Occidozyga laevis(1)
Polypedates colletti
Peat-
swamp IV
13-
09-
2010
500m
15 9 6 3
Hylarana
baramica(1)
Occidozyga
laevis(11)
Polypedates colletti
(3)
Peat-
swamp V
15-
09-
2010
500m
12 9 3 4
Hylarana baramica
(6)
Occidozyga laevis(1)
Limnonectes
paramacrodon (2)
Polypedates colletti
(3)
Peat-
swamp VI
17-
09-
2010
500m 16 8 8 2
Hylarana
baramica13)
Limnonectes
paramacrodon(3)
Peat-
swamp
VII
20-
09-
2010
500m 10 4 6 3
Hylarana
baramica(6)
Occidozyga laevis(2)
Limnonectes
paramacrodon(2)
Peat-
swamp
VIII
01-
10-
2010
500m
12 5 7 3
Hylarana
baramica(10)
Limnonectes

31
paramacrodon(1)
Polypedates colletti
Canal I
30-
09-
2010
275m 8 5 3 2
Hylarana
baramica(6)
Limnonectes
paramacrodon(2)
Canal II
11-
10-
2010
275m 6 3 3 3
Pseudobufo subasper
Hylarana
baramica(3)
Limnonectes
paramacrodon(2)
Burnt I
28-
09-
2010
580m
6 1 5 2
Hylarana baramica
(4)
Occidozyga laevis(2)
Burnt II
04-
10-
2010
580m
10 6 4 2
Hylarana baramica
(6)
Occidozyga laevis(4)
Gaps I
29-
09-
2010
50m
3 1 2 1 Hylarana
baramica(3)
Gaps II
06-
10-
2010
50m
2 0 2 1 Hylarana
baramica(2)
Table 3.1 Number of individuals that were recorded in and out of transect during VES in four
different habitats including the mixed peat swamp, canal, burnt area and gaps

32
Another sampling method used in this study was active survey. Details of transects are in
Table 3.2.
Transect Date
Length
of
transect
Duration
of
survey
Total
number of
individuals
Nuber
species
Species
(number of individuals)
Peat-swamp I 19-09-2010
500m 30min 7 4
Occidozyga laevis(4)
Limnonectes
paramacrodon(1)
Polypedates colletti(1)
Polypedatesmacrotis (1)
Peat-swamp II 20-09-2010
500m
30min 4 3
Limnonectes
paramacrodon(1)
Occidozyga laevis(2)
Polypedates colletti(1)
Peat-swamp III 01-10-2010 500m 30min 1 1 Occidozyga laevis(1)
Peat-swamp IV 02-10-2010
500m 1h 30min 21 4
Hylarana baramica(1)
Occidozyga laevis(9)
Limnonectesparamacrodon(1)
Polypedates colletti(10)
Peat-swamp V 05-10-2010
500m
2h 7 3
Hylarana baramica(2)
Limnonectes
paramacrodon(4)
Polypedates colletti (1)

33
Peat-swamp VI 13-10-2010
500m 1h 30min 5 3
Hylarana baramica(2)
Occidozyga laevis(1)
Limnonectes
paramacrodon(1)
Polypedates colletti (1)
Canal I 30-09-2010 275m 30min 0 0 -
Canal II 11-10-2010 275m
30min 2 1 Limnonectes
paramacrodon(2)
Burnt I 14-09-2010 580m 30min 1 1 Hylarana baramica(1)
Burnt II 02-10-2010 580m 30min 1 1 Occidozyga laevis(1)
Gaps I 29-09-2010 50m 30min 0 0 -
Gaps II 12-10-2010 50m 30min 2 1 Hylarana baramica(2)
Gaps III 12-10-2010 50m 30min 1 1 Hylarana baramica(1)
Table 3.2 The results for the active surveys in the Sebangau forest
Table 3.1 and 3.2 demonstrate that the greatest number of species was encountered in
the mixed peat swamp habitat during VES and active survey. Lesser number of
species were found in canal in the secondary peat swamp forest, regenerating burnt
areas and recently logged gaps.

34
Species composition of Sebangau forest
Species Camp mixed
peat
swamp
Canal Burnt Forest
sedge
Gaps
logged
Total
number of
individuals
Ingerophrynus
quadriporcatus
1 1 1 3
Pseudobufo
subasper
1 1
Hylarana
baramica
3 59 11 8 90
Limnonectes
paramacrodon
1 19 6 26
Occidozyga
laevis
2 38 3 2 45
Polypedates
colletti
24 24
Polypedates
leucomystax
1 1
Polypedates
macrotis
1 1
The number
of species
5 6 2 2 1 2 191
Table 3.3 The number of individuals and species found at each of the different survey sites
using VES and active survey.
The species abundance and composition differ between all the habitats. Table 3.3
demonstrates that the highest species richness with six species, was observed in the mixed
peat swamp including Ingerophrynus quadriporcatus, Hylarana baramica, Limnonectes
paramacrodon, Occidozyga laevis, Polypedates colletti and Polypedates macrotis.

35
Additionally, Pseudobufo subasper, Hylarana baramica and Limnonectes paramacrodon
were found in a canal. Species Hylarana baramica and Occidozyga laevis were detected
in burnt area. Only one species Occidozyga laevis was found in the forest sedge.
Ingerophrynus quadriporcatus and Hylarana baramica were identified in logged gaps.
Although, five different species were opportunistically encountered in camp during the
active survey, including Ingerophrynus quadriporcatus, Hylarana baramica,
Limnonectes paramacrodon, Occidozyga laevis and Polypedates leucomystax, the number
of individuals for each species was low. However, dates obtained in a camp and forest
sedge were excluded from an estimation of the richness and relative abundance of anurans
Figure 3.1 The percentage of species recorded on all VES and active surveys in 6 habitats
including camp, the regenerating burnt area, canal in the secondary forest, recently logged
gaps, the mixed peat swamp and forest sedge.

36
Figure 3.1 shows that Hylarana Baramica accounted for 47%of the individuals detected in all
habitats, which is over two fold higher than any of the other species. In contrast, only one
individual of Polypedates leucomystax, Polypedates macrotis and Pseudobufo subasper were
found in different habitats and each accounted for 0.05% of the total individual found.
Figure 3.2 Species abundance of anurans at each of six habitats including camp, the mixed
peat swamp, canal, burnt area, forest edge and gaps.

37
Figure 3.3 Amphibian species found in Sabangau forest. From left to right:
Ingerophrynus quadriporcatus (top), Pseudobufo subasper, Hylarana baramica,
Occidozyga laevis, Limnonectes paramacrodon (bottom), Polypedates leucomystax,
Polypedates colletti, Polypedates macroti (Picture by Iván Mohedano).
Environmental parameters
Temperature (C⁰) and humidity (%) was measured at the beginning survey at every transect.
In according results, temperature had similar values in every habitat between 27 and 29 ˚C.
Humidity was between 89 and 99%.
The intra-day humidity was not studied on this occasion, but its values probably oscillate
considerably, especially in those areas where the canopy cover is not well developed.
HABITAT SAMPLE
(days)
TEMPERATURE
VARIATION (˚C
)
HUMIDITY
RANGE
(%)
Mixed peat-swamp forest 8 24,1-27,7 89-99
Canal in peat-swamp forest 2 28,8-29,6 97-99
Burnt regenerating 2 26,8-28,6 94-99
Gaps 2 27,8-28,7 99-99
Table 3.4 Environmental parameters for the different habitat surveyed using
VES.

38
Species accumulation curves
Species accumulation curves for each habitat are shown below ( Figure 3.4).
Interval 30 minutes
Figure 3.4 Species accumulation curve of frogs observed in the mixed forest in the Sebangau
forest during 18 days (interval 30 minutes). Results include data from VES (in transect) and
active survey.
Interval 30 minutes
Figure 3.5 Species accumulation curve of frogs observed in a canal in the Sebangau forest
during 18 days (interval 30 minutes). Results include data from VES (in transect) and active
survey.
39
Interval 30 minutes
Figure 3.6 Species accumulation curve of frogs observed in a burnt area in the Sebangau
forest during 18 days (interval 30 minutes). Results include data from VES (in transect) and
active survey
Interval 30 minutes
Figure 3.7 Species accumulation curve of frogs observed in logged gaps in the Sebangau forest
during 18 days (interval 30 minutes). Results include data from VES (in transect) and active
survey.

40
The species accumulation curve (Figure 3.4, 3.5, 3.6 and 3.7) for the mixed swamp, canal,
burnt area and logged gaps has reached an asymptote. It suggests that additional species of
anurans are expected to be detected if more surveys are done.
Species diversity in Sebangau forest
The Shannon- Wiener diversity index for anurans species was the highest for the
mixed peat swamp (1.08), compared to either canal (0.28), burnt area (0.68) or logged gaps
(0.53).In terms of species evenness, the distribution of individuals among species was uneven
in the peat swamp (E=0.58) compared to canal (E=0.66), burnt area (E=0.98) and gaps logged
(E=0.23) (Table 3.5).
Habitat Shannon-Wiener
index
Species Evenness
Secondary mixed peat
swamp
1.08 0.58
Canal in secondary
forest
0.28 0.66
Regenerating burnt
area
0.68 0.98
Gaps recently logged 0.53 0.23
Table 3.5 Shannon-Wiener diversity and evenness index for anuran species in four different
habitats including the mixed peat swamp, canal, burnt area and gaps.

41
0
0.2
0.4
0.6
0.8
1
1.2
peat swamp canal burnt area gaps
Shanon index
Habitat
Figure 3.8 The Shannon- Wiener diversity index for anurans species in four different habitats
including the mixed peat swamp, canal, burnt area and gaps.
Relative abundance
Habitat HYLBAR OCCLAE LIMPAR POLCOL PSESUB
Peat-
swamp
6.11 5.45 1.73 2.29 0
Canal 0 0 4.72 0 0.75
Burnt 1.38 3.13 0 0 0
Gaps 0.38 0 0 0 0
Table 3.6 The relative abundance per habitat for the main surveyed species (VES date).
Table 3.6 shows VES (in –transects contacts) that were standardized by capture rate (CR)
for each species (Cook, 2010).
CR( capture rate)=the total number of individuals /total time*number of people for each
species( person hours)

42
Visual Encounter Survey
Habitat type Days of
collection
Person
hours
Mixed-peat
swamp
8 25.033
Canals in
peat-swamp
forest
2 2.88
Burnt areas 2 4.05
Gaps 2 3.57
Total 12
Table 3.7 The number of days of collection of anurans and person hours
0
1
2
3
4
5
6
7
Hylarana
baramica
Occidozyga
laevis
Polypedates
colletti
Limonectes
paramacradon
Pseudobufo
subasper
Relative abundance
Species anuran
Figure 3.9 The relative abundance of five different species in the mixed peat swamp

43
Figure 3.10 The relative abundance of five different species in a canal in secondary peat
swamp forest
Figure 3.11 The relative abundance of five different species in a regenerating burnt area

44
0
0.05
0.1
0.15
0.2
0.25
0.3
0.35
0.4
Hylarana
baramica
Occidozyga
laevis
Polypedates
colletti
Limonectes
paramacradon
Pseudobufo
subasper
Relative abundance
Species anuran
Figure 3.12 The relative abundance of species in recently logged gaps

45
Anurans calls There were recognized and recorded calls of different species.
Species
Type of call
Description
Ingerophrynus
quadriporcatus
Territorial day
call Heard throughout the year
Hylarana baramica Territorial
night call Heard throughout the year
Limnonectes
paramacrodon Alarm call
Observed some alarm calls during
captures
Occidozyga laevis Breeding call
Alarm call
Breeding call heard during one
month only
Polypedates colletti Breeding call Heard just for a couple of weeks
Polypedates macrotis Breeding call Heard for just one week, coinciding
with the full moon
Table 3.11 The list of calls anurans recorded in the Sebangau forest

46
Results of Anurans species richness in Bawan forest.
Table 3.8 presents the number of anuran species that were recorded at each of the survey
habitat using VES and active survey in the Bawan forest.
Species C K M-PS K+S BN BR LP
Bufonidae X
Fejervarya cancrivora X
Hylarana baramica X X X X X X X
Hylarana glandulosa X
Hylarana raniceps X X X
Ignerophrynus quadriporcatus X X X X
Kalophrynus sp. X
Kalophrynus pleurostigma X X X
Leptobrachium spp. X X X X X
Limnonectes malesianus X
Limnonectes paramacrodon X X X
Microhyla borneensis X
Nyctixalus pictus X
Occidozyga laevis X X X X
Polypedates colletti X X X X X
Polypedates leucomystax X
Polypedates macrotis X X X X X
Rhacophorus appendiculatus X
Total 6 7 11 10 6 6 2
Table 3.8 The number of individuals and species found at each of the survey sites using VES
and active survey in the Bawan forest (C = camp, K= kerangas, M-PS = mixed-peat swamp,
K+S = kerangas plus stream, BN = burnt new, BR = burnt regenerating and LP = low interior
forest). Bufonidae, Kalophrynus sp and Leptobrachium spp were not qualified to species
level ( Data provided by Emilly Waddell).

47
Figure 3.13 Shannon- Wiener diversity index for anuran species in five different habitats
including A-kerangas, B-mixed-peat, C-kerangas+stream, D-burnt new and E-burnt
regenerating. The Shannon index was calculated for each individual night at each site
(Waddell, 2011).
The Shannon- Wiener diversity index for anurans species was the highest for the kerangas
with stream (1.32976) and the lowest in the burnt new area (Figure 3.13).
EDCBA
2.0
1.5
1.0
0.5
0.0
Site
Shannon Index
1.00875
0.423825
1.32976
0.91896
0.51721
Boxplot of Diversity per Habitat

48
The null hypothesis (H0) that there was no difference between the species richness in the
habitats in the Sabangau and mixed peat swamp the Bawan forest, was tested using an
independent samples t-test (2-tailed). Table 3.9 summarises these results.
Habitats Sebangau
forest mean
Bawan forest
mean
t-test
mixed peat swamp forest
Sebangau vs. mixed peat swamp
in the Bawan forest
3; SD=0.53 4; SD= 1.51 (t (14)=1.76,
p=0.1
mixed peat swamp forest in the
Sebangau vs. kerangas in the
Bawan forest
3; SD=0.53 3; SD= 0.75 (t (14)=0, p= 1)
mixed peat swamp forest in the
Sebangau vs. kerangas with
stream the Bawan forest
3; SD=0.53 4.14; SD=1.67 (t (13)=1.83,
p=0.09),
canal in the secondary peat
swamp forest in the Sebangau vs.
kerangas with stream the Bawan
forest
1.5; SD=1.29 4.14; SD=1.67 (t (9)=2.706,
p=0.024)
regenerating burnt area in the
Sebangau vs. regenerating burnt
area in the Bawan
1.5; SD=0.57 3; SD=0.81 (t (9)=3, p=0.024)
regenerating burnt area in the
Sebangau vs. recently burnt area
in the Bawan forest
1.5; SD=0.57 3.5; SD=0.57 (t (6)=4.89,
p=0.003)
Table 3.9 Comparing species richness Sebangau vs. Bawan forest.
H0 was accepted p>0.05 (t (14)=1.76, p=0.1), there was no difference between the
richness species in the mixed peat swamp forest in the Sebangau (mean=3; SD=0.53) and in
mixed peat swamp the Bawan forest (mean=4; SD= 1.51).

49
H0 was accepted p>0.05 (t (14)=0, p= 1), there was no difference between the richness
species in the mixed peat swamp forest in the Sebangau (mean=3; SD=0.53) and kerangas the
Bawan forest (mean=3; SD= 0.75).
H0 was accepted p>0.05 (t (13)=1.83, p=0.09), there was no difference between the
richness species in the mixed peat swamp forest in the Sebangau (mean=3; SD=0.53) and the
kerangas with stream the Bawan forest (mean=4.14; SD= 1.67).
H0 was rejected p<0.05 (t (9)=2.706, p=0.024), there was significant difference
between the richness species in canal in the secondary forest in the Sebangau (mean=1.5;
SD=1.29) and in the kerangas with stream the Bawan forest (mean=4.14; SD= 1.67).
H0 was rejected p<0.05 (t (9)=3, p=0.024), there was significant difference between
the richness species the regenerating burnt area in the Sebangau (mean= 1.5; SD= 0.57) and in
the regenerating burnt area in the the Bawan forest (mean=3; SD= 0.81).
H0 was rejected p<0.05 (t (6)=4.89, p=0.003), there was significant difference between
the richness species in richness for the regenerating burnt area in the Sebangau (mean= 1.5;
SD= 0.57) and in the recently burnt area in the Bawan forest (mean=3.5; SD= 0.57).

50
Variations among anurans size and weight in the Sebangau forest
and the Bawan forest
Table 3.10 presents body size range (mm) and weight range (gr) of anurans found in the
Sebangau forest and the Bawan forest during the study.
SPECIES SAMPLE
SIZE
RANGE
(mm)
WEIGHT
RANGE
(gr)
Ingerophrynus
quadriporcatus 0 - -
Hylarana baramica 30
8
18 - 48
30 - 48
<1 - 8,0
2,0 - 7,0
Limnonectes
paramacrodon
46
24
9 - 61
9 - 72
<1 - 24,5
<1 - 40,0
Occidozyga laevis 23
33
13 - 25
12 - 28
<1 - 3,0
<1 - 3,5
Polypedates colletti 35
25
45 - 77
34 - 66
4,5 - 26,5
3,0 - 20,0
Polypedates leucomystax 0 - -
Polypedates macrotis 23
1
45 - 87
82
4,0 - 45,0
31,0
Table 3.10 Parametres for anurans found in the Sebangau forest
(in black) and in the Bawan forest (in red).

51
Discussion
The highest number of species and individuals was found in the secondary mixed peat
swamp in the Sebangau forest with the value, on The Shanon–Wiener index, of 1.08 including
Hylarana baramica, Limnonectes paramacrodon, Occidozyga laevis, Polypedates colletti and
Polypedates macrotis. This could be due to the mixed peat swamp being less disturbed than
other sites. Although air temperatures and humidity during the night transects had similar
ranges in all sites, there could be great differences in light intensity between sites during
daytime.
The regenerating burnt area, the canal in secondary forest and gaps recently logged
included less abundance of species and individuals of anurans than the mixed peat swamp.
The Shannon–Wiener index (0.68) was second in species diversity in the regenerating burnt
area followed by recently logged gaps (0.53) and the canal in the secondary forest (0.28). The
relative abundance of species of anurans found in the regenerating burnt area was 1.38 for
Hylarana baramica and 3.13 for Occidozyga laevis. Furthermore, Pseudobufo subasper
(0.75) and Limnonectes paramacrodon (4.72) were detected in the canal and Hylarana
baramica (0.38) was found in recently logged gaps.
Hylarana baramica was the most common frog in three habitats but not from the canal
in the secondary forest. This species prefers the forest floor and low vegetation where it
climbs, usually peat swamp forest and swampy flatland in primary forest at low elevations. It
known that it breeds in water but its breeding habitats are unclear (Inger& Stuebing, 2005).
Most of the individuals that were recorded during this study were calling males. This frog is
not qualified as fast declining species due to its wide distribution and large population (IUCN,
2010).

52
Limnonectes paramacrodon favours clay and the gravel banks of small streams in
primary forest as well as selectively logged rain forest at low elevations. It lives in heath and
peat swamp forests, and preys on moderate to larger sized invertebrates. It breeds in streams
and can adapt to live in selective logging forests but they are not able to live in strongly
disturbed habitats. It is suggested that this species may be endangered by clear-cutting of
forest, agriculture or fire (Inger& Stuebing, 2005; IUCN 2010).
During these studies Limnonectes paramacrodon was found in the mixed secondary
peat swamp forest and a canal in secondary peat swamp forest. The highest abundance of
Limnonectes paramacrodon occured in a canal where the water depth was approximately
60cm, which was probably full of predator fish species. This site was dominated by large
individuals of Limnonectes paramacrodon. Smaller Occidozyga laevis, which prefer shallow
aquatic habitats, was not found in a canal. This may be linked to competition between these
two water frogs. Larger Limnonectes paramacrodon, which favours deeper water bodies, may
be less endangered by predator fish species (Inger& Stuebing, 2005; IUCN, 2010).
Occidozyga laevis lives in marshy habitats, small puddles and streams in lowland
rainforest. Fragmentation of the habitat may be the main threat for this frog which doesn’t live
in groups.. The species was reported in the mixed secondary peat swamp and in the
regenerating burnt area. The greatest abundance of Occidozyga laevis was detected in a
regenerating burnt area which was flooded to water depth of approximately 10 cm. (Inger &
Stuebing, 2005; IUCN, 2010).
Another aquatic anuran Pseudobufo subasper was detected in the bank of a canal,
eating termites.

53
This toad lives and breeds in swamps and peat swamps forests, it is not usually found in
disturbed habitats. Wetland drainage, air pollution or logging are the major threats for this
species (IUCN, 2010).
Polypedates colletti lives in primary and secondary lowland peat swamp forests at
different elevations up to 650 meters. Secondary forest cannot be heavily disturbed. Adults
occupy trees and breed around temporary rain pools. Although, this species is not considered
as threatened, further deforestation may influence their decline. During this study,
Polypedates colletti occurred only in the mixed secondary peat swamp forest. This habitat
seems to provide optional conditions for this species with the high abundance of trees and
small pools with standing water (Inger & Stuebing, 2005; IUCN, 2010).
Another tree species Polypedates macrotis is known to live in primary and secondary
lowlands forests, in vegetation over standing water at forest edges. It can breed in rain
puddles, ditches or build foam nests (Inger& Stuebing, 2005; IUCN, 2010). Although, it is is
not considered as endangered, one individual of Polypedates macrotis was found in the mixed
secondary peat swamp forest only.
Additionally, other microhabitats were surveyed opportunistically including flooded
forest sedge or a base camp. And one individual of Polypedates leucomystax, for instance,
was found in a base camp during opportunistic searching. This species has learnt adapt to
living in modified human areas including towns, villages, agricultural areas, artificial ponds
and logged forests. It is often found in or under grass around shallow standing water and
builds foam nests on the ground at water’s edge. Polypedates leucomystax is resilient and
though, and can tolerate more extreme temperature and dryness (Inger& Stuebing, 2005,
IUCN, 2010).

54
Apart from Polypedates leucomystax, other anurans were found in low abundance at
the camp site including Ingerophrynus quadriporcatus, Hylarana baramica, Limnonectes
paramacrodon and Occidozyga laevis.
Another anuran, which has been recorded in only a few habitats was Ingerophrynus
quadriporcatus. This toad has not been seen but its calls has been heard in Sabangau forest.
Swamps forests are favourable for this species, where they breed in standing water.
Ingerophrynus quadriporcatus can be threatened by logging or oil palm plantation (Inger,
2005; IUCN, 2010).
Canopy gaps that were more common in study sites including a canal in the secondary
peat swamp, regenerating burnt areas and recently logged gaps, could be correlated with a
lower diversity of anurans there. Canopy openings, may influence changes in the level of
light, conductivity and pH of stream, temperature of air, humidity or distribution of leaf litter
(Meijaard et al 2005).
Additionally, the abundance of amphibians may be linked to the amount of understory
vegetation at each site. Anurans use this part of vegetation as shelter and calling sites (Parris
& McCarthy, 1999). Those that are dependent on different environmental factors, they can be
sensitive to any changes in their habitat. Particular anurans orders tend to rely on particular
type of resources (Porter, 2010). Logging may cause some changes in the structure of the
forest leaf litter in riparian habitats, ponds and streams, and these changes can cause
disturbances in anuran population structures. As a result of logging, primary tropical
rainforest is replaced by secondary forest, where the species richness of trees is lower than in
primary ones.

55
Secondary forest is ruled by pioneer tree species that have more open- branched crowns. This
characteristic causes the forest floor to be influenced by a larger amount of light. Furthermore,
wind speed, air temperature and soil temperature increase and humidity decrease during the
day in secondary tropical rainforest (Whitmore, 1998). Results that were obtained during a
study conducted in North Sumatra, suggested that changes in the quantity of forest leaf litter
may cause a decrease in the diversity of anurans in secondary forest (Iskandar, 1999a, b).
Logging, which causes disturbances in floor litter and lower vegetation, leads to a large rise in
sedimentation levels in streams and, consequently, to negative effects on the stream breeding
anurans reproduction, affecting survival of tadpoles (Meijaard et al 2005).
Another factor, which may lead to amphibians decline, is an increase in the intensity of light
in secondary forest (Porter, 2010; Lannoo, 2005). Larvae or juvenile amphibians may be hurt by too
much intensive light (Blaustein& Bancroft, 2007). Also an abundance of amphibians is an influence
on UVB rays on the forest floor. These rays could destroy nitrogen consumers, including
phytoplankton, causing an increase of the accessibility of active nitrogen to anurans. Or could limit
food resources for anurans tadpoles (Hader et al. 1998; Macias et al, 2007).
Anurans have various reproductive systems associated with complicated life cycles
including a larvae (tadpoles) and adults. The reproductive life of anurans is linked to aquatic
environments including streams or ponds (Inger, 2001). Some frog species even use plant and tree
holes filled with water for either egg deposition or tadpole growth. Logging may affect the
development of these anurans. Moreover, changes in water chemistry may influence larval anurans
(Meijaard et al 2005).
56
Previous studies in different study sites have shown that logging may affect anurans
through impact upon ponds, streams and watersheds, and on forest leaf litter in no riparian
habitats. Studies conducted in Sumatra showed that approximately 20% individuals non-
riparian anurans were detected in logged forest compared to unlogged forest in the same area
Iskandar (1999a, b). The decrease in anurans abundance was associated with the change in the
amount of forest leaf litter.
However, some studies showed that selective logging did not significantly affect
anurans abundance (Iskandar, 2004, Wong, 2003). And according to Iskandar (2004), the
relative abundance of amphibians in the Malinau rainforest in the North Sumatra was higher
in logged forest than in unlogged forest. It was not possible to explain this phenomena. There
were suggestions that logged forests still had quite close canopy or some differences in habitat
that were not identified.
Another study conducted in Sabah rainforest showed that logging had a low impact on
frog richness and abundance (Wong, 2003). Some anurans species including Rhacophorus
pardalis, Polypedates colletti, P. macrotis, Leptobrachium montanum, and Rananicobariensis
and R. signata had a high abundance in selectively logged forest. There is a suggestion that
logging created some microhabitats such as ponds, which are suitable for pond breeders and
for those that prefer secondary forest. Anurans species were found in selectively logged
forests that tolerated disturbed habitats as well as in primary forest (Wong, 2003).
Amphibians have not been well studied in peat swamp forests in Indonesia because it
has been thought that biodiversity in peat swamps is less rich than in different lowland
rainforests (Page, 1997). The limited number of amphibian surveys has perhaps influenced the
low number of species found in this habitat. For instance, 19 species only were found at the

57
Pekan Forest Reserve in Malaysia (Yule, 2010).
The richness of species of amphibians in the peat swamp downland forests is probably less
diverse than in other types of forest in Borneo because of the acidic and flooded environment. For
instance, in the lowland mixed dipterocarp rainforest at Ulu Temburong National Park in Brunei 54
anuran species were found (Ulmar , 2009) and 65 frogs species were detected in the hilly and
mountainous ever-wet tropical rainforest in the Kayan Mentarang National Park East Kalimantan in
Indonesia (Veith, 2004). However, these studies were conducted for long-term periods, of at least one
year.
Comparison in anurans species richness between the peat swamp
lowland forests in Sebangau and Bawan catchment
421 anuran were found during studies in Bawan forest. Waddell (2011) showed that
kerangas with stream was the most species diverse habitat and burnt new habitat was the least.
Burnt regenerating was the second, followed closely by mixed-peat swamp and then by
kerangas.
Additionally, although the greatest number of anurans species was found in the mixed-
peat swamp, this diversity richness of this habitat was assessed as third among all studied
habitats (Figure 3.13) . In according statistical test as a General Linear Model there was a
significant difference between kerangas, mixed-peat swamp, kerangas with stream, burnt new
and burnt regenerating habitats (Waddell, 2011).
In this study temperature, humidity and rate of rainfall was not included. Overall,

58
average values for each parameter are similar for the Sebangau forest and the Bawan forest.
An independent- samples t-test was used to test differences in the richness of
amphibian species found between different habitats in the Sebangau forest and the Bawan
catchment. The results showed that there was no difference between the species richness in
the mixed peat swamp forest in the Sebangau and mixed peat swamp the Bawan forest, the
mixed peat swamp forest in the Sebangau and in kerangas in the Bawan forest, the mixed peat
swamp forest in the Sebangau and in kerangas with stream the Bawan forest. Furthermore, the
there was a significant difference between the richness species in a canal in the secondary peat
swamp forest in the Sebangau and in kerangas with stream the Bawan forest, regenerating
burnt area in the Sebangau and in regenerating burnt area in the Bawan forest regenerating
burnt area in the Sebangau and in recently burnt area in the Bawan forest.
Overall, the species number of anurans found in Bawan forest was 18 species
(Waddell, 2011) and was greater than in the Sebangau forest, with 8 species. There are some
suggestions that may explain these differences in the richness of anurans species.
First of all, the Sebangau forest is more flooded and swampy over a year than the
Bawan forest. This characteristic may limit the occurrence some types of anurans such as the
ground anurans. The ground anurans including Leptobrachium abbotti, Kalophrynus
pleurostigma, Microhyla borneensis and Ansonia minuta were found in the kerangas forest in
Bawan catchment. This area is drier and suitable for anurans species that spend most of time
on forest floor. In the Sebangau forest, the limited amount of the forest floor may be not
suitable for the development of ground anurans.
Furthermore, the number of tree frogs species was lower in the Sebangau forest than in
the Bawan catchment. In the first site only two trees anurans Polypedates colletti and

59
Polypedates macrotis were detected and six tree species in the Bawan forest.
These differences in the diversity of tree frogs between two forests may be linked to
types of disturbance in the forests, types of predators, an access to breeding locations or food.
One of the most probable explanations may be problems connected with searching
some tree frogs in the canopy. Some tree frogs may possible be detected only during their
breeding periods around water bodies such as ponds. The species of frogs found in the
Sabangau forest breed in the lower parts of the vegetation.
Moreover, the most suitable habitat for aquatic anurans could be a canal in the peat
swamp forest. Only two species were found there, however, Limnonectes paramacrodon and
Pseudobufo subasper .These species live in peat swamp forests and probably, this disturbed
site is not suitable for common water frogs.
In both study sites, the species richness was greater in less disturbed habitat, including
the mixed peat swamp forest, kerangas and kerangas with stream, in the Bawan forest and the
mixed peat swamp in the Sabangau forest. More disturbed areas including regenerating burnt
areas in both sites, recently burnt areas in the Bawan forest and a canal in secondary peat
swamp forest in the Sebangau catchment significantly were significantly less diverse in
anuran species. These results suggest that intensive logging and fires may affect the density
and disturbance of anurans.
Overall, the body size and weight of anurans were similar in the Sebangau forest and
the Bawan forest. However, Occidozyga laevis and Limnonectes paramacrodon were a little
larger in the Sebangau forest than in the Bawan forest, and Polypedates colletti and
Polypedates macrotis were larger in the Bawan forest. These differences in body size between
anurans may be caused by various ecological differences between kerangas habitat in the

60
Bawan forest and peat swamp in the Sebangau forest and a degree of the disturbance in each
site.
Conclusions
Although that this study was conducted for only a short period, the number of species and
individuals found in the Sebangau forest showed clear differences in each site.
However, it is difficult to assess how the disturbance of primary forest can affect species
diversity because Bornean frogs have complex ecological adaptations (Meijaard et al. 2005).
Generally, the results showed that more intensively disturbed habitats, including a canal,
logged gaps or regenerating burnt areas, compared to mixed peat swamp forest area, had a
lower the anuran species richness and abundance. It may be concluded that logging, fires and
wetlands drainage in tropical forests may negatively affect anurans distribution and cause
their decline (Porter, 2010).
A study of amphibians should be conducted in different seasons throughout the year. It is
known that the behavior of amphibians is depended on rainfall and temperature (Inger 2003).
Anurans can call and breed at the beginning of a rainy period or over a whole season. It is suggested
that surveys of amphibians that are conducted to assess their richness and abundance in any tropical
area, should be carried out at differing times in order to cover the variation in their activity (Inger,
2003).
An estimation of accurate anurans abundance is difficult to achieve because of their
life patterns. Many species live underground for the greater part of their lives. Besides this,
they do not have high food requirements and can be visible when weather conditions are
optimal (Sutherland, 2006). This study was carried out only for a few weeks during the same
61
season and this factor may have influenced the results. It is necessary to continue amphibian
studies over many weeks and months.
Long term studies would be able to assess anuran decline or an increase in species
diversity and abundance. Additionally, such a study would show the beginning of anurans
decline in disturbed primary forests or the beginning of recovery of secondary forests (Porter,
2010).
The methods of a Visual Encounter Survey and an Active Survey used during this
study, are simple and not expensive but may be labour intensive (Rodel & Ernst, 2004). It is
considered that transect sampling, combined with other methods, including trapping, drift
fencing or mark- recapture, could be the best solution to amphibian studies (Sutherland,
2006). Another study showed that the combination of Visual Encounter Survey (VES) and
quadrates can be the most suitable in rainforest environments (Doan, 2003). However, these
methods are not efficient in a peat swamp download rainforest which is flooded most of the
time. The transect method, moreover, seems to be the least invasive for anurans. Despite of
the fact that the transect method, supported by mark –recapturing, is considered the optimal
sampling method (Sutherland, 2006), for ethical reasons, toe clipping of anurans was not
included during studies. It is claimed that toe-clipping methods can reduce frog survival rates
(May, 2004). In terms of amphibian decline, the trapping method could be useful to assess
reasons for a decrease in the population of amphibians in different habitats, including the
infectious diseases or abnormalities of the limbs of anurans (Porter, 2010). Furthermore,
Visual and Acoustic Encounter Surveys combined with opportunistic trapping and transect
surveys, for long term studies, were recommended in tropical habitats (Rodel & Ernst, 2004).

62
It is recommended to conduct further long term studies for amphibians, and may be
desirable to study relationships between leaf litter arthropods and life patterns of leaf anurans,
in the increased abundance of some anurans species in selective logged forests, or changes in
abundance of species of insects, caused by habitat (Meijaard et al 2005).
Amphibians can be potentially good ecological indicators in biological ecosystems.
They have thin, semi-permeable skin and complex life cycles making them sensitive to any
changes in habitat and environmental stress. Herpetological monitoring may assess the
quality of the environment or assess the effects of restoration of ecosystems (Hardin, 2006).
Amphibians are abundant locally and their survey may be low cost (Heyer et al. 1994). These
vertebrate probably may be good indicators of the aquatic (reproduction) and terrestrial
(feeding, dispersal) habitats (Hardin, 2006).
Furthermore, more studies are needed to investigate relationships between the
particular stress and its effects on the amphibians (Pechmann & Wilbur, 1994). While the
IUCN Red List of Threatened Animals in 2000 did not listed any Indonesian amphibian
species, the 2006 Red List of Threatened Species listed 39 threatened amphibians (IUCN
2006). It is necessary to understand more about habitat destruction or El Niño Southern
Oscillation (ENSO) events influence population size in amphibians. For instance Iskandar
(1999) have pointed out that fires in 1998 in Kalimantan have caused the disturbances in
amphibian reproductive cycles. Indonesia has been logging intensively for the last few
decades and it is still not known in what degree amphibians can adopt to changes in their
63
natural habitats. In Kalimantan, amphibians that are endemic and occur in limited
geographical ranges may become extinct.
The species richness of amphibians in Indonesia is probably one of the highest
worldwide, however, studies of these vertebrates are really limited. It is important to take
action to protect the herpetofauna in the face of degradation of the rainforests (Iskandar,
2006).
Evaluation of Project Success
• Weather conditions, such as rainfall or wind, obstructed searching in the study site.
• Sampling methods used in peat swamp forest need to be more studied and developed.
• Studying of abundance and richness of animals requires longer-time periods of survey.
More intensive study of the relationships between environmental factors and diversity
of anurans is needed.
• Amphibians were not surveyed in the higher part of vegetation including the canopy.
Some microhabitats in the study site may be more studied, including interior pole,
forest sedge and others.
• Unidentified calls of anurans probably underestimated the richness of anurans frogs.

64
Appendix A
Results include data from VES (in transect) and active survey in Sabangau
forest
Interval
(30min)
Number of
individuals
New species
1 7 OCCLAE/LIMPAR/POLCOL/POLMAC
2 4 -
3 1 -
4 7 -
5 7 -
6 7 HYLBAR
7 3 -
8 2 -
9 1 -
10 1 -
11 1 -
12 3 -
13 1 -
14 2 -
15 1 -
Total 48
Table1. Results include data from VES (in transect) and active survey in the peat swamp
forest in Sabangau forest (HYLBAR- Hylarana baramica, LIMPAR- Limnonectes
paramacrodon, POLCOL- Polypedates colletti, OCCLAE- Occidozyga laevis).
Interval
(30min)
Number of
individuals
New species
1 5 LIMPAR
2 1 -
3 1 -
4 3 PSESUB
5 1 -
6 1 -
Total 12
Table 2.Results include data from VES (in transect) and active survey in a canal in Sabangau

65
forest (LIMPAR- Limnonectes paramacrodon, PSESUB- Pseudobufo subasper).
Interval
(30min)
Number of
individuals
New species
1 2 HYLBAR
2 3 OCCLAE
3 1 -
4 5 -
5 1 -
6 1 -
7 5 -
8 4 -
Total 22
Table 3. Results include data from VES (in transect) and active survey in recently logged gaps
in Sabangau forest (HYLBAR- Hylarana baramica , OCCLAE- Occidozyga laevis).
Interval
(30min)
Number of
individuals
New species
1 1 INGQUA
2 2 HYLBAR
3 2 -
4 1 -
5 1 -
Total 7
Table 4. Results include data from VES (in transect) and active survey in recently logged
gaps in Sabangau forest (HYLBAR- Hylarana baramica, INGQUA- Ingerophrynus
quadriporcatus).

66
Appendix B
Relative abundance of anurans in Sabangau forest Transect Distance Time Person
number
Person
hours
Number of
individuals
HYLBAR
Relative
abundance
HYLBAR
9-9-10 500 1.1166
3 3.35 0 0
10-9-10
500 1.1833 3 3.55 1 0.28
11-9-10
500 1.2666 2 2.53 1 0.39
13-09-10
500 0.8333 3 2.65 0 0
15-09-10
500 0.85 4 3.4 3 0.88
17-09-10
500 0.8333 3 2.5 8 3.2
20-09-10
500 1.6166 3 4.85 0 0
1-10-10
500 0.7333 3 2.2 3 1.36
Total
16 6.11
Number of
individuals
LIMPAR
Relative
abundance
LIMPAR
Number of
individuals
POLCOL
Relative
abundance
POLCOL
Number of
individuals
OCCLAE
Relative
abundance
OCCLAE
0
0 1 0.27 2 0.59
1
0.28 0 0 4 1.13
0
0 1 0.39 1 0.39
0
0 2 0.75 7 2.64
2
0.59 3 0.88 1 0.29
0
0 0 0 0 0
2
0.41 0 0 2 0.41
1
0.45 1 0 0 0
6 1.73 8 2.29 17 5.45
Table 5. Relative abundance of anurans in the peat swamp forest in Sabangau forest

67
(HYLBAR- Hylarana baramica ,LIMPAR- Limnonectes paramacrodon, POLCOL-
Polypedates colletti, OCCLAE- Occidozyga laevis).
Transect Distance Time Person
number
Person
hours
Number of
individuals
HYLBAR
Relative
abundance
HYLBAR
Number of
individuals
OCCLAE
Relative
abundance
OCCLAE
30-9-10 275 1.1166
3 3.35 0 0 0 0
11-9-10
275 1.1833 2 3.55 0 0 0 0
Total 0 0 0 0
Number of
individuals
LIMPAR
Relative
abundance
LIMOAR
Number of
individuals
POLCOL
Relative
abundance
POLCOL
Number of
individuals
PSESUB
Relative
abundance
PSESUB
5
3.22 0 0 0 0
2
1.5 0 0 1 0.75
7
4.72 0 0 1 0.75
Table 6. Relative abundance of anurans in a canal in Sabangau forest (HYLBAR- Hylarana
baramica ,LIMPAR- Limnonectes paramacrodon, POLCOL- Polypedates colletti,
OCCLAE- Occidozyga laevis, PSESUB- Pseudobufo subasper).
Transect Distance Time Person
number
Person
hours
Number of
individuals
HYLBAR
Relative
abundance
HYLBAR
28-9-10 580 0.8666
3 2.6 0 0
04-10-10
580 0.48333 3 1.45 2 1.38
Total
2 1.38
Number of
individuals
LIMPAR
Relative
abundance
LIMOAR
Number of
individuals
POLCOL
Relative
abundance
POLCOL
Number of
individuals
OCCLAE
Relative
abundance
OCCLAE
0
0 1 0.27 1 0.38
1
0.28 0 0 4 2.75
1 0.28
1 0.27 5 3.13

68
Table 7. Relative abundance of anurans in regenerating burnt area habitat in Sabangau forest
(HYLBAR- Hylarana baramica ,LIMPAR- Limnonectes paramacrodon, POLCOL-
Polypedates colletti, OCCLAE- Occidozyga laevis).
Transect Distance Time Person
number
Person
hours
Number
of
individual
s
HYLBAR
Relative
abundance
HYLBAR
29-9-10 100 0.8666 3 2.6 1 0.38
6-9-10
100 0.4833 2 0.966 0 0
Total
1 0.38
Number of
individuals
LIMPAR
Relative
abundance
LIMOAR
Number of
individuals
POLCOL
Relative
abundance
POLCOL
Number of
individuals
OCCLAE
Relative
abundance
OCCLAE
0
0 0 0 0 0
0
0 0 0 0 0
0
0 0 0 0 0
Table 8. Relative abundance of anurans in recently logged gaps in Sabangau forest
(HYLBAR- Hylarana baramica ,LIMPAR- Limnonectes paramacrodon, POLCOL-
Polypedates colletti, OCCLAE- Occidozyga laevis).

69
Appendix C
Shannon- Wiener diversity and evenness index for anuran species in
Sebangau forest
Shannon- Wiener diversity and evenness index for anuran species in the mixed peat swamp in
Sabangau forest.
species hylbar limpar occidozyg polcolleti polmar
npop.size 1 3 16 12 1
pi 0.03 0.09 0.48 0.36 0.007
lnpi -3.50656 -2.40795 -0.73397 -1.02165 -4.96185
pixlnpi -0.1052 -0.21672 -0.35231 -0.36779 -0.03473 -1.07674
D=1.07674
D = -Σ pi ln pi
Shannon-Weaver Information Function –
Species
Diversity(S) = 5
N=33
D = -Σ pi ln pi= 1.08
Species Evenness
E = eD/s
e = 2.7 (= constant), D = the value of the Shannon-Weaver
b. and s = number of species in sample (= simple species diversity).
E=2.7*1.08/5=0.584

70
Shannon- Wiener diversity and evenness index for anuran species in a canal in the secondary
peat swamp forest in Sabangau forest.
species LIMPAR PSESUB TOTAL
npop.size 11 1 12
pi 0.92 0.08
lnpi -0.08338 -2.52572864
pixlnpi -0.07671 -0.20205829 -0.27877
D= 0.28
D = -Σ pi ln pi Shannon-Weaver Information Function –
Species Diversity
(S=2
N=12
Species Evenness
E = eD/s
: e = 2.7 (= constant), D = the value of the Shannon-
Weaver
b. and s = number of species in sample (= simple species
diversity).
E=2.7*0.28/2=0.66
Shannon- Wiener diversity and evenness index for anuran species in a regenerating burnt area
in Sabangau forest.
species hylbar occlaevis total
npop.size 13 9 22
pi 0.59 0.41
lnpi -0.52763 -0.8916
pixlnpi -0.3113 -0.36556 -0.67686
D=0.68

71
D = -Σ pi ln pi Shannon-Weaver Information Function –
Species Diversity (S) =2
N=22
Species Evenness
E = eD/s
: e = 2.7 (= constant), D = the value of the Shannon-Weaver
b. and s = number of species in sample (= simple species
diversity).
E=2.7*0.68/2=0.98
Shannon- Wiener diversity and evenness index for anuran species in recently logged gaps in
Sabangau forest.
species hylbar ingqua total
npop.size 6 1 7
pi 0.86 0.14
lnpi -0.15082 -1.96611
pixlnpi -0.25942 -0.27526 -0.53467
D= 0.53
D = -Σ pi ln pi Shannon-Weaver Information Function –
Species Diversity (S)
N=2
Species Evenness
E = eD/s
: e = 2.7 (= constant), D = the value of the Shannon-Weaver
b. and s = number of species in sample (= simple species
diversity).

72
E=2.7*0.53/2=0.234
References list
AmphibiaWeb: http://amphibiaweb.org/ downloaded 12th of March
Cheyne, S. (2010) Behavioural ecology and socio-biology of gibbons (Hylobates albibarbis)
in a degraded peat-swamp forest. In Indonesian Primates. eds J. Supriatna, S.L. Gursky.
Springer, New York
Blaustein, A.R. and B.A Bancroft (2007) Amphibian population declines: evolutionary
considerations. BioScience, 57, 437–444
Cheyne, S. and D. Macdonald (2011) Wild felid diversity and activity patterns in
Sabangau peat-swamp forest, Indonesian Borneo. Fauna & Flora International, Oryx.45(1),
119–124, downloaded:07 Apr 2011
Cook, R. (2010) Inventory of Amphibians and Reptiles at Sagamore Hill National Historic
Site. Natural Resource Report NPS/NCBN/NRTR—2010/379. Colorado
Doan, T. M. (2003) Which methods are most effective for surveying rain forest herpetofauna.
Journal of Herpetology 37:72-81
Food and Agriculture Organization of the United Nations (2010) Global Forest Resources
Assessment; http://www.fao.org/forestry/fra/fra2010/en/[Accessed March 16th
2010]

73
Frost, D. R. (2006) Amphibian Species of the World: an Online Reference. Version 4 (17
August 2006). Electronic DatabaseAccessible at
http://research.amnh.org/herpetology/amphibia/index.
Groves, C.P. (1993) Order Primates. In: D.E. Wilson and D.M. Reeder ( Eds ) Mammal
Species of the World: A Taxonomic and Geographic Reference. Smithsonian Institution Press,
Washington, D.C. pp. 243-278
Häder. D.P., H.D. Kumar, R.C. Smith and R.C. Worrest (1998) Effects on aquatic
ecosystems. J Photochem Photobiol, 46, 53–68
Hardin, J. (2006) Use of amphibians as ecosystem indicatiors species. Dissertation presented
to the graduate school of the University of Florida in partial fulfillment of the requirements
for the degree of Doctor of Philosphy University of Florida
Hamard, S., M. Cheyne and V. Nijman (2010)Vegetation correlates of gibbon density in the
peat swamp forest of the Sanbangau Catchment, Central Kalimantan, Indonesia American
Journal of Primatology 71:1-10
Harrison, M. (2009)Orangutans feeding behaviour in Sabangau, Central Kalimantan. A
dissertation submitted to the University of Cambridge in partial fulfillment of the conditions
of application for the Degree of Doctor of Philosophy,Wildlife Research Group. The

74
Anatomy School, University of Cambridge, Hughes Hall, Cambridge
Heyer, W. R., M. Donnelly, R. McDiarmid, L. Hayek and M. Foster (1994)
Measuring and monitoring biological diversity: standard methods for amphibians.
Smithsonian Institution Press, Washington, DC
Hill, D.(2005) Handbook of biodiversity methods: survey, evaluation and monitoring. The
University Press Cambridge, Cambridge, 2005
Houghton J. T., Y. Ding, D.J. Griggs, M. Noguer, P.J. van der Linden, X. Dai, K. Maskell and
C. A. Johnson (Eds.)(2001) Climate Change 2001, The Scientific Basis. Third Assessment
Report of theIntergovernmental Panel on Climate Change. Cambridge University,Press,
Cambridge, UK
Husson, S.J., C.S. McLardy, H. Morrogh-Bernard, L.J. D’Arcy and S.H. Limin(2004 in press)
The Compression Effect and Orangutan Population Decline in the Sebangau Peat Swamp
Forest 1996-2003. Submitted to Biological Conservation
Inger, R. F. and K. V. Voris. (2001)The biogeographical relations of the frogs and snakes of
Sundaland. Journal of Biogeography 28:863-891
Inger, R. (2003) Sampling Biodiversity in Bornean Frogs. The Natural History Journal of
Chulalongkorn University 3(1): 9-15.Department of Zoology, The Field Museum, Chicago,
USA

75
Inger, R and R. Stuebing (2005) A Field guide to the frogs of Borneo- Second edition
Natural History Publications (Borneo)
Iskandar, D. T.(1999a) Amphibian declines monitoring in the Leuser Management Unit,
Aceh, North Sumatra, Indonesia. Froglog 34:2
Iskandar, D. T. (1999b) Training on “monitoring methods in amphibians and reptiles fauna”
at Soraya and Gunung Air Station, Leuser National Park. Unpublished report. Institute of
Technology, Bandung, Indonesia
Iskandar, D. A and D. Setyantob (1999) Environmental impact assessment in four logged
forest conditions in South Kalimantan. Presented at Asia Pacific Congress on the Biology of
the Environment. Singapore, 21-24 November 1999
Iskandar, D. T. (2004) The amphibians and reptiles of Malinau region, Bulungan research
forest, East Kalimantan: Annotated checklist with some notes on ecological preferences of the
species and local utilization. CIFOR.
Accessed 15th
March 2011 Http://www.cifor.org/mla/_ref/publication/amphibian.htm
Iskandar, D. and W. Erdelen (2006) Conservation of amphibians and reptiles in Indonesia:
issues and problem. Amphibian and Reptile Conservation 4(1):60-87

76
IUCN (2006) IUCN Red List of Threatened Species.
http://www.redlist.org/ (accessed on 13th
June 2006)
IUCN, Conservation International, and NatureServe (2010) IUCN Red List Status,
http://www.iucnredlist.org/initiatives/amphibians/analysis/red-list-status [Accessed March
16th
2010]
Lannoo. M. (2005) Amphibian declines: The conservation status of United States
Species. University of California Press, Berkeley, USA
Macias. G. A. Marco and A. Blaustein (2007) Combined exposure to ambient UVB radiation
and nitrite negatively affects survival of amphibian early life stages.
Science of the total environment, 385, 55-65
May, R. (2004) Ecology: Ethics and amphibians. Nature 431, 403
MacKinnon, K., Ir., Gusti Hatta, H. Halim andA. Mangalik (1996) The Ecology of
Kalimantan Indonesian Borneo, The Ecology of Indonesia. Series, Volume 3, Periplus
Editions
MacKinnon, K., G. Hatta, H. Halim and A. Mangalik (1996) the Ecology of Kalimantan,
Indonesia Borneo. Periplus Editions (HK) Ltd.
Magurran,A. (2004) Measuring biological diversity. Blackwell Publishing.UK

77
Morrogh-Bernard H, S. Husson, S.E. Page and J.O. Rieley. (2003) Population status of the
Bornean orang-utan (Pongo pygmaeus) in the Sabangau Peat Swamp Forest, Central
Kalimantan, Indonesia. Biological Conservation 110: 141-152
Meijaard, E. et al (2005) Life after logging: Reconciling Wildlife Conservation and
Production Forestry in Indonesia Borneo. Centre of International Forestry, Borneo
Mendelson, J. R., K.R. Lips, R.W. Gagliardo, G.B. Rabb, J.P. Collins, J.E. Diffendorfer, P.
Daszak, D.R. Ibanez, K.C. Zippel, D.P. Lawson, K.M. Wright, S.N.Stuart and C.Gascon
(2006) Biodiversity. Confronting amphibian declines and extinctions. Science 313: 48
Morrogh-Bernard H, S. Husson, S.E.Page and J.O. Rieley(2003) Population status of the
Bornean orang-utan (Pongo pygmaeus) in the Sabangau Peat Swamp Forest, Central
Kalimantan, Indonesia. Biological Conservation 110: 141-152.
The Orangutan Tropical Peatland Project (OuTrop) and Centre for the International
Cooperation in Management of Tropical Peatland(CIMTROP)(2010)Biodiversity Surveys and
Conservation Assessment of the Bawan Forest, Indonesia, Borneo
http://www.orangutantrop.com/research/researchsite/catchment.html[Accessed March 25th
2010]
OuTrop and CIMTROP (2010) Biodiversity surveys and conservation assessment of the
Bawan forest, Indonesian Borneo. Technical report

78
Page SE, J.O. Rieley, K. Doody, S. Hodgson, S. Husson, P. Jenkins, H. Morrogh-Bernard ,
S. Otway and S.Wilshaw (1997). Biodiversity of tropical peat swamp forest: a case study of
animal diversity in the Sungai Sabangau catchment of Central Kalimantan, Indonesia. In:
Rieley JO and S.E. Page , editors. Tropical peatlands. Cardigan: Samara Publishing Limited. p
231-242
Parris, K.M and M.A. McCarthy (1999) What influences the structure of frog
assemblages at forest streams?. Australian Journal of Ecology, 24, 495-502
Pechmann, J.H.K. and H.M. Wilbur (1994 )Putting declining amphibian populations
perspective: natural fluctuations and human impacts. Herpetologica 50:65-84
Porter, A. ( 2010) Abundance and diversity of anuran species in
Danum Valley, Sabah, Borneo. The Plymouth Student Scientist, 2010, 3, (1), 34-50
Rodel, M. O. and R.Ernst (2004) Measuring and monitoring amphibian diversity in
tropical forests, I, An evaluation of methods with recommendations for
standardization. Ecotropica, 10, 1-14
Seaby R. M. and P.A. Henderson (2006) Species Diversity and Richness Version 4.
Pisces Conservation Ltd., Lymington, England
Stuart, S. N., J.S.Chanson, N.A. Cox, B.E.Young, A.S.L. Rodrigues, D.L.Fischman and R. W.
79
Waller (2004) Status and trends of amphibian declines and extinctions worldwide. Science
306:1783–1786
Sutherland, W. J (2006) Ecological Census Techniques a handbook, Second
Edition. Cambridge University Press, UK
Ulmar G.T. and A. Keller (2009) A Bornean amphibian hotspot: the lowland mixed
dipterocarp rainforest at Ulu Temburong National Park. Salamandra 25-38 1 45
Brunei Darussalam
Veith, M., S. Wulffrsst, J. Kosuch, G. Hallmann, H.W. Henkel, P. Sound and D. Iskandar
(2004) Amphibians of the Kayan Mentarang National Park (East Kalimantan,
Indonesia):estimating overall and local species richness. Tropical Zoology 17: 1-13
Venter, O., E. Meijaard, H. Possingham, R. Dennis, D. Sheil, L. Hovani and K. Wilson (2008)
Carbon payments as a safeguard for threatened tropical mammals Received: 11 December
2008; accepted 12doi: 10.1111/j.1755-263X.2009.00059.x
Yule, C. (2010)Loss of biodiversity and ecosystem functioning in Indo-Malayan peat swamp
forests. Biodiversity and Conservation. Volume 19, Number 2, 393-409
Waddell, E. ( 2011) Amphibian diversity in Bornean forests: a comparison of habitats using
different sampling methods and richness estimators. Undergraduate thesis. University of
80
Glasgow, Scotland.
Whitmore. T.C. (1998) An Introduction to tropical Rain forests. Second edition,
Oxford University press, United States, New York
Williams, L. (2007) A comparative study between two villages within the Sabangau: Their use
of Natural Resources and understanding of Ecological Restoration. Undergraduate Thesis.
University of East Anglia
Wong, A. (2003). Species diversity and abundance of frogs in different forestry practices In
Sabah,Malaysia. In International Conference on Bornean Herpetology 16-17 December
2003. Universiti Malaysia Sabah, Kota Kinabalu, Malaysia.