an equity beta estimate for australian energy network ... 8.2... · an equity beta estimate for...
TRANSCRIPT

© Frontier Economics Pty. Ltd., Australia.
An equity beta estimate for Australian
energy network businesses A REPORT PREPARED FOR ACTEWAGL DISTRIBUTION
February 2018


i Frontier Economics | February 2018
Contents
An equity beta estimate for Australian
energy network businesses
1 Executive summary 4
1.1 The AER’s approach 4
1.2 Recent analysis by the ERA 5
1.3 Recent empirical evidence 6
1.4 Author of report 6
2 Background and context 8
2.1 The role of equity beta 8
2.2 The estimation of equity beta 8
2.3 Comparator firms and re-levered equity beta estimates 9
2.4 The AER approach to beta 11
3 The ERA’s recent updated beta estimates 14
3.1 A current best statistical estimate of 0.7 14
3.2 The ERA’s estimation methodology 15
4 Current equity beta estimates 16
4.1 Data Source 16
4.2 Methodology 16
4.3 Current beta estimates for domestic utilities 18
5 Declaration 29
6 Appendix: Comment on the AER’s 2017 beta analysis 30
7 Appendix: Transport comparator firms 36
8 Appendix: Instructions 39
9 Appendix: Curriculum Vitae of Professor Stephen Gray 40
Key experience 40
Papers and publications: Cost of capital 49

ii Frontier Economics | February 2018
Tables and figures
An equity beta estimate for Australian
energy network businesses
Figures
Figure 1: 95% confidence intervals for weekly beta estimates over the last 5
years 20
Figure 2: Rolling 5-year portfolio estimates of beta 22
Figure 3: Rolling average of the value-weighted portfolio, showing 95%
confidence intervals 23
Figure 4: Varying window beta estimates 24
Figure 5: Comparison of 2014 and 2017 individual beta estimates (re-levered)
for comparators that remain listed at the time of the AER’s 2017 beta study
32
Figure 6: Comparison of 2014 and 2017 average beta estimates (re-levered)
across comparators that remain listed at the time of the AER’s 2017 beta
study 33
Figure 7: Comparison of 2014 and 2017 portfolio estimates (OLS, re-levered)
constructed using comparators that remain listed at the time of the AER’s
2017 beta study 34
Tables
Table 1: Weekly beta estimates over the last 5 years 19
Table 2: Weekly beta estimates over the last 10 years 21
Table 3: Weekly transport infrastructure beta estimates over the last 10 years:
Individual firm estimates 27
Table 4: Weekly transport infrastructure beta estimates over the last 10 years:
Portfolio estimates 28
Table 5: Availability of data used in AER’s 2017 beta study 31

February 2018 | Frontier Economics iii
Draft Tables and figures

4 Frontier Economics | February 2018
Executive summary
1 Executive summary
1 Frontier Economics has been retained by ActewAGL Distribution to provide an
expert opinion on the approach to estimating the equity beta for use in the Sharpe-
Lintner Capital Asset Pricing Model (SL-CAPM).
2 Specifically, we have been asked to:
a. Set out the AER’s methodology—as specified in the AER’s 2013
Rate of Return Guideline (Guideline)—for deriving estimates of
the equity beta for Australian energy network businesses;
b. Update the statistical estimates of the equity beta using the AER’s
methodology using market data that has become available since the
publication of the Guideline;
c. Consider the latest evidence on Australian energy network
businesses published by the Economic Regulation Authority of
Western Australia (ERA), noting that the Guideline had regard to
similar evidence published by the ERA in 2013;
d. Consider any adjustments that the AER has made in the past to its
statistical estimate of the equity beta to arrive at its final equity beta
estimate; and
e. Provide an expert opinion on a reasonable, current estimate of the
equity beta for Australian energy network businesses.
1.1 The AER’s approach
3 In its Guideline, the AER adopted a “primary range” of 0.4 to 0.7 for the equity
beta of the benchmark efficient entity (BEE).1 This primary range is based on a
set of domestic comparators for a regulated energy distribution business. Only
three of the nine domestic comparator companies considered by the AER at the
time of the Guideline remain listed today: APA Group, AusNet Services and Spark
Infrastructure.
4 In a series of decisions, the AER has explained that:
a. It considers the “best empirical estimate” of beta to be 0.5;2 and
1 AER Rate of Return Guideline, p. 15.
2 TransGrid Draft Decision, 2017, Attachment 3, p. 3-243.

February 2018 | Frontier Economics 5
Executive summary
b. The allowed beta is to be set to 0.7 due to three additional
considerations:3
i. “international estimates” – the fact that the weight of
evidence from international comparators supports a beta
estimate materially above the AER’s domestic starting
point estimate of 0.5;
ii. “consideration of the theory of the Black CAPM” – the
fact that the Black CAPM evidence is that the unadjusted
SL-CAPM will systematically understate the required
return on low-beta stocks; and
iii. “investor certainty” – the fact that instability in equity beta
allowances may cause investors to increase their
assessment of regulatory risk.
5 Thus, the AER’s approach is to begin with its “best empirical estimate” of 0.5 from
domestic comparators, and then select a final point estimate (i.e., 0.7) above this
level on the basis of a number of other considerations.
6 Approximately four years have elapsed since the analysis that was performed at the
time of the AER’s Guideline, providing approximately 200 more recent weekly
returns observations. This report demonstrates that the more recent evidence
results in an increase in the statistical beta estimates.
1.2 Recent analysis by the ERA
7 The ERA has recently updated its equity beta estimates for the BEE and concluded
that the latest available data supports a best statistical beta estimate of 0.7, as
compared to the AER’s 2013 best statistical estimate of 0.5.
8 That is, the ERA has concluded that equity beta estimates based on current data
for domestic regulated network comparators are materially higher than the
estimates at the time of the Guideline.
9 For its Final Decision for DBP, the ERA updated its beta estimates for domestic
comparators and concluded that:
…the Authority considers that a 95 per cent confidence interval range of equity beta
using the most recent data is from 0.479 and 0.870 based on the portfolio results (see
Appendix 4A, Table 21 and Table 22). The central estimate given by the average of
the portfolios is 0.699. The Authority notes that portfolio estimates have a narrower
range than the individual assets.
Based on its own analysis and the other evidence before it, together with the
recognition that estimates of equity beta from empirical studies exhibit a high level of
3 TransGrid Draft Decision, 2017, Attachment 3, p. 3-165
6 Frontier Economics | February 2018
Executive summary
imprecision, the Authority is of the view that the point estimate of equity beta of 0.7
(rounded) provides a conservative and appropriate central best estimate for beta for
use in the SL-CAPM.4
10 Unlike the AER, the ERA does not reflect in its final point estimate the
international evidence, low-beta bias or investor certainty. Rather, the ERA
compiles what it considers to be the best statistical estimate and adopts that figure
– which it currently considers to be 0.7. Any accounting by the AER for additional
factors, such as those accounted for in the Guideline, would result in a higher
estimate than is indicated by the statistical evidence alone.
1.3 Recent empirical evidence
11 In this report, we compile a range of equity beta estimates using the most recent
data that is available on domestic network comparators. Our main findings are:
a. Equity beta estimates for domestic regulated network comparators
have increased since the 2013 Guideline. Using the same firms that
the AER and ERA analyse and using the same estimation method,
current estimates are higher than the “best statistical estimate” at
the time of the Guideline; and
b. Equity beta estimates for a broader sample of domestic
unregulated infrastructure firms are also higher than the 0.5 “best
statistical estimate” at the time of the Guideline.
12 Consequently, we conclude that application of the AER’s Guideline approach (i.e.,
begin with a best empirical estimate and select a point estimate from the top the
equity beta range to account for the additional considerations set out above) to the
most recently available data would support an equity beta of at least 0.7. Indeed,
recent empirical evidence supports a final beta allowance of at least 0.7, even if the
AER adopts what is considers to be the best empirical estimate, rather than the
Guideline approach of adopting the top of the range of empirical estimates, as its
point estimate for the equity beta.
1.4 Author of report
13 This report has been authored by Professor Stephen Gray, Professor of Finance
at the UQ Business School, University of Queensland and Director of Frontier
Economics, a specialist economics and corporate finance consultancy. I have
Honours degrees in Commerce and Law from the University of Queensland and
a PhD in Financial Economics from Stanford University. I teach graduate level
courses with a focus on cost of capital issues, I have published widely in high-level
4 DBP Final Decision, Attachment 4, Paragraphs 473-474.

February 2018 | Frontier Economics 7
Executive summary
academic journals, and I have more than 20 years’ experience advising regulators,
government agencies and regulated businesses on cost of capital issues. I have
published a number of papers that specifically address beta estimation issues. A
copy of my curriculum vitae is attached as an appendix to this report.
14 My opinions set out in this report are based on the specialist knowledge acquired
from my training and experience set out above. I have been provided with a copy
of the Federal Court’s Expert Evidence Practice Note GPN-EXPT, which
comprises the guidelines for expert witnesses in the Federal Court of Australia. I
have read, understood and complied with the Practice Note and the Harmonised
Expert Witness Code of Conduct that is attached to it and agree to be bound by
them.

8 Frontier Economics | February 2018
Background and context
2 Background and context
2.1 The role of equity beta
15 The approach that the AER uses to determine the allowed return on equity is
known as the Sharpe-Lintner Capital Asset Pricing Model (SL-CAPM).5 Under
the SL-CAPM, the return on equity that investors would require in the current
market conditions, er , is given by:
fmfe rrrr
where:
a. fr represents the risk-free rate of return. This is the return that
is available to investors on an investment that is completely free of
risk. Commonwealth government bonds are usually assumed to be
such a risk-free investment;
b. mr represents the expected return on the market, which is the
expected return that investors require to invest in an asset of
average risk;
c. fm rr represents the market risk premium, which is the
amount of extra return (over and above the return on a risk-free
asset) that investors would require for investing in an asset of
average risk; and
d. represents the equity beta, which indicates the extent to which
the particular investment has more or less risk than average. For
example, an equity beta of 1.2 indicates that the investment is 20%
more risky than average, in which case it would require a risk
premium (over and above the risk-free rate) that is 20% more than
would be required for an investment of average risk.
2.2 The estimation of equity beta
16 In the SL-CAPM, the equity beta is defined to be:
5 This formula was independently derived by Sharpe (1964) and Lintner (1965). Sharpe, W., 1964, “Capital
asset prices: A theory of market equilibrium under conditions of risk,” Journal of Finance, 19, 425-442;
and Lintner, J., 1965, “The valuation of risk assets and the selection of risky investments in stock
portfolios and capital budgets,” Review of Economics and Statistics, 13-37.

February 2018 | Frontier Economics 9
Background and context
m
mi
rVar
rrCov ,
where:
a. mi rrCov , is the covariance between the returns of the asset in
question and the returns on the market portfolio; and
b. mrVar is the variance of the returns on the market portfolio.
17 The slope coefficient from an ordinary least squares (OLS) regression of stock
returns on market returns has the same definition as beta above, so it is standard
to estimate betas using OLS regression analysis:
ttmti rr ,, .
18 This OLS estimation technique was employed by Henry (2014) in a report
commissioned by the AER.6 Henry (pp. 8-9) notes that he was instructed to also
report estimates from the Least Absolute Deviations (LAD) approach. Because
the LAD estimate does not correspond with the SL-CAPM definition of beta in
Paragraph 16 above, we focus on the OLS estimates in this report. In this regard,
Henry (2014) states:
The AER also requires the construction of estimates of using the Least Absolute
Deviations (LAD) approach…The use of LAD in addition to the (standard) OLS was
intended to provide a robustness check on the underlying data with regard to data
outliers. The consultant was not requested to provide expert advice or analysis on this
design decision.7
2.3 Comparator firms and re-levered equity beta
estimates
19 The equity beta estimates for individual firms generally have poor statistical
properties. For example, the statistical noise in stock return data results in equity
beta estimates for individual firms being unstable over time (sometimes doubling
or halving over the course of two years). In addition, the R-squared statistics tend
to be very low, indicating that there is a high degree of firm-specific noise which
makes it difficult to reliably quantify the relationship between stock and market
returns.
6 See Henry (2014), Estimating β: An update, April, Equation (4), p. 6. Henry (pp. 8-9) notes that he was
instructed to also report estimates from the Least Absolute Deviations (LAD) approach
7 Henry (2014), pp. 8-10.
10 Frontier Economics | February 2018
Background and context
20 For this reason, it is common to consider a set of comparator firms such that
random statistical noise might tend to cancel out in a large enough sample of firms.
There are two ways to distil the information from a set of comparator firms into a
single beta estimate:
a. Estimate beta for each of the comparator firms and take the mean
over this set of estimates; and
b. For each period, form the returns from each comparator firm into
a portfolio return and use the portfolio returns in the OLS
regression approach to produce a single estimate of beta.
21 In this report, we follow the standard approach of considering both of these
techniques for reducing sampling error.8
22 When using a set of comparator firms, it is important to produce “re-levered”
equity beta estimates. To explain this concept, we first note that beta is an estimate
of the systematic risk of owning shares in the relevant company. There are two
elements of this risk:
a. The asset beta – the inherent risk of the firm’s operations; and
b. Leverage – the extent to which the firm has issued debt finance
which ranks ahead of equity.
23 The asset beta reflects the extent to which some lines of business are inherently
riskier than others. For example, high-end consumer products and financial
services businesses tend to perform very well when the market is up and poorly
when the market is down, whereas carton manufacturers and supermarkets tend
to have more stable performance over market cycles.
24 Consider two firms with the same asset beta (because they operate in the same
industry) but which have different leverage. The shareholders in the firm with
higher leverage are subject to more risk. This is because the debt holders have a
claim that ranks ahead of equity – they are entitled to be paid in full before the
equity holders are entitled to any residual distribution.
25 Selecting comparator firms to match the relevant characteristics of the firm in
question ensures that the sample firms all have similar operational risk (asset beta).
However, the comparator firms may have different leverage. To correct for these
differences in leverage, a procedure known as ‘re-levering’ is used.
26 In the case at hand, the AER has determined that the benchmark efficient entity
(BEE) has 60% debt finance. If a comparator firm has, for example, 50% leverage,
its beta estimate must be re-levered to provide an estimate of what that beta
estimate would have been if the firm had 60% debt commensurate with the BEE.
The process of re-levering beta estimates to ensure that they are comparable is
8 For example, these two approaches were adopted by Henry (2014).

February 2018 | Frontier Economics 11
Background and context
standard academic and industry practice. All of the Henry (2014) beta estimates
have been re-levered by multiplying the raw beta estimates by the following factor:
60.01
1
G
where G represents the average leverage of the comparator firm over the relevant
data period. We follow the Henry (2014) approach to re-levering throughout this
report.
2.4 The AER approach to beta
27 The AER’s approach to setting the allowed beta involves two steps:
a. The first step is to determine a range for beta from an analysis of
domestic comparators; and
b. The second step is to use all other relevant evidence to guide the
selection of a point estimate from within that range.
28 In its Guideline materials, the AER summarised its approach as follows:
…the AER proposes to estimate the range for the equity beta based on empirical
analysis using a set of Australian energy utility firms the AER considers reasonably
comparable to the benchmark efficient entity. This approach leads to a range for equity
beta from 0.4 to 0.7.
The AER then proposes to use other information sources to inform the selection of a
point estimate from within the empirical range of equity beta estimates. This additional
information includes:
empirical estimates of overseas energy networks.
the theoretical principles underpinning the Black CAPM.
This approach leads to a point estimate of 0.7 for equity beta, chosen from within the
range 0.4 to 0.7.9
29 The AER has maintained its 0.7 beta allowance in all of its decisions since the
Guideline.
30 In relation to the first step of establishing a primary range based on a consideration
of statistical estimates from domestic comparators only, the AER commissioned
the Henry (2014) report. Henry advised the AER that:
9 AER Rate of Return Guideline, p. 15.

12 Frontier Economics | February 2018
Background and context
In the opinion of the consultant, the majority of the evidence presented in this report,
across all estimators, firms and portfolios, and all sample periods considered, suggests
that the point estimate for β lies in the range 0.3 to 0.8.10
31 The AER has not adopted the advice from Henry (2014) and has instead adopted
a primary range of 0.4 to 0.7. The AER has explained its rationale as follows:
…while Henry appears to base his range on all his estimates (including individual firm
estimates), we consider the most useful empirical estimates in our regulatory context
are averages of individual firm estimates and fixed weight portfolio estimates. We note,
in any case, that a point estimate of 0.7 is consistent with, and at the higher level of,
the range identified by Henry.11
32 Consequently, while we report individual firm estimates below, our primary focus
is on the average and portfolio estimates of beta.
33 The second step of the AER’s approach to beta is to select a point estimate from
within its primary range. The AER begins this task by concluding that:
We also consider Henry's 2014 results indicate a best empirical estimate of
approximately 0.5 for the benchmark efficient entity. This is because most of the
[average and portfolio] estimates are clustered around 0.5...12
34 However, the AER also notes that there are additional considerations that inform
its determination of the equity beta point estimate from within the range. In its
recent decisions, the AER has maintained its beta allowance at 0.7. The choice of
the final point estimate of 0.7—which is at the top of the AER’s estimated equity
beta range, and above the AER’s best empirical estimate of 0.5—is said to be based
on three considerations:13
a. “International estimates” – due to the fact that the weight of
evidence from international comparators supports a beta estimate
materially above the AER’s domestic starting point estimate of 0.5;
b. “Considerations of the Black CAPM” – due to the fact that the
Black CAPM evidence is that the unadjusted SL-CAPM will
systematically understate the required return on low-beta stocks;
and
c. “Investor certainty” – due to the fact that a larger movement from
the AER’s previous 0.8 allowance may cause investors to increase
their assessment of regulatory risk.
10 Henry (2014), p. 63.
11 TransGrid Draft Decision, 2017, Attachment 3, p. 3-274.
12 TransGrid Draft Decision, 2017, Attachment 3, p. 3-243.
13 TransGrid Draft Decision, 2017, Attachment 3, p. 3-165.

February 2018 | Frontier Economics 13
Background and context
35 Nowhere in its decisions does the AER quantify how much of the uplift from 0.5
to 0.7 is due to each of the three factors that it has documented. Moreover, the
AER has not stated whether it considers any of the three factors to be more or less
important than the others.

14 Frontier Economics | February 2018
The ERA’s recent updated beta estimates
3 The ERA’s recent updated beta estimates
3.1 A current best statistical estimate of 0.7
36 In its recent (June 2016) Final Decision for DBP,14 the ERA noted that it had
adopted a range of 0.3 to 0.8, consistent with the advice from Henry (2014):
The Authority noted in the Draft Decision it considered that the 95 per cent confidence
interval for the beta estimate was 0.3 to 0.8. The Authority then determined a point
estimate for beta at 0.7, allowing for some adjustment towards the top end of the range
to account for the theory underpinning the Black CAPM.15
37 For its Final Decision, the ERA updated its beta estimates for domestic
comparators and concluded that:
…the Authority considers that a 95 per cent confidence interval range of equity beta
using the most recent data is from 0.479 and 0.870 based on the portfolio results (see
Appendix 4A, Table 21 and Table 22). The central estimate given by the average of
the portfolios is 0.699. The Authority notes that portfolio estimates have a narrower
range than the individual assets.
Based on its own analysis and the other evidence before it, together with the
recognition that estimates of equity beta from empirical studies exhibit a high level of
imprecision, the Authority is of the view that the point estimate of equity beta of 0.7
(rounded) provides a conservative and appropriate central best estimate for beta for
use in the SL-CAPM.16
38 That is, the ERA has concluded that the latest available data supports a best
statistical beta estimate of 0.7, as compared to the AER’s 2013 best statistical
estimate of 0.5. Unlike the AER, the ERA does not reflect in its final point
estimate the international evidence, low-beta bias or investor certainty. Rather, the
ERA compiles what it considers to be the best statistical estimate and adopts that
figure – which it currently considers to be 0.7. Any accounting for the factors
identified by the AER in the Guideline as relevant to the selection of the final point
estimate would result in a higher estimate.
14 ERA, Final Decision on Proposed Revisions to the Access Arrangement for the Dampier to Bunbury
Natural Gas Pipeline 2016 – 2020, 30 June 2016.
15 DBP Final Decision, Attachment 4, Paragraph 469.
16 DBP Final Decision, Attachment 4, Paragraphs 473-474.

February 2018 | Frontier Economics 15
The ERA’s recent updated beta estimates
3.2 The ERA’s estimation methodology
3.2.1 Currently existing comparators
39 The ERA’s approach to estimating beta was to focus on the four domestic
comparators that still remained listed at the time the ERA conducted its analysis:
APA Group, AusNet Services, DUET and Spark Infrastructure.17 The ERA does
not estimate betas using firms that were once listed but that have subsequently
been delisted. We agree with this approach and adopt it in our empirical analysis
below. In our view, regression analysis applied to firms that have not existed for
several years is unlikely to provide an estimate of beta that is commensurate with
the prevailing conditions in the market for equity funds.
3.2.2 Portfolio estimates
40 The ERA draws its conclusions on the basis of portfolio estimates, considering
both equally weighted and value weighted portfolios. Whereas the ERA also
reports mean estimates over the four remaining comparators, it places less weight
on them. This is primarily because the beta estimates for one of the four
comparators, DUET, are materially below all of the other individual firm estimates
and all of the portfolio estimates.18 Our approach is to consider average and
portfolio estimates.
3.2.3 Range of regression approaches
41 The ERA uses four variations of regression analysis – standard OLS analysis and
three other methods. The beta estimates from OLS analysis are generally lower
than the estimates from the other techniques.19 However, it is only the estimate
from OLS regression that corresponds to the CAPM definition of beta, so we
focus on OLS estimates in our empirical analysis below.
3.2.4 Use of five years of data
42 The ERA focuses on estimates from the most recent five years of data. When
estimating beta there is a trade-off between using a short data period to ensure that
the estimate is commensurate with prevailing conditions, and using a longer period
to improve statistical precision. Our view is that a five-year period is generally
insufficient to provide sufficient statistical precision, so we also consider estimates
from longer (10-year) periods.
17 DUET was de-listed in May 2017, leaving just three listed domestic energy network comparator firms.
18 DBP Final Decision, Attachment 4, Paragraphs 470-471.
19 DBP Final Decision, Attachment 4, Table 2, p. 102.
16 Frontier Economics | February 2018
Current equity beta estimates
4 Current equity beta estimates
43 This section sets out recent beta estimates for:
a. The four domestic regulated utility comparator firms that remained
listed until May 2017: APA Group, AusNet Services, DUET and
Spark Infrastructure;20 and
b. A broader set of firms that have investments in long-lived
infrastructure assets.
44 We report beta estimates for individual firms, mean estimates across firms, and
portfolio estimates (equal and value-weighted portfolios).
4.1 Data Source
45 We have obtained weekly and monthly total returns for each stock and the broad
market index21 from Datastream for the most recently available 10-year period,
2006-09-01 to 2016-09-01. Our main results are based on the full 10-year period,
but we also consider periods of different lengths as a robustness test.
4.2 Methodology
4.2.1 Regression analysis
46 All of the beta estimates reported below are estimated by OLS as set out in Section
2.2 above:
ttmti rr ,, .
47 We have re-levered all estimates to be consistent with the 60% leverage assumption
that the AER has adopted. We have used the same re-levering process that was
adopted by Henry (2014) and which has been used consistently by the AER in
every decision since its inception. Specifically, the re-levering is performed by
multiplying the raw OLS beta estimates by the following factor:
60.01
1
G
where G represents the average leverage of the comparator firm over the relevant
data period.
20 DUET was delisted in May 2017, leaving just three comparator firms in the AER’s sample listed.
21 ASX 200 Total Return Index.
February 2018 | Frontier Economics 17
Current equity beta estimates
4.2.2 Equally weighted portfolio construction
48 We construct equally-weighted portfolio estimates for two portfolios:
a. The set of four domestic regulated gas and electricity distribution
businesses; and
b. The broader set of infrastructure firms.
49 In each case, the equally weighted portfolio is created by assigning the same weight
to the returns of each firm for each period:
N
ititp r
Nr
1,,
1.
50 For example, when computing a weekly estimate, we compute the portfolio return
for each week as the simple mean of the returns of each of the firms in the
portfolio. This produces a single time series of portfolio returns, which are
regressed against the corresponding market returns to produce a raw beta estimate.
51 The raw beta estimate is then re-levered using the AER approach, as set out above.
The average leverage is computed by constructing an equally-weighted average of
the leverage of each component firm for each week or month, and then by
averaging over all weeks or months:
T
t
N
itip G
NTG
1 1,
11.
4.2.3 Value weighted portfolio construction
52 The value weighted portfolio return for each week or month is constructed by
applying a number of steps:
a. For each week or month, the “portfolio market value of equity” is
created as the sum of the market value of equity for each
constituent firm:
N
ititp EE
1,,
.
b. The weight applied to each constituent firm (for that period, t) is
then constructed as the ratio of the firm’s market value of equity
to that of the portfolio:
.,
,,
tp
titi
E
Ew
c. The portfolio return for each period, t, is then constructed as a
weighted average of the returns of each constituent firm:

18 Frontier Economics | February 2018
Current equity beta estimates
N
itiitp rwr
1,,
This produces a single time series of portfolio returns, which are
regressed against the corresponding market returns to produce a
raw beta estimate.
53 The raw beta estimate is then re-levered using the AER approach, as set out above.
The average leverage is computed by constructing a value weighted average of the
leverage of each component firm for each period, t, and then by averaging over all
weeks or months:
T
t
N
ititip Gw
TG
1 1,,
1.
4.3 Current beta estimates for domestic utilities
54 We begin by reporting current beta estimates for the four firms in the AER’s set
of domestic comparators that remained listed until May 2017. In all cases, we
report raw OLS beta estimates and re-levered estimates in a table structure that
follows Henry (2014).
4.3.1 Beta estimates over the past five years
55 We begin by considering beta estimates over the most recent five-year period.
Although our view is that a sample of five years and four comparator firms is too
small to produce reliable estimates, we report these results:
a. To provide an indication of the direction of movement in equity
beta estimates since the 2013 Guideline; and
b. To provide a point of comparison with the ERA’s recent approach,
which was to rely almost exclusively on estimates from the most
recent five-year period for the four domestic utilities.
Table 1 shows that the re-levered equity beta estimates for three of the four firms are in the order of 0.7 to 0.9, with the DUET estimate appearing to be an outlier in the sense that it is materially below the other three estimates.

February 2018 | Frontier Economics 19
Current equity beta estimates
56 Figure 1 shows that the 95% confidence interval for DUET does not overlap the
interval for any of the other estimates, indicating that the DUET estimate is
significantly different from all other estimates.
57 As noted above, DUET is no longer listed, so is no longer available to the AER as
a comparator contributing current information towards the estimate of the equity
beta. The mean estimate over the four firms is 0.67, and if DUET is excluded the
mean rises to 0.79.
58 The value and equally-weighted portfolio estimates are 0.71 and 0.83 respectively,
which corresponds closely to the estimates for three of the four comparator firms.
The mean of the two portfolio estimates is 0.77.
Table 1: Weekly beta estimates over the last 5 years
Statistic APA AST DUE SKI
Equally-
Weighted
Portfolio
Value-
Weighted
Portfolio
Average gearing 0.50 0.58 0.64 0.28 0.50 0.52
Adjustment factor 1.24 1.04 0.90 1.80 1.24 1.20
Raw beta 0.64 0.66 0.36 0.49 0.58 0.69
Re-levered beta 0.80 0.68 0.33 0.89 0.71 0.83
Standard error 0.09 0.08 0.09 0.12 0.07 0.09
Confidence
interval upper
bound
0.97 0.84 0.50 1.12 0.85 1.01
Confidence
interval lower
bound
0.62 0.52 0.15 0.66 0.58 0.65
R2 0.20 0.21 0.05 0.11 0.25 0.21
Observations 260 260 260 260 260 260
Source: Datastream, Frontier Economics calculations. Five years to beginning of May 2017.

20 Frontier Economics | February 2018
Current equity beta estimates
Figure 1: 95% confidence intervals for weekly beta estimates over the last 5 years
Source: Frontier Economics
59 We have also compiled beta estimates using monthly data over the last five years.
The key monthly point estimates are as follows:
a. The mean estimate over the four comparator firms is 0.82;
b. The equally-weighted portfolio estimate is 0.96;
c. The value-weighted portfolio estimate is 1.20;
d. The average of the two portfolio estimates is 1.08.
That is, the monthly estimates are generally higher than the weekly estimates.
60 It is clear that these recent re-levered equity beta estimates are materially higher
than the best statistical estimate of 0.5 adopted by the AER in its decisions since
the Rate of Return Guideline.
4.3.2 Beta estimates over the past ten years
As set out above, our view is that a sample of four firms and five years of data is
insufficient to provide statistically reliable estimates of beta. In this section, we
expand the sample period to ten years, examining a period from May 2007 to May
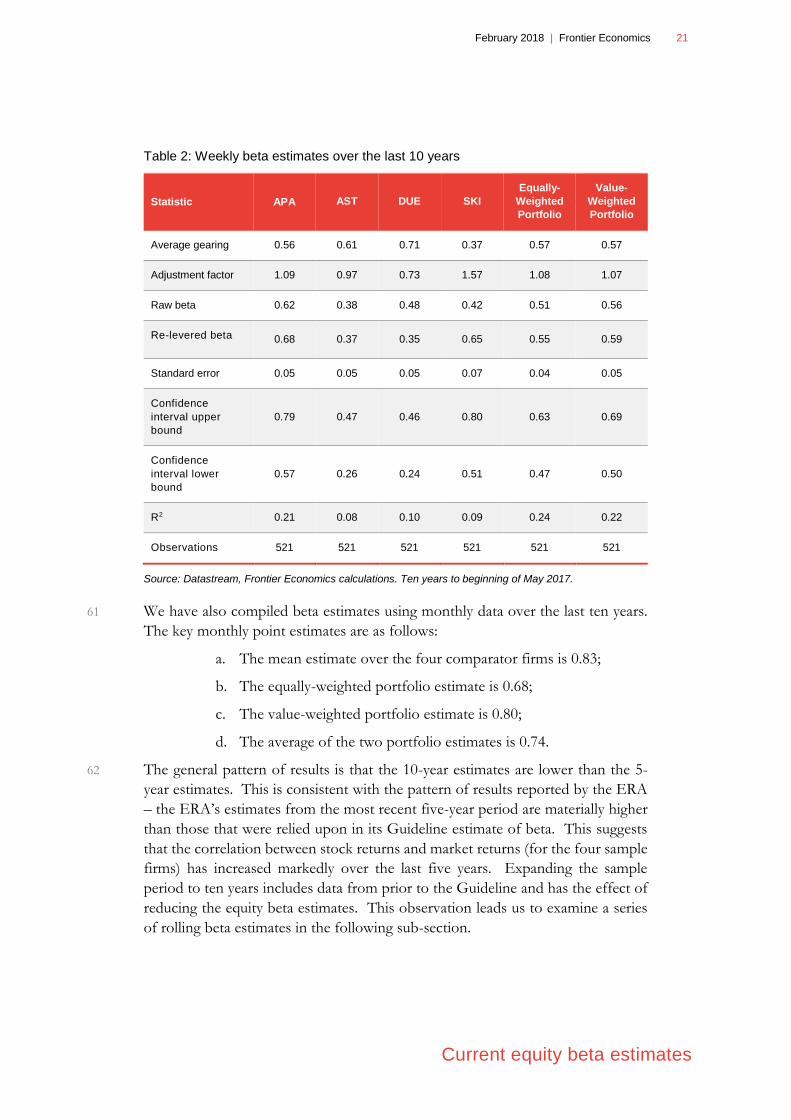
2017. The results are set out in Table 2.
February 2018 | Frontier Economics 21
Current equity beta estimates
Table 2: Weekly beta estimates over the last 10 years
Statistic APA AST DUE SKI
Equally-
Weighted
Portfolio
Value-
Weighted
Portfolio
Average gearing 0.56 0.61 0.71 0.37 0.57 0.57
Adjustment factor 1.09 0.97 0.73 1.57 1.08 1.07
Raw beta 0.62 0.38 0.48 0.42 0.51 0.56
Re-levered beta 0.68 0.37 0.35 0.65 0.55 0.59
Standard error 0.05 0.05 0.05 0.07 0.04 0.05
Confidence
interval upper
bound
0.79 0.47 0.46 0.80 0.63 0.69
Confidence
interval lower
bound
0.57 0.26 0.24 0.51 0.47 0.50
R2 0.21 0.08 0.10 0.09 0.24 0.22
Observations 521 521 521 521 521 521
Source: Datastream, Frontier Economics calculations. Ten years to beginning of May 2017.
61 We have also compiled beta estimates using monthly data over the last ten years.
The key monthly point estimates are as follows:
a. The mean estimate over the four comparator firms is 0.83;
b. The equally-weighted portfolio estimate is 0.68;
c. The value-weighted portfolio estimate is 0.80;
d. The average of the two portfolio estimates is 0.74.
62 The general pattern of results is that the 10-year estimates are lower than the 5-
year estimates. This is consistent with the pattern of results reported by the ERA
– the ERA’s estimates from the most recent five-year period are materially higher
than those that were relied upon in its Guideline estimate of beta. This suggests
that the correlation between stock returns and market returns (for the four sample
firms) has increased markedly over the last five years. Expanding the sample
period to ten years includes data from prior to the Guideline and has the effect of
reducing the equity beta estimates. This observation leads us to examine a series
of rolling beta estimates in the following sub-section.

22 Frontier Economics | February 2018
Current equity beta estimates
4.3.3 Rolling beta estimates
63 Figure 2, below shows rolling 5-year beta estimates for the two portfolio methods.
We have estimated the re-levered portfolio betas for a number of five-year periods.
There is an obvious increase in the portfolio beta estimates as data from 2014,
2015, 2016 and 2017 is introduced, replacing older data from 2007-2008. This is
consistent with the notion that the relationship between the domestic comparator
stock returns and market returns has become stronger in the years that have passed
since the Guideline.
Figure 2: Rolling 5-year portfolio estimates of beta
Source: Datastream, Frontier Economics calculations.
64 Figure 3 shows the 95% confidence interval around the rolling five-year weekly
value-weighted portfolio estimates. This figure shows that the starting point
estimate of 0.5 that the AER adopted from its Guideline analysis does not fall
within the standard 95% confidence interval for the most recent estimate.
65 Moreover, there is little or no overlap between the bottom of the current
confidence interval and the top of the interval around the time of the Guideline.

February 2018 | Frontier Economics 23
Current equity beta estimates
This suggests that the estimates have increased significantly since the time of the
Guideline.
Figure 3: Rolling average of the value-weighted portfolio, showing 95% confidence
intervals
Source: Datastream, Frontier Economics calculations.
66 Figure 4 shows the re-levered portfolio equity beta estimates for different sample
periods, all ending with the most recent data from May 2017. The estimates at the
left-hand end of the figure are based on a longer sample period of ten years.
Moving from left to right sees the length of the sample period decline, always
ending with the 2017 data.
67 Again, the pattern in the estimates is obvious – including the older data has the
effect of materially reducing the equity beta estimates. This evidence is consistent
with the notion that the relationship between the domestic comparator stock
returns and market returns has become stronger in the years since the Guideline.

24 Frontier Economics | February 2018
Current equity beta estimates
Figure 4: Varying window beta estimates
Source: Datastream, Frontier Economics calculations.
4.3.4 The AER’s 2017 update of Henry’s estimates
68 In its latest Decisions, the AER states that it has updated the empirical estimates
of the equity beta using the methodology employed by Henry (2014) and data up
to 28 April 2017.22 The AER concludes that:23
a. the updated empirical estimates continue to support Henry’s
empirical range of 0.3 to 0.8; and
b. there is insufficient evidence to depart from the AER’s estimated
beta range of 0.4 to 0.7, or its point estimate of 0.7.
22 AER Staff Beta Analysis June 2017, published 7 February 2018.
23 TransGrid Draft Decision, 2017, Attachment 3, p. 63-4.

February 2018 | Frontier Economics 25
Current equity beta estimates
69 Section 6 explains why we consider the AER has drawn incorrect conclusions from
its updated analysis.
70 In essence, the AER’s updated beta analysis continues to include five delisted
comparators; at the time the AER completed its 2017 analysis, only four of the
nine comparators used in the Henry (2014) study remained listed.
71 The problem with including delisted comparators in the sample is that the beta
estimates of such firms at the time of delisting become determinative at whatever
the estimate happened to be at that time. In other words, because no information
on the returns of those comparators is available beyond the date of delisting, the
beta estimate at the time of delisting becomes permanently ‘frozen’ in time. As
such, delisted comparators provide no information about how beta estimates may
have changed since the date of delisting. Yet, the AER continues to use estimates
from firms that have in most cases been delisted for several years (more than a
decade in two instances) to derive a current estimate of the beta of Australian energy
networks.
72 We show in the Attachment that the beta estimates of all of the comparators that
remained listed at the time the AER completed its updated beta study have
increased since 2014. This supports the findings in this report that the beta of
Australian energy networks has increased recently.
4.3.5 Conclusions in relation to domestic energy network
comparators
73 The evidence set out above supports the conclusion that the equity beta estimates
for the AER’s preferred four domestic comparator firms have increased since the
2013 Rate of Return Guideline. Thus, the AER’s starting point, or “best statistical
estimate” of beta must now be at least what it was at the time of the Guideline.
4.3.6 Evidence from other domestic network utility firms
74 Currently, only three of the nine domestic energy network comparator firms
considered by the AER remain listed, following DUET’s delisting in May 2017. In
our view, it is not possible to derive statistically-reliable beta estimates using just
three comparator firms. Therefore, in order to obtain statistically-reliable beta
estimates, it is necessary to expand the sample of comparators. A natural way to
do this would be to include in the sample energy network comparator firms listed
overseas. Whilst the AER has some regard to such firms when determining its final
equity beta point estimate, the AER considers that such firms should not be used
to estimate primary equity beta range or the best empirical estimate of beta.
Therefore, the only remaining way to improve the statistical reliability of beta
estimates is to consider empirical estimates from listed domestic non-energy
networks.
26 Frontier Economics | February 2018
Current equity beta estimates
75 Consequently, we examine the beta estimates of a set of firms that are comparable
to an energy distribution business. Specifically, we consider a set of firms that
demonstrate the characteristics of:
a. Ownership of very long-lived, tangible, infrastructure assets;
b. Capital intensive businesses;
c. Provision of an access service to customers that provides a
relatively stable series of cash flows;
d. Being listed on the ASX.
76 This leads us to consider a set of transport-related infrastructure firms identified
as such by the Thomson-Reuters classification scheme. A brief summary of the
operations of each of the relevant firms is presented in section 7 of this report.
77 For the avoidance of doubt, we do not claim that these domestic transport
infrastructure firms are perfect comparators to energy networks regulated by the
AER. However, they share a number of important characteristics with energy
networks (outlined above) that are likely to contribute towards the systematic risk
of those firms. Therefore, in our view, they are useful in informing the estimate of
the equity beta of Australian energy network businesses.
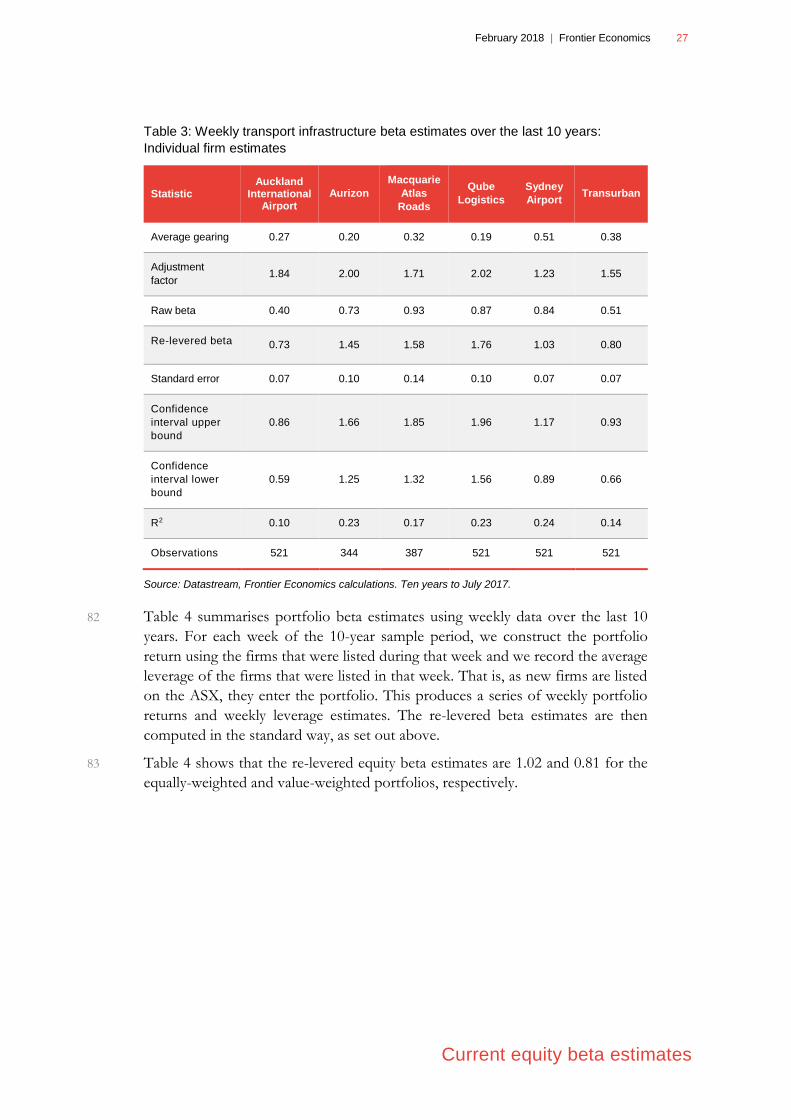
78 Table 3 documents the re-levered equity beta estimates for the set of transport
infrastructure firms using weekly data over the last 10 years. For those firms that
have not been listed on the ASX for the full 10-year period, estimates are based on
the life of those firms.
79 Table 3 shows that the re-levered equity beta estimates range from 0.73 to 1.76,
with a mean of 1.23.
80 We have also computed estimates based on different estimation periods and using
monthly rather than weekly observations and summarise the results as follows:
a. The mean estimate based on weekly data over the last 5 years is
1.15;
b. The mean estimate based on monthly data over the last 5 years is
1.22; and
c. The mean estimate based on monthly data over the last 10 years is
1.30.
81 In summary, however the estimates are computed for this set of unregulated
infrastructure firms, the result is a mean point estimate materially above the AER’s
current equity beta allowance of 0.7.
February 2018 | Frontier Economics 27
Current equity beta estimates
Table 3: Weekly transport infrastructure beta estimates over the last 10 years:
Individual firm estimates
Statistic Auckland
International Airport
Aurizon
Macquarie
Atlas
Roads
Qube
Logistics
Sydney
Airport Transurban
Average gearing 0.27 0.20 0.32 0.19 0.51 0.38
Adjustment
factor 1.84 2.00 1.71 2.02 1.23 1.55
Raw beta 0.40 0.73 0.93 0.87 0.84 0.51
Re-levered beta 0.73 1.45 1.58 1.76 1.03 0.80
Standard error 0.07 0.10 0.14 0.10 0.07 0.07
Confidence
interval upper
bound
0.86 1.66 1.85 1.96 1.17 0.93
Confidence
interval lower
bound
0.59 1.25 1.32 1.56 0.89 0.66
R2 0.10 0.23 0.17 0.23 0.24 0.14
Observations 521 344 387 521 521 521
Source: Datastream, Frontier Economics calculations. Ten years to July 2017.
82 Table 4 summarises portfolio beta estimates using weekly data over the last 10
years. For each week of the 10-year sample period, we construct the portfolio
return using the firms that were listed during that week and we record the average
leverage of the firms that were listed in that week. That is, as new firms are listed
on the ASX, they enter the portfolio. This produces a series of weekly portfolio
returns and weekly leverage estimates. The re-levered beta estimates are then
computed in the standard way, as set out above.
83 Table 4 shows that the re-levered equity beta estimates are 1.02 and 0.81 for the
equally-weighted and value-weighted portfolios, respectively.

28 Frontier Economics | February 2018
Current equity beta estimates
Table 4: Weekly transport infrastructure beta estimates over the last 10 years:
Portfolio estimates
Statistic Equally- Weighted Value- Weighted
Average gearing 0.32 0.35
Adjustment factor 1.70 1.62
Raw beta 0.60 0.50
Re-levered beta 1.02 0.81
Standard error 0.05 0.06
Confidence interval upper bound 0.92 0.68
Confidence interval lower bound 1.13 0.94
R2 0.31 0.16
Observations 521 521
Source: Datastream, Frontier Economics calculations. Ten years to July 2017.
84 We have repeated this exercise using monthly data and report similar re-levered
equity beta estimates of 1.01 and 0.70, respectively.
85 The conclusion from this analysis of unregulated infrastructure firms is that the re-
levered equity beta estimates are all materially above the AER’s current starting-
point “best statistical” equity beta estimate. Thus, if this evidence were to be
afforded any weight, the result would be an increase in the equity beta allowance.

February 2018 | Frontier Economics 29
Declaration
5 Declaration
86 I confirm that I have made all the inquiries that I believe are desirable and appropriate and
no matters of significance that I regard as relevant have, to my knowledge, been withheld from the
Court.
____________________________ Professor Stephen Gray

30 Frontier Economics | February 2018
Appendix: Comment on the AER’s 2017
beta analysis
6 Appendix: Comment on the AER’s 2017 beta
analysis
87 In the Guideline, the AER concludes on the basis of the Henry (2014) empirical
analysis that an appropriate range for the equity beta is 0.4 to 0.7. That study used
data for a set of Australian energy network comparators up to 28 June 2013.
88 In its latest Decisions, the AER states that it has updated the empirical estimates
of the equity beta using the methodology employed by Henry (2014) and data up
to 28 April 2017. The AER published this study in February 2018.24 The AER
concludes that:25
a. the updated empirical estimates continue to support Henry’s
empirical range of 0.3 to 0.8; and
b. there is insufficient evidence to depart from the AER’s estimated
beta range of 0.4 to 0.7, or its point estimate of 0.7.
89 In this section we comment on the AER’s conclusion (which differs from our own)
that there is insufficient evidence to suggest that the beta of Australian energy
networks has increased since Henry (2014).
90 It appears to us that the main reason the AER concludes that there is insufficient
evidence that the beta of Australian energy networks has increased is because in its
2017 beta study, the AER relies on several comparators that have been delisted
many years. This can be seen in Table 5 below, which reports the full range of the
time series (for each individual firm) used in the AER’s 2017 beta study.
91 The Table shows that, at the time of completion of the AER’s 2017 beta study:
a. Only four (APA, DUE, SKI and AST) of the original nine
comparators used in Henry (2014) remained listed;
b. Two comparators (AGL and GAS) used in Henry (2014) had been
delisted for over a decade; and
c. Five comparators (AAN, AGL, ENV, GAS and HDF) used in
Henry (2014) had been delisted for more than two years.
24 AER Staff Beta Analysis June 2017, published 7 February 2018.
25 TransGrid Draft Decision, 2017, Attachment 3, p. 63-4.

February 2018 | Frontier Economics 31
Appendix: Comment on the AER’s 2017
beta analysis
Table 5: Availability of data used in AER’s 2017 beta study
Comparator Starting date Ending date
Listed at the time
of AER 2017 beta
study?
Alinta (AAN) 20/10/2000 17/08/2007 No
Australian Gas Light
(AGL) 29/05/1992 06/10/2006 No
APA Group (APA) 16/06/2000 28/04/2017 Yes
DUET Group (DUE) 13/08/2004 28/04/2017 Yes
Envestra (ENV) 29/08/1997 12/09/2014 No
GasNet Australia (GAS) 21/12/2001 10/11/2006 No
Hastings Diversified Fund
(HDF) 17/12/2004 23/11/2012 No
Spark Infrastructure (SKI) 02/03/2007 28/04/2017 Yes
SP AusNet (AST) 16/12/2005 28/04/2017 Yes
Source: AER 2017 beta study, Table 3, p. 15.
92 The problem with including delisted comparators in the sample is that the beta
estimates of such firms at the time of delisting become determinative at whatever
the estimate happened to be at that time. In other words, because no information
on the returns of those comparators is available beyond the date of delisting, the
beta estimate at the time of delisting becomes permanently ‘frozen’ in time. As
such, delisted comparators provide no information about how beta estimates may
have changed since the date of delisting.
93 However, a comparison of the individual beta estimates for the four comparators
that remain listed at the time of the AER’s 2017 beta study with the beta estimates
for the same firms in Henry (2014) shows that in every instance the beta estimates
have increased. This can be seen in Figure 5 below, which plots the re-levered OLS
and LAD estimates for APA, DUE, SKI and AST, as reported in the AER’s 2017
beta study and in Henry (2014).
94 Figure 6 shows that the average beta estimate across the four surviving
comparators has increased between Henry (2014) and the AER’s 2017 beta study.

32 Frontier Economics | February 2018
Appendix: Comment on the AER’s 2017
beta analysis
Figure 5: Comparison of 2014 and 2017 individual beta estimates (re-levered) for
comparators that remain listed at the time of the AER’s 2017 beta study
Source: Henry (2014), AER 2017 beta study
0
0.1
0.2
0.3
0.4
0.5
0.6
0.7
0.8
0.9
1
Henry 2014 AER 2017 Henry 2014 AER 2017 Henry 2014 AER 2017
Longest - weekly From 2002, exclude GFC Last five years
Ordinary Least Squares estimates
APA DUE SKI AST
00.10.20.30.40.50.60.70.80.9
1
Henry 2014 AER 2017 Henry 2014 AER 2017 Henry 2014 AER 2017
Longest - weekly From 2002, exclude GFC Last five years
Least Absolute Deviations estimates
APA DUE SKI AST

February 2018 | Frontier Economics 33
Appendix: Comment on the AER’s 2017
beta analysis
Figure 6: Comparison of 2014 and 2017 average beta estimates (re-levered) across
comparators that remain listed at the time of the AER’s 2017 beta study
Source: Henry (2014), AER 2017 beta study
95 Finally, Figure 7 shows that the beta estimates for a portfolio constructed using
only the four comparators that remained listed at the time of the AER’s 2017 beta
study (referred to by the AER as ‘portfolio 6’) have increased since 2014.26
26 Since Henry (2014) did not derive estimates for portfolio 6, we have derived the 2014 estimates reported in
Figure 7 using data up to 28 June 2013 and the methodology described in the AER’s 2017 beta study.
We were unable to replicate the 2017 estimates derived by the AER (using Bloomberg data and the
methodology described in the AER’s 2017 beta study). However, our estimates and those reported in
the AER’s 2017 beta study differ only slightly. In order to ensure as much comparability as possible,
the estimates presented in Figure 7 were derived by Frontier Economics using consistent methodology
and the same dataset (albeit for different time periods). The measure of gearing for SKI used in the
0
0.1
0.2
0.3
0.4
0.5
0.6
0.7
Henry 2014 AER 2017 Henry 2014 AER 2017 Henry 2014 AER 2017
Longest - weekly From 2002, exclude GFC Last five years
Ordinary Least Squares estimates
0
0.1
0.2
0.3
0.4
0.5
0.6
0.7
Henry 2014 AER 2017 Henry 2014 AER 2017 Henry 2014 AER 2017
Longest - weekly From 2002, exclude GFC Last five years
Least Absolute Deviations estimates

34 Frontier Economics | February 2018
Appendix: Comment on the AER’s 2017
beta analysis
Figure 7: Comparison of 2014 and 2017 portfolio estimates (OLS, re-levered)
constructed using comparators that remain listed at the time of the AER’s 2017 beta
study
Source: Frontier analysis
96 The analysis above shows that the most recent estimates derived using only those
firms that remain listed — and that therefore provide current information on how
AER’s 2017 beta study made use of data obtained from annual reports. We have made no adjustments
for data from annual reports; the data used in our analysis were obtained from Bloomberg. Finally,
we note that whilst Henry (2014) adopted a net debt approach, the AER’s 2017 beta study adopted a
total debt approach. For comparability with the AER’s results, we have adopted the AER’s net debt
approach.
February 2018 | Frontier Economics 35
Appendix: Comment on the AER’s 2017
beta analysis
the beta of Australian energy networks may have evolved since Henry (2014) —
have increased.
97 The only way to conclude that the beta of Australian energy networks has not
increased since Henry (2014) is by giving material weight to beta estimates derived
using stocks that have been delisted for many years (in some cases more than a
decade), and therefore have no ability to inform on how the beta of Australian
energy networks may have changed recently.
98 For the avoidance of doubt, we are not arguing that statistically reliable beta
estimates can be derived using a sample of only four listed comparators.
99 Our fundamental point is that:
a. The AER has some evidence that the beta of Australian energy
networks has increased since 2014; but
b. This evidence is muted and masked by the inclusion in the AER’s
sample of delisted comparators that are capable of providing no
information on how the beta of Australian energy networks has
changed since 2014.

36 Frontier Economics | February 2018
Appendix: Transport comparator firms
7 Appendix: Transport comparator firms
100 In this appendix we provide a short explanation of what each of the firms in the
transport utility portfolios does. These explanations are taken directly from
Thompson Reuters.
7.1.1 Auckland International Airport Limited (AIA)
101 Auckland International Airport Limited provides airport facilities and supporting
infrastructure in Auckland, New Zealand. Whilst AIA is a New Zealand firm, it is
listed on the ASX. The Company operates in three segments: Aeronautical, Retail
and Property. The aeronautical business provides services that facilitate the
movement of aircraft, passengers and cargo, and provides utility services that
support the airport. The aeronautical business also earns rental revenue from space
leased in facilities, such as terminals. The retail business provides services to the
retailers within the terminals and provides car parking facilities for airport staff,
visitors and passengers. The property business earns rental revenue from space
leased on airport land outside the terminals, including cargo buildings, hangars and
standalone investment properties. Its subsidiaries include Auckland Airport
Limited, Auckland Airport Holdings Limited and Auckland Airport Holdings (No.
2) Limited.
7.1.2 Aurizon Holdings Limited (AZJ)
102 Aurizon Holdings Limited is engaged in rail-based transport business. The
Company acts as a heavy haul freight railway operator and rail transporter of coal
from mine to port for export markets, and also engages in bulk general and
containerized freight businesses and rail services activities. Its segments include
Network, Commercial & Marketing, Operations and Other. The Network segment
provides access to, operation and management of the Central Queensland Coal
Rail Network. The Network segment is also engaged in the provision of overhaul
and maintenance of rail network assets. The Commercial & Marketing segment is
responsible for commercial negotiation of sales contracts and customer
relationship management. The Operations segment is responsible for the national
delivery of coal, iron ore, bulk and intermodal haulage services. It also includes
yard operations, fleet maintenance, operations, engineering and technology,
engineering program delivery and safety, health and environment.
7.1.3 Macquarie Atlas Roads Group (MQA)
103 Macquarie Atlas Roads Group is an Australia-based global infrastructure developer
and operator. The Company comprises Macquarie Atlas Roads Limited and
Macquarie Atlas Roads International Limited. Its portfolio assets have interests in
five international toll roads, including Autoroutes Paris-Rhin-Rhone (APRR),
which is a toll road network located in the east of France and covers over 2,320
February 2018 | Frontier Economics 37
Appendix: Transport comparator firms
kilometres of motorway network; Dulles Greenway, which is a toll road located in
northern Virginia, the United States, and covers over 20 kilometres toll road which
forms part of a commuter route into Washington District of Columbia; Warnow
Tunnel, which is a toll tunnel located in Rostock, Germany, and covers over two
kilometres toll road and tunnel under the Warnow River in the northern German
city of Rostock, and M6 Toll, which is a toll road located in the West Midlands,
United Kingdom, and covers over 43 approximately tolled motorway in the West
Midlands of the United Kingdom.
7.1.4 Qube Holdings Limited (QUB)
104 Qube Holdings Limited is an Australia-based logistics and infrastructure company.
The principal activities of the Company consist of logistics solutions across various
aspects of the import-export supply chain, and the management and development
of strategic properties into inland rail terminals, bulk terminals and related logistics
facilities. Its segments include Logistics, which provides a range of services relating
to the import and export of containerized cargo; Ports & Bulk, which consists of
port and bulk logistics wherein port logistics activities are focused on the provision
of an integrated logistics solution for the automotive industry, and bulk logistics
activities are aimed at offering customers a logistics solution from mine-to-ship
covering various activities, such as transport, stockpile management, ship loading
facilities and stevedoring; Strategic Assets, which consists of the Company's
interests in the Moorebank Industrial Property Trust, and Corporate and Other.
7.1.5 Sydney Airport (SYD)
105 Sydney Airport Holdings Limited the ownership of Sydney Airport. The
Company’s investment policy is to invest funds in accordance with the provisions
of the governing documents of the individual entities within the Company. The
Company is consists of Sydney Airport Limited (SAL) and Sydney Airport Trust 1
(SAT1).The Trust Company (Sydney Airport) Limited (TCSAL) is the responsible
entity of SAT1.
7.1.6 Transurban Group (TCL)
106 Transurban Group is engaged in the development, financing, operation and
maintenance of toll roads networks, as well as management of the associated
customer and client relationships. The Company's segments include Victoria
(VIC), New South Wales (NSW), Queensland (QLD) and the Greater Washington
Area (GWA). Its VIC segment's operations include CityLink operations and
development of CityLink Tulla Widening and Western Distributor. Its NSW
segment's operations include GLIDe tolling system and the development of
NorthConnex. Its QLD segment's operations include AirportlinkM7 and the
development of Inner City Bypass (ICB), Gateway Upgrade North and Logan
Enhancement Project. Its GWA segment's operations include 95 Express Lanes

38 Frontier Economics | February 2018
Appendix: Transport comparator firms
and the development of I-66, I-395 and Southern Extensions to 95 Express Lanes.
The Company manages and develops urban toll road networks in Australia and the
United States. Its subsidiaries include Transurban Holdings Limited and
Transurban Holdings Trust.

February 2018 | Frontier Economics 39
Appendix: Instructions
8 Appendix: Instructions


40 Frontier Economics | February 2018
Appendix: Curriculum Vitae of Professor
Stephen Gray
9 Appendix: Curriculum Vitae of Professor
Stephen Gray
Stephen Gray is Professor of Finance at the University of Queensland Business
School and Chairman of Frontier Economics (Australia). He has Honours degrees
in Commerce and Law from the University of Queensland and a PhD in financial
economics from the Graduate School of Business at Stanford University.
In his university role, he teaches a range of award and executive education courses
in financial management, asset valuation, and corporate finance. He has received
a number of teaching awards, including a national award for university teaching in
the field of business and economics. He has published widely in highly-ranked
journals and has received a number of manuscript awards, most notably at the
Journal of Financial Economics.
Stephen is also an active consultant to industry on issues relating to valuation, cost
of capital, and corporate financial strategy. He has acted as a consultant to many
of Australia’s leading companies, government-owned corporations, and regulatory
bodies. His clients include the Independent Pricing and Regulatory Tribunal
(IPART), Australian Competition and Consumer Commission (ACCC),
Melbourne Water, Qantas, Telstra, Origin Energy, AGL, Foxtel, ENERGEX,
Queensland Treasury Corporation, Rio Tinto Alcan and the Australian Securities
and Investments Commission (ASIC). Projects include corporate cost of capital
reviews, asset valuation, independent valuation of executive stock options, and the
assessment of capital structure and financing strategies.
He has also appeared as an independent expert in several court proceedings relating
to the valuation of assets and businesses and the quantification of damages.
Key experience
Cost of capital
Energy sector
TransGrid (2015) – Advised the electricity transmission operator in NSW on
the appropriateness of the Australian Energy Regulator’s (AER’s) proposed
transitional arrangements before the full introduction of a trailing average
approach to setting the cost of debt allowance for regulated networks. The
AER recently revised its rate of return methodology. In doing so, the AER
announced that it would adopt a trailing average approach to setting cost of
debt allowances (similar to the approach used by Ofgem in Great Britain).
However, the AER argued that it should phase this approach in to allow
businesses sufficient time to align their debt management practices to the new

February 2018 | Frontier Economics 41
Key experience
methodology. Frontier prepared a report on behalf of TransGrid explaining
the circumstances in which such transitional arrangements would not be
appropriate.
Australian Energy Markets Commission (AEMC) (2012) – The regulator
(AER) and a group of large energy users (EURCC) proposed changes to the
National Electricity Rules and National Gas Rules (Rules). The AEMC, which
is the government agency that is responsible for maintaining the Rules,
conducted a year-long review and consultation process in relation to the
proposed rule changes. Stephen was appointed to advise the AEMC on rate
of return issues. His role involved the provision of advice to the AEMC
secretariat and board, the preparation of a number of public reports, the co-
ordination and chairing of public hearings, and a series of one-on-one
meetings with key stakeholders. The process resulted in material changes
being made to the Rules, with revised Rules being published in November
2012.
Energy Networks Association (2013) – The National Electricity Rules and
National Gas Rules (Rules) require the regulator to publish a series of
regulatory guidelines every three years. The Australian Energy Regulator
(AER) conducted a year-long process in 2013 that ended with the publication
of its first Rate of Return Guideline. Throughout this process, Stephen
advised the Energy Networks Association (ENA) on rate of return issues.
This involved working with the ENA’s Regulatory Affairs Committee,
specialist working groups, and legal advisors, preparing expert reports,
drafting submissions, and representing the ENA at stakeholder forums.
TransGrid (2013) Return on Debt Analysis – The 2012 changes to the
National Electricity Rules included, inter alia, a provision that permitted the
allowed return on debt to be set according to a trailing average approach.
TransGrid sought an analysis of the effect that such a change would have on
the residual cash flows that were available to its shareholders. Stephen
developed a Monte Carlo simulation model that generated many scenarios for
the possible future evolution of interest rates, incorporating empirical
relationships between government bond yields, credit spreads, and inflation.
His analysis quantified the extent to which the trailing average approach would
better match the actual cost of servicing debt under TransGrid’s longstanding
debt management approach, thereby reducing the volatility of the cash flow
to equity holders.

42 Frontier Economics | February 2018
Key experience
Aurizon Network (2014) Split Cost of Capital Analysis – In a discussion
paper, the Queensland Competition Authority advocated consideration of a
split cost of capital regulatory approach. Under the proposed approach the
regulator would allow a standard “debt and equity” regulated return on assets
during their construction, but a “100% debt” return once the asset had been
included in the firm’s regulatory asset base. Stephen was retained by Aurizon
(operator of a regulated coal rail network). His role was to prepare an expert
report that considered the economic and financial basis for the proposed
approach, and which considered the likely consequences of such an approach.
After his presentation to the QCA board, the proposal was shelved
indefinitely.
Energy Networks (2014-15) Regulatory Reviews – Stephen has prepared
expert reports and submissions on behalf of all businesses that are in the
current rounds of regulatory resets. These reports cover the whole range of
regulatory cost of capital issues. Clients over the last year include ATCO Gas,
DBP, ActewAGL, TransGrid, Jemena, United Energy, CitiPower, Powercor,
SA Power Networks, Ausgrid, Essential Energy, Endeavour Energy,
ENERGEX, and Ergon Energy.
Legal and Appeal Work – Stephen has assisted a number of regulated
business, and their legal teams, through merits review and appeal processes.
One example is the 2011 Gamma case in the Australian Competition Tribunal.
That case involved the “gamma” parameter, which quantifies the impact that
dividend imputation tax credits have on the cost of capital. The regulator
(AER) proposed an estimate that was based on (a) an assumption that was
inconsistent with the observed empirical evidence, and (b) a point estimate
that was based partly on a paper with questionable reliability and partly on
data that was irrelevant to the task at hand. Stephen’s role was to prepare a
series of expert reports, to assist the legal team to understand the issues in
detail, and to attend the hearings to advise as the matter was heard. The end
result was that the Tribunal set aside the entire basis for the AER’s proposed
estimate and directed us to perform a “state of the art” empirical study.
Stephen performed the required study and its results were accepted in full by
the Tribunal, who set the estimate of gamma on the basis of it.
Water sector
Melbourne Water (2015) – In preparation for the 2016 Victorian price review,
Stephen is part of the Frontier team currently advising Melbourne Water on
ways in which the rate of return methodology used by the Victorian regulator,
February 2018 | Frontier Economics 43
Key experience
the Essential Services Commission (ESC), could be improved, and the likely
revenue impact of any methodological changes. At the last (i.e. 2013) price
reset, the ESC indicated that it intended to review its rate of return
methodology but to date has not done so. By comparison, most other major
Australian regulators have revised their methodologies significantly, in part due
to recognition of the need to make their estimation approaches more resilient
to the effects of global financial crises. A comparison of the methodologies
used by different regulators in Australia suggests that the ESC’s methodology
is out of line with best regulatory practice. Frontier’s advice has focused on
identifying the areas for improvement, and the development of the economic
arguments that would support the case for change.
Unity Water, SEQ Water, Gladstone Area Water Board (2013-14) –
Stephen has prepared a series of reports for a number of Queensland water
utilities. These reports include (a) a response to the QCA’s (Queensland
regulator) proposed split cost of capital approach (which has now been shelved
indefinitely), and (b) a response to the QCA’s proposed cost of capital
estimates.
Telecommunications sector
NBN Co (2012-13) – Stephen advised NBN Co on a range of cost of capital
issues in relation to their proposed special access undertaking. This work
included the drafting of expert reports, meetings with and presentations to
various NBN Co committees and working groups, and representing NBN Co
in discussions with the regulator (ACCC). Key issues included the length of
the proposed access arrangement, the extent to which higher risk during the
construction and proof-of-concept phases justified a higher allowed return,
and the process by which early year losses might be capitalized into the
regulatory asset base.
C7 Case (2006-07), Federal Court of Australia
The Seven Network brought an action against a number of Australian media
and entertainment firms in relation to the abandonment of its cable TV
business, C7. Seven alleged that the respondents colluded to prevent C7 from
securing the rights to broadcast AFL and NRL matches and that this
prevented its C7 business from being economically viable.
Stephen was retained by a group of respondents including PBL, Telstra, and
News Corporation. His role was to address various matters relating the
quantification of damages. He prepared several reports, was involved in
several discussions with other valuation expert witnesses, and was cross
examined in the Federal Court.

44 Frontier Economics | February 2018
Key experience
The Court found in favour of the respondents.
Transport sector
CBH Group (2015) – Stephen was part of the Frontier team that developed,
on behalf of CBH (a major Australian grain producer and access seeker to rail
infrastructure in Western Australia) and its legal counsel, a submission to the
Economic Regulation Authority (ERA) of Western Australia on the
regulator’s approach to estimating WACC. The submission focused on,
amongst other issues, the ERA’s approach to estimating the market risk
premium, the estimation approach to beta, and the way in which the WACC
ought to be used within the negotiate-arbitrate arrangements within the rail
access regime.
Brockman Mining Australia (2015) – Stephen was part of the Frontier team
that advised Brockman, a potential access seeker to rail infrastructure in
Western Australia, on its submission to the Economic Regulation Authority
(ERA) of Western Australia in relation to the ERA’s approach to WACC
under the Railways (Access) Code 2000. Subsequently, the ERA released a
Revised Draft Decision on its proposed WACC methodology. Frontier was
engaged again by Brockman to help develop its submission to the ERA on the
Revised Draft Decision. The submissions focused on the appropriateness of
the beta estimates proposed by the ERA, the methodology used to estimate
the market risk premium (and consistency between the methodologies used
by the ERA in different sectors), the appropriateness of the ERA’s credit
rating assumption for the benchmark efficient entity (which affects the cost
of debt allowance under the ERA’s methodology).
Brookfield Rail (2014) – The WA Railways (Access) Code requires railway
operators to provide certain information to access seekers to enable them to
compute “floor” and “ceiling” prices as defined in the Code. Brookfield
provided access seekers with certain information and other relevant
information was available from public sources. Stephen prepared an expert
report that considered whether the information available to an access seeker,
together with specialist assistance from relevant experts, would be sufficient
to compute floor and ceiling prices.
Brisbane Airport Corporation (2013-14) – Stephen was engaged by
Brisbane Airport Corporation (BAC) to advise on a range of regulatory and
cost of capital issues in relation to the development of the airport’s new
parallel runway (NPR). BAC identified the need for an additional runway to
accommodate steadily increasing demand. The development of a new runway
required a large capital commitment ($1.5 billion) and would take

February 2018 | Frontier Economics 45
Key experience
approximately eight years to complete. BAC proposed that the airlines would
contribute to the financing of the NPR during construction – the alternative
being the capitalisation of a return on capital expenditure until completion and
a sharp spike in landing fees when the NPR become operational. One of the
key issues in the negotiations with airlines was the WACC that would be used
to determine the return on capital. Stephen’s role was twofold. He produced
an expert report providing a strong basis for BAC’s proposed WACC. He
also advised BAC on the likely approach of the ACCC (the regulator in
question) should they become involved – the regulatory arrangements provide
for the parties to negotiate a commercial outcome and for the regulator to
become involved if they are unable to do so. BAC was successful in their
negotiations with the relevant airlines and the NPR is now under
construction.
Abbott Point Coal Terminal (2014) – Stephen was engaged by a consortium
of mining companies in relation to arbitration with Adani, the owner and
operator of the Abbott Point Coal Terminal. The parties had in place a user
agreement that was similar to a regulatory-style building block model. Stephen
advised on a range of cost of capital and other issues including detailed reports
on the cost of debt and the level of corporate costs.
Financial litigation support
APLNG (2014-15)
The Australia-Pacific LNG (APLNG) project is a joint venture between
Origin Energy, ConocoPhillips and Sinopec that involves the extraction of
coal seam methane and processing into liquefied natural gas (LNG) for export.
The relevant Queensland royalties legislation provides that a 10% royalty is to
be levied on the value of the gas at the first point of disposal. Since the project
is integrated from end-to-end, there is no arm’s length price at the relevant
point. Stephen was retained by APLNG to prepare an expert report on the
process for determining what the arm’s length price at the first point of
disposal would be if such a thing existed. This involves estimating the costs,
including a fair return on capital, for a hypothetical upstream gas producer
and a hypothetical downstream LNG operator, and allocating any excess
profit between the parties.
CDO Case (2013)
This case involved a class action against the Australian distributor of
collateralised debt obligations (CDOs) and the international credit ratings
agency that assigned credit ratings to them. The CDOs in question were
financial products with a payoff that depended on the number of defaults (or

46 Frontier Economics | February 2018
Key experience
“credit events”) among a reference set of 150 different corporate bonds issued
by companies in different industries and different geographical locations. A
typical CDO structure would involve the investor being repaid all of their
initial investment plus an attractive rate of interest so long as there were less
than say 7 defaults out of the reference set of 150 bonds during the five-year
life of the CDO. However, if there were say 11 or more defaults, the investor
would lose their entire investment. If the number of defaults was between 7
and 11, the return to the investor would be proportional (e.g., 8 defaults would
involve a 25% loss of principal).
The CDOs in question were created by US investment banks and were
distributed in Australia by a large Australian commercial bank. One of the key
issues in the case was whether the Australian distributor made proper
disclosures about risk to investors, which included individuals, self-managed
superannuation funds, and local councils. The CDOs in question were
assigned strong investment grade credit ratings by an international ratings
agency. The process used to assign those ratings did not properly take into
account the correlation between defaults – the empirical fact that during
recessions and financial crises many bonds default at the same time.
Stephen’s role was to prepare an expert report that explained to the Court
how CDOs were structured, how they operated, and what risks were involved.
His report also examined the risk disclosures that were contained in the
materials that were provided to potential investors and the process by which
the credit rating agency assigned ratings.
Wright Prospecting litigation (2012-14)
Wright Prospecting Pty Ltd (WPPL) is involved in several legal disputes about
the payment of royalty streams in relation to iron ore and coal mining
operations. WPPL had assigned various rights and licenses in relation to iron
ore mines in WA and coal mines in Queensland to other parties, in return for
royalties on the revenues received from the sale of the ore. Stephen’s role was
to prepare a series of expert reports quantifying the present value of the royalty
streams.
Public Trustee of QLD v. Octaviar Ltd (2009), Supreme Court of
Queensland
The Octaviar Group (formerly the MFS Group) is a Gold Coast based group
of listed companies with funds management and leisure services businesses.

February 2018 | Frontier Economics 47
Key experience
Octaviar was unable to refinance a loan in early 2008 and sought to raise equity
via a rights issue as part of a substantial corporate restructure. The stock price
fell some 70% on this announcement and Octaviar subsequently sold a 65%
interest in its leisure business known as Stella. Octaviar then sought to make
arrangements with its creditors, including the Public Trustee, as trustee for
note holders.
Stephen was retained by the Public Trustee. His role was to prepare several
reports on (a) whether the companies in the Octaviar Group were insolvent,
(b) the date the companies became insolvent, and (c) whether the note holders
would be made better or worse off by the proposed arrangement, relative to
a liquidation. He was cross examined by four parties with an interest in these
proceedings on issues relating to the date of the insolvency.
Telstra v. ACCC (2008), Federal Court of Australia
Telstra brought an action against the ACCC in relation to access charges that
Telstra was allowed to charge its retail competitors for access to its fixed line
and broadband networks – arguing that the return on capital allowed by the
ACCC was unreasonably low.
Stephen was retained by Telstra. His role was to prepare several reports on
the issue of whether the ACCC has been inconsistent in its application of
valuation methods – in a way that reduced Telstra’s allowed return. He was
also involved in several discussions with other valuation expert witnesses,
prepared a joint statement of experts, and was cross examined in the Federal
Court individually and in a “hot tub” setting.
Alcan Northern Territory Alumina Pty Ltd v. Commissioner of Taxes
(2006-07), Supreme Court of Northern Territory
First Engagement: Consulting Expert
Alcan bought out the equity of its joint venture partner in a combined bauxite
mine and alumina refinery in the Northern Territory. The NT Revenue
Authority claimed that the transaction was caught by the NT “land rich”
provision, under which the transaction would be subject to stamp duty if more
than 60% of the consideration was attributable to land assets.
The key economic issue is the apportionment of value between the mine
(predominately land assets) and the refinery (substantially intangible assets
arising out of intellectual property and expertise).

48 Frontier Economics | February 2018
Key experience
Stephen was retained by Alcan as consulting experts. Their role was to
prepare a range of financial models and analysis to support the view that a
substantial portion of the value of the transaction was attributable to non-land
assets in the refinery. This involved complex financial modelling and market
analysis. A full integrated model was produced, allowing users to select
whether they preferred the appellant’s or respondent’s submission on each
input parameter, and automatically re-calculating the land-rich ratio.
Stephen worked closely with Alcan’s legal team, Counsel, and various
independent experts. Stephen assisted the legal team during the trial and in
preparing sections of final submissions.
Second Engagement: Independent Expert
The initial judgment contained findings about certain matters and was sent
back to the Commissioner for re-assessment. A dispute arose between the
parties about the effect of the judgment. In particular, the value of a primary
10-year lease had to be disaggregated from the value of an option to continue
the project.
Stephen was retained by Alcan to produce an expert valuation report that
addressed the matters in dispute. Two expert reports were prepared and
Stephen was cross-examined on this material. Stephen prepared an easy to
use spreadsheet calculator to assist the Court in testing how different input
assumptions (where the experts could not agree) affected the bottom line.
This was used by His Honour as an aide memoire and was considered to be
particularly helpful in the case in terms of simplifying the effects of a number
of complex matters.
Judgment was in favour of Alcan. Stephen’s evidence was accepted and
endorsed by the Court.
Career: Professional
2014-Present Chair, Frontier Economics
1997-2014 Director, SFG Consulting

February 2018 | Frontier Economics 49
Papers and publications: Cost of capital
Career: Academic
2000 - Present Professor of Finance, UQ Business School, University of Queensland
1997-1999 Associate Professor of Finance, UQ Business School, University of Queensland
1997-2001 Research Associate Professor of Finance, Fuqua School of Business, Duke University
1995-1997 Assistant Professor of Finance, Fuqua School of Business, Duke University
Education 1987 Bachelor of Commerce (Hons), University of Queensland
1989 Bachelor of Laws (Hons), University of Queensland
1995 PhD, Stanford University
Papers and publications: Cost of capital
Gray, S. and J. Nowland, 2015, "The Diversity of Expertise on Corporate
Boards in Australia," Accounting and Finance, forthcoming.
Darat, A., S. Gray, J. C. Park and S. Wu, (2014), “Corporate governance and
bankruptcy risk” Journal of Accounting, Auditing and Finance, forthcoming.
Gray, S., I. Harymawan and J. Nowland, (2014), “Political and government
connections on corporate boards in Australia: Good for business?” Australian
Journal of Management, forthcoming.
Brailsford, T., S. Gray and S. Treepongkaruna, (2013), “Explaining the bid-
ask spread in the foreign exchange market: A test of alternate models,”
Australian Journal of Management, forthcoming.
Faff, R., S. Gray and M. Poulsen, (2013), “Financial inflexibility and the value
premium,” International Review of Finance, forthcoming.
T. Fitzgerald, S. Gray, J. Hall and R. Jeyaraj, (2013), “Unconstrained estimates
of the equity risk premium” Review of Accounting Studies, 18, 560-639.
Feuerherdt, C., S. Gray and J. Hall, (2010), “The Value of Imputation Tax
Credits on Australian Hybrid Securities,” International Review of Finance, 10, 3,
365-401.

50 Frontier Economics | February 2018
Papers and publications: Cost of capital
Gray, S., J. Hall, D. Klease and A. McCrystal, (2009), “Bias, stability and
predictive ability in the measurement of systematic risk,” Accounting Research
Journal, 22, 3, 220-236.
Costello, D., S. Gray, and A. McCrystal, (2008), “The diversification benefits
of Australian equities,” JASSA, 2008, 4, 31-35.
Gray, S. and J. Hall, (2008), “The Relationship Between Franking Credits and
the Market Risk Premium: A Reply,” Accounting and Finance, 48, 1, 133-142.
Gray, S., A. Mirkovic and V. Ragunathan, (2006), “The Determinants of
Credit Ratings: Australian Evidence,” Australian Journal of Management, 31(2),
333-354.
Choy, E., S. Gray and V. Ragunathan, (2006), “The Effect of Credit Rating
Changes on Australian Stock Returns,” Accounting and Finance, 46(5), 755-769.
Gray, S. and J. Hall, (2006), “The Relationship Between Franking Credits and
the Market Risk Premium,” Accounting and Finance, 46(3), 405-428.
Cannavan, D., F. Finn and S. Gray, (2004), “The Value of Dividend
Imputation Tax Credits in Australia,” Journal of Financial Economics, 73, 167-
197.
Dahlquist, M. and S. Gray, (2000), “Regime-Switching and Interest Rates in
the European Monetary System,” Journal of International Economics, 50(2), 399-
419.
Bollen, N., S. Gray and R. Whaley, (2000), “Regime-Switching in Foreign
Exchange Rates: Evidence from Currency Options,” Journal of Econometrics, 94,
239-276.
Bekaert, G. and S. Gray, (1998), “Target Zones and Exchange Rates: An
Empirical Investigation,” Journal of International Economics, 45(1), 1-35.
Gray, S. (1996), “Modeling the Conditional Distribution of Interest Rates as a
Regime- Switching Process,” Journal of Financial Economics, 42, 27-62.
Gray, S. (1996), “Regime-Switching in Australian Interest Rates,” Accounting
and Finance, 36(1), 65-88.


Frontier Economics Pty Ltd in Australia is a member of the Frontier Economics network, and consists of companies based in Australia (Melbourne, Sydney & Brisbane) and Singapore. Our sister company, Frontier Economics Ltd, operates in Europe (Brussels, Cologne, Dublin, London & Madrid). The companies are independently owned, and legal commitments entered into by any one company do not impose any obligations on other companies in the network. All views expressed in this document are the views of Frontier Economics Pty Ltd.
Disclaimer
None of Frontier Economics Pty Ltd (including the directors and employees) make any representation or warranty as to the accuracy or completeness of this report. Nor shall they have any liability (whether arising from negligence or otherwise) for any representations (express or implied) or information contained in, or for any omissions from, the report or any written or oral communications transmitted in the course of the project.

FRONTIER ECONOMICS
BRISBANE | MELBOURNE | SINGAPORE | SYDNEY
Frontier Economics Pty Ltd 395 Collins Street Melbourne Victoria 3000
Tel: +61 (0)3 9620 4488 Fax: +61 (0)3 9620 4499 www.frontier-economics.com.au
ACN: 087 553 124 ABN: 13 087 553 124