an empirical study to understand the factors that influences consumer buying behavior in organized...
TRANSCRIPT
85
An empirical study to Understand the Factors that Influences Consumer Buying Behavior in Organized Housing Projects with Special Reference to Delhi-NCR.
Shamsher Singh and Ameet Sao1
Banarsidas Chandiwala Institute of Professional Studies, Sector 11, Dwarka, New Delhi 110075, India
1RICS School of Built Environment, Block-F2, Fifth Floor, Amity University, Sector -125Noida 201301, (UP) IndiaEmail: [email protected], [email protected]
AbstractIndian housing sector is growing at a very rapid rate. There is a great demand for organized houses. This study takes up the question of buying behavior and the reason for the preference of Housing Projects in a wide context. It tries to identify the existing market structure for the product and the factors influencing the customers to buy Housing projects as well as to analyze the purchase behavior of customers in preferring the choice of a House. To prepare an effective marketing strategy, a company must do competitor analysis, pest analysis, value chain analysis, swot analysis as well as its potential and prospect customer. This is especially necessary in a developing economy because sales can be gained only by winning them away from competitor’s offerings. The marketing activities through sales promotion and social media tactics has increased significantly in promoting sales and preparing the ground for future expansion. The use of social media sites as part of a company’s
ISSN 2348-2869 Print
© 2014 Symbiosis Centre for Management Studies, NOIDA
Journal of General Management Research, Vol. 1, Issue 1, January 2014, pp. 37–50.
JOURNAL OF GENERAL MANAGEMENT RESEARCH
85

86 Journal of General Management Research
marketing strategy has increased significantly in the past couple of years. The study has used the primary data to analyze the significant factors through ANOVA, and Factor analysis which differ across different demographic variables such as age, income, education, occupation, gender & lifestyle.
Keywords: Organized Housing, Marketing Strategy, prospective customer, social media
INTRODUCTIONConsumer behavior is often defined to include the acquisition and use of goods and services by ultimate consumers (Jacoby, 1975, 1976). It is the study ‘of when, why how and where people do or do not buy a product’. Advancement in science and technology has offered man – equipment’s, machineries and apparatus which have made life more comfortable and enjoyable. Television, Washing machines, Refrigerators, Microwave ovens, cell phones, Laptops, modernized houses are some of the innovations which provide comfort, luxury, information, entertainment and lifestyle.
Consumer buying behavior is influenced by various factors. Some of these factors are attitude, personality, values, lifestyle, learning, self-image, perception, brand image, quality, features, price, distance, sales promotion, reference group, awareness, unaware etc. Normally, when a consumer approaches a sales person for purchasing house, the salesman or service provider will show case only the products which are available during that time or they will show the catalogue, brochures
and prospectus. In case, if the customer likes any of the product they enquire in detail and if they are satisfied they look forward to purchase the product.
Gone are the days when a pure-bricks business model would have been thriving in current market scenario. Today the consumer uses internet to acquire information which enables him to compare products before making purchase decision. For example, if there are more than 5 varieties of products available and there are 10 companies who offers the similar products, the consumer does a comparative analysis as per his feasibility to act upon. However, Marketing stimuli act at each stage of the decision making process and become a major factor in consumer buying behavior and satisfaction. The initial problem recognition stage of the decision making process is a result of consumer’s black box (Loudon, 1988) which includes the individuals attitudes, motivation, perceptions, personality, lifestyle and knowledge. Once the consumer recognizes his needs he looks for information from various sources. Foxall (2005) suggested the importance of the post purchase evaluation and that the post purchase evaluation is due to its influence on future purchase patterns.
The Real Estate sector is important to the Indian economy. In terms of employment generation, it is second only to the agricultural sector. The housing sector contributes nearly 5% to India’s GDP. It is expected to rise to 6 per cent in the next five years.(www.customessays.net) Property markets in India are recovering faster than those in the US
87 An empirical study to Understand the Factors that Influences Consumer Buying ...
and the UK. The sector is expected to attract around US$ 12.11 billion of investments in the next five years. Residential space comprises almost 80% of the real estate developed in the country. There is a shortage of 22.4 million dwelling units according to the Tenth Five Year Plan. 80 to 90 million housing units will have to be constructed over the next 10 to 15 years to rectify this, with the majority of them for the middle- and lower-income groups.(www.ukessays.net) It is for this reason that residential properties in India, particularly in Mumbai and Delhi, are viewed as very good investments as per a study by Price Waterhouse Coopers (PWC) and Urban Land Institute, a global non-profit education and research institute.
In the 2009-10 budgets of Government of India , a tax holiday on profits was granted to developers of affordable housing (units of 1,000-1,500 sq ft. This exemption was instituted for projects that started from 2007-08 onwards with a deadline of completion of March 1, 2012. US$ 207 million was also allocated to grant a 1% interest subsidy on home loans up to US$ 20,691 with the caveat that the cost of the home should not be more than US$ 41,382. This was expected to further help the housing sector. An apartment is a residential unit that forms a division of a building. It can be either owned or rented. Some people own their apartments together where each owns a part of the corporation which owns the flat. In condominiums, dwellers own the individual apartments and share the public environment.
NDA government’s first budget has announced a mega project of developing 100 smart cities with modern amenities over the years. The project will be executed in PPP model and the government will contribute as viable gap funding (VGF) for the project. Greenfield projects are new factories, power plants or airports which are built from scratch while facilities which are modified or upgraded are called Brownfield projects. Smart City entails facilities like continuous water supply, modern sewerage system, solid waste management and infrastructure development among other advanced facilities. The total estimate of investment requirements for providing these services is estimated to be around Rs 7.5 lakh crore over 20 years which means it requires Rs 35,000 crore in a year.
Living in apartments is gaining popularity in India. Their allure lies in the convenience that they offer in terms of safety and security and maintenance of utilities like electricity and water. A central maintenance system obviates the need for hiring outside help for minor problems like leaking taps or electric short circuits. Stand-alone homes also require incurring additional costs like buying/leasing land, licensing, duties, etc. Apartments enable maximization of space utilization and reduce demand on public resources. People are also able to avail of additional amenities like gymnasiums, swimming pools, etc. at affordable prices. There is a gap in the literature, with regard to the value drivers that influence purchase decisions of residential property in the country. Similar studies exist for other countries but were found wanting
88 Journal of General Management Research
in the Indian context, especially when it comes to apartments. This paper examine and establish the factors of purchase decision and to what extent. This paper present the new insights in consumer decision making for housing, which will be very useful especially for builders and property developers who can use these findings for preparing their marketing strategy.
India is blessed with one of the fastest growing real-estate markets in the world. It is not only attracting domestic real-estate developers but also the foreign investors; particularly, the NRI investments in India have a bulk of their share in the Indian housing market. Despite the global economic gloom as a result of the sub-prime mortgage debacle and ensuing credit crunch, India’s housing sector remains on course for yet another year of double-digit growth. The growth is attributed mainly to a large population base, rising income level, and rapid urbanization, according to research report, “Indian Housing Sector Analysis”. In view with the ongoing development exhibited by the housing construction industry in India, it is expected that the sector will overtake other industrial sectors in terms of contribution to the GDP growth during the next few years. Presently, affordable housing is basically targeting the economically weaker class and low-income groups and constitutes majority of the Indian housing industry, both in terms of value and volume. Besides, luxury housing is also expected to witness significant growth in the coming years as this market segment is comparatively very small and possesses huge potential for further developments. Further,
FDI in India’s booming real estate and housing market jumped 80 times between 2005 and 2010. Moreover, private equity funds are also venturing into development of housing projects. The fund houses are developing their own projects in order to endow better returns for their investors. Factors including steadily increasing life expectancy, lack of safety and security in urban areas and rising number of financially independent senior citizens have made senior citizens an ideal target customer for niche offerings by housing firms.(www.rncos.com)
Another external dimension in consumer decision making process is information search Rutz & Bucklin (2011) emphasized that in Internet paid search advertising, marketers pay for search engines to serve text advertisements in response to keyword searches that are generic (for example, ‘hotels’) or branded (for example, ‘Hilton Hotels’). The results show that generic search activity positively affects future branded search activity through awareness of relevance. However, branded search does not affect generic search, demonstrating that the spillover is asymmetric. The findings have implications for understanding search behavior on the Internet and the management of paid search advertising. Taylor et al. (2011) presents research on Internet advertising, which examines consumer attitudes towards advertising presented on social media by users of those media. It was found that consumers reacted most favorably to advertising which was perceived as offering entertainment or information value. According to Edelman,
89 An empirical study to Understand the Factors that Influences Consumer Buying ...
(2010) Digital marketers think of themselves as publishers of online content, recognize digital marketing as a means to acquire advocates for their brands and invest in ways such as monitoring consumers to gain knowledge about them in order to provide them with a satisfying sales experience.
This study is aimed at understanding buying behavior and preference of housing projects in a wider context. It tries to identify the existing market structure for the product. This study tries to identify the factors influencing the customers to buy Housing projects and to identify the customers brand preference as well as to analyze the purchase behavior of customers in preferring the choice of a House.
LITERATURE REVIEWSeveral well-known models such as the AIDA model (Strong, 1925) or the frequently cited hierarchy-of-effects model (Lavidge & Steiner, 1961) have been developed that try to explain the consumers’ persuasion process (Grabam & Havlena, 2007; Vakratsas & Ambler, 1999). The AIDA model is one of the first formal advertising models, attributed to E. St. Elmo Lewis in 1898 (Strong, 1925). AIDA is an acronym for Attention, Interest, Desire and Action. Lewis in his model suggest that salespeople have to attract attention, maintain interest and create desire and the resulting action in order to be successful. Some studies show the way in which advertising messages have an effect on consumers’ perception (for example, Baumgartner & Sujan, 1997) or the brand. Numerous studies focus on which
advertising effort works when, for which consumer and under what circumstances (Ansari & Mela, 2003; van Heerde, Helsen, & Dekimpe, 2007).Housing is one of the most basic needs of the human beings, and it indicates the level of economic and social development of societies. Housing is one of the most basic needs of the human beings, and it indicates the level of economic and social development of societies.
Hansen (1959) indicates that for young people, whether married or not, housing costs and tenure are important factors in deciding where to live. People in the childrearing stage trade-off the quality of the residential environment against job accessibility (Kim et al., 2005). Karsten (2007) indicates that housing quality is composed of two major ingredients:(1) the site (accommodation for daily life); and (2) the situation (location) of the neighborhood. Ageing populations have substantial implications for the future of modern societies and there is a growing body of research on these issues (Bo¨rsch-Supan et al., 2009). Policymakers should consider the substantial behavior of consumers and investors before implementing housing programs. Selective programs and subsidies affect both the financial position and the housing conditions of the household, as well as the equilibrium outcome in housing markets (Nordvik, 2006). (Nguyen, 2013; Oikarinen, 2012). Han (2010) found that households with lower income are more elastic to shocks in monthly cost that decreases their affordability of larger types of houses. Turner (2003) suggested that impact of house-price risk is

90 Journal of General Management Research
greater on low- and middle-income families and first-time homeowners than other groups. In this manner, one may speculate that the present housing policy in Turkey is consistent with the previous work. It is well-known that housing policy formulation is strongly associated with the careful understanding of the behavior of the housing market reflected by housing demand (Tiwari, 2000).
The housing collateral constraint gives information and conceives an association between the housing market and borrowing capacity that strengthens the response of housing demand to technology shocks in economies with more liberalized mortgage markets (Nguyen, 2013; Oikarinen, 2012). Han (2010) found that households with lower income are more elastic to shocks in monthly cost that decreases their affordability of larger types of houses. Income distribution has become less equal in most countries that has a significant impact on housing affordability and individuals’ housing standards (Ball and Harloe,2005). The amount of income also depends on several discourses such as rent regulations between individuals within countries and regional variations in house prices (Boelhower et al., 2005).
There is legitimate concern that disparities in the availability of adequate housing will intensify problems of urban poverty, and will widen the gaps of economic and social stratification (Wang 2003). Housing has been recognized as one of the basic needs (along with food and clothing) of a. household. At the macro level, the norm of one dwelling unit per household has been accepted by
the Indian planners.( This norm has been adopted by National Building Organisation in estimating the housing shortage in the country). At the scheme or programme level, the need for housing of a household seems to have been related to the income of the household rather than to its size. Further, the norms have in-variably been defined in terms of size and at times the tenure of the house.
A perusal of various programmes and schemes of the government of India reveals that the norms specified in these schemes are higher for high income groups and vice versa.( In the Low Income Group Housing Scheme of the government of India, the floor area is restricted to a size of 1200 sq feet. For the middle income groups the ceiling was higher at 2000 sq ft. Similar bias is seen in various schemes financed by Housing and Urban Development Corporation (HUDCO). The maximum permitted plinth area varies from 35 sq mt to 185 sq mt for household belonging to different income groups. A common feature of norms for all income groups is a ‘pucca’ structure and secure tenure. In case of the lowest income groups housing was provided mainly on rental basis whereas for other, ownership-supposedly a superior tenure-was prescribed.)
The key linkage among the different factors is that economic growth induces migration (both immigration and internal migration) to supply required labor force (Kuznets and Rubin 1954; Thomas [1954] 1973). That in turn creates demand for new housing construction
91 An empirical study to Understand the Factors that Influences Consumer Buying ...
Chris Leinberger (2008) has inferred that new slums will form in the suburbs where large quantities of less desirable, larger, and less accessible homes are located
Objectives Of The Study
To study the factors influencing consumer buying behavior in housing projects.
To identify the customers brand preferences towards purchasing housing projects.
To find out the roles of various demographic factors in buying habits of consumers.
To examine the role of social media in the consumer decision making process.
Hypothesis
Ho1: There is no significant impact of Age and the factors considered for buying an organized house.
Ho2: There is no significant impact of the Gender and the factors considered for buying an organized house.
Ho3: There is no significant impact of the Education and the factors considered for buying an organized house.
Ho4: There is no significant impact of the Occupation and the factors considered for buying an organized house.
Ho5: There is no significant impact of the Income and the factors considered for buying an organized house.
Ho6: There is no significant impact of the
nature of family and the factors considered for buying an organized house.
Ho7: There is no significant impact of the Residential Location and the factors considered for buying an organized house.
Ho8: There is no significant impact of the Married Status and the factors considered for buying an organized house.
Ho9: There is no significant impact of the Family lifecycle stage and the factors considered for buying an organized house.
RESEARCH METHODOLOGY
Sampling Unit, Sample Selection and Sample Size
Sampling Unit : The population studied here is Indian customers in Delhi-NCR region. The sampling unit consist of the customers who intend to buy organized housing located in NCR-Delhi. Convenient sampling method was adopted to select the customers. There was no discrimination on the basis of Occupation, Age or Gender. The sample is broadly representative of the population for purposes of cross sectional survey.
Sampling Procedure: Since there are large numbers of buyer in NCR, we adopted convenient sampling method to select the customers. Sample selection was to ensure generalization and validity of findings.
Data Collection Method: The study is based on descriptive research design. The main instrument used to collect data was the well-
92 Journal of General Management Research
structured questionnaire. This structured questionnaire was pilot tested with 25 respondent’s to ensure that the respondents understand the questions. The responses were further circulated to 273 respondents who were found near the housing projects site and looked as prospect buyers/ existing users.. The present study is based on both primary and secondary data.
Measurement Scales Employed
The overall satisfaction of the respondents towards the price of the product were being gauged by using a questionnaire containing close-ended question, which were designed to ascertain satisfaction level of the respondents using a five point Likert scale with following options: Highly Satisfied, Satisfied, Neither Satisfied nor Dissatisfied, Dissatisfied and Highly Dissatisfied. The respondents were asked to read the questions and then choose the option for their response. Questions were explained to them if the respondent does not understand a particular question. Prior to the final survey, the questionnaire was pre tested using a sample of respondents similar in nature to the final sample.
Research and Statistical Tools Employed
The research and statistical tools employed in this study are frequency analysis, factor analysis, ANOVA (Analysis of variance)& Regression Analysis. SPSS 16 was used to perform statistical analysis. The reliability of
the data was carried out by using Cronbach’s Alpha Value. ANOVA was employed to find the association between demographic and relevant factor related with the organized and unorganized retails sector. The third major analysis carried out was a factor analysis to examine the underlying or latent factors related to housing sector. Both Bartlett’s test of Sphericity and measure of sampling adequacy (MSA) were also carried out to ensure that the requirements of factor analysis were met.
ANALYSIS AND INTERPRETATIONSThe analysis of this data was divided into following section:
(i) Demographic profile of Respondents: Table 1
(ii) Reliability and Validity: Table 2
(iii) Factor Analysis: Table 3 to 5
(iv) ANOVA: Table 6
LIMITATIONS OF THE STUDY:1. The survey was restricted to Delhi-NCR
alone.
2. The data were collected from the existing user of the Product and the New Buyers from the site.
93 An empirical study to Understand the Factors that Influences Consumer Buying ...
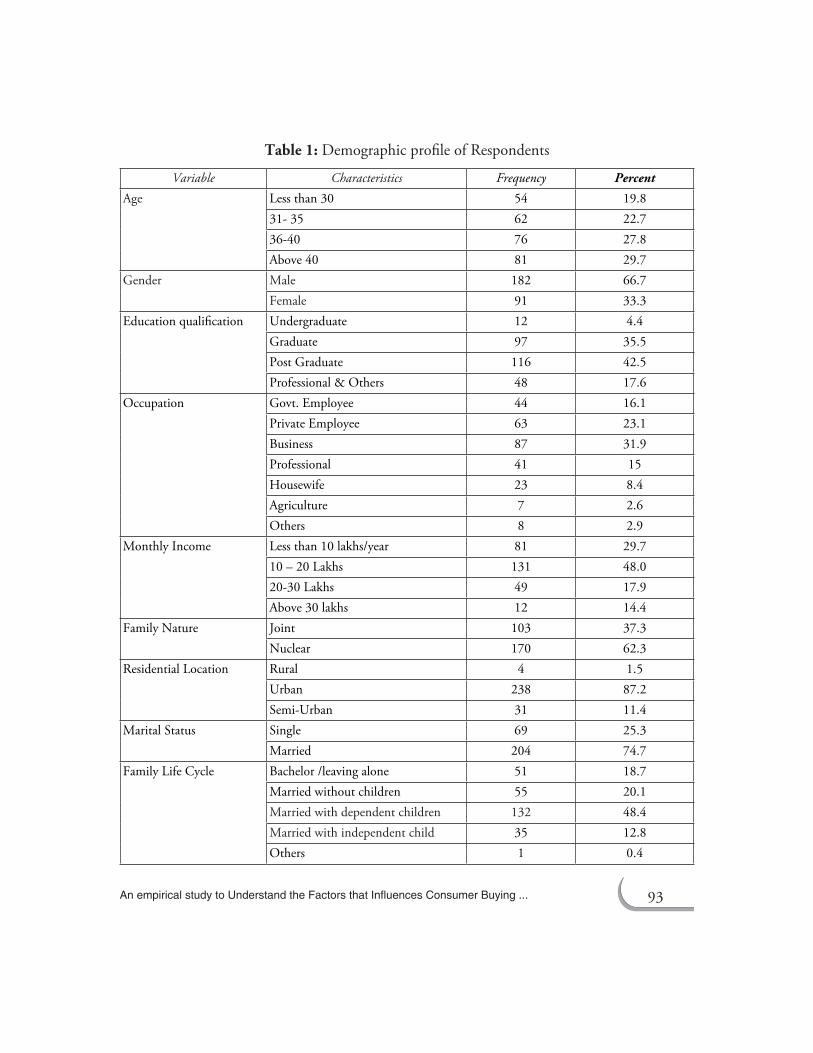
Table 1: Demographic profile of Respondents
Variable Characteristics Frequency Percent
Age Less than 30 54 19.831- 35 62 22.736-40 76 27.8Above 40 81 29.7
Gender Male 182 66.7Female 91 33.3
Education qualification Undergraduate 12 4.4Graduate 97 35.5Post Graduate 116 42.5Professional & Others 48 17.6
Occupation Govt. Employee 44 16.1Private Employee 63 23.1Business 87 31.9Professional 41 15Housewife 23 8.4Agriculture 7 2.6Others 8 2.9
Monthly Income Less than 10 lakhs/year 81 29.710 – 20 Lakhs 131 48.020-30 Lakhs 49 17.9Above 30 lakhs 12 14.4
Family Nature Joint 103 37.3Nuclear 170 62.3
Residential Location Rural 4 1.5Urban 238 87.2Semi-Urban 31 11.4
Marital Status Single 69 25.3Married 204 74.7
Family Life Cycle Bachelor /leaving alone 51 18.7Married without children 55 20.1Married with dependent children 132 48.4Married with independent child 35 12.8Others 1 0.4

94 Journal of General Management Research
The demographic profile of the respondents shows that the respondents above 40 years are 29.7 % followed by 35-40years 27.8%.This is the age group which represent majority of buyers for housing sector . There are 42.5% post graduate and 35.% are graduate, which indicate that educated persons are showing interest in this sector. They are decently employed (31.9% are businessman and 23.1% are in private employment) and have monthly income above 10 Lakhs (80%) which indicate that they also have the buying ability and can be the prospective customers. Further it is revealed that 74.7% of respondents are married and majority of them are having nuclear family (62.3%) and are from urban area (87.2%) This is ideal demographic profile who may prefer to buy from organized sector.
Table 2: Reliability Statistics
Cronbach’s Alpha No. of Items.726 44
Reliability & Validity: Table 2 reflects the result of reliability analysis- Cronbach’s Alpha Value. This test measured the consistency between survey scales. A Cronbach’s Alpha score of 1.0 indicate 100 percent reliability. Cronbach’s Alpha score were all greater than the Nunnally’s (1976) generally accepted score of 0.7. The score was 0.708 for different
characteristic in the findings that indicates reliability of the survey.
Factor Analysis: To carry out the factor analysis, the suitability of data was examined with the help of Kaiser-Meyer-Olkin Measure of Sampling Adequacy (KMSA) and Bartlett’s Test of Sphericity (Hair et al, 2006). Result of test are given in the table-3.
Table 3: KMO and Bartlett’s Test- Organized sector
Kaiser-Meyer-Olkin Measure of Sampling Adequacy
.708
Bartlett’s Test of Sphericity
Approx. Chi-Square
3.337E3
df 496Sig. .000
Overall, the set of data meets the fundamental requirements of factor analysis satisfactorily (Hair et al, 2006). In analyzing the data given, the 14 response items for organized sector and 13 items for unorganized sector were subjected to a factor analysis using the principal component method. As in common practice, a Varimax rotation with Kaiser Normalization was performed to achieve a simpler and theoretically more meaningful factor solution. The Cronbach’s alphas score for all the factors were above the cutoff point (0.7) recommended by Nunnally (1978).
95 An empirical study to Understand the Factors that Influences Consumer Buying ...
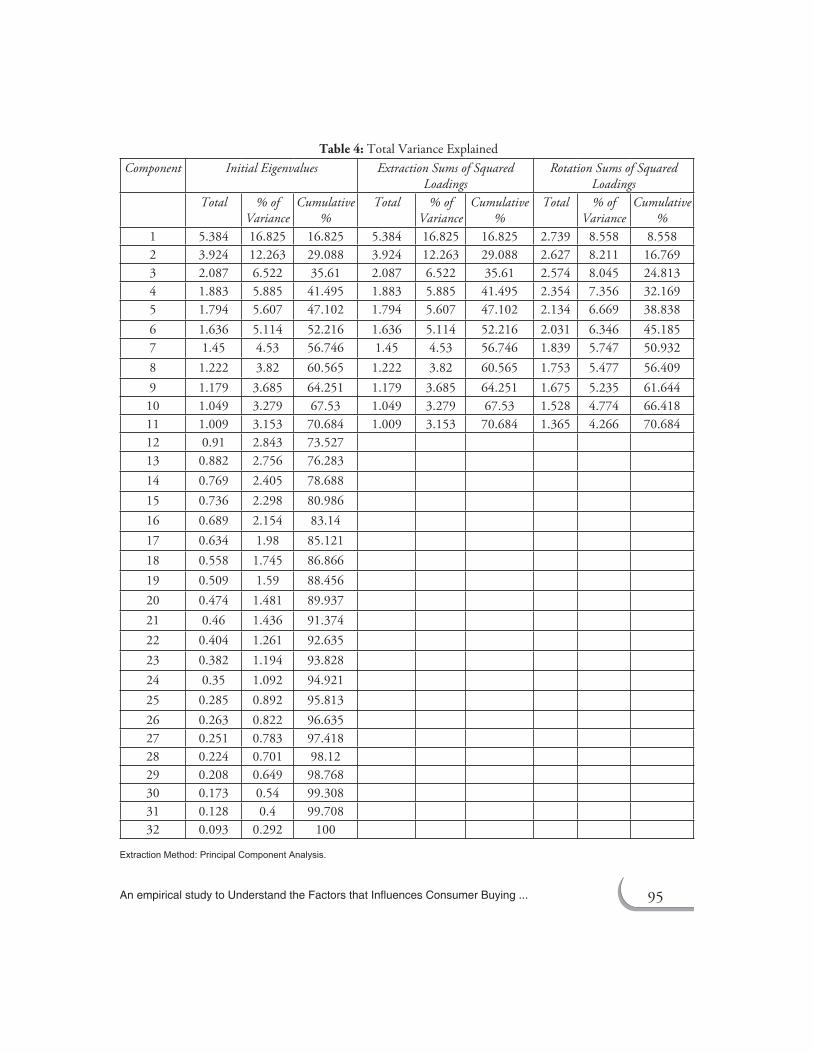
Table 4: Total Variance ExplainedComponent Initial Eigenvalues Extraction Sums of Squared
LoadingsRotation Sums of Squared
Loadings Total % of
VarianceCumulative
%Total % of
VarianceCumulative
%Total % of
VarianceCumulative
%1 5.384 16.825 16.825 5.384 16.825 16.825 2.739 8.558 8.5582 3.924 12.263 29.088 3.924 12.263 29.088 2.627 8.211 16.7693 2.087 6.522 35.61 2.087 6.522 35.61 2.574 8.045 24.8134 1.883 5.885 41.495 1.883 5.885 41.495 2.354 7.356 32.1695 1.794 5.607 47.102 1.794 5.607 47.102 2.134 6.669 38.8386 1.636 5.114 52.216 1.636 5.114 52.216 2.031 6.346 45.1857 1.45 4.53 56.746 1.45 4.53 56.746 1.839 5.747 50.9328 1.222 3.82 60.565 1.222 3.82 60.565 1.753 5.477 56.4099 1.179 3.685 64.251 1.179 3.685 64.251 1.675 5.235 61.64410 1.049 3.279 67.53 1.049 3.279 67.53 1.528 4.774 66.41811 1.009 3.153 70.684 1.009 3.153 70.684 1.365 4.266 70.68412 0.91 2.843 73.527 13 0.882 2.756 76.283 14 0.769 2.405 78.688 15 0.736 2.298 80.986 16 0.689 2.154 83.14 17 0.634 1.98 85.121 18 0.558 1.745 86.866 19 0.509 1.59 88.456 20 0.474 1.481 89.937 21 0.46 1.436 91.374 22 0.404 1.261 92.635 23 0.382 1.194 93.828 24 0.35 1.092 94.921 25 0.285 0.892 95.813 26 0.263 0.822 96.635 27 0.251 0.783 97.418 28 0.224 0.701 98.12 29 0.208 0.649 98.768 30 0.173 0.54 99.308 31 0.128 0.4 99.708 32 0.093 0.292 100
Extraction Method: Principal Component Analysis.
96 Journal of General Management Research
Table 5: Rotated Component Matrix
Component
1 2 3 4 5 6 7 8 9 10 11
Brand image of the builder -0.068 0.006 0.224 0.063 0.012 -0.049 0.725 -0.1 -0.135 0.01 -0.16
Affordability of the project -0.04 0.03 -0.087 0.137 -0.041 0.07 0.044 0.765 -0.13 0.297 -0.098
Schemes provided by the builder 0.1 0.211 0.194 0.072 0.261 0.12 -0.244 0.292 -0.166 0.581 -0.06
overall satisfaction of the project -0.091 -0.15 0.055 -0.005 0.049 -0.009 0.029 0.768 0.322 -0.033 0.036
Discounts offered by Builder 0.114 0.032 -0.101 -0.139 -0.071 0.017 0.044 0.122 0.029 0.73 0.066Timely delivery of the project 0.025 -0.004 -0.127 0.645 0.019 -0.054 0.371 0.3 -0.075 0.059 -0.25
Distance between metro and House 0.026 0.737 0.289 0.05 0.117 -0.161 -0.024 0.088 -0.243 0.118 -0.166
Distance b/w Railway St and House 0.193 0.842 0.157 -0.227 -0.037 -0.066 0.012 -0.121 0.004 -0.044 0.167
Distance B/w Bus stand and House 0.127 0.867 0.072 -0.111 -0.027 0.05 -0.003 -0.09 0.088 0.001 0.22
Distance from commercial Place -0.257 0.032 -0.125 0.53 0.403 -0.015 0.002 -0.024 0.000 -0.14 0.159
Distance from School 0.08 0.216 0.279 0.054 0.2 -0.046 0.051 -0.141 -0.045 0.098 0.698
Variety in Houses 0.253 0.233 0.103 -0.026 0.506 0.115 0.172 0.108 0.075 -0.32 0.124
Information from TV 0.823 0.084 0.333 0.044 0.193 0.066 -0.01 -0.063 -0.079 0.01 0.055
information from Radio 0.749 0.118 0.035 -0.13 0.22 0.056 -0.04 0.011 0.139 0.063 0.006
Information from Brochure /Magazine
0.858 0.083 0.224 0.104 0.016 0.024 0.059 -0.078 -0.112 0.031 0.064
lucky Draw offers 0.272 0.033 0.039 0.097 0.72 0.003 -0.179 -0.061 -0.055 0.183 -0.048
Parking Facility -0.007 -0.202 -0.143 0.501 0.194 0.168 0.4 0.029 -0.012 0.201 0.383
Features of the project 0.155 -0.142 -0.149 0.306 0.294 0.366 0.399 0.38 0.031 -0.111 0.014
Celebrity Endorser 0.049 0.001 0.406 -0.156 0.571 -0.036 0.204 0.185 -0.167 0.025 0.19After sales service -0.405 -0.203 0.036 0.224 0.149 -0.033 0.29 -0.108 -0.003 0.516 -0.004No hidden cost -0.089 -0.203 -0.07 0.229 0.344 0.005 0.249 -0.116 0.253 0.143 -0.572Sales Promotion 0.156 -0.214 0.439 -0.003 0.531 0.001 0.015 -0.056 0.263 0.014 -0.095Space, Ventilation &24x7 water availability
0.06 -0.149 0.015 0.77 -0.08 -0.03 0.01 0.006 0.219 -0.054 -0.01
Innovative features of the project 0.054 0.061 -0.086 0.078 -0.063 0.186 0.688 0.211 0.248 -0.001 0.152Reference given by friends 0.383 0.153 0.674 -0.251 0.034 0.089 0.012 0.035 0.142 -0.125 0.05Information in Facebook 0.099 0.176 0.812 -0.098 0.159 0.065 0 -0.067 -0.107 0.076 0.135Buyer review on Social Media 0.257 0.232 0.707 0.111 0.03 0.202 0.066 -0.016 0.033 -0.072 0.088
Club for recreation 0.052 -0.016 0.19 0.057 -0.114 0.853 0.104 0.025 -0.034 -0.016 0.109
swimming pool facility 0.075 -0.002 0.061 -0.146 0.18 0.854 0.057 0.036 -0.013 0.065 -0.076
games, banks, ATMS -0.011 -0.264 0.019 0.387 -0.107 0.473 -0.174 0.012 0.172 0.036 -0.146Appearance of the Flat -0.031 -0.172 -0.008 0.413 -0.092 0.121 0.109 0.205 0.618 0.006 -0.061
value system of an individual -0.002 0.04 0.016 0.034 0.047 -0.048 -0.02 0.017 0.818 -0.042 -0.07
97 An empirical study to Understand the Factors that Influences Consumer Buying ...
Table 6: Computation of ANOVA
FACTORS Age Gender Occupation Education Income Family-nature Res-Location Marital-status Lifecycle
F Sig. F Sig. F Sig. F Sig. F Sig. F Sig. F Sig. F Sig. F Sig.
Brand image of the builder
3.004 0.031 3.087 0.08 1.632 0.139 3.191 0.024 5.042 0.002 0.522 0.471 2.771 0.064 2.457 0.118 1.584 0.193
Affordability of the project
2.077 0.104 3.003 0.084 2.227 0.041 1.231 0.299 0.902 0.44 1.753 0.187 2.478 0.086 0.033 0.857 0.701 0.552
Schemes provided by the builder
0.953 0.416 1.35 0.246 3.138 0.005 0.076 0.973 1.905 0.129 0.122 0.727 1.791 0.169 4.805 0.029 3.419 0.018
overall satisfaction from the project
1.205 0.309 2.807 0.095 2.119 0.052 3.353 0.02 1.205 0.308 2.593 0.108 3.867 0.022 2.78 0.097 2.055 0.107
Discounts offered by Builder
0.168 0.918 0.776 0.379 3.227 0.004 0.531 0.662 0.454 0.715 4.151 0.043 4.295 0.015 0.42 0.517 1.318 0.269
Timely delivery of the project
0.424 0.736 2.29 0.131 4.569 0.000 4.145 0.007 7.559 0..00 0.277 0.599 5.689 0.004 6.683 0.01 2.374 0.071
Distance between metro and House
3.354 0.019 0.346 0.557 5.463 0.000 2.472 0.062 1.453 0.228 3.181 0.076 2.877 0.058 0.041 0.839 9.894 0.000
Distance b/w Railway St and House
0.545 0.652 0.052 0.819 8.092 0.000 0.33 0.804 1.5 0.215 10.138 0.002 0.543 0.582 4.64 0.032 6.547 0.000
Distance B/w Bus stand and House
0.131 0.942 0.108 0.742 6.056 0.000 0.172 0.915 0.519 0.669 10.948 0.001 2.841 0.06 3.925 0.049 4.494 0.004
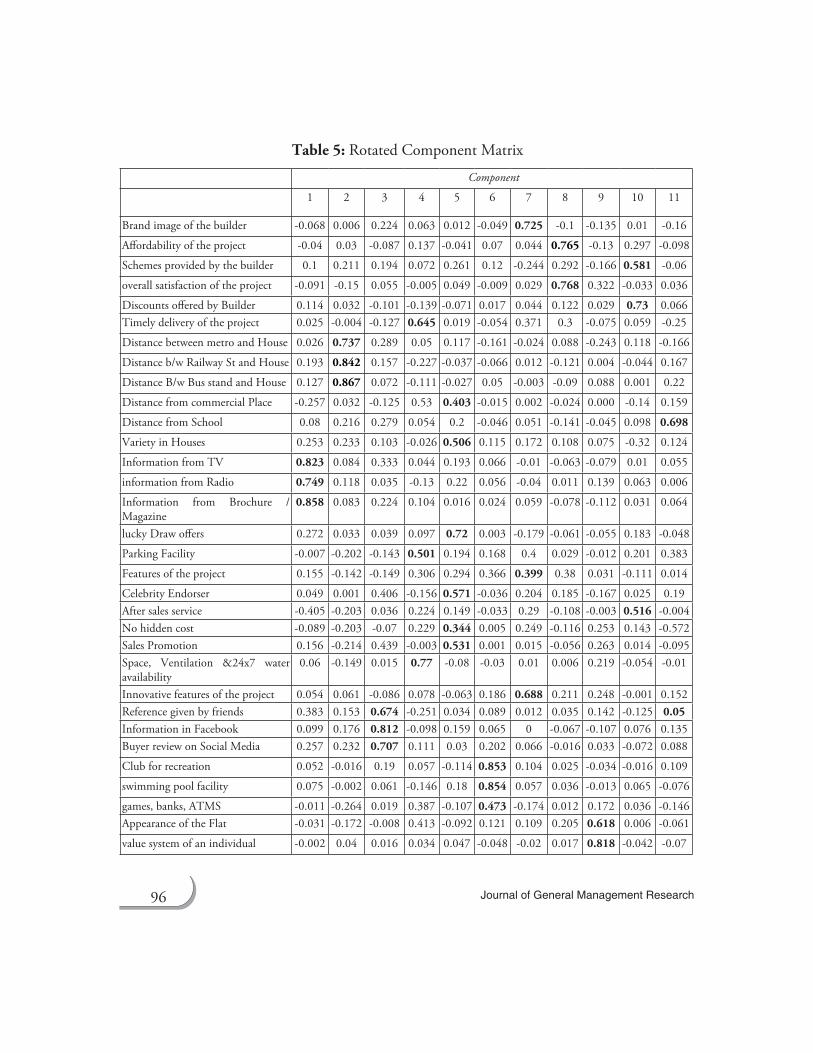
It is clear from the factor loadings as highlighted in Table 5, that eleven factors emerged. These eleven factors represent different elements of Housing-Project form the underlying factors from the original 32 scale response items given.
Referring to the Table 5 above first factor represents elements directly related to information available on Facebook, reference given by friends, buyer review on social media and is named as “Social Factor”. The second factor is related to Distance b/w Metro & House, Distance b/w Railway Station and House, Distance b/w bus stand and house and school and is named as “Distance factor”. The third factor is related to information
from TV, Radio, Magazine & Brochure and is named as “Communicator factor”. Fourth factor is directly related to club for recreation, swimming pool facility, games, banks, ATMs and is named as “Facility Factor”. Fifth factor includes timely delivery of the project, space & parking and is named as “Time Factor”
The other factors are “ Promotion factor” (lucky draw, sales promotion, celebrity endorser, variety in houses), Value factor (Appearance of the flat, value system of an individual), External factor ( after sales service, distance from commercial place), “Price Factor”(Affordability of the project, satisfaction of the project)“Brand value” ( Brand Image) and the last factor is “Offer & Scheme” ( schemes and discounts).
98 Journal of General Management Research
FACTORS Age Gender Occupation Education Income Family-nature Res-Location Marital-status Lifecycle
F Sig. F Sig. F Sig. F Sig. F Sig. F Sig. F Sig. F Sig. F Sig.
Distance from commercial Place
2.738 0.044 0.269 0.604 1.923 0.077 5.951 0.001 2.236 0.084 1.194 0.275 3.953 0.02 4.784 0.03 1.244 0.294
Distance from School
6.548 0.00 0.896 0.345 4.672 0.00 1.745 0.158 3.664 0.013 4.716 0.031 1.947 0.145 0.262 0.609 15.115 0.00
Variety in Houses
1.713 0.165 2.2 0.139 2.341 0.032 11.215 0.00 1.624 0.184 3.962 0.048 0.83 0.437 1.221 0.27 8.862 0.00
Information from TV
0.569 0.636 0.00 1 4.341 0.00 0.554 0.646 9.746 0.00 6.152 0.014 1.527 0.219 0.662 0.417 6.556 0.00
information from Radio
0.47 0.704 0.841 0.36 5.316 0.00 3.357 0.019 6.947 0.00 0.163 0.687 1.386 0.252 1.858 0.174 1.696 0.168
Information from Brochure /Magazine
3.363 0.019 2.176 0.141 5.72 0.00 1.661 0.176 3.372 0.00 8.13 0.005 1.788 0.169 0.235 0.628 8.533 0.00
lucky Draw offers
5.452 0.001 4.745 0.03 2.023 0.063 1.74 0.159 8.311 0.00 2.915 0.089 1.277 0.28 7.688 0.006 9.328 0.00
Parking Facility 0.104 0.957 2.671 0.103 3.511 0.002 15.019 0.00 6.813 0.00 0.649 0.421 1.98 0.14 4.072 0.045 3.024 0.03
Features of the project
1.651 0.178 4.523 0.034 6.237 0.00 3.911 0.009 3.629 0.014 0.205 0.651 1.601 0.204 0.843 0.359 1.096 0.351
Celebrity Endorser
0.514 0.673 4.586 0.033 0.886 0.506 0.388 0.762 3.29 0.021 2.126 0.146 2.467 0.087 0.271 0.603 3.809 0.011
After sales service
3.415 0.018 0.287 0.593 1.188 0.313 1.713 0.165 2.753 0.043 3.334 0.069 1.146 0.319 0.473 0.492 1.982 0.117
No hidden cost 4.124 0.007 0.595 0.441 7.713 0.00 1.747 0.158 3.635 0.013 1.073 0.301 15.179 0.00 2.671 0.103 2.668 0.048
Sales Promotion 3.914 0.009 16.543 0 1.601 0.147 3.741 0.012 1.49 0.218 2.709 0.101 6.856 0.001 0.021 0.884 3.421 0.018
Space, ventilation &24x7 water availability
1.395 0.245 1.54 0.216 4.2 0.00 2.612 0.052 4.437 0.005 0.424 0.515 2.278 0.104 0.015 0.902 3.417 0.018
Innovative features of the project
2.232 0.085 0.011 0.916 1.962 0.071 6.729 0.00 2.663 0.048 0.04 0.841 5.376 0.005 1.642 0.201 0.868 0.458
Reference given by friends
2.52 0.058 11.733 0.001 3.784 0.001 2.488 0.061 0.897 0.443 10.756 0.001 0.196 0.822 5.22 0.023 2.332 0.075
Information in Facebook
3.268 0.022 9.457 0.002 5.003 0.00 0.592 0.62 2.918 0.035 14.716 0.00 0.662 0.516 0.05 0.824 6.448 0.00
Buyer review on Social Media
1.421 0.237 2.28 0.132 6.746 0.00 0.324 0.808 4.612 0.004 27.18 0.00 6.886 0.001 0.506 0.478 3.112 0.027
Club for recreation
3.854 0.01 0.945 0.332 5.65 0.00 2.075 0.104 3.895 0.009 3.947 0.048 5.753 0.004 0.013 0.91 1.005 0.391
swimming pool facility
6.433 0.00 0.925 0.337 2.95 0.008 4.17 0.007 3.056 0.029 2.577 0.11 5.309 0.005 4.045 0.045 3.261 0.022
games, banks, ATMS
9.994 0.00 3.554 0.06 3.525 0.002 4.151 0.007 1.261 0.288 1.236 0.267 2.116 0.123 0.515 0.473 1.175 0.319
Appearance of the Flat
5.067 0.002 7.029 0.008 2.133 0.05 3.683 0.013 1.677 0.172 0.331 0.566 1.093 0.337 4.299 0.039 1.943 0.123
value system of an individual
5.373 0.001 5.671 0.018 0.642 0.697 1.407 0.241 0.421 0.738 5.873 0.016 6.768 0.001 12.359 0.001 6.38 0.00
99 An empirical study to Understand the Factors that Influences Consumer Buying ...
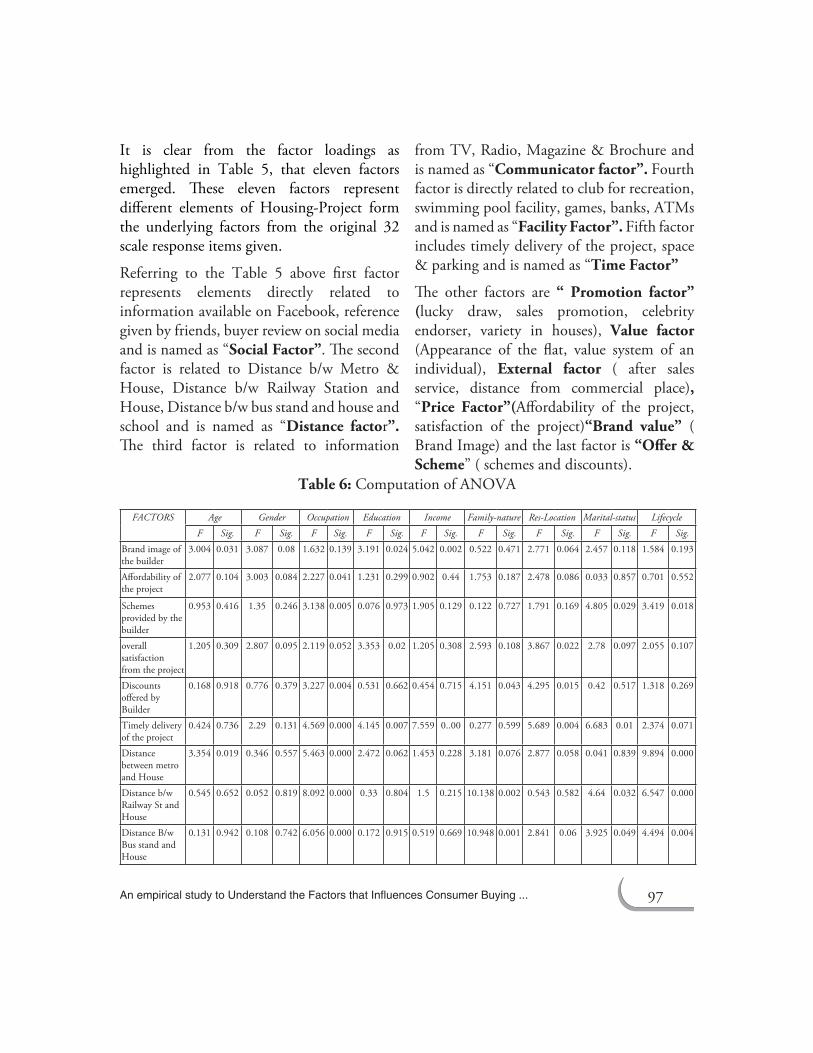
Hypothesis Testing
In order to find whether there is any impact of demographic elements on housing sector and to test hypothesis we carried out ANOVA on the customers responses . The results of ANOVA is given in the table 6 for the organized housing sector.
Table 6 indicate that age has significant impact on the factors considered for organized houses, hence we reject Ho1, where as gender and martial status of respondents show no significant impact therefore we accept Ho2 and Ho8 that there is no significant impact of the gender and marital status on the factors considered for buying an organized house . The occupation, education level and income of the respondents has significant impact on buying an organized house which leads us to reject Ho3 Ho4 and Ho5. Similarly it was found that the nature of family, residential location and the family lifecycle stage also has significant impact on buying an organized house which leads us to reject Ho6, Ho7 and Ho9.
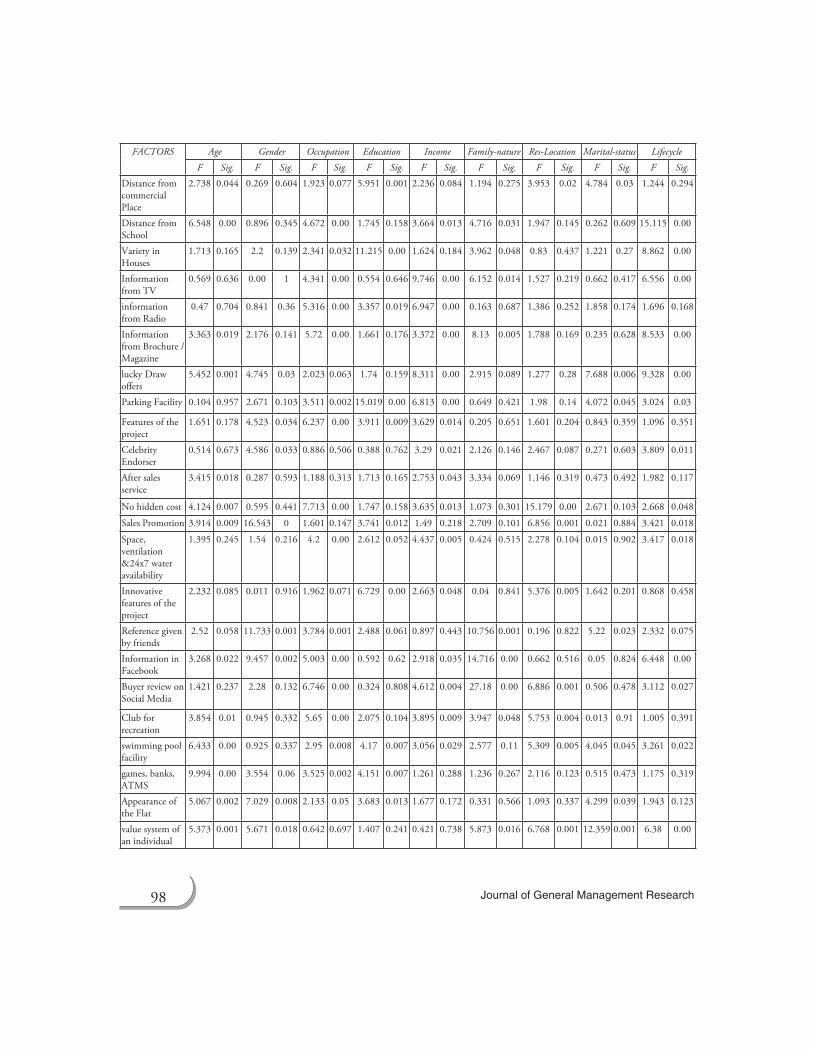
It was found that if the source of information is from reference given by friends, information on Facebook or buyer review on social media have significant influence on consumer decision making. Buyers also look for various facility such as recreation club, swimming pool, banks, ATM before making buying decision. Distance from Metro, Railway Station, Bus Stand, Commercial place and school are also significant factors considered by the buyers for organized housing. Buyers also considers availability of parking facility
and lucky draw as well as information given on TV and radio another positive inducement given by the organized housing schemes.
CONCLUSION Factor analysis have brought 11 factors representing various elements considered by the buyers for organized housing These factors are social factor, distance factor, communicator factor, facility factor , time factor, promotion factor, value factor, external factor, brand value, offer & scheme.
Gender and marital status of respondents have no significant impact on decision making whereas age occupation, education level and income of the respondents has significant impact on buying an organized house . It was also found that the nature of family, residential location and the family lifecycle stage also has significant impact on buying an organized house. Reference given by friends, information on Facebook or buyer review on social media have significant influence on consumer decision making, therefore housing company must have their presence on various social media platform. The companies must provide various facility such as recreation club, swimming pool, banks , ATM . Distance from Metro, railway, bus stand , commercial place and school are also significant factors considered by the buyers from organized housing. Buyers also considers availability of parking facility and lucky draw as well as information given on TV and radio another positive inducement given by the organized housing schemes.
100 Journal of General Management Research
REFERENCES [1] Aaker. (1991). Managing Brand Equity:
Capitalizing on the Value of a Brand Name. New York: The Free Press.
[2] Acar, A. & Polonsky, M. (2007). Online social networks and insights into marketing communications. Journal of Internet Commerce, 6(4), 55–72.
[3] Adrian Palmer, N. K.-L. (2009). an experiential, social network-based approach to direct marketing. International Journal of Direct Marketing, 162 - 176.
[4] Ball, M. and Harloe, M. (2005), “Uncertainty in European housing markets”, in Kleinman, M., Matznetter, W., Stephens, M. (Eds), European Integration and Housing Policy, Routledge, New Fetter Lane, London, pp. 57-74.
[5] Boelhower, P., Doling, J., Elsinga, M. and Ford, J. (2005), “Gains and losses for European home owners”, in Boelhower, P., Doling, J. and Elsinga, M. (Eds), Home Ownership: Getting in, Getting from, Getting out, Onderzoeks instituut OTB, Haveka, Alblasserdam, pp. 1-18.
[6] Borsch-Supan, A., Hank, K., Jurges, H. and Schro¨der, M. (2009), “Introduction: empirical research on health, ageing and retirement in Europe”, Journal of European Social Policy, Vol. 19, p. 293.
[7] Brinlee D (2007). Does Internet Advertising Work? http://www.askdeb.com/internet/advertising.
[8] Bronner, F. & De Hoog, R. (2010). Consumer-generated versus marketer-generated websites in consumer decision making. International Journal of Market Research, 52(2), 231–248.
[9] Bulmer, D. and V. DiMauro(2003) “The New Symbiosis of Professional Networks: Social Media’s Impact on Business and Decision-Making,” The Society for New
Communications Research, 2010, available at http://sncr.org/wp-content/uploads/2010 /02/NewSymbiosisReportExecSumm.pdf
[10] Boyd, D. M., & Ellison, N. B. (2007). Social Network Sites: Definition, History and Scholarship. Journal of Computer-Mediated Communication, 13(1), 210–230.
[11] Chaffey D (2003). Internet Marketing, Strategy, Implementation and Practise. 2nd edition, Pearson Education Limited, pp. 115-186.
[12] Chau, Patrick Y.K., Melissa Cole, Anne P. Massey, Mitzi Montoya-Weiss and Robert M. O
[13] Keefe (2002). Cultural differences in the online behavior of consumers. Association for Computing Machinery. Communications of the ACM, 45 (10), 138–143.
[14] Chen, Y., Fay, S. & Wang, Q. (2011). The role of marketing in social media: How online consumer reviews evolve. Retrieved 17 May 2013, from http://ssrn.com/abstract=1710357
[15] Conroy, P., &Narula, A. (2010). A new breed of brand advocates - Social networking redefines consumer engagement. Delloite.
[16] Curtis, A. (2011). The brief history of social media. Retrieved from http://www.uncp.edu/home/acurtis/NewMedia/SocialMedia/SocialMediaHistory.
[17] Darrel, R. (2011). The future of shopping. Harvard Business Review, 89(12), 64–75.
[18] David, F.D. (1988). Perceived usefulness, perceived ease of use, and user acceptance of information technology. MIS Quarterly, 13(3), 319–339.
[19] Donath J, Boyd D (2004). Public displays of connection. BT Technol. J., pp. 71-82.
[20] Doyle, S. (2007). The role of social networks in marketing. Journal of Database Marketing & Customer Strategy Management, 15(1), 60–64. DOI: 10.1057/palgrave.dbm.3250070.
101 An empirical study to Understand the Factors that Influences Consumer Buying ...
[21] Edelman, D. (2010). Gaining an edge through digital marketing. McKinsey Quarterly, (3), 129–134. DOI: 0047- 5394.
[22] Eric E (2008). 2008 Growth Puts Face book In Better Position to Make Money. http://venturebeat.com/2008/12/18/2008-growth-puts-facebook-in-better-position-to-make-money.
[23] Filo, K., & Funk, D.C. (2005). Congruence between attractive product features and virtual content delivery for Internet marketing communication. Sport Marketing Quarterly, 14, 112–122.
[24] Fishbein, M. & Ajzen, I. (1975). Belief, attitude, intention, and behavior: An introduction to theory and research. Reading, MA: Addison-Wesley.
[25] Graham, Jeffery & Havlena, William (2007). Finding the ‘missing link’: Advertising’s impact on word-of-mouth, web searches, and site visits. Journal of Advertising Research, 47 (4), 427–435.
[26] Hansen, W.G. (1959), “How accessibility shapes land use”, Journal of the American Planning
[27] Association, Vol. 25 No. 2, pp. 73-6. [28] Hans Baumgartner, Mita Sujan & Dan Padgett
(1997). Patterns of affective reactions to Ads: Integration of moment-by-moment reactions into overall judgments. Journal of Marketing Research, May, 219–232.
[29] HogE, C.C. (1993). The electronic marketing manual. McGraHil: New York, NY.
[30] http://www.customessays.net http://www.managementjournals.com , http://www.rncos.com http://www.smartcities.comhttp://www.ukessays.net
[31] Jason Fitzpatrick, “Establish and Maintain Your Online Identity,” Lifehacker (blog), May 5, 2010, http://lifehacker.com/5531465/establish-and-maintain-your-online-identity.
[32] Karsten, L. (2007), “Housing as a way of life: towards an understanding of middle-class
families’ preference for an urban residential location”, Housing Studies, Vol. 22, p. 83.
[33] Khanna, R. M. (2010, August 6). Aircel Enters Punjab. The Tribune.
[34] McKinsey. (2007). How companies are marketing Online: A McKinsey Global Survey King, P. (2009), Understanding Housing Finance: Meeting Needs and Making Choices, Routledge, London.
[35] Kim, T.-K., Horner, M.W. and Marans, R.W. (2005), “Life cycle and environmental factors in selecting residential and job locations”, Housing Studies, Vol. 20, p. 457.
[36] Kuznets, Simon S., and Ernest Rubin. (1954). Immigration and the foreign born. New York: National Bureau of Economic Research. Lavidge, R.J. & Steiner, G.A. A model for predictive measurements of advertising effectiveness. Journal of Marketing, 1961, 59–62.
[37] Leinberger, C.B.(2008).The nex tslum?Atlantic Monthly, available at http://www.theatlantic.com/doc/print/200803/subprime?emc=lm&m=212836&l=18&v=36915.
[38] Li, H., Kuo, C. and Rusell, M. G. (1999). The impact of perceived channel utilities, shopping orientations, and demographics on the consumer’s online buying behavior. Journal of Computer-Mediated Communication, 5. Doi: 10.1111/j.1083-6101.1999. tb00336.x.
[39] Liu, M. & Xiao, Y. (2008). Relationship between consumer satisfaction and web consumer shopping behaviour. International Journal of Business Research, 8(5), 127–136.
[40] Loudon, D.L. (1988), Consumer behaviour: Concepts and applications. London: McGraw Hill. M.H. Huang/Computers in Human Behavior, 19 (2003), 425–442.
[41] Nicole K (2007). Building a Brand through Social Networks, http:/ /mashable.com/ 2007/05/ 08/ brand-social-networks/ Ricadela A (2007).

102 Journal of General Management Research
Fogeys Flock to Facebook, Business Week. http://www.businessweek.com/technology/content/aug2007/ tc2007085_051788.html
[42] Nguyen, Q.H. (2013), “Housing investment: what makes it so volatile? Theory and evidence from OECD countries”, Journal of Housing Economics, Vol. 22 No. 3, pp. 163-178.
[43] Nordvik, V. (2006), “Selective housing policy in local housing markets and the supply of housing”, Journal of Housing Economics, Vol. 15 No. 4, pp. 279-292.
[44] O’Reilly, T. (2005, April 6). What is web 2.0? Retrieved June 12, 2011, from www.oreilly.com:http://oreilly.com/lpt/a/6228
[45] Oikarinen, E. (2009), “Household borrowing and metropolitan housing price dynamics – empirical evidence from Helsinki”, Journal of Housing Economics, Vol. 18 No. 2, pp. 126-139.
[46] Oikarinen, E. (2012), “Empirical evidence on the reaction speeds of housing price and sales to demand shocks”, Journal of Housing Economics, Vol. 21 No. 1, pp. 41-54.
[47] Patrick, Y.C. & Massey, A.P. (2002). Cultural differences in the online behaviour of consumers. Communications of the ACM, 45(10), 138–143.
[48] Power, D. J. “What is social media?” DSS News, Vol. 11, No. 9, April 24, 2011.
[49] Reppel, A. & Szmigin, I. (2010). Consumer-managed profiling: A contemporary interpretation of privacy in buyer-seller interactions. Journal of Marketing Management, 26(3/4), 321–342. DOI: 10.1080/02672570903566383.
[50] Rutz, J.O. & Bucklin, E.R. (2011). From generic to branded: A model of spillover in paid search advertising. Journal of Marketing Research, 48(1), 87–102. DOI: 10.1509/ jmkr.48.1.87.
[51] Social media from Wikipedia, the free encyclopedia, available at http://en.wikipedia.org/wiki/Social_media
[52] TNS, TRU & Marketing evolution. (2007). Never Ending Friending - A Journey into Social Networking. Fox Interactive Media, Inc.
[53] Schiffman, L.G. (1993). Consumer behavior. London: Prentice Hall International.
[54] Scott DM (2009). The New Rules of Marketing and PR. John Wiley & Sons Inc., pp. 135-150.
[55] Shih C (2009). The Facebook Era. Tapping online social networks to build better products, reach new audiences and selling more stuff. Prentice Hall Publication, pp. 85-128.
[56] Smith, P.R. & CHAFFEY, D. (2005). e-Marketing excellence: At the heart of e-business (2nd ed.). Oxford, UK : Butterworth Heinemann.
[57] Spilker-Attig, A. (2010). Effectiveness of online advertising channels: A price-level-dependent analysis. Journal of Marketing Management, 26(3/4), 344–360.
[58] Strauss, J, El-Ansary, A. & Frost. R. (2006). E-marketing (4th ed.). Pearson Pretince Hall.
[59] Strong, E.K. (1925). Theories of selling. Journal of Applied Psychology, 9, 75–86.
[60] Stroud D. (2007). Opinion piece: Falling in Love 2.0: Relationship marketing for the Face book generation. Social networking: An age-neutral commodity-Social networking becomes a mature web application, pp.105-165
[61] Taylor, D. et al. (2011). Friends, fans, and followers: Do ads work on social networks? Journal of Advertising Research, 51(1), 258–275.
[62] Taylor, D.G., Lewin, J.E. & Strutton, D. (2011). Friends, fans, and followers: Do ads work on social networks? Journal of Advertising Research, 51(1), 258–275.
[63] Thomas, G.E. (2008). Internet marketing in the international arena: A cross-cultural comparison. Journal of International Business Strategy, 8(3), 84–98.
103 An empirical study to Understand the Factors that Influences Consumer Buying ...
[64] Thompson SH (2002). Attitudes toward online shopping and the internet. National university of Singapore, 21(4).
[65] Tiwari, P. (2000), “Housing demand in Tokyo”, International Real Estate Review, Vol. 3 No. 1, pp. 65-92.
[66] Turner, T.M. (2003), “Does investment risk affect the housing decisions of families?”, Economic Inquiry, Vol. 41 No. 4, pp. 675-691.
[67] Van Heerde, Harald J., Kristiaan Helsen & Marnik Dekimpe (2007). The impact of a product-harm crisis on marketing effectiveness. Marketing Science, 26(2), 230–245.
[68] Weber L (2009). Marketing to the Social Web. Second Edition. John Wiley and Sons, pp. 58-97.
[69] Vogt, C., &Knapman, S. (2008). The Atanomy of social networks. Market leaders, 40(3), 46-51.
[70] Wang, F. (2003). Housing improvement and distribution in urban China: Initial evidence from China’s 2000 Census. The China Review, 3(2), 121-143.
[71] Yannopoulos, P. (2011). Impact of the Internet on marketing strategy formulation. International Journal of Business & Social Science, 2(18), 1–7.