an empirical study of the causes and consequences of mergers
TRANSCRIPT

AN EMPIRICAL STUDY OF THECAUSES AND CONSEQUENCES OF MERGERS
IN THE CANADIAN CABLE TELEVISION INDUSTRY
by
DAVID PATRICK RONALD BYRNE
A thesis submitted to the Department of Economics
in conformity with the requirements for
the degree of Doctor of Philosophy
Queen’s University
Kingston, Ontario, Canada
December, 2010
Copyright c© David Patrick Ronald Byrne, 2010

Abstract
This dissertation consists of three essays that study mergers and consolidation in the Cana-
dian cable television industry. The first essay provides a historical overview of regulatory
and technical change in the industry, and presents the dataset that I constructed for this
study. The basic pattern of interest in the data is regional consolidation, where dominant
cable companies grow over time by acquiring the cablesystems of small cable operators. I
perform a reduced-form empirical analysis that formally studies the determinants of merg-
ers, and the effect that acquisitions have on cable bundles offered to consumers.
The remaining essays develop and estimate structural econometric models to further
study the determinants and welfare consequences of mergers in the industry. The sec-
ond essay estimates an empirical analogue of the Farrell and Scotchmer (1988) coalition-
formation game. I use the estimated model to measure the equilibrium impact that economies
of scale and agglomeration has on firms’ acquisition incentives. I also study the impact
entry and merger subsidies have on consolidation and long-run market structure. The fi-
nal chapter estimates a variant of the Rochet and Stole (2002) model of multi-product
monopoly with endogenous quality and prices. Using the estimated model I compute the
impact mergers have on welfare. I find that both consumer and producer surplus rise with
acquisitions. I also show that accounting for changes both in prices and products (i.e., cable
bundle quality) is important for measuring the welfare impact of mergers.
i

Dedication
To Marisia, for always understanding, encouraging, and loving me in all that I do.
ii

Acknowledgments
I am very grateful for my supervisors, Chris Ferrall and Susumu Imai for giving me their
time, patience, advice, guidance, and encouragement over the course of my Ph.D. I have
also benefitted from the continual support of Allan Gregory and Roger Ware during my
six years at Queen’s. I am thankful for funding from SSHRC’s Doctoral Canada Graduate
Scholarship, and from the Province of Ontario’s Ontario Graduate Scholarship.
For their many helpful comments and suggestions, I thank the seminar participants
at Mount Allison University, the University of Toronto, Queen’s University, Simon Fraser
University, the University of Alberta, HEC Montreal, Carnegie Mellon (Tepper), University
of Melbourne, Analysis Group (Chicago), the 2009 CEA Annual Meetings, and the 2009
CIREQ Ph.D Students Conference. I have also had very helpful discussions with Victor
Aguirregabiria, Branko Boskovic, Sacha Kapoor, Arvind Magesan, Shannon Seitz, Ryan
Webb, and Jan Zabojnik.
Finally, I thank for my wife, parents, and brothers for their continued love, encourage-
ment and patience.
iii

Table of Contents
Abstract i
Dedication ii
Acknowledgments iii
Table of Contents iv
List of Tables vii
List of Figures ix
Chapter 1: General Introduction . . . . . . . . . . . . . . . . . . . . . . . . . . 1
Chapter 2: Cable Television in Canada: Historical and Empirical Perspectives 5
2.1 Historical Overview . . . . . . . . . . . . . . . . . . . . . . . . 6
2.2 The Dataset . . . . . . . . . . . . . . . . . . . . . . . . . . . . . 11
2.3 Descriptive Statistics . . . . . . . . . . . . . . . . . . . . . . . . 14
2.3.1 Market Structure . . . . . . . . . . . . . . . . . . . . . . 14
2.3.2 Cable Prices and Packages . . . . . . . . . . . . . . . . . 17
2.4 Determinants of Acquisitions . . . . . . . . . . . . . . . . . . . 25
2.5 The Effect of Acquisitions on Cable Bundles . . . . . . . . . . . 28
iv

2.5.1 Results . . . . . . . . . . . . . . . . . . . . . . . . . . . 29
2.5.2 Endogeneity of acquisitions . . . . . . . . . . . . . . . . 33
2.6 Summary . . . . . . . . . . . . . . . . . . . . . . . . . . . . . . 35
Chapter 3: Quantifying Merger Incentives in the Cable Television Industry . . 38
3.1 Related Literature . . . . . . . . . . . . . . . . . . . . . . . . . . 42
3.2 Empirical Motivation . . . . . . . . . . . . . . . . . . . . . . . . 43
3.3 Model . . . . . . . . . . . . . . . . . . . . . . . . . . . . . . . . 46
3.3.1 Environment . . . . . . . . . . . . . . . . . . . . . . . . 46
3.3.2 Sub-Period 2: LSA Profits . . . . . . . . . . . . . . . . . 48
3.3.3 Sub-Period 1: Acquisition Game . . . . . . . . . . . . . . 51
3.3.4 Equilibrium . . . . . . . . . . . . . . . . . . . . . . . . . 56
3.4 Empirical Implementation . . . . . . . . . . . . . . . . . . . . . 57
3.4.1 Likelihood . . . . . . . . . . . . . . . . . . . . . . . . . 58
3.4.2 Reducing Dimensionality . . . . . . . . . . . . . . . . . 60
3.5 Findings . . . . . . . . . . . . . . . . . . . . . . . . . . . . . . 61
3.5.1 Parameter Estimates . . . . . . . . . . . . . . . . . . . . 61
3.5.2 Economies of Scale, Density, Deregulation and Acquisi-
tion Activity . . . . . . . . . . . . . . . . . . . . . . . . 65
3.5.3 Merger and Entry Policy Experiments . . . . . . . . . . . 69
3.6 Concluding Remarks . . . . . . . . . . . . . . . . . . . . . . . . 72
Chapter 4: The Welfare Effects of Acquisitions in the Cable Television Industry 73
4.1 Related Literature . . . . . . . . . . . . . . . . . . . . . . . . . . 77
4.2 Model . . . . . . . . . . . . . . . . . . . . . . . . . . . . . . . . 79
v

4.2.1 Overview . . . . . . . . . . . . . . . . . . . . . . . . . . 79
4.2.2 Demand . . . . . . . . . . . . . . . . . . . . . . . . . . . 80
4.2.3 Supply . . . . . . . . . . . . . . . . . . . . . . . . . . . 83
4.3 Empirical Specification . . . . . . . . . . . . . . . . . . . . . . . 84
4.3.1 Estimation . . . . . . . . . . . . . . . . . . . . . . . . . 85
4.3.2 Computational Details . . . . . . . . . . . . . . . . . . . 88
4.3.3 Identification . . . . . . . . . . . . . . . . . . . . . . . . 89
4.4 Estimation Results . . . . . . . . . . . . . . . . . . . . . . . . . 91
4.5 Welfare Effects of Acquisitions . . . . . . . . . . . . . . . . . . 96
4.6 Conclusion . . . . . . . . . . . . . . . . . . . . . . . . . . . . . 101
Chapter 5: Conclusion . . . . . . . . . . . . . . . . . . . . . . . . . . . . . . . . 103
Appendix A: Tables and Figures . . . . . . . . . . . . . . . . . . . . . . . . . . 113
vi

List of Tables
2.1 Trends in Market Structure . . . . . . . . . . . . . . . . . . . . . . . . . . . . 15
2.2 License Ownership and Subscribership of Large Firms . . . . . . . . . . . . . . 16
2.3 Master Files and Census Data Summary Statistics: 1990-1996 . . . . . . . . . . 21
2.4 Trends in Cable Prices and Channel Offerings . . . . . . . . . . . . . . . . . . 23
2.5 Prices and Packages of Large and Small Firms . . . . . . . . . . . . . . . . . . 24
2.6 Determinants of Mergers . . . . . . . . . . . . . . . . . . . . . . . . . . . . . 27
2.7 Relationship Between Acquisitions and Prices, Channel Counts, Market Shares
and Channel Costs . . . . . . . . . . . . . . . . . . . . . . . . . . . . . . . . . 31
2.8 Tests of Whether Acquired LSAs are Representative . . . . . . . . . . . . . . . 33
2.9 Estimation Results by Large and Not Large Buying Firms in Two-Bundle Markets 35
3.1 Variable Profit Function Parameter Estimates . . . . . . . . . . . . . . . . . . . 62
3.2 Fixed, Acquisition and Entry Cost Parameter Estimates . . . . . . . . . . . . . 65
3.3 Counterfactual Experiments Predictions . . . . . . . . . . . . . . . . . . . . . . 67
3.4 Merger Fees and Entry Subsidies Policy Experiments . . . . . . . . . . . . . . 70
4.1 Parameter Estimates . . . . . . . . . . . . . . . . . . . . . . . . . . . . . . . . 92
4.2 Model Fit . . . . . . . . . . . . . . . . . . . . . . . . . . . . . . . . . . . . . . 94
4.3 Welfare Effect of Mergers . . . . . . . . . . . . . . . . . . . . . . . . . . . . . 97
4.4 Decomposition of Merger Welfare Effects . . . . . . . . . . . . . . . . . . . . 101
vii

A.1 Region Definitions . . . . . . . . . . . . . . . . . . . . . . . . . . . . . . . . . 113
A.2 Variable Sources and Definitions . . . . . . . . . . . . . . . . . . . . . . . . . 114
A.3 License Ownership and Subscribership of Large Firms - All Years . . . . . . . . 116
A.4 Welfare Effect of Mergers (Unacquired LSA’s) . . . . . . . . . . . . . . . . . . 117
viii

List of Figures
2.1 Geographic Market Ownership: 1986 . . . . . . . . . . . . . . . . . . . . . . . 18
2.2 Geographic Market Ownership: 2004 . . . . . . . . . . . . . . . . . . . . . . . 19
3.1 LSA Buyout Counts . . . . . . . . . . . . . . . . . . . . . . . . . . . . . . . . 44
3.2 Firm Buyout Counts . . . . . . . . . . . . . . . . . . . . . . . . . . . . . . . . 44
3.3 Number of Non-Basic Channels . . . . . . . . . . . . . . . . . . . . . . . . . . 45
3.4 Revenue per Subscriber . . . . . . . . . . . . . . . . . . . . . . . . . . . . . . 45
3.5 Affiliation Cost per Subscriber . . . . . . . . . . . . . . . . . . . . . . . . . . 45
3.6 Profits per Subscriber . . . . . . . . . . . . . . . . . . . . . . . . . . . . . . . 45
3.7 Model Predictions . . . . . . . . . . . . . . . . . . . . . . . . . . . . . . . . . 68
3.8 No Density Economies . . . . . . . . . . . . . . . . . . . . . . . . . . . . . . 68
3.9 No Policy Change . . . . . . . . . . . . . . . . . . . . . . . . . . . . . . . . . 68
4.1 Quality vs. Channels (Basic) . . . . . . . . . . . . . . . . . . . . . . . . . . . . . 96
4.2 Quality vs. Channels (Non-Basic) . . . . . . . . . . . . . . . . . . . . . . . . . . 96
4.3 CS Gains vs. Urban Density . . . . . . . . . . . . . . . . . . . . . . . . . . . . 99
4.4 Merger-Induced Changes in Marginal Costs . . . . . . . . . . . . . . . . . . . 100
A.1 Sample Reporting Form for Broadcast Undertakings . . . . . . . . . . . . . . . 118
A.2 CRTC Decision 89-46 . . . . . . . . . . . . . . . . . . . . . . . . . . . . . . . 121
ix

A.3 CRTC Decision 95-476 . . . . . . . . . . . . . . . . . . . . . . . . . . . . . . 122
x

Chapter 1
General Introduction
This dissertation consists of three essays that empirically study the determinants and wel-
fare effects of mergers in the Canadian cable television industry.1
The first essay provides context with a historical and empirical overview of the industry.
It opens with an in-depth discussion of technological and regulatory change from the first
Canadian cablesystems in the 1950’s to present-day debates related to competition and the
technological convergence of cable and telephone companies.2 The essay then presents the
dataset that I constructed to carry out the study. These data consist of a rich panel containing
information on cable company entry and exit, acquisitions, subsidiaries, cable company
prices, market shares, channels, costs, and demographics at the local cablesystem level
1I use the words acquisition, merger and buyout interchangeably throughout this dissertation. The focusis on acquisitions however, where there is a selling firm that ceases to exist following a merger. That is, I donot study “mergers of equals.”
2Cablesystems roughly correspond to the cities, towns and villages of Canada. Law (1999) succinctlydefines a “cablesystem” as follows:
“A cablesystem is the cable network around one local head end. The head end is the locationof the equipment that receives the signals that are sent down the cable to the subscriber. Headend apparatus can include devices such as satellite dishes, large antennas for the reception ofover-the-air broadcasts, fibre optic links, video relay equipment, and microwave towers.”
1

from 1986 to 2004. Using these data, I present various summary statistics and empirical
patterns of interest that together tell a story of regional consolidation in the industry, where
dominant cable companies grow over time by acquiring the cablesystems of small cable
operators. By 2004, distinct regional clusters of cablesystems exist in Western Canada,
Ontario, Quebec and in Atlantic Canada.
These basic findings are complemented by two reduced-form analyses that respectively
focus on the determinants of mergers and the effect acquisitions have on prices and channels
offered on cable tiers. First, I estimate a Poirier (1980) bivariate probit model that predicts
the probability that two firms merge. I find that larger differences in firm size (measured by
number of subscribers nationally), and geographic proximity of the cablesystems owned,
have a positive non-negligible impact on the probably that a merger occurs. Second, I
conduct a regression analysis that looks at the relationship between cable prices, the number
of channels offered and whether a cablesystem has been recently acquired. I find that
acquisitions have little impact on cable prices and channels in rural markets where only
basic cable is offered. In larger, more urban cablesystems with both basic and non-basic
cable, the results suggest that basic prices and non-basic channels distinctly rise following
an acquisition.
The second essay further analyses the determinants of acquisitions in the industry. I
develop a model of license ownership that predicts the evolution of profit-maximizing en-
try and acquisition decisions by firms over time, starting from an initial allocation of cable
television licenses. The entry and acquisition process is modelled as a one-sided coalition-
formation game as in Farrell and Scotchmer (1988), where acquisition payoffs depend on
economies of scale and agglomeration/economies of density. I apply the model to the Cana-
dian cable television industry and estimate its parameters using license-level information
2

on acquisition and entry decisions, subscribership, and subscription profits. The model is
estimated in two steps. I first estimate firms license-level profit functions, and then esti-
mate the parameters of the fixed, merger and entry cost functions by Simulated Maximum
Likelihood. Through counterfactual simulations, I use the estimated model to quantify the
extent to which economies of scale and density drive acquisition behaviour, and to evaluate
how merger activity reacts to a partial deregulation that occurs in 1994. I also evaluate poli-
cies that stimulate entry or reduce acquisitions in the early years of the sample. The main
finding is that these policies can lead to more productive dominant firms in the long-run as
the industry consolidates.
The third essay quantifies the effect acquisitions have on welfare. I develop and es-
timate a model of multi-product monopoly in the spirit of Rochet and Stole (2002) that
endogenizes price, quality and the number of cable bundles offered to consumers. I apply
the model to the Canadian cable television industry, and estimate its parameters using panel
data on basic and non-basic cable prices and market shares from 1990-1996. To estimate
the model, I use a Simulated Method of Moments estimator that compares the model’s
predictions for cable prices, market shares and number of products offered to those in the
data. The estimates suggest there are scale effects that reduce cable companies’ marginal
cost of cable bundles, which corroborates previous findings from the U.S. cable television
industry. In light of this finding, I use the estimated model to calculate the welfare effects
of mergers, finding that mergers increase consumer and producer surplus. Prices and cable
quality are predicted to rise with acquisitions, but the increase in the latter is sufficient to
yield gains to consumers. The welfare gains are most pronounced in licenses that large
acquiring cable companies target; namely urban markets where basic and non-basic bun-
dles are offered. I show that accounting for firms’ endogenous quality choice is central to
3

this finding, and that following the common practice of focusing on only price effects of
mergers can lead to incorrect conclusions regarding their impact on welfare.
4

Chapter 2
Cable Television in Canada: Historical
and Empirical Perspectives
This chapter provides a historical and empirical overview of the Canadian cable television
industry. First, I set the context for this thesis by discussing the intertwined history of reg-
ulation and technological change from the 1950’s to present. This discussion updates and
extends previous historical overviews of the industry by Good (1974), McFadyen, Hoskins,
and Gillen (1980), and Law (1997) by making use of the Canadian Radio-television and
Telecommunication Commission’s online database of historical reports and regulatory de-
cisions for the industry.1 I then present the empirical foundation for this dissertation − a
panel dataset at the cablesystem level on market structure and cable offerings that spans
the 1986 to 2004 period. Descriptive statistics on market structure and cable bundles are
presented and I perform a reduced-form empirical analysis of the determinants of mergers
and their impact on cable prices and channel offerings.
1The url for these searchable files is http://www.crtc.gc.ca/eng/dno.htm.
5

2.1 Historical Overview
1950-1980: First Cablesystems and Regulations
The modern era of cable television in Canada dates back to 1952, the year in which the
Canadian Broadcasting Corporation (CBC) is launched, and the first urban cablesystem is
built in London, Ontario.2 Through the 1950’s and 1960’s, cablesystems emerge primarily
in urban parts of Canada until 1968, when the Federal government introduces an array of
new regulations for the industry with the Broadcasting Act.3 The Act confirms the CBC as
the national broadcaster, defines foreign ownership restrictions (i.e. what fraction of broad-
casters are allowed to be owned by non-Canadians), creates Canadian content provisions,
and creates a new national regulatory agency called Canadian Radio-television Commis-
sion (CRTC, or “the Commission”).4 Moreover, the Act creates a new mandatory licensing
scheme for broadcasting that requires cable companies to obtain licenses from the CRTC to
exclusively offer cable television as regulated monopolists within geographic “Local Ser-
vice Areas” (LSAs) or “broadcasting/distributing undertakings” (BDU’s).5 In 1968, there
are approximately 377 previously established cablesystems in Canada that are immediately
adopted by the CRTC as new LSAs with the passing of the Act. The initial regulatory
framework requires the CRTC to regulate licenses’ channel carriage, basic cable prices and
installation fees on a LSA-by-LSA basis.
2The CRTC provides an outline of the history of telecommuncations in Canada on its websitethat I follow and supplement with other sources in discussing the history of the industry. Seehttp://www.crtc.gc.ca/eng/backgrnd/brochures/b19903.htm. The Canadian Communications Foundation alsohas rich documentation of the history of the Canadian cable industry online at http://www.broadcasting-history.ca/index3.php. This subsection draws heavily on the information from these two sites.
3The Broadcasting Act can be found on the web at http://laws.justice.gc.ca/en/B-9.01/index.html.4As of 2010, content rules require at least 60% of all programming between 6:00am and midnight be
“Canadian content”, and at least 50% of programming between 6:00pm and midnight be “Canadian content”,where “Canadian content” is defined by the CRTC. Current foreign ownership restrictions state that at most46.7% of a Canadian broadcasting company may be foreign owned.
5Throughout, I use “licenses,” “Local Service Areas (LSAs).”
6

Under the Act, the CRTC’s original regulatory jurisdiction is strictly over radio and
television companies. This jurisdiction is expanded in 1976 to include all telecommunica-
tions companies (including telephone companies) with the Canadian Radio-television and
Telecommunications Commissions Act.6 This act aptly renames the CRTC to its modern-
day name, the Canadian Radio-television and Telecommunications Commission.
1980’s: Non-Basic Cable and Revamped Regulations
The CRTC overhauls a number of its regulatory practices for broadcasting in the early
1980’s. The revisions are mainly a response to the booming growth of cable television in
Canada, and newly emerging “pay” and “specialty” or “discretionary” television services.
In 1982, the CRTC licenses its first six pay television services in Canada, including chan-
nels such as The Movie Network and First Choice. Another collection of specialty channels
is licensed in 1984, including five Canadian specialty channels (Much Music, TSN, Chi-
navision, Catha, and Telelatino) and seventeen American channels (such as CNN, CMT,
TLC, and The Weather Network). With the additional “higher quality” channels, cable
companies begin tiering their cable packages by offering “basic,” “extended-basic,” and
“pay services.” The latter two services are collectively referred to as “non-basic services.”
The CRTC’s license-by-license, micro-managed regulatory approach to carriage and
pricing becomes increasingly complex and convoluted with the emergence of non-basic
cable services. As a result, the Commission revamps its regulatory framework over the
1984 to 1986 period resulting in the 1986 Cable Television Regulations.7 The Regulations
significantly reduces the regulatory burden of CRTC with respect to basic cable prices by
creating three primary rules that govern basic cable price increases. These rules are defined6The Canadian Radio-television and Telecommunications Commissions Act is documented online at
http://laws.justice.gc.ca/en/C-22/.7The details of the regulations are found at http://www.crtc.gc.ca/eng/archive/1986/PB86-27.htm.
7
in Section 18 of the Regulations as follows: 18(1) partial indexing to 80% of the C.P.I,
18(2) pass-through of unforeseen or uncontrollable costs of a cable licensee, and 18(4)-
18(6) Capital Investment Credit Plan which allows licensees to increase rates to recover
50% of eligible capital expenditures over a five-year window.
Beyond simplifying its approach to basic price regulation, there are two additional
changes implemented by the Regulations worth noting. In Section 8, regulatory classes for
the LSAs are defined based on subscribership: Class 1 (more than 6000 subscribers), Class
2 (between 2000 and 6000 subscribers), and Part 3 (less than 2000 subscribers). These
classes differ by their extent of basic price regulation. Class 1 licenses have more stringent
rules for allowable basic price increases than Class 2 licenses; Part 3 licenses are not price
regulated at all. Section 5 of the Regulations formalizes the “Transfer of Ownership and
Control” procedures that govern acquisitions. These rules require that cable licensees no-
tify the CRTC of transactions where more than 20% of voting shares for a cablesystem are
transferred.
1990-2010: The Digital Age, Technological Convergence, and Deregulation
The 1990’s bring major technological innovations as the industry moves into the Digital
Age. In 1990, Rogers becomes the first cable company in Canada to use fibre-optic cable,
a technology that significantly increases cable companies’ ability to offer many channels
across their LSAs.8 The Commission licenses the first Direct-to-Home (DTH) satellite ca-
ble services in 1995, with Bell ExpressVu being the first DTH provider to subsequently
enter the market in 1998. In response to the emergence of DTH cable service, as well as
growing demand for non-basic channels by the Canadian public, the CRTC holds a call for
8Fibre-optic cables also facilitate cable companies’ entry in the the market for telephone services a decadelater.
8
applications for new specialty and pay television channels in 1994.9 Fifty applications are
submitted, that results in the licensing of eight new specialty channels and two pay chan-
nels. For example, these new channels include Bravo!, Showcase, The Country Network,
and The Discovery Channel.
Through the late 1990’s and early 2000’s the industry enters the Information Age,
and the industry-labelled “Technological Convergence” accelerates as telecommunications
companies such as cable, phone and satellite providers continue to converge in terms of the
products they offer. Digital cable arrives in 1997, as Shaw Cable is the first company to
offer digitally-enhanced services to its subscribers in Western Canada. Canada’s major tele-
phone provider, Bell, is licensed by the CRTC in 1995 to offer cable television and begins
offering its service to local cable markets in 1997. The entry of Bell into the market for ca-
ble television represents the first competitive threat to established cable companies within
their LSAs. Conversely, cable companies enter the market for telephone services during
this period as Bragg Communications becomes the first major Canadian cable company to
offer local telephone service over its fibre optic network in 1999. In the following year
Bragg becomes one of the first telecommunications companies in North America to bundle
digital cable, internet and phone services.10 Heading into this era, the CRTC releases an
important Public Notice on “New Media” on May 17, 1999, which clarifies its stance as
a national regulator on services delivered over the Internet (or “new media”), and how it
relates to the Broadcasting Act.11 The main conclusion of the CRTC is media activities on
the Internet are not to be regulated under the Broadcasting Act.
9See CRTC Public Notice 1994-59 at http://crtc.gc.ca/eng/archive/1994/PB94-59.htm.10See http://www.eastlink.ca/about/milestones/index.asp.11See Broadcasting Public Notice 1999-84 and Telecom Public Notice 99-14 at
http://www.crtc.gc.ca/eng/archive/1999/PB99-84.htm.
9

The exclusive licensing scheme set out in the 1968 Broadcasting Act begins being dis-
mantled in 2001 with the release of Public Notice 2001-59 by the Commission. The Com-
mission introduces two initiatives; one to completely deregulate smaller/rural LSAs, and
the second to replace the territorial licensing of broadcast undertakings with a regional
licensing scheme. This regulatory overhaul is mainly a response to the emergence of dom-
inant regionally-based cable companies in Canada, and increased competition in the indus-
try from telephone and DTH satellite companies. The regional licensing scheme requires
firms to hold one license for all of their LSAs within each LSA class for a given region.12
Instead of having up to hundreds of individual licenses for all the territories served by dom-
inant firms such as Rogers, Shaw, and Cogeco, they now have at most three licenses within
a given region in Canada, which significantly reduces their regulatory burden. These regu-
latory changes are carried out in CRTC Decisions 2002-45 and 2004-382, when the CRTC
revokes the local licenses and associated regulation for all Part 3 and Class 2 LSAs in 2002
and 2004 respectively.
Looking to the future, the CRTC’s most recent comprehensive stance on the trajectory
of broadcasting and telecommunications in Canada is contained in the December 2006 re-
port entitled “The Future Environment Facing the Canadian Broadcasting System.”13 As
outlined in the report, the rapid growth of over-the-air Digital Signals, High Definition
Television, Internet Protocol Television, and the offering of handheld devices by cable and
telephone companies has created a myriad of regulatory challenges for the CRTC. In the
face of such rapid technical and regulatory change in broadcasting and telecommunica-
tions, the Federal Government issues a Telecommunications Policy Review for Canada in
12The CRTC divided Canada into five regions: Region 1: British Columbia, the Yukon, Nunavut, theNorthwest Territories; Region 2: Alberta, Saskatchewan, and Manitoba; Region 3: Ontario; Region 4:Quebec; Region 5: New Brunswick, Nova Scotia, Prince Edward Island, and Newfoundland.
13This detailed report is found online at http://www.crtc.gc.ca/eng/publications/reports/broadcast/rep061214.htm.
10

2007.14 The Government of Canada’s overall message to the CRTC is to “accelerate the
pace of deregulation of competitive telecommunications markets” and “to rely on market
forces as much as possible to achieve the policy objectives of the Telecommunications Act.”
In short, the Federal government wants to ensure that (de)regulatory reform keeps pace with
technical change, while maintaining affordability and sufficient Canadian content for con-
sumers of various forms of media. The proposal for a more market-oriented approach to
governing broadcasting and telecommunications in Canada stands in stark contrast to the
history of heavy regulation. Recently, this new regulatory approach has come to the fore-
front with additional proposals to reduce the stringency of foreign ownership restrictions
of broadcasting and telecommunications companies in Canada.15
2.2 The Dataset
Turning to empirics, I now describe the dataset that is the focal point of the dissertation.
For completeness, I provide details on all variables used throughout this thesis in Table A.2
of the Appendix.
The primary data source is the CRTC Master Files for the 1986-1996 period.16 They
contain detailed information on firms’ revenues, costs, number of households, and sub-
scribership, broken down by basic and non-basic services, and are at the LSA, year level
14The Policy Review can be found at http://www.telecomreview.ca/eic/site/tprp-gecrt.nsf/eng/rx00069.html.
15See for example “Tories to launch plans for telecom shakeup” (2010, June 4), The Globe and Mail.Interestingly, the demarcation of “telecommunications” and “broadcasting” in Canada that has been main-tained since the Telecommunications Act of 1993 has been brought into question since these proposed reducedforeign ownership restrictions only apply to telecom (i.e. phone and internet) companies, and not cable com-panies. See “Can’t separate telecom, broadcasting: CRTC head” (2010, June 8), The Globe and Mail.
16Stephen Law graciously provided these data. They have been previously used in Law (1999) and subse-quent papers. To the best of my knowledge, these data are not publicly available from 1997 onwards, withthe exception of the data collected by the private marketing firm Media Stats (http://www.mediastats.com/).
11

of aggregation. The data also have unique identifiers and location names for all LSAs and
cable companies which is useful for matching the other data sources listed below to the
Master Files dataset. The information contained in the Master Files is collected and ver-
ified by Statistics Canada on behalf of the CRTC through cable companies’ submission
of “Annual Return of Broadcasting Distribution Licensee” forms. An example of one of
these forms for 2006 is provided in Figure A.1 in Appendix A. Having access to these
forms is helpful in understanding exactly how the variables contained in the Master Files
are constructed.
The second data source is the CRTC’s Decision and Notices (DNO) archives.17 For
each LSA, the CRTC maintains searchable archives online for all LSA-ownership related
decisions from 1984 onwards. Example decision files include new license applications, li-
cense renewals and revocations, as well as license buyouts among cable companies. Using
these decision files, I track the current cable operator (if there is one) for all 1262 LSAs
defined in the Master Files over the 1985-2004 period. For each acquisition, I record the
acquisition date, the identity of the buying and selling firms, the LSAs involved, and the
transaction price (where available). I also identify new entrant cable companies in the sam-
ple. Although the Master Files contain information on how licenses are allocated across
firms in a given year, it is important for my empirical analysis that the exact timing of
acquisition and entry decisions, as well as the firms and locations involved, be accurately
recorded. Further, the information contained in the Decision and Notice files allows me
to identify the subsidiaries of large cable companies that differ by name from their parent
company. The Master Files often fail to distinguish subsidiaries from their parent compa-
nies, which would otherwise undermine calculation of the number of subscribers a firm has
nationally. Figures A.2 and A.3 in the Appendix provide examples of acquisition files that17All of the CRTC’s Decisions and Notices are documented online at http://www.crtc.gc.ca/eng/dno.htm.
12

I use to construct these data.
I also collect information from the 1986, 1991, 1996, and 2001 Canadian Censuses
on the total number of households, average household income, average household size,
average age, unemployment rate, educational attainment (fraction of population with post-
secondary education), and urban density (population per square kilometre). These data
are obtained using the program PCensus (http://www.tetrad.com/software/pcensus/). The
LSA name identifiers are matched to their corresponding Census Subdivision to obtain the
above Census aggregates at the LSA level. I use the 1996 Geosuite package from Statistics
Canada to track location-specific household counts and urban density as it provides a more
accurate measure of the local population and urban density than what a location’s Census
Subsidivision yields.18 Moreover, Geosuite provides data for 1991 household counts and
urban density, correcting for differences in Census boundaries between Census years. For
non-Census years, I follow Holmes (2010) and impute a census variable xt according to
the following weighted average: xt =(
T2−tT2−T1
)xT1 +
(t−T1
T2−T1
)xT2 for t ∈ (T1, T2), where
T2 > T1 are Census years 1 and 2. Geographic information on LSA latitudes and longitudes
are obtained using location name searches from Google Maps (http://maps.google.com/).19
For my empirical analyses, I require a measure of a firm’s national subscribership in
a given year (i.e. the total number of subscribers across all LSAs that a cable company
currently operates in). The total number of subscribers is relatively well-reported, as I
have information on these figures for all 1262 LSAs in the Master Files. Using these
data, and Census information on the total number of households in a given location, I
interpolate missing years’ subscribership data. This provides an estimate of market size18Documentation on the 1996 Geosuite package is listed at http://geodepot.statcan.ca/Diss/Data/GeoSuite/GeoSuite e.cfm19I obtain the centre of a location by doing a name search for a LSA, and then use the script
javascript:void(prompt(’’,gApplication.getMap().getCenter())). Ideally, I woulduse geo-coded maps containing LSA boundaries to track the ‘location’ of LSAs in the sample, however inmy discussions with the CRTC, it has become evident that no such maps exist.
13
for all locations over the entire 1986-2004 period, which allows me to estimate a firm’s
national subscribership for every year.
2.3 Descriptive Statistics
2.3.1 Market Structure
Table 2.1 summarizes annual entry and acquisition activity at the firm and LSA level from
1986 to 2004. At the firm level, there is a very active entry during the late 1980’s after
which firm entry slows and continues throughout the sample until 2001. The net effect of
firm entry and acquisition causes the number of firms to rise then fall over time from 408
cable companies in 1986 to 280 firms in 2004. LSA entry and acquisitions show a similar
pattern. Cable companies actively expand into new geographic licenses in the early part of
the sample and LSA acquisitions remain active throughout.
The persistent acquisitions reported in Table 2.1 point to the fact that the industry is con-
solidating over time. Table 2.2 further illustrates this fact by reporting the shares of LSA
and subscribers served nationally from 1986 to 2004 by the 6 largest cable companies in of
terms national subscribership in 2004.20 Collectively, the largest firms increase their pres-
ence nationally over time from owning 6% of the LSAs in 1986 to over 60% of the LSAs in
2004, as illustrated in the top panel of Table 2.2. In terms of national subscribership, the six
largest firms increase their national presence from serving 42% of all subscribers in 1986 to
92% in 2004. Specifically, Persona and Cogeco respectively experience the most growth in
LSA ownership and subscribership. Amongst the larger cable companies, the firms differ
20For brevity, I only report numbers for 1986, 1992, 1998 and 2004 in Table 2.2. In the Appendix I producefigures for all years between 1986 and 2004 in Table A.3.
14

Table 2.1: Trends in Market Structure
Firm-Level Tabulations LSA-Level TabulationsYear Firms Entries Acquisitions LSAs Entries Acquisitions
1986 408 40 6 1262 119 71987 448 54 15 1262 108 151988 483 53 30 1262 122 771989 464 20 43 1262 25 611990 432 17 55 1262 16 1581991 416 18 41 1262 20 581992 421 21 28 1262 22 611993 423 22 25 1262 19 311994 419 15 25 1262 9 371995 402 11 45 1262 9 1751996 384 9 30 1262 4 431997 375 5 26 1262 0 871998 359 4 28 1262 0 771999 342 3 31 1262 0 1262000 326 4 23 1262 0 1292001 293 5 49 1262 0 2062002 286 1 12 1262 0 352003 283 0 1 1262 0 12004 280 0 4 1262 0 44
Total - 302 517 - 473 1428
Notes: Statistics based on data collected from the CRTC’s Decisions and Notices from 1985-2004 (inclusive).
substantially in their shares of LSAs and national subscribership. Although Persona oper-
ates in a relative large share of LSAs (20.21% in 2004), it has a relatively small share of
national subscribership (4.72% in 2004), reflecting the fact that Persona specializes in op-
erating rural licenses. Conversely, Rogers cable owns a relatively small share of the LSAs
nationally (7% in 2004), but has a large share of national subscribership (29% in 2004) as
it mainly draws its subscribership from a collection of densely populated LSAs in Southern
Ontario by 2004.
15
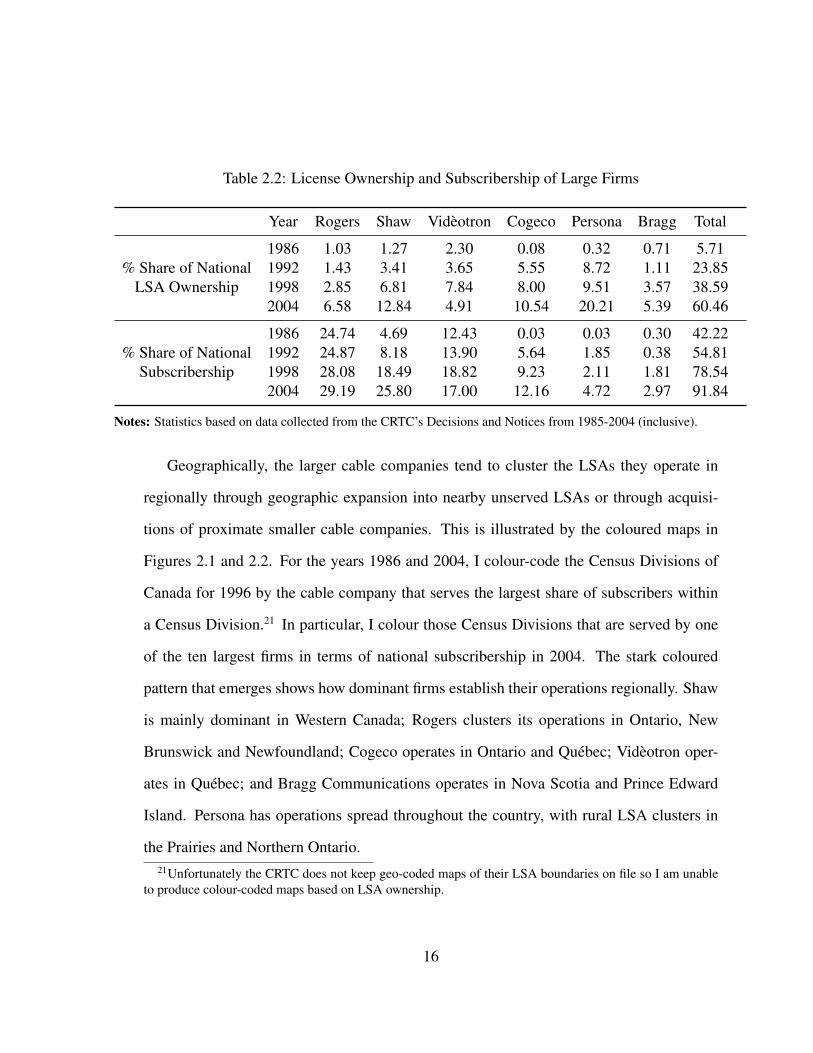
Table 2.2: License Ownership and Subscribership of Large Firms
Year Rogers Shaw Videotron Cogeco Persona Bragg Total
1986 1.03 1.27 2.30 0.08 0.32 0.71 5.71% Share of National 1992 1.43 3.41 3.65 5.55 8.72 1.11 23.85
LSA Ownership 1998 2.85 6.81 7.84 8.00 9.51 3.57 38.592004 6.58 12.84 4.91 10.54 20.21 5.39 60.46
1986 24.74 4.69 12.43 0.03 0.03 0.30 42.22% Share of National 1992 24.87 8.18 13.90 5.64 1.85 0.38 54.81
Subscribership 1998 28.08 18.49 18.82 9.23 2.11 1.81 78.542004 29.19 25.80 17.00 12.16 4.72 2.97 91.84
Notes: Statistics based on data collected from the CRTC’s Decisions and Notices from 1985-2004 (inclusive).
Geographically, the larger cable companies tend to cluster the LSAs they operate in
regionally through geographic expansion into nearby unserved LSAs or through acquisi-
tions of proximate smaller cable companies. This is illustrated by the coloured maps in
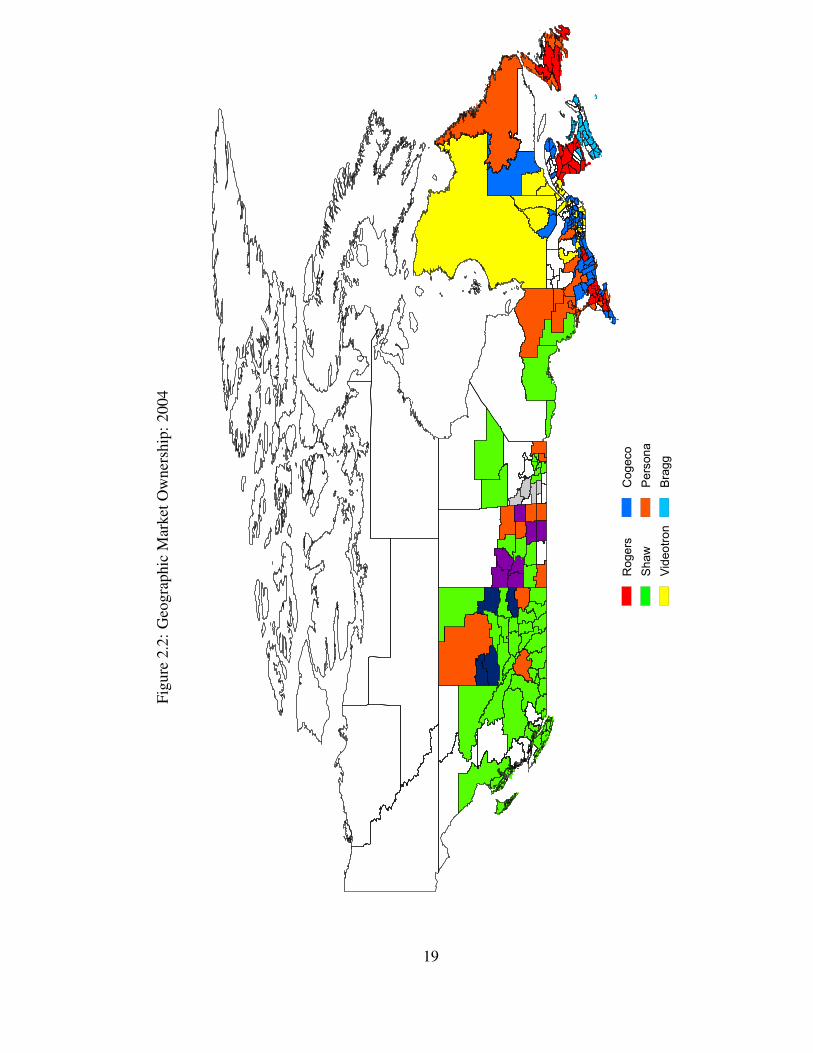
Figures 2.1 and 2.2. For the years 1986 and 2004, I colour-code the Census Divisions of
Canada for 1996 by the cable company that serves the largest share of subscribers within
a Census Division.21 In particular, I colour those Census Divisions that are served by one
of the ten largest firms in terms of national subscribership in 2004. The stark coloured
pattern that emerges shows how dominant firms establish their operations regionally. Shaw
is mainly dominant in Western Canada; Rogers clusters its operations in Ontario, New
Brunswick and Newfoundland; Cogeco operates in Ontario and Quebec; Videotron oper-
ates in Quebec; and Bragg Communications operates in Nova Scotia and Prince Edward
Island. Persona has operations spread throughout the country, with rural LSA clusters in
the Prairies and Northern Ontario.21Unfortunately the CRTC does not keep geo-coded maps of their LSA boundaries on file so I am unable
to produce colour-coded maps based on LSA ownership.
16

The main feature of the industry that induces firms to cluster their operations is po-
tential agglomeration/density economies in operating geographically proximate licenses.
For example, signals can be transmitted from a local head-end across many LSAs meaning
fixed operating costs from operating a head-end can potentially be spread across many lo-
cal markets. Figure A.3 provides an example of an acquisition that occurs for this reason.
The extent to which signals can be transmitted across locations is restricted by the fact
that signal quality deteriorates as the distance between the subscribers and the origin of a
channel’s signal grows. Economies of density can also be generated by cable companies’
ability to spread fixed administrative and technical/support services across local LSAs.
2.3.2 Cable Prices and Packages
Table 2.3 contains summary statistics for LSAs where only basic cable is offered (here-
after, one-bundle markets), and for those where both basic and non-basic cable are offered
(hereafter, two-bundle markets). Throughout, I use pj, qj, sj to represent prices, “quality”
(measured by channel counts), and market shares for cable bundle j.22 Basic packages are
indexed by j = 1 and non-basic packages by j = 2. The first panel shows that the aver-
age one-bundle market has 85% of its total population subscribing to basic cable, paying
$22.41 for the bundle and getting 15 channels.23 For an average two-bundle market, 43%
of consumers subscribe to only basic cable while 38% subscribe to both basic and non-
basic services. Basic bundles in two-bundle markets cost $19.25 and provide 21 channels
on average, while adding the non-basic bundle costs provides 8 additional channels for an
22This notation for cable prices, quality and shares is used in Chapter 4 below, so I employ it here forconsistency. Of course, raw channel counts can inaccurately measure cable quality if consumers’ derivedifferent levels of utility from different channels. Unfortunately, data on channel identity is not currentlyavailable for my sample.
23All dollar amounts are in 1992 constant dollars throughout.
17

Figu
re2.
1:G
eogr
aphi
cM
arke
tOw
ners
hip:
1986
Rogers
Shaw
Videotron
Cogeco
Persona
Bragg
18
Figu
re2.
2:G
eogr
aphi
cM
arke
tOw
ners
hip:
2004
Rogers
Shaw
Videotron
Cogeco
Persona
Bragg
19

extra $12.48.24 The top panel also shows that firms are generally not channel-capacity con-
strained within their LSAs as cable operators in one- and two-bundle markets respectively
use 66% and 77% of their total available channel capacity on average.
The second and third panels of Table 2.3 summarize market size, cost and demographic
data. One-bundle markets have 5,500 subscribers on average, while the average numbers
of homes passed (i.e. the total number of households currently hooked up to a local ca-
blesystem, not of all of which necessarily subscribe to cable) is 6,900. This compares to
averages of 10,420 and 12,910 subscribers and homes passed in two-bundle markets. This
difference in average market size for one- and two-bundle markets suggests that there are
additional fixed costs cable companies must pay to offer non-basic cable services.
The cost data show that on average a cable operator pays $2.94 cents per channel per
subscriber in affiliation payments to upstream non-basic channel providers. The final two
variables in the panel report sample averages for LSA-level per-subscriber labour and op-
erating expenses (i.e. sales, administration, technical, and local programming expenses).
For one-bundle markets average labour and operating expenditures are $29.34 and $196.18
per subscriber respectively, and for two-bundle markets they are $43.73 and $160.80. The
higher average labour cost for two-bundle markets suggests that there are additional labour
costs in offering non-basic cable. The lower per-subscriber operating costs suggest that
sunk expenditures for basic services can be also be applied to non-basic services. The cen-
sus data summary statistics in the third panel of Table 2.3 show that with the exception
of urban density, demographics are relatively similar across one- and two-bundle markets.
These statistics indicate that two-bundles are offered in relatively more urbanized markets.
24Note that there is a tying requirement whereby a consumer must subscribe to basic cable in order tosubscribe to non-basic cable services. The average price for non-basic cable consists of the $19.25 for basicservices, plus the additional $12.48 for non-basic cable, therefore yielding a total average price of $31.73 forthose consumers who subscribe to both basic and non-basic services.
20
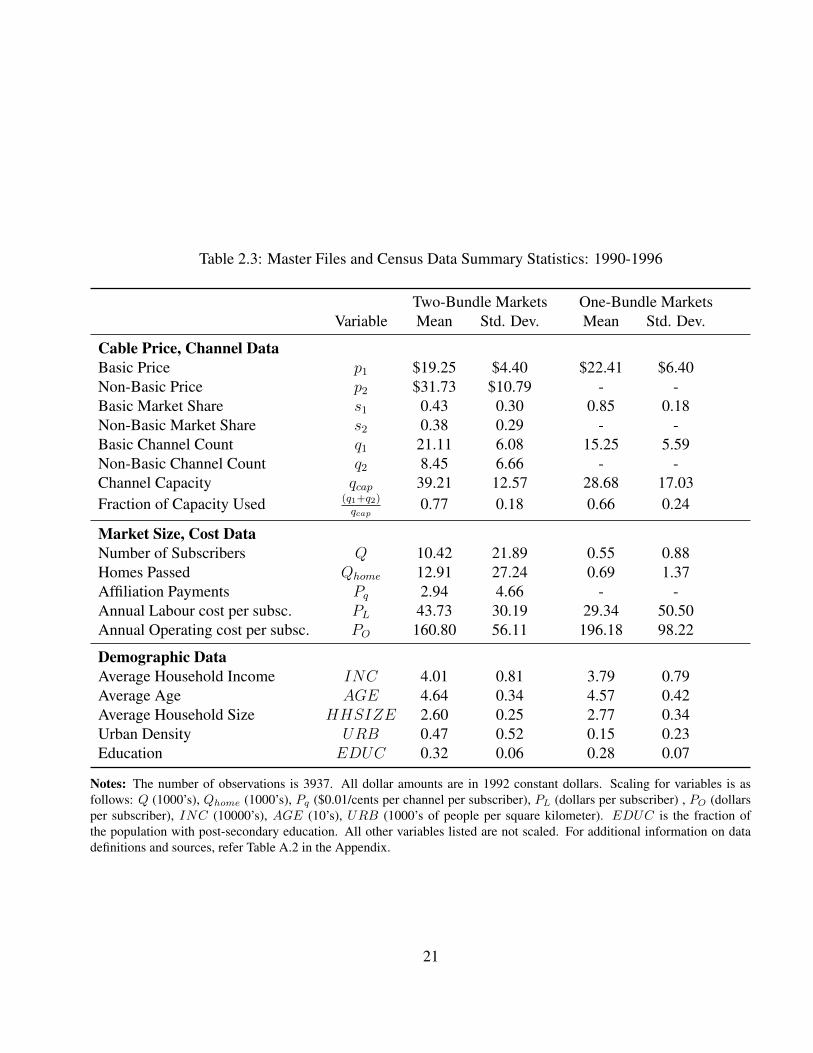
Table 2.3: Master Files and Census Data Summary Statistics: 1990-1996
Two-Bundle Markets One-Bundle MarketsVariable Mean Std. Dev. Mean Std. Dev.
Cable Price, Channel DataBasic Price p1 $19.25 $4.40 $22.41 $6.40Non-Basic Price p2 $31.73 $10.79 - -Basic Market Share s1 0.43 0.30 0.85 0.18Non-Basic Market Share s2 0.38 0.29 - -Basic Channel Count q1 21.11 6.08 15.25 5.59Non-Basic Channel Count q2 8.45 6.66 - -Channel Capacity qcap 39.21 12.57 28.68 17.03Fraction of Capacity Used (q1+q2)
qcap0.77 0.18 0.66 0.24
Market Size, Cost DataNumber of Subscribers Q 10.42 21.89 0.55 0.88Homes Passed Qhome 12.91 27.24 0.69 1.37Affiliation Payments Pq 2.94 4.66 - -Annual Labour cost per subsc. PL 43.73 30.19 29.34 50.50Annual Operating cost per subsc. PO 160.80 56.11 196.18 98.22
Demographic DataAverage Household Income INC 4.01 0.81 3.79 0.79Average Age AGE 4.64 0.34 4.57 0.42Average Household Size HHSIZE 2.60 0.25 2.77 0.34Urban Density URB 0.47 0.52 0.15 0.23Education EDUC 0.32 0.06 0.28 0.07
Notes: The number of observations is 3937. All dollar amounts are in 1992 constant dollars. Scaling for variables is asfollows: Q (1000’s), Qhome (1000’s), Pq ($0.01/cents per channel per subscriber), PL (dollars per subscriber) , PO (dollarsper subscriber), INC (10000’s), AGE (10’s), URB (1000’s of people per square kilometer). EDUC is the fraction ofthe population with post-secondary education. All other variables listed are not scaled. For additional information on datadefinitions and sources, refer Table A.2 in the Appendix.
21

Table 2.4 reports annual trends in cable package prices and channel counts from 1990 to
1996 for one- and two-bundle markets. For two-bundle markets, basic prices trend upward
over the sample, while non-basic prices follow a “U-shape,” initially falling in 1993-1994
and then rising through 1995-1996.25 The average channel counts in columns four and five
show that the number of channels offered in basic and non-basic services is rising over
time. These changes in bundle prices and channel counts partly reflect the increase in the
number of licensed non-basic services by the CRTC in the 1990’s, as discussed in section
2.1 above. There is considerably more growth in the number of non-basic channels offered,
which more than doubles from 1990 to 1996. The market share averages in columns six
and seven provide evidence of consumer switching in response to the enriched non-basic
services over time. Between 1990 and 1996, the share of consumer subscribing to basic-
only services falls by 25%, while non-basic subscription rates rise by 64%. One-bundle
markets see an increase in their average price from $20.81 in 1990 to $24.20 in 1996,
and basic packages experience more than a 50% increase in average channel offerings
from approximately 12 to 19 channels. Within one-bundle markets, the share of consumers
purchasing basic service out of all homes passed is stable, hovering between 84% and 86%.
Another pattern of interest is how LSA-level cable prices, channels and demographics
vary with the size of cable companies. There is an exhaustive empirical literature on the
cable television industry for the U.S. that finds larger horizontal firm size reduces cable
companies’ channel costs which in turn affects the prices and composition of their cable
bundles.26 Scale effects in marginal costs arise through negotiations over per-subscriber
channel prices between upstream channel providers and downstream cable companies.
Larger firms are in better negotiating positions as they can offer larger audiences to channel25Recall these amounts are in real terms (1992=100).26See for example Chipty (1995), Ford and Jackson (1997), Chipty and Snyder (1999), and Crawford and
Yurukoglu (2010).
22

Table 2.4: Trends in Cable Prices and Channel Offerings
Year p1 p2 q1 q2 s1 s2
Two-Bundle Markets1990 17.91 32.13 20.08 5.89 0.52 0.281991 18.25 32.23 20.40 6.18 0.54 0.281992 18.97 31.09 20.45 7.28 0.46 0.351993 19.48 29.92 20.27 8.39 0.38 0.441994 19.82 30.26 21.03 8.91 0.36 0.451995 19.97 32.84 22.15 10.98 0.37 0.431996 20.13 33.20 23.57 11.32 0.39 0.46
One-Bundle Markets1990 20.81 - 12.08 - 0.84 -1991 22.15 - 13.75 - 0.84 -1992 22.52 - 14.97 - 0.84 -1993 23.23 - 15.25 - 0.84 -1994 22.87 - 15.69 - 0.84 -1995 22.62 - 17.83 - 0.86 -1996 24.20 - 18.65 - 0.85 -
Notes: Yearly means presented in each column. All dollar amounts are in 1992 constant dollars.
providers, who in turn are concerned with viewership for the advertisements they air be-
tween their shows. Recent findings by Crawford and Yurukoglu (2010) suggest that large
U.S. cable companies such as Comcast obtain up to 13% lower channel costs than smaller
cable operators.
Table 2.5 illustrates the impact of firms’ size on cable bundles by presenting sample
means for LSA-level cable prices, channels, market shares and demographics conditional
on whether a market is served by one of the ten largest firms (or “large firms”) by national
23

Table 2.5: Prices and Packages of Large and Small Firms
Two-Bundle Markets One-Bundle MarketsVariable Big 10 Not Big 10 Big 10 Not Big 10
p1 18.53 19.62 20.10 22.54p2 30.41 32.41 - -s1 0.34 0.48 0.86 0.85s2 0.45 0.34 - -q1 22.89 20.20 20.22 15.07q2 12.11 6.57 - -
Q 19.67 5.68 0.72 0.55INC 4.18 3.91 3.66 3.81AGE 4.60 4.65 4.60 4.56
HHSIZE 2.57 2.61 2.69 2.77URB 0.68 0.37 0.30 0.15
EDUC 0.33 0.31 0.34 0.28
Notes: Means for each variable are presented in each column. All dollar amounts are in 1992 constant dollars.All other variables are scaled as noted in the footnote of Table 2.3.
subscribership in 1996.27 The patterns for cable bundles are clear for both one- and two-
bundle markets; larger cable companies offer more channels in their packages for lower
prices on average. The differences are most stark for channel counts; large firms offer
nearly double the number of non-basic channels on average in two-bundle markets, and
36% more basic channels in one-bundle markets. Relatedly, large firms on average tend
to have a larger share of subscribers out of all homes passed in one-bundle markets, and
a larger relative share of consumers buying non-basic packages in two-bundle markets. In
fact, the majority of consumers in two-bundle markets served by large cable companies
subscribe to non-basic cable on average, while the opposite is true for two-bundle markets
27I denote firms outside of the largest ten as “small firms.” The findings from this table are consistent forvarious definitions of “large” firms (top five, ten, twenty, thirty, etc.). The ten firms comprising the largefirms are Rogers, Shaw, Videotron, Cogeco, C.F. Cable, Telecable Des Milles-Iles, Cablecasting, VideonCablesystems, and Cablenet .
24

served by smaller firms. The bottom panel of Table 2.5 shows that on average, large cable
companies tend to serve markets with a larger subscriber base and higher urban density.
The differences in other demographics across markets served by large and non-large firms
are negligible. Taken together, the results from this table are suggestive of scale effects
on cable prices and bundle composition. Chapter 4 further investigates the extent to which
channel cost reducing scale effects are responsible for these differences.
2.4 Determinants of Acquisitions
The summary statistics describe a consolidation process where large cable companies ac-
quire small cable companies over time. Further, acquiring companies target small firms
whose LSAs are geographically proximate to their own cable systems, which leads to the
observed clustering of cable ownership in 2004. These two facts suggest that economies of
scale and density affect firms’ merger decisions. To formally investigate the determinants
of mergers, I estimate the following bivariate probit model that predicts the probability that
firm i and j enter into a merger in year t:
a∗ijt = Xijtβ1 + εijt; aijt = 1a∗ijt > 0 (2.1)
a∗jit = Xijtβ2 + εjit; ajit = 1a∗jit > 0 (2.2)
The term 1· is an indicator function, a∗ijt is firm i’s latent utility from entering a merger
with firm j in year t, and aijt is firm i’s binary decision to agree to enter an i − j merger
in year t (and vice-versa with a∗jit and ajit for firm j). The error terms are assumed to
be drawn from a mean-zero bivariate normal distribution, with normalized variances equal
to one and correlation coefficient ρ. In the data, the aijt decisions are partially observed
25

since I only observe acquisitions where both aijt and ajit equal one. To accommodate this
partial observability, I estimate equations 2.1 and 2.2 using the Poirier (1980) bivariate
probit model. 28
I include three variables of interest in Xij related to potential merging firms’ relative
size and geographic proximity of their LSAs. The size variables are ∆Qijt = Qit − Qjt
and (∆Qijt)2), where Qit is the number of subscribers firm i has nationally in year t. Dif-
ferences in firm size between two merging firms serve as a proxy for gains from a merger
due to economies of scale. Including the square of firm size differences in Xij allows me
to see if these returns are increasing or decreasing in the size differential between merging
parties. My economies of density variable is constructed as: densij =∑
`∈Lit
∑`′∈Ljt
1d``′
where Lit and Ljt are the sets of LSAs owned by firm i and j in year t respectively, and
d``′ is the Great Circle Distance between LSA ` and `′, as measured using their coordi-
nates from name searches with Google Maps. I focus on local density effects by setting
d``′ = ∞ for d``′ > 100 km. This measure of geographic complementarity between firms
i and j is similar to that used by Jia (2008). I also include dummy variables for years and
“regions” in Canada to account for year- and region-specific factors that drive acquisition
behaviour. These regions are broadly defined (ten total) and are constructed using the Cen-
sus Economic Regions from Statistics Canada for 2001. They are listed in Table A.1 of the
Appendix.
I estimate the model under two restrictions to simplify the estimation procedure and
interpretation of the results. First, following Brasington (1999), I estimate the model un-
der the restriction that both sides of a merger use the same decision making model, i.e.
β1 = β2. Second, I assume firms only consider merger partners whose LSAs are located
28Brasington (1999) uses this empirical model to study spatial patterns in the consolidation of schooldistricts in the major metropolitan areas of Ohio.
26

Table 2.6: Determinants of Mergers
Parameter MarginalVariable Estimate Effect
∆ Qijt 0.104∗∗∗ 0.083∗∗∗
(0.013) (0.011)(∆ Qijt)
2 -0.037∗∗∗ -0.029∗∗∗
(0.006) (0.005)densijt 0.101∗∗∗ 0.081∗∗∗
(0.021) (0.016)Constant 0.001 -
(0.001) -ρ 0.897 -
(1.414) -Year Fixed Effects Y YRegion Fixed Effects Y Y
P (aijt = 1, ajit = 1|Xijt) 0.021LL -1460.600N 15667# Acquisitions 340
Notes: ***, **, * indicate statistical significance at the 1%, 5%, and 10% levels respectively. Standard errorsare reported in parentheses. The total number of subscribers Qij is in terms of millions.
in the region they operate in. This assumption allows me to greatly reduce the size of the
set of potential mergers when computing the likelihood for the model. For firms that are
located in multiple regions of Canada, I assume there is a regional manager that makes
within-region acquisition decisions for a firms regional subsidiary. These regional man-
agers make merger decisions in isolation, ignoring the simultaneous merger decisions of
the firm’s other regional managers across Canada. This assumption is very much in-line
with how acquisition decisions for large firms are made in practice. In fact, the raw data
assigns different firm identifiers to the regional subsidiaries of the large cable companies
like Rogers, Shaw, Cogeco, Persona.
27

The estimation results and corresponding marginal effects (computed at sample means)
are presented in Table 2.6. I find that economies of scale and density have positive impact
on the probability that two cable companies merge, with statistically significant estimates
and marginal effects at the one-percent level (evaluated at sample means). The estimates
for differences in firm size and its square show that the larger the difference in firm size
between two firms, the more likely they are to merge. However this size effect is diminish-
ing as the difference in firm size grows. The marginal effect from the linear term on ∆ Qij
implies an increase in the probability of acquisition by 8.3%, which is four times the mean
predicted acquisition probability of 2%. Similarly, the marginal effect of densij increases
the probability of acquisition by 8.1%
2.5 The Effect of Acquisitions on Cable Bundles
It is also of interest to see what effect acquisitions have on cable price, channels offered,
market shares and channel costs (non-basic affiliation payments per subscriber per month
denoted by affilpay2). I investigate these effects empirically using the following regression
that predicts y`kt for license ` served by cable company k at time t:
yk`t = β0 + β1A`t + β2Qkt +Xk`tβ3 +Dtβ4 + FE` + εk`t (2.3)
I separately estimate (2.3) for two and one-bundle markets for each of y`kt ∈ p1, p2, q1, q2, s1,
s2, affilpay2.29 The covariates of interest are a dummy variable A`t which equals one if
29Throughout this section, I focus on a subsample of LSAs that do not experience a change in the numberof products offered (i.e., locations that do not switch from one to two-bundle markets or vice versa) over the1990-1996 period. In total, 18 out of 784 LSAs experience such a change in the number of products offered.None of these changes correspond to an acquisition. The estimation samples for one and two-bundle marketsafter removing these locations contain 891 and 2790 observations, respectively.
28

LSA ` is acquired in year t and all years thereafter, and the horizontal size of firm k in
LSA ` in year t, Qkt (i.e., firm k’s national subscribership). The vector Xk`t consists
of location and firm control variables including average household income, average age,
average household size, the proportion of the population with post-secondary education,
urban density, the number of homes passed, and a dummy variable equalling one if firm
k is a multi-system operator. To account for year and location unobserved heterogeneity,
I include time and LSA fixed effects (respectively, Dt and FE`). The final term εk`t is
an idiosyncratic error term. Under this LSA fixed-effects specification, the identification
of β1 relies on within license variation over time in basic and non-basic prices, channel
counts, market shares and affiliation payments before and after an acquisition. Within li-
cense variation in the various dependent variables and firm size, which is mainly generated
by acquisitions, is what identifies β2.
2.5.1 Results
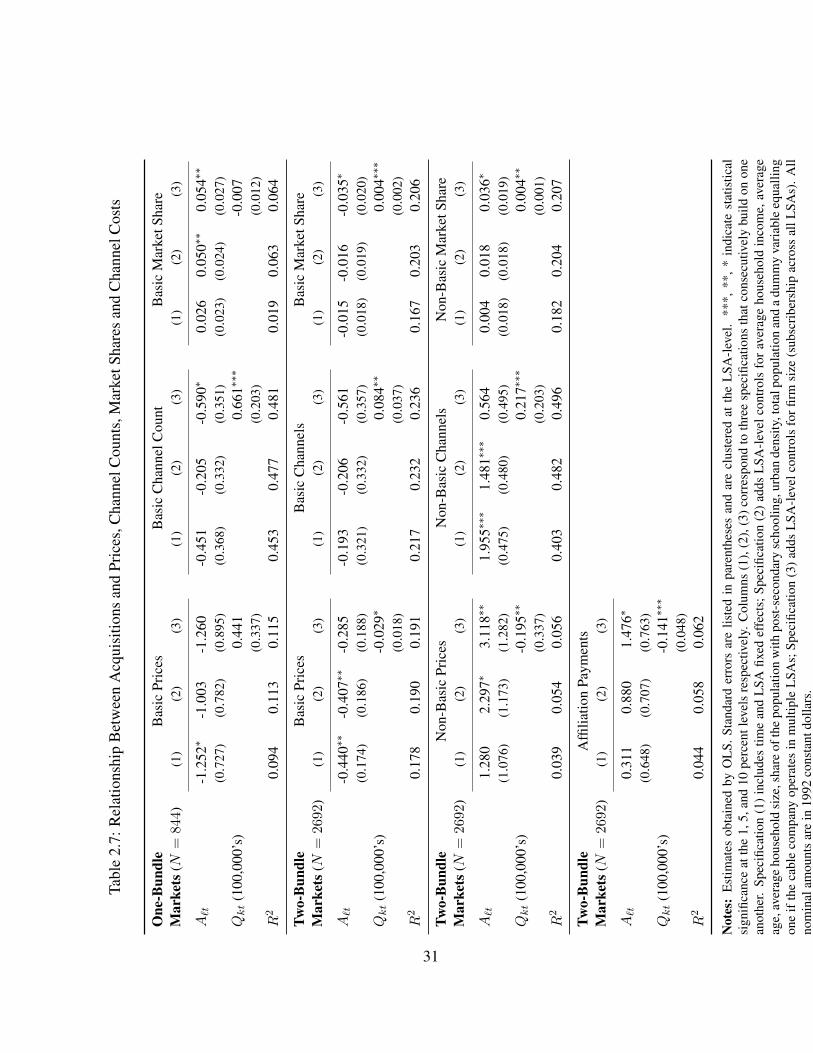
Table 2.7 presents the OLS estimates for β1 and β2 for each dependent variable using three
different specifications. Specification (1) includes the merger dummy and a full set of year
and LSA fixed effects. Specification (2) adds the vector of LSA and firm specific controls
(Xk`t) and specification (3) adds cable operator firm size (Qkt). Comparing the estimates
for β1 across specifications (1) and (2) shows that controlling for local factors beyond
the location-specific fixed effects does not have large impact on the results. The sign of
all the estimates remain the same, and the magnitudes and statistical significances of the
estimates are comparable. Overall, the estimates from the top panel in Table 2.7 indicate
that following acquisitions, one-bundle markets experience small declines in basic prices
29

and channel counts, and a slight 5.0% increase in basic market shares. The results for two-
bundle markets in the second and third panels suggest that basic prices and channels counts
slightly fall following acquisitions, while non-basic prices and channel counts experience
relatively large, statistically significant increases of $2.30 and 1.48, respectively. Affiliation
payments are also predicted to rise by $0.88 per-subscriber following mergers, though the
change is not statistically significant.
By comparing the results for specifications (2) and (3), I can assess the extent to which
merger effects correspond to merger-induced changes in horizontal firm size of a LSA’s
local monopolist. The estimates of β1 and β2 in the top panel of Table 2.7 show that
basic prices and channel counts are still predicted to fall with acquisitions in one-bundle
markets, however the firm size effects suggest that larger firms tend to offer more basic
channels at higher prices (though only the estimates for the basic channel count equation
are statistically significant).
For example, if the median-sized company operating in a one-bundle market in 1993
(Tofino Television) is acquired by its nearby regionally dominant firm (Shaw Cable) the
coefficient estimates predict that basic prices and channel counts would respectively fall
and rise by $1.68 and 3.82 channels, respectively. The predicted change in market shares
remain similar for one-bundle markets under column (3) (subscription rates rise by 5.3%)
with firm size having a negligible effect.
30
Tabl
e2.
7:R
elat
ions
hip
Bet
wee
nA
cqui
sitio
nsan
dPr
ices
,Cha
nnel
Cou
nts,
Mar
ketS
hare
san
dC
hann
elC
osts
One
-Bun
dle
Bas
icPr
ices
Bas
icC
hann
elC
ount
Bas
icM
arke
tSha
reM
arke
ts(N
=84
4)(1
)(2
)(3
)(1
)(2
)(3
)(1
)(2
)(3
)
A`t
-1.2
52∗
-1.0
03-1
.260
-0.4
51-0
.205
-0.5
90∗
0.02
60.
050∗∗
0.05
4∗∗
(0.7
27)
(0.7
82)
(0.8
95)
(0.3
68)
(0.3
32)
(0.3
51)
(0.0
23)
(0.0
24)
(0.0
27)
Qkt
(100
,000
’s)
0.44
10.
661∗∗∗
-0.0
07(0
.337
)(0
.203
)(0
.012
)R
20.
094
0.11
30.
115
0.45
30.
477
0.48
10.
019
0.06
30.
064
Two-
Bun
dle
Bas
icPr
ices
Bas
icC
hann
els
Bas
icM
arke
tSha
reM
arke
ts(N
=26
92)
(1)
(2)
(3)
(1)
(2)
(3)
(1)
(2)
(3)
A`t
-0.4
40∗∗
-0.4
07∗∗
-0.2
85-0
.193
-0.2
06-0
.561
-0.0
15-0
.016
-0.0
35∗
(0.1
74)
(0.1
86)
(0.1
88)
(0.3
21)
(0.3
32)
(0.3
57)
(0.0
18)
(0.0
19)
(0.0
20)
Qkt
(100
,000
’s)
-0.0
29∗
0.08
4∗∗
0.00
4∗∗∗
(0.0
18)
(0.0
37)
(0.0
02)
R2
0.17
80.
190
0.19
10.
217
0.23
20.
236
0.16
70.
203
0.20
6
Two-
Bun
dle
Non
-Bas
icPr
ices
Non
-Bas
icC
hann
els
Non
-Bas
icM
arke
tSha
reM
arke
ts(N
=26
92)
(1)
(2)
(3)
(1)
(2)
(3)
(1)
(2)
(3)
A`t
1.28
02.
297∗
3.11
8∗∗
1.95
5∗∗∗
1.48
1∗∗∗
0.56
40.
004
0.01
80.
036∗
(1.0
76)
(1.1
73)
(1.2
82)
(0.4
75)
(0.4
80)
(0.4
95)
(0.0
18)
(0.0
18)
(0.0
19)
Qkt
(100
,000
’s)
-0.1
95∗∗
0.21
7∗∗∗
0.00
4∗∗
(0.3
37)
(0.2
03)
(0.0
01)
R2
0.03
90.
054
0.05
60.
403
0.48
20.
496
0.18
20.
204
0.20
7
Two-
Bun
dle
Affi
liatio
nPa
ymen
tsM
arke
ts(N
=26
92)
(1)
(2)
(3)
A`t
0.31
10.
880
1.47
6∗
(0.6
48)
(0.7
07)
(0.7
63)
Qkt
(100
,000
’s)
-0.1
41∗∗∗
(0.0
48)
R2
0.04
40.
058
0.06
2
Not
es:
Est
imat
esob
tain
edby
OL
S.St
anda
rder
rors
are
liste
din
pare
nthe
ses
and
are
clus
tere
dat
the
LSA
-lev
el.
***,
**,
*in
dica
test
atis
tical
sign
ifica
nce
atth
e1,
5,an
d10
perc
entl
evel
sre
spec
tivel
y.C
olum
ns(1
),(2
),(3
)cor
resp
ond
toth
ree
spec
ifica
tions
that
cons
ecut
ivel
ybu
ildon
one
anot
her.
Spec
ifica
tion
(1)
incl
udes
time
and
LSA
fixed
effe
cts;
Spec
ifica
tion
(2)
adds
LSA
-lev
elco
ntro
lsfo
rav
erag
eho
useh
old
inco
me,
aver
age
age,
aver
age
hous
ehol
dsi
ze,s
hare
ofth
epo
pula
tion
with
post
-sec
onda
rysc
hool
ing,
urba
nde
nsity
,tot
alpo
pula
tion
and
adu
mm
yva
riab
leeq
ualli
ngon
eif
the
cabl
eco
mpa
nyop
erat
esin
mul
tiple
LSA
s;Sp
ecifi
catio
n(3
)ad
dsL
SA-l
evel
cont
rols
for
firm
size
(sub
scri
bers
hip
acro
ssal
lLSA
s).
All
nom
inal
amou
nts
are
in19
92co
nsta
ntdo
llars
.
31
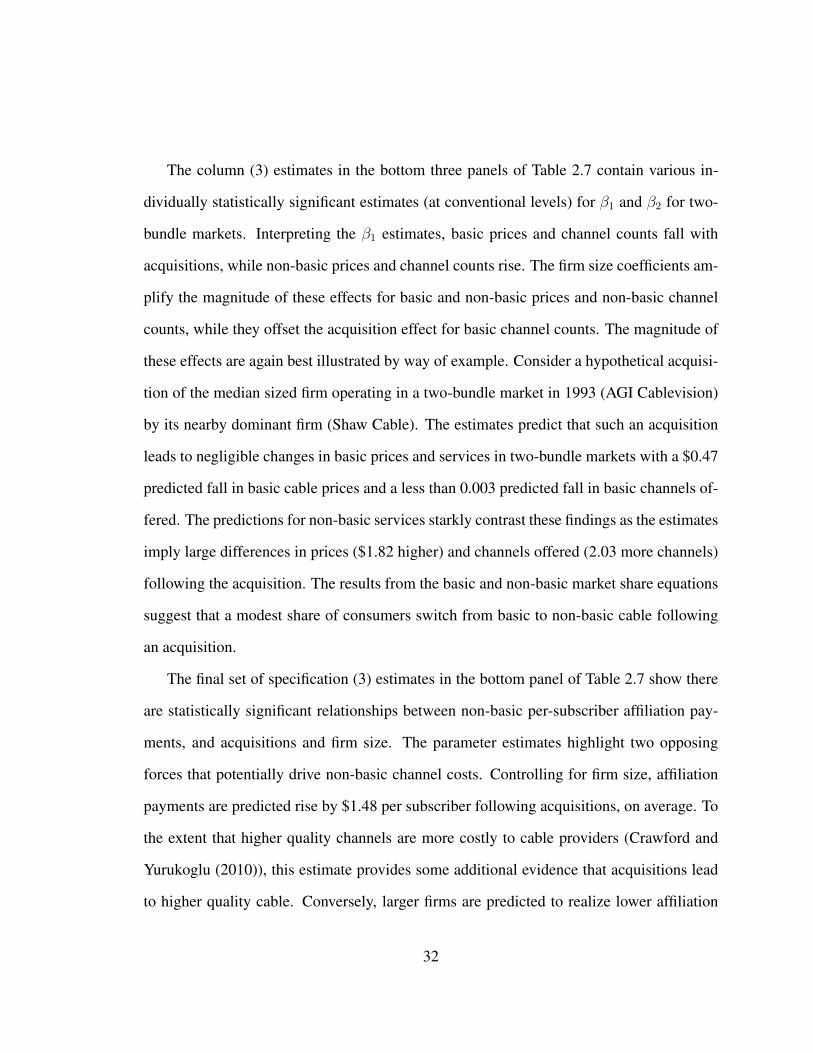
The column (3) estimates in the bottom three panels of Table 2.7 contain various in-
dividually statistically significant estimates (at conventional levels) for β1 and β2 for two-
bundle markets. Interpreting the β1 estimates, basic prices and channel counts fall with
acquisitions, while non-basic prices and channel counts rise. The firm size coefficients am-
plify the magnitude of these effects for basic and non-basic prices and non-basic channel
counts, while they offset the acquisition effect for basic channel counts. The magnitude of
these effects are again best illustrated by way of example. Consider a hypothetical acquisi-
tion of the median sized firm operating in a two-bundle market in 1993 (AGI Cablevision)
by its nearby dominant firm (Shaw Cable). The estimates predict that such an acquisition
leads to negligible changes in basic prices and services in two-bundle markets with a $0.47
predicted fall in basic cable prices and a less than 0.003 predicted fall in basic channels of-
fered. The predictions for non-basic services starkly contrast these findings as the estimates
imply large differences in prices ($1.82 higher) and channels offered (2.03 more channels)
following the acquisition. The results from the basic and non-basic market share equations
suggest that a modest share of consumers switch from basic to non-basic cable following
an acquisition.
The final set of specification (3) estimates in the bottom panel of Table 2.7 show there
are statistically significant relationships between non-basic per-subscriber affiliation pay-
ments, and acquisitions and firm size. The parameter estimates highlight two opposing
forces that potentially drive non-basic channel costs. Controlling for firm size, affiliation
payments are predicted rise by $1.48 per subscriber following acquisitions, on average. To
the extent that higher quality channels are more costly to cable providers (Crawford and
Yurukoglu (2010)), this estimate provides some additional evidence that acquisitions lead
to higher quality cable. Conversely, larger firms are predicted to realize lower affiliation
32

Table 2.8: Tests of Whether Acquired LSAs are Representative
Basic Non-Basic Basic Non-Basic Basic Non-Basic FirmPrice Price Channels Channels Share Share Size
One-BundleMarkets (N = 680)Coefficient on -0.697 - -0.252 - -0.102∗∗∗ - -0.001LSA ever acquired (1.109) - (0.802) - (1.039) - (0.069)
Two-BundleMarkets (N = 1910)Coefficient on -0.263 -0.283 0.476 -0.424 -0.001 -0.028 -0.901∗∗
LSA ever acquired (0.448) (0.853) (0.500) (0.453) (0.027) (0.025) (0.374)
Notes: Estimates obtained by OLS. Standard errors are listed in parentheses and are clustered at the LSA-level. ***,**, * indicate statistical significance at the 1, 5, and 10 percent levels respectively. The specification is analogous toSpecification (2) from Table 2.7, expect the LSA fixed effects are replace with province dummies. All nominal amountsare in 1992 constant dollars.
payments, which suggests there may be scale effects. The estimates imply that affiliation
payments are predicted to rise by $0.54 per subscriber following the hypothetical AGI Ca-
blevision/Shaw merger, even though there is a large predicted rise in non-basic prices and
channel counts, as discussed above.
2.5.2 Endogeneity of acquisitions
If firms’ acquisition decisions are driven by target firms’ basic or non-basic cable prices,
channel counts and so on, the OLS estimates of β1 and β2 in Table 2.7 will suffer from
selection bias. For example, if large cable companies acquire small ones because small
firms offer poor non-basic cable services (i.e. low non-basic channel counts), then the OLS
estimates for β1 and β2 would be biased upward due to selection effects.
As a first check on potential endogeneity issues, I compare the pre-merger charac-
teristics of acquired LSAs to non-acquired LSAs prior to acquisitions to see if there are
33

systematic differences in the types of LSAs that are acquired.30 Using the sample of all
non-acquired LSAs and pre-merger observations for all acquired LSAs, I regress a given
LSA-level characteristic on a dummy variable that equals one if a LSA is subsequently ac-
quired. If the coefficient estimate on the acquisition dummy is statistically significant, then
the dependent variable for acquired LSAs systematically differs from non-acquired LSAs.
I present the results from these regressions for one and two-bundle markets in Table 2.8,
where the dependent variables are basic and non-basic prices, channel counts and market
shares, as well as horizontal firm size (national subscribership) of a LSA’s current cable
company.31 For one-bundle markets, the only statistically significant estimate is for basic
shares (at the 1% level), suggesting that acquiring firms potentially target one-bundle mar-
kets with low-demand. For two-bundle markets, only the regression where firm size is the
dependent variable delivers a statistically significant result (at the 5% level). The coeffi-
cient estimate suggests that two-bundle markets served by smaller firms are more likely to
be acquired, which reflects the aforementioned fact that the dominant firms are involved in
the majority of acquisitions. There do not appear to be systematic differences in acquired
LSAs based on the characteristics of the current cable bundles since as other estimates are
statistically insignificant.
As another check on endogeneity, I re-estimate equation (2.3) using sub-samples of
the data that vary the extent to which selection effects matter. For example, acquisitions
involving the dominant firms may be more influenced by selection effects as scale efficien-
cies may allow larger companies to offer more lucrative bundles that potentially earn higher
profits. I continue to classify a firm as “large” if it is one of the ten largest cable companies
in 1996 by national subscribership. I re-estimate equation (2.3) for two-bundle markets30The two merger endogeneity checks in this subsection follow Sweeting (2010)’s approach.31I include time dummies and the firm and demographic controls from above in the regressions, and replace
the LSA fixed effects with province fixed effects.
34

Table 2.9: Estimation Results by Large and Not Large Buying Firms in Two-Bundle Mar-kets
Basic Non-Basic Basic Non-Basic Basic Non-Basic AffiliationPrice Price Channels Channels Share Share Payments
Exclude Small AcquiringFirms (N = 2664)Alt -0.458∗∗∗ 3.771∗∗∗ -1.733 4.260∗ -0.058∗∗ 0.136∗∗∗ 1.723∗∗∗
(0.126) (0.534) (2.055) (2.310) (0.023) (0.022) (0.360)Exclude Large AcquiringFirms (N = 1926)Alt -0.444∗∗ 2.274∗ -0.132 1.348∗∗∗ -0.014 0.014 0.851
(0.196) (1.231) (0.336) (0.490) (0.020) (0.019) (0.742)
Notes: Estimates obtained by OLS. Standard errors are listed in parentheses and are clustered at the LSA-level.***, **, * indicate statistical significance at the 1, 5, and 10 percent levels respectively. The specification isanalogous to Specification (2) from Table 2.7. A firm is classified as large if it operates in ten or more LSAs in1996. All nominal amounts are in 1992 constant dollars.
using two subsamples that respectively exclude small and large firm acquisitions.32 The
results are listed in Table 2.9. Comparing the top and bottom panels, I find qualitatively
similar results for the two sets of estimates, implying that to the extent that scale-based
selection effects exist, they are not driving the general conclusions of my reduced-form
analysis. The results do suggest that scale-based selection effects may put upward pres-
sure on the magnitude of the acquisition coefficients for non-basic prices, channels and
affiliation payments in Table 2.7.
2.6 Summary
In this chapter, I have provided historical background for the evolution of the cable tele-
vision industry in Canada, introduced the dataset used throughout this dissertation, and
32I do not list results for one-bundle markets as there are no acquisitions of one-bundle markets by largefirms as I have defined them. This is because one-bundle market acquisitions typically involve rural cablesys-tems that larger firms do not actively acquire.
35

discussed some empirical facts related to market structure and cable packages. Overtime,
the cable television industry in Canada consolidates and dominant, regionally-based firms
emerge. Basic summary statistics show that these larger firms tend to offer more chan-
nels in their basic and non-basic cable packages at lower prices relative to smaller firms.
Using a bivariate probit model, I highlight the role of economies of scale and density in
the acquisition process. To evaluate the outcomes of mergers in terms of prices and chan-
nels offered, I use linear regressions with LSA fixed effects while instrumenting for firms’
merger decisions. I find that acquisitions have little impact on basic prices and channels
offered in one-bundle markets. In two-bundle markets, I find non neglible increases (de-
creases) in channels (prices) for non-basic services, as well as reductions in basic prices
following acquisitions.
While these reduced-form findings are interesting in their own right, they come up short
in some respects. In terms of the determinants of mergers, the above empirical specification
in section 2.4 does not account for the rich interdependency and mutual exclusivity of
acquisitions observed in the data. For example, if I observe firms A and B merge in the
data, they must have mutually agreed to the merger.33 Moreover, for any third firm C, it
must be the case that an A − B merger yields more surplus to A and B than either an
A − C or B − C merger. Not only are these interdependencies in firms A, B, and C’s
acquisition decisions not accounted for in the empirical model in section 2.4, they make
the reported marginal effects of firm size and economies of density difficult to interpret,
since the relative merger values between all three firms are simultaneously affected for any
change in the covariates that predict merger surplus.
The regression analysis in section 2.5 also has its limitations. A natural question aris-
ing from this empirical analysis is what are the welfare consequences of mergers? For33In collecting the data from CRTC Decision and Notice files, I do not observe any hostile takeovers.
36

two-bundle markets, LSAs tend to see reductions and increases in the prices and channels
offered in their non-basic prices, so presumably consumers are better off. To evaluate these
welfare effects, I require an empirical model whose parameters are internally consistent
with cable companies’ profit-maximizing price and cable bundle quality choice as well as
consumers’ utility-maximizing cable bundle choices. By estimating such a behavioural
model, I can evaluate the “no-merger” equilibrium outcomes by simulating counterfactual
choices by firms and consumers in a world where no mergers occurred. Comparing the con-
sumer and producer surplus values under the observed changes market structure and this
counterfactual would allow me to computer the welfare effects of merger empirically.34
Going forward, I further explore the determinants and welfare consequences of merg-
ers in this industry using structural econometric models, where I build up empirical models
directly from economic theory. Chapter 3 constructs a Simulated Maximum Likelihood es-
timator from the stability conditions of a Farrell and Scotchmer (1988) coalition-formation
game. I use the estimated model to quantify the equilibrium impact of economies of scale
and agglomeration on acquisitions, while accounting for the aforementioned interdepen-
dency in merger decisions. In Chapter 4, I estimate a variant of the Rochet and Stole
(2002) model of multi-product monopoly with endogenous product quality (i.e. cable bun-
dle quality) and prices, and use it to quantify the welfare effects of acquisitions in the
industry.
34This is the approach taken by Pesendorfer (2003) in his study of the welfare effects of mergers in theU.S. paper and paperboard industry during the mid-1980’s.
37

Chapter 3
Quantifying Merger Incentives in the
Cable Television Industry
This chapter provides a unique, in-depth empirical analysis of industrial consolidation and
the determinants of mergers. I develop a model of acquisitions and entry for an industry
that is subject to exclusive geographic licensing, and apply the model to the Canadian
cable television industry by estimating its parameters using the panel data set described
in Chapter 2. Using the estimated model, I evaluate how economies of scale and density
(i.e.: agglomeration) affect firms’ acquisition incentives, and how deregulation can trigger
merger activity. I also use the model to study the impact that entry subsidies and policies
that restrict merger activity can have on long-run market structure and firms’ productivity
distribution as the industry consolidates over time.
The acquisition and entry model that I develop explicitly accounts for the interdepen-
dency and mutual exclusivity of firms’ merger and entry decisions. There are three key
features of the industry and data that keep the model tractable and allow me to identify the
impact that economies of scale, density and deregulation have on acquisition behaviour.
38

First, firms are local monopolists within their licenses over my entire sample period. This
allows me to abstract from modelling complications related to oligopolistic product-market
competition, such as business stealing incentives or market power motives for acquisition.1
Second, my panel dataset contains information on firms’ profits at the license-level, a lux-
ury empirical studies of market structure typically do not have.2 This allows me to estimate
firms’ profit functions directly while accounting for location and firm unobserved hetero-
geneity. Moreover, these profit data reveal a scale effect on profits; all else equal, large
cable companies (in terms of national subscribership) earn more profits per-subscriber than
small ones. This gives large firms an incentive to acquire the licenses of small firms as
larger companies can earn higher profits than the status quo.
Third, I exploit the fact that a partial deregulation occurs within my sample period,
which presents a unique opportunity to study the interaction between regulatory policy
and industrial merger activity for a specific industry, for a well-defined regulatory change.3
Using variation in firms’ channel offerings and profits before and after the policy change,
I find that large cable companies take advantage of the policy by offering new channels
to its subscribers, while smaller firms do not. My estimates show that this increases large
firms’ profitability advantage. Using the structural model, I study how this change in the
scale effect generates the observed rise in merger activity following the deregulatory policy
change.
1Examples of entry/exit models with network competition that attempt to deal with these difficulties in-clude the seminal work of Seim (2006), and more recently by Aguirregabiria and Ho (2009).
2In the absence of profit data, authors infer the parameters of profit functions in entry/exit studies byrationalizing the observed entry/exit decisions of firms in the data. This revealed preference approach toprofit function estimation dates back to Bresnahan and Reiss (1991). Jia (2008) is a recent example that takessuch an approach.
3This regulatory change occurs in 1994 and is discussed at length in Section 2.1 above. Typically mergerwaves are studied at the aggregate level using merger data across many industries for broadly defined regula-tory or technological shocks. For a recent analysis, see Jovanovic and Rousseau (2008).
39

My acquisition and entry model is based on Farrell and Scotchmer (1988)’s coopera-
tive, one-sided coalition formation game. Starting from an initial allocation of licenses to
firms, in each period (year) cable companies make irreversible merger and entry decisions
that affects the license allocation, and that determines the set of cable companies that play
the acquisition game in the next period. For a given allocation of licenses within a year
firms earn profits from their set of licenses. The amount of surplus generated by a merger
depends on three main factors: (1) the relative size of the buying and selling firms (which
affects relative profitability through a scale effect), (2) an agglomeration effect, as merg-
ing firms can reduce their overall fixed costs per license (related to local administrative
and technical expenses) if they own licenses that are geographically proximate, and (3)
firm heterogeneity, which captures differences in unobservables that affect profits (such as
managerial ability or firm productivity). The equilibrium of the game is characterized by a
stability condition where for a given set of merger and entry arrangements, no collection of
firms can profitability deviate from their arrangements.
The model is estimated in two steps. First, I estimate a per-subscriber variable profit
function using within-license variation in subscription profits, firm size, and local demo-
graphics, while controlling for firm and license unobserved heterogeneity. To account for
the impact that the 1994 policy change has on firms’ profits, I estimate different variable
profit functions for the pre (1990-1994) and post (1995-1996) regulatory periods. In the
second step, the parameters of the fixed, merger, and entry cost functions are estimated
using data on firms’ acquisition and entry decisions, their geographic locations, and pre-
dictions from the estimated profit function on the additional variable profits created by
mergers. The second-step parameters are estimated by Simulated Maximum Likelihood,
40

where the likelihood for the model is constructed using inequalities implied by the equilib-
rium conditions of the acquisition and entry game.
The estimation results provide various empirical findings on the determinants of ac-
quisitions. As noted, I find empirically that large cable companies earn more profits per-
subscriber than do small ones, and that these differentials are magnified by the 1994 policy
change. My counterfactual experiments show that these firm size effects are the main driver
of acquisition behaviour in the industry. When I remove the scale effect on profits and sim-
ulate data using the model, acquisition levels fall dramatically. The model also predicts that
the deregulation is largely responsible for the spike in acquisition behaviour that follows
the policy change. In the absence of the impact that deregulation has on firms’ profit func-
tions, my simulations show that acquisitions do not spike in 1995 as they do in the data.
Economies of density are found to have a relatively modest effect on firms’ acquisition in-
centives. Given the geographic clustering of firms’ license ownership in the data, this result
is somewhat surprising. It highlights the importance of accounting for scale effects when
estimating the impact that economies of density have on firms’ acquisition incentives.
Using the estimated model, I also conduct two sets of policy experiments that study
entry subsidies and policies that restrict merger activity (for example, through regulator-
imposed acquisition fees) in the industry’s infancy. I find that both of these policies can
yield more productive dominant firms in the long-run as the industry consolidates. Entry
subsidies make it easier for productive entrants to enter and acquire relatively unproductive
incumbents. Acquisition fees reduce merger activity in the early years of the industry’s
life-cycle, helping prevent large cable companies from initially forming. If large compa-
nies emerge early on, they develop scale advantages that allow them to continue to grow
41

by acquiring smaller cable operators. However, since entrants typically enter the indus-
try by acquiring small cable companies (as acquisition costs scale with incumbent size),
scale-driven acquisitions by initially large incumbents can prevent the entry of productive
entrants who would otherwise acquire relatively unproductive incumbents. That is, large
incumbent scale-effects can overwhelm any productivity differences between incumbents
and new entrants if incumbents grow too fast, too soon. By slowing the initial rate of con-
solidation, merger policy can help ensure that productive entrants can enter the industry.
By creating an initial environment that gives productive entrants the opportunity to replace
unproductive incumbents, these policies can ensure that dominant firms emerge in the long-
run due to their intrinsic productivity advantages as well as scale effects, and not because
of scale effects alone.
The rest of the chapter is organized as follows. The next section discusses the literatures
this paper contributes to, and Section 3.2 highlights the empirical motivation for this chap-
ter. I develop a model of acquisitions and entry in Section 3.3, and outline my estimation
strategy in Section 3.4. My empirical findings and counterfactual analyses are presented in
Section 3.5, and Section 3.6 concludes.
3.1 Related Literature
This chapter relates to a large empirical literature on merger waves which mainly consists of
descriptive, aggregate industry-level studies. Andrade, Mitchell, and Stafford (2001) pro-
vide a comprehensive overview of this literature. They emphasize that industrial shocks,
such as deregulation and technological change, are fundamental to the merger waves ex-
perienced by various industries in the U.S. during the 1980’s and 1990’s. I provide a mi-
croeconometric analysis of a merger wave that follows a well-identified regulatory change
42

within an industry. Further, I identify a mechanism through which a merger wave occurs
by estimating an equilibrium model of firms’ acquisition and entry decisions.
I also contribute to an empirical literature on market structure and agglomeration. Jia
(2008), Holmes (2010) and Ellickson, Houghton, and Timmins (2010) all study the im-
pact that economies of density have on the spread of Walmart and other retail chains in
the U.S.. Aguirregabiria and Vincentini (2006) develop methods for estimating dynamic,
spatial, multi-store entry models that focus on economies of density and firms’ pre-emption
incentives. Akkus and Hortacsu (2007) use maximum score methods to study bank mergers
in a spatial environment and find that firms of similar size and in geographic proximity are
more likely to merge. My findings provide new empirical insights on how market structure
can be shaped by buyouts, and how dominant firms can emerge through their acquisition
of smaller companies over time, in industries where economies of scale are present. To
the best of my knowledge, my policy experiments that investigate the impact entry subsi-
dies and restrictive merger policy have on long-run market structure and firms’ productivity
distribution in a consolidating industry, are novel.
3.2 Empirical Motivation
The empirical motivation for studying the role of economies of scale and density in shaping
firms’ merger decisions has been discussed at length in Section 2.3 above. In particular,
Tables 2.2 and A.3 show that year-to-year, the largest cable companies are the most active
in acquiring other firms. Figures 2.1 and 2.2 illustrate how these dominant acquiring firms
cluster the operations regionally, suggesting there are agglomeration economies in oper-
ating geographically proximate LSA’s. The reduced-form Poirier (1980) bivariate probit
results in Table 2.6 further indicate that larger differences in firm size and closer networks
43

Figure 3.1: LSA Buyout Counts
050
100
150
200
Lice
nse
Buy
out C
ount
19901991
19921993
19941995
19961997
Figure 3.2: Firm Buyout Counts
020
4060
Firm
Buy
out C
ount
19901991
19921993
19941995
19961997
of LSA ownership both increase the probability of merger between two firms.
The motivating empirical patterns for studying the impact the 1994 partial deregula-
tion has on industrial merger activity are highlighted in Figures 3.1-3.6. Figures 3.1 and
3.2 respectively show that LSA and firm acquisitions fall from 1990 to 1994, jump in
1995, and fall thereafter. Figures 3.3-3.6 present annual trends for large and small (i.e.,
not large) firms’ channel offerings and profitability from 1990-1996.4 Figure 3.3 clearly
shows that following the licensing of new non-basic channels by the CRTC in 1994, large
cable companies immediately adopt new non-basic channels on average, while small cable
companies do not. Figures 3.4 and 3.5 show that large cable companies subsequently see
a pronounced rise in average revenue and channel affiliation payments per subscriber that
small cable companies do not post-1994. Ultimately, large firms see a relatively sharp in-
crease in per-subscriber profitability across their LSA’s, as illustrated in Figure 3.6. This
policy-induced increase in per-subscriber profitability for large firms potentially underlies
4In these figures, I define “large” firms as being those who are in the top 10 in terms of national sub-scribership in 1994. All other firms not in this set are grouped as “small” or “Not Largest 10 Firms.” Thefigures are similar for different classifications (i.e.: based on largest 20, 30 firms and so on).
44

Figure 3.3: Number of Non-Basic Channels
05
1015
Non
−B
asic
Cha
nnel
Cou
nt
1990 1992 1994 1996Year
Largest 10 Firms Not Largest 10 Firms95% CI 95% CINew Channels Licensed
Figure 3.4: Revenue per Subscriber
100
150
200
250
Var
iabl
e P
rofit
per
Sub
scrib
er
1990 1992 1994 1996Year
Largest 10 Firms Not Largest 10 Firms95% CI 95% CINew Channels Licensed
Figure 3.5: Affiliation Cost per Subscriber
2025
3035
4045
Var
iabl
e P
rofit
per
Sub
scrib
er
1990 1992 1994 1996Year
Largest 10 Firms Not Largest 10 Firms95% CI 95% CINew Channels Licensed
Figure 3.6: Profits per Subscriber50
100
150
200
Var
iabl
e P
rofit
per
Sub
scrib
er
1990 1992 1994 1996Year
Largest 10 Firms Not Largest 10 Firms95% CI 95% CINew Channels Licensed
45

the observed rise acquisition levels in 1995. In developing a merger model below, I there-
fore use a specification that allows me to draw an empirical link between equilibrium
merger activity and this change in the scale effect on profits before and after 1994.
3.3 Model
3.3.1 Environment
The industry consists of i = 1, . . . , Nt cable companies, who are local monopolists across
` = 1, . . . , L LSAs (locations), for t = 0 . . . T periods (years). I slightly abuse notation,
and use Nt and L to represent the set of firms and locations as well. Within each period,
cable companies myopically play a two sub-period merger game. In the first sub-period,
firms interact in the acquisition and entry market where incumbents simultaneously decide
whether to merge and entrants make entry decisions.5 I model this process as a coalition-
formation game as in Farrell and Scotchmer (1988).6 Acquisitions are irreversible, which
means selling firms cease to exist following a merger. Thus, the outcome of the merger
game for a given period determines the set of firms that exist in the next period, implying
5I abstract from geographic expansions into new LSAs as there is insufficient new LSA entry activity over1990-1996 to admit empirical modelling of this behaviour. I simply drop the LSAs that are expanded into byincumbents or entrants after 1989 in the estimation sample. Since these LSAs are located in rural, sparselypopulated areas, they should have little impact on the measurement of economies of density and nationalsubscribership.
6Recent research in the empirical political economy literature uses one-sided matching models in a spatialsetting. Weese (2009) uses a one-sided coalition-formation framework to study political amalgamations inJapan. Gordon and Knight (2009) use a one-sided matching model to study school-district amalgamations.Both papers restrict their analyses to contiguous mergers, as non-contiguous amalgamations are not observed.The latter paper further abstracts from matches involving more than two districts as they rarely occur. I cannotmake such abstractions since I often observe many non-contiguous acquisitions, as well as mergers involving3 or 4 firms.
46

that Nt evolves over time. Formally, the set of firms in period t is:
Nt =
1 . . . N0 if t = 0
i : firm i still active in year t if t > 0
Within a period, the set of LSAs firm i operates in potentially changes depending on
whether it acquires other cable companies in the first sub-period. I denote Lit and Lit
as the set of LSAs owned by firm i within the first and second sub-periods of period t,
respectively. Given the outcomes from the acquisition game, firms earn profits from their
LSAs in the second sub-period. In describing the model, I begin with the second sub-period
as profits earned within this period are fundamental to the payoffs that govern play in the
first sub-period.
The myopic decision-making assumption is strong, and warrants some discussion. If I
allow firms to be forward-looking in their acquisition decisions, then I must compute the
flow value of a match which takes into account all possible merger sequences for all firms in
the future. As has been noted by previous authors who estimate strategic models of network
formation, the computational burden of such a calculation is extreme, and one is forced to
make assumptions to make the model tractable. The myopic decision assumption allows
firms in my model to consider the rich choice set of all potential merger partners in the data,
and further allows firms to consider the joint value of acquisitions of two or more firms,
which previous papers abstract from.7 Another modelling approach is to incorporate fully
forward-looking decision making, but completely ignore strategic interaction by firms. This
is the approach Holmes (2010) takes in studying the spread of Walmart in the U.S.. This is
7That is, I do not have to make a “local managers” assumption (as in Aguirregabiria and Ho (2009))whereby the collection of merger decisions are made independently when rms merge with multiple partners.There is ample evidence in the CRTC Decision and Notice files to suggest that firms account for the jointvalue of mergers with multiple partners when making acquisition decisions.
47
not an attractive alternative in my context as the Decision and Notice files clearly show that
firms strategically interact when engaging in a merger. A second motive for this assumption
is the fact that a collection of dominant firms grow in a highly non-stationary fashion over
time. Modeling the forward-looking behaviour of these firms would thus require that I
develop and estimate a non-stationary game, an environment which to date lacks empirical
methods.8 Developing such methods is well beyond the scope of this paper.
3.3.2 Sub-Period 2: LSA Profits
Firms offer cable packages to subscribers within their LSAs, subject to the basic price and
carriage restrictions imposed by the CRTC, which defines how much subscription prof-
its per-subscriber a company earns from a given LSA.9 As discussed in Chapter 2, the
composition, cost, and profitability of these bundles can vary depending on the number of
subscribers a cable operator has nationally. Companies also incur fixed technical, admin-
istrative and service costs in offering services to their LSAs. The following profit function
accounts for these factors, predicting firm i’s profit from LSA ` at time t:
πi`t = vi`t ×Q`t − Fi`t (3.1)8Current methods for estimating dynamic network-formation games using entry/exit models (such as
those used by Aguirregabiria and Ho (2009) and others) require that entry/exit behaviour follow a stationaryprocess. Ellickson, Houghton, and Timmins (2010) highlight this non-stationarity issue as well in motivatingtheir use of a static game in estimating a strategic model of network formation in the U.S. retail industry.
9A complete industry model, like that of Crawford and Yurukoglu (2010), incorporates these optimalprice and bundling decisions of cable companies. However, since data on channels’ identity and prices forextended basic and specialty services are currently unavailable, I cannot explicitly model how firms extractrents from their subscribers. See Chu (2008) and Crawford and Yurukoglu (2010) for structural approachesto modelling cable companies’ bundling decisions in the U.S., where channel identities and bundle pricesare available from the Cable Television Factbook. Microdata on channel offerings, market shares, and pricesfor extended basic and speciality services are available in Canada from a private marketing company calledMediastats for a price that is in excess of $10,000 per year.
48

where vi`t is the subscription profits per-subscriber, Q`t is the population of subscribers in
location ` at time t, and Fi`t is firm i’s fixed cost of servicing LSA ` at time t. In equation
(3.1), I take the total subscribership of the market as exogeneously given.10 Out of the total
number of households in a given LSA, one might expect the number of households that
sign up for cable (known as the penetration rate) to depend on the cable company which
serves LSA ` at time t. However, in my preliminary empirical work I found virtually no
relationship between the penetration rate and firm characteristics after controlling for local
demographics.11 I therefore adopt a parsimonious specification of the profit function that
assumes the subscriber base is exogenous.
Within location ` at time t, firm i’s subscription profits per-subscriber are defined as
follows:
vi`t =1∑
dreg=0
[βdreg0 + βdreg1 Qit + βdreg2 Q2
it +X`tβdreg3
]+ εi + ε` + εt + εi`t (3.2)
where Qit =∑
`∈LitQ`t is the national subscribership of firm i in the second sub-period
10The tying requirement for non-basic and basic services implies that the total number of people signedup for basic services equals the total number of subscribers overall. To see why, suppose individuals’ tastesfor cable is heterogeneous such that people with strong preferences for cable get non-basic services, and lowdemand types get basic cable only (as in Chu (2008) or Crawford and Yurukoglu (2010)). With heterogenoustastes for cable, assuming the fraction of people that sign up for cable service in a population is exogenousis the same as saying the marginal consumer at the lower end of the cable willingness-to-pay-distribution isexogenous.
11Specifically, I estimate a Tobit model, with LSA random-effects, that predicts the penetration rate as afunction of the exogenous demand shifters used in this paper, firm fixed effects for the 15 largest firms, andthe national subscribership of a cable operator i in LSA ` at time t. The estimated marginal effect (evaluatedat sample means) that a 100,000 subscriber increase in national subscribership has on the penetration rate isless that 0.1%. Firm fixed effects also have negligible marginal effects as well. Part of the reason for thismay be due to the fact that basic cable prices and channel offerings are highly regulated (unlike non-basicservices), implying that for a given LSA, firms’ flexibility over what channels and prices to offer in the basicpackage is limited. I have estimated the model in this paper treating Qit as endogenous, and find the resultsare largely unchanged.
49

of time t, and X`t are location-specific profit shifters (for example, income). The depen-
dent variable is calculated as total annual subscription revenue from basic and non-basic
services, less affiliation payments made to upstream channel providers, divided by the total
number of basic subscribers (which is equivalent to the total number of subscribers because
of the tying of non-basic to basic services). The error term consists of four components:
εi is firm i’s individual effect, ε` is location `’s individual effect, εt is an aggregate time
effect, and εi`t is an i.i.d idiosyncratic profit shock drawn from a normal distribution with
mean 0 and variance Σε. I include the square of national subscribership to allow for an
increasing or decreasing effect of firm size on per-subscriber profitability. The superscripts
for the first four coefficients allows firms’ subscription profit function to change as a result
of the 1994 deregulation. The values dreg = 0 and dreg = 1 respectively correspond to
the periods before (1990-1994) and after (1995-1996) the policy change. The parameters
of interest are βdreg1 and βdreg2 for dreg ∈ 0, 1. They determine how firm size affects LSA
profitability, and the extent to which the policy change affects the marginal effect of firm
size on subscription profits.
Cable companies incur fixed administrative, technical, capital, and marketing expendi-
tures to serve LSAs. As noted in many CRTC Decision Files, these costs can be spread
across geographically proximate LSAs (see Figure A.3 in the Appendix for example). I
therefore adopt the following specification for the fixed cost firm i pays to serve LSA ` at
time t:
Fi`t = fc0 + fc1W`t + fc2EODi`t + ωi + ω` + ωt + ωi`t (3.3)
where W`t are local cost shifters, EODi`t is the economies of density realized by firm i in
location ` at time t, (ωi, ω`, ωt) are respectively firm, location and time-specific fixed cost
50

effects, and ωi`t is an i.i.d idiosyncratic fixed cost shock drawn from a mean-zero distri-
bution. Economies of density depends on how densely clustered firm i’s LSAs are located
around LSA `. I adopt a measure that is similar to that used by Jia (2008): EODi`t =∑`∈Lit
∑`′∈Lit,`′ 6=`
12d``′
where d``′ is the distance from the centers of LSAs ` and `′. To en-
sure consistency in estimation, the geographic effect of local LSA ownership on fixed costs
must die away at a sufficient rate as the distance between two LSAs increases. I therefore
set d``′ =∞ for d``′ > D = 100 kilometres.12
3.3.3 Sub-Period 1: Acquisition Game
In the first sub-period of period t, the acquisition and entry game is played by the set of
Nt active cable companies. It is a simultaneous-move, full information, co-operative game,
where firms are free to merge with other collections of firms.13 A merger at time t, St,
consists of a subset of active firms: St ⊂ Nt. A merger structure Πt is a partition of Nt into
K mergers: Πt = S1 . . . SK, Si⋂Sj = ∅ for i 6= j.
For a given merger, I index the acquiring cable company with i. It is defined as the
largest cable company in terms of national subscribership in the first sub-period: i = i :
i ∈ St, Qit = maxi∈St Qit, where Qit =∑
`∈LitQ`t is the national subscribership of
firm i in the first sub-period of period t. This assumption is consistent with the fact that
the largest firm is the buyer in over 95% of all mergers. Buyer i acquires the remaining
NSt − 1 firms, and their corresponding LSAs. The set of LSAs owned by all of the firms
in merger St is LSt =⋃i∈St
Lit, and the total number of subscribers across these LSAs is
QSt =∑
`∈LStQ`t.
12I have checked my estimation results for D = 75 and D = 150 kilometres and find little difference inmy estimates.
13Note that the game is played at the firm level, not the LSA-level. I abstract from the possibility that firmssell subsets of their LSAs to other firms, an event that I rarely observe in the data.
51

The definition of the buyer matters for two reasons. First, the sellers’ firm-fixed ef-
fects in the per-subscriber profits functions are replaced by the individual effect of the
buyer, which affects the surplus generated by an acquisition. Second, in forward-simulating
merger activity for the industry below, I must track the buyers year-to-year as the outcome
of the acquisition game in period t determines the allocation of LSAs to firms and the set
of remaining cable companies at the beginning of period t+ 1.
Acquisition Payoffs and Costs
The total value firm i creates from its Lit LSAs in period t is simply the expected sum of
their individual values:
Vit =∑`∈Lit
E[πi`t] (3.4)
where the expectation operator is over εi`t and ωi`t, which I assume are drawn after the
acquisition and entry game is played. For merger St, the total value is similarly defined as
the sum of the value of the LSAs owned by the firms in St:
VSt =∑`∈LSt
E[πi`t] (3.5)
Acquisitions are costly, as they typically involve large sunk investments by buying com-
panies related to technical upgrades of newly purchased cable systems, or initial marketing
expenses and distribution costs to promote new cable offerings to subscribers. As discussed
in Chapter 2 and highlighted in Figure A.2, these sunk expenditures are often in the range
52

of hundreds of thousands of dollars. I define acquisitions costs as follows:
ACSt = ac0 + ac1QSt\i (3.6)
whereQSt\i = QSt−Qit is the total number of subscribers in the LSAs of the firms acquired
by buyer i. Acquisition costs will also capture any regulatory costs that are involved with
mergers.
Entry
In the data, I observe new cable companies who enter the industry by acquiring the LSAs of
incumbent firms. To account for entry in period t, I assume that there is one entrant for each
incumbent. Each entrant can only enter the industry through a bilateral acquisition, where
it acquires its corresponding incumbent cable company. The number (and set) of firms in
the period t acquisition game is thus Nt = 2Nt, where Nt is the number of incumbent
firms. This entry process is largely consistent with my readings of the CRTC Decision and
Notice Files. In the estimation sample, there are no instances where an entrant acquires
two or more incumbents, and entrants typically acquire small incumbent cable companies.
Prior to entry, a potential entrant draws an individual variable profit shock εi. To enter,
an entrant must sink a one-time entry cost ECSt defined as:
ECSt = ec0 + ec1Qit (3.7)
Entry costs are higher for entrants who acquire incumbents with larger national subscriber-
ship. This captures initial marketing and set-up expenses that scale with the size of a
purchased incumbent cable company. These costs also capture any regulatory costs, or
53

one-time technical upgrade expenditures that entrants sink upon acquiring an incumbent. I
normalize entrants’ reservation value to not entering to zero.
Acquisition Surplus
The surplus generated by merger St is the difference between what the merging firms earn
from their LSAs jointly less the sum of what they earn apart, less any acquisition or entry
costs (depending on whether the acquiring company is an entrant or incumbent):
∆VSt = VSt −NSt∑i=1
VSit− (1− 1newit)ACSt − 1newitECSt + εSt (3.8)
The indicator function 1newit equals 1 if the buying firm is an entrant. The final term εSt
is an i.i.d merger-specific shock drawn from a mean-0 Type-1 Extreme Value distribution
with scale parameter σε. The shock captures any acquisition synergies that are observed by
the firms but not the econometrician. Beyond this shock, acquisition surplus depends on
the relative size of buyers and sellers (which affects variable profits), economies of density
if buyers and sellers own nearby LSAs (which affects total fixed costs paid across LSAs),
and differences in firm-specific variable profit or fixed cost effects (i.e.: εi and ωi). Con-
veniently, location and time-specific effects in fixed costs and variable profits (ε`, εt, ω`, ωt)
difference out in equation (3.8), implying that they do not affect the model’s predictions
over what mergers occur. Should a firm not enter a merger with another company, it earns
a merger surplus of zero.
Like Farrell and Scotchmer (1988), I make the simplifying assumption that firms equally
split merger surplus. Under an equal-sharing assumption, the total expected payoff to firm
54
i from merger St is:
VSt[i] = Vit +∆VSt
NSt
(3.9)
This assumption rules out the possibility of transfers between firms, that would endogenize
how acquisition surplus is split. For example, I do not allow for the possibility that a
weaker firm could entice a stronger firm to form a merger by offering a large share of the
merger surplus. If I were to allow for endogenous transfers of merger surplus, multiple
equilibria would arise, implying that there would be a non-unique mapping from the model
to the data. For my estimation algorithm below, this implies that for a given parameter
vector, I would have to find all equilibria in the acquisition game, which is computationally
prohibitive. Like various other papers that build structural matching models, I do not check
robustness of my empirical findings with respect to this assumption, as such an exercise
represents a challenging research frontier.14
Across mergers, only the acquisition surplus varies, and it is therefore what defines
firms’ preferences over mergers. Thus, I characterize the equilibrium and estimation strat-
egy in terms of acquisition surplus. Notice that under the equal sharing assumption, firms’
preferences are symmetric for a given acquisition as all merging companies earn the same
value from their merger.
14See for example Sorensen (2007), Park (2008), Gordon and Knight (2009) for examples of two- and one-sided matching papers requiring a fixed sharing assumption. Fox (2009) presents an alternative estimationstrategy that is robust to endogenous transfers. He develops a maximum score estimator for 2-sided, one-to-one or many-to-many matching models, with binding quotas in the latter case. If I was to estimate themodel using Fox (2009)’s method, I would still face the problem of how to simulate acquisition decisionswith endogenous transfers in performing counterfactual simulations below.
55

3.3.4 Equilibrium
The equilibrium concept is the stability of merger structure Πt. The intuition is that for a
given Πt, no group of buyers and sellers can coordinate to create a blocking merger St /∈ Πt
that yields higher surplus to all of the coordinating buyers and sellers relative to what they
realize under Πt. Formally, the definition is:
Πt is a stable merger structure if and only if @ St /∈ Πt such that ∀ i ∈ St, ∆VSt>
∆VSt[i], where St ∈ Πt.
Under the payoff structure from the acquisition game, firms’ preferences over mergers are
strict (i.e., each firm can uniquely rank their payoffs from coalitions) and symmetric. Under
these conditions on preferences, Farrell and Scotchmer (1988) prove that a stable Πt exists
and is unique.15 They provide an iterative “top-down” algorithm that produces the unique
merger structure. Denote St as the set of all possible mergers at time t. Starting from
iteration k = 0, the procedure for finding the unique stable Πt is as follows:
1. Initialize Π0t = ∅ and the remaining merger structure vector S0
t = St.
2. Compute ∆VSt for all St ∈ S0t
3. Find Skmax = maxSt∈Skt
∆VSt
4. Update Πk+1t = Πk
t ∪ Skmax, Sk+1t = St|St ∈ Skt : St ∩ Skmax = ∅
5. Go back to Step 3 if Sk+1t 6= ∅, otherwise stop.
This algorithm is particularly useful for conducting counterfactual experiments below.
15Similar results related to existence and uniqueness of an equilibrium have recently have been shown forone and two-sided matching games by Rodrigues-Neto (2007) and Sorensen (2005). Similar “top-down”algorithms for finding the unique equilibrium are also provided in these papers.
56

3.4 Empirical Implementation
My objective is to estimate the parameters in equations (3.2) and (3.8). Collecting the
parameters of the model, define θ1 = β,Σε, θ2 = fc2, ac0, ac1, ec0, ec1, σε, and θ =
θ1, θ2.16 The model is estimated in two steps to reduce computational burden. First, I
estimate the parameters of the variable profit (θ1) using the LSA-level CRTC Master File
data, and the matched Census data. The remaining parameters (θ2) are then estimated using
variation in buyout and entry decisions, the geographic location of buyers and sellers, and
predictions for LSA-level variable profits from the estimated variable profit function.
I estimate equation (3.2) using a multi-level mixed effects model that includes LSA
fixed effects, and firm random effects.17 This introduces another parameter into θ1, σεi ,
the variance of the mean-zero i.i.d normal firm-specific profit shocks. The vector of profit
shifters in equation (3.2) includes per capita income, per capita income squared, age, age
squared, urban density, the unemployment rate, and the proportion of the population with
post-secondary education.18 I include a quadratic trend in all specifications to control for
yearly trends in per-subscriber profitability.
The remaining parameters in θ2 are estimated by Simulated Maximum Likelihood.
Given the data, the first-step parameter estimates (θ1), a given εi draw (i.e., the vector
of firm-specific profit shocks), and a value for θ2, the likelihood that the observed merger
16Notice that I do not estimate fc0, fc1 and Σω (the covariance matrix of the fixed cost shocks) in equation(3.3). The terms corresponding to fc0 and fc1 difference out when I compute ∆VSt
. They do not affectmerger outcomes, and are therefore are not identified by the model. I also ignore firm-specific effects in fixedcosts (ωi), as incorporating a vector of firm-specific fixed effects drastically increases the computationalburden of estimation in the second step.
17I do not include a full array of firm fixed effects as this leads to an incidental parameter problem. I haveexperimented with specifications that involve multiple firm-specific intercepts for larger companies in thesample and find virtually no difference in the results.
18See Table A.2 in the Appendx for variable definitions and their sources.
57

structure in period t in the data corresponds to a stable Πt is
`(Πt stable |θ2, εi) =
∫ε
1Πt stable |θ2, εi =
∫εΠt
P (Πt stable |θ2, εΠt , εi) (3.10)
where ε and εΠt are vectors of εSt shocks for all possible St’s, and for all St ∈ Πt respec-
tively. The expression 1· is an indicator function equalling one if the argument is true.
Conditional on a given εΠt and εi draw, the probability that Πt is stable can be computed as
a product of probabilities:
P (Πt stable |θ2, εΠt , εi) =∏S′t∈S′t
P(∆VS′tNS′t
< maxSt∈DS′t
∆VSt
NSt
| θ2, εΠt , εi
)(3.11)
where S′t = S ′t|S ′t /∈ Πt is the set of all mergers not in Πt, and DS′t= St|St ∈ Πt, St ∩
S ′t 6= ∅ is the set of deviating firms from Πt needed to form alternative merger S ′t /∈ Πt.
This simple calculation follows from the assumption that the merger-specific shocks are
i.i.d. across mergers.
3.4.1 Likelihood
To simulate the likelihood function of the model, I must evaluate acquisition surplus for all
possible mergers in the sample.19 The number of mergers increases exponentially in the
number of firms, which can make computation of equation (3.10) infeasible.20 To reduce
the dimensionality of the problem, I first break up the country intom = 1 . . .M geographic
19More specifically, I simulate acquisition surplus for all observed mergers, and evaluate merger surpluswithout any merger-specific shocks for all unobserved acquisitions.
20In a merger game involving N incumbent firms, the number of mergers is the sum of the binomialcoefficients from zero to N : #St =
∑Nk=0
(Nk
). So for example, a merger game involving 25 incumbents
has over 1 billion possible mergers
58

regions, across which firms play acquisition games independently. For national cable oper-
ators such as Shaw or Rogers, this implies that their regional subsidiaries do not consider
the impact of their mergers in other regions when playing the acquisition game. For esti-
mation, I define ten geographic regions based on the Statistics Canada Census economic
regions for 2001. Their definitions can be found in Table A.1 in the Appendix.21
Given the M independent regions, and the assumption that cable companies play the
acquisition game independently across years, the likelihood function for the model is:
L =
∫εi
1996∏t=1990
10∏m=1
`(Πmt stable |θ2, εi)dG(εi; σεi) (3.12)
where Πmt denotes the merger structure in region m at period t, G is the CDF for the
εi, and σεi is the estimated variance of the firm-specific profit shocks from the first step.
Since equation (3.12) cannot be computed analytically, so for estimation I use simulation
methods to approximate the log-likelihood:
LL =10∑m=1
log( 1
B
B∑b=1
1996∏t=1990
[ 1
K
K∑k=1
P (Πmt stable |θ2, εkΠmt
, εbim)])
(3.13)
where εim is a vector of region m’s firm-specific profit shocks, B and K are the number
of simulation draws for εi,m and εΠmt , and εbim and εkΠmtare the bth and kth draws. Recall
the elements of εi are i.i.d draws from a mean-zero normal distribution (whose variance
is estimated in the first step), and εΠmt’s elements are i.i.d draws from a Type-1 Extreme
Value distribution. For companies located in multiple regions, I draw a firm-specific shock
in each region.
21I drop the provinces of Newfoundland and Prince Edward Island as acquisition activity in these provincesis minimal over the 1990-1996 period.
59

3.4.2 Reducing Dimensionality
Within each geographic region and year, I further reduce the number of mergers in three
ways. First, I follow Weese (2009) and restrict the maximum merger size to be the largest
merger observed within a region in a given year. Second, I restrict the number of firms
playing the acquisition game within a year and region to include the observed buyers and
sellers in the data, plus a random subset of firms who are inactive in the acquisition/entry
market (i.e., firms who are not buyers or sellers in a given region and year in the data). This
follows an approach taken by Park (2008), and reflects the fact that I do not have natural
contiguity restrictions for acquisitions (i.e., firms only consider mergers amongst firms
with neighboring LSAs) as in Weese (2009) and Gordon and Knight (2009) that would
otherwise reduce the number of merger surplus values to check in estimation. Even if a
target small cable company does not yield economies of density with a large firm through
an acquisition, the larger company may have an incentive to acquire small ones because
of a scale effect on variable profits. For a given region, year and εim vector, I take a 20%
random sample of inactive firms. Importantly, I have estimated the model under different
20% random samples and find my results are robust to the sample that I draw. My results
are also unchanged if I take 10% or 30% random samples of inactive firms in the merging
game. Finally, I drop those mergers whose minimum distance between buyers’ and sellers’
LSAs is larger than the maximum distance between merging firms LSAs in the data. I
also drop acquisitions whose acquiring firm has less than the minimum of 2500 national
subscribers and the minimum national subscribership of an acquiring firm within its region
and year in the data.
60
3.5 Findings
This section first presents my parameter estimates for the variable profit, fixed cost and
entry cost functions. I then use the estimated model to perform counterfactual experiments
that isolate the impact that economies of scale, density, and the 1994 policy change have
on merger activity. To conclude, I conduct policy experiments that investigate the impact
entry subsidies or restrictive merger policy at the beginning of the sample have on market
structure and firms’ productivity distribution in the long-run as the industry consolidates.
3.5.1 Parameter Estimates
The parameter estimates for the variable profit function are listed in Table 3.1. To highlight
the importance of accounting for LSA fixed effects, I present OLS estimates as well. A
comparison of the two sets of estimates shows that controlling for LSA unobserved hetero-
geneity is important. Particularly for the parameters of interest, the OLS estimates yield
mixed, statistically insignificant estimates for the national subscribership coefficient for the
pre and post 1994 period. There are odd findings for the demand shifters as well. For ex-
ample, the estimates imply that age and income have a negative impact on per-subscriber
profitability, which contradicts previous empirical findings on cable demand and household
characteristics (see for example Crawford and Shum (2007)).
After controlling for LSA fixed effects, I obtain much more plausible results for both
the parameters of interest, and the marginal effects for the demographic variables. National
subscribership has a statistically significant, positive impact on per-subscriber profits and
the marginal effect declines as national subscribership rises. All of the demand shifters have
their expected signs, with age, urban density and education having statistically significant
coefficients at the 1% level. The negative impact of urban density relates to the fact that
61

Table 3.1: Variable Profit Function Parameter Estimates
OLS Fixed EffectsVariable Parameter dreg=0 dreg=1 dreg=0 dreg=1
Qit βdreg1 -0.051 0.035 0.230∗∗∗ 0.269∗∗∗
(0.043) (0.032) (0.029) (0.038)
Q2it βdreg2 -0.000 -0.005∗∗∗ -0.008∗∗∗ -0.010∗∗∗
(0.001) (0.002) (0.001) (0.002)
INC βdreg3 -0.352∗∗∗ -0.070 0.419∗ 0.375∗
(0.133) (0.265) (0.255) (0.212)
INC2 βdreg4 0.022 -0.065 -0.057 -0.014(0.014) (0.041) (0.039) (0.025)
AGE βdreg5 -0.535∗∗∗ -0.574 0.893∗∗∗ 0.868∗∗∗
(0.083) (0.348) (0.348) (0.090)
AGE2 βdreg6 0.005∗∗∗ 0.006 -0.009∗∗∗ -0.009∗∗∗
(0.001) (0.004) (0.004) (0.001)
URB βdreg7 -0.163∗∗∗ -0.105 -2.478∗∗∗ -2.449∗∗∗
(0.038) (0.941) (0.949) (0.095)
UNEMP βdreg8 1.863∗∗∗ 1.840∗ -0.173 -0.103(0.334) (1.087) (1.059) (0.945)
EDUC βdreg9 -0.156 -0.587 2.652∗∗∗ 2.640∗∗∗
(0.417) (1.221) (0.797) (0.788)
Constant βdreg0 18.808∗∗∗ 5.149∗∗∗ - -(1.958) (0.464) - -
σεi - 0.258
R2 0.115 -LL -7968.281 -7467.933N 4407 4407
Notes: Robust standard errors (clustered at the LSA level) are reported in parentheses. ***,**,* denotesstatistical significance at the 1%, 5%, and 10% level, respectively. Dependent variable is the differencebetween subscription revenue and channel affiliation payments per-subscriber (vi`t), measured in hundredsof dollars per year. Qit is the sum of all subscribers across all LSAs for cable company i in year t. Thedreg = 0 columns correspond to the parameter estimates over the 1990-1994 period, and the dreg = 1estimates are for 1995-1996. All demographic variables are defined in Table A.2. Both specifications includea linear and quadratic trend term.
62

households in rural areas have less alternatives to watching television in their leisure time
than do households in urban centers. Income, age, and educational attainment all have a
positive impact on profitability, however the estimated marginal effect of income is not as
precisely estimated as the effects of age and education.
Focusing on the parameters of interest, national subscribership has a higher marginal
effect that is diminishing at a more rapid rate in the years following the policy change.
Testing the individual hypotheses that βdreg=01 = βdreg=1
1 and βdreg=02 = βdreg=1
2 yields
P-values of P = 0.187 and P = 0.127 respectively.22 Although these differences not are
statistically significant at standard levels, their difference in magnitude has a large impact
on firms’ merger incentives, as shown in the counterfactual experiments below. Interpreting
the coefficients, an increase in national subscribership by a cable operator of 100,000 sub-
scribers raises annual variable profits per-subscriber by $22.20 and $25.90 for the pre and
post-policy periods respectively. In monthly terms, these values are $1.85 and $2.16 per
subscriber, per month. This jump in national subscribership for an LSA is not uncommon
given the pattern of large firms purchasing small firms in the data.
An example of a hypothetical acquisition helps shed light on what the per-subscriber
profit function estimates imply for the acquisition game. Consider a potential merger in
1994 involving two cable companies in the Southwestern British Columbia region, Re-
liance Distributors and Shaw Cablesystems. Reliance serves the LSA for Squamish, British
Columbia, which has 4,415 subscribers. Shaw, the dominant cable company in Western
Canada, has 1,171,214 subscribers nationally, many of which reside in nearby LSAs around
Vancouver. Ignoring any agglomeration or firm-specific effects on profits, the parameter
22A joint test of the equality of the two parameters also fails to reject the null (P = 0.301), as does a jointtest of the equality of all coefficients between the 1990-1994 and 1995-1996 periods.
63

estimates for the pre-1994 period imply that Shaw can earn $664,249 additional subscrip-
tion profits due to the scale effect on profits if it takes over Reliance’s LSAs. If the exact
same acquisition scenario presents itself after the deregulation in 1995, the first-step esti-
mates imply that Shaw would generate $747,240 dollars of subscriber-based surplus. This
$82,990 rise in surplus due to the policy change implies that the acquisition is feasible for
a larger region of the support of the merger-specific shocks in 1995 than it is for 1994.23
This is the sense in which the deregulation stimulates merger activity in the model.
The second stage estimates for the merger and entry cost functions are found in Table
3.2. Evaluating these functions at the mean values of LSA-subscribership and economies
of density between two firms in the data, I obtain predicted acquisition and entry costs
of $631,669, and $383,943. These values are respectively 28.6% and 17.6% of the mean
subscription profit level for an LSA ($2,180,659). These predictions reflect the large sunk
costs related to capital upgrades and new equipment that acquiring/entering firms spend
prior to entering new locations.24 Interpreting the coefficients, an additional subscriber
amongst a set of acquired LSAs raises acquisition and entry costs by $32.20 and $22.12
dollars respectively. Economies of density have a modest effect on acquisition surplus.
Consider for example a merger between two firms who own one LSA apiece. Suppose the
distance between the two LSAs is 75 < D kilometres. If the distance between the two
LSAs falls by 50 kilometres, then the merger cost falls by $2,731.41, or 0.43% of the mean
acquisition cost. This indicates that firms are limited in their ability to spread their fixed
costs of operation locally.
23That is, the merger yields positive surplus over a larger region of the support in 1995 than in 1994. Thechange in the likelihood of the merger is ambiguous as it depends on the relative growth of the other mergeropportunities for Reliance and Shaw.
24Figures A.2 and A.3 in the Appendix highlight how these merger-related sunk investments can range inthe hundred of thousands of dollars.
64

Table 3.2: Fixed, Acquisition and Entry Cost Parameter Estimates
Variable Parameter Estimate
EOD fc2 -1.023∗∗∗
(0.055)Constant (AC) ac0 3.713∗∗∗
(0.004)Qit ac1 0.322∗∗∗
(0.087)Constant (EC) ec0 2.050∗∗∗
(0.074)Qit ec1 0.221∗∗∗
(0.002)
ACSt (mean acquisition cost) 6.317ECSt (mean entry cost) 3.839σε 1.886Log-Likelihood -41447
Notes: Standard errors are reported in parentheses. They correspond to outer-product-of-the-gradient (orOPG) estimates using numerical derivatives of the log-likelihood function. This assumes the first-stage profitfunction estimates are computed without error. ***,**,* denotes statistical significance at the 1%, 5%, and10% level, respectively. The coefficients ac0 and ec0 are in terms of hundred of thousands of dollars, andmc1and ec1 are measured in terms of hundreds of dollars per-subscriber. The economies of density parameter, fc2is in terms of hundred of thousands of dollars. The mean values for an LSAs subscribership and economiesof density between two firms is 8086 subscribers and 0.0784 respectively. All nominal dollar amounts are in1992 constant dollars.
3.5.2 Economies of Scale, Density, Deregulation and Acquisition Ac-
tivity
In this section I use simulations to see how well the estimated model predicts acquisition
and entry activity, and to isolate the separate impacts that economies of scale and density.
All results are reported in Table 3.3, and I provide graphical representations with Figures
3.7-3.9 to help ease comparison across the experiments.
For a given parameter vector θ, I simulate data with the model as follows:
65

1. Start in year t = 1990. For each region, draw firm-specific variable profit randomeffects εim for all initial incumbents using the estimated random effects variance fromthe first step, σεi .
2. For each possible merger, draw an εSmt merger-specific shock. Draw a εi for allpotential entrants using σεi .
3. Compute merger surplus values for all possible mergers using equation (3.8).
4. Find the unique stable merger structure by the iterative approach provided by Farrelland Scotchmer (1988) for each of the M regions.
5. Update the LSA-ownership distribution for each region. Compute the new nationalsubscribership for all remaining firms.
6. Stop if the year is 1996, otherwise move to year t+ 1 and go back to Step 2.
All predictions correspond to mean acquisition and entry levels for 500 simulated se-
quences. I first forward-simulate sequences of acquisition/entry outcomes using my pa-
rameter estimates. The first two pairs of columns in Table 3.3 and Figure 3.7 shows that
the model predicts acquisition and entry levels well, including the rise in acquisition levels
following the policy change.
The remaining two pairs of columns in Table 3.3 and Figures 3.8 - 3.9 present results for
two counterfactual experiments. The first counterfactual removes the impact of economies
of scale on variable profits by setting βdreg=01 = βdreg=1
1 = βdreg=02 = βdreg=1
2 = 0. Figure
3.8 shows a stark decline in acquisition rates, with no spike in acquisitions in 1995, since
the channel through which the deregulation affects firms’ relative profits is shut down.
Overall, acquisition levels fall by 42%, falling as much as 62% in 1995. Thus, the scale
effect on firms’ subscription profits plays a major role in firms’ acquisition decisions, and
is fundamental to the process whereby large cable companies acquire small firms in the
industry over time. Local entry rises in the absence of scale effects, as fewer incumbent
mergers leads to smaller incumbent cable companies, which lowers entry costs.
66

Table 3.3: Counterfactual Experiments Predictions
Year Observed Predicted Experiment 1 Experiment 2
Entry Acq. Entry Acq. Entry Acq. Entry Acq.
1990 32.00 11.00 31.80 19.09 21.71 20.23 27.17 19.231991 22.00 19.00 23.00 19.86 15.43 19.94 21.23 20.291992 14.00 17.00 13.91 15.54 8.23 16.43 13.40 16.201993 12.00 13.00 11.63 12.74 6.63 12.74 10.91 12.511994 10.00 11.00 12.71 10.94 6.86 11.69 11.80 11.831995 24.00 11.00 22.57 11.94 9.17 12.71 21.09 12.171996 15.00 9.00 15.17 6.11 6.34 6.20 14.40 7.26
Notes: “Entry” and “Acq.” correspond to average entry and acquisition counts obtained from 500 forwardsimulations of the model. The column header definitions are as follows:Predicted: Parameter estimates from the 2-step estimation procedureExperiment 1: No economies of scale effects on variable profits: β0
1 = β02 = β1
1 = β12 = 0
Experiment 2: No economies of density effects on acquisition costs: fc2 = 0
The simulated merger counts from the first experiment also illustrate how the partial
deregulation in 1994 stimulates merger activity in 1995. In particular, by removing the
scale effects on profits, I effectively shut-down the channel through which the deregulation
affects merger incentives as my empirical specification picks up the deregulation’s effect on
variable profits through the estimates for βdreg1 and βdreg2 for dreg = 0 and dreg = 1. Figure
3.9 clearly shows that without regulatory change acquisitions do not jump in 1995. Rather,
they continue to monotonically decline, as firms deplete the remaining merger surplus in
the industry over time. Thus, deregulation largely accounts for the spike in acquisitions
in the part of the sample. The predictions for entry levels are relatively unaffected, as the
pre-1994 growth in incumbent cable companies is sufficient to suppress entry in the latter
part of the sample.
The second experiment removes the effect economies of density have on fixed costs by
67

Figure 3.7: Model Predictions
010
2030
Buy
out C
ount
1990 1992 1994 1996Year
Acquisitions: Data Acquisitions: SimulatedEntry: Data Entry: SimulatedNew Channels Licensed
Figure 3.8: No Density Economies
010
2030
Buy
out C
ount
1990 1992 1994 1996Year
Acquisitions: Data Acquisitions: SimulatedEntry: Data Entry: SimulatedNew Channels Licensed
Figure 3.9: No Policy Change
010
2030
Buy
out C
ount
1990 1992 1994 1996Year
Acquisitions: Data Acquisitions: SimulatedEntry: Data Entry: SimulatedNew Channels Licensed
setting fc2 = 0. The results for this counterfactual are listed in the fourth pair of columns
in Table 3.3, and are illustrated by Figure 3.9. The impact on acquisition levels is modest
as total acquisitions fall by 6.98% overall. There is a negligible rise in entry rates due to the
slight reduction in incumbent merger activity. The fall in acquisitions arises from the direct
effect of fixed costs not being reduced by agglomeration, but also an indirect effect as fewer
acquisitions early in the sample, reduces the number of large firms that could later generate
merger surplus through the scale effect on variable profits. Given the regional clustering of
68

large cable companies observed in the data, this finding is somewhat surprising. It suggests
that the large regional clusters emerged primarily from larger companies buying out small
ones to capture surplus created by scale effects on variable profits, not large fixed cost
savings due to economies of density.
3.5.3 Merger and Entry Policy Experiments
In the presence of scale effects on profits, if firms are free to acquire each other (as is the
case with the CRTC), the industry will likely consolidate over time and dominant firms will
emerge in the long run. A question of interest for policymakers in this context is what can
policy do to ensure that the dominant firms that emerge are productive. That is, can policy
protect against having large but unproductive firms in the long-run?
The problem from a policy perspective for consolidating industries with scale effects
is that of path-dependence. As incumbent firms grow over time, it becomes increasingly
easy for them to continue acquiring smaller firms due to scale effects. However, since new
entrants enter the industry through the acquisition of smaller incumbent firms, scale-driven
acquisitions by large incumbents can restrict entry activity as larger firms are more costly to
acquire than small ones. This ultimately prevents relatively more productive entrants from
acquiring unproductive incumbents. The CRTC may therefore want to slow acquisition
activity or subsidize entry early in the industry’s life cycle to give productive entrants a
chance to enter the industry before scale-dominant firms are established.
I perform two sets of policy experiments that investigate the impact that entry subsidies
or policies that increase merger costs (say through merger fees imposed by the CRTC)
have on the long-run distribution of firm-specific effects as the industry consolidates. The
69

Table 3.4: Merger Fees and Entry Subsidies Policy Experiments
Percentiles of εi Distribution in 2010
Experiment Mean 2.5 5 25 50 75 95 97.5
Model Predictions 0.234 -0.436 -0.373 -0.122 0.048 0.234 0.537 2.97125% Entry Costs 0.272 -0.442 -0.388 -0.142 0.034 0.245 1.020 4.02850% Entry Costs 0.300 -0.439 -0.382 -0.131 0.044 0.254 0.947 4.528125% Acquisition Costs 0.325 -0.431 -0.374 -0.121 0.050 0.252 0.918 5.198150% Acquisition Costs 0.326 -0.429 -0.370 -0.126 0.052 0.254 0.867 5.313
Notes: Mean and percentiles correspond to distribution of εi at T = 20, where I assume local covariates fort >1996 are as they are in 1996. The time-invariant, firm-specific effects are drawn from a normal distributionwith mean zero and variance 0.251, which is estimated in the first step of the estimation procedure. All results arebased on 500 forward simulations of the model.
first set of experiments look at entry subsidies that reduce entrant acquisition costs by one-
quarter and one-half from 1990 to 1992. The second set of experiments impose merger
fees that increase incumbent acquisition costs by one-quarter and one-half from 1990 to
1992. I forward simulate the data for 20 years according to the six-step procedure outlined
in Section 3.5.2 above. These simulations ignore any future changes in the industry, such
as the entry of DBS or the introduction of phone, internet and cable bundling that arrive in
the late 1990’s.
The results from the simulations are presented in Table 3.4. I present the mean and
seven percentiles from the distribution of the firm-specific effects in the industry for the
20th year of the forward simulations.25 For comparison, I provide predictions from the es-
timated model in the first row. Comparing the predictions from the first and the remaining
four rows, I find that initial entry subsidies and acquisition fees yield higher average pro-
ductivity. The rise in the mean of the firm-specific effects ranges from 16% to 39% across
the four counterfactual policies. As illustrated from the percentiles, this rise in average
25Formally, the distribution consists of: ε4imt | i ∈ Nmt,m = 1 . . .M, t = 2010.
70

productivity is driven by an increase in the mass in the right tail of the long-run productiv-
ity distribution. As the magnitude of the entry subsidies or merger fees increases, average
productivity rises, and the increase is more pronounced for the rise in entry subsidies. The
results further show that policies that increase merger costs are more effective in increasing
long-run productivity. However, I am hesitant to draw absolute conclusions over which
policy is “better,” since it depends on the chosen entry subsidy level or the factor by which
acquisition costs are increased.
Although these results are specific to the Canadian cable television industry, they high-
light a broader issue for merger or entry policies in industries where scale effects are
present. In such industries, if firms are free to acquire each other, dominant firms are
likely to emerge over time and their scale effects alone can make it increasingly difficult
for more productive firms to enter. The cable television provides an example of such an in-
dustry, however in other industries such as the airlines industry or the online social-media
industry, there are advantages to being large and dominant firms are likely to arise in the
long-run.26 These policy experiments suggest that authorities should be very cautious in
approving acquisitions in the early years of these industries’ life-cycle. Specifically, my
findings suggest that entry subsidies or slowing initial consolidation in industries with scale
effects can help ensure that a rich pool of entrants is initially established. The productive
firms are more likely to remain and grow through their relative productivity advantage, as
well as through scale effects over time. If unproductive firms are permitted to grow ini-
tially through acquisitions, they can subsequently grow and suppress potential entry solely
through scale effects. It is this long-run outcome of having large, unproductive firms that
initial entry subsidies or restrictive merger policy can help avoid.
26In the case of social media, the industry is characterized by network-effects. In such industries there is arelative advantage to being large since larger networks are more valuable to consumers on those networks.
71

3.6 Concluding Remarks
In this chapter, I have developed a model of acquisitions and entry for an industry that is
subject to exclusive territorial licensing. The model is estimated using unique profit and ac-
quisition data for the Canadian cable television industry over the 1990-1996 period. I find
that large cable companies earn more profits per subscriber than small ones, and that this
scale effect is the main driver of acquisitions in the industry. Controlling for scale effects,
economies of density are found to have a relatively smaller impact on firms’ merger incen-
tives than expected a priori. I also study the interaction between deregulatory policy and
merger activity. The 1994 deregulation increases the scale effect on firms’ profits, which
gives large firms an additional incentive to buyout smaller cable companies. Through coun-
terfactual simulations, I show that this policy change is largely responsible for the observed
rise in acquisition behavior that follows the deregulation in the data. Finally, I provide a set
of experiments that show how policies that stimulate entry or reduce acquisition levels in
the industry’s infancy can lead more productive dominant firms in the long-run.
72

Chapter 4
The Welfare Effects of Acquisitions in
the Cable Television Industry
This chapter develops a multi-product monopoly model in the spirit of Rochet and Stole
(2002), and estimates its parameters using a unique panel dataset for the Canadian cable
television industry from 1990-1996. An important feature of the model is that firms set both
the prices and characteristics of the products they offer (i.e., their cable bundles). Using
the estimated model, I quantify the welfare effect of mergers in the industry and highlight
the importance of accounting for merger-induced changes in both prices and products for
merger evaluation.
In the past two decades, economists have made significant progress in understanding
differentiated product markets by developing rich discrete-choice demand models that ac-
count for endogenous price setting by firms.1 Firms are typically assumed to play a differ-
entiated Bertrand pricing game in these models, implying that observed prices correspond
1Perhaps the most notable of these papers is the seminal contribution of Berry, Levinsohn, and Pakes(1995).
73

to the game’s Nash Equilibrium.2 One important form of analysis these models permit
is merger evaluation, as first discussed at length by Nevo (2000). To conduct a merger
analysis, one first estimates a demand system under the Bertrand-Nash assumption. Using
the estimated demand system, mergers can be simulated by assuming that a collection of
“merging” firms perfectly coordinate on prices in the pricing game. The welfare effects of
mergers can be quantified by calculating changes in consumer and producer surplus from
the difference in predicted prices under the “no-merger” and “merger” scenarios.
Fundamental to this sort of welfare analysis are the maintained assumptions that firms
take as exogenous the characteristics of the products they offer and that firms only compete
on prices. Thus, any potential changes in the nature of the products offered post-merger
are completely abstracted from.3 These two assumptions are challenged by the findings of
various empirical studies that show mergers can affect both prices and product characteris-
tics in differentiated product markets. For example, Berry and Waldfogel (2001) find that
product variety in the U.S. Radio Broadcasting Industry rises following an induced merger
wave from the introduction of the 1996 Telecommunications Act. Unfortunately, extending
the empirical methods discussed above to allow for endogenous product characteristics is
non-trivial since models of strategic price and product setting are quite complex, even for a
small number of competitors.4 As a result, the existing empirical literature on differentiated
product markets lacks evidence on the welfare effects of mergers due to merged induced
changes in prices and product characteristics.
2In addition to facilitating merger analysis, the Nash assumption yields additional moments for estimatingand identifying the model. Furthermore, firms’ marginal costs can be recovered by inverting the first orderconditions that characterize firms’ optimal responses in the differentiated Bertrand pricing game.
3Nevo (2000) (p. 146) originally notes this potential shortcoming of his analysis.4Ghandi, Froeb, Tschantz, and Werden (2008) provide a recent theoretical analysis on mergers in a model
where firms are allowed to set prices and location. Using simulations, they show that merging firms havean incentive to reposition their products post-merger to reduce cannibalization amongst their portfolio ofproducts.
74

In this chapter, I study the welfare effect of mergers using a model that endogenizes
firms’ price and product choice. My analysis focuses on the Canadian cable television in-
dustry from 1990-1996, a consolidating industry that experiences very active merger activ-
ity during this period. This industry and time period is particularly conducive for studying
acquisitions with endogenous price and product choice for two reasons. First, I am able to
exploit the fact that firms are licensed local monopolists in pre-defined geographic markets
which allows me to abstract from modelling complications related to strategic interaction.
Second, during this period cable companies do not bundle cable with other services (such
as phone and internet) and Direct Broadcast Satellite has not yet entered the market (it does
so in 1998). Thus, cable companies are local monopolists in the provision of cable services
who primarily earn profits by offering a discrete number of products to consumers in terms
of tiered cable bundles (i.e., basic and non-basic cable). These features of the industry
allow me to develop a merger analysis using the Rochet and Stole (2002) multi-product
monopoly model where both prices and product characteristics are endogenized. In this
model, firms are information-constrained as they only know the distribution over the con-
sumers’ willingness-to-pay for cable. Cable companies screen consumers by determining
the number of cable bundles to offer and the price and quality of each bundle.
The model is structurally estimated using a rich panel dataset on license-level cable
products, prices and market shares that I have constructed.5 A key feature of the empir-
ical specification is I allow for the possibility that firm size can affect cable companies’
per-subscriber marginal costs for cable bundles. This corresponds to the industry fact dis-
cussed in Chapter 2 that larger cable companies are in relatively advantageous positions in
5These data are discussed in Chapter 2 above.
75

negotiating channel costs with upstream channel providers.6 The model is estimated us-
ing a Simulated Method of Moments estimator that compares the model’s predictions for
prices, market shares, and number of cable bundles offered to those observed in the data.
Using the estimated model, I quantify the welfare effects of observed acquisitions follow-
ing an approach similar to that of Pesendorfer (2003). In particular, I contrast the predicted
consumer and producer surplus under the observed merger-induced change in market struc-
ture to a counterfactual “no-merger” scenario where I assume no acquisitions occur over
1990-1996 period.
My results corroborate previous findings that larger firms have lower marginal costs in
offering cable services. These scale effects are fundamental to the main finding of this pa-
per, namely that acquisitions lead to increases both in consumer and producer surplus. The
estimated model predicts that when large firms acquire small firms’ cablesystems they bring
higher quality cable bundles at higher prices to consumers at lower costs. The increase in
quality is sufficient to overcome the increase in prices to yield welfare gains to consumers.
Simply put, consumers face higher prices from larger cable providers, but are happy to pay
for the better quality cable bundles. Furthermore, increases in consumer surplus are found
to be more prominent in larger, more urban cablesystems that are more likely to be targeted
by dominant firms. The results also highlight the importance of accounting for merger in-
duced changes in prices and products (cable quality) in quantifying the welfare effects of
mergers.
The remainder of this chapter is structured as follows. The next section outlines the
literatures this chapter contributes to. Section 4.2 describes the Rochet and Stole (2002)
multi-product monopoly model that my analysis is based on. Section 4.3 proposes an6As noted in Chapter 2, Chipty (1995), Ford and Jackson (1997), Chipty and Snyder (1999), and Crawford
and Yurukoglu (2010) all find evidence that horizontal firm size (in terms of national subscribership) andvertical-integration affect cable companies’ marginal cost of cable bundles.
76

empirical specification for the model, develops a Simulated Method of Moments estimator
and discusses identification of the model. Section 4.4 presents the parameter estimates and
an analysis of how well the estimated model fits the data. The main empirical results on
the welfare effects of acquisitions are discussed in Section 4.5, and Section 4.6 concludes.
4.1 Related Literature
This chapter complements an empirical literature on market structure and differentiated
product markets by providing some of the first welfare calculations that account for both
endogenous prices and product characteristics. Berry and Waldfogel (2001)’s aforemen-
tioned study of changes in product variety following a merger wave in the U.S. Radio
Broadcasting industry is the most well-known paper in this literature. Sweeting (2010)’s
analysis of the effect of mergers on product positioning in the Music Radio Industry in the
U.S. is a recent paper that follows Berry and Waldfogel (2001)’s approach. Using detailed
playlist data, and taking merger decisions as exogenous, he finds that following a merger
a common owner of a portfolio of radio stations will increase the differentiation of its sta-
tions beyond their pre-merger level of differentiation. He further finds that a merged firm
will position its products closer to its competitors.
Recently, two papers in this literature have proposed structural approaches that aim to
quantify the welfare effects of mergers in differentiated product markets while allowing for
endogenous prices and product characteristics. Draganska, Mazzeo, and Seim (2009) pro-
vide an overview of merger analyses in differentiated goods markets and illustrate the use-
fulness of the methods they develop in Draganska and Seim (2008) for conducting merger
evaluations that allow for endogenous prices and product characteristics. They propose a
synthesis of the Berry, Levinsohn, and Pakes (1995) demand model and the Seim (2006)
77

strategic entry model that yields a two-stage game where firms first decide what prod-
ucts to offer and then what prices to charge conditional on the products offered.7 The
authors’ merger simulations show that not accounting for endogenous products can under-
state the impact mergers have on consumer welfare. A second paper by Fan (2010) also
develops a two-stage game where firms set product quality and subsequently choose prices
conditional on first-stage qualities. She uses the model to perform merger simulations
for the U.S. Newspaper industry and shows that allowing for endogenous products yields
smaller predicted consumer surplus losses and larger producer surplus gains due to merg-
ers. The consumer surplus results arise because firms tend to differentiate their products
post-merger to avoid cannibalization, which ultimately yields more product variety. One
difficulty these papers face is their models potentially have multiple equilibria which can
compromise merger simulations. The authors in these papers note this potential problem
but do not formally account for it in their merger analyses.8 I do not face these difficulties
because all the firms in my sample are local monopolists.
I also contribute to an established empirical literature on price discrimination. Crawford
and Shum (2006), Chu (2008), and Crawford and Yurukoglu (2010) have recently estimated
structural models of price discrimination in the U.S. cable television industry. These papers
respectively study quality degradation, the impact of Direct Broadcast Satellite entry, and
the welfare effects of bundling. Various other empirical papers have studied price discrim-
ination in a variety of markets including the cellular phone industry, Broadway Theatre,
Yellow Pages, and coffee shops (respectively, Miravete and Roller (2004), Leslie (2004),7The “entrants” from Seim (2006)’s model in this case are the products, each of which are assigned an
offering probability. Thus, the firms in market are taken as exogenous (i.e., there is no firm entry and exit),but the products are endogenous (i.e., there is product entry and exit with product-offering fixed costs).
8In principle, if one can find all equilibria for a given model then multiplicity of equilibria can be dealtwith directly. Jia (2008) and Bajari, Hong, and Ryan (2010) are examples of papers that take such an approachin estimating and simulating models of strategic interaction. Finding all equilibria in general is a very difficultproblem that can typically only be done under special circumstances.
78

Busse and Rysman (2005), McManus (2007)). My paper differs from previous studies by
focusing on the effect scale economies have on firms’ optimal screening decisions and the
corresponding welfare implications. Like Chu (2008), I study the impact that changes in
market structure have on prices and product characteristics, but differ in that I study cable
mergers whereas he studies satellite entry.
4.2 Model
This section develops an empirical model of a multi-product monopolist who sets prices
and product quality in the spirit of Rochet and Stole (2002). The model is similar to those
recently developed by Crawford and Shum (2006), Chu (2008), and more recently by Craw-
ford and Yurukoglu (2010). The latter two papers have data on the identity of channels
within cable bundles from Warren Publishing’s Cable and Television Factbook. Unfortu-
nately, I do not have this luxury which means I must use an empirical strategy that does
not require this information. Moreover, without these data I cannot model the vertical
relationship between channel and cable companies which is a limitation of my analysis. 9
4.2.1 Overview
The model describes the problem of an informationally-constrained cable monopolist who
knows the distribution of consumers’ willingness-to-pay (WTP), but not their individual
types. To maximize profits the firm decides on the number of cable bundles to offer, as
9While I do have data on channel counts, I do not use it in estimation as using counts alone would requirean assumption that each channel delivers the same marginal utility to consumers, which starkly contrasts withthe findings of these aforementioned papers.
79

well as the price and quality of each bundle. Bundle quality depends on the set of chan-
nels offered in a given bundle. Firms’ costs of offering bundles in turn depends on cable
operators’ upstream negotiations with channel companies over the per-subscriber cost of
offering a given channel in a given cable bundle. Consumers self-select into cable pack-
ages by making utility-maximizing choices given the cable package prices and qualities of
their local cable monopolist.
4.2.2 Demand
The utility that consumer i obtains from subscribing to cable bundle j offered by cable
company k in market n is given by:
uijkn = tiqjkn − pjkn ∀j 6= 0
ui0n = εi (4.1)
where ti is consumer i’s individual WTP for cable and εi is consumer i’s utility from con-
suming the outside good (i.e., their utility from not ordering cable).10 Consumers’ tastes
for cable depend on what free over-the-air channels are available or local alternative forms
of entertainment. Cable bundle quality and prices are respectively denoted by qjkn and
pjkn. Consumers’ WTP for cable are i.i.d across consumers and are drawn from a contin-
uous distribution with market-specific CDF Fn and PDF fn. The outside good preference
shocks are also i.i.d draws from a continuous distribution with CDF Gn and PDF gn. I
assume throughout that both distributions have unbounded support. Cable companies are
informationally-constrained as they know Fn, fn, Gn and gn, but not individuals’ WTP for
10For the sake of brevity in notation, I omit time subscripts throughout.
80

cable ti.
There are two points about the preference structure worth noting. First, as discussed
by Crawford and Shum (2006), in the absence of utility shocks to consumers’ outside
good, preferences would be strictly vertical ordered by consumers’ individual ti’s. Such
a preference structure would impose strong restrictions on consumers’ responses to price
changes in the model. For example, a proportional increase in prices for all products would
only reduce the demand for the lowest-quality cable bundle. Second, although the outside
option shocks create random participation in cable consumption, there is no random utility
in this model unlike discrete choice models that are typically used to study differentiated
product demand systems. Random utility would require an individual taste shock for each
good (εijkn ∀ j). Allowing for random utility in this model is challenging because doing so
would violate the single crossing condition on preferences that I exploit below that greatly
simplifies my characterization of consumer demand.
I use J to denote the collection of cable bundles offered in market n by firm k such that
j ∈ 1 . . . Jnk. The corresponding set of quality and prices for each bundle is denoted
by (pjkn, qjkn)Jnkj=1. Without loss of generality, I order package indices such that higher
quality packages are indexed by larger j values (i.e., qJnkis the highest quality cable pack-
age out of Jnk bundles offered by company k in market n). The tying requirement that
basic cable must be purchased before an individual buys non-basic cable ensures that cable
bundle quality can be ordered in this fashion.
Consumers choose the cable bundle that maximizes their utility. For a given set of
packages in market n, consumer i chooses package j if for all packages ` 6= j the following
81

set of incentive compatibility (IC) and individual rationality (IR) constraints hold:
u(qjkn, tikn)− pjkn ≥ u(qj`n, tikn)− pj`n ∀` 6= j (IC) (4.2)
u(qjkn, tikn)− pjkn ≥ ui0n (IR) (4.3)
For a given menu of Jnk packages, there are Jnk − 1 indifferent consumers in the WTP
distribution, each of whom are indifferent between package j and j + 1. These cut-off
types in the distribution are defined where:
u(qjkn, tjkn)− pjkn = u(qj+1n, tjkn)− pj+1n ⇒ tjkn =pjkn − pj+1n
qjkn − qj+1n
; J > 1 (4.4)
where tjkn is the WTP of the indifferent consumer between bundles j and j + 1. For
example, if Jnk = 2 there is a consumer located at t1kn who is indifferent between ordering
basic and non-basic cable (ignoring random participation shocks which affect the net utility
of both choices similarly). Thus all consumers with tikn ∈ [tjkn, tj+1n) demand package j,
where tjn = −∞ if j = 1 and tj+1n =∞ if j = Jn.
For a given vector of cut-types tjknJnkj=1, the market share for cable bundle j offered
by firm k in market n is computed as:
sjkn =
∫ tj+1
tj
[G(uijkn(ti))]dFn(t) (4.5)
where I denote market shares by sjkn and I make the dependence of uijkn on ti explicit.
Consumer i will consume good j if their individual WTP is between tj+1 and tj and if
good j delivers more utility than the outside good. Using market shares, I can compute the
total number of subscribers for good j offered by firm k in market n as Qjkn = sjknQn,
82

where Qn denotes the total number potential subscribers in market n.
4.2.3 Supply
Turning to the supply side, the total cost incurred by cable company k from offering cable
bundle j in market n is:
Cjkn(qjkn, Qjkn) = cjkn(qjkn)Qjkn − FCjkn (4.6)
The per-subscriber marginal cost of bundle j for firm k in market n is denoted by cjkn(qjkn).
Cable quality qjkn can be thought of as a hedonic index of the individual channels in-
cluded in bundle j. Conditional on qjkn, the marginal cost of quality is the sum of the
per-subscriber affiliation payments that downstream cable operators pay to upstream chan-
nel providers. Previous research shows that higher quality cable channels (inferred by
television ratings) comes at a higher marginal cost to cable companies.11 Therefore, I as-
sume that c(·) is independent of the number of consumers in market n and is increasing and
convex in quality: c′(·) > 0, c′′(·) > 0. The curvature assumptions on c(·) are standard
for this class of screening models and ensures an interior solution can be found.12 Be-
yond channel-related variable costs, firm k also incurs fixed costs for offering Jnk bundles
in market n, FCkn = FCjknJnkj=1. These reflect administrative, technical and marketing
expenses related to offering each tier of cable service.
Given a set of Jnk bundles with corresponding prices and qualities (pjkn, qjkn)Jnkj=1,
11See Crawford and Yurukoglu (2010) for recent evidence on the positive relationship between observedcable quality and cost.
12See Mussa and Rosen (1978) and Bensanko, Donnenfeld, and White (1987).
83

the total profits earned by cable company k in market n is:
πkn =
Jnk∑j=1
[(pjkn − cjkn)sjknQn − FCjkn
](4.7)
Firms maximize profits by choosing the number of cable bundles to offer and their corre-
sponding prices and qualities (J∗nk, (p∗jkn, q∗jkn)J∗knj=1). I find the solution for this screen-
ing problem using a nested optimization procedure that consists of two steps. For each
value of Jnk, I first find the prices and qualities that maximize variable profits (i.e., the
variable portion of 4.7). I then compute total profits at the optimal prices and qualities for
each Jnk and select the Jnk that yields the highest profits. In the context of cable television,
this amounts to computing maximal variable profits for basic and non-basic cable and then
selecting the number of cable bundles that maximizes total profits.
4.3 Empirical Specification
To estimate the model I adopt the following empirical specifications for the WTP distribu-
tion, marginal cost function and fixed costs:
tin = Xnβ + ξin (4.8)
cjkn(qjkn) = (Zcknγ)qjkn + (α/ρ)qρjkn (4.9)
FCjkn = Zfknη (4.10)
where ξin are individual-specific WTP shocks, Xn are LSA-level mean-WTP shifters, Zckn
are firm or market specific variables that affect marginal costs, and Zfkn are fixed cost
shifters. The WTP shocks are assumed to be i.i.d. mean-zero Normal random variables
84

with variance σξ. The outside option preference shocks are also i.i.d mean-zero Normal
random variables with variance σε.
I include a constant and measures of average household income, average age, and ur-
ban density at the LSA-level in Xn. These variables have been used previously by papers
that estimate demand for cable television in the U.S. (see Crawford (2000) for example). I
also include year dummies in Xn (except for 1996) to control for year-specific heterogene-
ity in tastes for cable. The marginal cost shifters Zckn include a constant and the number
subscribers firm k serves nationally. The inclusion of national subscribership allows me
to account for any potential scale effects in firms’ marginal cost of cable bundles. I also
include year dummies in Zckn to control for year-specific differences in firms’ cost of cable
quality. For example, time dummies will account for year-to-year differences in the list of
channels licensed by the CRTC (i.e., as more channels are licensed, firms’ are more able
to offer higher quality cable bundles). I parameterize FCjkn as being constant across firms
and LSAs such that constants F1 and F2 enter the total profit function. Throughout, I take
a LSAs potential market size Qn as exogenous. This value corresponds to the number of
homes passed within a LSA (i.e., those homes that are connected to the local cablesystem)
as measured annually by Statistics Canada on behalf of the CRTC. The vectors X and Zc
contain Xn and Zckn for all n and k.13 The parameter vector for the model is denoted by
θ = β, γ, α, ρ, F1, F2, σξ, σε.
4.3.1 Estimation
I estimate θ using a Simulated Method of Moments (SMM) estimator. For a given θ, I
compare the model’s predictions for prices, market shares and number of products offered,
13The data used in estimation has been discussed in Chapter 2 and details on their definitions and sourcesare listed in Table A.2
85

(respectively p1, p2, s1, s2, J) to those observed in the data across LSAs. In estimation, I
account for endogenous quality choice, but treat cable quality (q1, q2) as unobserved to the
econometrician. Moreover, the SMM estimator accounts for the firms’ selection over the
number of tiers to offer across cable systems. In the data, when only basic cable is offered,
cable companies code non-basic prices and shares with “0.” When simulating data with the
model, if I code non-basic prices and shares as “0” when only basic cable is offered, then
the simulated data is censored exactly like the real data, thereby allowing me to estimate θ
consistently.14
More specifically, for a given value of θ and K × 1 vector of all exogenous variables
Z, I find the optimal prices, qualities, market shares and number of products offered in
each market using the two-step optimization procedure discussed above. In total there are
K = 11 exogenous variables (constant, income, age, urban density, firm size and 6 time
dummies for 1990-1995). I denote the model’s predictions for prices, market shares, and
number of products offered p∗jknt(Z, θ), s∗jknt(Z, θ), J
∗knt(Z, θ). The following system of
h = 1 . . . H equations relates the model’s predictions to their empirical counterparts:
s1knt = s∗1knt(Z, θ) + us1knts2knt = s∗2knt(Z, θ) + us2knt
p1knt = p∗1knt(Z, θ) + up1kntp2knt = p∗2knt(Z, θ) + up2knt
Jknt = J∗jknt(Z, θ) + uJknt(4.11)
Stacking the econometric errors across all n = 1 . . . N markets and t = 1 . . . T years, I
denote the (N ×T ×H)×1 error vector as u(Z, θ) = [u′s1 u′s2u′p1
u′p2u′J ]′, where ui(Zi, θ)
is a typical (H × 1) element at the (LSA,year) level (i.e., i ∈ 1, . . . N × T and H = 5).
14See Hall and Rust (2003) for further details on SMM estimators for multi-equation, non-linear structuraleconometric models with data truncation and sample selection.
86

I estimate the model under the assumption that the prediction errors are orthogonal
to the exogenous variables in Z. By iterated expectations, I assume that the following
L = H ×K = 5× 11 = 55 moment equations hold at the true parameter vector:
E[Z ′iui(Zi, θ0)] = 0 (4.12)
Building from the moment conditions in (4.12), the SMM estimator for θ is defined as (see
Wooldridge (2002)):
θ = arg minθ∈Θ
[N×T∑i=1
W ′iui(Zi, θ)
]′Λ[N×T∑i=1
W ′iui(Zi, θ)
](4.13)
Wi is a H × K block diagonal matrix where each diagonal element is wi = Zi, and Λ
is a L × L positive definite weighting matrix. I obtain an initial consistent estimate of θ
using Λ1 = [(N × T )−1∑N×T
i=1 (W ′iWi)]
−1. Using the first-step estimate θ1, I compute
the predicted residuals from the model, ui(Zi, θ1) and use them to construct an optimal
weighting matrix Λ2 = [(N × T )−1∑N×T
i=1 (W ′i u(Zi, θ1)u(Zi, θ1)′Wi)]
−1, that I in turn use
to obtain an efficient second-step estimate θ2. To conduct inference, I compute standard
errors for θ2 by estimating its asymptotic variance matrix with the following estimator
(Wooldridge (2002)):
Ω =[N×T∑
i=1
W ′i∇θui(θ2)
]′(N×T∑i=1
W ′i ui(θ2)ui(θ2)′Wi
)−1[N×T∑i=1
W ′i∇θui(θ2)
]′−1
(4.14)
where∇θui(θ2) is the gradient vector of ui(θ2) with respect to θ evaluated at θ2.
87

4.3.2 Computational Details
There are three issues in computing the SMM objective function worth noting. First, I use
a smoothed simulator in predicting the number of cable bundles offered to ensure that the
SMM objective function is continuously differentiable. Rather than using an Accept-Reject
(AR) simulator, Train (2003) suggests using the following logit-smoothed AR simulator for
predicting whether two bundles are offered or not:
Si =e(πi[J=2]−F2)/λ
e(πi[J=1])/λ + e(πi[J=2]−F2)/λ
where λ is a smoothing parameter.
Second, I numerically integrate the integral that defines each cable bundle’s market
share defined in (4.5) using 200 draws from a Halton sequence (with a different prime
number seed for each observation). As noted by Train (2003), Halton sequences have
much better coverage properties than machine-generated pseudo random number genera-
tors, which reduces the variance of the market shares estimates.15 By using fewer draws,
I also reduce the computational cost in simulating market shares for all bundles, for each
observation.
Finally, calculating the SMM objective function is a computationally intensive task
since it involves solving N × T × JMAX non-linear optimization problems (i.e., finding
(p∗jkn, q∗jkn)J∗knj=1 for each possible Jnk value, for each observation). Since I can indepen-
dently compute s∗, p∗, J∗ across LSAs and time, I parallelize my code which allows me to
perform these LSA-level computations on multiple processors simultaneously. This sub-
stantially speeds up computation of the SMM objective function. I use the Nelder-Mead
15Train (2003) (p. 233) illustrates how estimates based on 100 Halton draws have lower variance thanestimates based on 1000 pseudo-random number draws.
88

Simplex method to find the qualities and prices that maximize variable profits given Jnk.
I minimize the SMM objective function using the Simplex method as well. I obtain infor-
mative starting values by performing an initial grid search over the parameter space.
4.3.3 Identification
The econometric model described above is identified if there exists only one value of θ0
that satisfies (4.12). In total, there are P = 26 parameters to estimate using L = 55
orthogonality/moment conditions. While the parameters move jointly to minimize the dis-
tance between the model’s predictions and their empirical counterparts, for expositional
purposes it is useful to describe identification separately for the demand and cost param-
eters. The taste parameters and demographic covariates within LSAs determine the level
and shape of the consumers’ WTP and outside options to consuming cable. Conditional on
the vector of cost parameters, this affects the model’s predictions over the firms’ optimal
prices, qualities, and corresponding market shares for basic and non-basic cable. Given the
distributional assumptions on WTP for cable and the outside option utility, cross-sectional
relationship between exogenous demographics and observed prices and market shares, is
therefore what identifies the preference parameters. For example, markets with higher av-
erage income tend to see higher market shares and price levels. This variation identifies
a positive average income effect on mean WTP for cable in the structural model. The
level of utility is identified from the normalization that the mean of outside option utility is
zero, and the scale is identified in terms of dollars since the parameters are estimated using
observed prices.
Holding the demand parameters constant, the marginal cost parameters are identified
89

under the assumed quadratic specification on marginal costs, the cross-sectional relation-
ship between exogenous firm characteristics (namely firm size), LSA characteristics that
affect non-content costs (urban density and per-subscriber wage and operating expenses)
and endogenous prices and market shares. Changes in the marginal cost parameters that re-
duce firms’ cost of quality lead to higher offered quality and prices, higher market shares in
one-bundle markets and generally shift market shares from basic to non-basic cable in two
bundle markets.16 Thus, if I observe a pair of two-bundle markets with similar demograph-
ics and prices, however one market is served by a larger cable company and has a relatively
larger share of consumers buying non-basic cable, this identifies a cable quality cost scale
effect.17 This sort of identifying variation can be seen directly for two-bundle markets in
Table 2.5 from Chapter 2 since large and small firms have similar average prices, however
the prior group have a relatively larger share of non-basic subscribers.
Since non-basic cable is tied to basic cable, and all firms offer at least basic cable
services in their LSAs, I cannot separately identify F1 from F2. Rather, I can only identify
their difference or the incremental fixed costs that must be incurred to offer non-basic cable.
Therefore, in estimation I normalize F1 = 0 and estimate only F2. Given a vector of
demand and marginal cost parameters (which together yield predictions for variable profits
for basic and non-basic cable), F2 is identified off of cross sectional variation in LSA
market size, and the number of bundles offered (i.e., one-bundle markets tend to have
smaller populations than two-bundle markets).
16Using simulated data for various sets of parameters, I find that lower cable quality costs do not alwayslead to higher basic market shares, particularly if the variance of the WTP distribution in a LSA is small.
17Analogously, if I observe a pair of one-bundle markets with similar demographics and prices, but themarket with the larger cable company has a higher basic market share, then this also identifies a scale effect.Similarly, if I observe similar market shares for larger and smaller firms, but higher prices for large firms, themodel predicts that larger firms are offering higher unobserved quality, which in turn identifies a scale.
90

4.4 Estimation Results
Table 4.1 presents the structural parameter estimates. On the demand side, the coefficients
for the impact of income, age, and urban density on average tastes for cable have their ex-
pected signs. The average value of the mean WTP for consumers across all LSAs and years
is $5.64 which compares to a mean cable price across all markets, periods and bundles of
$21.87.18 The average predicted quality offered to consumers in one-bundle markets is
$4.81 utility units, while mean quality for basic and non-basic cable across all two-bundle
markets is $4.20 and $5.96 respectively. Crawford and Shum (2006) find comparable im-
plied quality levels for the U.S. in 1998 ($3.61 for one-bundle markets, and $2.64 and $3.86
for basic and extended-basic for two-bundle markets in terms of real USD (1998=100).19
On the supply side, the mean predicted marginal cost per month for a basic cable bundle
is $15.68 in one-bundle markets, and $11.95 and $21.14 for basic and non-basic cable in
two-bundle markets.20 The corresponding monthly average predicted per-subscriber profit
margins realized by cable companies is $8.77 on basic cable in one-bundle markets, which
represents a predicted 56% mark-up over marginal cost on average. The analogous mar-
gins and percentage mark-ups for basic and non-basic cable in two-bundle markets are
$9.37 and $10.47 (78% and 50% mark-ups), respectively. These estimates suggest that the
local monopolists exercise considerable market power in extracting rents from their local
subscribers.18Using a similar model, Chu (2008) finds mean-of-mean consumer preferences ($12.84) and cable prices
($22.06) in 1997-dollars for the U.S. from 1993 to 2002. His model is estimated under a different parametricassumption on preferences (Weibull distribution) and under the assumption that the number of offered goodsoffered is exogenous.
19Crawford and Shum (2006) report mean predicted prices in the U.S. in 1998 for one-bundle markets of$19.82, and $21.89 and $15.98 respectively for basic and extended-basic cable in two-bundle markets (in1998 dollars). These compare to mean predicted prices of $23.33 for one-bundle markets, and $22.61 and$26.63 for two-bundle markets in Canada in 1992 dollars (see Table 4.2 below).
20These values are comparable in magnitude to the findings of Crawford and Yurukoglu (2010) for the U.S.
91
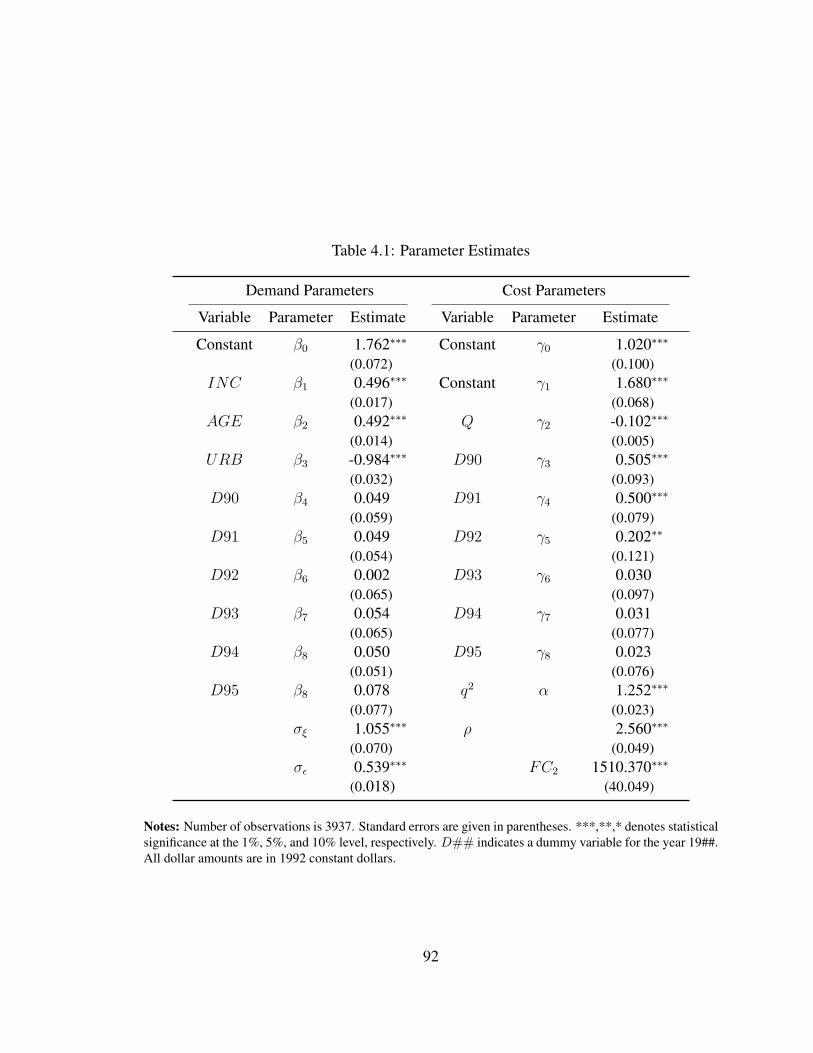
Table 4.1: Parameter Estimates
Demand Parameters Cost Parameters
Variable Parameter Estimate Variable Parameter Estimate
Constant β0 1.762∗∗∗ Constant γ0 1.020∗∗∗
(0.072) (0.100)INC β1 0.496∗∗∗ Constant γ1 1.680∗∗∗
(0.017) (0.068)AGE β2 0.492∗∗∗ Q γ2 -0.102∗∗∗
(0.014) (0.005)URB β3 -0.984∗∗∗ D90 γ3 0.505∗∗∗
(0.032) (0.093)D90 β4 0.049 D91 γ4 0.500∗∗∗
(0.059) (0.079)D91 β5 0.049 D92 γ5 0.202∗∗
(0.054) (0.121)D92 β6 0.002 D93 γ6 0.030
(0.065) (0.097)D93 β7 0.054 D94 γ7 0.031
(0.065) (0.077)D94 β8 0.050 D95 γ8 0.023
(0.051) (0.076)D95 β8 0.078 q2 α 1.252∗∗∗
(0.077) (0.023)σξ 1.055∗∗∗ ρ 2.560∗∗∗
(0.070) (0.049)σε 0.539∗∗∗ FC2 1510.370∗∗∗
(0.018) (40.049)
Notes: Number of observations is 3937. Standard errors are given in parentheses. ***,**,* denotes statisticalsignificance at the 1%, 5%, and 10% level, respectively. D## indicates a dummy variable for the year 19##.All dollar amounts are in 1992 constant dollars.
92

The parameter estimate for γ2 suggests there are scale effects that reduce the marginal
cost of cable bundles. For the median-sized company in the sample (Battlefords Cable in
1994), a one-standard deviation increase in firm size reduces the marginal costs for basic
and non-basic bundles by 24.6% and 25.4% on average across Battlefords Cable’s LSAs in
1994. The only comparable estimates for these findings are those found by Crawford and
Yurukoglu (2010), who estimate that a large cable company like Comcast in U.S. has 13%
lower input costs relative to a small cable operator. Taken together, these estimates suggest
that channel cost reducing scale effects are more prevalent in Canada in the early 1990’s
than in the U.S. through the 2000’s. There are various possible reasons for this including the
fact that the U.S. in the 2000’s has much more competition in the downstream cable market
(from cable companies, phone companies, Direct Broadcast Satellite, Internet television,
and so on) than Canada does in the early 1990’s (when only cable-specific companies were
in the market).
The estimated fixed costs for offering non-basic services is smaller in magnitude than
expected at $1510.37. I conjecture that the scale of this estimate is partly being driven by
the non-negligible mass of small LSAs (in terms of subscribership) that have only basic
cable in the LSA size distribution, which generally corresponds to the most rural LSAs in
the sample. Of the 992 LSAs in the data that has only basic cable (25.2% of all LSAs),
930 have less than 2000 subscribers. If, for example, the per-subscriber profit differential
was between offering basic and non-basic cable was $2 for all of these markets (which is
approximately the average margin differential between offering basic and non-basic cable
in the sample), this would imply that a non-basic fixed cost of only $2000 would rationalize
firms’ choice of offering basic cable only in these 930 small markets.
93

Tabl
e4.
2:M
odel
Fit
1990
1991
1992
1993
1994
1995
1996
Mod
elD
ata
Mod
elD
ata
Mod
elD
ata
Mod
elD
ata
Mod
elD
ata
Mod
elD
ata
Mod
elD
ata
One
-Bun
dle
Mar
kets
p 122
.38
20.8
123
.22
22.1
524
.14
22.5
225
.56
23.2
325
.42
22.8
725
.49
22.6
225
.28
24.2
0s 1
0.75
0.84
0.76
0.84
0.79
0.84
0.82
0.84
0.82
0.84
0.82
0.86
0.82
0.85
N14
912
715
514
718
315
915
615
214
714
814
815
012
410
9
Two-
Bun
dle
Mar
kets
p 121
.14
17.9
121
.25
18.2
521
.22
18.9
721
.35
19.4
821
.29
19.8
221
.49
19.9
721
.48
20.1
3p 2
31.8
832
.13
31.8
132
.23
31.5
731
.09
31.5
129
.92
31.4
530
.26
31.5
932
.84
31.4
933
.20
s 10.
510.
520.
500.
540.
460.
460.
410.
380.
400.
360.
400.
370.
380.
34s 2
0.30
0.28
0.32
0.28
0.38
0.35
0.44
0.44
0.46
0.45
0.46
0.43
0.48
0.46
N35
637
839
240
040
342
744
244
646
846
745
445
236
037
5
Not
es:M
eans
from
the
sam
ple
and
the
mod
el’s
pred
ictio
nar
ere
port
edin
each
cell.
All
dolla
ram
ount
sar
ein
1992
cons
tant
dolla
rs.
94

Table 4.2 shows that the predictions of the estimated model generally captures the basic
features of the prices, market shares, and the number of one and two-bundle markets in the
data from 1990-1996. The model matches the sample means for prices and market shares
better for two-bundle than one-bundle markets. Unlike Crawford and Shum (2006) who
allow the variance of the WTP distribution to depend on the number of bundles offered in a
market (which they assume is exogenous), my specification defines one WTP distribution
for all markets. They find that larger markets tend to have more disperse preferences for
cable than do small markets, which suggest that allowing for different WTP distributions
across markets can help in matching market shares and prices.21.
As another check on how well the model’s predictions line up with the data, I recover
the optimal qualities for all the LSAs as predicted by the estimated model and plot them
against the channel counts from the data. To the extent that a cable bundle’s quality de-
pends on the raw number of channels, we should expect a positive relationship between
predicted quality and channel counts, even if channel counts are not used in estimation for
reasons discussed above. Figures 4.1 and 4.2 present scatter plots of the model’s predictions
for basic and non-basic cable quality across LSAs and the corresponding channel counts.
Both figures show a positive correlation between predicted quality and the number of chan-
nels. Regressing predicted quality on channel counts for basic and non-basic cable yields
regression coefficients of 3.45 (t-stat=8.78) and 8.08 (t-stat=18.67). These findings are en-
couraging for the model’s performance as they suggest that the model does predict cable
quality in a way that is consistent with the number of channels cable companies actually
provide.
21I can potentially improve the fit of the model by allowing the variance of the WTP distribution to varyacross markets as function of local demographics as in Chu (2008)
95

Figure 4.1: Quality vs. Channels (Basic)
45
67
Pred
icted
Qua
lity
0 10 20 30 40 50Channel Count
(Channels, Predicted Quality) Regression Line
Figure 4.2: Quality vs. Channels (Non-Basic)
67
89
10Pr
edict
ed Q
ualit
y
0 10 20 30 40Channel Count
(Channels, Predicted Quality) Regression Line
4.5 Welfare Effects of Acquisitions
In this section, I use the model to study the welfare impact of acquisition-induced changes
in firms’ LSA ownership. Recall from Chapter 2 that acquisitions primarily see large cable
companies acquire small firms. The finding of scale economies in marginal costs from Ta-
ble 4.1 suggests a potential channel through which acquisition surplus can be generated.22
To quantify changes in surplus from mergers, I follow an approach similar to Pesendorfer
(2003). Specifically, I fix the firms and allocation of LSAs to what is observed in 1990,
and simulate the cable bundles that would have been offered from 1990 to 1996. I denote
this counterfactual market structure and corresponding set of cable bundles offered as the
“no-merger” scenario. To quantify the welfare effects of mergers, I compare predicted con-
sumer and producer surplus under the no-merger scenario to their counterparts under the
observed changes in market structure in the data which I denote the “merger” scenario.
It should be noted that these welfare calculations do not account for the impact that
22The reduced-form estimates for the per-subscriber profit function in Table 3.1 in Chapter 3 also point toscale effects in the relative profitability of cable companies.
96

Table 4.3: Welfare Effect of Mergers
Two-Bundle Markets One-Bundle MarketsBaseline Counterfactual Baseline CounterfactualMergers No-Mergers % ∆ Mergers No-Mergers % ∆
Welfare OutcomesConsumer Surplus 3.35 3.07 9.12 3.13 2.87 8.94
Producer Surplus 9.74 8.40 15.97 8.74 7.61 14.85Total Surplus 13.09 11.47 14.14 11.87 10.48 13.23
Other Outcomesp1 21.42 21.14 1.28 25.70 24.98 2.80p2 31.52 31.45 0.23 - - -q1 4.28 4.19 2.00 5.08 4.89 3.88q2 6.05 5.96 1.41 - - -s1 0.39 0.44 -12.61 0.82 0.80 2.27s2 0.47 0.41 13.37 - - -
mc1 10.98 11.88 -8.13 15.33 15.78 -2.89mc2 19.84 21.09 -6.32 - - -
Notes: LSAs are classified as one- and two-bundle markets according to the number of bundles offered underthe merger-scenario. All amounts are per-subscriber averages across all LSAs and periods, and are in 1992constant dollars.
cable company mergers have on the surplus of upstream channel providers. Crawford and
Yurukoglu (2010) have recently studied this vertical relationship and find that larger ca-
ble companies can obtain lower negotiated per-subscriber channel prices. Thus, horizontal
mergers by cable operators can be detrimental to channel companies in channel price ne-
gotiations. Since I do not incorporate these vertical relations explicitly in my model, I am
unable to account for this in my welfare calculations for the industry on the whole. Thus
my predicted changes in producer surplus due to mergers will be an upper bound on firms’
welfare gains.
Table 4.3 presents the welfare calculations and predictions for prices, quality and marginal
97

costs for one and two-bundle markets under the merger and no-merger scenario.23 Inter-
preting the welfare figures directly, the model predicts that on average consumers realize
a monthly surplus of $3.35 and $3.13 in two and one-bundle markets, respectively.24 For
two-bundle markets, I find that mergers increase per-subscriber consumer and producer
surplus on average by 9.12% and 15.97% respectively. There are also welfare gains in one-
bundle market that are slightly smaller by comparison (increases of 8.94% and 14.85% in
consumer and producer surplus, respectively).
The bottom panel of Table 4.3 highlights the merger-induced changes in prices, cable
quality and costs of firms that underly the welfare gains. Consumers are predicted to have
higher prices and cable quality for both basic and non-basic cable in two-bundle markets
under the merger scenario. The increase in cable quality is thus sufficiently large to off-
set the price increases to yield consumer surplus gains. One-bundle markets similarly see
increases in cable prices and quality that ultimately yield gains to consumers under the
merger scenario. For two-bundle markets, the relative increase in non-basic quality and
prices is such that more consumers purchase non-basic cable in the merger scenario than
in the no-merger scenario. Specifically, under the merger scenario non-basic market shares
are 13.37% higher, basic market shares are 12.61% lower, and the fraction of people pur-
chasing cable in two-bundle markets is higher overall. Profits are also higher under the
merger scenario for two and one-bundle markets, mainly due to higher prices and lower
per-subscriber marginal costs.
There are two features of the estimated model and data that drive the welfare gains and23These results are based on LSAs that have been previously acquired. There are small differences in
predictions for welfare and cable prices, quality and cost for non-acquired LSAs due to changes in firm sizefrom acquisitions from other LSAs. I present analogous calculations to Table 4.3 for these LSAs in Table A.4in the Appendix.
24Chu (2008) estimates that consumers in two-good markets for the U.S. realize a monthly surplus of$3.16 (USD) per month on average over the 1992-2002 period (he does not report the base year for deflatingnominal amounts).
98

Figure 4.3: CS Gains vs. Urban Density
0.5
11.
52
2.5
Con
sum
er S
urpl
us
0 50 100 150Urban Density
(Consumer Surplus, Urban Density) Regression Line
the finding of relatively higher welfare gains in two-bundle markets. First, there are scale
economies that reduce firms’ marginal costs of cable quality, that in turn allow larger ca-
ble operators to offer higher quality cable bundles which consumers are willing to pay for.
Second, recall the empirical facts from Section 2.3 that large cable companies are relatively
more active acquirers who tend to acquire larger, urban LSAs where two-bundles are of-
fered. Together, these two facts yield the increases in welfare and average per-subscriber
cost savings of 8.13% and 6.32% for basic and non-basic cable in two-bundle markets,
while the average predicted cost savings of one-bundle markets is only 2.89% by compari-
son.
Figure 4.3 and 4.4 further illustrate what types of acquired LSAs realize the highest
consumer welfare gains and how mergers affect the distribution of marginal costs. Figures
4.3 plot LSAs’ urban density against their predicted change in consumer surplus due to
mergers. I find a positive, statistically significant relationship between predicted consumer
99
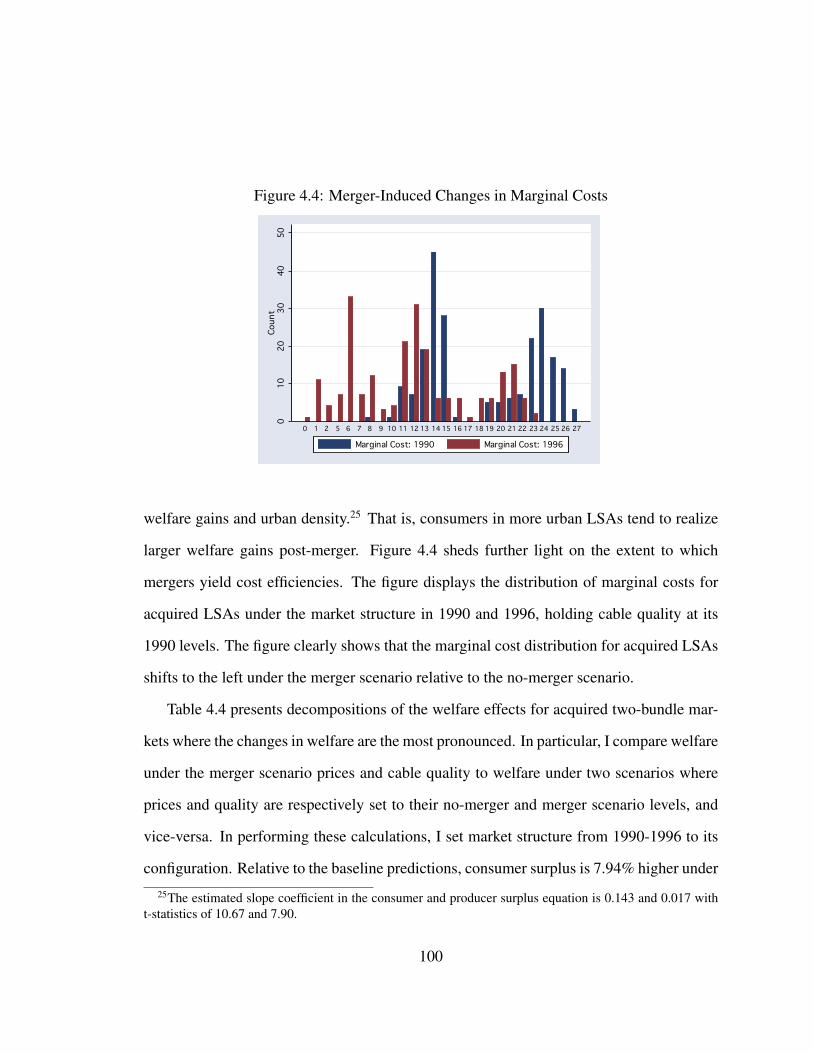
Figure 4.4: Merger-Induced Changes in Marginal Costs
010
2030
4050
Coun
t
0 1 2 5 6 7 8 9 10 11 12 13 14 15 16 17 18 19 20 21 22 23 24 25 26 27
Marginal Cost: 1990 Marginal Cost: 1996
welfare gains and urban density.25 That is, consumers in more urban LSAs tend to realize
larger welfare gains post-merger. Figure 4.4 sheds further light on the extent to which
mergers yield cost efficiencies. The figure displays the distribution of marginal costs for
acquired LSAs under the market structure in 1990 and 1996, holding cable quality at its
1990 levels. The figure clearly shows that the marginal cost distribution for acquired LSAs
shifts to the left under the merger scenario relative to the no-merger scenario.
Table 4.4 presents decompositions of the welfare effects for acquired two-bundle mar-
kets where the changes in welfare are the most pronounced. In particular, I compare welfare
under the merger scenario prices and cable quality to welfare under two scenarios where
prices and quality are respectively set to their no-merger and merger scenario levels, and
vice-versa. In performing these calculations, I set market structure from 1990-1996 to its
configuration. Relative to the baseline predictions, consumer surplus is 7.94% higher under
25The estimated slope coefficient in the consumer and producer surplus equation is 0.143 and 0.017 witht-statistics of 10.67 and 7.90.
100

Table 4.4: Decomposition of Merger Welfare Effects
Merger p No-Merger p Merger pMerger q Merger q % ∆ No-Merger q % ∆
Consumer Surplus 3.35 3.64 7.94 3.06 -9.56Producer Surplus 9.74 7.98 -22.12 8.04 -21.19Toal Surplus 13.09 11.62 -12.70 11.10 -17.98
Notes: LSAs are classified as one- and two-bundle markets according to the number of bundles offered underthe merger-scenario. All amounts are per-subscriber averages across all LSAs and periods, and are in 1992constant dollars.
merger scenario qualities and no-merger scenario prices, and 9.56% lower under no-merger
scenario prices and merger scenario prices. For both scenarios, producer surplus is higher
under the baseline case at the profit-maximizing merger scenario prices and quality.
Overall, my empirical findings highlight the importance of accounting for endogenous
price and product (quality) setting by firms in assessing the welfare effects of mergers.
Specifically, if merger-induced price increases are accompanied by changes in product
characteristics or quality that consumers prefer, then mergers can yield consumer welfare
gains if the negative price effect is dominated by positive product effects, as is the case
here.
4.6 Conclusion
This chapter has studied the welfare consequences of acquisitions in the Canadian cable
television industry. Using an empirical analogue to the Rochet and Stole (2002) multi-
product monopoly model, I perform counterfactual simulations to quantify the welfare im-
pact of acquisitions. I find that acquisitions yield non-negligible increases in consumer and
producer surplus, mainly for urban LSAs that are acquired by dominant cable companies
101

such as Rogers and Shaw. Fundamental to the welfare gains is the finding of cost-reducing
scale effects in cable operators’ marginal costs of cable bundles. These scale economies al-
low cable companies to serve consumers at a lower cost, while offering higher quality cable
services per dollar. My welfare analysis hinges on having a model that endogenizes prices
and product characteristics (i.e., cable quality). Cable prices and quality are predicted to
rise with mergers, however the rise in quality is sufficiently large to yield increases in con-
sumer surplus. By using a model with endogenous prices and product characteristics, I
highlight how merged induced increases in prices can be accompanied by welfare gains to
consumers if product quality rises as well.
102

Chapter 5
Conclusion
This dissertation has empirically studied mergers in the Canadian cable television industry.
Fundamental to the analysis is a rich panel dataset that I have constructed for the industry
from 1985-2004 that incorporates information from the CRTC’s Master Files and online
Decision and Notices regarding cable license ownership. By exploiting the fact that cable
companies are local monopolists within their licenses prior to 1998 (when Direct Broadcast
Satellite enters), I have developed empirical strategies that avoid modelling complications
related to strategic interaction to provide a uniquely in-depth analysis of the determinants
and welfare effects of mergers.
The empirical facts highlighted in Chapter 2 show how dominant firms emerge over
time by acquiring smaller, geographically proximate cable companies. By 2004, six cable
companies dominate the industry (Shaw, Rogers, Cogeco, Videotron, Persona and Bragg)
and they operate distinct regional clusters of cable licenses in Western Canada, Ontario,
Quebec and Atlantic Canada. Using a Poirier (1980) bivariate probit model, I find pre-
liminary empirical evidence that both economies of scale and density affect firms’ merger
decisions. Through regression analysis, I find that mergers are primarily associated with
103

increases in the number of non-basic prices and channel counts within LSAs. That is,
acquiring firms tend to enrich the cable offerings of the markets they acquire.
Chapter 3 further studies firms’ merger incentives in this industry by developing and
estimating an empirical merger model based on Farrell and Scotchmer (1988)’s coalition-
formation game. Using the estimated model, I conduct counterfactual simulations that
quantify the extent to which economies of scale and density affect equilibrium merger ac-
tivity. I find that economies of scale have a large impact on firms’ merger incentives while
density effects are relatively modest. These simulations also highlight how a 1994 partial
deregulation, that asymmetrically affects large and small firms’ relative profitability, stim-
ulates acquisition activity. Finally, I conduct a series of policy experiments that study the
impact entry subsidies and/or restrictive merger policies have on long-run market struc-
ture and the firm productivity distribution. I find that both policies yield more productive
dominant firms in the long-run as the industry consolidates.
Chapter 4 provides a unique analysis of the welfare effects of mergers in the Cana-
dian cable television industry that accounts for endogenous prices and product character-
istics (i.e., cable quality). I develop and estimate a variant on the Rochet and Stole (2002)
multi-product monopoly model and estimate its parameters using a Simulated Methods of
Moments estimator. Consistent with previous research for the cable television industry,
the estimates suggest there are scale effects that reduce cable companies’ marginal cost of
channel quality. Counterfactual simulations are performed to compare welfare under the
observed “merger scenario” in the data to a “no-merger” scenario, where I assume no merg-
ers take place from 1990-1996. I find that both consumer and producer surplus are higher
under the “merger” equilibrium. Consumers face higher cable prices and quality as a result
of mergers and are better off because the utility gains from higher quality are sufficient to
104

offset the utility losses due to price increases.
This dissertation primarily contributes to two active research agendas in empirical in-
dustrial organization, both of which are areas of future research. First, I have contributed to
a growing literature that examines industries’ life-cycle and the evolution of market struc-
ture through mergers, entry and exit. The primary issue in developing empirical strategies
for studying the dynamics market structure is the “Curse of Dimensionality” (Rust (1997)).
From the outset, it is clear that any strategic model that involvesN firms deciding to enter a
subset of L possible locations for T periods will face a severe dimensionality problem even
for small N or L. Further complicating the issue in consolidating industries, such as the
Canadian cable television industry, is the fact that firms experience explosive growth with
non-stationary entry and exit behaviour (for example, Shaw and Rogers always expand into
new markets in my data).
There appear to be two empirical models that researchers are using to study market
structure, agglomeration and industry dynamics.1 One group of papers use dynamic games
estimators developed by Aguirregabiria and Mira (2007) or Bajari, Benkard, and Levin
(2007) to study various industries including retail chains, the U.S. airline industry and
the U.S. cable broadcasting industry (respectively, Aguirregabiria and Vincentini (2006),
Aguirregabiria and Ho (2009) and Calfee Stahl (2009)). Another body of research uses
matching estimators developed by Sorensen (2007) or Fox (2009) to investigate agglom-
eration and market structure in various industries such as banking, wireless carriers and
1The study of Wal-Mart in the U.S. by three separate authors clearly illustrates how different authors haveused different models to study the same problem. Holmes (2010) studies the dynamics of Wal-Mart’s growthover time using a single-agent model that abstracts from any strategic interaction with other large chains likeK-mart or Target. On the other hand, Jia (2008) allows for strategic interaction between Wal-Mart and K-mart(but not Target), but abstracts from any dynamics as she uses a static entry model. Ellickson, Houghton, andTimmins (2010) employ a matching model similar to the merger model used in Chapter 3 that allows forstrategic interaction between Wal-Mart, K-mart and Target, but abstracts from dynamics and non-cooperativebehaviour.
105

retailers (respectively, Akkus and Hortacsu (2007), Bajari and Fox (2009) and Ellickson,
Houghton, and Timmins (2010)). Dynamic games estimators’ main advantage is that they
incorporate forward looking strategic behaviour by firms, but typically require assumptions
such as firms do not jointly decide on all locations in which to expand.2 Moreover, dynamic
games estimators rely on some form of stationarity in entry/exit decisions by firms which
is not observed in many interesting markets (such as in telecommunications or the case of
Wal-Mart). Matching estimators can account for the rich joint decision making of firms
across multiple locations, but abstract from forward-looking behaviour by firms.3
Given the complexity of network-formation games that characterize the evolution of
market structure in these studies, it is encouraging that methods have been adapted to make
progress in understanding how geography and strategic considerations affect long-run mar-
ket structure. Future research that helps distinguish the appropriateness of dynamic games
estimators versus matching estimators in studying market structure or innovations that help
cope with the Curse of Dimensionality will be invaluable to researchers in developing em-
pirical strategies.
This thesis also contributes to our understanding of differentiated product markets and
the importance of accounting for endogenous price and product characteristics in merger
evaluation. While Chapter 4 has produced novel findings on the welfare effect of mergers
in differentiated product markets by exploiting the fact that firms are local monopolists in
the estimation sample, the analysis is restrictive as it abstracts from competition. Devel-
oping a framework for demand estimation that accounts for endogenous price and product
2Rather authors who use dynamic games estimators have assumed firms have “local managers” acrosslocations who make entry and exit decisions while accounting for strategic complementarity of the decisionsof other local managers of geographically proximate locations.
3As stated in Chapter 3, I use a static matching estimator because firms explicitly state that they make jointmerger decisions in the CRTC Decision and Notice files and the consolidation process yields non-stationaryentry behaviour by large cable companies across the country over time.
106
characteristics would significantly enrich the array of demand models at our disposal, and
would also permit merger analyses in competitive markets where both prices and products
can adjust post-merger.
As noted in Chapter 4, Draganska, Mazzeo, and Seim (2009) have made initial progress
in incorporating product choice in a demand model. They develop a strategic two-stage
model where firms first determine the “location” of their products in attribute space and
then set prices given product choices. Product choice is modelled using Seim (2006)’s
strategic location model while equilibrium prices and demand is modelled using the Berry,
Levinsohn, and Pakes (1995) random coefficients discrete-choice model. The moment
inequality approach of Pakes, Porter, Ho, and Ishii (2006) is another avenue through which
endogenous product choice can be introduced into a demand model. Specifically, if firms
make a discrete choice over the products (or characteristics of the products) they offer, in
a Nash equilibrium their product choices must yield higher profits than any other possible
product choices, given the observed prices and product choices of their rivals. Using this
logic, one can construct a set of inequalities based on the Nash equilibrium conditions
given the observed product choices and prices of firms to empirically examine endogenous
product choice. Crawford and Yurukoglu (2010) take this approach in estimating their
model of the cable television industry for the U.S. where firms are assumed to compete on
prices and their discrete cable bundling decisions.
Regardless of the approach taken, extending empirical methods to allow for compe-
tition with endogenous prices and products is an important research frontier in studying
differentiated products markets. Undoubtedly, innovations along this research agenda will
have a large impact on how practitioners in academia, private consulting, and anti-trust
authorities estimate preference parameters and conduct merger evaluations.
107

Bibliography
AGUIRREGABIRIA, V., AND C.-Y. HO (2009): “A Dynamic Game of Airline NetworkCompetition: Hub-and-Spoke Networks and Entry Deterrence,” TECIPA Working PaperNo. 379, University of Toronto.
AGUIRREGABIRIA, V., AND P. MIRA (2007): “Sequential Estimation of Dynamic DiscreteGames,” Econometrica, 75, 1–53.
AGUIRREGABIRIA, V., AND G. VINCENTINI (2006): “Dynamic Spatial Competition Be-tween Multi-Store Firms,” TECIPA Working Paper No. 253-1, University of Toronto.
AKKUS, O., AND A. HORTACSU (2007): “The Determinants of Bank Mergers: A RevealedPreference Analysis,” mimeo, University of Chicago.
ANDRADE, G., M. MITCHELL, AND E. STAFFORD (2001): “New Evidence and Perspec-tives on Mergers,” Journal of Economic Perspectives, 15, 103–120.
BAJARI, P., C. L. BENKARD, AND J. LEVIN (2007): “Estimating Dynamic Models ofImperfect Competition,” Econometrica, 75, 1331–1370.
BAJARI, P., AND J. FOX (2009): “Measuring the Efficiency of an FCC Spectrum Auction,”Working Paper, University of Chicago.
BAJARI, P., H. HONG, AND S. RYAN (2010): “Identification and Estimation of DiscreteGames of Complete Information,” Econometrica, 78, 1529–1568.
BENSANKO, D., S. DONNENFELD, AND L. J. WHITE (1987): “Monopoly and QualityDistorition,” Quarterly Journal of Economics, 102, 743–767.
BERRY, S., J. LEVINSOHN, AND A. PAKES (1995): “Automobile Prices in Market Equi-librium,” Econometrica, 63, 841–890.
BERRY, S. T., AND J. WALDFOGEL (2001): “Do Mergers Increase Product Variety? Evi-dence from Radio Broadcasting,” Quarterly Journal of Economics, 55, 49–67.
108

BRASINGTON, D. M. (1999): “Joint Provision of Public Goods: The Consolidation ofSchool Districts,” Journal of Public Economics, 73, 373–393.
BRESNAHAN, T., AND P. REISS (1991): “Entry and Competition in Concentrated Mar-kets,” Journal Political Economy, 99, 977–1009.
BUSSE, M., AND M. RYSMAN (2005): “Competition and Price Discrimination in YellowPages Advertising,” Rand Journal of Economics, 36, 378–390.
CALFEE STAHL, J. (2009): “A Dynamic Analysis of Consolidation in the Broadcast Tele-vision Industry,” Working Paper, Boston University.
CHIPTY, T. (1995): “Horizontal Integration for Bargaining Power: Evidence From theCable Television Industry,” Journal of Economics and Management Strategy, 4, 375–397.
CHIPTY, T., AND C. M. SNYDER (1999): “The Role of Firm Size in Bilateral Bargaining:A Study of the Cable Television Industry,” Review of Economics and Statistics, 81, 326–340.
CHU, S. (2008): “The Effect of Satellite Entry on Product Quality for Cable Television,”Finance and Economics Discussion Series Working Paper 2008-12, FRB Washington.
CRAWFORD, G. (2000): “The Impact of the 1992 Cable Act on Household Demand andWelfare,” Rand Journal of Economics, 32, 422–449.
CRAWFORD, G., AND M. SHUM (2006): “The Welfare Effects of Endogenous QualityChoice: The Case of Cable Television,” manuscript, John Hopkins University.
CRAWFORD, G. S., AND M. SHUM (2007): “Monopoly Quality Degradation in CableTelevision,” Journal of Law and Economics, 50, 181–219.
CRAWFORD, G. S., AND A. YURUKOGLU (2010): “The Welfare Effects of Bundling inMultichannel Television,” Working Paper, Stanford.
DRAGANSKA, M., M. MAZZEO, AND K. SEIM (2009): “Addressing Endogenous ProductChoice in Merger Analysis,” Working Paper, Stanford.
DRAGANSKA, MICHAELA., M. M., AND K. SEIM (2008): “Beyond Plain Vanilla: Mod-eling Joint Pricing and Product Assortment and Pricing Decisions,” Quantitative Mar-keting and Economics, 7, 105–146.
ELLICKSON, P. B., S. HOUGHTON, AND C. TIMMINS (2010): “Estimating NetworkEconomies in Retail Chains: A Revealed Preference Approach,” NBER Working Pa-per 15832.
109

FAN, Y. (2010): “Ownership Consolidation and Product Quality: A Study of the U.S. DailyNewspaper Market,” Working Paper, University of Michigan.
FARRELL, J., AND S. SCOTCHMER (1988): “Partnerships,” Quarterly Journal of Eco-nomics, 103, 279–297.
FORD, G. S., AND J. D. JACKSON (1997): “Horizontal Concentration and Vertical Integra-tion in the Cable Television Industry,” Review of Industrial Organization, 12, 501–518.
FOX, J. (2009): “Estimating Matching Games with Transfers,” Working Paper, Universityof Chicago.
GHANDI, A., L. FROEB, S. TSCHANTZ, AND G. J. WERDEN (2008): “Post-Merger Prod-uct Repositioning,” Journal of Industrial Economics, 56, 49–67.
GOOD, L. M. (1974): “An Econometric Model of the Canadian Cable Television Industryand the Effects of CRTC Regulations,” Ph.D Dissertation, Department of Economics,University of Western Ontario.
GORDON, N., AND B. KNIGHT (2009): “A Spatial Merger Estimator with an Applicationto School District Consolidation,” Journal of Public Economics, forthcoming.
HALL, G., AND J. RUST (2003): “Simulated Minimum Distance Estimation of a Modelof Optimal Commodity Price Speculation with Endogenously Sampled Prices,” WorkingPaper, Yale.
HOLMES, T. J. (2010): “The Diffusion of Wal-Mart and Economies of Density,” Econo-metrica, Forthcoming.
JIA, P. (2008): “What Happens When Wal-Mart Comes to Town: An Empirical Analysisof the Discount Industry,” Econometrica, 76, 1263–1316.
JOVANOVIC, B., AND P. ROUSSEAU (2008): “Mergers as Reallocation,” Review of Eco-nomics and Statistics, 90, 765–776.
LAW, S. (1999): “Holding the Line: The CRTC and the Pricing of Canadian Basic CableTelevision,” Canadian Journal of Economics, 32, 630–653.
LAW, S. M. (1997): “Economic Policy Interactions: Intellectual Property Rights and Com-petition Policy; Exclusive Licensing and Rate Regulation,” Ph.D Dissertation, Depart-ment of Economics, University of Toronto.
LESLIE, P. (2004): “Price Discrimination in Broadway Theater,” Rand Journal of Eco-nomics, 35, 520–541.
110

MCFADYEN, . S., C. HOSKINS, AND D. GILLEN (1980): Canadian Broadcasting: MarketStructure and Economic Performance. Montreal: IRPP.
MCMANUS, B. (2007): “Nonlinear Pricing in an Oligopoly Market: The Case of SpecialtyCoffee,” Rand Journal of Economics, 38, 512–532.
MIRAVETE, E. J., AND L.-H. ROLLER (2004): “Competitive Nonlinear Pricing inDuopoly Equilibrium: The Early U.S. Cellular Telephone Industry,” Working Paper, UTAustin.
MUSSA, M., AND S. ROSEN (1978): “Monopoly and Product Quality,” Journal of Eco-nomic Theory, 18, 301–317.
NEVO, A. (2000): “Mergers with Differentiated Products: The Case of the Ready-to-EatCereal Industry,” Rand Journal of Economics, 31, 395–421.
PAKES, A., J. PORTER, K. HO, AND J. ISHII (2006): “Moment Inequalities and TheirApplication,” Working Paper, Harvard.
PARK, M. (2008): “An Empirical Two-Sided Matching Model of Acquisitions: Under-standing Merger Incentives and Outcomes in the Mutual Fund Industry,” Working Paper,University of Minnesota.
PESENDORFER, M. (2003): “Horizontal Mergers in the Paper Industry,” Rand Journal ofEconomics, 34, 495–515.
POIRIER, D. (1980): “Partial Observability in Bivariate Probit Models,” Journal of Econo-metrics, 12, 209–217.
ROCHET, J.-C., AND L. A. STOLE (2002): “Nonlinear Pricing with Random Participa-tion,” Review of Economic Studies, 69, 277–311.
RODRIGUES-NETO, J. A. (2007): “Representing Roomates’ Preferences with SymmetricPreferences,” Journal of Economic Theory, 135, 545–550.
RUST, J. (1997): “Using Randomization to Break the Curse of Dimensionality,” Econo-metrica, 65, 487–516.
SEIM, K. (2006): “An Empirical Model of Firm Entry with Endogenous Product-TypeChoices,” Rand Journal of Economics, 37, 619–640.
SORENSEN, M. (2005): “An Economic and Econometric Analysis of Market Sorting Withan Application to Venture Capital,” Ph.D dissertation, Stanford University.
111

(2007): “How Smart is Smart Money? A Two-Side Matching Model of VentureCapital,” Journal of Finance, 62, 2725–2762.
SWEETING, A. (2010): “The Effects of Mergers on Product Positioning: Evidence fromthe Music Radio Industry,” Rand Journal of Economics, Forthcoming.
TRAIN, K. E. (2003): Discrete Choice Methods with Simulation. Cambridge UniversityPress.
WEESE, E. (2009): “Political Mergers as Coalition Formation: Evidence from JapaneseMunicipal Mergers,” Working Paper, MIT.
WHITE, H. (1980): “A Heteroskedasticity-Consistent Covariance Matrix Estimator and aDirect Test for Heteroskedasticity,” Econometrica, 48, 817–838.
WOOLDRIDGE, J. M. (2002): Econometric Analysis of Cross Section and Panel Data.MIT Press (London).
(2006): “Cluster-Sample Methods in Applied Econometrics: An Extended Analy-sis,” Manuscript, Michigan State University.
112

Appendix A
Tables and Figures
Table A.1: Region Definitions
CensusRegion Name Economic Regions Total LSAs
Nova Scotia 10-50 75New Brunswick 10-50 38Quebec North 20, 50-70 109Quebec South 25-45 80Ontario East 10, 15, 90 145Ontario South 20-80 47Manitoba and Northern Ontario 95 (Ont.), 10-70 (Man.) 53Saskatchewan 10-50 133Alberta and Rockies 10-60 (Alb.), 30-40 (BC) 132British Columbia 10, 20, 50-70 124
Notes: Economic regions correspond to their 2001 Census definitions. Economic region numbers correspondto within-province region definitions, with the exception of multi-provincial regions where both the within-province regions are listed, with province in brackets. The .pdf file that maps these regions can be found at:http://geodepot.statcan.ca/Diss/Maps/ReferenceMaps/n er e.cfm
113
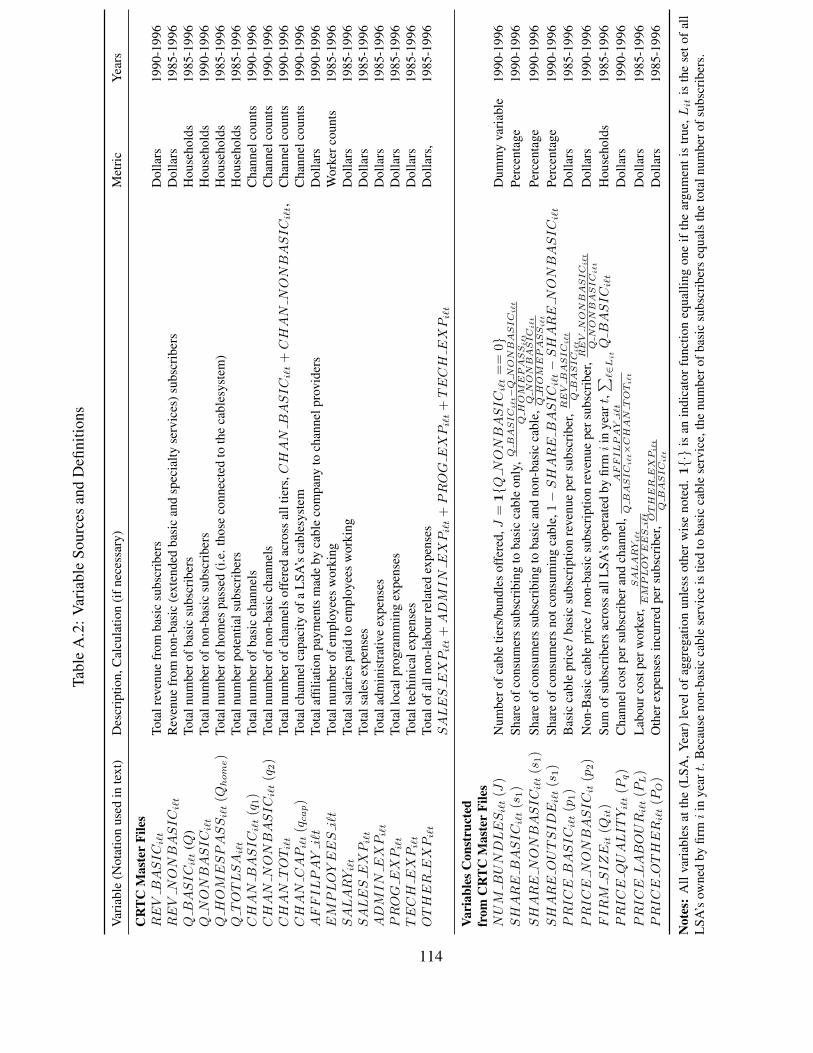
Tabl
eA
.2:V
aria
ble
Sour
ces
and
Defi
nitio
ns
Var
iabl
e(N
otat
ion
used
inte
xt)
Des
crip
tion,
Cal
cula
tion
(ifn
eces
sary
)M
etri
cY
ears
CR
TC
Mas
ter
File
sREVBASIC
i`t
Tota
lrev
enue
from
basi
csu
bscr
iber
sD
olla
rs19
90-1
996
REVNONBASIC
i`t
Rev
enue
from
non-
basi
c(e
xten
ded
basi
can
dsp
ecia
ltyse
rvic
es)s
ubsc
ribe
rsD
olla
rs19
85-1
996
QBASIC
i`t
(Q)
Tota
lnum
bero
fbas
icsu
bscr
iber
sH
ouse
hold
s19
85-1
996
QNONBASIC
i`t
Tota
lnum
bero
fnon
-bas
icsu
bscr
iber
sH
ouse
hold
s19
90-1
996
QHOMESPASSi`t
(Qhom
e)
Tota
lnum
bero
fhom
espa
ssed
(i.e
.tho
seco
nnec
ted
toth
eca
bles
yste
m)
Hou
seho
lds
1985
-199
6QTOTLSA
i`t
Tota
lnum
berp
oten
tials
ubsc
ribe
rsH
ouse
hold
s19
85-1
996
CHANBASIC
i`t
(q1)
Tota
lnum
bero
fbas
icch
anne
lsC
hann
elco
unts
1990
-199
6CHANNONBASIC
i`t
(q2)
Tota
lnum
bero
fnon
-bas
icch
anne
lsC
hann
elco
unts
1990
-199
6CHANTOTi`t
Tota
lnum
bero
fcha
nnel
sof
fere
dac
ross
allt
iers
,CHANBASIC
i`t
+CHANNONBASIC
i`t,
Cha
nnel
coun
ts19
90-1
996
CHANCAPi`t
(qcap)
Tota
lcha
nnel
capa
city
ofa
LSA
’sca
bles
yste
mC
hann
elco
unts
1990
-199
6AFFILPAYi`t
Tota
laffi
liatio
npa
ymen
tsm
ade
byca
ble
com
pany
toch
anne
lpro
vide
rsD
olla
rs19
90-1
996
EMPLOYEESi`t
Tota
lnum
bero
fem
ploy
ees
wor
king
Wor
kerc
ount
s19
85-1
996
SALARYi`t
Tota
lsal
arie
spa
idto
empl
oyee
sw
orki
ngD
olla
rs19
85-1
996
SALESEXPi`t
Tota
lsal
esex
pens
esD
olla
rs19
85-1
996
ADMINEXPi`t
Tota
ladm
inis
trat
ive
expe
nses
Dol
lars
1985
-199
6PROGEXPi`t
Tota
lloc
alpr
ogra
mm
ing
expe
nses
Dol
lars
1985
-199
6TECHEXPi`t
Tota
ltec
hini
cale
xpen
ses
Dol
lars
1985
-199
6OTHEREXPi`t
Tota
lofa
llno
n-la
bour
rela
ted
expe
nses
Dol
lars
,19
85-1
996
SALESEXPi`t
+ADMINEXPi`t
+PROGEXPi`t
+TECHEXPi`t
Vari
able
sCon
stru
cted
from
CR
TC
Mas
ter
File
sNUM
BUNDLESi`t
(J)
Num
bero
fcab
letie
rs/b
undl
esof
fere
d,J
=1Q
NONBASIC
i`t
==
0D
umm
yva
riab
le19
90-1
996
SHAREBASIC
i`t
(s1)
Shar
eof
cons
umer
ssu
bscr
ibin
gto
basi
cca
ble
only
,Q
BASIC
i`t−Q
NON
BASIC
i`t
QH
OM
EPASSi`t
Perc
enta
ge19
90-1
996
SHARENONBASIC
i`t
(s1)
Shar
eof
cons
umer
ssu
bscr
ibin
gto
basi
can
dno
n-ba
sic
cabl
e,Q
NON
BASIC
i`t
QH
OM
EPASSi`t
Perc
enta
ge19
90-1
996
SHAREOUTSIDE
i`t
(s1)
Shar
eof
cons
umer
sno
tcon
sum
ing
cabl
e,1−SHAREBASIC
i`t−SHARENONBASIC
i`t
Perc
enta
ge19
90-1
996
PRICEBASIC
i`t
(p1)
Bas
icca
ble
pric
e/b
asic
subs
crip
tion
reve
nue
pers
ubsc
ribe
r,REV
BASIC
i`t
QBASIC
i`t
Dol
lars
1985
-199
6PRICENONBASIC
it(p
2)
Non
-Bas
icca
ble
pric
e/n
on-b
asic
subs
crip
tion
reve
nue
pers
ubsc
ribe
r,REV
NON
BASIC
i`t
QN
ON
BASIC
i`t
Dol
lars
1990
-199
6FIRM
SIZE
it(Q
it)
Sum
ofsu
bscr
iber
sac
ross
allL
SA’s
oper
ated
byfir
mi
inye
art,∑ `∈
LitQBASIC
i`t
Hou
seho
lds
1985
-199
6PRICEQUALITYi`t
(Pq)
Cha
nnel
cost
pers
ubsc
ribe
rand
chan
nel,
AFFILPAY
i`t
QBASIC
i`t×CH
AN
TOTi`t
Dol
lars
1990
-199
6PRICELABOUR
i`t
(PL
)L
abou
rcos
tper
wor
ker,
SALARYi`t
EM
PLOYEES
i`t
Dol
lars
1985
-199
6PRICEOTHER
i`t
(PO
)O
ther
expe
nses
incu
rred
pers
ubsc
ribe
r,OTH
ER
EX
Pi`t
QBASIC
i`t
Dol
lars
1985
-199
6
Not
es:
All
vari
able
sat
the
(LSA
,Yea
r)le
velo
fag
greg
atio
nun
less
othe
rw
ise
note
d.1·
isan
indi
cato
rfu
nctio
neq
ualli
ngon
eif
the
argu
men
tis
true
,Lit
isth
ese
tof
all
LSA
’sow
ned
byfir
mi
inye
art.
Bec
ause
non-
basi
cca
ble
serv
ice
istie
dto
basi
cca
ble
serv
ice,
the
num
bero
fbas
icsu
bscr
iber
seq
uals
the
tota
lnum
bero
fsub
scri
bers
.
114

Tabl
eA
.2:V
aria
ble
Sour
ces
and
Defi
nitio
ns(C
ontin
ued)
Var
iabl
eD
escr
iptio
nM
etri
cY
ears
CR
TC
Dec
isio
nsan
dN
otic
esUNDERID
`L
SA/U
nder
taki
ngid
entifi
erN
/A19
85-2
004
YEAR
tY
eari
dent
ifier
Yea
r19
85-2
004
FIRMID
iFi
rmid
entifi
erN
/A19
85-2
004
MERGE
ijt
Indi
cato
requ
allin
gon
eif
firmi
andj
mer
gein
yeart
Dum
my
vari
able
1985
-200
4ENTER
itIn
dica
tore
qual
ling
one
iffir
mi
ente
rsth
ein
dust
ryin
yeart
Dum
my
vari
able
1985
-200
4LSABUYOUTit
Indi
cato
requ
allin
gon
eif
LSA
i’s
loca
lcab
leco
mpa
nych
ange
sin
yeart
Dum
my
vari
able
1985
-200
4LSAENTRYit
Indi
cato
requ
allin
gon
eif
LSA
i’s
first
year
ofca
ble
serv
ice
isin
yeart
Dum
my
vari
able
1985
-200
4DATEMERGEijt
Dat
ew
hen
firmi
andj
mer
geC
alen
dard
ay19
85-2
004
DATEENTERit
Dat
ew
hen
LSA
iis
first
ente
red
into
bya
cabl
eco
mpa
nyC
alen
dard
ay19
85-2
004
Stat
istic
sCan
ada
INFLATION
tA
nnua
lave
rage
ofse
ason
ally
adju
sted
mon
thly
CPI
Pric
eIn
dex
(199
2=10
0)19
85-2
004
CSDLSAMATCH
ijIn
dica
tore
qual
ling
one
ifth
em
idpo
into
fCSD
iis
clos
estt
oL
SAi
Dum
my
vari
able
1986
,199
1,19
96,2
001
INC
`tA
vera
geho
useh
old
inco
me
Dol
lars
1986
,199
1,19
96,2
001
AGE
`tA
vera
geag
eof
the
popu
latio
nY
ears
1986
,199
1,19
96,2
001
HHSIZE
`tA
vera
geho
useh
old
size
Indi
vidu
als
1986
,199
1,19
96,2
001
UNEMP`t
Une
mpl
oym
entr
ate
Perc
enta
ge19
86,1
991,
1996
,200
1EDUC
`tFr
actio
nof
popu
latio
nw
ithpo
st-s
econ
dary
educ
atio
nPe
rcen
tage
1986
,199
1,19
96,2
001
POP`t
Tota
lpop
ulat
ion
ofa
LSA
Indi
vidu
als
1986
,199
1,19
96,2
001
URB
`tU
rban
dens
ityof
aL
SAIn
divi
dual
spe
rsq.
km.
1986
,199
1,19
96,2
001
Goo
gle
Map
sXCOORD
`L
atitu
deof
LSA
`D
egre
es19
85-2
004
YCOORD
`L
ongi
tude
ofL
SA`
Deg
rees
1985
-200
4DIST``
′(d
``′ )
Gre
atC
ircl
eD
ista
nce
betw
een
LSA
`an
d`′
Kilo
met
res
1985
-200
4
Not
es:
CSD
stan
dsfo
rC
ensu
sSu
bdiv
isio
nfr
omSt
atis
tics
Can
ada.
All
Stat
istic
sC
anad
aob
serv
atio
nsar
eat
the
CSD
leve
lof
aggr
egat
ion
unle
ssot
herw
ise
note
d.T
hem
atch
ing
betw
een
CSD
’san
dL
SA’s
isdo
neus
ing
1996
CSD
defin
ition
s.T
helo
catio
nof
CSD
’sar
eob
tain
edus
ing
Stat
istic
Can
ada’
sG
eosu
ite19
96pa
ckag
e,an
dth
edi
stan
cebe
twee
nth
eC
SDan
da
LSA
isco
mpu
ted
asth
eG
reat
Cir
cle
Dis
tanc
ebe
twee
nth
em.
Mor
eac
cura
tem
easu
res
ofdi
stan
cear
eun
avai
labl
ebe
caus
eth
eC
RT
Cdo
esno
thav
ehi
stor
ical
data
onL
SAbo
unda
ries
.C
hang
esin
any
CSD
defin
ition
sbe
twee
n19
96an
dal
loth
erC
ensu
sye
ars
are
trac
ked
and
mat
ched
ascl
osel
yas
poss
ible
toth
eir
1996
defin
ition
.T
heC
PIm
easu
reex
clud
esfo
od,e
nerg
yan
din
dire
ctta
xes,
and
are
take
nfr
omC
AN
SIM
Tabl
e17
6-00
03.
The
inco
me,
age,
hous
ehol
dsi
ze,u
nem
ploy
men
trat
ean
ded
ucat
ion
data
for
each
Cen
sus
year
are
obta
ined
usin
gPC
ensu
sfo
rM
apPo
int.
The
popu
latio
nan
dur
ban
dens
itym
easu
reat
the
LSA
leve
lare
obta
ined
from
the
1991
,19
96an
d20
01G
eosu
itepa
ckag
esus
ing
LSA
(not
CSD
)na
me
sear
ches
.T
he19
86ur
ban
dens
itym
easu
reis
then
cons
truc
ted
byex
trap
olat
ing
alo
catio
n’s
tota
lpop
ulat
ion
back
to19
86us
ing
with
the
1991
,199
6,an
d20
01da
ta,a
ndth
endi
vidi
ngit
byth
eto
tals
quar
eki
lom
eter
sof
alo
catio
n(w
hich
isav
aila
ble
from
the
1996
Geo
suite
pack
age)
.
115

Tabl
eA
.3:L
icen
seO
wne
rshi
pan
dSu
bscr
iber
ship
ofL
arge
Firm
s-A
llY
ears
%Sh
are
ofN
atio
nalL
SAO
wne
rshi
p%
Shar
eof
Nat
iona
lSub
scri
bers
hip
Yea
rR
oger
sSh
awV
ideo
tron
Cog
eco
Pers
ona
Bra
ggL
arge
st6
Rog
ers
Shaw
Vid
eotr
onC
ogec
oPe
rson
aB
ragg
Lar
gest
6
1986
1.03
1.27
2.30
0.08
0.32
0.71
5.71
24.7
44.
6912
.43
0.03
0.03
0.30
42.2
219
871.
111.
352.
380.
160.
320.
716.
0224
.14
5.56
12.8
70.
040.
190.
3043
.11
1988
1.11
1.43
2.38
2.77
1.90
0.79
10.3
823
.45
5.76
13.1
01.
840.
410.
3344
.88
1989
1.19
2.14
2.46
2.77
3.33
0.79
12.6
822
.57
6.77
13.0
92.
200.
880.
3445
.85
1990
1.35
2.38
3.41
4.83
6.97
0.87
19.8
121
.17
7.64
14.0
12.
961.
560.
9348
.27
1991
1.43
3.09
3.65
5.55
7.61
1.03
22.3
523
.14
8.33
14.2
45.
681.
690.
3853
.46
1992
1.43
3.41
3.65
5.55
8.72
1.11
23.8
524
.87
8.18
13.9
05.
641.
850.
3854
.81
1993
1.51
4.04
3.65
5.55
8.87
1.35
24.9
624
.79
12.1
813
.75
5.60
1.95
0.73
59.0
019
941.
514.
683.
655.
558.
871.
4325
.67
24.9
212
.50
13.5
85.
562.
080.
8159
.45
1995
4.44
7.29
3.65
5.55
9.27
2.69
32.8
831
.09
18.6
313
.70
5.62
1.97
1.01
72.0
119
964.
757.
293.
655.
719.
353.
0933
.84
32.1
018
.67
13.8
85.
762.
001.
6574
.05
1997
2.85
7.21
6.97
7.61
9.43
3.25
37.3
228
.07
18.6
618
.57
9.02
2.06
1.78
78.1
619
982.
856.
817.
848.
009.
513.
5738
.59
28.0
818
.49
18.8
29.
232.
111.
8178
.54
1999
2.85
6.18
4.91
7.45
13.0
04.
8339
.22
28.1
618
.39
16.8
69.
103.
282.
1577
.93
2000
2.85
9.43
4.91
8.00
17.3
54.
8347
.39
28.2
421
.69
16.8
910
.46
3.90
2.17
83.3
520
016.
5811
.25
4.91
9.67
18.2
34.
8355
.47
29.1
125
.89
16.9
212
.04
4.08
2.18
90.2
220
026.
5810
.86
4.91
10.5
418
.62
5.39
56.8
929
.14
25.0
716
.95
12.1
54.
242.
9590
.50
2003
6.58
10.8
64.
9110
.54
18.7
05.
3956
.97
29.1
725
.02
16.9
712
.15
4.37
2.96
90.6
520
046.
5812
.84
4.91
10.5
420
.21
5.39
60.4
629
.19
25.8
017
.00
12.1
64.
722.
9791
.84
Not
es:
116

Table A.4: Welfare Effect of Mergers (Unacquired LSA’s)
Two-Bundle Markets One-Bundle MarketsBaseline Experiment 1 Baseline Experiment 2Mergers No-Mergers % ∆ Mergers No-Mergers % ∆
Welfare OutcomesConsumer Surplus 2.98 2.96 0.52 2.69 2.69 0.19
Producer Surplus 8.02 7.95 0.92 6.84 6.83 0.28Total Surplus 11.00 10.91 0.81 9.54 9.51 0.25
Other Outcomesp1 21.30 21.29 0.05 24.19 24.18 0.05p2 31.66 31.65 0.04 - - -q1 4.17 4.17 0.10 4.75 4.74 0.08q2 5.93 5.92 0.11 - - -s1 0.45 0.45 -0.48 0.79 0.79 0.07s2 0.39 0.38 0.78 - - -
mc1 12.37 12.42 -0.41 15.78 15.78 -0.05mc2 21.69 21.75 -0.28 - - -
Notes: LSAs are classified as one- and two-bundle markets according to the number of bundles offered underthe merger-equilibrium. All amounts are per-subscriber averages across all LSAs and periods, and are in1992 constant dollars.
117

Figure A.1: Sample Reporting Form for Broadcast Undertakings
STC
ATTN:
CRTC FILE
Confidential when completed
Collected under the authority of the Statistics Act, Revised Statutes of Canada, 1985, Chapter S19.
Completion of this questionnaire is a legal requirement under the Statistics Act.
See page 1, Reporting Guide for notice of agreements made by Statistics Canada under Sections 11 and 12 of the Statistics Act with other federal and provincial government bodies concerning information contained in the Annual Return.
Si vous préférez un questionnaire en français, veuillez cocher
Chief, Industry Statistics and Analysis, Broadcast Analysis, Canadian Radio-television and Telecommunications Commission (CRTC), Ottawa, K1A 0N2.
Annual Returnof "BroadcastingDistribution" Licensee
Upon receipt of this annual return, please review the systems listed below. If the list is different from your organizational structure. please contact the Chief, Broadcast ing Section, Science, Innovation and Electronic Information Division, Statistics Canada, Ottawa, Telephone: (613) 951-3177; Fax: (613) 951-9920.
2006
For the fiscal period ended August 31, 2006
Keep one copy of this return for your files and mail 3 completed copies (including financial statements) by November 30, 2006 to:
System Number CRTC Forms
Location Prov. CRTC ID Additional
in co-operation with the Canadian Radio-television
and Telecommunications Commission
5-5300-53.1: STC/SAT-430-60110 2006-10-26
1. Complete name of licensee:
2. Mailing address of the licensee:
Street and Number
City and Province Postal Code
Telephone Fax E-mail
3. Person to be contacted in connection with this return:
Mr. [ ] Mrs. [ ] Miss [ ] Ms. [ ]
Address (if different from licensee address)
Street and Number
City and Province Postal Code
Telephone Fax E-mail
4.
Name
Street and Number
City and Province
Postal Code
5. If the information in this return is for a period other than 12 months ending August 31, 2006, please indicate:
From To
Reasons:
6.
7. Type of business organization:
Incorporated company, shares publicly traded Sole proprietorship/partnership Co-operative
Incorporated company, shares NOT publicly traded Non-profit organization Military Unit
Other (specify)
8. MANAGEMENT CERTIFICATION
I, , am authorized
(Licensee)
that the information shown on this return and all the attachments thereto are true and complete in all respects to the best of my knowledge
and belief.
(Signature)
5-5300-53.1: 2006-06-20
SECTION 1 (pages 2 & 3)
LICENSEE (COMPANY) INFORMATION
Enquiries concerning this return may be referred to Dany Gravel, Unit Head, Broadcasting section, Science, Innovation and Electronic Information
Division, Statistics Canada, Ottawa, Telephone: (613) 951-0390; Fax: (613) 951-9920
Enquiries pertaining to Licence Fees should be referred to Lise Parent, Canadian Radio-televisionand TelecommunicationsCommission, Gatineau,
Telephone: (819) 997-4384, Fax: (819) 953-5107
to certify on behalf of
(Telephone and Area Code)
(Official use only)
(Date)
Date(s) of transaction(s):
(Title)
(Name)
(Name)
Date received
(Title)
If, during the period covered by this return, the licensee conducted business under a name or address other than that listed in 1 or 2, please indicate:
If any undertaking(s) reported in this return was acquired or sold during the reference year ending August 31, 2006, please indicate the
undertaking(s) and the name(s) of the previous owner(s)/purchaser(s):
CRTC File Number STC File Number
- 2 -
118

Non-merchandise charges related to broadcasting operation
Program Rights Interest
and Advertising Other and
Royalties Dividends
1. United States
2. United Kingdom
3. France
4. European Union (excl. U.K. and France)
5. Japan
6. OECD countries (excl. Japan, United States and E.U.)
7. All other countries
TOTAL
Program Rights Interest
and Advertising Other and
Royalties Dividends
1. United States
2. United Kingdom
3. France
4. European Union (excl. U.K. and France)
5. Japan
6. OECD countries (excl. Japan, United States and E.U.)
7. All other countries
TOTAL
Receipts from non-residents
INTERNATIONAL PAYMENTS AND RECEIPTS
(See Guide)
5-5300-53.1: 2006-06-20
Please complete one form per licensee (company)
($'000 Canadian)
($'000 Canadian)
Payments to Non-residents
Business services
Business services
01
02
03
04
05
06
07
08
16
17
18
19
20
21
22
23
31
32
33
34
35
36
37
38
46
47
48
49
50
51
52
53
01 16 31 46
02 17 32 47
03 18 33 48
04 19 34 49
05 20 35 50
06 21 36 51
07 22 37 52
08 23 38 53
4 0
4 1
CRTC File Number STC File Number
- 3 -
(See Guide for details)
Basic and Non-Basic
Programming Services
Exempt Programming
Services
Non-Programming
Services Total All Services
(1) (2) (3) (4)
1. Revenue
1. Subscription $
2. Connection (install. & reconnect) $
3. Community channel and facilities rental
4. Digital Addressable DVC Decoders - Rental $
5. - Net Sales $
6. Other (specify) ______________________________ $
7. Total Revenue $
2. Expenses
1. Programming (community) $
2. Affiliation Payments $
3. Technical $
4. Sales and Promotion $
5. Administration and General $
6. Total Expenses $
3. 1. Operating Income (loss) $
2. Less: Depreciation $
3. Interest $
4. Other adjustments - Income (expense) $
5. Net income (loss) before income taxes $
6. Provision for income taxes $
7. Net income (loss) after income taxes $
Classified advertising
Teleshopping/general services
Infomercials
Games services
Channel lease
Internet access services
Other telecommunications services (incl. security)
Other (specify) _______________________
Total (should equal sum of cells 47 on line 1.7 above)
5-5300-53.1: 2006-06-20
EXEMPT PROGRAMMING Total RevenueLicensee Revenue
Other exempt
Total (should equal sum of cells 27 on line 1.7 above)
NON-PROGRAMMING SERVICES
Affiliate Entity
Revenue
Telephony
Province: ______________________________
GROSS REVENUE FROM EXEMPT PROGRAMMING & NON-PROGRAMMING SERVICES
Summary of revenues and expenses
For year ended August 31, 2006
Please report the results for all systems (exempted and non-exempted) within the Province.
01
02
04
05
06
07
08
10
11
12
13
12
21
22
24
25
26
27
28
30
31
32
33
32 54
53
52
51
50
48
47
46
45
44
42
41 61
62
64
65
66
67
70
71
68
72
73
12
25 35 45
26 36 46
27 37 47
28 38 48
30 40 50
29 39 49
63 64 65
9 0
32 42 52
34 44 54
55 56 57
58 61 62
14 34
76
77
74
78
79
80
75
7 1
03 23 43 63
09 29 49 69
66 67 68
CRTC File Number STC File Number
- 4 -
119

Programming Technical SalesAdministration
and general Total
(1) (2) (3) (4) (5)
1.
2.
3.
Historical cost Accumulated Additions to
of assets depreciation fixed assets
in use at at August 31, 2006 2006
August 31, 2006
(1) (2) (3)
1.
2.
3.
4.
5.
6.
7.
8.
9.
5-5300-53.1: 2006-06-20
Average number of employees (the
typical weekly total of full & equivalent
part time employees)
Fringe benefits (included in line 4.1 above)
11.
10.
Please report assets for each Province in which you operate.
EMPLOYMENT INFORMATION
Total Remuneration
Please report the results for all systems (exempted and non-exempted) within the Province.
SUMMARY OF FIXED ASSETS
Province: ________________________
($ omit cents)
Salaries and Wages (include sales
commissions and talent fees paid to
employees), fringe benefits and
director's fees
For year ended August 31, 2006
Distribution system plant/transmitters/transponders
12.
13.
Classification of Fixed Assets
Land
Buildings (Include land improvements)
Head-end and components-earth receiving station & associated plant
Cost of subscriber drops and devices including descramblers
Test equipment and tools
Furniture and fixtures
Province of operation:______________________________
Computers
Total
$(omit cents)
Other property, plant and equipment
Cable casting equipment/local program production equipment
Leasehold improvements (except cable system plant)
Automobiles and trucks
46
51
42 43 44 45
47 48 49 50
52
01
02
03
04
05
06
07
08
09
10
11
12
13
14
15
16
17
18
19
20
21
22
23
24
25
27
28
29
30
31
32
33
34
35
36
37
38
26
9 2
9 3
CRTC File Number STC File Number
- 5 -
Affiliation payments
1. Pay Services $ (omit cents)
1. Canadian Pay Services
2. Non-Canadian Pay Services
3. Total - Pay Services
2 Specialty Services
4. Canadian Specialty Services
5. Non-Canadian Speciality Services
6. Total - Speciality Services
7. Total - Affiliation Payments
1. Number of Direct subscribers to basic cable services
2. Number of Indirect subscribers to basic cable services
3. Number of households with access to cable services (homes passed)
4. Number of households in licensed area
This Company Affiliate
1. Number of subscribers to high speed internet access services
2. Revenues from high speed internet access services
3. Number of households with access to high speed internet services
1.
4.
5.
1.
1 Number of subscribers to telephone services by cable
2. Revenues from telephone services by cable
3. Number of households with access to telephone services by cable
5-5300-53.1: 2006-06-20
AFFILIATION PAYMENTS AND SUBSCRIBERS
Affiliation payments summary
DIGITAL TELEVISION
Number of subscribers
INTERNET
Cable modem, satellite or MDS
CABLE
Please report the results for all systems (exempted and non-exempted) within the Province
Province: ____________________________
Number of subscribers to digital cable services
TELEPHONE
Revenues from digital services
Number of household with access to Video-on-demand
VIDEO-ON-DEMAND
Number of households with access to digital TV
10
11
23
24
30
31
32
52
53
54
55
04
01
07
08
01
03
02
02
03
04
06
05
01
01
03
02
04
7 2
7 3
9 1
7 7
7 6
7 8
7 9
CRTC File Number STC File Number
- 6 -
120

Figure A.2: CRTC Decision 89-46
Decision
Ottawa, 14 February 1989
Decision CRTC 89-46
Adelaide Radio & T.V. Limited
St. Mary's, Ontario - 882794100
Pursuant to Public Notice CRTC 1988-212 dated 22 December
1988, the Commission approves the application for authority to
transfer effective control of Adelaide Radio & T.V. Limited, licensee
of the broadcasting receiving undertaking serving St. Mary's,
through the transfer of all of the common voting shares from the
existing shareholders (the Tipping family) to Rogers Cable T.V.
Limited (Rogers).
Rogers has proposed to purchase 100% of the shares of Adelaide
Radio & T.V. Limited for the purchase price of $600,000. Based on
information filed with the application, the Commission has no
concerns with respect to the availability or adequacy of the
required financing.
Rogers is a wholly-owned subsidiary of Canadian Cablesystems
Limited, which in turn, is indirectly and ultimately controlled by Mr.
Edward Rogers of Toronto.
Through various companies, Mr. Rogers owns CFTR and CHFI-FM
Toronto and eight cablesystems in Ontario, one in Alberta and five
in British Columbia. Mr. Rogers also holds a 25.4% interest in YTV
Canada Inc., the youth-oriented specialty service; a 74.2%
interest in the multilingual station CFMT-TV and a majority interest
in the Canadian Home Shopping Network (CHSN) Ltd., a non-
programming cable service.
As stated in a number of decisions relating to applications for
authority to transfer ownership or effective control of broadcasting
undertakings, and because the Commission does not solicit
applications for such transfers, the onus is on the applicant to
demonstrate to the Commission that the application filed is the
best possible proposal under the circumstances, taking into
account the Commission's general concerns with respect to
transactions of this nature.
The Commission reaffirms that the first test any applicant must
meet is that the proposed transfer of ownership or control yields
significant and unequivocal benefits to the communities served by
the broadcasting undertaking, to the Canadian broadcasting
system as a whole, and that it is in the public interest.
In particular, the Commission must be satisfied that the benefits,
both those that can be quantified in monetary terms and others
which may not easily be measurable in terms of their dollar value,
are commensurate with the size of the transaction and that they
take into account the responsibilities to be assumed, the
characteristics and viability of the broadcasting undertakings in
question, and the scale of the programming, management,
financial and technical resources available to the purchaser.
In assessing this application, the Commission has taken into
consideration Rogers' commitment to provide St. Mary's with a
level of cable service equivalent to that of the neighbouring Grand
River system. Also, Rogers intends to extend the company's
service hours thereby decreasing response time for service calls
and improving accessibility to the cable company. The Commission
also notes the extensive experience and resources upon which the
purchaser may draw in order to maintain and improve service to subscribers.
In evaluating the benefits to be derived from this transaction, the
Commission has taken into account that Rogers has committed to
spend $568,000 to improve technical services $500,000 of which
may be recovered through rate applications filed under subsection
18(6) of the Cable Television Regulations, 1986 (the regulations).
In this respect, Rogers has committed to spend approximately
$120,000 for improvements in the St. Mary's signal package by
including in the channel line-up Canadian specialty services and
FM services not currently available. Further, in this regard, Rogers
has undertaken to rebuild the system in order to increase capacity
on the basic service from 15 to 29 channels. The estimated capital
cost of this proposal is $380,000.
Although an application to recover these capital expenditures
which represent about $500,000 may be filed under subsection
18(6) of the regulations, the Commission notes Rogers'
commitment that the basic monthly fee at St. Mary's will be no
more than the authorized rate for the adjacent Grand River
system.
Having examined the financial situation of the current licensee, the
Commission notes that Adelaide Radio & T.V. Limited has
experienced declining rates of returns on net fixed assets and, in
this regard, considers that the licensee appears unable at present
to finance basic on-going maintenance programs and would have
difficulty financing the extensive capital improvements that will be
necessary in the future.
In light of the foregoing, the Commission considers that these
expenditure commitments will benefit St. Mary subscribers.
In addition, the purchaser has proposed quantifiable benefits
totalling $68,000 that will accrue to subscribers through technical improvements and other programming and operating
expenditures.
Specifically, Rogers will introduce by September 1989 full-service
community programming that will, among other things, provide
coverage of St. Mary's town council meetings. Also, Rogers will
incorporate a descrambling system enabling subscribers greater
flexibility in the selection of discretionary services.
The Commission has therefore concluded that the benefits, both
intangible and quantifiable, are commensurate with the size of the
transaction, the viability of the undertaking in question, the
responsibilities involved and the resources available to the
purchaser. In view of all the foregoing and having examined the
information available to it, the Commission is satisfied that the
proposed transfer of control will yield significant benefits to cable
subscribers in St. Mary's and that approval of the application is in
the public interest.
The Commission acknowledges the intervention received from Mr.
Chris West in support of this application.
Fernand Bélisle Secretary General
121

Figure A.3: CRTC Decision 95-476
Decision
Ottawa, 24 July 1995
Decision CRTC 95-476
K-Right Communications Limited Wellington, Abrams Village and Urbainville, Prince Edward Island -
942042300 - 942043100- 942044900
Acquisition of assets
Deletion of local head end and interconnection to the Summerside
undertaking
Change to authorized service area
Following a Public Hearing in the National Capital Region beginning on 15 May 1995, the Commission approves the application for
authority to acquire the assets of the cable distribution
undertaking serving the above-noted communities from La
Coopérative des Communications Communautaire Limitée (La
Coopérative), and for a broadcasting licence to continue the
operation of this undertaking.
The Commission will issue a licence to K-Right Communications Limited (K-Right), expiring 31 August 2002, upon surrender of the
current licence. The operation of this undertaking will be regulated
pursuant to Parts I and III of the Cable Television Regulations,
1986 (the regulations). The authority granted herein is subject to
the same conditions as those in effect under the current licence, as
well as to any other condition specified in this decision and in the
licence to be issued.
The price of the transaction is $237,923. However, the Commission notes that the Purchase and Sale Agreement stipulates: "Should
the CRTC not issue a license to the Purchaser permitting the
construction of the System Extension or should the Purchaser not
construct the System Extension before the earlier of the first
anniversary of the Closing Date and April 30, 1996, the Purchase
Price shall be increased by $63,000."
Based on the evidence filed with the application, the Commission has no concerns with respect to the availability or the adequacy of
the required financing and is satisfied with the benefits flowing
from this transaction.
In view of the approval granted herein, it would appear that no further action is required on the application (941086100)
submitted by La Coopérative for the renewal of its licence which
was announced in Public Notice CRTC 1995-10 dated 20 January
1995.
Nevertheless, in Decision CRTC 95-477 dated 1995, the Commission renewed La Coopérative's licence until 31 December
1995, in order to allow sufficient time for completion of the
acquisition of assets approved herein.
Interconnection
The Commission also approves the application for authority to delete the local head end at Wellington and to interconnect that
undertaking, via optical fibre, to the undertaking serving
Summerside. The Commission notes that the Summerside
undertaking is a Class 2 system and that the Wellington system is
regulated pursuant to Parts I and III of the regulations. The
Commission also notes that the number of programming services provided to the Wellington undertaking as part of the
basic service would increase from 12 to 23.
The Commission also notes that the applicant will cease
distribution of CBMT Montréal. The Commission also notes that the
distribution of CHCH-TV Hamilton and CITV-TV Edmonton which
are now available to Wellington subscribers as part of the basic
service, will only be available on a discretionary basis
. In addition to the services required or authorized to be distributed pursuant to the applicable sections of the regulations, the licensee
is authorized to continue to distribute, at its option, CFJP-TV
Montréal, received via satellite, as part of the basic service.
The applicant is also authorized, by condition of licence, to continue to distribute the programming service of the Atlantic
Satellite Network (ASN), received via satellite, provided that it is
distributed on an unrestricted channel of the basic service.
Change to authorized service area
The Commission also approves the application to change the licensed area for the Wellington undertaking by including the
communities of St. Chrysostome, Cape Egmont and St. Timothy. The Commission notes that the subscribers in the extended area will be offered the same programming services and will be charged
fees identical to those in the current licensed service area.
This approval is subject to the requirement that construction in the extended area be completed and the extended system be in
operation within twelve months of the date of this decision or,
where the applicant applies to the Commission within this period
and satisfies the Commission that it cannot complete the
construction and commence operations throughout the extended
system before the expiry of this period and that an extension of
time is in the public interest, within such further periods of time as
are approved in writing by the Commission.
Should construction not be completed within the twelve-month period stipulated in this decision or, should the Commission refuse
to approve an extension of time requested by the applicant, the
authority granted to change the service area shall lapse and
become null and void upon expiry of the period of time granted
herein or upon the termination of the last approved extension of
time period.
In Public Notice CRTC 1992-59 the Commission announced implementation of its employment equity policy. It advised
licensees that, at the time of licence renewal or upon considering
applications for authority to transfer ownership or control, it would
review with applicants their practices and plans to ensure
equitable employment. In keeping with the Commission's policy, it
encourages the applicant to consider employment equity issues in
its hiring practices and in all other aspects of its management of
human resources.
The Commission acknowledges the intervention submitted by the Canadian Broadcasting Corporation, expressing its wish that the
applicant consider the distribution of the Réseau de l'information
(RDI). A similar intervention was submitted by the Société Saint-
Thomas-d'Aquin.
In reply, the applicant stated that this fall it will address the carriage of RDI as well as other services to be added 1 January
1996. While the Commission notes that RDI is not a priority
programming service, it reiterates the importance of Canadian
programming services being given the widest possible distribution.
The Commission encourages the applicant to take
intoconsideration the Canadian Cable Television Association (CCTA)
Access Commitment with respect to the carriage of licensed
Canadian specialty, pay television and pay-per-view services
in minority official language markets.
Allan J. DarlingSecretary General122