an empirical comparison of seven populist attitudes scalesresearchers had little empirical evidence...
TRANSCRIPT

https://doi.org/10.1177/1065912919833176
Political Research Quarterly 1 –16© 2019 University of UtahArticle reuse guidelines: sagepub.com/journals-permissionsDOI: 10.1177/1065912919833176journals.sagepub.com/home/prq
Methodology
Introduction
Social scientists doing survey research have never had as much data. Besides well-established cross-national sur-veys, every week specific surveys are fielded to study various topics. Two consequences have been the follow-ing: (1) survey and questionnaire design become funda-mental for an ever growing number of scholars, and (2) a proliferation of different ways to measure similar concepts. Examples include authoritarian attitudes (Altemeyer 1981; Feldman and Stenner 1997; Oesterreich 2005), ideology (e.g., Lo, Proksch, and Gschwend 2014; Wilson and Patterson 1968), or political trust (Feldman 1983; Levi and Stoker 2000; Marien 2011).
It is often difficult for researchers to decide which questions, among suggested alternatives, would be better to measure a concept. With the rapid expansion of popu-lism studies, multiple scholars tried measuring populist attitudes among individuals, all in different ways. So far, researchers had little empirical evidence to guide their choice for a battery of questions. In this article, we apply several psychometric techniques to seven scales measur-ing populist attitudes: Akkerman, Mudde, and Zaslove (2014); Castanho Silva et al. (2018); Elchardus and Spruyt (2016); Oliver and Rahn (2016); Schulz et al. (2018); Stanley (2011); and the module of the wave 5
questionnaire of the Comparative Study of Electoral Systems (CSES; Hobolt et al. 2016).1 We collected origi-nal survey data in nine European and American countries, including all batteries of questions in all samples. We analyze questionnaire design, perform tests with factor analysis and Item Response Theory (IRT), and evaluate external validity. At the end, we suggest how scholars can make an informed decision as to what scales perform bet-ter in each aspect, and how that can be expanded beyond populist attitudes studies.2
Populist Attitudes Defined and Measured
Populism is defined almost identically across all studies building on Mudde (2004): a thin-centered ideology according to which society is divided into two homoge-neous and antagonistic groups: the “good people” and the
833176 PRQXXX10.1177/1065912919833176Political Research QuarterlySilva et al.research-article2019
1University of Cologne, Germany2University of Bamberg, Germany3Central European University, Budapest, Hungary
Corresponding Author:Bruno Castanho Silva, University of Cologne, Herbert-Lewin Str. 2, 50931 Köln, Germany. Email: [email protected]
An Empirical Comparison of Seven Populist Attitudes Scales
Bruno Castanho Silva1 , Sebastian Jungkunz2, Marc Helbling2, and Levente Littvay3
AbstractWith the recent upsurge of populism in developed and transition democracies, researchers have started measuring it as an attitude. Several scales have been proposed for this purpose. However, there is little direct comparison between the available alternatives. Scholars who wish to measure populist attitudes have little information available to help select the best scale for their purposes. In this article, we directly compare seven populist attitudes scales from multiple perspectives: conceptual development, questionnaire design, dimensionality, information, cross-national validity, and external validity. We use original survey data collected online from nine countries in Europe and the Americas, with around 250 participants per country, in which all seven batteries of questions were present. Results show that most scales have important methodological and validity limitations in at least one of the dimensions tested, and should not be used for cross-national comparative research. We recommend populist attitudes items that work better at capturing populism, and more generally provide guidelines for researchers who want to compare different scales that supposedly measure the same construct.
Keywordsmeasurement, populism, structural equation modeling, scale development, psychometric properties

2 Political Research Quarterly 00(0)
“corrupt elites.” Ordinary people are always morally bet-ter than the elite, who illegitimately capture and maintain power, betraying people’s interests (Hawkins 2009; Mudde and Rovira Kaltwasser 2013). Broadly, this is the concept all scales try capturing, with the partial exception of Oliver and Rahn (2016), which adds nationalism.
The most important aspect measured in these projects concerns the role ordinary people play in politics and society: the “will of the people” is the highest principle in a country and needs to be fully implemented into politics (Canovan 1981, 1999). The people should be in charge of important decisions and cannot be well represented by politicians. All studies include items representing popular sovereignty, the duties of elected politicians toward their electorate, and questions of representative democracy. Another crucial aspect concerns the idea that populists are against anyone who does not belong to the group of “ordinary people.” These others form an “elite.” It is not always clear how it is delimited (Jagers and Walgrave 2007, 324), but for most populists, it is the political estab-lishment. Every measure under study here includes items on attitudes toward politicians, members of parliament, and the government.
Operationalization and Dimensionality
Populism is a multidimensional concept, so there are two possible approaches to question design. The first is draft-ing specific items to capture each dimension sepa-rately—for example, if praise of common people is one dimension, an item should tap exclusively into that with-out references to the elite. This approach is followed by Castanho Silva et al. (2018), Oliver and Rahn (2016), Schulz et al. (2018), and Stanley (2011). The second option is capturing all dimensions simultaneously in a single scale, including single items that refer to two or three dimensions in themselves. That is seen in Akkerman, Mudde, and Zaslove (2014); Elchardus and Spruyt (2016); and the CSES.3
With the exception of Elchardus and Spruyt (2016), all projects differentiate between three different subcom-ponents, which cover similar dimensions and can be sub-sumed under the terms of people-centrism, anti-elitism, and anti-pluralism. Oliver and Rahn (2016), for exam-ple, have the dimension “mistrust of experts” besides “anti-elitism,” including several questions on the role ordinary people play in society. There, the common sense knowledge of ordinary folk is played up as supe-rior to experts’ ideas, which is one way that populists praise common people. Anti-pluralist attitudes are some-times measured by focusing on the importance of one’s own national group (Oliver and Rahn 2016) or by simply dividing people into good and evil (Castanho Silva et al. 2018).
To capture people-centrism, two scales directly refer to the “will of the people” (Akkerman, Mudde, and Zaslove 2014; Castanho Silva et al. 2018). Others have statements on direct democracy and popular sovereignty, claiming that the people should be consulted for impor-tant policy and political decisions (Akkerman, Mudde, and Zaslove 2014; Hobolt et al. 2016; Schulz et al. 2018). There are also items gloryfing the “honest” and “hard-working” character of ordinary folk, as well as its com-mon sense wisdom (Elchardus and Spruyt 2016; Oliver and Rahn 2016; Schulz et al. 2018; Stanley 2011). Some scales focus on the political aspects of people-centrism—popular sovereignty in politics (Akkerman, Mudde, and Zaslove 2014; Castanho Silva et al. 2018; Hobolt et al. 2016)—while others give more weight to the romantici-zation of ordinary people and common sense in general (Elchardus and Spruyt 2016; Oliver and Rahn 2016). Two scales combine both aspects (Schulz et al. 2018; Stanley 2011).
When it comes to anti-elitism, all have a strong focus on government and elected politicians. This brings trou-ble when applied to countries where populists are in power. Most scales were first tested in countries where the government was not populist and, therefore, the anti-government items worked fine for capturing anti-elitist views. The increase in the number of populist govern-ments in Western democracies today makes it necessary to rethink the connection between theoretical anti-elitism and its operationalization (Enyedi 2016).
Nonetheless, some include other elite groups, for instance “experts,” “academics,” or “intellectuals” (Elchardus and Spruyt 2016; Oliver and Rahn 2016). These are a common target for right-wing populists. However, if we think of some cases where left-populists are heavily popular among, and inspired by, well-edu-cated individuals—Podemos in Spain being a case in point—then these terms will hardly determine a credible elite for populist supporters. Broader concepts are also used, such as “interest groups” (Akkerman, Mudde, and Zaslove 2014), “the system” and “the powerful” (Oliver and Rahn 2016), or “the big interests” (Castanho Silva et al. 2018). Ultimately, these might be more generaliz-able across different types and contexts of populism to capture the essence of anti-elitist feelings beyond anti-government expressions.
Importantly, all scales measure populism independent of the so-called “host ideology,” that is, they do not try to capture specifically right- or left-wing populism. Theoretically, this follows the definition laid out above of populism as a thin-centered ideology that can be attached to various thick-centered ones. Empirically, populist attitudes are not necessarily correlated with the left or right across countries, and they have explanatory power beyond ideology on vote-choice models (for
Castanho Silva et al. 3
example, Rico and Anduiza 2017; Spruyt, Keppens, and van Droogenbroeck 2016; Van Hauwaert and van Kessel 2018).
While all studies agree on the basic definition of popu-lism, and most agree on its three subcomponents, it rarely becomes clear how the respective dimensions and attri-butes are logically organized and delimited from each other (Munck and Verkuilen 2002, 9–10). Providing one or several dimensions of populism reflects the different ideas of the concept. As such, it is either assumed as a prerequisite for respondents to score high on all dimen-sions simultaneously to speak of populist attitudes or it is possible to study certain dimensions separately. Akkerman, Mudde, and Zaslove (2014), Elchardus and Spruyt (2016), and the CSES use a single dimension, and form an additive index with all questions. Higher values in one dimension compensate lower values in another, so that to reach relatively high levels of populism, an indi-vidual still can have little of one of its aspects. Oliver and Rahn (2016) and Stanley (2011) measure and use the dimensions completely separately in all analyses. They investigate how each subcomponent is connected with outcomes of interest.
Schulz et al. (2018) propose a second-order factor analysis, whereby the latent variable “populism” is formed by the covariance between the three latent vari-ables of “anti-elitism,” “homogeneity of the people,” and “popular sovereignty.” This scale takes that the presence of all dimensions is necessary to consider someone popu-list, and that only the correlation between the three dimensions configures the full concept. Castanho Silva et al. (2018) depart from a similar idea of populism at the intersection of all three dimensions. However, they do not assume that all three dimensions are correlated, which is a necessary assumption for the second-order model of Schulz et al. (2018). Instead, Castanho Silva et al. (2018) propose a multiplicative unified scale, in which an indi-vidual’s score in each dimension, normalized and bound between 0 and 1, is multiplied by the others to result in the final level of populism. Therefore, one is only as pop-ulist as their lowest score on people-centrism, anti-elitism, or Manichaean outlook. The decision of aggregation method reflects different understandings of the concept and of the interrelations between its dimensions.
Item Selection and Wording
There is almost no overlap of items in these studies, unless scales directly build on each other. Some studies craft a few items based on theory (Stanley 2011, Akkerman, Mudde, and Zaslove 2014; Elchardus and Spruyt 2016), sometimes providing extensive justifica-tions for how their selection is different from other proj-ects (Akkerman, Mudde, and Zaslove 2014, 1329–30;
Elchardus and Spruyt 2016, 121–22). Still, most scale development is at least partially empirically driven. Items that do not load strongly on the respective latent variables or principal components are deleted.4 Schulz et al. (2018) and Castanho Silva et al. (2018) have taken this approach a step further and combined a selection of a large number of items based on theoretical considerations with explor-atory analyses that helped them define a small number of core items. Indices also vary in their number of items. While some include between twelve and fifteen (Oliver and Rahn 2016), most range from six to nine (Akkerman, Mudde, and Zaslove 2014; Castanho Silva et al. 2018; Schulz et al. 2018; Stanley 2011; and CSES) or even only four (Elchardus and Spruyt 2016). The number of items is related to the number of dimensions: multidimensional scales include more items than single-dimensional ones. While longer scales may be able to grasp a broader range of the concept, they may also be more prone to poor oper-ationalization if the selection of items is not careful (Elkins 2000; Hayduk and Littvay 2012).
From the perspective of questionnaire design, we also consider the wording of items, framing of indicators, and response options. Questions can be worded positively—higher agreement indicating higher levels of the construct being measured. Conversely, in negative-worded items, higher agreement indicates less presence of the construct. All scales should have a combination of both, to avoid acquiescence bias (McClendon 1991): the tendency of sur-vey respondents to agree with questions presented to them. Without negatively worded items, it is not possible to judge how much individuals agree with the actual content, and how much they are simply saying “yes” by default. In the absence of negative-worded items, average levels of agree-ment with a construct are overestimated.
Three scales here have no negative-worded items: Akkerman, Mudde, and Zaslove (2014); Elchardus and Spruyt (2016); and Schulz et al. (2018). In Oliver and Rahn (2016), only one subdimension has a negative worded item. Castanho Silva et al. (2018) and Stanley (2011) have negative-worded items for every subdimen-sion. The unidimensional CSES module has a total of seven questions, and one is negatively worded. Regarding response scales, Akkerman, Mudde, and Zaslove (2014); CSES; Elchardus and Spruyt (2016); and Schulz et al. (2018) use Likert-type agree-disagree with five catego-ries; Castanho Silva et al. (2018) and Stanley (2011) use seven-point scales; and Oliver and Rahn (2016) use a mix of two, five, and seven categories for their questions.
Data
Data for this study come from nine online samples.5 In the United States, it was collected through Amazon’s Mechanical Turk in November 2016, before the general

4 Political Research Quarterly 00(0)
elections. In Brazil, France, Greece, Ireland, Italy, Mexico, Spain, and the United Kingdom, it was collected through CrowdFlower6 between December 2016 and March 2017.7 This platform has started to be used for social scientific studies (e.g., Van Prooijen and Krouwel 2017), and tests with behavioral experiments show that results from studies with field and student samples can be replicated (Peer et al. 2017). The reasoning for case selec-tion was cultural and political diversity: we include Latin and North America, as well as Western and Southern European cases. There are countries with relevant right-wing populist actors (e.g., the United Kingdom, France), left-wing ones (Greece, Spain, Mexico), both (Italy), and those where populist forces were not electorally strong at the time (Brazil, Ireland). This allows us to test whether the scales work in different national contexts where popu-list support is associated with very different kinds of par-ties or even with no populist party at all. Moreover, populist preferences have different demographic corre-lates depending on countries and what their thick ideo-logical attachment is (Rooduijn 2018). Therefore, these samples are also diverse enough that we may expect there to be variance in the levels of populism across them, including individuals who hold both high and low popu-list attitudes.
Descriptive statistics for all samples is in Table S1 of the online supplementary materials. Online samples have known biases: they are more liberal, younger, and better educated than national populations (Berinsky, Huber, and Lenz 2012). Moreover, the CrowdFlower samples have gender imbalances: between 53 and 81 percent are males. Since these samples are not representative of the respec-tive populations, inferences about average levels of atti-tudes or relationships between factors and voting intentions should be made with caution. Nevertheless, convenience samples (especially with college students), are common in psychological scale development (Shen et al. 2011), with reason. Such exercises are not interested in accurate proportions of a certain trait in the population, or on base-rate differences among groups (Ellsworth and Gonzalez 2007). We are particularly interested, for instance, on whether individuals give similar responses to items designed to tap into the same construct; whether there are important cross-cultural variations in the pat-terns of responses; and how two psychological attitudes are related to one another. For these kinds of tests, there is no reason why the lack of representativeness in these samples could bias inferences (see Ellsworth and Gonzalez 2007; Pernice et al. 2008). We do not expect that two items measuring populist attitudes would have correlated responses among men but not women. On practical grounds, the populist attitudes scales compared here have sixty-five unique items, amounting to ten min-utes of survey time. Gathering such data with large
representative samples from nine countries, for the sole purpose of psychometric testing, would be prohibitively expensive and a poor use of scarce resources.
Psychometric Properties
We evaluate three main psychometric properties in each scale: its internal coherence, the cross-cultural validity, and the breadth of the concept each one captures. The first test is done with confirmatory factor analysis (CFA), where we check whether the items in each scale load onto the dimension(s) they are theorized to. We proceed with a measurement invariance test to evaluate cross-national validity. Finally, we use a graded ratings scale model to produce information curves telling us how well these scales discriminate among individuals on all levels of the latent traits.
Internal Coherence
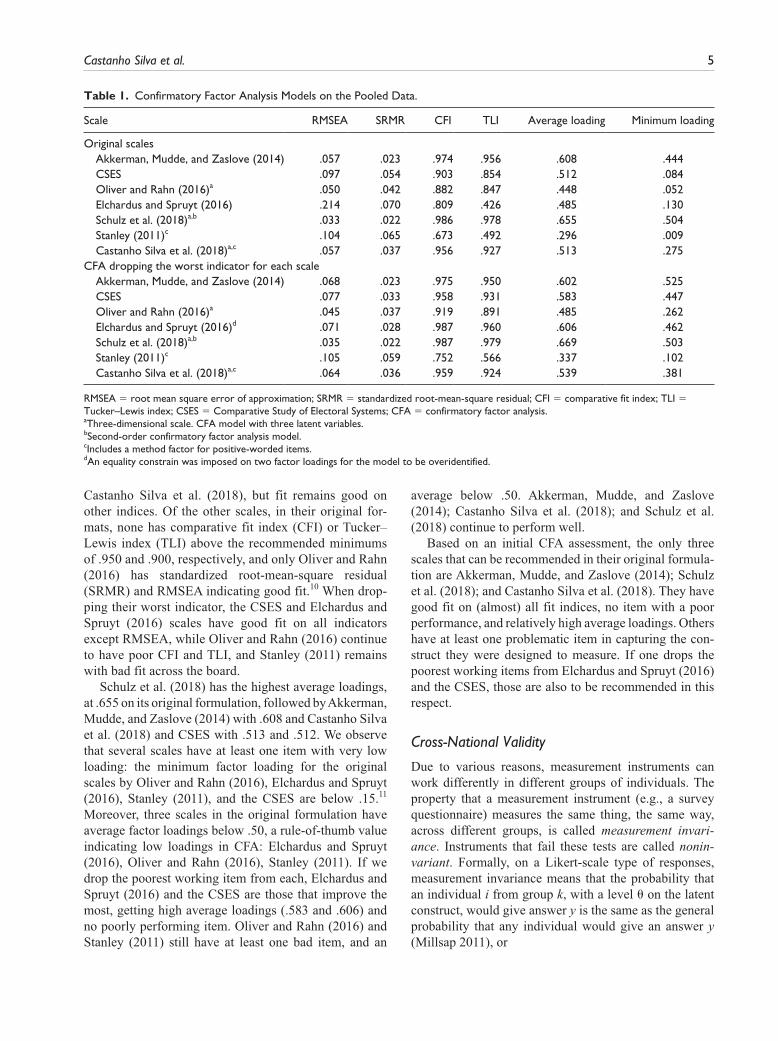
We start by asking whether each scale actually measures the latent construct(s) it was designed for. We apply CFA to the pooled data, separately for each scale.8 Results are in Table 1.9 In this table, we report both results for the scales as they are originally proposed and used in the ref-erence texts, and also dropping the worst working indica-tor from each. It is common in practical applications that, if the measurement model identifies a single poorly work-ing indicator, it is dropped from subsequent analyses. Therefore, to give a fair assessment to all, we take that into consideration.
We look at two main points of information: first, whether the model fits the data, and second, how high are factor loadings. Model fit tells us whether the estima-tion of a covariance structure based on measurement model parameters leads to a close reproduction of the observed covariance matrix. There can be various causes of poor fit, but all reflect a poorly functioning scale. Two common examples are that there are more, or fewer, dimensions than those modeled, or that the residuals of indicators have high correlations with one another, implying that there is another factor, unaccounted for, which influences measurement error for two or more items. In the tests here, the χ2 test of model fit is signifi-cant for all, what is not unexpected given the large pooled sample (Kline 2016). However, other than that, only the scale by Schulz et al. (2018) has good fit on all fit indi-ces. Akkerman, Mudde, and Zaslove (2014) and Castanho Silva et al. (2018) come in a close second: both have root mean square error of approximation (RMSEA) at .057, a bit above the maximum recommended .05, but have good fit on all other fit statistics. When dropping their worst indicators, RMSEA actually increases for both Akkerman, Mudde, and Zaslove (2014) and
Castanho Silva et al. 5
Castanho Silva et al. (2018), but fit remains good on other indices. Of the other scales, in their original for-mats, none has comparative fit index (CFI) or Tucker–Lewis index (TLI) above the recommended minimums of .950 and .900, respectively, and only Oliver and Rahn (2016) has standardized root-mean-square residual (SRMR) and RMSEA indicating good fit.10 When drop-ping their worst indicator, the CSES and Elchardus and Spruyt (2016) scales have good fit on all indicators except RMSEA, while Oliver and Rahn (2016) continue to have poor CFI and TLI, and Stanley (2011) remains with bad fit across the board.
Schulz et al. (2018) has the highest average loadings, at .655 on its original formulation, followed by Akkerman, Mudde, and Zaslove (2014) with .608 and Castanho Silva et al. (2018) and CSES with .513 and .512. We observe that several scales have at least one item with very low loading: the minimum factor loading for the original scales by Oliver and Rahn (2016), Elchardus and Spruyt (2016), Stanley (2011), and the CSES are below .15.11 Moreover, three scales in the original formulation have average factor loadings below .50, a rule-of-thumb value indicating low loadings in CFA: Elchardus and Spruyt (2016), Oliver and Rahn (2016), Stanley (2011). If we drop the poorest working item from each, Elchardus and Spruyt (2016) and the CSES are those that improve the most, getting high average loadings (.583 and .606) and no poorly performing item. Oliver and Rahn (2016) and Stanley (2011) still have at least one bad item, and an
average below .50. Akkerman, Mudde, and Zaslove (2014); Castanho Silva et al. (2018); and Schulz et al. (2018) continue to perform well.
Based on an initial CFA assessment, the only three scales that can be recommended in their original formula-tion are Akkerman, Mudde, and Zaslove (2014); Schulz et al. (2018); and Castanho Silva et al. (2018). They have good fit on (almost) all fit indices, no item with a poor performance, and relatively high average loadings. Others have at least one problematic item in capturing the con-struct they were designed to measure. If one drops the poorest working items from Elchardus and Spruyt (2016) and the CSES, those are also to be recommended in this respect.
Cross-National Validity
Due to various reasons, measurement instruments can work differently in different groups of individuals. The property that a measurement instrument (e.g., a survey questionnaire) measures the same thing, the same way, across different groups, is called measurement invari-ance. Instruments that fail these tests are called nonin-variant. Formally, on a Likert-scale type of responses, measurement invariance means that the probability that an individual i from group k, with a level θ on the latent construct, would give answer y is the same as the general probability that any individual would give an answer y (Millsap 2011), or
Table 1. Confirmatory Factor Analysis Models on the Pooled Data.
Scale RMSEA SRMR CFI TLI Average loading Minimum loading
Original scales Akkerman, Mudde, and Zaslove (2014) .057 .023 .974 .956 .608 .444 CSES .097 .054 .903 .854 .512 .084 Oliver and Rahn (2016)a .050 .042 .882 .847 .448 .052 Elchardus and Spruyt (2016) .214 .070 .809 .426 .485 .130 Schulz et al. (2018)a,b .033 .022 .986 .978 .655 .504 Stanley (2011)c .104 .065 .673 .492 .296 .009 Castanho Silva et al. (2018)a,c .057 .037 .956 .927 .513 .275CFA dropping the worst indicator for each scale Akkerman, Mudde, and Zaslove (2014) .068 .023 .975 .950 .602 .525 CSES .077 .033 .958 .931 .583 .447 Oliver and Rahn (2016)a .045 .037 .919 .891 .485 .262 Elchardus and Spruyt (2016)d .071 .028 .987 .960 .606 .462 Schulz et al. (2018)a,b .035 .022 .987 .979 .669 .503 Stanley (2011)c .105 .059 .752 .566 .337 .102 Castanho Silva et al. (2018)a,c .064 .036 .959 .924 .539 .381
RMSEA = root mean square error of approximation; SRMR = standardized root-mean-square residual; CFI = comparative fit index; TLI = Tucker–Lewis index; CSES = Comparative Study of Electoral Systems; CFA = confirmatory factor analysis.aThree-dimensional scale. CFA model with three latent variables.bSecond-order confirmatory factor analysis model.cIncludes a method factor for positive-worded items.dAn equality constrain was imposed on two factor loadings for the model to be overidentified.

6 Political Research Quarterly 00(0)
P y P yik i| ( | ).θ θ( ) =
(1)
Invariance is an especially important characteristic when scales are used in cross-national surveys. If the measurement instruments are noninvariant, regression estimates that ignore this issue are not reliable: it is not possible to know whether differences between coun-tries, for example, are actual differences in the con-struct or simply an artifact of differing response styles across the two cultures, let alone different understand-ings of the whole concept.12 Two kinds of invariance are most often tested: metric and scalar. Metric invari-ance is less demanding, and indicates that factor load-ings are invariant across countries. It means that a change of one unit in an individual’s level of the latent variable produces the same change in the observed response regardless of group membership. Scalar invariance goes a step further, and tests whether both factor loadings and indicators’ intercepts are invariant across groups (Davidov et al. 2014). In this case, two individuals with the same level of the latent construct will give the exact same answer to a question, regard-less of group membership. Metric invariance is often accepted as enough because, if achieved, it does not bias regression estimates. However, one cannot com-pare group means (say, one country has a more populist electorate than the other) unless scalar invariance is achieved on the instrument.
We test measurement invariance using multiple group CFA (Jöreskog 1971). It consists in first fitting, for each scale, a so-called “configural model”: in essence, one CFA model is fit to each group (in this case countries), each with their own factor loadings, intercepts, covari-ance structures, and so on. Next, a more constrained model is fit, where factor loadings are forced to be the same across groups. For example, the loading of indicator Y1 on the latent variable “populism” is forced to be the same for all countries. If that indicator works the same way across countries in measuring the latent construct, then its loading should be similar across groups anyway,
and forcing it to be exactly the same would not make the model significantly worse.
Differences in models are assessed with the χ2 test of model difference. Each model has a χ2 statistic that indi-cates how well it fits the data. The difference in χ2s between two nested models is χ2-distributed,13 with degrees of freedom equal to the difference in the number of estimated parameters. If the more constrained model fits significantly worse than the configural, it means the measurement is noninvariant: there is variation in how the items or scale works across countries. However, if the constrained model does not have a significantly worse fit, the scale is invariant, meaning that the indicators capture the latent variable in a similar way across countries.
Table 2 has the result of invariance tests for all scales. Only two have invariant factor loadings across all coun-tries: Elchardus and Spruyt (2016) and Castanho Silva et al. (2018). The first, however, had bad fit in the pooled data to begin with, so the fact that it is invariant simply indicates it works equally poorly across countries. All other batteries do not capture the latent construct of popu-lism in comparable ways across the groups. This means that one cannot compare regression coefficients from models using these scales in samples from different coun-tries. Moreover, no scale, including Elchardus and Spruyt (2016) and Castanho Silva et al. (2018), achieves scalar invariance—where intercepts are equal. As a conse-quence, we cannot say that average levels of populism are the same (or not) across different countries, as suggested by Rico and Anduiza (2017).
Information Curves
A further psychometric property that researchers can apply to test their scales comes from a different para-digm, IRT. We are interested in knowing how much of the latent construct of populism each scale is able to cap-ture. IRT was first developed to assess educational tests, and evaluate the difficulty of individual items. It consid-ers that a good test, able to discriminate among pupils’ quality, should include both easy items—that most get
Table 2. Mutigroup Confirmatory Factor Analysis Test of Measurement Invariance.
Scale χ2 Configural χ2 Loadings χ2 diff. (df) p value
Akkerman, Mudde, and Zaslove (2014) 230.76 297.15 59.935 (40) .022CSES 462.03 570.89 89.458 (48) <.001Oliver and Rahn (2016) 942.62 1176.99 187.29 (72) <.001Elchardus and Spruyt (2016) 229.16 254.76 20.845 (24) .648Schulz et al. (2018) 360.48 496.06 116.64 (64) <.001Stanley (2011) 629.81 809.27 131.05 (64) <.001Castanho Silva et al. (2018) 440.58 599.12 102.04 (88) .145
CSES = Comparative Study of Electoral Systems.
Castanho Silva et al. 7
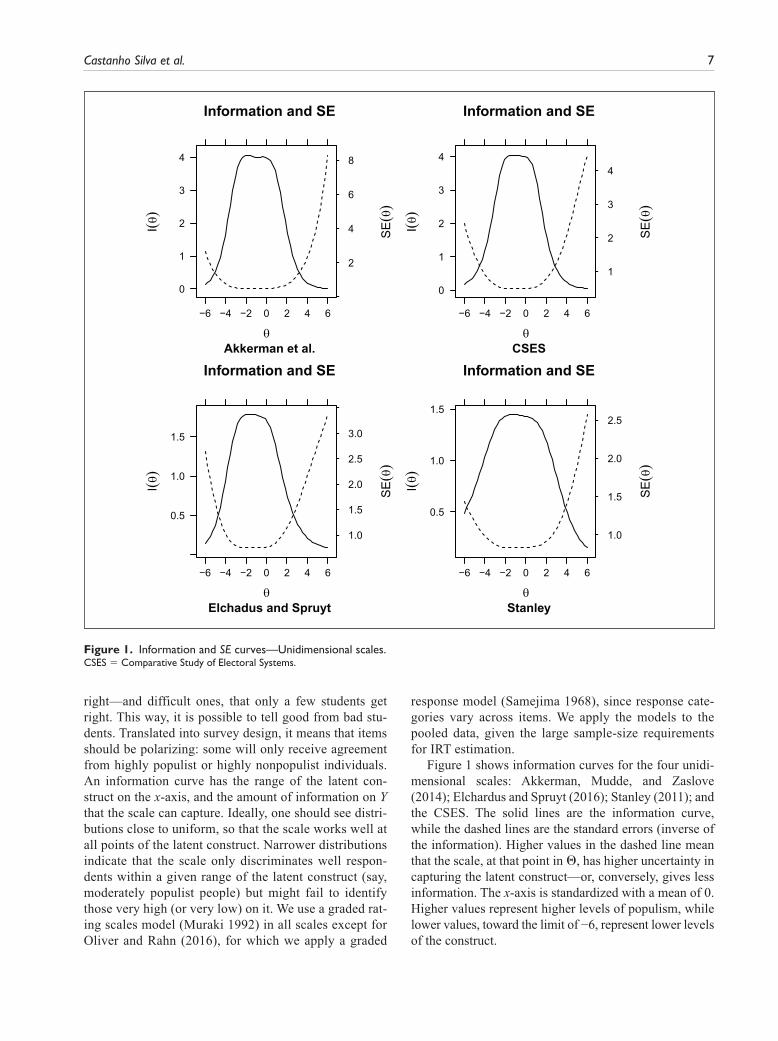
right—and difficult ones, that only a few students get right. This way, it is possible to tell good from bad stu-dents. Translated into survey design, it means that items should be polarizing: some will only receive agreement from highly populist or highly nonpopulist individuals. An information curve has the range of the latent con-struct on the x-axis, and the amount of information on Y that the scale can capture. Ideally, one should see distri-butions close to uniform, so that the scale works well at all points of the latent construct. Narrower distributions indicate that the scale only discriminates well respon-dents within a given range of the latent construct (say, moderately populist people) but might fail to identify those very high (or very low) on it. We use a graded rat-ing scales model (Muraki 1992) in all scales except for Oliver and Rahn (2016), for which we apply a graded
response model (Samejima 1968), since response cate-gories vary across items. We apply the models to the pooled data, given the large sample-size requirements for IRT estimation.
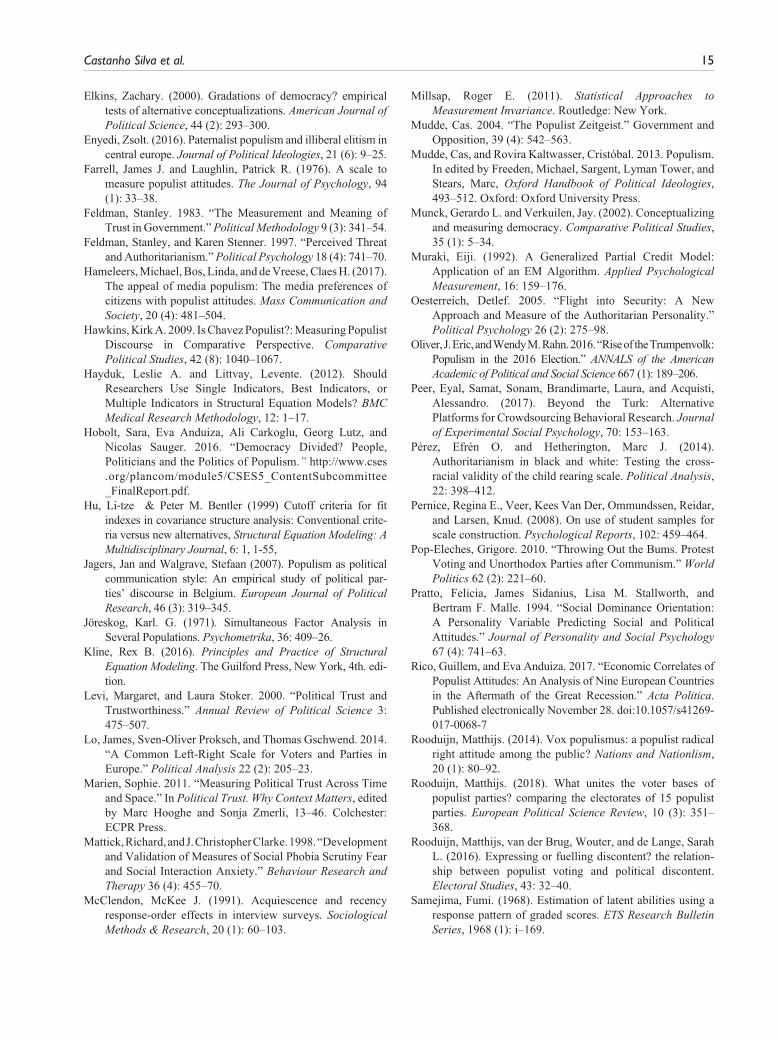
Figure 1 shows information curves for the four unidi-mensional scales: Akkerman, Mudde, and Zaslove (2014); Elchardus and Spruyt (2016); Stanley (2011); and the CSES. The solid lines are the information curve, while the dashed lines are the standard errors (inverse of the information). Higher values in the dashed line mean that the scale, at that point in Θ, has higher uncertainty in capturing the latent construct—or, conversely, gives less information. The x-axis is standardized with a mean of 0. Higher values represent higher levels of populism, while lower values, toward the limit of −6, represent lower levels of the construct.
Figure 1. Information and SE curves—Unidimensional scales.CSES = Comparative Study of Electoral Systems.

8 Political Research Quarterly 00(0)
We confirm findings by Van Hauwaert et al. (2018) that the eight-item scale by Stanley (2011) is that with the broadest information curve. It is able to discriminate pop-ulist attitudes for a range between [−4,2], underperform-ing only at the extreme high end of the scale. Others, however, have high information only around the center, in ranges between [−3,1], meaning they are better equipped to identify moderately nonpopulist and populist individuals, but not strongly populist ones. Figure 2 shows the information curves for each dimension of the three-dimensional scales by Castanho Silva et al. (2018), Schulz et al. (2018), and Oliver and Rahn (2016). In the latter, we see that one subdimension has little informa-tion: national affiliation. There’s a peak around the cen-ter, and the scale captures very little even for those moderately above or below the center. The other two dimensions not only fare better but also concentrate around the [−3,1] and [−2,2] ranges. For Schulz et al. (2018), we observe that all three dimensions capture somewhat similar ranges of their respective constructs around the center: somewhere between [−3,1] or [−2,2].
If the covariance of those three makes up populism, this means that the scale is also unable to discriminate better toward the extremes. That by Castanho Silva et al. (2018), on the other hand, has one dimension that works better at the higher end: Manichaean outlook, in which the peak of the information curve is between [−1,3]. The other two dimensions, however, have the same limitations of other scales and work better on the center and the moderately low ranges.
Discussion of Psychometric Properties
Taken together, these tests give important insights into various components in the working of attitudinal scales. Factor analysis inform us about the most basic property a scale needs: does it measure (well) what it is supposed to measure? However, two additional tests give more extensive insights: an invariance tells us if the batteries have cross-national validity. Most populist attitudes scales failed this test in these data. Last, information curves tell us whether the scale works better for some
Figure 2. Information and SE curves—three-dimensional scales.

Castanho Silva et al. 9
respondents, depending on how much they have of the underlying construct we are measuring. Ideally, scales should have high information across the board. The reality, in this case, is that most are better able to distin-guish moderately populist individuals from moderately nonpopulist ones than moderates from strong populists/nonpopulists. Based on their psychometric properties alone, none of the scales has an exemplary performance on all tests. The better working ones, even if with some shortcomings, appear to be Akkerman, Mudde, and Zaslove (2014); Castanho Silva et al. (2018); and Schulz et al. (2018).
The psychometric tests performed here are not expected to be strongly affected by the nonrepresentative samples used. Factor analysis and information curves are built on the amount of correlation in answers to items that form one construct. There is no theoretical reason to expect that the structure of correlations between items would be very different within the groups in these samples than they are in the general population. Otherwise, all of these scales would be in serious trouble: they would lack not only cross-country measurement invariance but also within-country, across-groups measurement invariance. For example, Pérez and Hetherington (2014) use invari-ance tests to find that the child-rearing authoritarianism scale (Feldman and Stenner 1997) is understood differ-ently by blacks and whites in the United States. As a con-sequence, analyses that do not take this into account produce biased estimates even if ran on a representative sample within the country. If the populist attitudes scales perform differently in measurement models with conve-nience samples, in relation to representative ones, because of different correlation structures in groups over-repre-sented within the countries tested, then no regression esti-mates using these scales that has been published in the existing literature can be trusted if they do not control for noninvariance.
Construct Validity
A proper assessment of a scale needs to take into account whether it displays external validity. They are designed to measure constructs that have been developed theo-retically, and for which there are known correlates. The question is, therefore, if a scale works at predicting something that the given concept would most certainly predict. We test external validity of populist attitudes with three variables: political trust, belief in conspira-cies, and identification with populist parties. While Ellsworth and Gonzalez (2007) and Pernice et al. (2008) claim that nonrepresentative samples should not bias estimates of correlations between two psychological constructs, we refrain from making any inferences in this section. Our goal is pre-testing survey items. If they are to have minimal external validity, we expect populist attitudes to be associated with a few of its known strong correlates in any kind of sample. We do not claim, however, that the strength of associations we find should be taken as indicative for population values.
Populist Correlates
We start by testing how each scale is correlated with two known correlates of populist attitudes and voting prefer-ences: political trust (Rooduijn, van der Brug, and Lange 2016), and conspiratorial mentality (Castanho Silva, Vegetti, and Littvay 2017). Conspiracy mentality is mea-sured with the five-item scale by Bruder et al. (2013), while political trust is measured with a question on how much confidence the respondent has in three institutions: govern-ment, parliament, and political parties. Higher values indi-cate more confidence. They are both modeled as latent variables. We fit one model for each of the scales tested, with results in Table 3.
Table 3. Correlation between Populist Attitudes, Political Trust, and Conspiracy Mentality.
Scale Political trust (r) Conspiracy (r)
Akkerman, Mudde, and Zaslove (2014) −.34 .53CSES −.44 .56Elchardus and Spruyt (2016) −.32 .50Schulz et al. (2018) −.32 .57Stanley (2011) −.11 .33Castanho Silva et al. (2018)—Aggregate −.14 .12Castanho Silva et al. (2018)—Anti-elitism −.51 .31Castanho Silva et al. (2018)—People-centrism −.34 .23Castanho Silva et al. (2018)—Manichaean outlook .11 −.16Oliver and Rahn (2016)—Anti-elitism −.31 .53Oliver and Rahn (2016)—Mistrust experts −.08 .37Oliver and Rahn (2016)—National affiliation .11 .11
CSES = Comparative Study of Electoral Systems.

10 Political Research Quarterly 00(0)
Most scales have a moderate negative correlation with political trust—between .30 and .50—and stronger with conspiracy mentality. The exceptions are the aggre-gate version of Castanho Silva et al. (2018), driven mostly by its Manicheaean outlook dimension; Stanley (2011); and the national affiliation and mistrust of experts dimensions from Oliver and Rahn (2016). The fact that the anti-elitism batteries of both Oliver and Rahn (2016) and Castanho Silva et al. (2018) have simi-lar behavior to other populist attitudes scales suggest that the latter might be capturing little more than anti-establishment sentiments.
This is confirmed by results in Figure 3, which con-tains the correlation matrix between all scales and their subdimensions.14 First of all, we observe high correla-tions (r > .8) between Akkerman, Mudde, and Zaslove (2014) and two scales that share at least one item from it: Schulz et al. (2018) and the CSES. Interestingly, Elchardus and Spruyt (2016) also strongly correlated with those three, even though there are no common items, while Stanley (2011), upon which those scales also build, is correlated with them with at least r > .6.
It is important to notice, however, how these perform once compared with the disaggregated versions of multi-dimensional scales: Akkerman, Mudde, and Zaslove (2014); Schulz et al. (2018); Elchardus and Spruyt (2016); and the CSES battery have all r > .8 correlations with the anti-elitism dimension from Oliver and Rahn (2016), and at least r > .6 with the anti-elitism dimension in Castanho Silva et al. (2018). These scales seem to be failing to cap-ture more than mere anti-elitism (in fairness, the CSES battery is referred to as “attitudes about elites” in the questionnaire). The lowest r’s are with those subdimen-sions that expand on a general anti-elitism: national affili-ation, in Oliver and Rahn (2016), and Manichaean outlook, from Castanho Silva et al. (2018), as well as the multifaceted scale by Stanley (2011).
Party Identification
A few countries in our study had relevant populist par-ties at the time of data collection. The parties are Front National and Parti de Gauche in France, Five Star Movement, Lega Nord and Forza Italia in Italy,
Figure 3. Correlation plot across populist attitudes scales.CSES = Comparative Study of Electoral Systems.
Castanho Silva et al. 11
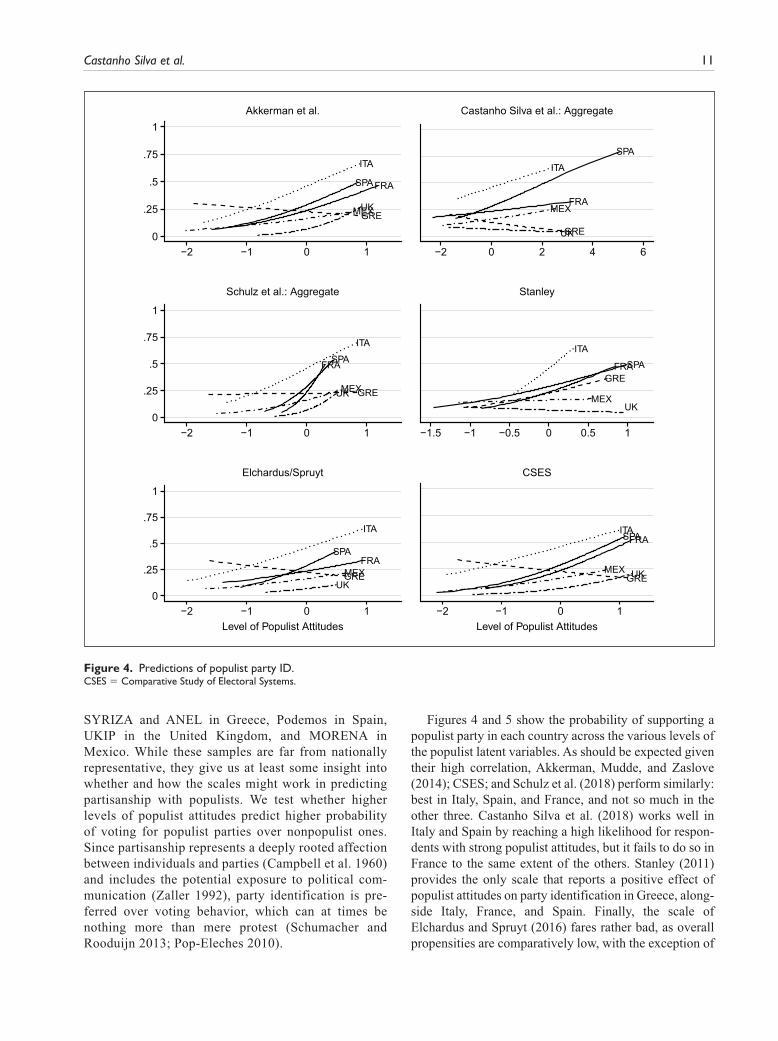
SYRIZA and ANEL in Greece, Podemos in Spain, UKIP in the United Kingdom, and MORENA in Mexico. While these samples are far from nationally representative, they give us at least some insight into whether and how the scales might work in predicting partisanship with populists. We test whether higher levels of populist attitudes predict higher probability of voting for populist parties over nonpopulist ones. Since partisanship represents a deeply rooted affection between individuals and parties (Campbell et al. 1960) and includes the potential exposure to political com-munication (Zaller 1992), party identification is pre-ferred over voting behavior, which can at times be nothing more than mere protest (Schumacher and Rooduijn 2013; Pop-Eleches 2010).
Figures 4 and 5 show the probability of supporting a populist party in each country across the various levels of the populist latent variables. As should be expected given their high correlation, Akkerman, Mudde, and Zaslove (2014); CSES; and Schulz et al. (2018) perform similarly: best in Italy, Spain, and France, and not so much in the other three. Castanho Silva et al. (2018) works well in Italy and Spain by reaching a high likelihood for respon-dents with strong populist attitudes, but it fails to do so in France to the same extent of the others. Stanley (2011) provides the only scale that reports a positive effect of populist attitudes on party identification in Greece, along-side Italy, France, and Spain. Finally, the scale of Elchardus and Spruyt (2016) fares rather bad, as overall propensities are comparatively low, with the exception of
Figure 4. Predictions of populist party ID.CSES = Comparative Study of Electoral Systems.

12 Political Research Quarterly 00(0)
Italy. Of the three dimensions in Oliver and Rahn (2016), anti-elitism works similarly to other scales: well in Italy and Spain, and less so in other countries. However, mis-trust of experts is associated with little variation in pre-dicting populist identification in all countries, while national affiliation has a strong positive association in Italy, moderate in France and Greece, and a strong nega-tive one in Spain. Finally, the failure of almost all instru-ments to predict support for populists in Greece is another strong indication that they are measuring little more than anti-establishment or anti-government feelings, given that Greece was the only country in this sample with pop-ulists in government during the data collection.
Conclusion
Table 4 summarizes our findings. The first column indi-cates how the scales load onto the dimension(s) they were proposed to. Only Akkerman, Mudde, and Zaslove (2014); Castanho Silva et al. (2018); and Schulz et al. (2018) presented good model fit and high factor loadings in this test, having, therefore, high internal coherence. Oliver and Rahn (2016) have mixed model fit but at least one indicator that works poorly, while the others have both poor fit and low factor loadings, or at least one
poorly performing one. For CSES and Elchardus and Spruyt (2016), fit improves dramatically if one bad indi-cator is removed from the original scale.
Cross-national validity refers to measurement invari-ance. The only scales that have invariant factor loadings across countries are Castanho Silva et al. (2018) and Elchardus and Spruyt (2016)—the latter one, however, has poor internal validity and the invariant loadings sim-ply indicate it works equally bad in all countries. Akkerman, Mudde, and Zaslove (2014) have a significant χ2 test, though with a p value of .022, which is not such a large violation. All other scales have much worse fitting models once we constrain factor loadings to be the same across countries, implying low cross-national validity. Further research is certainly needed as it may well be that, with different samples and a different group of countries, some scales could be invariant which are noninvariant in the tests here, and vice versa. Conceptual breadth refers to information curves and the correlation matrices. None of the scales tested has broad information curves, captur-ing high levels of information all over the range of the dependent variable. Akkerman, Mudde, and Zaslove (2014); Stanley (2011); and Castanho Silva et al. (2018) are those that get the widest information curves. As their correlations with one another showed, only Castanho
Figure 5. Predictions of populist party ID.
Table 4. Summary of Findings.
Scale Internal coherence Cross-national validity Conceptual breadth External validity
Akkerman, Mudde, and Zaslove (2014) High Medium Medium HighCSES Medium Low Low HighOliver and Rahn (2016) Medium Low Medium MediumElchardus and Spruyt (2016) Medium Medium Low LowStanley (2011) Low Low Medium MediumSchulz et al. (2018) High Low Low HighCastanho Silva et al. (2018) High High Medium Medium
CSES = Comparative Study of Electoral Systems.

Castanho Silva et al. 13
Silva et al. (2018), Stanley (2011), and Oliver and Rahn (2016) seem to capture more than mere anti-elitism.
Most scales fare similarly in external validity tests: they have moderate or high correlations with known pop-ulist attitudes correlates: low political trust and belief in conspiracies, and good at predicting populist party identi-fication in at least two of three countries: Italy, France, and Spain. This is important, since it means they work both with left- (Podemos, Left Front) and right-wing pop-ulists (National Front, Berlusconi), not being ideologi-cally skewed to one side or the other.
The nature of our data (online convenience samples with relatively small n in each country) is undoubtedly far from ideal to make inferences about populations. However, it allows to pursue the main goal of our analy-ses, namely, to test the psychometric properties of various instruments in an efficient way. Using convenience sam-ples to test large numbers of survey items is a standard practice in social and clinical psychology, for constructs as varied as social dominance orientation (Pratto et al. 1994), social phobia (Mattick and Clarke 1998), and clin-ical depression and anxiety (e.g., Watson et al. 2007), after which a much smaller number of questions is admin-istered in representative samples to measure the preva-lence of such traits in the population. It is important to emphasize that the issue at hand is not if it is better to pre-test scales on representative, convenience, or student samples. The status quo in political science is still an almost complete absence of pre-tests. At the same time, allocating scarce resources (money, survey space) for such a test on representative samples is wasteful. While acknowledging the limitations of this study, we are con-vinced that it goes beyond the state of the art, and offers a reasonable recipe for future scale development in politi-cal science. It puts forth a blueprint of how to empirically evaluate the quality of political attitudes scales in an affordable way.
While researchers have made several efforts at devel-oping scales to measure populist attitudes in recent years, up to now, most of the information available to make a decision between one or another would be theoretical considerations and the reporting of how well these scales performed in the papers that first proposed them. Our analyses, directly contrasting one to the other, show that they must be used with care. Several batteries of items or questions appear to have poor psychometric properties, or fail at capturing the proposed construct. Moreover, most seem to have limited cross-cultural validity. Given how such batteries are starting to be part of large-scale cross-national surveys, that is a source of concern. Castanho Silva et al. (2018) presents decent performance in all psychometric properties analyzed here but fails to predict populist party support in comparison with the oth-ers, which is an important drawback. Akkerman, Mudde, and Zaslove (2014) and Schulz et al. (2018) have an
acceptable or good performance on almost all tests but fail on cross-national validity in this sample. Considering that Akkerman, Mudde, and Zaslove (2014) is the most used option today, that is a slight relief. However, the lack of (1) negative-worded items, (2) multidimensionality, and (3) conceptual breadth at capturing more than anti-elitism makes us refrain from fully recommending their application in multicountry studies. As a last note, we must also highlight that while in this paper we focus on empirical tests, the selection of a scale should also be dic-tated by theory, and which one has items that better reflect the concept one is interested in measuring.
Declaration of Conflicting Interests
The author(s) declared no potential conflicts of interest with respect to the research, authorship, and/or publication of this article.
Funding
The author(s) disclosed receipt of the following financial sup-port for the research, authorship, and/or publication of this article: The data collection has been funded by the Central European University’s Research Support Scheme grant number OTHERPOL0711.
Notes
1. The full list of items can be found in the supplementary materials. There are sixty-five unique statements, all mea-sured with disagree-agree Likert-type responses, except for three in the battery by Oliver and Rahn (2016).
2. We do not have an exhaustive list of populism scales. We have not included Rooduijn (2014), which uses only questions on respondents’ opinions about politicians as a proxy measure of populism (e.g., “Politicians are profi-teers”). Older scales, such as Axelrod (1967) or Farrell and Laughlin (1976), have specific policy items that are not resonant with contemporary political discourse (e.g., the government should fire suspected communists). After our data were collected (the questionnaire was finalized in September 2016), two new ones were published: Van Hauwaert and Van Kessel (2018) and Hameleers et al. (2017). Nevertheless, both are based on Akkerman, Mudde, and Zaslove (2014), which we include.
3. An example of an item capturing more than one populism dimension in Akkerman, Mudde, and Zaslove (2014) is, “The political differences between the elite and the people are larger than the differences among the people.” It taps both into the idea of homogeneity of the people and of its distance to the elite. An example of an item tapping into a single dimension, in this case “popular sovereignty,” is “The people should be asked whenever important deci-sions are taken” Schulz et al. (2018).
4. For example, Akkerman, Mudde, and Zaslove (2014, 1332): we use here only the final list of six they ended up with, instead of the original eight from the beginning of their study.
5. These data were also used by Castanho Silva et al. (2018) in the final part of the development of their scale.

14 Political Research Quarterly 00(0)
6. Now called “figure eight.” 7. The Irish sample was complemented with hundred respon-
dents from a Qualtrics panel. We collected CrowdFlower, complemented with Qualtrics, data for Hungary as well. However, there were several concerns about data quality for this sample: large proportion of respondents who pow-ered through without giving almost any answers, and very short completion times. For this reason, we do not include Hungary in the analysis.
8. Stanley (2011) does not aggregate the indicators in his analy-ses, using all eight items separately as independent variables in regression models. However, since they are constructed to rep-resent the various dimensions of the concept of populism, we create a unidimensional factor from the eight. The estimation of a four-factor model for this scale, with two indicators each, fails to converge, and for this reason, we stick with a unidimen-sional one. We also add the method factor for positive worded items since the model would not converge without it. We also use a method factor for positive items for Castanho Silva et al. (2018), used by the authors, following the recommendation by DiStefano and Motl (2006) for when a few items have a differ-ent wording style or response scale than others.
9. Full results in the supplementary materials.10. Recommended cutoffs following Hu and Bentler (1999). 11. From the Comparative Study of Electoral Systems
(CSES), the poorly working item is, “Having a strong leader in government is good for [COUNTRY] even if the leader bends the rules to get things done”; from Oliver and Rahn (2016), it is “Ordinary people can really use the help of experts to understand complicated things like science and health.” From Elchardus and Spruyt (2016), “People who have studied for a long time and have many diplomas do not really know what makes the world go round,” and from Stanley (2011), “Ordinary people are unable to make the correct decisions about the future of our country.”
12. The two most common ways of accounting for clustering used today, clustering standard errors and multilevel mod-eling, only correct for clustering of regression estimates, but still assume measurement invariance across groups. The exception, when it comes to factor loadings, is multi-level structural equation models with random factor load-ings (Asparouhov and Muthén 2015).
13. The more restricted model (loadings) is considered “nested” within the configural model. It means that one can arrive at the more restricted one by imposing no more than equality constraints on the less restrictive.
14. For this figure, we ran two-factor confirmatory factor anal-ysis (CFA) models with each pair of scales. The correla-tions presented are those estimated between the two latent variables in each CFA model.
Supplemental Material
Supplemental materials for this article are available with the manuscript on the Political Research Quarterly (PRQ) website.
ORCID iD
Bruno Castanho Silva https://orcid.org/0000-0001-9363-4704
References
Akkerman, Agnes, Cas Mudde, and Andrej Zaslove. 2014. “How Populist Are the People? Measuring Populist Attitudes in Voters.” Comparative Political Studies 47 (9): 1324–53.
Altemeyer, Bob. 1981. Right-Wing Authoritarianism. Winnipeg: University of Manitoba Press.
Asparouhov, Tihomir and Muthén, Bengt O. (2015). General Random Effect Latent Variable Modeling: Random Subjects, Items, Contexts, and Parameters. In Harring, J. R., & Stapleton, L. M., & Beretvas, S. N. (Eds.), Advances in Multilevel Modeling for Educational Research: Addressing Practical Issues Found in Real-world Applications. Information Age Publishing, Inc., Charlotte, NC.
Axelrod, Robert. (1967). The structure of public opinion on pol-icy issues. Public Opinion Quarterly, 1 (1): 51–60.
Berinsky, Adam J., Huber, Gregory A., and Lenz, Gabriel S. (2012). Evaluating Online Labor Markets for Experimental Research: Amazon.com’s Mechanical Turk. Political Analysis, 20 (3): 351–368.
Bruder, Martin,, Haffke, Peter, Neave, Nick, Nouripanah, Nina, and Imhoff, Roland. (2013). Measuring individual dif-ferences in generic beliefs in conspiracy theories across cultures: conspiracy mentality questionnaire. Frontiers in Psychology, 4: 1–15.
Canovan, Margaret. (1981). Populism. Junction Books, London.Canovan, Margaret. (1999). Trust the People! Populism and the
Two Faces of Democracy. Political Studies, 47: 2–16. Campbell, Angus, Philip E. Converse, Warren E. Miller, and
Donald E. Stokes. 1960. The American Voter. New York: Wiley.
Castanho Silva, Bruno, Vegetti, Federico, and Littvay, Levente. (2017). The elite is up to something: Exploring the relation between populism and belief in conspiracy theories. Swiss Political Science Review, 23 (4): 423–443.
Castanho Silva, Bruno, Ioannis Andreadis, Eva Anduiza, Nebojša Blanuša, Yazmin Morlet Corti, Gisela Delfino, Guillem Rico, et al. 2018. “Public Opinion Surveys: A New Scale.” In The Ideational Approach to Populism: Theory, Method & Analysis, edited by Kirk Hawkins, Ryan Carlin, Levente Littvay, and Cristóbal Rovira Kaltwasser, 150-178. London: Routledge.
Davidov, Eldad, Meuleman, Bart, Cieciuch, Jan, Schmidt, Peter, and Billiet, Jaak. (2014). Measurement Equivalence in Cross-National Research. Annual Review of Sociology, 40 (1): 55–75.
DiStefano, Christine and Motl, Robert W. (2006). Further Investigating Method Effects Associated With Negatively Worded Items on Self-Report Surveys. Structural Equation Modeling: A Multidisciplinary Journal, 13: 440–464.
Elchardus, Mark, and Bram Spruyt. 2016. “Populism, Persistent Republicanism and Declinism: An Empirical Analysis of Populism as a Thin Ideology.” Government & Opposition 51 (1): 111–33.
Ellsworth, Phoebe C. and Gonzalez, Richard. (2007). Questions and comparisons: Methods of research in social psychol-ogy. In The Sage Handbook of Social Psychology. edited by Michael Hogg and Joel Cooper, 24–42. Los Angeles, CA: Sage.
Castanho Silva et al. 15
Elkins, Zachary. (2000). Gradations of democracy? empirical tests of alternative conceptualizations. American Journal of Political Science, 44 (2): 293–300.
Enyedi, Zsolt. (2016). Paternalist populism and illiberal elitism in central europe. Journal of Political Ideologies, 21 (6): 9–25.
Farrell, James J. and Laughlin, Patrick R. (1976). A scale to measure populist attitudes. The Journal of Psychology, 94 (1): 33–38.
Feldman, Stanley. 1983. “The Measurement and Meaning of Trust in Government.” Political Methodology 9 (3): 341–54.
Feldman, Stanley, and Karen Stenner. 1997. “Perceived Threat and Authoritarianism.” Political Psychology 18 (4): 741–70.
Hameleers, Michael, Bos, Linda, and de Vreese, Claes H. (2017). The appeal of media populism: The media preferences of citizens with populist attitudes. Mass Communication and Society, 20 (4): 481–504.
Hawkins, Kirk A. 2009. Is Chavez Populist?: Measuring Populist Discourse in Comparative Perspective. Comparative Political Studies, 42 (8): 1040–1067.
Hayduk, Leslie A. and Littvay, Levente. (2012). Should Researchers Use Single Indicators, Best Indicators, or Multiple Indicators in Structural Equation Models? BMC Medical Research Methodology, 12: 1–17.
Hobolt, Sara, Eva Anduiza, Ali Carkoglu, Georg Lutz, and Nicolas Sauger. 2016. “Democracy Divided? People, Politicians and the Politics of Populism.” http://www.cses .org/plancom/module5/CSES5_ContentSubcommittee _FinalReport.pdf.
Hu, Li‐tze & Peter M. Bentler (1999) Cutoff criteria for fit indexes in covariance structure analysis: Conventional crite-ria versus new alternatives, Structural Equation Modeling: A Multidisciplinary Journal, 6: 1, 1-55,
Jagers, Jan and Walgrave, Stefaan (2007). Populism as political communication style: An empirical study of political par-ties’ discourse in Belgium. European Journal of Political Research, 46 (3): 319–345.
Jöreskog, Karl. G. (1971). Simultaneous Factor Analysis in Several Populations. Psychometrika, 36: 409–26.
Kline, Rex B. (2016). Principles and Practice of Structural Equation Modeling. The Guilford Press, New York, 4th. edi-tion.
Levi, Margaret, and Laura Stoker. 2000. “Political Trust and Trust worthiness.” Annual Review of Political Science 3: 475–507.
Lo, James, Sven-Oliver Proksch, and Thomas Gschwend. 2014. “A Common Left-Right Scale for Voters and Parties in Europe.” Political Analysis 22 (2): 205–23.
Marien, Sophie. 2011. “Measuring Political Trust Across Time and Space.” In Political Trust. Why Context Matters, edited by Marc Hooghe and Sonja Zmerli, 13–46. Colchester: ECPR Press.
Mattick, Richard, and J. Christopher Clarke. 1998. “Development and Validation of Measures of Social Phobia Scrutiny Fear and Social Interaction Anxiety.” Behaviour Research and Therapy 36 (4): 455–70.
McClendon, McKee J. (1991). Acquiescence and recency response-order effects in interview surveys. Sociological Methods & Research, 20 (1): 60–103.
Millsap, Roger E. (2011). Statistical Approaches to Measurement Invariance. Routledge: New York.
Mudde, Cas. 2004. “The Populist Zeitgeist.” Government and Opposition, 39 (4): 542–563.
Mudde, Cas, and Rovira Kaltwasser, Cristóbal. 2013. Populism. In edited by Freeden, Michael, Sargent, Lyman Tower, and Stears, Marc, Oxford Handbook of Political Ideologies, 493–512. Oxford: Oxford University Press.
Munck, Gerardo L. and Verkuilen, Jay. (2002). Conceptualizing and measuring democracy. Comparative Political Studies, 35 (1): 5–34.
Muraki, Eiji. (1992). A Generalized Partial Credit Model: Application of an EM Algorithm. Applied Psychological Measurement, 16: 159–176.
Oesterreich, Detlef. 2005. “Flight into Security: A New Approach and Measure of the Authoritarian Personality.” Political Psychology 26 (2): 275–98.
Oliver, J. Eric, and Wendy M. Rahn. 2016. “Rise of the Trumpenvolk: Populism in the 2016 Election.” ANNALS of the American Academic of Political and Social Science 667 (1): 189–206.
Peer, Eyal, Samat, Sonam, Brandimarte, Laura, and Acquisti, Alessandro. (2017). Beyond the Turk: Alternative Platforms for Crowdsourcing Behavioral Research. Journal of Experimental Social Psychology, 70: 153–163.
Pérez, Efrén O. and Hetherington, Marc J. (2014). Authoritarianism in black and white: Testing the cross-racial validity of the child rearing scale. Political Analysis, 22: 398–412.
Pernice, Regina E., Veer, Kees Van Der, Ommundssen, Reidar, and Larsen, Knud. (2008). On use of student samples for scale construction. Psychological Reports, 102: 459–464.
Pop-Eleches, Grigore. 2010. “Throwing Out the Bums. Protest Voting and Unorthodox Parties after Communism.” World Politics 62 (2): 221–60.
Pratto, Felicia, James Sidanius, Lisa M. Stallworth, and Bertram F. Malle. 1994. “Social Dominance Orientation: A Personality Variable Predicting Social and Political Attitudes.” Journal of Personality and Social Psychology 67 (4): 741–63.
Rico, Guillem, and Eva Anduiza. 2017. “Economic Correlates of Populist Attitudes: An Analysis of Nine European Countries in the Aftermath of the Great Recession.” Acta Politica. Published electronically November 28. doi:10.1057/s41269-017-0068-7
Rooduijn, Matthijs. (2014). Vox populismus: a populist radical right attitude among the public? Nations and Nationlism, 20 (1): 80–92.
Rooduijn, Matthijs. (2018). What unites the voter bases of populist parties? comparing the electorates of 15 populist parties. European Political Science Review, 10 (3): 351–368.
Rooduijn, Matthijs, van der Brug, Wouter, and de Lange, Sarah L. (2016). Expressing or fuelling discontent? the relation-ship between populist voting and political discontent. Electoral Studies, 43: 32–40.
Samejima, Fumi. (1968). Estimation of latent abilities using a response pattern of graded scores. ETS Research Bulletin Series, 1968 (1): i–169.

16 Political Research Quarterly 00(0)
Schulz, Anne, Philipp Müller, Christian Schemer, Dominique S. Wirz, Martin Wettstein, and Werner Wirth. 2018. “Measuring Populist Attitudes on Three Dimensions.” International Journal of Public Opinion Research 30 (2): 316–26.
Schumacher, Gijs, and Matthijs Rooduijn. 2013. “Sympathy for the ‘Devil’? Voting for Populists in the 2006 and 2010 Dutch General Elections.” Electoral Studies 32 (1): 124–33.
Shen, Winny, Kiger, Thomas B., Davies, Stacey E., Rasch, Rena L., Simon, Kara M., and Ones, Deniz S. (2011). Samples in applied psychology: Over a decade of research in review. Journal of Applied Psychology, 96: 1055–1064.
Spruyt, Bram, Keppens, Gil, and Van Droogenbroeck, Filip. (2016). Who Supports Populism and What Attracts People to It? Political Research Quarterly, 69 (2): 335–346.
Stanley, Ben. 2011. “Populism, Nationalism, or National Populism? An Analysis of Slovak Voting Behaviour at the 2010 Parliamentary Election.” Communist and Post-Communist Studies 44 (4): 257–70.
Van Hauwaert, Steven M. and Van Kessel, Stijn. (2018). Beyond protest and discontent: A cross-national analysis of the effect of populist attitudes and issue positions on popu-
list party support. European Journal of Political Research, 57 (1): 68–92.
Van Hauwaert, Steven, Schimpf, Christian H., and Azevedo, Flavio de. (2018). Public opinion surveys: evaluating existing measures. In edited by Hawkins, Kirk A., Carlin, Ryan, Littvay, Levente, and Rovira Kaltwasser, Cristóbal, The Ideational Approach to Populism: Theory, Method & Analysis. London: Routledge.
van Prooijen, Jan-Willem. and Krouwel, Andre. P. M. (2017). Extreme Political Beliefs Predict Dogmatic Intolerance. Social Psychological and Personality Science, 8 (3): 292–300.
Watson, David, Michael W. O’Hara, Leonard J. Simms, Roman Kotov, Michael Chmielewski, Elizabeth A. McDade-Montez, Wazika Gamez, and Scott Stuart. 2007. “Development and Validation of the Inventory of Depression and Anxiety Symptoms (IDAS).” Psychological Assessment 19 (3): 253–68.
Wilson, Glenn D., and John R. Patterson. 1968. “A New Measure of Conservatism.” British Journal of Clinical Psychology 7 (4): 264–69.
Zaller, John. 1992. The Nature and Origins of Mass Opinion. New York: Cambridge University Press.