an electrophysiological signature of summed …memory.psych.upenn.edu/files/pubs/vanvetal12.pdfan...
TRANSCRIPT

An Electrophysiological Signature of Summed Similarity in VisualWorking Memory
Marieke K. van VugtUniversity of Groningen
Robert SekulerBrandeis University
Hugh R. WilsonYork University
Michael J. KahanaUniversity of Pennsylvania
Summed-similarity models of short-term item recognition posit that participants base their judgments ofan item’s prior occurrence on that item’s summed similarity to the ensemble of items on the rememberedlist. We examined the neural predictions of these models in 3 short-term recognition memory experimentsusing electrocorticographic/depth electrode recordings and scalp electroencephalography. On each ex-perimental trial, participants judged whether a test face had been among a small set of recently studiedfaces. Consistent with summed-similarity theory, participants’ tendency to endorse a test item increasedas a function of its summed similarity to the items on the just-studied list. To characterize this behavioraleffect of summed similarity, we successfully fit a summed-similarity model to individual participant datafrom each experiment. Using the parameters determined from fitting the summed-similarity model to thebehavioral data, we examined the relation between summed similarity and brain activity. We found that4–9 Hz theta activity in the medial temporal lobe and 2–4 Hz delta activity recorded from frontal andparietal cortices increased with summed similarity. These findings demonstrate direct neural correlatesof the similarity computations that form the foundation of several major cognitive theories of humanrecognition memory.
Keywords: summed similarity, oscillations, recognition memory, EEG
Behavioral and model-theoretic analyses of recognition memoryagree that similarity is a major determinant of both recognitionaccuracy and speed (e.g., Hintzman, 1988; Nosofsky, Little,Donkin, & Fific, 2011). Specifically, participants’ recognitionresponses are influenced by a probe’s similarity to items on thejust-studied list. When a lure is similar to one or more studieditems, participants tend to commit false alarms, and when theycorrectly reject those similar items, their response times (RTs) aresignificantly increased. Moreover, a target is more likely to beendorsed when it is similar to the nontarget items on the studiedlist (see Kahana, 2012, for a review).
Assessing the psychological similarity of a probe (be it a targetor lure) to the stored representation of the items on a just-presentedlist requires a quantitative model of the mapping between physicaland psychological coordinates and of the way in which similaritiescombine across multiple study items. Summed-similarity models,which describe both of these processes, have been highly success-ful in accounting for behavioral data on item recognition (e.g.,Hintzman, 1988; Kahana & Sekuler, 2002; Lamberts, Brockdorff,& Heit, 2003; Nosofsky, 1991; Nosofsky & Kantner, 2006; Nosof-sky et al., 2011; Shiffrin & Steyvers, 1997). These models positthat item recognition is a signal-detection process, in which aparticipant computes the probe’s summed similarity to all studyitems and bases her or his recognition decision on this measure.Whenever the computed summed similarity exceeds a decisionthreshold, the participant will respond yes. Thus, when summedsimilarity is high for probes that are targets, there is little interfer-ence and the participant is likely to respond yes. For probes that arelures, high summed similarity constitutes high interference, whichalso increases the participant’s tendency to incorrectly respond yes.
Summed-similarity models are generally viewed as models offamiliarity. There is evidence that people can base recognitionjudgments both on recall of specific features of the encoding trial(termed “recollection”) and on item familiarity. However, for listsof perceptually similar items, pure summed-similarity (familiarity)models provide an excellent fit to the data without positing arecollection component. Given summed-similarity models’ suc-cess in describing trial-by-trial variation in participants’ behavior
This article was published Online First September 10, 2012.Marieke K. van Vugt, Department of Artificial Intelligence, University
of Groningen, Groningen, the Netherlands; Robert Sekuler, Volen Centerfor Complex Systems, Brandeis University; Hugh R. Wilson, Center forVision Research, York University, Toronto, Ontario, Canada; Michael J.Kahana, Department of Psychology, University of Pennsylvania.
We acknowledge support from National Science Foundation Science ofLearning Center Grant SBE 0354378, Conte Center Grant P50 MH062196,and National Institutes of Health Grants RO1 MH061975, MH068404,EY002158, and MH055678. We thank Josh Jacobs, Sean Polyn, andChristoph Weidemann for helpful discussions and Patrick Crutchley forhelp with figure preparation.
Correspondence concerning this article should be addressed to MariekeK. van Vugt, Department of Artificial Intelligence, University of Gro-ningen, Nijenborgh 9, 9747 AG Groningen, the Netherlands. E-mail:[email protected]
Thi
sdo
cum
ent
isco
pyri
ghte
dby
the
Am
eric
anPs
ycho
logi
cal
Ass
ocia
tion
oron
eof
itsal
lied
publ
ishe
rs.
Thi
sar
ticle
isin
tend
edso
lely
for
the
pers
onal
use
ofth
ein
divi
dual
user
and
isno
tto
bedi
ssem
inat
edbr
oadl
y.
Journal of Experimental Psychology: General © 2012 American Psychological Association2013, Vol. 142, No. 2, 412–425 0096-3445/13/$12.00 DOI: 10.1037/a0029759
412

(e.g., the noisy exemplar model; NEMo; Kahana & Sekuler, 2002;Nosofsky & Kantner, 2006), we sought to determine whether thereis an electrophysiological correlate of the model-defined summed-similarity signal. Such a demonstration would provide neural sup-port for the existence of the cognitive construct of summed simi-larity.
In three studies we examined whether oscillatory activity in bothelectrocorticographic (ECoG) recordings in neurosurgical patientsand scalp EEG recordings in healthy controls correlate withsummed-similarity computations, with other relevant variablesbeing controlled for. We focused our attention on oscillatoryresponses because an extensive body of work has linked neuraloscillations to cognitive processes in both humans and animals(see Jacobs & Kahana, 2010, for a review). Of particular relevanceto the current studies is the finding that during memory retrieval,slow oscillations, in the theta (4–9 Hz) and delta (2–4 Hz) fre-quency bands, are of higher amplitude for targets than for lures(Düzel, Neufang, & Heinze, 2005; Jacobs, Hwang, Curran, &Kahana, 2006) and also of higher amplitude for high-confidencecorrect decisions than for low-confidence correct decisions (Gud-erian & Düzel, 2005). In contrast, oscillations at higher frequen-cies, specifically in the gamma band (28–128 Hz), have primarilybeen associated with manipulations of memory load (Howard etal., 2003; van Vugt, Schulze-Bonhage, Litt, Brandt, & Kahana,2010). The ECoG study reported here builds on a prior study byvan Vugt et al. (2009), which involved a subset of the same groupof neurosurgical patients. By combining novel analyses of thoseECoG data with data from two new scalp EEG studies we assayedneural data recorded at multiple spatial scales for direct evidenceof summed-similarity computations. To parametrically investigatethe neural correlates of similarity in item recognition, we usedspecially designed synthetic faces whose similarity is well definedboth in physical and psychological representational spaces (seeMethod below).
Experiments 1–3
Method
Because similar experimental and data-analytic methods wereused in Experiments 1–3, we present the methods for all threeexperiments together and note differences between studies as ap-propriate.
Synthetic faces. We chose human faces as stimuli because oftheir ecological validity and because their similarities can be bothquantified and parametrically varied. Rather than using photo-graphs of faces as stimuli, we adopted a set of synthetic facesderived from real photographs but filtered to remove componentssuch as hair and skin texture while preserving the shape, size, andposition of key facial features (Wilson, Loffler, & Wilkinson,2002). Wilson’s technique for generating synthetic faces begins bytaking 37 physical measurements on a set of (normalized) photo-graphs of Caucasian males and then reconstructing the faces fromthe principal components that could be extracted from the matrixof these measurements. A stimulus set of 16 faces was constructedfrom all permutations of steps of one standard deviation away fromthe mean face (of the 37-dimensional face space) in the directionsof each of the first four principal components (one standard devi-ation is approximately the threshold for 75% correct discrimina-
tion between two faces that are flashed for 110 ms; see AppendixA). The resulting faces were low-pass filtered at 10 cycles per facewidth, which is optimal for face processing and removes compo-nents like hair and skin texture (Wilson et al., 2002). The advan-tages of using this face set are that, although the faces are wellcontrolled, they still can be identified with high accuracy, and it ispossible to measure their interitem similarity precisely. Moreover,the faces are realistic enough to generate strong responses in thefusiform face area (Loffler, Yourganov, Wilkinson, & Wilson,2005). This is important because previous studies have shown thatthe fusiform face area is sensitive to similarity distances betweenfaces (e.g., Harris & Aguirre, 2010). As such, it should be possibleto find neural effects of similarity for these faces.
Multidimensional scaling study. We carried out a prelimi-nary multidimensional scaling (MDS) study to characterize thepsychological similarities among the items (see Appendix A fordetails). In this MDS study, 23 participants served for two ses-sions, in which they saw all combinations of three faces (triads)twice and had to determine the “odd-one-out” (i.e., the face that isleast similar to the other two). From these ratings, a similaritymatrix was constructed by increasing the similarity value for eachof the two nonchosen faces (see Kahana & Bennett, 1994, fordetails). This similarity matrix was transformed into similaritycoordinates for every face using individual-differences multidi-mensional scaling (INDSCAL/ALSCAL; Takane, Young, & deLeeuw, 1977). We used the four-dimensional stimulus coordinatesderived from this procedure (see Appendix A) in our summed-similarity analyses. The normalized raw stress measure for thissolution was 0.022, which had a dispersion accounted for (DAF) of0.98. (DAF is analogous to variance accounted for in a regressionanalysis; Heiser & Bennani, 1997.) The attentional weights werevery similar across participants, as demonstrated by the smallstandard deviation for each of the four dimensions: mean atten-tional weight (standard deviation) � 0.34 (0.026); 0.34 (0.042);0.34 (0.024); 0.33 (0.015).
Short-term item recognition paradigm. Figure 1 illustratesthe sequence of events during each trial of the experiment. Fol-lowing the appearance of a fixation stimulus (an asterisk thatappeared for 1,000–1075 ms, jittered) participants viewed a shortseries of faces. Each stimulus appeared for 700–775 ms, followedby a 275- to 350-ms interstimulus interval. After a 3,000- to3,300-ms retention interval, a probe item appeared and participantsindicated with a keypress whether the probe was a member of thejust-presented list (a target) or an item not shown on the current list(a lure). After each trial, participants were given accuracy feed-back. The participant advanced to the next trial with a keypress.Temporal jitter was used to avoid spurious correlations betweenongoing brain activity and task events. Participants were encour-aged to be both fast and accurate, and participants in Experiments2 and 3 were paid a bonus based on their accuracy and responsetime. The experiment was programmed in the Python Experimen-tal Programming Library PyEPL (http://pyepl.sourceforge.net; de-scribed in Geller, Schleifer, Sederberg, Jacobs, & Kahana, 2007).
The three experiments differed in the number of faces presentedin each series. Lists used in Experiments 1 and 2 comprised avariable number of faces, whereas lists in Experiment 3 alwayscomprised three faces. In Experiment 1, lists could have one, two,or three faces; in Experiment 2, lists could have two, three, or four
Thi
sdo
cum
ent
isco
pyri
ghte
dby
the
Am
eric
anPs
ycho
logi
cal
Ass
ocia
tion
oron
eof
itsal
lied
publ
ishe
rs.
Thi
sar
ticle
isin
tend
edso
lely
for
the
pers
onal
use
ofth
ein
divi
dual
user
and
isno
tto
bedi
ssem
inat
edbr
oadl
y.
413OSCILLATORY CORRELATES OF SUMMED SIMILARITY

faces. Experiments 1 and 2 also contained lists of nonface stimuli,which are not analyzed in the present report.1
Each experiment employed a “recent negatives” manipulation tostudy the effects of proactive interference on brain activity (Mon-sell, 1978). Whenever a lure probe was shown, it always had beena study item one, two, or three lists back (we refer to this lurerecency as “list lag”). Lures that appeared as study items on recentlists are expected to give rise to significant proactive interference.Although we report on the behavioral effects of lure recency, theseeffects are not a major focus of the present study. With theexception of those probe items that were part of the recent nega-tives manipulation, lists were constructed so that items could notbe repeated on successive lists. Lists were also constructed so thatthe frequencies of targets and lures and each of the list lengths andthe three levels of the recent negatives manipulation were allmatched. In addition, targets were equally likely to match a studyitem from each serial position. Blocks were then constructed bydrawing lists at random from the pool, subject to the aboveconstraints.
Every session was preceded by two 16-trial training blocks; forExperiment 1, there were 40 additional one-item lists to familiarizethe participant with the face stimuli. Participants were given feed-back on their average accuracy and RT at the end of each 30-trialblock. Incorrect trials and trials with RTs shorter than 200 ms orlonger than 2,500 ms (for Experiment 1) or 2,000 ms (for Exper-iments 2 and 3) were removed from the analysis.
Participants. Participants in Experiment 1 were 16 neurosur-gical patients being treated for medically refractory epilepsy (ages15–58; six female). Patients were monitored with arrays of sub-dural and/or depth electrodes to localize seizure onset and to mapcognitive functions prior to resective surgery. Patients were re-cruited from Brigham and Women’s Hospital (Boston, Massachu-setts), the Hospital of the University of Pennsylvania (Philadel-phia), and Universitäts Klinikum Freiburg (Freiburg, Germany),and the research protocol was approved by the appropriate insti-tutional review boards at each hospital. Informed consent wasobtained from all participants.
In Experiment 2, 37 young adults (ages 20–32) recruited fromthe University of Pennsylvania student community participated intwo experimental sessions for payment. Each session involved 10blocks of 30 trials, as described above. In Experiment 3, 20 young
adults (ages 19–29) participated in four experimental sessions forpayment. Over the course of their four sessions, participants sawthe same set of 66 study lists 16 times. The lists were divided intothree blocks, the order of which was randomized across the fourrepetitions in each testing session.
ECoG and depth electrode recordings in Experiment 1.The local field potential was amplified and digitally recorded atsampling rates between 250 and 1,024 Hz and bandpass filteredbetween 0.1 and 100 Hz. Data were subsequently notch filteredwith a Butterworth filter with zero phase distortion to eliminateline noise. The intervals of interest were scanned for epilepticspikes and sharp waves by means of a kurtosis threshold; eventswere discarded if their kurtosis exceeded a threshold of 5 (see vanVugt et al., 2010, for details).
To synchronize electrophysiological recordings with behavioralevents, the computer generating the task sent pulses via an opticalisolator into an unused recording channel or digital input on theamplifier to time stamp the digital intracranial EEG (iEEG) re-cording. The time stamps associated with these pulses aligned theexperimental computer’s clock with the iEEG clock to a precisionwell under the sampling interval of the iEEG recording (�4 ms).For all participants, the locations of implanted electrodes weredetermined by means of co-registered postoperative computedtomographies and preoperative magnetic resonance imaging(MRI) or from postoperative MRIs by an indirect stereotactictechnique and converted into Montreal Neurological Institute(MNI) coordinates. Localization of depth electrode contacts in thehippocampus was done manually through clinician’s inspection ofthe postoperative MRIs.
Scalp EEG recordings in Experiments 2 and 3. We re-corded scalp EEG signals using a 129-channel EGI Inc. system,with an AC-coupled, high-input-impedance amplifier (200 M�,Net Amps, Electrical Geodesics, Inc., Eugene, OR). The samplingrate was 500 Hz, and data were recorded with a 0.1–250 Hzbandpass filter. Individual channels were adjusted until imped-
1 Experiment 1 included lists of consonants, and Experiment 2 includedlists of compound sinuosoidal gratings. For these experiments, trials ofeach list type were presented in blocks of 30 lists with the order of theblocks randomized across participants.
Figure 1. Trial structure of the Sternberg task. This figure illustrates the sequence and timing of events in a trialwith three faces.
Thi
sdo
cum
ent
isco
pyri
ghte
dby
the
Am
eric
anPs
ycho
logi
cal
Ass
ocia
tion
oron
eof
itsal
lied
publ
ishe
rs.
Thi
sar
ticle
isin
tend
edso
lely
for
the
pers
onal
use
ofth
ein
divi
dual
user
and
isno
tto
bedi
ssem
inat
edbr
oadl
y.
414 VAN VUGT, SEKULER, WILSON, AND KAHANA
ances were below 50 k�. Bad channels were detected manuallyoff-line, and the remaining channels were used for average re-referencing. Eye blinks were detected using a running-averagethreshold and a voltage threshold of 100 �V. Data from sevenparticipants for whom more than 20% of events were rejected dueto eye blinks were excluded, leaving us with 30 participants. Oneadditional participant was excluded because of average accuracybelow 60%. For Experiment 3, one participant was excludedbecause of average accuracy below 60%, and another was ex-cluded for failure to exhibit serial position effects (and accuracybelow 70%). All data were notch filtered in the 58–62 Hz fre-quency band to remove line noise.
Regression-based analysis of EEG and ECoG oscillations.We used a multiple-regression approach (e.g., Jacobs et al.,2006) to assess the neural correlates of summed similarity whilecontrolling for the effects of proactive interference and within-list recency (i.e., serial position effects that cause the first andlast items of a list to be remembered better). We computed theordinary least squares regression coefficient of summed-similarity S, response time, and recency on z-transformed os-cillatory power during the interval between probe onset and themoment the participant responded. Oscillatory power was de-termined using six-cycle Morlet wavelets at logarithmicallyspaced frequencies (2(x/8) Hz for x � 8, . . . , 56). Recency wasdefined separately for targets (lagT; in units of item position)and lures (lagL; the number of lists ago the probe was lastpresented). Note that lure recency is a measure of proactiveinterference, with more recent lures corresponding to conditionsof higher proactive interference. S was computed by fitting asummed-similarity model (Kahana & Sekuler, 2002, describedbelow) to the behavioral data from each individual participant.The parameters of this model were optimized with a patternsearch algorithm that searched for the minimum of a goodness-of-fit measure that consisted of the sum of the root-mean-squaredeviation between modeled and empirical summed similarityand the difference between modeled and empirical d prime. InExperiments 1 and 2, S was binned into five levels of summedsimilarity; in Experiment 3, we had multiple repetitions of eachlist so we could fit the model to participants’ accuracy data oneach individual list.
To assess whether the neural correlates of S changed over thecourse of the trial and/or differed between low- and high-frequency bands, we included terms representing the interactionbetween S and frequency band F (2–4 Hz delta, 4–9 Hz theta, and9–14 Hz alpha were coded as low frequencies; 14–28 Hz beta and28–90 Hz gamma were coded as high frequencies) and between Sand time interval T (first half or second half of the recognitionprobe-to-response interval). We also included the triple interactionterm between S, F, and T. The length of the probe interval variedfrom trial to trial as a function of the participant’s RT (i.e.,oscillatory power was Vincentized; it was resampled into time binswhose size scaled with the length of the trial such that each trialhad two time bins, but their size increased with the participant’sresponse time; Workman & Adams, 1950). Because recency wasdefined separately for targets and lures, we fit separate models tothe electrophysiological data recorded during these two types oftrials. For target trials we fit the model
Z(P)e � �0 � �1S � �2lagT � �3S � F � �4S � T
� �5S � F � T � �6RT,
and for lure trials we fit the model
Z(P)e � �0 � �1S � �2lagL � �3S � F � �4S � T
� �5S � F � T � �6RT,
where Z(P)e indicates the z-transformed power at electrode e.The resulting regression coefficients were then submitted to an
across-subject t test to establish population effects. For Experi-ments 2 and 3, we used a cluster-based method on the t statisticsto correct for multiple comparisons (Maris & Oostenveld, 2007).Clusters reflect the intuition that results are more likely to be trueif they are present in groups of adjacent EEG channels. Theprocedure starts by comparing the p value from each channel’s ttest (on the regression coefficients) to a threshold of 0.01. We thenassessed to what extent this binarized significance map consistedof clusters of spatially adjacent channels. For each cluster, wesummed the t statistics from all the channels comprising thatcluster, which we compared to a permutation distribution to de-termine whether the cluster was significant. The permutation dis-tribution was created by randomly swapping the sign of individual-subject regression coefficients and recomputing the clusters.Significant clusters are those whose summed t statistic is in theupper tail of the distribution of summed t statistics based onrandomized data. For Experiment 1, no such clustering was nec-essary, because we restricted our analyses to a small set of pre-defined regions of interest (ROIs).
The ROIs (predefined for Experiment 1; based on the S � Finteraction for Experiments 2 and 3) were then used to examine theslope of oscillatory power on S. We used this S � F interaction todefine our ROIs because we were primarily interested in oscilla-tory correlates of S that were specific for a frequency band. Toensure that any differences we would observe between Experi-ments 2 and 3 were not an artifact of having ROIs comprisingdifferent sets of electrodes, we defined a parietal and frontal ROIbased on the intersection of the ROIs for the two experiments inthe lures condition. For each of these ROIs, we then assessedwhether the slope of S on oscillatory power was consistent be-tween target and lure trials and between the two experiments.
Results
Behavioral analysesSerial position effects. We observed standard serial position
effects in all three experiments, with the general pattern being alarge recency effect and a small primacy effect. Serial position hada significant effect on accuracy but not RT in Experiment 1, asrevealed by a repeated-measures analysis of variance: accuracy,F(2, 44) � 5.67, p � .01; RT, F(2, 44) � 1.29, ns. In Experiment2 we observed significant serial position effects for both accuracyand RT: accuracy, F(3, 84) � 23.5, p � .001; RT, F(3, 84) � 8.0,p � .001. In Experiment 3 we also observed reliable serial positioneffects for both accuracy and RT: accuracy, F(2, 53) � 16.9, p �.001; RT, F(2, 53) � 35.6, p � .001. For these analyses of variancewe considered the longest list length in each of the experiments,which was list length 4 in Experiment 2 and list length 3 in
Thi
sdo
cum
ent
isco
pyri
ghte
dby
the
Am
eric
anPs
ycho
logi
cal
Ass
ocia
tion
oron
eof
itsal
lied
publ
ishe
rs.
Thi
sar
ticle
isin
tend
edso
lely
for
the
pers
onal
use
ofth
ein
divi
dual
user
and
isno
tto
bedi
ssem
inat
edbr
oadl
y.
415OSCILLATORY CORRELATES OF SUMMED SIMILARITY

Experiments 1 and 3. Similar results were observed for list length3 in Experiment 2.
Proactive interference effects. We next examined whetherrecently studied lures (i.e., lures that were members of recent priorlists) were more likely to be endorsed as targets. Although we didnot observe a significant effect of our proactive interference ma-nipulation in Experiment 1, we did observe clear proactive inter-ference effects in both Experiment 2 and Experiment 3. In Exper-iment 2, both RT and accuracy showed a significant proactiveinterference effect. We quantified this proactive interference effectseparately for each participant by regressing his or her accuracy onlist lag (where a list lag of 1 corresponds to high proactiveinterference and a list lag of 3 corresponds to low proactiveinterference). The mean slope of this regression (0.028) was sig-nificantly larger than zero, t(28) � 3.31, p � .001. The mean slopeof RT (�27.7 ms) exhibited an analogous effect, t(28) � �3.72,p � .001. In Experiment 3, we found a significant proactiveinterference effect for accuracy; the mean slope of accuracy on thelist lag of lures was 0.063, t(17) � 8.5, p � .001, but there was noeffect of lure lag on RT (mean slope � 0.59 ms), t(17) � 0.14, ns.
Application of summed-similarity model. We hypothesizedthat the basic computation underlying short-term item recognitionis the summed pairwise similarity between an item’s memorialrepresentation and the representation of the test probe (Kahana &Sekuler, 2002; Nosofsky et al., 2011). If stimuli are randomlyselected from a multidimensional space, the summed similarity ofa target to the contents of memory will typically exceed thesummed similarity for a lure. Kahana and Sekuler (2002) extendedthe basic summed-similarity framework for item recognition(Hintzman, 1988; Nosofsky, 1991) by showing that the degree ofsummed similarity required to respond yes varies with list homo-geneity (i.e., the mean similarity among list items). With greaterlist homogeneity, participants will respond yes at lower levels ofsummed similarity (Kahana, Zhou, Geller, & Sekuler, 2007;Nosofsky & Kantner, 2006; Visscher, Kaplan, Kahana, & Sekuler,2007). Specifically, according to Kahana and Sekuler’s noisyexemplar model (NEMo), participants respond yes when the sim-ilarity signal (S) defined as
S � �i�1
LL
�ie���si�p� �
2�
LL�LL � 1� �i�1
LL�1
�j�i�1
LL
e���si�sj� (1)
exceeds a decision threshold cLL (the subscript LL indicates thereis a separate optimal decision criterion for every list length). InEquation 1, LL is list length, �i is a forgetting parameter, �determines the form of the exponential generalization gradient(Shepard, 1987), si is the vector representing the coordinates of thememorial representation of stimulus i as determined by a priorMDS study, p is the representation of the probe item, and determines the influence of list homogeneity (bold typeface indi-cates vectors). A Gaussian random variable with mean zero andstandard deviation is added to each item’s memorial represen-tation to simulate the variability in participants’ responses acrossdifferent occurrences of the same item.
Our implementation is a reduced form version of previousversions of NEMo insofar as we assume that does not varyacross stimulus dimensions and that each dimension is weightedequally in the similarity computation. We also assume that thedecision threshold is chosen to yield the maximum likelihood of
the simulated data. Although NEMo does not offer a processaccount of primacy or recency effects, the set of parameters�i (i � 1 indicating the most recently studied item) allows themodel to differentially weight items from different serial positions,thereby matching any forgetting or primacy effects that may bepresent in the data (see also Nosofsky et al., 2011).
Although most previous applications of summed-similarity the-ory have involved fitting group data, we chose to fit the modelseparately to each individual’s behavioral data. In this way our aimof examining the neural correlates of summed similarity would notbe subject to model misspecification at the level of individualparticipants. This approach enabled us to examine the relationbetween brain activity and summed similarity at the individualsubject level and then to aggregate those tests across participants.
Estimates of the best fitting parameters we obtained (see Table1) are similar across the three experiments and also similar to thosereported in previous applications of NEMo (Kahana & Sekuler,2002; Kahana et al., 2007; Nosofsky & Kantner, 2006; Visscher etal., 2007; Yotsumoto, Kahana, Wilson, & Sekuler, 2007). Notsurprisingly, the alpha parameters mirror the serial position effectsin the data, with a large recency effect and a small primacy effectacross studies. The list homogeneity parameter, , was negative inall studies and significantly negative in Experiments 2 and 3,which had the most statistical power, t(28) � �2.295, p � .05 andt(17) � �5.58, p � .01 for Experiments 2 and 3, respectively. Thisindicates that in general, list homogeneity decreases the decisionthreshold for responding yes.
The central tenet of summed-similarity theory is that the prob-ability of responding yes to lures and to targets should increasewith summed similarity. Figure 2 shows this effect in each of thethree experiments. In all of the experiments, the false alarm ratereliably increased with summed similarity: Experiment 1: M �4.75, t(15) � 4.06, p � .01; Experiment 2: M � 6.15, t(28) � 7.94,p � .001; Experiment 3: M � 6.56, t(17) � 6.23, p � .001. Fortargets, the effect was generally smaller, but nonetheless the hitrate was statistically significant in both Experiment 1, M � 2.32,t(15) � 3.22, p � .01, and Experiment 3, M � 1.66, t(17) � 4.72,p � .001.
Electrophysiological results. To avoid contaminating anyobserved interference-based effects with effects caused by differ-ences in accuracy, we restricted our analyses to correct trials. Forlure trials, where proactive interference was explicitly manipu-
Table 1Best Fitting Parameter Values for NEMo’s Fit to BehavioralData in Experiments 1–3
Parameter
Experiment 1 Experiment 2 Experiment 3
M SEM M SEM M SEM
�0.31 0.52 �1.06 0.46 �1.68 0.30� 1.32 0.17 1.65 0.12 1.89 0.16 1.21 0.084 0.99 0.061 0.82 0.048�2 0.58 0.041 0.76 0.038 0.71 0.032�3 0.67 0.051 0.65 0.042 0.81 0.033�4 0.72 0.038RMSD 0.047 0.0026 0.021 0.0022 0.0811 0.0040
Note. NEMo � noisy exemplar model; RMSD � root-mean-squaredeviation; SEM � standard error of the mean.
Thi
sdo
cum
ent
isco
pyri
ghte
dby
the
Am
eric
anPs
ycho
logi
cal
Ass
ocia
tion
oron
eof
itsal
lied
publ
ishe
rs.
Thi
sar
ticle
isin
tend
edso
lely
for
the
pers
onal
use
ofth
ein
divi
dual
user
and
isno
tto
bedi
ssem
inat
edbr
oadl
y.
416 VAN VUGT, SEKULER, WILSON, AND KAHANA

lated, we regressed oscillatory power at each electrode on summedsimilarity, lure recency (a measure of proactive interference), andRT. For target trials, where proactive interference was not manip-ulated, we regressed oscillatory power on summed similarity,target item recency, and RT. We fit the regression models (seeMethod) to each individual’s data, using the NEMo fits to deter-mine the value of S on each trial. We then asked whether thedistribution of regression coefficients across participants deviatedsignificantly from zero and whether this difference was modulatedby time interval (first half vs. last half of retrieval period), fre-quency range (low vs. high), or both. On the basis of previousstudies of the target-lure effect (e.g., Düzel et al., 2005; Jacobs etal., 2006), we expected to find a neural correlate of summedsimilarity in the lower frequency bands (particularly delta andtheta).
For our ECoG and depth electrode recordings in Experiment 1,we computed an average regression coefficient for every partici-pant across all the electrodes in a set of five predefined regions(see Table 2). Statistical significance was determined using ap-value threshold set by a false discovery rate (FDR) procedure(Benjamini & Hochberg, 1995). A FDR of 0.05, as used here,means that one expects to find 5% of the effects deemed signifi-cant to be false positives. In our study, a FDR of 0.05 correspondedto a conventional p-value threshold of .011.
We would expect an oscillatory correlate of summed simi-larity to be present for both targets and lures. Whereas a main
effect of summed similarity, S, would suggest a broadbandpower modulation, an interaction between S and F (low- vs.high-frequency bands) would lend support to a frequency-specific oscillatory correlate. Given prior findings of delta andtheta band activity correlating with target-lure status and ofgamma-band activity correlating with memory load, we hypoth-esized that an oscillatory correlate of summed similarity wouldappear as an interaction between S and F or as a three-wayinteraction between S, F, and T (time epoch: early vs. lateportion of the retrieval period).
For lures, we found reliable (p � .011) neural correlates of S inall five ROIs; however, only the temporal cortex and medialtemporal lobe (MTL) exhibited reliable effects for both targets and
0.04 0.06 0.08 0.1 0.12 0.14 0.160
0.2
0.4
0.6
0.8
1
Summed Similarity
P(Y
ES
)
TargetLure
0.04 0.06 0.08 0.1 0.120
0.2
0.4
0.6
0.8
1
Summed Similarity
P(Y
ES
)
TargetLure
(a) Experiment 1 (b) Experiment 2
(c) Experiment 3
0 0.05 0.10
0.2
0.4
0.6
0.8
1
Summed Similarity
P(Y
ES
)
TargetLure
Figure 2. Summed-similarity effect. The probability (P) of saying yes is shown as a function of binned summedsimilarity (defined in Equation 1) for both targets (open circles) and lures (filled circles). Bins are defined as thelowest and highest 50% of the summed-similarity distribution. Error bars reflect Loftus–Masson corrected 95%confidence intervals. The fits for Experiment 1 are based on summed similarity for list length 3 only to makeit comparable to the fits for Experiment 2, in which there were only list length 3 trials.
Table 2Numbers of Patients and Electrodes in Each of Five AnatomicalRegions of Interest
Region of interest Brodmann areasNo.
patientsNo.
electrodes
Dorsolateral prefrontalcortex 9, 10, 46 9 95
Temporal cortex 20, 21, 22 16 413Medial temporal lobe 28, 35, 36 14 126Hippocampus 6 32Parietal cortex 1, 2, 3, 5, 7, 39, 40 13 126
Thi
sdo
cum
ent
isco
pyri
ghte
dby
the
Am
eric
anPs
ycho
logi
cal
Ass
ocia
tion
oron
eof
itsal
lied
publ
ishe
rs.
Thi
sar
ticle
isin
tend
edso
lely
for
the
pers
onal
use
ofth
ein
divi
dual
user
and
isno
tto
bedi
ssem
inat
edbr
oadl
y.
417OSCILLATORY CORRELATES OF SUMMED SIMILARITY

lures, and in both of those ROIs we found significant interactionsbetween S and F. In temporal cortex we observed a significant S �F interaction for both targets and lures; in MTL we observed asignificant S � F � T interaction for both targets and lures (see thecomplete table in Appendix B). To further explore these interac-tions, we examined whether regression betas showed a monotonicincrease or decrease with S across both target and lure trials. Thefrequency bands that show such monotonic increases or decreasesare shown in Table 3.
In temporal cortex, lower frequency oscillatory power (4–14Hz) decreases with S and higher frequency oscillatory power(24–90 Hz) increases with S for both targets and lures. In theMTL, 4–9 Hz theta and 28–128 Hz gamma power increase with Sin the early epoch, but the low-frequency effect switches sign inthe late time bin (second half of the retrieval interval), resulting ina three-way interaction between S, F, and T. Figure 3 shows thatin temporal cortex, theta power decreases with summed similarityand gamma power increases in the late epoch (this change indirection of the relation produces the significant interaction term).In MTL, both theta and gamma power increase with summedsimilarity but do so in the early epoch. The 2–4 Hz delta band doesnot show a consistent increase or decrease with summed similarityacross target and lure trials.
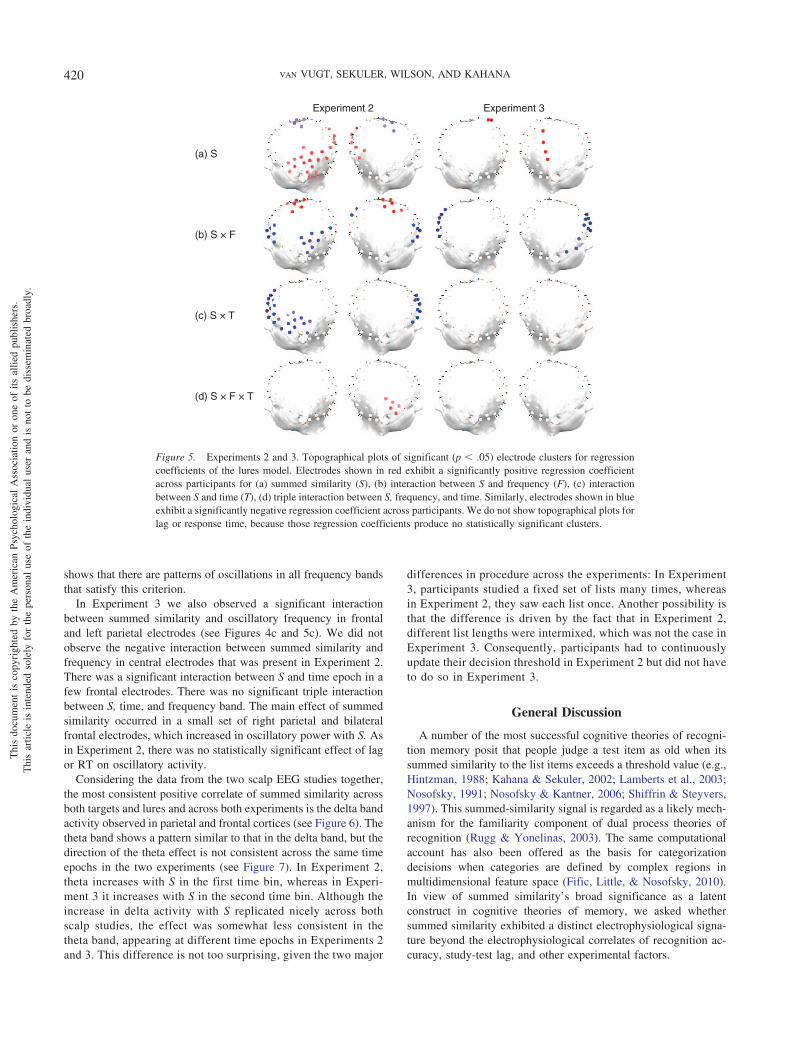
Results from our scalp EEG studies (Experiments 2 and 3) areshown in Figures 4 and 5. These figures summarize the regressionresults for the targets model and the lures model, respectively. Thefirst row of each figure shows clusters of electrodes (see Method)that exhibit significant oscillatory correlates of S that are notmodulated by frequency band, retrieval epoch (early vs. late), oritem recency. The subsequent rows of topographical plots showclusters of electrodes that exhibit significant interactions betweenS and frequency range F (low vs. high); between S and time epoch(T); and between S, frequency range, and time window. Red-shaded clusters indicate significantly positive regression coeffi-
cients, and blue-shaded clusters indicate significantly negativeregression coefficients.
The most consistent effect across the two scalp EEG studies andthe targets and lures models was the finding of clusters of primar-ily frontal but also left parietal electrodes that exhibited a signif-icant interaction between summed similarity and frequency range(see Figures 4 and 5). In electrodes for which this interaction wassignificant, the oscillatory summed-similarity effect differed be-tween lower frequencies (delta, theta, and alpha) and higher fre-quencies (beta and gamma). Blue electrodes indicate that thesummed-similarity effect was more positive for the lower fre-quency bands; red electrodes indicate the opposite. Whereas inboth experiments we observed similar clusters that exhibited astronger summed-similarity effect for the lower frequency bands,in Experiment 2 we also observed a cluster of central electrodesthat exhibited a summed-similarity effect that was more positivefor high frequencies. In Experiment 2 we further observed clustersof significant electrodes that exhibited significant modulation ofbroadband power with summed similarity.
In Experiment 2, a set of frontal electrodes also showed aninteraction between S and time epoch (see Figure 5c), indicatingthat the summed-similarity effect varied between the early and lateepoch (i.e., first half vs. second half of the retrieval period). In thiscondition, frontal electrodes exhibited a more positive summed-similarity effect for the early than for the late epoch. There was asmall group of right parietal electrodes for lures that exhibited atriple interaction between S, frequency, and time (see Figures 4dand 5d). The interaction between S and frequency band in theseelectrodes indicates that the frequency-specific summed-similarityeffect changes over the course of the trial. There was no significanteffect of lag or RT on oscillatory activity during retrieval.
To further examine the frequency specificity of the summed-similarity effect, we computed normalized oscillatory power in theROI defined by the summed similarity-by-frequency interaction in
Table 3Sign of Slope of Oscillatory Power on Similarity Bins, Grouped by ROI and Time Bin
Epochand ROI
Frequency band
Delta (2–4 Hz) Theta (4–9 Hz) Alpha (9–14 Hz) Beta (14–28 Hz)Low-gamma(28–48 Hz)
Mid-gamma(48–90 Hz)
High-gamma(90–128 Hz)
Experiment 1Early
TC 0 0 � � � 0 �MTL 0 � 0 0 0 � �
LateTC 0 � � 0 � � �MTL 0 0 0 0 0 � �
Experiment 2 (and Experiment 3)
EarlyFrontal 0 (0) � (0) � (0) 0 (0) � (0) � (0) 0 (0)Parietal � (�) 0 (0) � (0) � (0) � (0) 0 (0) � (0)
LateFrontal 0 (0) � (�) � (0) 0 (0) 0 (0) 0 (0) 0 (0)Parietal � (0) 0 (�) � (0) � (0) � (0) 0 (0) 0 (0)
Note. ROIs for Experiment 1 are based on Table 1; ROIs for Experiments 2 and 3 are based on Figures 4b and 5b. In the lower half of the table, the firstsymbol refers to Experiment 2, and the second symbol refers to Experiment 3. A plus sign denotes a positive slope for both targets and lures. A minus signdenotes a negative slope for both targets and lures. Boldface indicates frequency bands that have consistent slopes between targets and lures in bothexperiments. 0 � no consistent slopes between targets and lures; ROI � region of interest; TC � temporal cortex; MTL � medial temporal lobe.
Thi
sdo
cum
ent
isco
pyri
ghte
dby
the
Am
eric
anPs
ycho
logi
cal
Ass
ocia
tion
oron
eof
itsal
lied
publ
ishe
rs.
Thi
sar
ticle
isin
tend
edso
lely
for
the
pers
onal
use
ofth
ein
divi
dual
user
and
isno
tto
bedi
ssem
inat
edbr
oadl
y.
418 VAN VUGT, SEKULER, WILSON, AND KAHANA

Figure 5b. The ROIs were kept the same between Experiments 2and 3 by taking the intersection of electrodes that were significantfor both experiments. We then examined which of the frequencybands (2–4 Hz delta, 4–9 Hz theta, 9–14 Hz alpha, 14–28 Hz beta,28–48 Hz low gamma, 48–90 Hz mid gamma, and 90–128 Hzhigh gamma) displayed the pattern of regression slopes expected
of a neural correlate of summed similarity. A neural correlate ofsummed similarity should show a correlation with summed simi-larity in the same direction for targets and lures. Because we fit ourregression model separately for targets and lures, a significantsummed similarity-by-frequency band interaction in the regressionmodel does not guarantee that this condition is satisfied. Table 3
(a) Medial Temporal Lobe (early)
0.04 0.06 0.08 0.1 0.12 0.14 0.16
−0.06
−0.04
−0.02
0
0.02
0.04
0.06
Summed Similarity
Nor
mal
ized
Pow
er
0.04 0.06 0.08 0.1 0.12 0.14 0.16
−0.06
−0.04
−0.02
0
0.02
0.04
0.06
Summed Similarity
Nor
mal
ized
Pow
er
thetamid-gamma
TargetLure
(b) Temporal Cortex (late)
Figure 3. Experiment 1. Average normalized oscillatory power as a function of summed-similarity bin isshown (a) in the early time bin in the medial temporal lobe and (b) in the late time bin in temporal cortex. Inthe medial temporal lobe, both 4–9 Hz theta and 48–90 Hz gamma power increase with summed similarity. Intemporal cortex, theta decreases whereas gamma increases with summed similarity. Error bars reflect standarderror of the mean.
(a) S
(b) S × F
(c) S × T
(d) S × F × T
3 tnemirepxE2 tnemirepxE
Figure 4. Experiments 2 and 3. Topographical plots of significant (p � .05) electrode clusters for regressioncoefficients of the targets model. Electrodes shown in red exhibit a significantly positive regression coefficientacross participants for (a) summed similarity (S), (b) interaction between S and frequency (F), (c) interactionbetween S and time (T), (d) triple interaction between S, frequency, and time. Similarly, electrodes shown in blueexhibit a significantly negative regression coefficient across participants. We do not show topographical plots forlag or response time, because those regression coefficients produce no statistically significant clusters.
Thi
sdo
cum
ent
isco
pyri
ghte
dby
the
Am
eric
anPs
ycho
logi
cal
Ass
ocia
tion
oron
eof
itsal
lied
publ
ishe
rs.
Thi
sar
ticle
isin
tend
edso
lely
for
the
pers
onal
use
ofth
ein
divi
dual
user
and
isno
tto
bedi
ssem
inat
edbr
oadl
y.
419OSCILLATORY CORRELATES OF SUMMED SIMILARITY
shows that there are patterns of oscillations in all frequency bandsthat satisfy this criterion.
In Experiment 3 we also observed a significant interactionbetween summed similarity and oscillatory frequency in frontaland left parietal electrodes (see Figures 4c and 5c). We did notobserve the negative interaction between summed similarity andfrequency in central electrodes that was present in Experiment 2.There was a significant interaction between S and time epoch in afew frontal electrodes. There was no significant triple interactionbetween S, time, and frequency band. The main effect of summedsimilarity occurred in a small set of right parietal and bilateralfrontal electrodes, which increased in oscillatory power with S. Asin Experiment 2, there was no statistically significant effect of lagor RT on oscillatory activity.
Considering the data from the two scalp EEG studies together,the most consistent positive correlate of summed similarity acrossboth targets and lures and across both experiments is the delta bandactivity observed in parietal and frontal cortices (see Figure 6). Thetheta band shows a pattern similar to that in the delta band, but thedirection of the theta effect is not consistent across the same timeepochs in the two experiments (see Figure 7). In Experiment 2,theta increases with S in the first time bin, whereas in Experi-ment 3 it increases with S in the second time bin. Although theincrease in delta activity with S replicated nicely across bothscalp studies, the effect was somewhat less consistent in thetheta band, appearing at different time epochs in Experiments 2and 3. This difference is not too surprising, given the two major
differences in procedure across the experiments: In Experiment3, participants studied a fixed set of lists many times, whereasin Experiment 2, they saw each list once. Another possibility isthat the difference is driven by the fact that in Experiment 2,different list lengths were intermixed, which was not the case inExperiment 3. Consequently, participants had to continuouslyupdate their decision threshold in Experiment 2 but did not haveto do so in Experiment 3.
General Discussion
A number of the most successful cognitive theories of recogni-tion memory posit that people judge a test item as old when itssummed similarity to the list items exceeds a threshold value (e.g.,Hintzman, 1988; Kahana & Sekuler, 2002; Lamberts et al., 2003;Nosofsky, 1991; Nosofsky & Kantner, 2006; Shiffrin & Steyvers,1997). This summed-similarity signal is regarded as a likely mech-anism for the familiarity component of dual process theories ofrecognition (Rugg & Yonelinas, 2003). The same computationalaccount has also been offered as the basis for categorizationdecisions when categories are defined by complex regions inmultidimensional feature space (Fific, Little, & Nosofsky, 2010).In view of summed similarity’s broad significance as a latentconstruct in cognitive theories of memory, we asked whethersummed similarity exhibited a distinct electrophysiological signa-ture beyond the electrophysiological correlates of recognition ac-curacy, study-test lag, and other experimental factors.
(a) S
(b) S × F
(c) S × T
(d) S × F × T
3tnemirepxE2tnemirepxE
Figure 5. Experiments 2 and 3. Topographical plots of significant (p � .05) electrode clusters for regressioncoefficients of the lures model. Electrodes shown in red exhibit a significantly positive regression coefficientacross participants for (a) summed similarity (S), (b) interaction between S and frequency (F), (c) interactionbetween S and time (T), (d) triple interaction between S, frequency, and time. Similarly, electrodes shown in blueexhibit a significantly negative regression coefficient across participants. We do not show topographical plots forlag or response time, because those regression coefficients produce no statistically significant clusters.
Thi
sdo
cum
ent
isco
pyri
ghte
dby
the
Am
eric
anPs
ycho
logi
cal
Ass
ocia
tion
oron
eof
itsal
lied
publ
ishe
rs.
Thi
sar
ticle
isin
tend
edso
lely
for
the
pers
onal
use
ofth
ein
divi
dual
user
and
isno
tto
bedi
ssem
inat
edbr
oadl
y.
420 VAN VUGT, SEKULER, WILSON, AND KAHANA

Across three experiments we found that brain oscillationsmeasured using depth electrodes and cortical surface electrodesin temporal cortex and the medial temporal lobe (Experiment 1)and measured at the scalp (Experiments 2 and 3) are reliablymodulated by summed similarity both for targets and for lures.In particular, we found that lower frequency oscillations, in thedelta and theta bands, increased with summed similarity forboth targets and lures in the medial temporal lobe (Experiment
1) and in clusters of parietal and frontal electrodes (Experi-ments 2 and 3). Although the general trend is present in all threestudies, there were also differences between the experiments:Summed similarity correlated with theta band oscillations in themedial temporal lobe, whereas in the scalp recordings the effectwas found in the delta band. Between the two scalp experi-ments, which varied in the list lengths used and the degree ofpractice that participants had, we observed the summed-
(a) Experiment 2 (b) Experiment 3
0.04 0.06 0.08 0.1 0.12−0.03
−0.02
−0.01
0
0.01
0.02
0.03
Summed Similarity
Nor
mal
ized
Pow
er
TargetLure
0 0.05 0.1−0.03
−0.02
−0.01
0
0.01
0.02
0.03
Summed Similarity
Nor
mal
ized
Pow
er
TargetLure
Figure 6. Neural summed-similarity effect for Experiments 2 and 3. Normalized oscillatory power shown asa function of binned summed similarity (defined in Equation 1) for both targets (dashed lines) and lures (solidlines). Bins are defined as the lowest and highest 50% of the summed-similarity distribution. Power is averagedover all frequencies in the 2–4 Hz delta band and in the channels within the frontal region of interest (see Figures4b and 5b) in the first half of the trial. Error bars reflect standard error of the mean.
(a) Experiment 2 (b) Experiment 3
Early
Late
0.04 0.06 0.08 0.1 0.12−0.03
−0.02
−0.01
0
0.01
0.02
0.03
Summed Similarity
Nor
mal
ized
Pow
er
TargetLure
0 0.05 0.1−0.03
−0.02
−0.01
0
0.01
0.02
0.03
Summed Similarity
Nor
mal
ized
Pow
er
TargetLure
0 0.05 0.1−0.03
−0.02
−0.01
0
0.01
0.02
0.03
Summed Similarity
Nor
mal
ized
Pow
er
TargetLure
0.04 0.06 0.08 0.1 0.12−0.03
−0.02
−0.01
0
0.01
0.02
0.03
Summed Similarity
Nor
mal
ized
Pow
er
TargetLure
Figure 7. Neural summed-similarity effect in the 4–9 Hz theta band for Experiments 2 and 3. Normalizedoscillatory power as a function of binned summed similarity (defined in Equation 1) for both targets (dashedlines) and lures (solid lines). Bins are defined as the lowest and highest 50% of the summed-similaritydistribution. Power is averaged over all frequencies in the 4–9 Hz theta band and in the channels within theparietal region of interest (see Figures 4b and 5b), separately for the first half of the trials (Early) and the secondhalf of the trials (Late). Error bars reflect standard error of the mean.
Thi
sdo
cum
ent
isco
pyri
ghte
dby
the
Am
eric
anPs
ycho
logi
cal
Ass
ocia
tion
oron
eof
itsal
lied
publ
ishe
rs.
Thi
sar
ticle
isin
tend
edso
lely
for
the
pers
onal
use
ofth
ein
divi
dual
user
and
isno
tto
bedi
ssem
inat
edbr
oadl
y.
421OSCILLATORY CORRELATES OF SUMMED SIMILARITY

similarity correlate in the theta band earlier in the retrievalperiod in Experiment 2 and later in Experiment 3.
Although the prior literature suggests that theta oscillations area stronger correlate of target-lure status than are delta oscillations,the strongest effects in the literature have often been observed ataround 4 Hz, which is right at the boundary between the traditionaltheta and delta frequency bands. In addition, several studies haveobserved that delta and theta oscillations are similarly modulatedduring cognitive tasks (e.g., Jacobs et al., 2006; Lega, Jacobs, &Kahana, 2012; Mormann et al., 2005).
Related to the present work, several recent studies have begun tolook at the neural correlates of similarity itself. For example,Loffler et al. (2005) showed that in the fusiform face area, thefMRI BOLD signal responds to changes in structural distancebetween a mean face and a face further away in the face space.Similarly, Aguirre showed that distance in similarity space wasassociated with the magnitude of fMRI adaptation in the fusiformface area (Aguirre, 2007). As such, they observed a neural simi-larity matrix that was correlated with the similarity matrix derivedfrom the stimulus structure. Similarly, Kriegeskorte et al. (2008)demonstrated the existence of neural similarity matrices of a widerange of objects and faces in area IT (inferior temporal cortex), inboth BOLD signal and single-unit activity. For verbal stimuli,Manning, Sperling, Sharan, Rosenberg, and Kahana (2012)showed that predominantly low-frequency oscillations across thecortex varied with their semantic similarity distances. Movingfrom perception to memory, Yago and Ishai (2006) compared theBOLD response in an item recognition task to probes that were thesame as, ambiguous, similar to, or dissimilar to a studied prototypeimage (painting). They found an increase in BOLD activity withthe level of similarity between probe and study item in the bilateralinferior parietal sulcus and superior parietal lobe. In addition, theyfound a decrease of BOLD activation with probe-item similarity inthe superior frontal gyrus and precuneus.
A key assumption in summed-similarity theories of item recog-nition is that participants use all items in the contextually definedmemory set to help distinguish between targets and lures. Thisassumption leads to the prediction that participants are more likelyto endorse a target or a lure when there are other similar itemsstored in memory. However, summed-similarity theory also as-sumes a nonlinear (exponential) function relating similarity todistance in psychological space. The rate at which similarity de-cays with distance is a parameter of the model, and for thedecay-rate parameters estimated in most studies, the actual contri-bution of most items to the summed-similarity computation will benegligible. This means that in practice a summed-similarity modelwill give most weight to items that are very similar to the target orlure and that less similar list items contribute minimally to thesummed-similarity calculation. Because of this nonlinearity, itwould require considerable statistical power to distinguish asummed-similarity model from a model that uses only the simi-larity of the most similar lure or target. Prior studies that havecarefully explored this issue have shown that the summed-similarity models do in fact provide a better quantitative fit tobehavioral data on item recognition than models considering onlythe most similar list item (e.g., Huang, Kahana, & Sekuler, 2012;Kahana et al., 2007).
Our study provides neural evidence for the summed-similaritycomputation hypothesized to underlie recognition memory and
category learning (Brown, Neath, & Chater, 2007; Hintzman,1988; Kahana & Sekuler, 2002; Lamberts et al., 2003; Nosofsky,1991). Similarity-based interference is reflected in frontal andparietal delta and theta oscillations measured in scalp EEG and intheta oscillations recorded from depth electrodes in the humanmedial temporal lobe. Given that previous studies have foundsimilar neural correlates for old–new item recognition and catego-rization (Nosofsky, Little, & James, 2012), we would expect tofind similar oscillatory correlates of summed similarity in catego-rization tasks.
References
Aguirre, G. K. (2007). Continuous carry-over designs for fMRI. Neuro-Image, 35, 1480–1494. doi:10.1016/j.neuroimage.2007.02.005
Benjamini, Y., & Hochberg, Y. (1995). Controlling the false discoveryrate: A practical and powerful approach to multiple testing. Journal ofthe Royal Statistical Society: Series B (Methodological), 57, 289–300.
Brown, G. D. A., Neath, I., & Chater, N. (2007). A temporal ratio modelof memory. Psychological Review, 114, 539–576. doi:10.1037/0033-295X.114.3.539
Düzel, E., Neufang, M., & Heinze, H. J. (2005). The oscillatory dynamicsof recognition memory and its relationship to event-related responses.Cerebral Cortex, 15, 1992–2002. doi:10.1093/cercor/bhi074
Fific, M., Little, D. R., & Nosofsky, R. M. (2010). Logical-rule models ofclassification response times: A synthesis of mental-architecture,random-walk, and decision-bound approaches. Psychological Review,117, 309–348. doi:10.1037/a0018526
Geller, A. S., Schleifer, I. K., Sederberg, P. B., Jacobs, J., & Kahana, M. J.(2007). PyEPL: A cross-platform experiment-programming library. Be-havior Research Methods, 39, 950–958. doi:10.3758/BF03192990
Guderian, S., & Düzel, E. (2005). Induced theta oscillations mediatelarge-scale synchrony with mediotemporal areas during recollection inhumans. Hippocampus, 15, 901–912. doi:10.1002/hipo.20125
Harris, A., & Aguirre, G. K. (2010). Neural tuning for face wholes andparts in human fusiform gyrus revealed by fMRI adaptation. Journal ofNeurophysiology, 104, 336–345. doi:10.1152/jn.00626.2009
Heiser, W. J., & Bennani, M. (1997). Triadic distance models: Axiomati-zation and least squares representation. Journal of Mathematical Psy-chology, 41, 189–206. doi:10.1006/jmps.1997.1166
Hintzman, D. L. (1988). Judgments of frequency and recognition memoryin multiple-trace memory model. Psychological Review, 95, 528–551.doi:10.1037/0033-295X.95.4.528
Howard, M. W., Rizzuto, D. S., Caplan, J. C., Madsen, J. R., Lisman, J.,Aschenbrenner-Scheibe, R., . . . Kahana, M. J. (2003). Gamma oscilla-tions correlate with working memory load in humans. Cerebral Cortex,13, 1369–1374. doi:10.1093/cercor/bhg084
Huang, J., Kahana, M. J., & Sekuler, R. (2012). Similarity effects inname–face recognition: A dual-process, summed-similarity account.Manuscript submitted for publication.
Jacobs, J., Hwang, G., Curran, T., & Kahana, M. J. (2006). EEG oscilla-tions and recognition memory: Theta correlates of memory retrieval anddecision making. NeuroImage, 32, 978–987. doi:10.1016/j.neuroimage.2006.02.018
Jacobs, J., & Kahana, M. J. (2010). Direct brain recordings fuel advancesin cognitive electrophysiology. Trends in Cognitive Sciences, 14, 162–171. doi:10.1016/j.tics.2010.01.005
Kahana, M. J. (2012). Foundations of human memory. New York, NY:Oxford University Press.
Kahana, M. J., & Bennett, P. J. (1994). Classification and perceivedsimilarity of compound gratings that differ in relative spatial phase.Perception & Psychophysics, 55, 642–656. doi:10.3758/BF03211679
Thi
sdo
cum
ent
isco
pyri
ghte
dby
the
Am
eric
anPs
ycho
logi
cal
Ass
ocia
tion
oron
eof
itsal
lied
publ
ishe
rs.
Thi
sar
ticle
isin
tend
edso
lely
for
the
pers
onal
use
ofth
ein
divi
dual
user
and
isno
tto
bedi
ssem
inat
edbr
oadl
y.
422 VAN VUGT, SEKULER, WILSON, AND KAHANA

Kahana, M. J., & Sekuler, R. (2002). Recognizing spatial patterns: A noisyexemplar approach. Vision Research, 42, 2177–2192. doi:10.1016/S0042-6989(02)00118-9
Kahana, M. J., Zhou, F., Geller, A. S., & Sekuler, R. (2007). Lure-similarity affects visual episodic recognition: Detailed tests of a noisyexamplar model. Memory & Cognition, 35, 1222–1232. doi:10.3758/BF03193596
Kriegeskorte, N., Mur, M., Ruff, D. A., Kiani, R., Bodurka, J., Esteky, H.,. . . Bandettini, P. A. (2008). Matching categorical object representationsin inferior temporal cortex of man and monkey. Neuron, 60, 1126–1141.doi:10.1016/j.neuron.2008.10.043
Lamberts, K., Brockdorff, N., & Heit, E. (2003). Feature-sampling andrandom-walk models of individual-stimulus recognition. Journal of Ex-perimental Psychology: General, 132, 351–378. doi:10.1037/0096-3445.132.3.351
Lega, B. C., Jacobs, J., & Kahana, M. (2012). Human hippocampal thetaoscillations and the formation of episodic memories. Hippocampus, 22,748–761. doi:10.1002/hipo.20937
Loffler, G., Yourganov, G., Wilkinson, F., & Wilson, H. R. (2005). fMRIevidence for the neural representation of faces. Nature Neuroscience, 8,1386–1391. doi:10.1038/nn1538
Manning, J. R., Sperling, M. R., Sharan, A., Rosenberg, E. A., & Kahana,M. J. (2012). Spontaneously reactivated patterns in frontal and temporallobe predict semantic clustering during memory search. Journal ofNeuroscience, 32, 8871–8878.
Maris, E., & Oostenveld, R. (2007). Nonparametric statistical testing ofEEG- and MEG-data. Journal of Neuroscience Methods, 164, 177–190.doi:10.1016/j.jneumeth.2007.03.024
Monsell, S. (1978). Recency, immediate recognition memory, and reactiontime. Cognitive Psychology, 10, 465–501. doi:10.1016/0010-0285(78)90008-7
Mormann, F., Fell, J., Axmacher, N., Weber, B., Lehnertz, K., Elger, C., &Fernández, G. (2005). Phase/amplitude reset and theta–gamma interac-tion in the human medial temporal lobe during a continuous wordrecognition memory task. Hippocampus, 15, 890–900. doi:10.1002/hipo.20117
Nosofsky, R. M. (1991). Tests of an exemplar model for relating perceptualclassification and recognition memory. Journal of Experimental Psy-chology: Human Perception and Performance, 17, 3–27. doi:10.1037/0096-1523.17.1.3
Nosofsky, R. M., & Kantner, J. (2006). Exemplar similarity, study listhomogeneity, and short-term perceptual recognition. Memory & Cogni-tion, 34, 112–124. doi:10.3758/BF03193391
Nosofsky, R. M., Little, D. R., Donkin, C., & Fific, M. (2011). Short-termmemory scanning viewed as exemplar-based categorization. Psycholog-ical Review, 118, 280–315. doi:10.1037/a0022494
Nosofsky, R. M., Little, D. R., & James, T. W. (2012). Activation in theneural network responsible for categorization and recognition reflectsparameter changes. Proceedings of the National Academy of Sciences,USA, 109, 333–338. doi:10.1073/pnas.1111304109
Rugg, M. D., & Yonelinas, A. P. (2003). Human recognition memory: Acognitive neuroscience perspective. Trends in Cognitive Sciences, 7,313–319. doi:10.1016/S1364-6613(03)00131-1
Shepard, R. N. (1987, September 11). Toward a universal law of general-ization for psychological science. Science, 237, 1317–1323. doi:10.1126/science.3629243
Shiffrin, R. M., & Steyvers, M. (1997). A model for recognition memory:REM—Retrieving effectively from memory. Psychonomic Bulletin &Review, 4, 145–166. doi:10.3758/BF03209391
Takane, Y., Young, F. W., & de Leeuw, J. (1977). Nonmetric individualdifferences multidimensional scaling: An alternating least squaresmethod with optimal scaling features. Psychometrika, 42, 7–67. doi:10.1007/BF02293745
van Vugt, M. K., Schulze-Bonhage, A., Litt, B., Brandt, A., & Kahana,M. J. (2010). Hippocampal gamma oscillations increase with workingmemory load. Journal of Neuroscience, 30, 2694–2699. doi:10.1523/JNEUROSCI.0567-09.2010
van Vugt, M. K., Schulze-Bonhage, A., Sekuler, R., Litt, B., Brandt, A.,Baltuch, G., & Kahana, M. J. (2009). Intracranial electroencephalogra-phy reveals two distinct similarity effects during item recognition. BrainResearch, 1299, 33–44. doi:10.1016/j.brainres.2009.07.016
Visscher, K. M., Kaplan, E., Kahana, M. J., & Sekuler, R. (2007). Auditoryshort-term memory behaves like visual short-term memory. PLoS Biol-ogy, 5(3), e56. doi:10.1371/journal.pbio.0050056
Wilson, H. R., Loffler, G., & Wilkinson, F. (2002). Synthetic faces, facecubes, and the geometry of face space. Vision Research, 42, 2909–2923.doi:10.1016/S0042-6989(02)00362-0
Workman, W., & Adams, O. (1950). Suggestions for simplifying thecomputation of vincent curves. Journal of General Psychology, 43,147–151. doi:10.1080/00221309.1950.9710613
Yago, E., & Ishai, A. (2006). Recognition memory is modulated by visualsimilarity. NeuroImage, 31, 807–817. doi:10.1016/j.neuroimage.2005.12.014
Yotsumoto, Y., Kahana, M. J., Wilson, H. R., & Sekuler, R. (2007).Recognition memory for realistic synthetic faces. Memory & Cognition,35, 1233–1244. doi:10.3758/BF03193597
(Appendices follow)
Thi
sdo
cum
ent
isco
pyri
ghte
dby
the
Am
eric
anPs
ycho
logi
cal
Ass
ocia
tion
oron
eof
itsal
lied
publ
ishe
rs.
Thi
sar
ticle
isin
tend
edso
lely
for
the
pers
onal
use
ofth
ein
divi
dual
user
and
isno
tto
bedi
ssem
inat
edbr
oadl
y.
423OSCILLATORY CORRELATES OF SUMMED SIMILARITY

Appendix A
Multidimensional Representation of Synthetic Faces
Faces were constructed from four orthogonal dimensions, asshown in Figure A1. Inspection of the figure and of the measure-ment vector that makes up each of the four theoretical dimensionsdemonstrates that the first orthogonal dimension correspondsmostly to head width and mouth height. The second orthogonaldimension corresponds mostly to a hairline parameter and lip
thickness. The third dimension is related to the curvature of thebottom of the face, and the fourth dimension reflects curvature ofthe hairline.
The empirically derived MDS coordinates for this face set areshown in Table A1. They map onto slightly different sets ofmeasurements. One of the reasons for this difference with the
dim 1
dim
2
1 2
3 4
9
11
10
12
5 6
7 8
13 14
15 16
Figure A1. Two-dimensional projection of the four-dimensional theoretical face space. Each face was con-structed by moving a fixed distance (distance-unit), equal to the 75% correct discrimination threshold (justnoticeable difference), in positive or negative directions away from the mean face. All possible permutations ofpositive and negative shifts for the four principal components of face space yielded a set of 16 faces. Eachquadrant shows four faces that have the same coordinates for dimension 1 and 2 but differ in their coordinatesfor dimensions 3 and 4. For example, the faces in the right bottom quadrant are constructed by a positivedistance-unit in the direction of dimension 1 and a negative distance-unit in the direction of dimension 2. Foreach of the four faces, the coordinates in the third and fourth dimension are different. The numbers below eachface correspond to those in Table A1. dim � dimension.
(Appendices continue)
Thi
sdo
cum
ent
isco
pyri
ghte
dby
the
Am
eric
anPs
ycho
logi
cal
Ass
ocia
tion
oron
eof
itsal
lied
publ
ishe
rs.
Thi
sar
ticle
isin
tend
edso
lely
for
the
pers
onal
use
ofth
ein
divi
dual
user
and
isno
tto
bedi
ssem
inat
edbr
oadl
y.
424 VAN VUGT, SEKULER, WILSON, AND KAHANA

theoretically derived coordinates is that the empirically derivedMDS coordinates were not Procrustes transformed. We chose notto Procrustes transform the empirically derived MDS coordinates,such that we would not alter the data. The first dimension correlateshighest with nose width, r(15) � .89, p � .001, and one of thecomponents of the head shape, r(15) � .88, p � .01. The seconddimension from the MDS study correlates highest with a hairlineparameter, r(15) � .89, p � .001, as well as eye separation, r(15) �.85, p � .001. The third dimension correlates highest with thicknessof the top lip, r(15) � 0.82, p � .001, as well as a component of headshape, r(15) � �.73, p � .01. Finally, MDS dimension four corre-lates most strongly with thickness of the top lip, r(15) � �.72, p �.01, and with head shape, r(15) � 0.70, p � .01.
This demonstrates that perception of these stimuli emphasizesspecific aspects of the synthetic face stimuli (hairline, head shape,and lips), which led us to use the empirically derived MDScoordinates in our summed-similarity analyses. This was furtherjustified by the fact that we found very similar attentional weightson these four dimensions (see Method).
Appendix B
Complete Overview of the Normalized Regression Betas for Experiment 1
Model
DLPFC TC MTL Hippocampus Parietal
Targets Lures Targets Lures Targets Lures Targets Lures Targets Lures
S 0.021 0.044 0.008 0.041* 0.011 0.044* 0.032 0.060 0.022 0.032RT �0.003 0.007 �0.009 �0.005 �0.015 0.002 �0.013* 0.014 �0.012 0.002S � F �0.018 0.044* �0.023* �0.049* �0.003 �0.023 �0.032 �0.040 �0.010 �0.025S � T �0.017 �0.060* �0.008 �0.044* �0.025* �0.068* �0.005 �0.038* �0.015 �0.060*
S � F � T 0.023 0.069* 0.007 0.041* 0.017* 0.055* 0.003 0.041 0.016 0.066*
Note. Rows are regression coefficients (S � summed similarity; F � frequency band; T � time bin (early vs. late portion of the retrieval period);RT � response time; � � interaction term). Columns are brain regions (DLPFC � dorsolateral prefrontal cortex; TC � temporal cortex; MTL � medialtemporal lobe). Models are T (targets model) and L (lures model). Boldface type denotes significant for both targets and lures. An asterisk denotessignificance with a 0.05 false discovery rate (corresponding to a p-value threshold of .011).
Received June 25, 2011Revision received April 17, 2012
Accepted June 22, 2012 �
Table A1Similarity Coordinates of the Face Stimuli Derived From theMDS Study
Face dim 1 dim 2 dim 3 dim 4
1 0.901 0.706 1.060 �1.0792 1.886 �0.683 �0.227 0.4983 1.128 0.942 0.022 �1.1374 1.284 �1.257 �0.231 0.8915 �0.075 1.511 �1.029 �0.4836 0.484 �0.390 �1.059 1.6907 0.384 1.504 �0.951 0.5528 0.268 �0.468 �0.106 2.1999 �0.723 0.215 1.953 0.039
10 �0.248 �1.602 0.534 �0.86011 �0.342 0.087 1.801 �0.78912 0.402 �1.269 �0.481 �1.39113 �1.298 1.292 0.925 0.16514 �1.249 �0.599 �1.242 �0.53215 �1.725 0.840 0.301 �0.44416 �1.079 �0.828 �1.271 0.682
Note. MDS � multidimensional scaling; dim � dimension.
Thi
sdo
cum
ent
isco
pyri
ghte
dby
the
Am
eric
anPs
ycho
logi
cal
Ass
ocia
tion
oron
eof
itsal
lied
publ
ishe
rs.
Thi
sar
ticle
isin
tend
edso
lely
for
the
pers
onal
use
ofth
ein
divi
dual
user
and
isno
tto
bedi
ssem
inat
edbr
oadl
y.
425OSCILLATORY CORRELATES OF SUMMED SIMILARITY