an efficient maximum power point tracking controller for photovoltaic systems using new boost
TRANSCRIPT


Fig. 1. Typical MPPT Controller
For an efficient MPPT controller, two considerations
can be made, firstly by developing an improved
algorithm for tracking the maximum power point (MPP)
of PV systems and secondly by designing an efficient
boost converter circuit which is an important component
in the controller[3,4]. Boost converter may cause
serious reverse-recovery problem and increase the rating
of all devices. As a result, the conversion efficiency is
degraded and may result in severe electromagnetic
interference problem under this situation [5]. To
overcome the severe reverse-recovery problem of high
voltage diodes, voltage-clamped technique is
manipulated in the converter design. However, this
technique causes voltage stress on the switches and
voltage gain is limited by the turn-on time of the
auxiliary switch [6, 7]. Another problem in boost
converter operation is the leakage energy of the storage
inductor which is generated by the turning off action of
the converter switches. It will result in a high-voltage
ripple across the switch due to the resonant phenomenon
induced by the leakage current. Therefore, to protect the
converter switching devices, two mitigating actions can
be taken, that is, by using a high voltage rating device
with a snubber circuit and by depleting the inductor
leakage energy. To increase the conversion efficiency of
a boost converter, a new boost converter circuit has
been designed by adding diodes and capacitors to the
conventional converter circuit to transmit and sink the
leakage energy of the inductor during transient
switching.
For any PV module, there is a unique point on the
current-voltage (I-V) and a power-voltage (P-V) curve,
called as the MPP, in which at this point the PV system
is said to operate at maximum efficiency and produces
its maximum power output. The location of the MPP is
not known but can be traced by using MPPT methods to
maintain the PV array’s operating point at its MPP. The
MPPT methods can be classified as direct and indirect
methods. The direct methods include those methods that
use PV voltage and/or current measurements. These
direct methods have the advantage of being independent
from the priori knowledge of the PV generator
characteristics. Thus, the operating point is independent
of isolation, temperature or degradation levels. The
direct methods include the techniques of differentiation,
feedback voltage, perturbation and observation [8],
incremental conductance, as well as fuzzy logic and
neural network. The indirect methods are based on the
use of a database of parameters that include data of
typical P-V curves of PV systems for different
irradiances and temperatures, or on the use of
mathematical functions obtained from empirical data to
estimate the MPP. In most cases, a prior evaluation of
the PV generator based on the mathematical relationship
obtained from empirical data is required. The methods
belong to this category include the use of curve fitting
[9, 10], look-up table, open-circuit and short circuit PV
voltages [1,11]. In this paper, an improved indirect
MPPT method is proposed by using the curve fitting
technique. The present work introduces a hardware
implementation of a microcontroller based MPPT
controller for a PV system by incorporating an efficient
DC-DC boost converter and an improved MPPT
algorithm. The new boost converter circuit can produce
smooth IGBT switching which consequently reduces the
switching losses and increases the conversion efficiency.
As for the proposed MPPT algorithm, it requires only
parameters such as ambient temperature and solar
radiation and therefore it makes measurement simpler
for a cost effective controller.
2. Proposed Boost Converter Design A boost converter is the front-end component of a
PV system connected between a PV array and a load. It
is basically a power converter with DC output voltage
greater than its input voltage. It is a class of switching-
mode power supply containing at least two
semiconductor switches, a diode and a transistor and at
least one energy storage element. Filters made of
capacitors in combination with inductors are normally
added to the output of the converter to reduce the output
voltage ripple [12]. An inherent problem in boost
converters is that it may cause serious reverse recovery
problem which may increase the rating of devices and
degrade the conversion. To increase the conversion
efficiency, an improvement is made in the boost
converter design. Fig.2. shows the proposed boost
converter design. The converter consists of an inductor
WSEAS TRANSACTIONS on POWER SYSTEMS Tamer T. N. Khatib, A. Mohamed, N. Amin, K. Sopian
ISSN: 1790-5060 54 Issue 2, Volume 5, April 2010
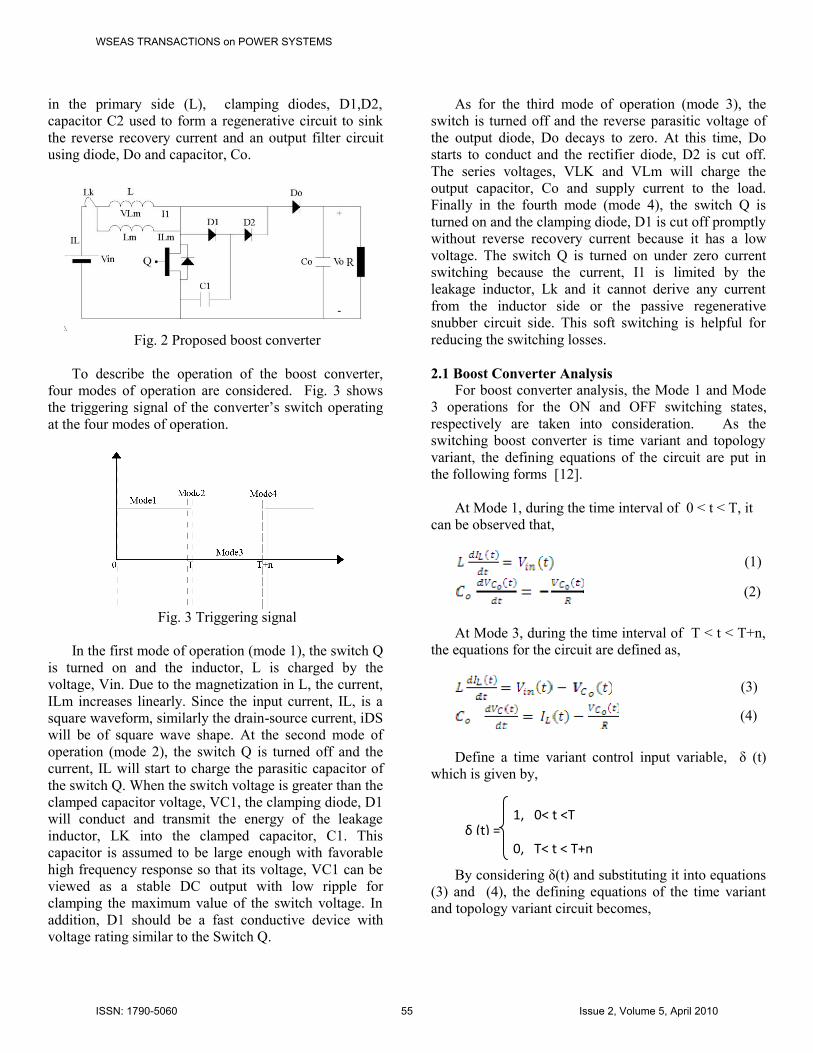
in the primary side (L), clamping diodes, D1,D2,
capacitor C2 used to form a regenerative circuit to sink
the reverse recovery current and an output filter circuit
using diode, Do and capacitor, Co.
Fig. 2 Proposed boost converter
To describe the operation of the boost converter,
four modes of operation are considered. Fig. 3 shows
the triggering signal of the converter’s switch operating
at the four modes of operation.
Fig. 3 Triggering signal
In the first mode of operation (mode 1), the switch Q
is turned on and the inductor, L is charged by the
voltage, Vin. Due to the magnetization in L, the current,
ILm increases linearly. Since the input current, IL, is a
square waveform, similarly the drain-source current, iDS
will be of square wave shape. At the second mode of
operation (mode 2), the switch Q is turned off and the
current, IL will start to charge the parasitic capacitor of
the switch Q. When the switch voltage is greater than the
clamped capacitor voltage, VC1, the clamping diode, D1
will conduct and transmit the energy of the leakage
inductor, LK into the clamped capacitor, C1. This
capacitor is assumed to be large enough with favorable
high frequency response so that its voltage, VC1 can be
viewed as a stable DC output with low ripple for
clamping the maximum value of the switch voltage. In
addition, D1 should be a fast conductive device with
voltage rating similar to the Switch Q.
As for the third mode of operation (mode 3), the
switch is turned off and the reverse parasitic voltage of
the output diode, Do decays to zero. At this time, Do
starts to conduct and the rectifier diode, D2 is cut off.
The series voltages, VLK and VLm will charge the
output capacitor, Co and supply current to the load.
Finally in the fourth mode (mode 4), the switch Q is
turned on and the clamping diode, D1 is cut off promptly
without reverse recovery current because it has a low
voltage. The switch Q is turned on under zero current
switching because the current, I1 is limited by the
leakage inductor, Lk and it cannot derive any current
from the inductor side or the passive regenerative
snubber circuit side. This soft switching is helpful for
reducing the switching losses.
2.1 Boost Converter Analysis
For boost converter analysis, the Mode 1 and Mode
3 operations for the ON and OFF switching states,
respectively are taken into consideration. As the
switching boost converter is time variant and topology
variant, the defining equations of the circuit are put in
the following forms [12].
At Mode 1, during the time interval of 0 < t < T, it
can be observed that,
(1)
(2)
At Mode 3, during the time interval of T < t < T+n,
the equations for the circuit are defined as,
(3)
(4)
Define a time variant control input variable, δ (t)
which is given by,
By considering δ(t) and substituting it into equations
(3) and (4), the defining equations of the time variant
and topology variant circuit becomes,
δ (t) =
1, 0< t <T
0, T< t < T+n
WSEAS TRANSACTIONS on POWER SYSTEMS Tamer T. N. Khatib, A. Mohamed, N. Amin, K. Sopian
ISSN: 1790-5060 55 Issue 2, Volume 5, April 2010

(5)
(6)
To perform DC steady state and AC small signal
analyses, the variables are defined as
having two components which are the DC component
and the corresponding perturbation component [12]. If
the DC components are represented by the letters with
non hat symbol and the perturbation components are
represented by the letters with hat symbol, (5) and (6)
become,
(7)
(8)
where, D is the duty cycle.
To perform DC steady state analysis, let
and . Then (7) and (8)
become,
(9)
(10)
From (9), the relation between the input and the
output voltages of the boost converter will be:
(11)
From (10) we get
(12)
Assuming that the converter is ideal in which output
power is equal to the input power, , we get
(13)
Substituting (11) into (13), we get the voltage and
current gain equation of the boost converter which is
given by,
(14)
3. Proposed MPPT Method for PV
System
The MPP is the extreme value of the P-V curve at
specific solar radiation and ambient temperature values.
To predict the P-V curve of a PV generator, the
nonlinear characteristic of the PV generator can be
modeled off-line based on mathematical equations or
numerical approximations [13]. To achieve an accurate
fitting of the P-V curve, a polynomial function of the
fourth degree is used and it is given by,
(15)
Fig. 4 shows a comparison of the P-V curve
obtained from using the fourth order polynomial
function and the actual P-V curve
Fig. 4. P-V prediction by the fourth order
polynomial function
The results show that the P-V curve predicted from
using the fourth order polynomial function is more
accurate as compared to using the third order
polynomial function as proposed in [9,10]. Thus, the
fourth order polynomial function is used to predict the P-
V curve.
After obtaining an accurate prediction of the P-V
curve using the fourth order polynomial P-V function,
WSEAS TRANSACTIONS on POWER SYSTEMS Tamer T. N. Khatib, A. Mohamed, N. Amin, K. Sopian
ISSN: 1790-5060 56 Issue 2, Volume 5, April 2010

this function ( is then used to determine the
coefficients of the fitting function. In this case, the
inputs of this function (equation 15) are the PV module’s
power and voltage and the outputs are the five
coefficients ( ).
Considering the fact that the PV module’s voltage
depends on the cell temperature in which it varies with
the sun’s radiation, it is considered that the PV power is
also a function of the temperature. The cell temperature
can be calculated from the nominal operation condition
temperature (NOCT) which is the temperature of the cell
at 800W/ and 20 oC ambient temperature [1]. The cell
temperature is given by,
(16)
Using the MATLAB based PV model which is
represented by a current source function in terms of PV
voltage, irradiance and cell temperature [15], a large
sampling of P-V curves under wide range of
temperatures (0 0C – 100
0C) are obtained. The P-V
curves at various temperatures are plotted as shown in
Fig.5 and fitted with the fourth order P-V polynomial
function by using the MATLAB fitting function
(P=polyfit(x,y,N)).
Fig. 5 P-V predicted functions at different
temperatures
From the derived P-V curves, the coefficients with
respect to the various cell temperatures are obtained.
Table 1 shows some samples of the PV coefficients at
temperatures 20 0C – 40
0C. From these coefficient
values, each coefficient can be plotted with respect to the
cell temperature. Figs. 10a, 10b, 10c, 10d and 10e show
the plots of the coefficients P1, P2, P3, P4 and P5 verses
the cell temperature, respectively.
TABLE I
PV COEFFICIENTS AT DIFFERENT TEMPERATURES
Tcell P1 P2 P3 P4 P5
0 -0.0021 0.1088 -1.91 19.35 -12.37
10 -0.0023 0.1165 -1.9638 19.1791 -11.6146
20 -.0023 .1161 -1.8715 18.1767 -10.0084
30 -.0022 .1079 -1.6372 16.3890 -7.6014
40 -.0021 .0917 -1.2582 13.7867 -4.360
50 -0.0018 0.0673 -0.7303 10.3455 -0.2450
65 -0.0014 0.0350 -0.0596 6.0996 4.6844
70 -8.67e-4 -0.0053 0.7560 1.0387 10.4486
80 -2.34e-4 -0.0536 1.7164 -4.8372 17.0476
90 5.15e-4 -0.1099 2.8217 -11.528 24.4814
100 0.0014 -.1742 4.0720 -19.034 32.75
Fig. 10a: Coefficient P1 vs cell temperature
Fig. 10b: Coefficient P2 vs cell temperature
WSEAS TRANSACTIONS on POWER SYSTEMS Tamer T. N. Khatib, A. Mohamed, N. Amin, K. Sopian
ISSN: 1790-5060 57 Issue 2, Volume 5, April 2010
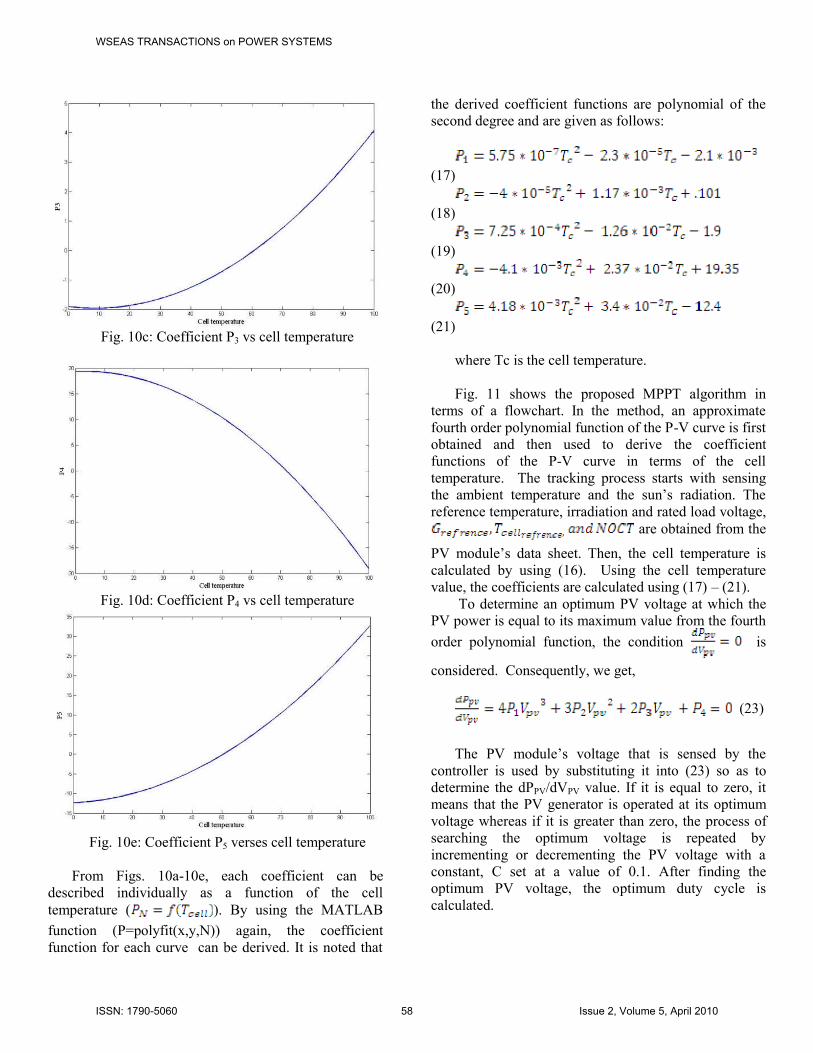
Fig. 10c: Coefficient P3 vs cell temperature
Fig. 10d: Coefficient P4 vs cell temperature
Fig. 10e: Coefficient P5 verses cell temperature
From Figs. 10a-10e, each coefficient can be
described individually as a function of the cell
temperature ( ). By using the MATLAB
function (P=polyfit(x,y,N)) again, the coefficient
function for each curve can be derived. It is noted that
the derived coefficient functions are polynomial of the
second degree and are given as follows:
(17)
(18)
(19)
(20)
(21)
where Tc is the cell temperature.
Fig. 11 shows the proposed MPPT algorithm in
terms of a flowchart. In the method, an approximate
fourth order polynomial function of the P-V curve is first
obtained and then used to derive the coefficient
functions of the P-V curve in terms of the cell
temperature. The tracking process starts with sensing
the ambient temperature and the sun’s radiation. The
reference temperature, irradiation and rated load voltage,
are obtained from the
PV module’s data sheet. Then, the cell temperature is
calculated by using (16). Using the cell temperature
value, the coefficients are calculated using (17) – (21).
To determine an optimum PV voltage at which the
PV power is equal to its maximum value from the fourth
order polynomial function, the condition
is
considered. Consequently, we get,
(23)
The PV module’s voltage that is sensed by the
controller is used by substituting it into (23) so as to
determine the dPPV/dVPV value. If it is equal to zero, it
means that the PV generator is operated at its optimum
voltage whereas if it is greater than zero, the process of
searching the optimum voltage is repeated by
incrementing or decrementing the PV voltage with a
constant, C set at a value of 0.1. After finding the
optimum PV voltage, the optimum duty cycle is
calculated.
WSEAS TRANSACTIONS on POWER SYSTEMS Tamer T. N. Khatib, A. Mohamed, N. Amin, K. Sopian
ISSN: 1790-5060 58 Issue 2, Volume 5, April 2010

Fig. 11: MPPT Algorithm
4. Experimental Results A prototype of the microcontroller based MMPT has
been designed and developed as shown in Fig. 12. The
controller circuits diagram is shown in Fig.13. The
MPPT controller consists of boost converter with
snubber circuit, microcontroller circuit and feedback
sensors. The proposed MPPT algorithm has been
programmed on the PIC16F778 microcontroller. This
microcontroller has 7 data reading ports and a pulse
width modulation (PWM) port. During the tracking, the
microcontroller reads three input readings; PV module’s
voltage, ambient temperature and solar radiation. Based
on these readings the optimum duty cycle of the
triggering signal is calculated. The MPPT controller was
tested by connecting it to a standalone PV system
installed at the university campus site as shown in
Fig.14. The PV system consists of a 350 Watt PV
module and a chargeable battery 180 Ah, 24 V. A
24V/240V inverter is connected between the battery and
loads comprising of an osmosis pump, lights and power
plugs for common uses. Table 2 shows the specification
of the boost converter’s devices.
Fig. 12: Prototype of the MPPT controller
Fig. 13 Circuit diagram of the MPPT controller
Fig. 14: Testing site
WSEAS TRANSACTIONS on POWER SYSTEMS Tamer T. N. Khatib, A. Mohamed, N. Amin, K. Sopian
ISSN: 1790-5060 59 Issue 2, Volume 5, April 2010

TABLE II
BOOST CONVERTER SPECIFICATION
Label Description/ Value
Q1 (IGBT) MOSFET , TO-247AC. 75 V L1 2 mH, 30 A
C1 6.8 F, 100V
C2 680 F , 100 V
D1, D2 and D3 SCHOTTKY diodes , TO-220, 20 A, 80 V
The MPPT controller is connected between the PV
modules and the battery. Thus, the PV modules charge
the battery through the MPPT. A charge controller is
also connected to protect the battery from being over
charged or over discharged. During the MPPT controller
testing, the solar radiation, ambient temperature,
batteries’ state of charge and MPPT output voltage and
current were measured. Fig. 15 shows the solar radiation
curve during the testing day which was a sunny and clear
day. The peak sun shine hours is 5.7 hours and
consequently the extracted energy form the PV modules
is 1995 KWh. Fig. 16 shows the ambient temperature
profile on the testing day in which the temperature was
23.5 oC in the morning and then reached a peak value of
32.5 oC
in the mid afternoon.
Fig.15: Solar radiation curve during the testing day
Fig. 16: Ambient temperatures during the testing day
The MPPT output voltage and current were also
measured so as to determine the MPPT output power.
Fig. 17 shows the voltage and current profiles during the
testing day.
Fig. 17: MPPT output voltage and current during the
testing day
From the MPPT output voltage and current, its
output power and efficiency are calculated. The
efficiency of a MPPT can be defined as the extracted
power from the PV module multiply by the boost
converter conversion efficiency and divided by the
theoretical maximum power at the same weather
conditions [16]. Based on this definition, the MPPT’s
efficiency during the testing day was calculated and
plotted as shown in Fig. 18. It is noted that the efficiency
varies between 88% - 90% with an average efficiency of
89.2%. Due to varying ambient temperatures and solar
radiation, the MPPT efficiency is affected. Fig. 19 and
20 show the effect of ambient temperature and solar
radiation on the MPPT efficiency, respectively. From
Fig. 19, it is clear that the MPPT’s efficiency decreases
when the ambient temperature increases. Thus, it can be
concluded that MPPT has better efficiency when
operating at moderate temperatures. It is noted that low
sun radiation affects the tracking efficiency negatively
(Fig. 20). Thus, tracking efficiency may be degraded
when the solar radiation becomes lower than 300 W/ .
WSEAS TRANSACTIONS on POWER SYSTEMS Tamer T. N. Khatib, A. Mohamed, N. Amin, K. Sopian
ISSN: 1790-5060 60 Issue 2, Volume 5, April 2010

Fig. 18: Tracking efficiency
Fig. 19: Effect of temperature on MPPT's efficiency
Fig. 20: Effect of solar radiation on MPPT
Fig. 21 shows the batteries’ state of charge (SOC)
during the testing day in which the initial SOC is 56%
and the final SOC is 89.6%.
Fig. 21: Batteries’ state of charge during testing
Figs.22 and 23 show the PV system’s performance
with and without MPPT. To do this comparison the
system was operated for short while with and without
MPPT. The values of solar radiation in both cases are
shown at the top of the columns. Since the solar
radiation values are very close to each other, a
comparison for the performance of the system with
MPPT and without MPPT can b obtained. See Fig (22).
The MPPT increases the extracted power from the PV
modules and consequently increases the system
efficiency (Fig.22). Fig.23 shows a comparison of the
PV module’s output voltage for the case of with and
without MPPT. It is noted that the voltage profile is
more stable with MPPT than the voltage profile without
MPPT.
Figure 22 PV system output power with and without
MPPT
WSEAS TRANSACTIONS on POWER SYSTEMS Tamer T. N. Khatib, A. Mohamed, N. Amin, K. Sopian
ISSN: 1790-5060 61 Issue 2, Volume 5, April 2010

Figure 23 Output voltage profile with and without
MPPT
Simulations were also carried out to compare the
performance of the conventional boost converter and the
proposed boost converter. The simulation results in
terms of the boost converter conversion efficiency are
shown in Fig. 24. From the figure, it can be seen that the
conventional boost converter reach its MPP in 0.4 sec
and the conversion efficiency is 88.2%. On the other
hand, the proposed boost converter reaches it’s MPP in
0.6 sec with conversion efficiency higher than the
conventional one (92.6 %). Thus, by adding a snubber
circuit in the boost converter, better soft switching of the
converter’s switches can be achieved and the conversion
efficiency increases by 4.4 %.
Figure 24 Comparison between the conventional
boost converter and the proposed boost converter
5. Conclusion An efficient MPPT controller has been developed by
incorporating a new DC-DC boost converter design and
an improved MPPT algorithm based on the indirect
curve fitting technique. The MPPT algorithm
approximates the P-V curve by representing it with a
fourth degree polynomial function in terms of ambient
temperature and sun’s irradiation. The developed MPPT
algorithm is programmed in a microcontroller based
MPPT controller and tested on an existing PV system.
Experimental test results showed that the proposed
MPPT gives an average tracking efficiency of 89.2%. It
is also shown that the tracking efficiency is lowered by
6% during high temperature and low radiation
conditions. An advantage of the proposed MPPT
controller is that it is cost effective and simple because it
does not require current measurements during MPP
tracking.
References [1] Salas, V., A.Barrado, E. O., lazaro, A. (2006).
Review of the maximum power point tracking algorithms
for stand-alone photovoltaic systems. Solar Energy
Materials & Solar Cells, Vol.90, pp:1555–1578.
[2] I. Güney, N. Onat, Technological Status and
Market Trends of Photovoltaic Cell Industry, WSEAS
Transactions on Electronics, Vol.5, Iss.7, pp.303-312,
2008.
[3]Jui-Liang Yang , Ding-Tsair Su , Ying-Shing
Shiao, Research on MPPT and single-stage grid-
connected for photovoltaic system, WSEAS
TRANSACTIONS on SYSTEMS, v.7 n.10, p.1117-
1131, October 2008
[4]Liu Liqun , Wang Zhixin, A variable voltage
MPPT control method for photovoltaic generation
system, WSEAS Transactions on Circuits and Systems,
v.8 n.4, p.335-349, April 2009
[5] Mohan, N., Undeland, T. M., Robbins. W.
P.,(1995), Power Electronics: Converters, Applications,
and Design. Wiley
[6] Jovanovic. M. M. , Jang, Y.,(1999), A new soft-
switched boost converter with isolated active snubber,
IEEE Trans. Ind. Appl. Vol. 35, pp. 496–502.
[7] Duarte, C. M. C. , Barbi, I.,(2002), An improved
family of ZVS-PWM active clamping DC-to-DC
converters, IEEE Trans. Power Electron.,Vol. 17, no. 1,
pp. 1–7.
[8] Tafticht, T., Doumbia, M., Che´riti, A. (2008).
An Improved Maximum Power Point Tracking Method
WSEAS TRANSACTIONS on POWER SYSTEMS Tamer T. N. Khatib, A. Mohamed, N. Amin, K. Sopian
ISSN: 1790-5060 62 Issue 2, Volume 5, April 2010

for Photovoltaic Systems. Renewable Energy. Vol.33,
pp: 1508–1516
[9] Takehara, N., Kurokami, S.,(1997) Power
control apparatus and method and power generating
system using them. Patent US5,654,883.
[10] Phang, J.C.H., Chan, D.S.H. , Phillips, J.R.
,(1984). Accurate analytical method for the extraction of
solar cell, Electron. Lett. Vol.20, pp:406–408.
[11] Faranda, R. , Leva, S. (2008). Energy
comparison of MPPT techniques for PV Systems.
WSEAS Transactions on Power Systems, Vol. 3,
pp:446-455
[12] Xu, J.,(1991), An Analytical Technique for the
Analysis of Switching DC-DC Converters, International
Symposium on Circuits and Systems ,Vol.2, pp. 1212 -
1215.
[13] Hamdy, M.A. , (1994). A new model for the
current-voltage output characteristics of photovoltaic
modules, J. Power Sources, Vol. 50 , pp:11–20.
[14] Takashima, T. , Tanaka, T., Amano, M. , Ando,
Y., (2001). Maximum output control of photovoltaic
(PV) array, Intersociety Energy Conversion Engineering
Conference and Exhibit (IECEC), 35th, pp. 380–383.
[15] Walker, G.,(2001). Evaluating MPPT converter
topologies using a MATLAB PV model," Journal of
Electrical & Electronics Engineering, Australia,
IEAust, vol.21, pp.49-56.
[16] Enrique, J.M. , Andujar, M.A. Bohorquez.
(2010). A reliable, fast and low cost maximum power
point tracker for photovoltaic applications. Solar Energy
Vol.84, pp:79-89.
WSEAS TRANSACTIONS on POWER SYSTEMS Tamer T. N. Khatib, A. Mohamed, N. Amin, K. Sopian
ISSN: 1790-5060 63 Issue 2, Volume 5, April 2010