an economic valuation of the natural - global islands
TRANSCRIPT


An Economic Valuation of the Natural Resources of Andros Islands, Bahamas.
By Venetia Hargreaves-Allen (PhD).
Conservation Strategy Fund.
Report presented to the Nature Conservancy in August 2010.
Acknowledgements. The author would like to thank the staff of The Nature Conservancy in the Bahamas, especially Sharrah Moss and Stacey Moultrie, who provided critical advice, information, comments on draft reports and made the whole project possible and John Reid who provided critical technical and editorial advice. The author would also like to thank key informants including Dr. Richard Cant, Tavares Thompson, Eugene, Sharon Henfield and Tamica Rhaming, who generously gave their time and knowledge, as well as the participants of the workshop hosted by TNC in June 2010 and all organisations who provided data and input for this analysis, including the Andros Conservancy and Trust, the Bahamas National Trust and the Ministry of Tourism.

1
Executive Summary
The island of Andros is located off the Southern tip of Florida and roughly 65km West of Nassau. It is 104 miles long and 45 miles wide with a population of approximately 10,000. Human activities on the island are mainly related to agriculture, tourism, fishing and general development, with some employment by the government and the Water and Sewage Company. The number of visitors to Andros is typically 10,000 per year, with a mean of 85,000 visitor nights from 2006-2008. There are 34 registered hotels (393 hotel rooms). Andros is often referred to as the ‘bone fishing capital of the world.’ Andros supports a number of habitat types, including broadleaf coppice forests, pine forests, palm shrublands, sawgrass, rocky shores, beaches, mangroves, seagrass beds and tidal creeks which provide a habitat for many rare and endangered species. It retains some of the most intact and least developed natural areas in the Bahamas and has high levels of biodiversity, some of the most extensive wetlands in the region and the largest source of freshwater in the Bahamas. Indeed water from Andros supplies over 50% of the water to capital in New Providence. In addition, the third largest barrier reef in the world is found off the East coast of Andros.
Figure. Summary map of Habitat Economic Values

2
Executive summary
Net Economic Value of Water and Androsian Habitats To estimate economic values, the area of each habitat type was multiplied by the average values, drawn from current academic literature, of ecosystem services from each habitat. Those habitats which tend to generate large values per area are beaches, wetlands and to a lesser extent forests and mangroves. On Andros, the most extensive habitats are forests and wetlands, followed by estuaries and seagrass beds. The value of ecosystem services provided by these habitats is approximately $260 million, although estimating such values is complicated by issues of additionality and marginality, as well as inadequate data. Of this, 59% comes from forests, 23% from wetlands and 7% from coral reefs. Furthermore, 25% comes from carbon storage, 19% from extraction of raw materials and 11% from biodiversity values. In addition, water resources generate a net value of $3.5 million.
Contribution of Natural Resources to the Economy.
In addition to net ecosystem values, we estimated the impact of ecosystems on the Bahamian economy, measured in terms of gross revenues from activities that depend on natural resources. This concept of impact is different from value in that it does not separate out all the non-natural inputs to production but simply aims to assess how much activity and employment is related to the areas natural ecosystems. In order to account for the indirect and induced effect of natural resource related revenues, an economic multiplier of 25% was used.
Overall, 67% of these revenues are generated by extractive activities and 33% by non-extractive ones. Commercial fishing (including crabbing and sponging) generates a huge $70 million in revenues, which is shared among a huge number of people and households. If all tourism related activities are added together, they constitute $43.6 million in revenues each year. Much of this tourism is related to recreational fishing, for which guided trips alone generate over $10 million each year. Farming, research /education programs and sponging generate relatively fewer revenues.
Table 2. Summary of direct Economic Impacts. 1 not including fishing or diving etc.
Type of Activity Aggregated impact in 2009 (US$’000)
Principal income
Secondary income
% of Economic Impact
Fishing 47,265 392 3700 33% Crabbing 19,687 53 3700 14% Sponging 3,180 32 275 2% Farming 1,234 486 28 1% Crafts1 8,345 448 17 6% Water revenues 15,830 31 0 11% Guided recreational fishing 10,000 18 35 7% Tourism expenditure 1 32,555 178 176 23% Eco-trips 1,025 20 60 1% Education / research 2,800 18 8 2% Total $141.9 million 1,676 8,000
Andros’ natural resources generate $142 million in direct revenues each year and employ over 80% of the population either full or part-time. Overall, $70 million stems from commercial fishing and $44 million from nature-based tourism. If we consider secondary impacts (related to spending not included here, such as fisheries equipment, construction and inter-island transport), we estimate that the total impact is $177 million each year. It should be noted that these are gross revenue estimates and that direct, indirect and opportunity costs can be significant.
1 Craft is used as a collective term for weaving, basket making, curio making, furniture production, wood carving and bush medicine.

3
Executive summary
Economic Values and Impacts into the Future.
The annual economic benefits and impacts were projected over 25 years and discounted to estimate present values. A present value in economics is simply the sum of annual values over many years, with future years’ benefits adjusted downward to account for the fact that people favor current income over future income. Inflation-adjusted discount rates of 1%, 3% and 5% were used. For the most part, we assume a business as usual scenario rather than increases or decreases in particular activities, a forecast that may not hold in reality. In fact it is likely that growing scarcity will cause the value of the habitats in Andros to rise over time, so we also assess the impact of a 1% and 2% increase in relative value of these resources.
If the economic values cited in this paper remained constant over the next 25 years the value of the ecosystem services would be $3.8-5.8 billion in present value terms. If there is a 1% annual increase in the relative value of these ecosystems, their present value rises to $4.2-6.5 billion. In addition, water is shown to have a value of $51-78 million over this time. The same ecosystems could generate $2.6-3.8 billion in gross revenues over a 25 year time period. A 1% real annual increase in revenues in Andros could increase this to $2.9-5 billion.
This study’s short timeframe and lack of biophysical data means that habitat values are speculative. Nevertheless, it is apparent that residents of Andros have become adept at finding a high quality of life, based largely on the utilisation of natural resources. People benefit directly in many ways from the flora and fauna, from extraction of crabs, sponge, fish, wood and palm for crafts, medicine and fruits from the forest, as well as water from the ground. They also benefit indirectly in terms of income and employment from nature based tourism, such as guided fishing and diving or visiting blue holes. In short, residents depend on a healthy environment and are therefore potentially vulnerable to environmental degradation.
Current and emerging threats in Andros include unchecked development (involving pollution, dredging and indiscriminant habitat clearing), over-fishing, invasive species, sewage, climate change and ocean acidification. Each of these threats is expected to reduce the economic value and impact of these resources. Conservation projects are urgently need to avoid this outcome and even to increase the value of these resources.
Sustainable Management and Finance There are a large number of projects and policies that could be enacted in Andros to help protect habitats and biodiversity of this island. In total, it is estimated that it is necessary to raise $1.62 million initially and $540,000 each year to enable the minimum level of sustainable management of these resources through parks management, ecotourism development, consultation, recycling, habitat restoration and vulnerability assessments. This is equivalent to 0.6% of the economic benefits and 1% of the gross revenues this islands ecosystems produce each year. Several potential sources of funding appear feasible, both solely for Andros and nationwide (where part of the funds raised could be used for conservation projects on Andros).
Table. Potential Sources of Funding.
Andros Nationwide A bonefishing fee Voluntary hotel surcharges Fines for environmental damage Voluntary carbon offsets for flights Grants from international organizations for specific projects Cruise ship fees Mitigation banking agreements with developers Lottery revenues A “friends of Andros” fundraising program Debt for Nature swaps or debt relief

4
Executive summary
Key messages from the Economic Valuation
of the Natural Resources of Andros Islands, Bahamas
The ecosystems, species and landscapes of Andros represent a huge ecological and economic endowment for the people of Andros, The Bahamas and the wider Caribbean region.
The habitats on Andros provide an estimated mean of $46,000 per km2 per year in ecosystem services, such as carbon storage, water supply and recreation.
Overall, habitats on Andros are thought to generate $260 million a year in net economic benefits, which if sustained, will be worth $4.6 billion over the next 25 years.
The net benefit of fresh water on Andros is $3.5 million each year. Nature provides income and employment for 80% of Andros; 1,645 full time jobs and 8,000
part time jobs. Commercial fisheries in Andros (including crabbing and sponging) generate $70 million in
revenues each year, which provides food and income for many people and households. Nature based tourism activities (including accommodation, bonefishing and diving)
constitute $43.6 million in revenues each year in Andros. Overall, the extractive and non-extractive use of Androsian natural resources generates $142
million in direct gross economic activity and an additional $35 million in associated spending, which is at least 60% of all economic activity on Andros. Over the next 25 years, this could add up to $3 billion in revenues.
Environmental degradation in the Caribbean means that natural resources on Andros are likely to become more valuable, if they are properly protected. Conversely, the potential losses in values and the loss in income, jobs and welfare could be enormous, if effective conservation actions are not implemented.
In order to establish a basic level of sustainable management of these habitats, initial funding of $1.62 million is needed, which is equivalent to 0.6% of the economic benefits and 1% of the gross revenues this island’s ecosystems produce each year.
Promising sources of funding include bonefishing fees, fines for environmental damage, grants from international organizations, a “friends of Andros” fundraising program, cruise ship fees and voluntary hotel surcharges.

1
Introduction.
Ecologists and NGOs working in the Bahamas have long known that the pristine habitats on the island of
Andros are both valuable and vulnerable. The aim of this work was however to work out how valuable the
natural resources are, what can be done to protect them and how protection might be financed. This
research was part of a wider project: The Integrated Watershed and Coastal Areas Management (IWCAM)
Project, funded by the Global Environmental Facility (GEF), whose overall goal is to enhance the capacity of
the countries to plan and manage their aquatic resources and ecosystems on a sustainable basis, for example
through the development of a Land and Sea Use Plan. Andros was chosen partly because it has some of the
most varied and pristine habitats, exceptional biodiversity and one of the largest freshwater lenses in the
region.
Economic valuation is increasingly required in the field of conservation, to demonstrate the economic
contribution of natural resources to the economy and human welfare, to correct for the lack of markets in
these resources which results in under-investment in their protection, to indentify sustainable sources of
funding for conservation and for cost-benefit analysis of projects and policies which reflect social and
environmental costs and benefits.
The aims of this work were therefore to:
Qualify and quantify the economic value of the natural resources on Andros Conceive a conceptual model to show the link between these ecosystems and human welfare Assess the costs of managing the natural resources of Andros Make suggestions for additional funding mechanisms for the sustainable management of natural
resources Consider costs and benefits of conservation in Andros.
This report begins with some background information on the Bahamas, fishing, tourism, as well as the island
of Andros. In the second chapter the conceptual model of the link between the natural resources of Andros
is presented. In chapter 3, the economic value and economic impact of the island’s natural resources both
now and in the future is qualified and quantified. In the final chapter, conservation funding needs for
sustainable ecosystem management are identified and potential sources of conservation funding are explored.
2
Chapter 1. Background
I. The Bahamas
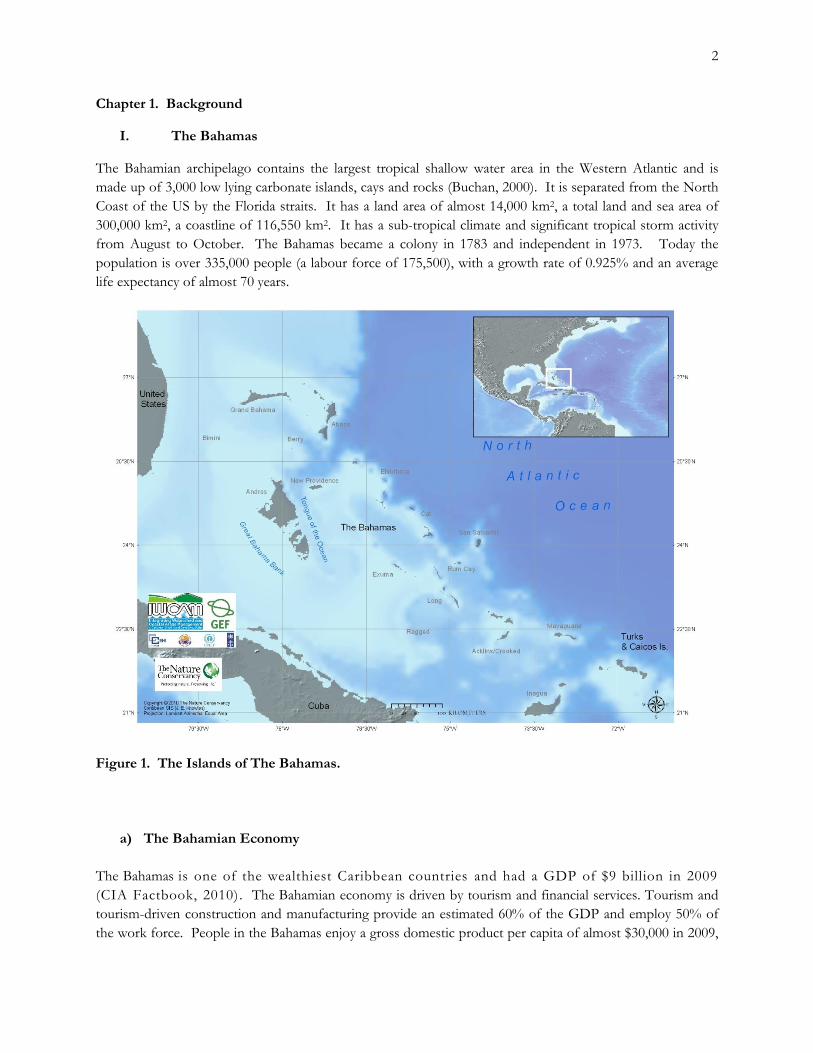
The Bahamian archipelago contains the largest tropical shallow water area in the Western Atlantic and is made up of 3,000 low lying carbonate islands, cays and rocks (Buchan, 2000). It is separated from the North Coast of the US by the Florida straits. It has a land area of almost 14,000 km2, a total land and sea area of 300,000 km2, a coastline of 116,550 km2. It has a sub-tropical climate and significant tropical storm activity from August to October. The Bahamas became a colony in 1783 and independent in 1973. Today the population is over 335,000 people (a labour force of 175,500), with a growth rate of 0.925% and an average life expectancy of almost 70 years.
Figure 1. The Islands of The Bahamas.
a) The Bahamian Economy
The Bahamas is one of the wealthiest Caribbean countries and had a GDP of $9 billion in 2009 (CIA Factbook, 2010). The Bahamian economy is driven by tourism and financial services. Tourism and tourism-driven construction and manufacturing provide an estimated 60% of the GDP and employ 50% of the work force. People in the Bahamas enjoy a gross domestic product per capita of almost $30,000 in 2009,

3
similar to those of Italy and Monaco. Mean income in 2008 is almost $35,000 for women and $49,000 for men (less on outer islands). However, 9.3% of people live below the poverty line. The Bahamian economy, due to its heavy dependence on U.S. tourism and trade, is deeply affected by U.S. economic performance and in 2009 there was a 4% decrease in visitors. GDP fell 5% from 2008 and unemployment and the inflation rates both rose to 8.7% and 4.5%, respectively from 7.9% and 2.4% in 2007. In 2004, business and financial services accounted for 29% of GDP, government expenditures 17%, construction 11%, manufacturing 3% and agriculture and fisheries 2%. In 2007, the Bahamas exported $670 million in mineral products and salt, rum, animal products, chemicals, fruits, and vegetables. Since the Bahamians do not pay income or sales taxes, most government revenue is derived from high tariffs and import fees. Other industries which are of relevance in out-islands (all islands other than New Providence) include aragonite production, which has remained relatively stable since 2001, a mean of 2.4 million short tons each year. Forestry, which has been important in the past has gradually declined.
b) Tourism
There are two principal types of tourism in the Bahamas, cruise ship and overnight. Since 2000, an average of 4.5 million tourists visited the Bahamas each year (Ministry of Tourism & Ministry of Immigration). Of these, about 1.5 million are overnight visitors and the remaining ones stay a few days on a cruise ship docked in a port. Almost half these visitors had incomes greater than US$100,000.2 81% were from USA, 8% Canada and 6% Europe. Overnight visitors stayed an average of 6.6 nights, typically either 5.6 nights in Nassau or 9.5 nights in the out islands. Overnight visitors spent an estimated total of $2.02 billion in aggregate in 2007 and a mean of $1,175 per visit.
258,000 visitors went to the out islands in 2008, spending 2.4 million visitor nights. Thirty seven percent of out-island visitors had chosen the Bahamas due to beaches, followed by 24% for sporting activities (e.g. snorkelling, fishing, diving, sailing). Mean expenditure for out-island overnight visitors was $1,396 per trip in 2007 or US$402 million in aggregate (20% of all tourism expenditure). This includes all those who stay with friends or on boats and so spend nothing on accommodation. Of this, 39% was spent on accommodation, for which the mean price was US$253 per night, 16% on food and drink and 4% on sporting activities. The number of visitors to the out islands continues to rise each year and could reach 3 million by 2024, given current growth of 2.8% per year.
c) Fishing Industry
The fishing industry employs over 9,300 people (7% of the workforce), as well as an estimated 3,800 part-time fishers, 23 vendours, 11 processors and 18 exporters (Buchan, 2000). These numbers have remained largely unchanged since then. Fisheries are subsidized through duty free concessions on fishing equipment. The three main important commercial fisheries in the Bahamas are:
Crawfish (Panulirus argus) – Landings in the Bahamas are the fourth largest in the world. In 2007, crawfish accounted for 29% of total fishery product landings by weight and 89% of total fishery exports by value (US$71 million).
Queen Conch (Strombus gigas) – Less than a quarter the conch catch is typically exported, so estimates are inaccurate because the rest is traded in local markets for which reliable data don’t
2 B$1 = US$1.

4
exist. Populations have been severely depleted (Buchan, 2000). Total conch exports in 2008 amounted to 159 mt with a value of $2.0 million.
Scalefish – This category includes species of grouper, snapper, jacks, grunts, hogfish, triggerfish and others. In 2008, scalefish landings totalled 1,333 mt and represented 9.4% of the total value of all fishery product landings. Snappers accounted for 20.7% of all scalefish landings (valued at US$4.6 million).
Landings estimates are rarely accurate for any country, as they typically do not reflect all the fish eaten and traded locally. However, minimum estimates are that landings in the Bahamas had a gross value of $80.3 million at ex-vessel prices and that the value of exports was $83.4 million in 2007 (FAO, 2009). Landings have increased at a fast rate since the 1970s (see http://www.fao.org/fishery/countrysector/FI-CP_BS/3/en for further reading). In nearby Florida in 2008, fisheries were valued at ex-vessel prices as $170 million (86 million lbs in weight). Today, there is widespread concern that grouper, conch and crawfish fisheries are in decline throughout the region and that such landings are not sustainable.
Table 1. Fish landings and value by type. Department of Marine Resources.
Product Weight (lbs) 2006
Value ($) 2006
Weight (lbs) 2007
Value ($) 2007
Weight (lbs) 2008
Value ($) 2008
Weight (lbs) 2009
Value ($) 2009
Scalefish 3.55 mill 9.3 mill 12.1 mill 6.25 mill 1.2 mill 2.9 mill 2.8 mill 7 mill Crawfish 6.05 mill 75 mill 5.2 mill 71 mill 3.8 mill 45.4 mill 5.23 mill 41 mill Conch 1.9 mill 6.6 mill 834,751 3.05 mill 1.04 mill 3.3 mill 1.36 mill 4.58 mill TOTAL 11.5 mill 90.9 mill 18.2 mill 80.3 mill 6.07 mill 51.6 mill 9.4 mill 52.6 mill In 1982, sponge exports were 8 million tonnes and in 1986, 14 million tonnes (FAO). From 1900 until 1940, sponging employed nearly a third of the Bahamian workforce, until a 1939 fungal disease outbreak killed around 90% of the harvestable sponge in 2 years (Buchan, 2000). Sponging still occurs in Acklins and Andros (Sealey, 1994). Exports in 1995-1997 averaged 127,000 lbs, which was worth about $932,000 (Department of fisheries). In 2009, 68,600 lbs were landed, with a value of $138,677. Shark landings have not been recorded systematically and there is little understanding of the extent of the shark fishery. Turtle shells have been harvested on a large scale, but due to protection and reduced numbers of individuals, currently they are only taken in small amounts. In addition, certain islands specialize in crab products, such as stone crab from Abaco and land crabs from Andros.
d) Reefs
The Bahamas is estimated to have an area of reefs of 3,580 km2, 14% of the total area of coral reef found in the Caribbean (Burke and Maidens, 2004). There are approximately 30 species of reef building corals (Buchan, 2000). Destructive fishing methods and coral extraction have been banned, and closed seasons established for several major fisheries, and fines set. But enforcement is minimal, partly due to funding and staff constraints. Twenty four percent of these reefs are thought to be at medium risk of being destroyed and two percent at high risk (Burke and Maidens, 2004). This is relatively good compared to other reefs in the region. The main threats identified in the Bahamas are related to high fishing pressure and, to a lesser extent, development. Reef quality has been observed to have declined in areas of high tourism development (Sullivan Sealey & others, 2005).

5
e) Water Resources
Water supply in the Bahamas is considered ‘scarce’ according to the United Nations criterion of being less than 1000 m3/capita/year. The country has 66 m3/capita/year. An assessment in the Bahamas described water resources as finite and vulnerable, due to the fact that 90% is contained in freshwater lenses in highly porous limestone aquifers less than 5ft from the surface. In addition, less than 10% of the country is connected to conventional sewage treatment, hence the main source of contamination is from on-site cesspits and septic tanks (US Army corps and engineers, 2004).
Most water systems operating in the Bahamas are owned and managed by the Water and Sewerage Corporation, a government-owned corporation formed in 1976. The corporation operates about sixty separate water systems distributed over 26 inhabited islands. About fourteen million Imperial gallons are supplied each day. A number of privately owned water supply companies operate in New Providence and on other islands. Presently the Water and Sewerage Corporation obtains its potable water supplies from 33 groundwater supply sources and reverse osmosis (RO) plants. RO, also known as desalination, is increasingly being used as it is quicker and cheaper than distillation, but it requires large amounts of electricity (which can make up to 25% of the cost). As a result costs are six to eight times as high as ground water extraction. Sixty two percent of the water supplied to the Bahamas is produced by reverse osmosis by hundreds of small plants used by the private sector that meet the water demands of private developments, industry, hotels, marinas, and individual homes. The volume of groundwater used for agriculture, municipal, industrial and residential uses is currently unknown. Forests influence water quality, quantity, seasonal variation in flows. They help to even out annual flows, therefore reducing the impacts of flood and drought cycles (Myers, 1996). Forest cover also helps to reduce erosion and filter pollutants from water. Further, removal of forests can alter rainfall patterns in entire regions. Wetlands in the Bahamas also have an important link to water, despite not being source of freshwater (much of their water is brackish). The relationship between water and wetlands is not fully understood, however these ecosystems are known to have a beneficial effect in terms of moderation of peak flows, erosion and sediment control. They are also thought to protect the freshwater lens from saltwater incursion. Management of wetlands can be an approach to reduce costs of ground water management and ground water recharge (US Army corps and engineers, 2004).

6
II. The Island of Andros
The island of Andros is located off the Southern tip of Florida and roughly 65km West of Nassau. It is 104 miles long and 45 miles wide and is larger than all other Bahamian islands combined (2,300 square miles) or 43% of Bahamian land area. It is cut by three tidal creeks and bordered by a deep ocean abyss. The Andros barrier reef stretches for 230 km off the east side of the island. The Great Bahama bank runs to the West.
Figure 2. The island of Andros.

7
A census of Andros in 2000 estimated a population of almost 8,000 people (3.3 per square mile). Andros is divided into 4 sections or bights; North, Central, Mangrove Cay and South Andros. Current estimates are for 10,000 people; 2,000 in South Andros, 1,000 in Mangrove Cay, 4,000 in Central Andros and 3,000 in North Andros. Communities are scattered along the East coast road, which runs North to South. The largest community is Fresh Creek, in Central Andros. Human activities on the island are mainly related to agriculture, tourism, fishing and general development, with some employment by the government, the Atlantic Undersea Test and Evaluation Center (part of the US navy) and the water company. Options for employment are therefore relatively limited.
The number of visitors to Andros is typically 10,000 per year, of whom 90% are from the US, 5% are from Europe and 3% are from Canada. A mean of 85,000 visitor nights were spent in Andros from 2006-2008. Sixty-six percent of visitors came in on commercial flights and 26% on private planes. Fifty percent of visitors stay in hotels, 12% with friends, 10% on private boats, 5% in rental properties and 5% in their own second homes. There were 34 registered hotels and 393 hotel rooms in Andros in 2008 (12% of all the out-island hotels). 67% of visitors to Andros were repeat visitors.
Andros is often referred to as the ‘bone fishing capital of the world’, due to the large number of people who come to Andros for recreational fly fishing and bone fishing. A report in 2009 reported 80 bone fishing guides in Andros and estimated there were 64,441 angler nights on Andros (12,643 guided) and that anglers spent an estimated $374 per night (compared to $364 for general tourists). The total estimated of direct tourist spending in 2008 was $23.63 million, with an additional $24.1 in value added expenditures. The value added figure is likely to be an overestimate due to a 100% value added assumption (Fedler, 2010).
a) Habitats of Andros
Andros supports a number of habitat types, including broadleaf coppice forests, palm shrublands, sawgrass, rocky shores, beaches, mangroves, seagrass beds and tidal creeks. Andros (one of the four pine islands) contains fifty-five percent of the Bahamian forest inventory of the endemic pine species (Pinus caribea var. bahamensis). Andros retains some of the most intact and least developed natural areas in the Bahamas. It is one of the most extensive wetland areas of the Caribbean, has high levels of biodiversity, and also contains the largest source of freshwater in the Bahamas. There is a huge amount of marine life found in the mangroves, creeks, estuaries and reefs found off Andros. In addition, the third largest barrier reef in the world is found off the East coast of Andros. As a biodiversity hotspot and the primary sensitive area in the Bahamas, Andros was chosen as a key demonstration site by the IW-CAM project. Much of Andros is in effect wilderness, covered with coppice and pine forest habitats (see figure 3), with little access except by boat or via a few roads which remain from logging. Mangrove Cay and South Andros support the largest pines remaining in the Bahamas and are primary forest, since they were not subject to the same extensive logging as North and Central Andros from 1900 to 1970. There is a high degree of structural and taxonomic variation within terrestrial vascular plant habitat types between North, East, South and West Andros (Dahlgren, 2006). The West side of the island is virtually untouched by human influence (there is currently only one lodge), and, as a result, is one of the last areas of wilderness in the region (Dahlgren, 2006). Andros’ barrier reef runs for 217 km along the East coast and is discontinuous. Live coral cover ranges from 20-54% (mean of 36% which is relatively low), and is dominated by colonies of Acropora palmata, however

8
there is a high degree of variability among reefs in terms of species cover. Mean densities of coral recruits (young growing coral) are fairly high (11/m2), so reef quality could improve over time. 164 species of reef fish, with mean species density of 37.4 individuals per 100 m2 transect, have been recorded. Juvenile species richness was higher in Andros’ shallow reefs than that found in shallow reefs of the Florida Keys (16 versus 11 species). While this reef has been affected by some of the regional stressors, such as loss of the diadema sea urchin (D. antillarium), there are large areas that seem not to have been affected. Levels of mortality ranged from 12-52% of coral cover in 1997, due to predation, disease, human-induced trash, boat groundings and the 1998 extensive bleaching event which was due to a 1-2 degree increase in sea temperature over four months. The entire reef system could be at risk from increases in fishing, given low abundance of fishes and growing demand driven by increased prices (Kramer & others, 2003).
The commingling of marine, freshwater and terrestrial environments throughout western Andros has produced a patchwork of habitats that vary in environmental conditions and ecological communities. The estuaries are important nursery and foraging habitat for commercially valuable species such as snapper, spiny lobster, tarpon, and bonefish. The nursery habitats are thought to significantly contribute to fish stocks throughout the Caribbean region, particularly for highly migratory species such as bull sharks and tarpon and several other species of interest, including endangered sawfish. A total of 32 fish taxa have been observed (19 in mangrove, 13 in hardbottom). Here fish biomass is extremely high, due to the mangrove creeks on western Andros having naturally high rates of productivity coupled with the absence of human impacts, such as creek fragmentation, fishing and coastal development, which can reduce the amount of fish biomass in mangrove systems. One of the most important spiny lobster (Panulirus argus) fishing grounds in the Bahamas is in the extensive bank areas to the west and southwest of Andros Island. Andros is also known to be an important mating area for nurse sharks, an important nursery area for lemon sharks and an important area for maintaining populations of bullsharks (The Nature Conservancy, 2006). Its pristine habitats are home to many rare, endangered and charismatic species, such as the Kirtland’s warbler, leatherback turtle, iguana, several species of shark and marine mammals. Aerial surveys of Andros during the summers of 2004 and 2005 revealed flocks of flamingos totaling more than 1,000 individuals both years (Baltz 2004, 2005), but did not establish the breeding status of the birds on the island. The west coast of Andros is important habitat for three species of sea turtles: green turtles (Chelonia mydas), loggerheads (Caretta caretta), and hawksbills (Eretmochelys imbricata). The sea turtle populations observed on the west coast of Andros are significant in the Bahamas Archipelago and may well be of regional significance in the Greater Caribbean. The juvenile loggerhead population observed in the waters around the west coast of Andros represents the only known aggregation of juvenile loggerheads in The Bahamas. The Bahamian Andros iguana (Cyclura cychlura cychlura) is the largest native terrestrial vertebrate, and the only iguana in the Bahamas that is presently not confined to small cays (Alberts, 2000).

9
Figure 3. The Terrestrial Habitats of Andros.
b) Fishing and crabbing in Andros
The number of fishers and the amount of fish, conch and lobster landed in Andros is not currently known. The Department of Marine Resources gathers some landings data, analysis of which suggests that there are large numbers of fishers operating in Andros.

10
Table 2. Landings data from Andros (based on data from the Department of Marine Resources).
Crawfish Scale fish Sponge Conch 2008 2009 mean 2008 2009 mean 2008 2009 mean 2008 2009 mean Days recorded 22 19 20 17 60 39
16 14 15 7 27 17
Boats 59 28 43.5 84 225 155 121 111 116 7 34 21 Total (pounds) 17,653 789 92,201 17,006 15,968 16,487
189,744
30,205,941
15,197,834 670
20,714 10,692
Mean catch / day / fisher (range)
34 (4-134)
12 (1-35)
26 (1-134)
23 (2-170)
21 (0.5-335)
22 (0.5-335)
302.4 (2-
3577)
98 (1-796)
200 1-
3577)
49 (4-
179)
68 (0.5-626)
59 (0.5-626)
Unfortunately, sampling has not been systematic and key information has been omitted. This information includes the proportion of boats surveyed, the number of days when no boats landed, the number of hours that landings data was collected, the time of day, etc. This data is expected to have covered less than half of actual landings. As a result, this data is not reliable and cannot be used to extrapolate landings estimates for the island of Andros. Similarly, there has been little record of the numbers of conch, sponge and crab transported to Nassau and processors in Nassau also not reported the proportion of landings they take from fishers in Andros. Consequently, it is very difficult to generate fisheries estimates from these data. Fortunately, there is increasing research starting to emerge. For example, a 2008 study looked at the habitat quality, distribution and export of land crabs from certain parts of North Andros (Gardiner, 2008).
c) Water resources on Andros
The freshwater aquifers on Andros (and most Bahamian carbonate Islands) are the Ghyben-Hertzberg type lenses whose thickness is primarily dependent on the width and elevation of the islands (Cant and Weech, 1986). The Bahamas Land Resources Survey conducted between 1969 and 1975 mapped out water resources in North and Central Andros and in 2004 the US Army Corps of Engineers compiled a complete Water Resources Assessment for the Bahamas, including Andros. Creeks are common in Andros where the water lens is typically only a metre below the surface. Surface water features make up 11% of the area on Andros and wetlands another 6%. The freshwater flowing from interior land areas out to the west side of Andros is a critical process that maintains the ecosystem function of habitats for wading and migratory birds and numerous aquatic species such as tarpon and sharks. Neither the West side of the island, South Andros nor Mangrove Cay has been assessed for water resources. The North receives more rain and so contains the majority of the water reserves. Blue holes, which are result of the dissolution of carbonate bedrock are common to Andros. There are over 118 in North Andros alone. They can be 6-100m deep and often contain both freshwater and saltwater.
Andros contains the largest freshwater lens in the country. People on Andros have high water usage rates, perhaps due to the quality of the water and the prices, which are set artificially low by the government. Whilst many people are supplied by the Water and Sewage Corporation, others use private wells, which are inexpensive given the proximity of water lenses to the surface of the island.
11
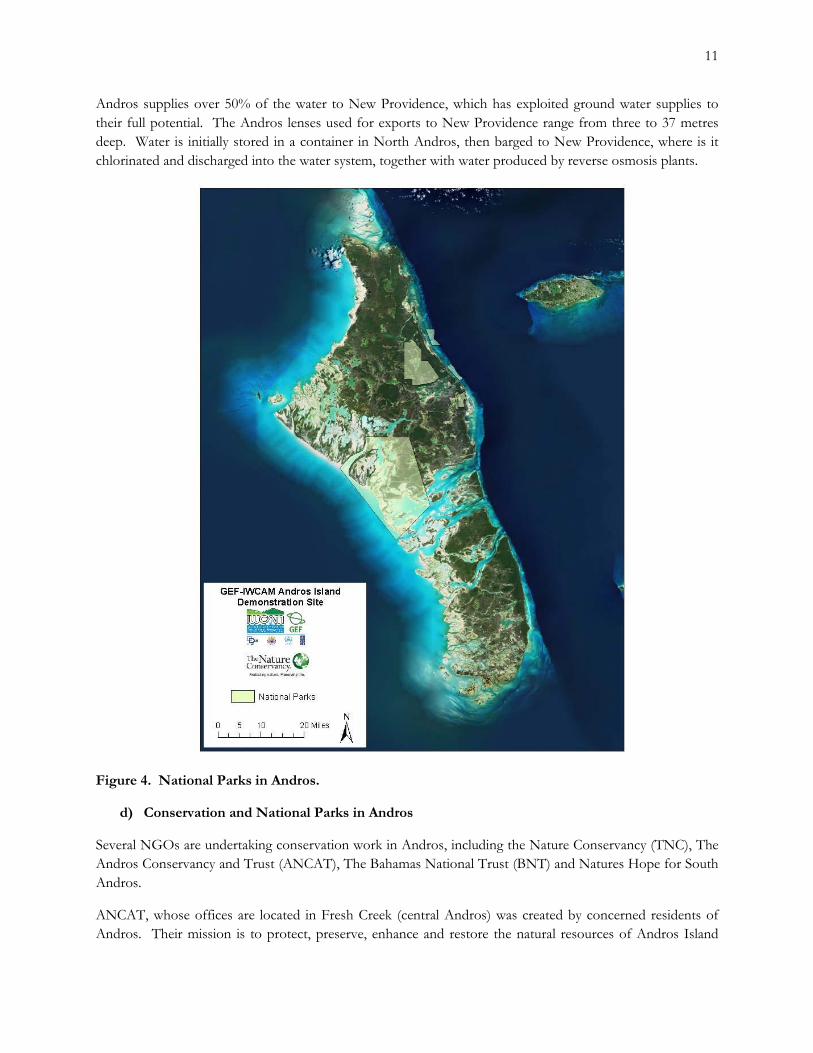
Andros supplies over 50% of the water to New Providence, which has exploited ground water supplies to their full potential. The Andros lenses used for exports to New Providence range from three to 37 metres deep. Water is initially stored in a container in North Andros, then barged to New Providence, where is it chlorinated and discharged into the water system, together with water produced by reverse osmosis plants.
Figure 4. National Parks in Andros.
d) Conservation and National Parks in Andros
Several NGOs are undertaking conservation work in Andros, including the Nature Conservancy (TNC), The Andros Conservancy and Trust (ANCAT), The Bahamas National Trust (BNT) and Natures Hope for South Andros.
ANCAT, whose offices are located in Fresh Creek (central Andros) was created by concerned residents of Andros. Their mission is to protect, preserve, enhance and restore the natural resources of Andros Island

12
and its marine environment through education, conservation and management. ANCAT led a five-year campaign to establish the Central Andros National Park. Currently, they are involved in a number of education initiatives, cleanup programs and plan to begin consultation for Andros’ National Parks, as well as a recycling program. ANCAT has developed a budget for its conservation needs, but has had limited success in fundraising.
Protected Areas are here defined as “any geographic area that has been legally granted special management rights over the use and protection of the natural resources.” The Bahamas National System of Protected Areas encompasses marine reserves, historical sites, terrestrial reserves and botanical gardens. The Bahamas National Trust (BNT) is a non-governmental and non-profit organization created by an act of Parliament in 1959 with statutory responsibility for 25 National Parks. BNT has experienced a financial loss every year since 2002 and income has fallen 28.5% over this time, hence increased funding is urgently needed to maintain and manage current Parks and to establish the new ones. BNT manages the five Andros protected areas (Figure 4). These PAs have very little infrastructure and lack management plans (although plans are underway for some parks). The Andros parks cover a large terrestrial area on the west side, an area of pine forest with numerous blue holes, two small marine Parks and a crab replenishment area. They were established in 2002 to preserve a total area of 64,834 acres of pine forests, mangroves, blue holes, tidal creeks, wetlands, reefs water and rare and endangered species.
Nature’s Hope for South Andros is recently established group run by people living in South Andros. Currently, their aims are limited to restoring a creek suffering from impacts of a road, which has thought to have negatively affected bonefishing nearby.
e) Threats to the Natural Resources of Andros
Current and emerging threats include water pollution, dredging and indiscriminant habitat clearing, all associated with unchecked development, as well as, fisheries declines from over-harvesting, invasive species, sewage, climate change and ocean acidification. Unchecked development, which typically involves habitat modification, dredging, wetland conversion and pollution is increasingly causing negative environmental consequences in Andros. These impacts include a reduction in water quality and damage to coral reef ecosystems as has occurred elsewhere in the Bahamas (Sullivan Sealy K, 1999). Alterations of the freshwater flows that impact estuarine characteristics of the creeks will impact the entire ecosystem and critical species such as bonefish. The state of the coast report assessed chronic stressors to the coast of Andros at 67 sites. They found that 41% were low impact areas, 35% medium, 16% high and 8% severely impacted (Sullivan Sealey & others, 2005). The highest impacted areas were in North Andros and in Driggs Hill, South Andros. Those greatest impacts were in areas developed for marinas or harbors. Thus there is a need for invasive species removal and mitigation efforts to restore coastal stability (Sullivan Sealey & others, 2005). There is also increasing interest in limestone extraction, which threatens the integrity of the water lens, as well as water quality, since it typically involves mining below the shallow water lens.
Fisheries are in decline generally in the Bahamas and are also reported to be in decline by fishers on Andros. There is a lack of monitoring of fish populations, so declines are unlikely to be noticed in time to reduce fishing pressure. As a result, there is an urgent need to conduct well-designed landings surveys to establish

13
current levels of extraction. In addition, there is almost no information on bonefish ecology and population health in Andros, nor on critical bonefish habitats and prey. Thus it is not certain if the apparent bonefish declines which have occurred in the Florida Keys have also occurred in Andros. Invasive species which have negative impacts include the Casuarina tree (which is a problem country wide), wild pigs, Brazilian pepper (Schinus terebinthefolious) and several aggressive grasses, notably Napier grass (Pennisetum purpureum) and scattered melaleuca (Melalueca quinquenervia) Invasives can alter habitats and cause declines in native, endangered and endemic species, such as the iguana, turtles and sharks. Solid waste disposal and point source chemicals pollution are also becoming an increasingly serious issue. Whilst some communities have lined landfill sites, the majority do not. The number of unlined dump sites and the frequency of indiscriminant dumping are increasing. This trend may cause significant ecosystem degradation as well as reducing water quality and scenic quality, which will reduce the recreational experience of visitors. Since two thirds of tourists are repeat visitors, environmental deterioration could deter future visits and have a significant impact on the local economy.
Lack of sewage collection and treatment is contaminating water supplies (US Army Corps and Engineers, 2004). Water level rises due to climate change are likely to result in saltwater incursion, also contaminating water supplies. Water is also subject to contamination with industrial and commercial effluents, coastal development including alteration of waterways and excavation of wetland areas. There are also no controls on the amount extracted, which could impact supply and costs. As water quality decreases its usefulness diminishes and quality of life can be reduced, for example through water-borne illness such as amoebic dysentery. In addition, lack of sewage treatment is a serious concern. Many tanks are improperly constructed and near private wells. Health impacts could be severe and could impact the tourist and agriculture industries if sewage contaminates water supplies. Conversely, a booming tourism industry could result in over-extraction, as tourists typically use 400-1000 litres of water/visitor day, in contrast to residential consumption of 150-200 litres /day.
In addition, climate change and its related problems of sea temperature increases and ocean acidification is expected to have a serious negative impact on marine ecosystems, especially coral reefs and their species, many of which are of huge commercial importance locally. Climate change is also expected to result in more hurricanes, which could cause huge ecological damage. Extreme weather events, sea level rise could also be a threat to water quality. The cost of repairs to the water supply and distribution system from hurricane Floyd was over $2 million. In 2004, hurricanes Frances and Jeanne caused significant storm surges in Grand Bahama and Andros. This increased chlorides in trenches in Northern Andros from 400 mg/L to as much as 15,000 mg/L in some well fields. Such surges also spread pollution into the sewage system. The SLOSH model for hurricane storm surges shows that Category 5 storms will be associated with storm surges of up to 20ft above sea level, hence this could contaminate water supplies throughout Andros with salt water, which would need to be pumped out. Since Andros is also low lying, sea level rise poses a critical threat in the longer term.
More research on the potential vulnerabilities of Andros to each of these threats is urgently needed, as is planning appropriate land and watershed use, management and policy. This is especially true given the significance of the island for potable water, agriculture and fisheries, and the fact that the water table lies only a few centimetres below the surface and is becoming increasingly contaminated. This problem is only expected to increase with future tourism development and climate change impacts.

14
Chapter 2.
Conceptual model of the Link between the Natural Resources of Andros and the Economy
In order to understand the economic value of the natural resources of Andros, a conceptual model was constructed. The first stage was to understand the link between values and the different habitats.
Table 3. The Economic Benefits Provided by Each Habitat Type on Andros. The number of stars denotes the strength of the benefit provided. Dashes show where the value is not supported.
Marine Wetlands Terrestrial
Coral Sea
grass Sandy bottom
Pelagic zone
Mangroves
Estuaries
Beaches
Pine forest
Coppice D
irect extractive use values
Fisheries *** *** * * *** ** - - - Materials ** - * - * - - ** * Food *** - - ** ** * - ** *** D
irect non-extractive use values
Tourism *** * - * ** ** *** ** * Recr. fishing * ** * * *** *** - - - Recreation ** * * * * ** ** * - Research *** ** * ** ** * * ** ** Education ** * - * ** ** ** ** * Indirect U
se Values
Waste treatment
* ** - - ** - - ** **
Sediment retention
- ** ** - ** - - - -
Carbon storage
** * - * * - - *** **
Coastal protection
*** - - - ** - - - -
Option &
non-use value
Biodiversity *** ** * * *** ** * *** *** Existence / Bequest of habitats, species, ways of life & landscapes
*** - - - * * ** ** *
Figure 5 illustrates the conceptual model. The model below shows how the habitats in Andros are linked by water. Fishing, tourism and other income generating activities result in direct economic impacts. Related spending results in indirect economic impacts, which then produce welfare benefits for a number of stakeholders. In addition, ecosystems services that flow from these healthy habitats produce gross economic values. Once costs have been subtracted, one can quantify net economic values enjoyed by a large number of local, national and international stakeholders. Related expenditures similarly result in direct and indirect economic impacts, welfare benefits. It’s important to note that ecosystem benefits include saving from avoided expenditures because natural materials are used by residents in place of goods that would have to be purchased if ecosystems were not intact, or because replacing many of these “free” services, such as those that contribute to human health, would incur significant costs.

15
Figure 5. Conceptual Model to show link between the Natural Resources of Andros, the Ecosystem Services, Expenditure, Gross and Net Ecoonomic Values, Economic Impacts, Welfare Benefits and Avoided Expenditures. Beneficiraies are shown in circles, costs in rectangles, and values and impacts in rounded squares.

16
Chapter 3. Economic Values and Impacts of the Natural Resources of Andros.
Introduction.
In this section, the economic benefits of the natural resources are characterized and then this information is used to quantity the economic value of the habitats found on Andros, as well as the economic contribution (impact) of activities associated with these natural resources. Finally, potential values and impacts over the next 25 years are considered.
Background.
The goals of the research are to estimate the net economic value of the natural resources on Andros and the economic contribution, or impact, of activities associated with these natural resources to the economy. Economic value and impact are not the same thing. In the case of value, costs are subtracted from benefits to quantify net benefits, known in economics terminology as consumer and producer surpluses. The ideal economic valuation would seek to measure total economic value (TEV), which spans the whole range of benefits: direct use, indirect use and non-use (see figure). Net values are measured in the form of producer surplus3 and consumer surplus4 values. In practise, time and budget constraints limit these valuations to only a few values, which are most easily measured. Economic valuation includes non-market values such as option and non-use values, which must be inferred indirectly from behaviour using revealed preference techniques5 or investigated using stated preference techniques6. Where there are inadequate resources to measure these values directly, “benefit transfer” can be used to generate rough estimates of potential values. Benefits transfer uses a metric, such as area or percentage change in an activity to apply values measured in one place to resources in another place.
Economic impact analysis uses input-output models to estimate discrete changes in money, jobs and taxes generated by an activity, focusing on gross, rather than net benefits. For example sales of conch create revenues and employment, stimulating local business investment and encouraging consumer spending. Economic impacts and contributions incorporate income, jobs and financial transfers between groups and are of interest as they are more tangible than some values and therefore may have a significant effect on local incentives and attitudes towards conservation. They can also be easier to capture than option and non-use values. Hence they can be more policy relevant than figures in traditional valuation studies. Economic impact also includes multiplier (indirect) impacts, as business that depend upon protected areas (say those catering to tourism or commercial fisheries) purchase labour, capital and other inputs. Workers, in turn, spend on housing, food, transportation, entertainment, etc. The multiplier impact is limited by the goods and services that can be supplied locally. If most of the inputs of production have to be purchased outside the local economy, the multiplier effect will be low. This is true for the Florida Keys as well as much of the Caribbean Islands, where most goods and services are imported.
3 The difference between revenues and costs of production, i.e. profits 4 The difference between willingness to pay and price actually paid 5 Such a travel cost methodology, which uses data on expenses incurred to visit an area, or hedonic pricing, which measures the impact of environmental variables on property prices. 6 Such as contingent valuation, which asks respondents their willingness to pay for or accept a loss of benefits from natural resources, or choice modeling, which looks at the impact of environmental attributes on values.

17
Figure 6. Constituents of Total Economic Value (from Munashinge, 1993).
Relevant Studies From Elsewhere
Over the last 30 years, a variety of studies have employed a range of methodologies to value habitats, species and natural resources. Initially these studies usually focused on consumptive and non-consumptive use values, which were relatively easy to measure. Non-use values and non-market values are now increasingly measured. Results have shown that often users enjoy significant welfare benefits, which help to justify continued conservation funding. Most recently, interest has grown in establishing the economic value of indirect use values such as water filtration, waste assimilation and carbon storage, especially in terms of avoided and replacement costs. Economists are, however, only able to conduct these kinds of analysis where good biophysical models have been published.
National, regional and global studies have been done to estimate values for large and/or unstudied areas, to draw attention to the economic benefits of ecosystem services. In 1997, Costanza and colleagues published a paper that attempted to quantify the global value of ecosystem services, using mean estimates taken from local case studies. This study has been largely discredited, since it did not take marginality of remaining habitat areas into account. Hence the values they quantified were considered too high. While these estimates

18
were in some ways crude, they did draw attention to the substantial and previously un-quantified contribution of ecosystem services.
A recent study found that the total annual value of ecosystem services (based on a measure called ecosystem service product) provided by the world’s coastal ecosystems (both natural and modified) was $25.8 billion (Martinez & others, 2007). The authors suggested that the terrestrial coast of the Bahamas was covered by 825 km2 of evergreen needleleaf, 400 km2 of evergreen broadleaf forest, significant areas of open shrub and savanna, 3124 km2 of cropland and 815 km2 of built up land (4.2% of area). In addition, the Bahamas was thought to have 3150 km2 of reefs and 1420 km2 of mangroves. Based on these area estimates, they valued the terrestrial area at US$5.1 billion per year and the aquatic systems at US$14.8 billion each year, meaning the total value was almost US$20 billion. This consisted of economic benefits from ecosystem services including climate and disturbance regulation, waste treatment and food production. This study used a measure called ecosystem service product (a measure which contains non-market values). See Appendix A1 for recommended further reading on natural resource valuation, as well as key valuation papers and reports for each type of habitat. In a further development of this approach, an analysis done in 2002 suggested that 89% of the total value of the Bahamas was generated by ecosystem service product ($37 billion) and 10% by traditional economic activity ($5 billion), which is reflected in GDP (Sutton and Costanza, 2002).
In addition to economic values, Martinez and colleagues quantified the gross financial revenue flows of activities that utilise natural resources. Economic impact analyses have shown that fisheries and eco-tourism can generate large income and employment benefits. It should be noted however that most of these figures overstate benefits, since they are gross values and authors do not make clear that costs (non-natural-resource inputs) associated with these economic activities can be large. A few examples of such studies:
In Florida coral reefs contribute toward an estimated US$1.6 billion in gross sales to the local economy each year (Jameson & others, 1995)
In 1990 tourism in the Caribbean generated $8.9 billion USD and employed 350,000 people (Holder, 1991)
Commercial reef fisheries in the Caribbean are worth US$310 million a year (Burke and Maidens, 2004)
In Massachusetts, tourists spent US$92.7 million on recreational fishing in 1998, resulting ultimately in nearly 3,300 jobs, $44.7 million in income, $3.6 million in state tax revenues, and $5.1 million in local tax revenues, which would be lost to others states if the fisheries disappeared (Storey and Allen, 1993)
In Namibia, the total direct and indirect economic impact of forest products used for fuel, poles, timber and non-timber had an estimated capital value of US$304 million and forest use directly contributed some three percent of the gross national product (Barnes & others, 2010)
Methods.
(a) Economic Values of Habitats
Initially, published literature, reports and interviews with key informants, including biologists and NGOs working in Andros, were used to establish which natural resources are present in the Island of Andros. TNC provided estimates of the major habitat types. Next, a literature review was used to glean estimates of the economic value of major ecosystem services for each type of habitat. This approach has been used by other
19
studies to identify potential values of unstudied ecosystems (Adger & others, 1995; Costanza & others, 2006; Krieger, 2001; Raheem & others, 2010), but is subject to a high degree of uncertainty and so the resulting figures should be taken as illustrative of habitat values. The original studies from which estimates are extrapolated are sometimes subject to error and their application to other sites is a speculative exercise, which is necessary due to time constraints and lack of data.
To transfer values, estimates were based on the area of each type of habitat found on Andros and average values of ecosystem services from each habitat. Where available newer values and those measured for habitats close to Andros were chosen over older or global values. Values from Florida were also prioritised, as it is only 300 km west of Andros and often the habitats are very similar. In addition, the great majority of tourists coming to Andros are from Florida or the US, hence individual values such as those associated with recreation are likely to be similar. Global estimates of values were avoided for those values known to be extremely site specific, such as recreational values and coastal protection. Instead, these were gleaned from Florida, the Caribbean and Central America wherever possible. Some values, such as non-use values and indirect values have rarely been measured or are highly uncertain, hence these were not included in the values tables unless the literature has reached some sort of consensus on their relative magnitude. In some cases, examples of such values from others places have been included in the notes to provide an idea of potential values. This issue is important, as non-use values can typically be larger than use values, but are often not included (Balasubramanian & others, 2003). In addition, some values are known to exist, but have, as yet, not been quantified. In these cases, they are included in the tables as unknown. For each value, the extent to which it is likely to be accurate in Andros is ranked from low to high, to help the reader interpret the values listed. Accuracy is related to the precision of methods used, as well as the number of relevant studies that have been done and the extent of variation in these values from different parts of the world. Even where potential non-use value estimates per person were available, it was not possible to know the population these would apply to; from Androsian residents, to those in the rest of the Bahamas, to those in the United States. Surveys of each of these groups are needed to establish this information.
Services based on area were all expressed in terms of value per km2. Values were converted to US$ for 2009, to adjust for inflation, to standarise studies from many different years. Some values were deemed to be more accurate based on the number of users. For example, recreational and consumer surplus values for reefs have been more accurately measured per individual, than based on area of habitat. In these cases, values per trip or tourist were used to estimate aggregate values, based on the number of tourists or activity days.
These calculations resulted in a table of values that are indicative of potential values of each type of habitat on Andros. Ideally, value transfer should involve the use of specific attributes of each habitat, fed into a model that has been validated for each type of habitat. There have been advances in these methods, but often they require accurate primary data. Given limits on available time and information for Andros research, formal value (or benefits) transfer was not possible here. Hence it should be stressed that the values presented are merely indicative of potential habitat values. Accurate estimates in Andros will require intensive research, more information on biophysical aspects of each type of habitat, as well as detailed data on uses and extraction by tourists and residents. In each case, estimates taken were ranked in terms of their likely accuracy in the case of Andros, as low, medium and high. When considering this accuracy, several factors were taken into account: the similarity of the habitat to that in Andros, the extent of understanding about the way in which the value occurs, the number of studies which have measured the value, the amount of variation in terms of values estimated in the literature and the quality of the original study (methods used, number of replications).

20
Using the area estimates, aggregated values by habitat were estimated. This aggregation implies a comparison between the current situation and a scenario in which the island’s habitats cease to exist entirely, rather than valuing some incremental change in the extent of a habitat in Andros. An analysis of incremental change would require the use of marginal values – the net benefits that would be lost due to destruction of the next area of habitat. In the former, aggregate scenario, the simplifying assumption of average values for the entire area of habitat is adequate. In order to examine the economic value of these habitats over the next 25 years, the annual benefits were discounted 7. This approach assumes business as usual, rather than increases or decreases in certain activities, which may not hold in reality. For example, certain resources may become more scarce or degraded, or tourism visitation could increase or decrease. Discount rates are also highly contentious, so a sensitivity analysis was used, with real (inflation adjusted) discount rates of 1%, 3% and 5% 8. However, to complicate matters, it is likely that the value of the habitats in Andros will rise over time, over and above inflation. This is because high-quality habitats become increasingly scarce over time, so the value of any high quality of habitats increases in real terms. Growth in values can reduce or even counteract the discounting of value over time (Hoel and Sterner, 2007). Hence we also do a sensitivity analysis to assess the impact of a 1% and 2% increase in relative value of these resources.
(b) Economic Contribution to the Economy of Activities using Natural Resources
For the economic impact assessment, reports and published literature were used to obtain background information on the types of revenues associated with the natural resources on the island. Then field trips were conducted to each of the major communities on each bight. A total of 64 semi-structured interviews and many hours of observation were done with residents of Andros, between the months of March and May, 2010. These were conducted at places of work or at home, using a snowballing sampling strategy, where interviewees gave information about where to find people employed in various livelihood strategies. Interviews took between 20 minutes and an hour and included males and females from the ages of 16 to 80. These interviews were supplemented with key informant interviews with industry or community leaders. Observation and interviews were used to establish several pieces of critical information:
‐ the extent and health of the natural resource and changes over the last 20 years ‐ the number of people engaged in each type of activity, both full time, part time and occasionally, and
the frequency with which they undertook the activity ‐ the gross and net revenues gained from each activity-day or per year ‐ related expenditures such as equipment ‐ attitudes towards the resource and protected areas
Fisheries information was supplemented by landings data provided by the Department of Marine Resources, as well as the records of the major fish export companies, who regularly buy from Androsian fishers. This was important since fisheries are so variable and hard to estimate, given poor local sales and landings data. In addition, a tourism survey was conducted at all the major hotels and lodges, to establish information on numbers of staff and the number of people conducting specific types of tours, such as snorkeling, or visits to blue holes (see appendix for full survey).
7 Discount rate is the rate at which society as a whole is willing to trade off present for future benefits and is used to reflect the fact that benefits received in the future are not valued as much as those received today. 8 Discount rates are high contentious and vary depending on whether social considerations are relevant. Using a sensitivity analysis allows researchers to assess the changes in conclusions draw from using different discount rates

21
This information was aggregated to construct a table with estimates of gross revenues for each activity, as well as the full- and part-time employment created by each type of activity related to natural resources on Andros. This table was presented to a number of people who live and work in Andros, in a workshop in Nassau Bahamas on the 18th June 2010 for validation and to increase the accuracy of the impact estimates. This workshop featured lively discussion and the revision of several estimates. It was assumed that all tourism is related to the natural resources, since all lodges reported that tourists came to do recreational fishing, diving, snorkeling, birdwatching or (much more rarely) simply to enjoy beach days. Data was then used to calculate direct economic impact. In order to account for the indirect and induced effect of natural resource related revenues, an economic multiplier of 25% was used, the low end of a range suggested by Cesar and others ( 2003a). This multiplier suggests that every dollar spent in Andros leads to $0.25 of additional economic activity, such as on spending by lodges, purchasing of fishing equipment or household spending. This is a relatively conservative value and one which is lower than that employed by other impact studies in the Bahamas. For example, Fedler (2010) uses 102% for an analysis of flats fishing in the Bahamas, while Sacks and Britton (2007) use 60% for the financial service industry in the Bahamas. Multipliers are contentious, as the indirect impacts of spending vary widely, by industry and location and depend on the extent to which revenues are leaked out of the national economy. In Andros, there is thought to be relatively low leakage, as most of the businesses are owned by Androsian residents and there is relatively little movement in and out of the island. In addition, imported products incur high import duties, which create revenues for the Bahamian government. As with the economic valuation, discount rates of 1%, 3% and 5% were used to examine the impact of these activities into the future, given business-as-usual as an underlying assumption. See appendix A2 for recommended further reading on value transfer, economic multipliers and discount rates.

22
Results.
In this section we summarise the main habitats and species with ecological or economic significance on Andros which have (based on the Conservation Assessment).
a) Characterisation of the Major habitat types of Andros.
Habitat Ecological significance Economic significance Threats Dry broadleaf evergreen forest
Superior quality dwarf scrublands, shrub lands, woodlands and forest Includes rare old growth forest Highest levels of terrestrial biodiversity Endemic orchids Habitat for threatened land crabs & ferns Feeding, breeding and nesting habitat for resident and migratory birds
Forestry, agriculture, water (under pinewood and coppice areas) Palms for thatch, plait and baskets Medicinal plant species Wood carvings Land crabs
Infrastructure development Slash & burn for agriculture Invasive species
Pine woodland (wet, moist, dry)
Pinus caribaea var. bahamensis is endemic Rare & endemic species such as Bahamian boa, Andros rock iguana, Atala hairstreak butterfly, orchids Resident & migratory bird habitat
Water well fields, wood (heavy, hard, insect resistant) Pine for construction Medical species
Pollutants Hurricanes Fire regime changes Logging (last clear cut in 70s) Invasive species (boar and cow trample) Infrastructure development Tourism related development
Mangrove communities and saltwater wetlands
4 species mangrove (red, black, white, buttonwood) Breeding habitat for terrestrial & marine species Nursery and feeding habitat for marine species Assimilation & filtration of pollutants Land building through accumulated sediments Storage and recycling of organic matter, nutrients & pollutants Export of organic matter and nutrients Carbon sequestration and storage Water catchment and groundwater recharge
Shoreline protection and erosion control for properties and businesses Fisheries support and enhancement Water provision for local use and barging to capital Eco-tourism Soil for agriculture
Coastal development Pollution Overharvesting Artificial dikes or causeways Hurricanes Sedimentation (esp. tidal creeks and east coast)
Seagrass beds Organic carbon production and export Nutrient cycling Sediment stabilization Enhanced biodiversity Trophic transfers to adjacent habitats
Fisheries Sediment and nutrient runoff Physical disturbance Invasive species Commercial fishing aquaculture Overgrazing Algal blooms Global warming

23
Beaches Feeding, breeding & nesting habitat for resident & migratory birds Nesting ground for sea turtles Erosion control
Tourism Shoreline protection Construction material
Hurricanes and storms Invasive plant species Sand mining Destruction of sand & seagrass Ocean acidification Garbage
Barrier reef Patch and fringing reefs with high extent coral cover High levels coral growth, low incidence coral disease and low level anthropogenic impacts Habitat for lobster, conch, snapper and grunts, migratory species, finfish, bonefish, sponges etc. High biodiversity Nutrient cycling
Fisheries Tourism
Sea temperature rise (bleaching) Ocean acidification Water pollution Sedimentation Hurricanes and storms Over-fishing Diver damage Pollution Coastal development Dredging and sand mining
Soft bottom sea floors
Feeding, spawning and nursery grounds for commercial and recreational fisheries species Primary production Sediment sink and trap Binding & oxygenating sediments Nutrient cycling Shorebirds & seabirds
Commercial fisheries Bonefisheries
Reef destruction Alteration of waterways Dredging and sand mining Dredging disposal Pollution Physical structures
Blue holes Rare and specialized species, e.g. cave fish & shrimps Bio-processes poorly understood
Tourism Water
Solid sewage & waste Development Storms
Freshwater Water lenses (bodies) exist in limestone aquifers (underground layer of water-bearing permeable rock) under pine forest Necessary for all ecosystems and species Sensitive to changes in rainfall induced by forest cover Complex ecological linkages with wetlands and blue holes (which are poorly understood)
Largest freshwater lens in the Bahamas. Supplies 55% of water supply to New Providence (approx. 110,000 people) Supplies water for household use, agriculture, schools and businesses in Andros Contributes to fly fishing industry
Lenses are porous & near surface Absence of land use planning Lack of monitoring Pollution and contamination Salt water incursion Mining projects / development Waste Sewage from cesspits, poor quality septic tanks, cruise ships & yachts Forests and wetland habitat loss Over-extraction Alteration of water ways

24
b) Characterisation of specific species of ecological or economic importance. Species Ecological significance Economic significance Threats Bonefish (Albula vulpes) Life history largely unknown Bonefishing industry is
major employer Mangrove destruction, dredging & sand mining, erosion, Pollution (sewage, water quality) Physical structures
Flamingos (Phoenicopterus ruber ruber)
Rare and endangered species in appendix II of CITES. 2000 recently located in West side (Turner sound). Population was 30,000 in early 1900s.
Flagship value (national bird of the Bahamas) Protected under the Wild Birds Protection Act Potential tourism revenue
Declining fish populations Loss of breeding habitat Hunting (meat) Disturbance from planes or tourists
Hawksbill, green and loggerhead turtle
Rare and endangered species Snorkelling and diving Higher WTP
Overfishing of turtles and prey Low regional population numbers
Queen conch (Strombas gigas) Eastern shelf
Rare & endangered species (CITES appendix II) Nurseries located in intermediate density seagrass at 2-4 metres. Populations are critical to seagrass habitat health
Commercial and subsistence fisheries Souvenirs Decoration Building material
Overfishing Undersized conch taken No catch limit or closed season Pollution from development and sedimentation Sewage
Rock iguana (Cyclura cychlura cychlura)
Largest West Indian rock iguana Isolated and stable populations in South Andros Facilitates seed dispersal Maintains habitat for species, e.g. land crab & white crowned pigeon Endangered species (IUCN)
Hunted Protected under the Wild Animals Protection Act Option value from healthy populations of endangered species
Habitat reduction from development and invasive species incursion Feral hogs, dogs and cats Illegal hunting
Sea birds: Brown noddy (Anous stolidus), sooty tern(Onychoprion fuscata), bridled tern (Sterna anaethetus), white tailed tropic bird (Phaeton lepturus), Audubon Shearwater (Puffinus lherminieri)
Highly reduced populations 20% of seabirds globally are threatened with extinction
Bird tourism Bird hunting
Development leading to habitat destruction Human disturbance of nesting and foraging sites Invasive species Pollution Egg collecting
Land crabs: White (Cardisoma guanahumi); Black (Gecarcinus ruricola)
Large populations Spawn June to September
Income and food for Androsians Export market
Overharvesting, especially before reproduction Habitat loss due to development on mangrove and coppice
Marine mammals (dolphin, manatees, minke whales, pilot whales, sperm whales); pelagic fish (sailfish, marlins)
Influence on the structure and function of aquatic communities, as consumers or predators, although these relationships remain poorly understood Declines are known to indicate reduction in ecosystem health Endangered species
Increased visitor values Potential for whale watching industry
Ship traffic (propeller injury) Pollution (sewage, waste) Human competition Acoustic testing

25
Potential Values for Andros’ Habitats.
Forests.
Forests in Andros are subtropical dry forests. There are needleleaf forest (pine) and broadleaf (coppice). The majority of the old growth forest is found in Southern Andros. Some values are currently low, but could be much higher in the future. For example, forest recreation values, if forest-based tourism was increased. Forests in Costa Rica are estimated to have mean recreational values of $25,000/km2/year (Tobias and Mendelsohn, 1991). Based on the literature, a list of potential values that may apply to Andros’ forests has been generated. These are listed below in US$(2009). See appendix A3 for recommended further reading.

26
Table 4. Forest Ecosystem Service Values.
Service Provided US$ value / km2/ year Likely accuracy
Disturbance regulation 700 1 Medium
Water regulation 860 1 Medium
Water quantity 1,140 1 Medium
Erosion control 16,640 1 Medium
Soil formation 1,430 1 Medium
Genetic resources 5,860 1 Medium
Cultural value 2,80 1 Low
Carbon storage 17,136 2 Medium
NTFPs (food, raw materials) 19,820 3 Medium
Pest control 1000 4 Medium
Prevention of nutrient loss 1480 5 Medium
CS recreation 140 6 Medium
Option value 915 7 Low
Non-use (global) 714 8 Low
Nutrient cycling unknown 9 n/a
Non-use (community) unknown 10 n/a
Education and Research unknown n/a
Rare / endangered species habitat unknown n/a
Water filtration (quality) unknown n/a
Waste treatment unknown n/a
Total 68,115
Notes. 1 Based on global estimates from Costanza & others (1997). 2 Based on carbon values of 126tC/ha for subtropical dry forests and a mean value of C of $34/t, which reflects the social costs of carbon (Clarkson, 2000). It is assumed that Androsian dry forests store carbon to the same extent as other subtropical dry forests. This means that the standing forest has a carbon storage value of $428,400. However, if this value is not an annual value, as the forest cannot be cut down each year. If we assume that part of the forest is cut down, over a twenty five year period, then we get the annualized value used here. 3 NTFPs include food and forest materials, such as palm and fruits and materials for construction of fish traps. Estimates vary from $30 – 330/ha. Here I use mean values from Mexican forests of $198/ha/yr (Alcorn, 1989) as forests in Andros produce similar products. Since people in Andros gather large amount of fruit and palm from their forests, the NTFP estimate is likely to be too low for those areas that are easily accessible, but high for those on the West coast that are less so. 4 (Krieger, 2001). 5 Valued based on fertilizer prices and nutrients in forest biomass in Guatemalan forests (Ammour & others, 2000). 6 Values vary widely depending on level of visitation, uniqueness and nearby substitutes. Here we use a conservative estimate of $1/ha from Mexican forests (Adger & others, 1995). 7 Based on $9.15 /ha reported for Mexican forests (Adger & others, 1995). 8 Based on implied estimate of global WTP based on debt for nature swaps (Pearce, 2001). 9 Costanza and colleagues (1997) suggest that nutrient cycling has a value of $14,180 /km2 /year, however these estimates have been criticized as inaccurate, hence they are not included here. 10 These have been estimated per household in the US as $10 for existence and $14 for bequest values Sutherland (Sutherland and Walsh, 1985), or in Sri Lanka as 0.2% and 0.4% of local household incomes (Gunawardena & others, 1999).
27
Coral Reefs
By one estimate, the total net benefit per year of the world’s coral reefs is US$100,000 -600,000 /km2 /year, which is $29.8 billion, based on median value estimates. Tourism and recreation account for $9.6 billion of this amount, coastal protection for $9.0 billion, fisheries for $5.7 billion, and biodiversity for $5.5 billion (Cesar & others, 2003b). The Bahamas is estimated to have a total reef area of 3,580km2. The Andros barrier reef is the third largest barrier reef in the world (with an area of almost 270 km2) and hence represents a huge natural endowment for the Bahamas. Potential values associated with reefs include the coastal protection of US$246,000-836,000 /km2 (Berg & others, 1998), mean recreational reef value in the Caribbean of $34,895 /km2 (Cesar, 2003), as well as reef fisheries potentially worth US$15,000-150,000 /km2 /year, based on catch values of US$1-10 /kg/km2 (Talbot and Wilkinson, 2001). Recorded reef-related fisheries landings in the Bahamas (possibly only 60% of all that is landed) were US$53 million in 2009. This figure suggests that Andros barrier reef supplies 10% of the catch for the Bahamas. Option values for reefs could also be large, as coral reef organisms are a reservoir for bio-medically important substances (with antiviral, antifungal, antibacterial and anti-inflammatory properties), bio-degraders, antifouling and anticorrosion substances, biosensors, biocatalysts, biopolymers and many other potentially important compounds and products. Many of these uses are yet to be discovered. Sri Lanka’s coral reefs have been valued at between US$140,000 - US$7.5 million /km2 over a period of 20 years (Berg & others, 1998). However, these studies show that values are highly variable and local studies are still needed to increase the accuracy of value transfer (Brander & others, 2007). Some of the largest values associated with these reefs could not be estimates, such as local recreational values, option and non-use values. Based on the literature, a list of potential values that may apply to Andros’ reefs has been generated. These are listed below in US$(2009). See appendix A4 for recommended further reading.
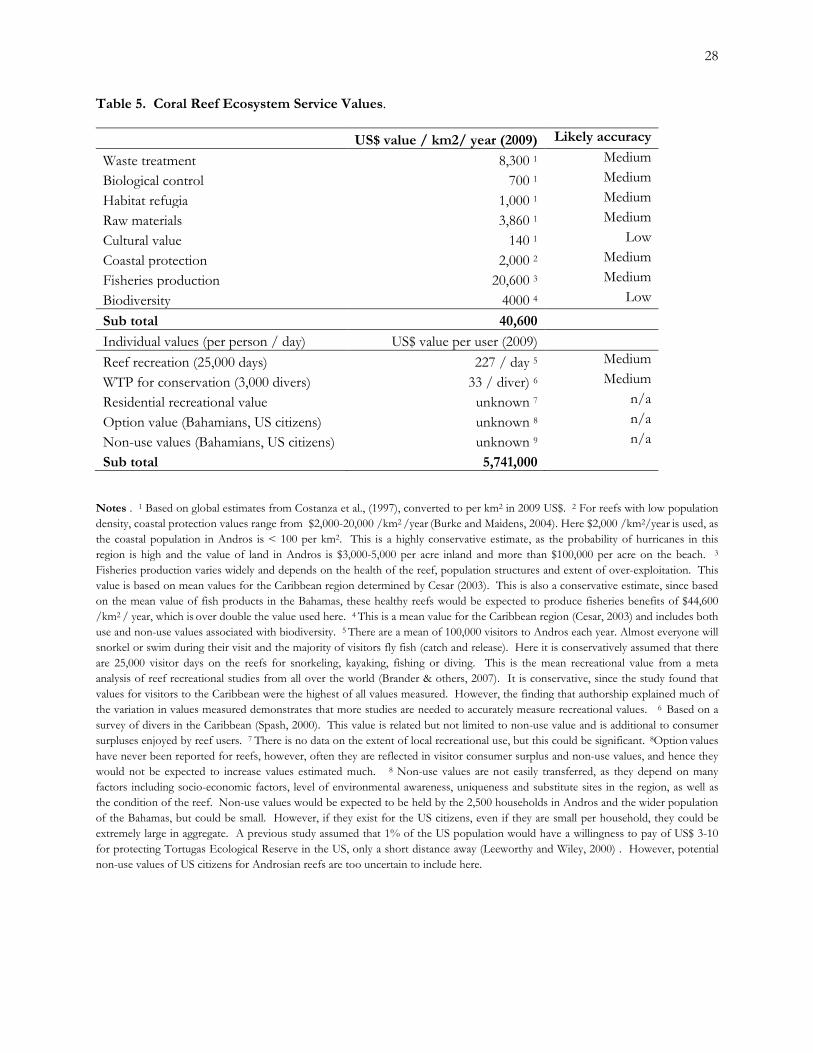
28
Table 5. Coral Reef Ecosystem Service Values.
US$ value / km2/ year (2009) Likely accuracy
Waste treatment 8,300 1 Medium
Biological control 700 1 Medium
Habitat refugia 1,000 1 Medium
Raw materials 3,860 1 Medium
Cultural value 140 1 Low
Coastal protection 2,000 2 Medium
Fisheries production 20,600 3 Medium
Biodiversity 4000 4 Low
Sub total 40,600
Individual values (per person / day) US$ value per user (2009)
Reef recreation (25,000 days) 227 / day 5 Medium
WTP for conservation (3,000 divers) 33 / diver) 6 Medium
Residential recreational value unknown 7 n/a
Option value (Bahamians, US citizens) unknown 8 n/a
Non-use values (Bahamians, US citizens) unknown 9 n/a
Sub total 5,741,000
Notes . 1 Based on global estimates from Costanza et al., (1997), converted to per km2 in 2009 US$. 2 For reefs with low population density, coastal protection values range from $2,000-20,000 /km2 /year (Burke and Maidens, 2004). Here $2,000 /km2/year is used, as the coastal population in Andros is < 100 per km2. This is a highly conservative estimate, as the probability of hurricanes in this region is high and the value of land in Andros is $3,000-5,000 per acre inland and more than $100,000 per acre on the beach. 3
Fisheries production varies widely and depends on the health of the reef, population structures and extent of over-exploitation. This value is based on mean values for the Caribbean region determined by Cesar (2003). This is also a conservative estimate, since based on the mean value of fish products in the Bahamas, these healthy reefs would be expected to produce fisheries benefits of $44,600 /km2 / year, which is over double the value used here. 4 This is a mean value for the Caribbean region (Cesar, 2003) and includes both use and non-use values associated with biodiversity. 5 There are a mean of 100,000 visitors to Andros each year. Almost everyone will snorkel or swim during their visit and the majority of visitors fly fish (catch and release). Here it is conservatively assumed that there are 25,000 visitor days on the reefs for snorkeling, kayaking, fishing or diving. This is the mean recreational value from a meta analysis of reef recreational studies from all over the world (Brander & others, 2007). It is conservative, since the study found that values for visitors to the Caribbean were the highest of all values measured. However, the finding that authorship explained much of the variation in values measured demonstrates that more studies are needed to accurately measure recreational values. 6 Based on a survey of divers in the Caribbean (Spash, 2000). This value is related but not limited to non-use value and is additional to consumer surpluses enjoyed by reef users. 7 There is no data on the extent of local recreational use, but this could be significant. 8Option values have never been reported for reefs, however, often they are reflected in visitor consumer surplus and non-use values, and hence they would not be expected to increase values estimated much. 8 Non-use values are not easily transferred, as they depend on many factors including socio-economic factors, level of environmental awareness, uniqueness and substitute sites in the region, as well as the condition of the reef. Non-use values would be expected to be held by the 2,500 households in Andros and the wider population of the Bahamas, but could be small. However, if they exist for the US citizens, even if they are small per household, they could be extremely large in aggregate. A previous study assumed that 1% of the US population would have a willingness to pay of US$ 3-10 for protecting Tortugas Ecological Reserve in the US, only a short distance away (Leeworthy and Wiley, 2000) . However, potential non-use values of US citizens for Androsian reefs are too uncertain to include here.
29
Mangroves
Estimates of the economic value of mangroves are extremely variable, which is due in part to differences to the value of coastal protection they offer shorelines with different levels of development, as well as their environmental quality and context. The majority of studies have been carried out in Asia. Ranges reported typically vary from US$200,000-900,000 / km2. In American Samoa, mangroves have an estimated value of US$104,000 /km2 (Spurgeon and Roxburgh, 2005), however in Thailand, they were estimated to be US$2.7 - $3.5 million /km2 (Sathirathai and Barbier, 2001). No studies have assessed the value of ecological services from mangroves in the Caribbean region. Mangroves provide firewood, construction materials, household and fishing materials, as well as food such as fish and crabs. As a result an estimated 26% of mangrove habitats are degraded because of over-exploitation (Valiela & others, 2001). Up to 80% of global fish catches are thought to be directly or indirectly dependant on mangroves (Sullivan, 2005). One estimate in the United States is US$6,200 /km2, compared to US$60,000 /km2 in Indonesia (Bann, 1997). Estimates of the annual market value of capture fisheries supported by mangroves ranges from US$75,000-1,675,000 /km2 /year and US$47,500–533,000 /km2 /year for the market value of commercial fish species utilising mangroves as habitat (Ronnback, 1999). However, here we use the more conservative lowest estimate of the annual market value of seafood from mangroves of US$7,500-167,500 /km2 /year (Millennium Ecosystem Assessment, 2005). Hence the value of fisheries generated is a minimum estimate. A study carried out in the tsunami-affected districts of Sri Lanka shows clearly that mangroves did play an important role in storm protection, but that this protection depended on the quality of the mangrove habitat. Degraded habitats or habitats with mangrove-associated species instead of true mangrove species did not provide as much protection (Dahdouh-Guebas & others, 2005). Whilst mangroves can generate significant recreational benefits, these have yet to be developed in Andros, hence they are not included here. Based on the literature, a list of potential values that may apply to Andros’ mangroves has been generated. These are listed below in US$(2009). See appendix A5 for recommended further reading.

30
Table 6. Mangrove Ecosystem Service Values.
Service Provided US$ value /km2
/year (2009) Likely accuracy Fisheries support 8,100 1 High Carbon storage 2,054 2 High Water filtration 943 3 High Coastal protection 9,100 4 Low Biodiversity 2,270 5 Medium Local uses 4,980 5 Medium Non-use 3,300 6 Low Nutrient cycling unknown 7 n/a Raw materials unknown 8 n/a Habitat refugia unknown 9 n/a Water catchment, groundwater recharge unknown n/a Topsoil formation & fertility unknown n/a Total 30,747
Notes. 1 This is the lowest end of the range of the value of the annual market value of seafood from mangroves of US$7,500-167,500 /km2 /year (Millennium Ecosystem Assessment, 2005). There is limited tourism in Andros’ wetlands, apart from that associated with fishing, to which this value refers, as well as commercial fisheries. 2 Based on a primary productivity of mangroves of 15.1t C / ha / yr (Sathirathai, 1998) and a mean value of C of $34/t, which reflects the social costs of carbon (Clarkson, 2000). This figure has been annualized, as avoided carbon emissions would not occur each year. 3 Taken from a analysis in Fiji (Lal, 1990). 4 Coastal or storm protection, disturbance regulation, erosion control and flood prevention are all linked, although the exact definitions and relationship are unclear. Erosion control was estimated to be $32,700 /km2 /year, coastal protection $109,000 /km2 / year (Gunawardena and Rowan, 2005), flood prevention as $296,400 /km2 /year (Emerton and Kekulandala, 2002) and storm protection as $1,048,000 /km2 /year (Batagoda, 2003) all in Sir Lanka, where populations are larger, but land prices would be expected to be lower. More recent estimates from Southern Thailand suggest coastal protection values of $449,000 /km2 /year (Sathirathai and Barbier, 2001). Here we use a relatively more conservative value of storm protection of US$9,100 /km2 /year, based on mangroves in Sri Lanka (UNEP and PA, 2003). We do not estimate related values of disturbance regulation, erosion control and flood prevention to avoid double counting. 5 Based on an analysis in Indonesia (Ruitenbeek, 1992). 6 This is based on a meta-analysis of 30 contingent valuation studies based in North America and Europe (Brouwer, 1999). See Wattage and Mardle (2008) for estimates of non-use values from Sri Lanka. 7 Nutrient cycling values have been estimated as $956,850 /km2 by Costanza and colleagues (1997), but these are too uncertain to include here. 8 Raw material values have been estimated as $23,150 /km2 by Costanza and colleagues (1997), but these are too uncertain to include here. 9 The global estimate of $24,150/km2 is likely to be too high for Andros, hence it is not used.

31
Wetlands
A 2006 meta-analysis of wetlands valuation studies around the world found that the average annual value is just over $2,800 /hectare (US$280,000 /km2). The median value, however, is US$150 /ha /year (US$15,000 /km2) (Brander & others, 2006). The prediction of a wetland's value based on previous studies remains highly uncertain and the need for site-specific valuation efforts remains large (Woodward and Wui, 2001). The annual market value of seafood from mangroves has been put at US$7,500- 167,500 /km2 (UNEP-WCMC, 2006). Recreational consumer surplus values have been shown to be extremely large for certain wetlands. For example they were estimated a from $540.54 to $869.57 /trip in the Pantanal wetlands of Brazil (Shrestha & others, 2007), but this area has exceptional wildlife viewing possibilities, compared to most wetlands. Hence we have used a more conservative estimate here. Based on the literature, a list of potential values that may apply to Andros’ wetlands has been generated. These are listed below in US$(2009). See appendix A6 for recommended further reading.

32
Table 7. Wetland Ecosystem Service Values
Service Provided US$ value /km2 /year (2009) Likely accuracy
Amenity 1,210 1 Low Water generation 2,000 2 Low Biodiversity 7,060 2 High Non-use 3,300 2 Medium Carbon storage 12,568 3 Medium Recreational CS 3,300 4 Medium Waste treatment unknown 5 Medium Bird watching unknown 6 n/a Flood protection unknown 7 n/a Habitat refugia unknown 8 n/a Water quality unknown 8 n/a Fishing support unknown 9 n/a Storm protection unknown 10 n/a Nutrient cycling, N assimilation unknown n/a Option and non-use value unknown n/a Total 29,438
Notes. 1 Estimated using a meta-analysis of 39 peer reviewed publications (Woodward and Wui, 2001). The amenity value is based on increase property values as a result of being near a wetland (hedonic pricing). The authors warn that valuation methods influence values estimated. 2 This is based on a meta-analysis of 30 contingent valuation studies based in North America and Europe (Brouwer, 1999). Non-use values elsewhere have been reported to be 50% of total values for wetlands (Wattage and Mardle, 2008), hence the value used here is likely to be an underestimate. 3 This is an annualized value taken from an analysis of a salt water wetland system in Sri Lanka which suggests carbon sequestration values are $314,200 /km2 (Emerton and Kekulandala, 2003). 4 Based on an empirical study which measured recreational consumer surplus of a coastal wetlands area in Louisiana, USA (Bergstrom, 1990). 5 Globally estimated values of $596,900 are too high to be accurate in Andros (Costanza & others, 1997). 6 Meta-analyses elsewhere suggest this could be as high as $485,000 /km2 for wetlands (Woodward and Wui, 2001). However, since bird related tourism has yet to be established on Andros, this is a potential, rather than a current value here. 7 Woodward & Wui (2001) estimate the mean flood protection value to be $157,339 /km2, however this is likely to be for wetlands adjacent to lands with high property value and is too uncertain to apply to Andros and is also not included to avoid double counting, as it is also likely to be related to storm protection, which is used above. 8 Woodward and Wui (2001) estimated value of $122,512 /km2 / year associated with habitat refugia, $166,972 /km2 / year with water quality, but these are will not be as high in Andros. 9 Woodward and Wui (2001) estimated fisheries support values of $142,766 /km2 / year from wetlands. However, we already account for fisheries support values from reefs, mangroves and estuaries. Hence it is unlikely that the marginal contribution of wetlands in Andros is anywhere near as high as this number. 10 the majority of wetlands are internal to Andros, hence the storm protection values they generate are likely to be negliable, but these have been estimated as $94,848 /km2 / year elsewhere (Woodward and Wui, 2001).

33
Estuaries Estuaries provide a range of ecosystem services, including recreational bone-fishing. There have been relatively few studies on estuary values, other than a handful related to fisheries. For example, an analysis of U.S. commercial fishery landings indicates that estuarine species comprised approximately 46% by weight and 68% by value of the commercial fish and shellfish landed nationwide (Lellis-Dibble & others, 2008). Based on the literature, a list of potential values that may apply to Andros’ estuaries has been generated. These are listed below in US$ (2009). See appendix A7 for recommended further reading.
Table 8. Estuary Ecosystem Service Values.
Service Provided US$ value /km2
/year (2009) Likely accuracy
Raw materials 3570 1 Medium
Biological control 111.5 1 Medium
Fisheries support 23,218 2 Medium
Recreation 5,434 3 Medium
Nutrient cycling unknown 4 n/a
Waste treatment unknown 5 n/a
Habitat refugia unknown 6 n/a
Disturbance regulation unknown 7 n/a
Primary production unknown 8 n/a
Water regulation unknown n/a
Subtotal 32,334
Fishing CS 88.8/day 7 Medium
Subtotal 2,220,000 Notes . 1 Based on global estimates from Costanza et al., (1997). 2 Based on a study based in Lousiana (Costanza & others, 1989). 3
Taken from a study that surveyed recreational fishers in The South Eastern United States (Bell and Leeworthy, 1997). Recreational fishing consumer surplus in Florida has been shown to range from $113-136 / day (McConnell and Strand, 1994). This is the lower estimate for a similar study based on travel cost data (Bell and Leeworthy, 1997). 4 Costanza and colleagues’ (1997) estimate of $3 million /km2 is considered too high to be accurate. 5 Raheem and colleagues’ (2010) estimate of $617,500 /km2 is considered too high to be used for Andros. 6 A study which collated valuation work from a number of studies to estimate the value of California’s coastal ecosystems of $47,242 /km2 / year (Raheem & others, 2010), but there is inadequate understanding of Andros’ estuary biodiversity to know if the value is as high there. 7 Global estimates from Costanza et al., (1997) of $81,000 /km2 / year are likely to be a large over-estimate. 8 Estimated values of $333,679 /km2 / year from Lousiana (Costanza & others, 1989) are likely to be a large over-estimate in Andros, as the extent of industries related to estuaries are much fewer. 9 Here it is assumed that there are 25,000 fishing days (out of 100,000 visitor nights), based on the tourism survey responses.

34
Seagrass. In 1990, Thorhaug suggested that seagrasses had a direct and indirect use value of $215,000 /ha / year ($34.8 million /km2 in 2009$). However this figure is likely to be too high. There has been little seagrass economic valuation since then, despite the fact that seagrass is known to provide critical ecosystem services for fisheries and biodiversity. Based on the literature, a list of potential values that may apply to Andros’ seagrass habitats has been generated. These are listed below in US$(2009). See appendix A8 for recommended further reading. Table 9. Seagrass Ecosystem Service Values.
Service Provided US$ value /km2 /year (2009) Likely Accuracy
Raw materials 290 1 Medium
Nutrient cycling unknown 1 n/a
Habitat refugia unknown n/a
Fisheries support unknown n/a
Sediment stabilization unknown n/a
Enhanced biodiversity unknown n/a
Carbon sequestration unknown n/a
Total 290 Notes . 1 Based on global estimates from Costanza et al., (1997). They also estimate the value of $2.7 million /km2 of seagrass from nutrient cycling, but this is likely to be inaccurate, hence it is not included here.

35
Beaches Bundled attributes for beaches are thought to vary from US$3.6 million - 8.3 million /km2 (Raheem & others, 2010) . Based on the literature, a list of potential values that may apply to Andros’ beaches has been generated. These are listed below in US$(2009). However, since the values below seem large and the number of recreational beach days is unknown, here we use the lower end of Raheem’s bundled values estimate. See appendix A9 for recommended further reading. Table 10. Beach Ecosystem Service Values.
Service Provided US$ value / km2/ year (2009) Accuracy
Erosion regulation unknown 1 n/a
Resident beach recreation unknown n/a
Land formation unknown n/a
Option value unknown 2 n/a
Non-use unknown 2 n/a
Subtotal unknown
Tourist Beach recreation (CS) 24.17 / day 3 Medium
Subtotal 604,250 Notes. 1 Values generated from analysis of beaches in the USA, suggest values of $7.7 million /km2 / year (Costanza & others, 2006), however this value is unlikely to be similar in Andros. 2 Existence values were measured for New Jersey beaches as a one-time willingness to pay of $19 per non-visitor (Silberman and Williams, 1992), however non-use values for beaches in Andros could be very different, hence they are not estimated here. 3 CS estimates for beach days in Florida have varied from $6 -160 per day. A study by NOAA estimated CS per beach day for 2 beaches in Florida and found then to be $24.17 for one beach and $90.70 for another (Leeworthy and Wiley, 1994), which shows the variability of such values Features which determine the extent of these values include ease of access, crowding, quality of sand and availability of nearby substitutes. Beaches in Andros are clean with white sand and could well generate very high CS values, the lower value is used here. It is assumed that there are approximately 20,000 tourist beach days each year.

36
Wildlife. Additionally to habitat values, humans hold values for rare, endangered and charismatic species. Several studies have shown that these can be very large in the aggregate. A few examples relevant to wildlife in Andros, include
Household WTP of US$23.66 for habitat for endangered species protection of the Northern spotted Owl in the US (Rubin & others, 1991)
Value of flamingos viewing (questions were designed to distinguish from other types of wildlife viewing) in Okavango wetlands of US$285/visitor/annum (Mladenov & others, 2007)
WTP $30.24 per person in additional trip expenditures to see flamingos in a national park in Kenya (Navrud and Mungatana, 1994).
Mean use and non-use value of US$38.25 per dolphin, $37 for grey whales, $19 per sea turtle and $240 per humpback whale, based on results from a meta-analysis (Richardson and Loomis, 2009).
Value of hunting deer: $53 for the first and $28 for the second in California (Livengood, 1983). It is unclear the extent to which such values are incorporated into recreational and non-use values of other habitats and the extent to which the habitats maintain viable populations of wildlife species. As a result, species related values are not added to habitat values, although they may be additional.

37
Water
Approximately 4.307 million m3 of water are stored in the water lens in North and Central Andros (1.138 billion US Gallons). Water resources in South Andros and Mangrove Cay have yet to be investigated. In 2009, 150 million gallons of piped water was supplied to residents of Andros. This figure does not include all the extraction done in private wells. In addition, an average of 2.7 million gallons is shipped to the capital (New Providence) each day, a total of 934 million gallons in 2009. It has been estimated that 210 million gallons (445 acre feet) could be extracted each day from North and Central Andros if the resource is properly managed, which is equivalent to 76.7 billion gallons per year. Water is not easily valued, since it is both a public good (when used for recreation or as habitat) and a private good (when consumed by households and businesses). The price of water typically reflects the supply costs, rather than being a reflection of its essentialness to life or its scarcity. The price is an even more misleading indication of value in places such as the Bahamas, where the government has set the price of water to be artificially low for welfare purposes. This policy typically results in overuse of the resource. Its value depends on physical characteristics of landscape and nearby human activity. Detailed demand studies can be carried out when there is data available about changes in demand over a time when price varies. Other studies determine the productivity of water, based on its contribution to agricultural or industrial output. Due to data limitations and to avoid double-counting values enumerated above, we focus solely on Andros water’s consumption by households and businesses in Bahamas. Market values are set by the government and are lower for out-island residents than those in Nassau. The gross value of Andros’ water at official prices is almost $16 million. The replacement cost for this water is $7.3 million. However, the net economic value of water provision by Andros is best estimated by the difference between the replacement cost and the current extraction and transport costs of Andros water. In Andros, the next alternative source of water would be from reverse osmosis plants (RO), which are increasingly used in Nassau (see background). The difference between this cost and the current costs associated with extraction and barging from Andros is $3.5 million each year. This is the net annual value of this water. Over time, the cost of production with RO will depend heavily on the cost of electricity, so this value will alter, but it is difficult to predict how much and in what direction. Currently, there is little market to use the maximum sustainable yield of water from Andros (210 million gallons per day or 77 billion gallons per year). Full sustainable extraction would be around 70 times the current volume used, with potential value of almost $250 million/year, based on the difference between current extraction cost and replacement costs. This could also have a gross market value of US$1.24 billion. If the rate of water extraction increased at 1% a year and we assume that prices of RO and extraction remained the same, this would provide an additional net benefit of $350,000 each year (and a gross market value of $1.7 million per year). See appendix A10 for recommended further reading.

38
Table 11. Water Value for current water extracted in Andros for use of residents and in the Capital.
Cost / Value data Current Value ($) Volume taken in 2009 to capital 934 million gallons Volume supplied to Andros 150 million gallons Total volume extracted 1084 million gallons Market value 1 14% charged lower rate 15.83 million Extraction cost 2 $3.50 per 1000 Gas 3.8 million Replacement cost 3 $6.74 per 1000 Gas 7.3 million Replacement - extraction cost $3.24 per 1000 Gas 3.5 million
Notes. 1 Water rates are a mean of $4.13 per 1000 Gas in Andros (which received 150 million gallons) and $16.28 per 1000 Gas in New Providence (which received 934 million gallons). 2 Including barging costs to Nassau and excluding capital cost recovery, due to lack of available data. 3 Replacement cost with the second most likely production method, here reverse osmosis on New Providence.

39
Aggregated Values by Habitat Using area estimates for each type of habitat on Andros, as well as estimates of the number and type of activity days, we can aggregate these values by habitat (table 12). In general, the habitats in Andros are estimated to be providing $46,000 of net annual benefits in terms of ecosystem services, to people within Andros and beyond. Habitats which tend to generate large values per area are beaches, forests, coral reefs and estuaries. On Andros, the most extensive habitats are forests and wetlands, followed by estuaries and seagrass beds. The implied values for the whole area vary and amount to $260 million each year. Of the services estimated, carbon storage is shown to be the most valuable, followed by raw materials (wood, food, fuel), other services (option value, soil formation). The relative contribution of each habitat and type of service is shown in figures 7 and 8. In addition, water resources generate a net value of $3.5 million each year. Table 12. Aggregated Economic Values of Androsian Habitats in US$ for 2009
Forest Coral reef Mangrove Estuaries Seagrass Beach Wetlands Total % Implied value per km2 68,115 62,065 30,747 37,802 290 93,682 29,439
$46,000 (mean)
Cultural 634,200 37,660 0.7 mill 0% Pest control 2,265,000 188,300 45,269 2.5 mill 1% Water 4,530,000 418,692 4,070,000 9 mill 4% Disturbance regulation 1,585,500 538,000 4,040,400 6.2 mill 2% Biodiversity 13,272,900 1,076,000 1,007,880 14,367,100 30 mill 11% Other 46,353,225 2,501,700 49 mill 19% Carbon storage 38,813,040 911,976 25,575,880 65.3 mill 25% Raw materials 44,892,300 1,038,340 2,211,120 1,449,420 84,100 50 mill 19% Non-use 1,617,210 99,000 1,465,200 6,715,500 10 mill 4% Fisheries 5,541,400 3,596,400 9,426,508 18.6 mill 7% Recreation 317,100 5,675,000 4,426,204 604,250 9177850 20.2 mill 8% Total 154.3 mill 16.7 mill 14 mill 15.3 mill 0.08 mill 0.6 mill 60 mill 260 million % of total 59% 7% 5% 6% 0% 0% 23%
Figure 7. a) The Net Economic Value of Natural Resources by Habitat Type b) Proportion of Overall Habitat Values made up of Different Ecosystem Services
Forest59%
Reef7%
Estuary6%
Wetland23%
Seagrass0%
Beaches0%
Mangroves
5%Cultural
0%Pest1%
Water4%
Disturbance regul.
2%
Biodiversity
11%
Other19%
Carbon25%
Raw materials
19%
Non-use4%
Fisheries7%
Recreation
8%

40
Figure 8. Proportion of Aggregated Value Generated by Different Ecosystem Services for Each Habitat
As figure 8 shows, forest values are dominated by carbon storage, raw materials and other values e.g. soil formation and erosion control. Coral reef values are generated from recreation, fisheries and biodiversity. Mangrove values are generated principally from fisheries and coastal protection. Estuaries generated large values from fisheries support and recreational fishing. Seagrass and beach values were in large part, not able to be measured. Wetlands however, provide significant benefits in terms of carbon storage, biodiversity and recreation.
0
20000000
40000000
60000000
80000000
100000000
120000000
140000000
160000000 Recreation
Fisheries
Non-use
Raw materials
Carbon
Other
Biodiversity
Disturbance regul.
Water
Pest
Cultural

41
Economic Contribution of Natural Resources to the Economy.
a) Tourism Survey Results.
A self-completed survey was distributed to all hotels and guests houses in Andros, which included questions related to hotel revenues and eco-tourism by guests, as well as employment benefits and attitudes towards conservation and management. In total 23 responses were received (out of 35 hotels), which included all but one of the larger hotels.
Respondents said the most valuable natural resources in Andros were bonefish (48%), beaches (39%), fish (39%), coral reefs (35%), creeks and flats (30%) and forests (30%). More abstract answers related to less development (17%), natural beauty (17%), general nature (22%) and eco-tourism (26%). Mangroves (17%), blue holes (13%), water (13%), wetlands (9%) and bird species (9%) were also cited. Only one person mentioned crabs. Respondents reported that the most critical threats to Andros were pollution (39%), habitat destruction (35%), overfishing / poaching (26%), the Deepwater Horizon oil spill (17%), dredging / beach erosion (17%) and mining (13%). Other responses included fires, hurricanes, net fishing, over-development and wild boar.
In total, there is a maximum occupancy of 810 tourists in Andros, of which 258 places are in 15 specially designated fishing lodges. The rest are in 20 other guesthouses (see table). In total, 20 hotels reported that they had a total of 246 staff (a mean of 12 per hotel), of which 149 were full time (7 per hotel) and 96 part-time (5 per hotel). Overall, 81% of staff were reported to be local to Andros. In addition, there were a reported 99 eco-tourism guides (a mean of 5 used for each hotel). Respondents reported at 32% decrease in tourism activity due to the economic downturn, but many commented that 2010 was much better than 2009.
Hotels reported purchasing a mean of 78 lbs of fish, 56 lbs of conch, 60 lbs of crawfish and 22 lbs of crab, all bought directly from individual fishers. This part of the catch is therefore not reflected in exports to Nassau. These guesthouses also generated a mean of $51 in transfer fees to or from the airstrips. 20% had a swimming pool, 41% got their water from a private well, 32% a metered well and 27% from a piped supplier. On average, they had spent almost $1,800 to set up their sewerage storage and $400 per year to maintain it.
Table 13. Fishing and Non-fishing Guesthouses in Andros
Type of accommodation
Max no. guests
Average occupancy
Mean lower rate / night
Mean higher rate / night
Median weekly rate
All guesthouses 23 39 383 731 3184 Fishing lodges 17 41 665 780 5054 Non-fishing guesthouses 28 37 184 694 1644
Owners estimated that 61% of guests did fishing trips, 29% other marine-based tours, 19% land-based eco-tourism tours and 9% visited national parks. Based on responses about guests’ trips, which were only reported by 11 out of 23 respondents, we can guess that a minimum of 18,000 eco-tourist trips were taken in 2009, with a mean cost of $198 and an implied gross value of US$2.86 million. Since we do not have this data for 24 lodges, we can reasonably assume we have captured only half of the trips (those not reporting are likely to have less trips or to concentrate on fishing, which is included in the price). If this estimate is close to being accurate, then there would be 36,000 trips with a potential value of $5.7 million. These responses do
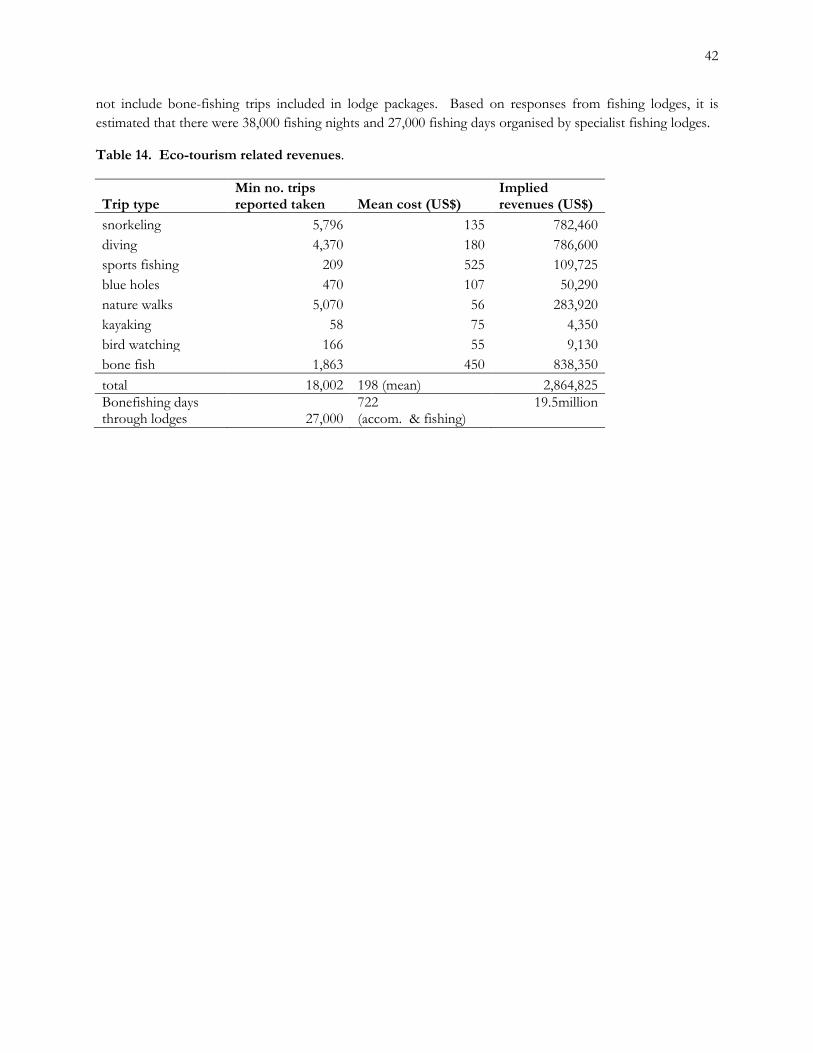
42
not include bone-fishing trips included in lodge packages. Based on responses from fishing lodges, it is estimated that there were 38,000 fishing nights and 27,000 fishing days organised by specialist fishing lodges.
Table 14. Eco-tourism related revenues.
Trip type Min no. trips reported taken Mean cost (US$)
Implied revenues (US$)
snorkeling 5,796 135 782,460 diving 4,370 180 786,600 sports fishing 209 525 109,725 blue holes 470 107 50,290 nature walks 5,070 56 283,920 kayaking 58 75 4,350 bird watching 166 55 9,130 bone fish 1,863 450 838,350 total 18,002 198 (mean) 2,864,825 Bonefishing days through lodges 27,000
722 (accom. & fishing)
19.5 million

43
b) Livelihoods Analysis
Table 15 shows the number of people estimated to be involved in each type of activity from each area and the total for all of Andros. It is very rare for people to work in more than one area, hence these are additive. We also see the mean number of activity days they make each year and the gross revenues each day and/or year for this activity. Since extractive activity income varied so much with frequency, these were distinguished. These pieces of information were used to calculate annual gross revenues per year for each individual and then for the entire population undertaking the activity.
Table 15. Economic Activity in Andros related to Natural Resources Economic activity
Frequency of activity
No. in South Andros
No. in Mangrove Cay
No. in Central Andros
No. in North Andros
Total no. on Andros
Est. activity days per person in 2009
Gross revenues per day
Est. gross revenues per year
Gross aggregated revenues
Crabbing
all yr (black) 20 - 30 10 - 15 0 0 38 60 $375 (15 doz @ $25) $24,000 $855,000
all yr (white) 0 0 9 6 15 20 $200 (8 doz @ $25) $4,000 $60,000
in season (black) 650 250 0 0 900 38 $300 (15 doz @ $20) $11,400 $10,260,000
in season (white) 0 0 1500 1300 2800
38 $80 (4 doz @ $20) $3,040 $8,512,000
Fishing principal income 35 - 45 250 12 100 392 250-300 $218 $60,000 $21,720,000
secondary income 200 120 50 80 450 150 $165 $25,000 $11,250,000
occasionally 350 400 300 1500 2550 70 $70 $4,900 $12,495,000
Spongers specialists 0 10 2 20 32 250 $150 $37,500 $1,200,000 opportunists 10 150 15 100 275 60 $120 $7,200 $1,980,000
Farming: e.g. onion, oranges, melon etc
farms (employees) 0 2 (6) 1 (2) 45 - 50 (478)
51 (486) full time $22,000 $1,122,000
small scale 30 - 25 8 2 5 28 $4,000 $112,000
Weaving & baskets
all year 48 30 20 350 448 260 $70 $18,200
$8,153,600
Wood carving
all year 3 2 1 3 9 200 $80 $16000
$144,000
Bush medicine
all year 1 0 2 0 3 $2,600 $7,800
Furniture all year 0 0 2 3 5 100 $80 $8000
$40,000

44
Economic activity
Group South Andros
Mangrove Cay
Central North Total on Andros
Est. activity days pp in 2009
Gross revenues per day
Gross aggregated revenues
Overnight visitor accommodation, transport and meal expenditures
No. staff 74 30 118 126 354 85,000 $383/night ($130-3000)
$32,555,000
Guided fishing trips (bone / deep sea)
Guides 10 - 20 4 to 6 30 3 53 20,000 $500 ($350-600) $10,000,000
Diving Dive operators
2 1 3 2 8 3,000 $175 ($100-300) $525,000
Eco-tourism; snorkeling, blue holes, bird watching, hunting
Guides 7 2 8 3 23 5,000 $100 ($75-250) $1,200,000
Education / research
BNT, lodges, fo far and greenforce
n/a n/a n/a n/a n/a 19,660 $155 ($36-170) $2,800,200

45
Employment
Fishing, tourism and farming generate many full time jobs but fishing and sponging provide additional income for large numbers of people (figure 9).
Figure 9. Number of full and part time jobs related to each type of activity.
Part time jobs were treated as a third of a full time job, based on survey information. Guided recreational fishing and tourism emerge as generating large revenues per employee, but are also expected to incur high costs (figure 10). Farming, crabbing, crafts and sponging were shown to generate relatively fewer revenues per person employed.
Figure 10. Revenues generated per person employed.
0500
10001500200025003000350040004500
part time
full time
050,000
100,000150,000200,000250,000300,000350,000

46
Summary of Economic Impacts
When revenues for each activity are added together (table 15), we see that there is almost US$142 million of economic activity related to Andros’ natural resources, as well as an additional 1,676 full time and 8,000 part time jobs. If we consider secondary impacts (related to spending not included here, such as fisheries equipment, construction and inter-island transport), we estimate that the total impact is $177.5 million each year. This means nature provides an income to 80% of Andros’ residents and at least 60% of all economic activity on the island (based on mean GDP per capita of $30,000).
Table 15. Summary of direct Economic Impacts
Figure 11. Economic contribution to the economy by type of activity. Note tourism and eco-trips are inter-related.
9 Craft is used as a collective term for weaving, basket making, curio making, furniture production, wood carving and bush medicine.
Fishing33%
Crabbing14%
Sponging2%
Guided fishing & Eco-trips
8%
Tourism23%
Education / research
2%
Crafts6%
Farming1% Water
11%
Type of activity
Type of Activity
Aggregated impact in 2009 (US$’000)
Principal income
Secondary income
Revenues generated per job
Extractive Fishing 47,265 392 3700 29,000 Crabbing 19,687 53 3700 15,300 Sponging 3,180 32 275 25,700 Farming 1,234 486 28 2,500 Crafts9 8,345 448 17 18,400
Water revenues 15,830 31 0 510,000 Non-extractive
Guided recreational fishing 10,000 18 35 337,000 Tourism expenditure (not including fishing or diving etc)
32,555 178 176 137,500
Eco-trips 1,025 20 60 25,600 Education / research 2,800 18 8 135,500
Total $141.9 million 1,676 8,000 80,000(mean)

47
Fishing generated the greatest proportion of revenues (figure 11). Fishing typically entails significant costs in terms of expenditure and time, so net values could be around half the gross revenues reported here (Burke and Maidens, 2004). Crabbing emerges as a hugely valuable resource, as it generates large revenues for many people. Costs associated with crabbing are relatively low, so in terms of net benefits, this could be one of the most valuable activities. It could be argued that all tourism in Andros is to some extent eco-tourism, as there is little to do other than spend time in the many varied habitats. Much of this tourism is related to recreational fishing, for which trips generate $10 million in revenues each year. If all tourism related activities are added together, they constitute 31% of revenues, compared to 49% for all commercial fisheries (including crabbing and sponging). Overall, 67% of these revenues are generated by extractive activities and 33% by non-extractive ones. Farming, education and sponging generate relatively few revenues, despite employing many people.

48
Economic Values and Impacts into the Future.
If the economic values cited in this paper remained constant over the next 25 years the value of the ecosystems would be $3.8 – 5.8 billion in present value terms. The present value calculation applies a “discount rate” to adjust future values so that they can be compared on an equal footing to values received today, to which people tend to attach greater importance. The present value of water over this time would be $51-78 million. The economic total impact of natural resource revenues (including indirect spending) would be $2.6-3.8 billion. Over time, these values are very sensitive to changes in values relative to other goods and places, as is shown by the impact of 1% and 2% increases in relative value and impact.
The underlying assumptions here are that there are no changes to environmental quality on the island, either good or bad and no significant changes in the economy or the population of Andros. We would caution that there will obviously be changes. This has was seen in 2009, when the global recession caused a decrease in tourism on the island or when the price of crawfish fell, which resulted in a large decrease in the volume of crawfish caught. However, these effects are often not straightforward, as people can switch between incomes or changes may be transient. Overall, we would expect a modest increase in most economic activities and a potentially large increase in the relative value of habitats, given the increasing scarcity of high quality habitats and resources such as water globally.
Table 16. Economic value and contribution to the economy discounted over the next 25 years
Timeframe 2009 (US$)
Over 25 years (US$)
Over 25 years (US$)
Over 25 years (US$)
Discount Rate 1% 3% 5% Forest 154 million 3.4 billion 2.74 billion 2.24 billion
Reef 16.6 million 369 million 295 million 240 million
Estuary 15.3 million 341 million 272 million 222 million
Wetland 60 million 1.3 billion 1.1 billion 868 million
Seagrass 0.12 million 2.6 million 2.1 million 1.7 million
Beaches 0.6 million 13 million 11 million 8.8 million
Mangroves 13.7 million 304 million 242 million 198 million Economic value all ecosystems 260.5 million 5.8 billion 4.6 billion 3.8 billion
Value with 1% relative value increase 6.5 billion 5.1 billion 4.2 billion
Value with 2% relative value increase 7.4 billion 5.8 billion 4.7 billion
Water 3.5 million 78 million 62 million 51 million
Water with a 1% relative price increase 88 million 68 million 57 million
Water with a 2% relative price increase 99 million 78 million 63 million
Direct Economic Impact 142 million 3.1billion 2.5 billion 2.1 billion Total Economic Impact 178 million 3.8 billion 3.1 billion 2.6 billion
Total impact with 1% relative activity increase
5 billion 3.5 billion 2.9 billion
Total impact with 2% relative activity increase
5 billion 3.9 billion 3.2 billion

49
Discussion.
In terms of habitat-based value estimates, some values have been taken from locations where there is a highly developed tourism industry or much higher populations, which is likely to mean that they are over-estimates in terms of Androsian habitat values. As a result, they should be considered as potential values. Many values are also not completely additive (i.e. forest recreation and wetland recreation), so there is likely to be some double counting. For example, it is unlikely that all the habitats are able to generate high recreational values concurrently and additively. There are also certain ecosystem services to which many ecosystems are contributing in some way. The link between these contributions is often poorly understood and therefore difficult to translate into economic value estimates. Values have been chosen as conservatively as possible, with the lowest end of reported ranges used from other studies. It has also not been possible to estimate many values, which may nevertheless be important. Hence values reported here should be taken as indicative only of value of ecosystem services provided by habitats on Andros. Rather than compete with one-another, these values are highly linked. Were the forests to disappear, water values would be severely degraded over time. Indeed it is water that links all these systems. Contamination of the water supply would lead to loss of values from all the other habitats and would reduce fisheries and recreational benefits. Where more precision is required for policy decisions, primary data needs to be collected and time allowed for a longer-term analysis.
Residents of Andros have become adept at finding a high quality of life, based largely on the utilisation of natural resources. People benefit directly in many varied ways from the flora and fauna, from extraction of crabs, sponge, fish, wood and palm for crafts, medicine and fruits from the forest, as well as water from the ground. They also benefit indirectly in terms of income and employment from nature based tourism, such as guided fishing and diving or visiting blue holes. Thus these surveys revealed the extent to which all residents depend on a healthy environment and are therefore potentially vulnerable to environmental degradation. Economic impact estimates are likely to be under-estimates of all activities, as they do not include revenues from other small activities such as honey production and illegal activities. Here we are assuming that the activities being under-taken are sustainable. However this may not be the case for certain extractive activities such as crabbing and fishing. This should therefore be further explored.
In terms of the economic contribution of these resources to Andros, we have generated estimates of gross revenues. It is important to consider that direct, indirect and opportunity costs can be significant. Economic impacts are rarely discounted, since they are so sensitive to conditions, such as changes in prices of inputs or substitutes sites. However, it is important to consider these values into the future and economic activities in Andros have changed very little over the last 20 years.
Despite confronting considerable uncertainty, this research clearly demonstrates the enormous contribution of natural habitats to the economy and human welfare both locally and internationally. We can tentatively say that the island of Andros could each year generate up to $260 million in net economic benefits, plus a net value of $3.5 million from water found on Andros and provide a direct contribution of $142 million each year and a total contribution of $178 million to the Bahamian economy (given induced spending from the direct revenues). If we consider these values over the next 25 years, then the economic value could be $3.8-5.8 billion and the impact $2.6-3.8 billion. If we consider the increasing scarcity of pristine habitats regionally, the relatively value of the natural resources of Andros is likely to continue to rise.

50
Chapter 4. Sustainable Financing Needs and Options for Conservation In Andros.
Financing mechanisms vary by degree of government intervention and public involvement and can be distinguished into the following categories; self-organising private deals, voluntary contractual arrangements, trading schemes and public payment schemes (Bernard et al., 2009).
(a) Financing Needs for Andros There are a large number of projects and policies that could be enacted in Andros, to help protect habitats and biodiversity of this island. As part of this research, a number of stakeholders were interviewed, to establish those projects that are most urgently needed. These are listed in the table below. Many of these are very rough estimates and it is recommended that more extensive costing be done by the agencies planning to carry out these activities. In total, based on these estimations, it is necessary to raise $1.62 million initially and $540,000 each year, to enable the minimum level of sustainable management of these resources through parks management, ecotourism development, consultation, recycling, habitat restoration and vulnerability assessments. Table 17. Costs of Sustainable Ecosystem Management on Andros.
10 Current locations and size of parks may not be suitable, hence new parks and larger locations are already being considered. This parks budget assumes there will be some expansion.
Group responsible
Details Initial cost
Annual costs
BNT parks Consultation and research to establish optimal park boundaries and locations 10
30,000 5,000
Rental of 3 offices (Central, North and South) 20,000 10,000 9 full time staff for management & enforcement of National parks (NPs)
270,000 270,000
Boats, vehicles, gas 260,000 50,000 Park education initiative (meetings, materials, radio announcements)
30,000 15,000
Park monitoring & research program 20,000 15,000 Park signage and boundary demarcation 10,000 2000
Conduct stakeholder meetings to raise awareness of benefits of National parks, to gather feedback and build local support
10,000 2,000
Department of Marine Resources
Design sampling technique and database for fisheries landings for commercial fisheries and land crabs. Train data collection officers to implement this.
10,000 0
ANCAT / BNT Create and distribute educational materials stating which species are illegal to catch and raise awareness of punishments e.g. for iguanas, sharks and turtles
5,000 0
Ecotourism training centre - office, trainers materials 86,000 20,000 TNC / ANCAT / BNT
Crab & fisheries education program 15,000 8,000 Vulnerability assessment for bonefish populations 60,000 5,000 Crab population monitoring and vulnerability assessment 40,000 10,000 Bone fish population and habitat monitoring 40,000 20,000
Nature’s Hope for South Andros/
50k matching funds for a project to restore a creek (50k has been promised contingent on matching funding)
50,000 0

51
In addition, other areas that could be deemed necessary, based on vulnerability assessments could be;
Sewage treatment plants to treat sewage in areas where sewage is contaminating water supplies could be established. Typically secondary treatment might cost $150,000 per year in expenses, but a basic package plant will also require a deep disposal well, which might cost $100,000. Once the sewage collection system is taken into account, the overall cost of establishing treatment is usually over $1 million.
Implementing the Andros Iguana Andros Conservation Plan, which contains many elements related to education, research and management to protect this species, which is under threat. Total costs are estimated to be $120,000, plus $2.5 million to create a protected area in the South of Andros
Recently, a large and ambitious water project was going to be undertaken in Andros, which had the following elements: o Compiling geologic, hydrologic, geochemical, soils, climate, water use, and other relevant
geospatial data; o Assessing current status of groundwater resources; o Assessing past climate data and influences on groundwater conditions, including the response
of groundwater resources to natural climate variability; o Characterizing the distribution of fresh, brackish and saline groundwater; o Developing a calibrated density-dependent groundwater model; o Estimating groundwater recharge; o Using current and future predicted climate data as input to recharge models, and subsequently
groundwater flow models;
ANCAT Management MOU & plans with BNT for National Parks (NPs)
8,000 4,000
Invasive species removal program 30,000 10,000 Creek restoration in primary settlement areas 25,000 8,000 BREEF summer / discovery camp 10,000 0 Education program with 8 local schools 18,000 7,000 Local consultation meetings 5,000 5,000 Recycling program 25,000 0 Green bags - manufacture and education 12,000 3,000 Advertising for eco-trips 10,000 10,000 Operational support 35,000 35,000
Water (WSC) Basic water monitoring program 20,000 10,000 Water vulnerability assessment to assess vulnerability of water quality to pollution, climate change impacts, etc and to establish need for further studies
80,000 0
Basic exploratory wells and testing to get a basic idea of the freshwater lens area in South Andros and Mangrove Cay
200,000 0
Bahamas airborne survey to map groundwater-blue hole interface and the interconnectivity of blue holes across the Andros land and seascape
90,000 0
Forestry department?
Water Reserve Act: legislation, then regulations and penalties to protect "water reserves’; "lands reserved for the protection of water resources, be it surface or ground water, deemed fit for human use or conservation"
100,000 20,000
Total $1.62 million
$540,000

52
o Generating scenarios for future land-use change, and changes in water use; o Modeling potential future human impacts on groundwater resources; o Evaluating model outputs for generating recommendations for groundwater monitoring and
management under scenarios of human impact and climate change; o Implementing and testing innovative techniques (e.g. artificial recharge, salt-fresh scavenger
wells, desalinization techniques, etc.) at favourable sites. The cost of this project is unknown, but it would be expected to be over a $1 million. It is recommended that an initial water vulnerability assessment be done to establish the need for more studies.
Costs and Benefits of Conservation.
Typically, costs of management have been shown to be small, compared to benefits. For example, the median budget for a coral reef marine protected area is $775 / km2 / year (Balmford & others, 2004), which is less than 0.2% of the estimated value of the coral reef itself (Cesar & others, 2003b). Healthier reefs can lead to both increased levels of visitation (Burke and Maidens, 2004) and increased willingness to pay to visit an area (Schuhmann & others, 2008). For example, a study in the Philippines showed that management costs were 4-6.5% of net benefits produced by a 40km2 area of reefs and wetlands and that increased reef quality would lead to a 60% increase in annual net revenues (White & others, 2000). A lack of conservation projects in contrast, can generate huge costs. Restoration costs for coral reefs span from $1-500 million /km2 (Spurgeon, 2001). The island of Andros ecosystem lies only 100 km ESE from the southern tip of Florida. The Southern part of Florida is currently undertaking restoration of its ecosystems, at a cost of US$2.38 billion. Projects include a project to restore the wetlands of the Biscayne National park wetlands at a cost of $595 million, and a project to achieve water quality goals in this area, which will cost $1.5 billion. Conservation projects yield the greatest benefit for a given investment when they are located in regions where GNP per unit area is low, cost structures are low, and reserves or other initiatives can cover large areas. For forested protected areas, costs are typically $1000 / km2 / year (Balmford & others, 2003), whereas benefits arising from forests such as those in Andros are upwards of $68,000 / km2 / year. Replacement costs for ecosystem services can also be huge and merit investment, hence defensive expenditures to protect water purification systems of forest watersheds are increasingly commonplace (Lerner and Poole, 1999). Economic analysis can help to make a case for conservation. A study in Sumatra, Indonesia, undertook an analysis of three scenarios and benefit streams from a number of values including water supply, flood prevention, tourism and agriculture, showed that the net present value (NPV) of deforestation over a 30 year time period and a 4% discount rate was $7 billion if this area was deforested and $9.1billion if selective utilization was allowed (selective logging and replanting). However, the highest NPV of $9.5 billion was produced by the conservation scenario (van Beukering & others, 2003). So why does conservation investment not occur more? The costs of conservation vary depending on who is being considered. When analysing the reasons that rainforests in Madagascar were not being conserved, but rather used for logging or converted into agriculture. Using an opportunity cost-benefit analysis, the authors found that at national levels, the logging generated significant gains, but that from a local and global
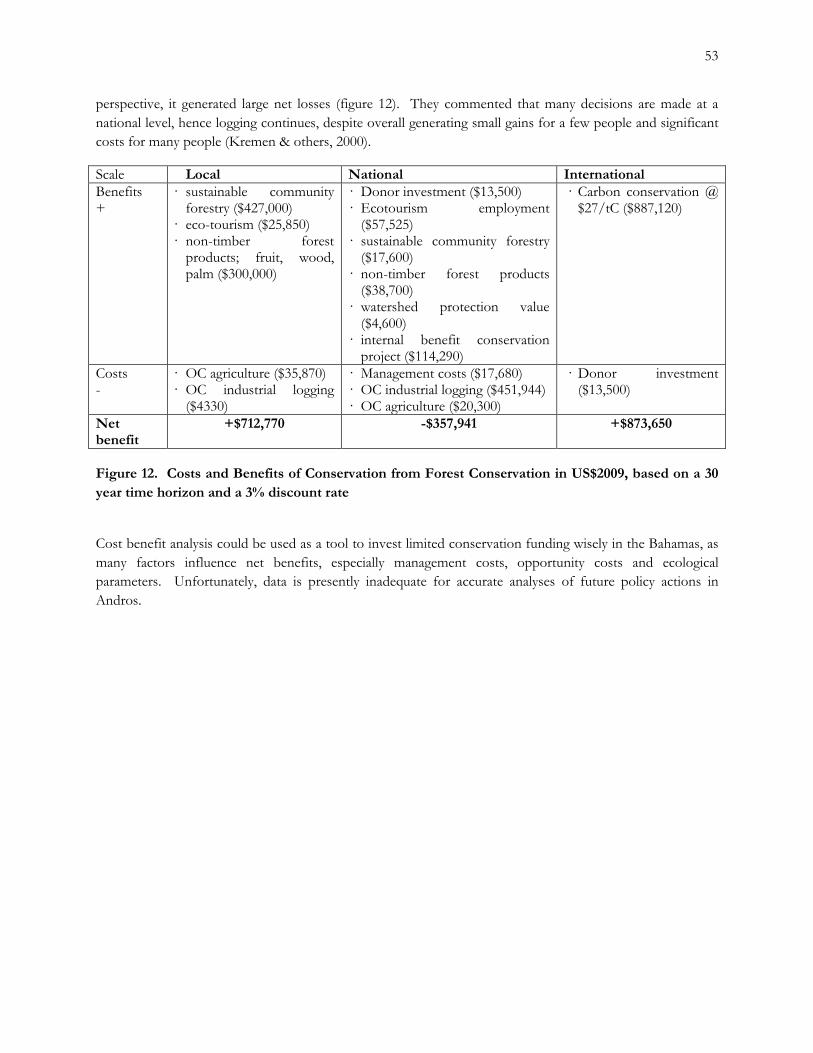
53
perspective, it generated large net losses (figure 12). They commented that many decisions are made at a national level, hence logging continues, despite overall generating small gains for a few people and significant costs for many people (Kremen & others, 2000).
Scale Local National International Benefits +
· sustainable community forestry ($427,000)
· eco-tourism ($25,850) · non-timber forest
products; fruit, wood, palm ($300,000)
· Donor investment ($13,500) · Ecotourism employment
($57,525) · sustainable community forestry
($17,600) · non-timber forest products
($38,700) · watershed protection value
($4,600) · internal benefit conservation
project ($114,290)
· Carbon conservation @ $27/tC ($887,120)
Costs -
· OC agriculture ($35,870) · OC industrial logging
($4330)
· Management costs ($17,680) · OC industrial logging ($451,944) · OC agriculture ($20,300)
· Donor investment ($13,500)
Net benefit
+$712,770 -$357,941 +$873,650
Figure 12. Costs and Benefits of Conservation from Forest Conservation in US$2009, based on a 30 year time horizon and a 3% discount rate
Cost benefit analysis could be used as a tool to invest limited conservation funding wisely in the Bahamas, as many factors influence net benefits, especially management costs, opportunity costs and ecological parameters. Unfortunately, data is presently inadequate for accurate analyses of future policy actions in Andros.

54
(B) Potential Sources for Increased Funding For Conservation in Andros
When considering potential sources of funding for the projects that have been identified as critical for Andros, there are a large number of potential options. Each option’s feasibility depends on a large range of factors including financial, legal, administrative, social, political and environmental issues. Below, potential sources of financing are presented, with indications of who would pay (which is important in terms of equity), potential problems, necessary actions or refinements for Andros and the revenue raising potential of each. This is not intended as an exhaustive list. Only those that appear feasible or rewarding have been included. See appendix A11 for further recommended reading.
Table 18. Potential Sources for Increased Funding For Conservation.
Income source Who pays / details
Potential issues Refinements Revenue raising potential
Entrance fees for parks
Tourists Transaction costs for fee collection, inadequate visitor numbers, lack of unique species or educational and park infrastructure
Ask operators to collect fees, deduct fees from moorings payments to reduce burden on sailing, do not charge Bahamians, ensure fees used for operational costs
Low due to low numbers of visitors (estimated <1000 per park annually)
Bonefishing conservation fee
Recreational fishers pay daily fee
Difficult to enforce and monitor, especially for people fishing through private guides
Ask lodges to collect fees to reduce transaction costs. Fund should be used for bonefish research or conservation.
$5 / day could generate $100,000 annually if everyone paid.
Diver conservation fee
Divers to pay $5 per day
Difficult to enforce and monitor
Produce tag for divers. Establish agreement with dive operators. Fund should be used for coral reef research or conservation.
$20,000, due to low numbers of divers (approx 4,000 dives per annum)
Voluntary hotel bill surcharges 11
Tourists Verification and collection of funds
Tourists must opt out not to pay
Unknown but potentially high
Research permit costs
Researchers working in Andros
Reduced research, transaction costs
Waive fee for researchers doing work previous planned or requested by conservation groups
Currently low, but potentially medium, given increasing interest in pristine habitats of Andros
Litigation or fines for environmental damage
Polluters doing damaging activities; developers, ship groundings, pollution
Costs of collecting information on damage and legal process
Develop transparent framework for litigation. Pass legislation to ensure compensation is received.
Medium
Grants for research or
Foundations and NGOs; e.g.
Need staff to write and submit
Apply for grants linked to management goals or specific
Unknown, but potentially high
11 The Turks and Caicos Islands designates 1% of a 9% hotel tax as a conservation tax to support the maintenance of the country’s protected areas. The Bahamian government has given permission for this, but private agreements need to be reached with hotels.

55
management projects
GEF, Moore, etc
proposals, time consuming and disjointed. Available funding can vary unpredictable and lots of competition for funding
threats.
Carbon markets or investment funds
The World Bank Forest Investment Fund, Prince’s Rainforest Project, Forest Carbon Partnership Facility, GEF, UN REDD Initiative, private investment funds
Currently only voluntary markets exist, although formal markets may be established soon. Avoided deforestation may not be eligible for payments (only afforestation). Lack of markets for which the Bahamas is currently eligible
Consider negotiating deal with US voluntary carbon markets. 2012km2 in pine forest area in Andros, but not all will be old growth and therefore eligible.
Unknown but potentially medium due to lack of compliance markets and continuing discussion over whether avoided deforestation should be eligible for payments under the post-Kyoto mechanism, as well as failure to agree the follow up to the Kyoto agreement.
Voluntary carbon offset partnership with Bahamasair
Bahamasair customers
Potential to generate conflict as to which forests to allocate funds to, within Andros and on other islands. Potentially low numbers of payees.
Need advertising campaign to raise awareness of how funds are used. Need to make sure funds provide additional benefits(compared to what would have occurred without them). Need survey to establish willingness-to-pay (WTP) for such a scheme.
Unknown but potentially medium. 1.5 million passengers in 2009. If 5% paid $3, could raise $225,000 annually.
Increased water charges
Nassau residents or industry
Androsians are likely to switch to private wells and Nassau consumers could switch to alternative sources.
Need to establish WTP for increased charges for the full range of consumers
Unknown but potentially low to medium.
Cruise ship fees (voluntary / non-voluntary) 12
Cruise ship passengers
Conflict over how funds should be allocated. Potentially not used for conservation programs.
Need to establish if more funds would be raised through voluntary or non-voluntary payments and if should be daily charge, percentage of trip costs or flat fee. Invest in awareness of use of funds for conservation, to increase WTP.
Unknown but potentially high. 96% indicated they would pay $25 in additional costs and still vacation in the Bahamas. If charged $25 per person 13, based on mean cruise ship entry of 3 million per year,
12 These have proven very difficult to negotiate in the past, as cruise ships have threatened to go elsewhere if high fees are charged. 13 A survey conducted in 2008 to explore tourist WTP for 1000 Bahamian tourists, 61% of whom were cruise ship passengers, who spent an average of US$915 on the cruise (all prices have been adjusted to reflect inflation from 1996 to 2009). Air visitors had spent US$1321 in pre-paid costs outside the Bahamas. Visitors were asked to reveal what is the maximum increase in their total costs per person they would have been willing to absorb and still have chosen to take this vacation. 96% were WTP $25, 86% $50 or more, 65% were WTP $100 or more per trip, 42% $150 or more and 28% $250 or more. In Belize, there is a 20% commission on cruise ship passenger fees.

56
this could raise $72 million annually. If it was $10, it could raise almost $30 million annually
Exit fee for tourists to Andros
Tourists Need government agreement that revenues raised will be used for conservation
Need to establish WTP for such fees and number of tourists who might go elsewhere if they are introduced
If 90% of people would pay $10 departure tax, could raise $90,000 annually 14
Selective sustainable logging
Wood related industries e.g. furniture and crate production
Could require certification to ensure higher prices for wood. Could be poorly done and cause damage to forests
Avoid older growth forests in South Andros. Need to establish maximum sustainable yields and ensure only selective methods are used. Need to monitor damage
Unknown, but potentiallymedium
Habitat extraction charges e.g. species for restoration elsewhere or royalties for resource extraction such as water, sand or rock
Those doing habitat restoration in region
Could require removal of species which are not abundant in Andros. Could produce negative environmental consequences if improperly done. Unpredictable demand.
Establish ability of habitats to withstand removal of species for use elsewhere. Establish likely buyers and establish safeguards or compensation for any damage caused
High, but unpredictable and intermittent
Payments for watershed services
Water users (e.g. WSC, farmers, industry) – usually made with NGOs
Difficult to negotiate, requires recognition of the goods and services provided within a watershed and the presence of buyers and sellers; and established property, access and usage rights related to land tenure and water use as well as agreement on the value and price of those goods and services
The arrangement must be transparent and reliable and there must be a clear understanding of the risks involved, appropriately negotiated agreements between buyers and sellers, established standards, and appropriate financing mechanisms (Smith et al., 2006). Use funds to achieve water quality and habitat restoration in the watershed
Unknown but low to medium
Mitigation banking 15,
Developers causing habitat
Can be politically difficult and costly to
Develop methods to measure environmental
Unknown but potentially medium to
14 In addition, respondents were asked the maximum increase in their total costs per person per visit they were WTP to help protect the natural (tropical forests, beaches and coral reefs) and cultural environment (archaeological sites, music, dance, arts and crafts). Ninety five percent were WTP at least $5, 90% at least $10, 78% at least $25, 60% at least $50, 39% at least $75, 31% at least $100. Respondents preferred allocation of 57% to environment and 43% to culture. A departure tax (part of an exit tax bundle of $37.50, of which $3.75 goes to protected area funding) has been initiated in Belize and has had no noticeable impact on visitor numbers. 15 Mitigation banking is the restoration, creation, enhancement, or preservation of a habitat conservation area which offsets expected adverse impacts to similar nearby ecosystems.

57
biodiversity offsets 16 or development compensation payments 17
reduction or environmental alterations
negotiate and monitor
impacts of projects. Establish system for mitigation banking fees, procedures and transparent oversight.
high
Lottery Revenues Ticket purchasers
Form of gambling regarded by some people as socially objectionable. Some transaction costs.
Administered at the national or local level by government agencies or licensed private operators. Allocation of funding between a large number of worthwhile causes could cause conflict
Medium to high
Fundraising sales e.g. specialized license plates 18, eco-labelled honey, eco-certification of fish 19, etc
Bahamians and tourists
Markets can be difficult and take time to develop. Plus unknown demand. Fulfilling requirements for certification can take years and entail large costs.
Sold at a premium compared to costs of ordinary products. Negotiate use of some funds for conservation.
Unknown, but potentially medium
“Friends of Andros” fundraising events and merchandise
Bahamians and tourists
Have significant set up and transaction costs.
Target people beyond the Bahamas. Minimise portion of funds that will be used for advertising and administration costs.
Unknown, but potentially medium
Debt relief agreements or “Debt for nature swaps” 20
International organisations and governments
Feasibility depends on who owns Bahamian debt & financial health of both economies. Requires advanced negotiation skills & large legal costs. Bahamas is classified as high-income.
Identify potential future beneficiaries for use & non-use values from species & habitats. Ensure legal framework mandates that a portion of funds are used for conservation in Andros.
Low in the near future, but high in the long term.
16 Biodiversity offsets are defined as measurable conservation outcomes that result from actions meant to compensate for the residual biodiversity impacts of project development after appropriate prevention and mitigation measures have been implemented. The United States has legislation related to biodiversity offsets and wetlands mitigation banking since 1972. Financial institutions and banks are increasingly including biodiversity offsets in their loan conditions. 17 Brazil designed a federal tax system which set aside 0.5% of major development project costs for conservation funding, to compensate for negative environmental impacts, but this has been suspended until the method for establishing the specific environmental impact of each project can be agreed. 18 In the US, most states offer a special environmental license plate or those to specifically support species conservation. 19 Such a scheme is currently being undertaken by fish processors in the capital, who also buy fish from Andros. 20 Current debt is approximately $3 billion. These free up debtor country resources that are obligated to paying off international debt, converting a portion of those obligations into local currency to support conservation activities. Since the first debt relief for conservation program was executed in Bolivia in 1987, such programs have contributed more than $1 billion to conservation around the world. Bilateral debt-for-nature swaps are similar to commercial swaps, but involve “sovereign” debt owed by one government to another rather than commercial debt owed to a bank or commercial creditor. In a bilateral debt agreement, the creditor government cancels or discounts a portion of debt in exchange for the debtor country’s commitment to finance local conservation activities. Agreements are negotiated between government ministries, but are often facilitated by conservation NGOs. In some cases, environmental organizations have contributed funds to bilateral debt agreements to further leverage the financial commitment to conservation. Bilateral debt swaps continue to support conservation, with most recent debt swaps taking place through the support of the German, French, and U.S. governments.

58
Summary of Sustainable Finance
In conclusion, based on the analysis above, there are several potential sources of funding which emerge as feasible and potentially lucrative, which have yet to be fully utilised. Specifically for Andros, these include;
a bonefishing fee litigation or fines for environmental damage grants from international organizations for specific projects which are needed, such as vulnerability
assessments of water resources or endangered or economically valuable species such as bonefish and crab
mitigation banking agreements with developers for projects on Andros a “friends of Andros” fundraising program.
In terms of more general fund raising, of which part of the funds raised could be used for conservation projects on Andros, those which emerge as promising are:
voluntary hotel surcharges voluntary carbon offsets for flights cruise ship fees lottery revenues debt for Nature swaps or debt relief with the US.

59
Additional Recommendations
In addition to sustainable finance tools, there are several areas that could be developed, to increase local incomes and reduce local reliance on natural resource extraction. Developing these areas could result in more sustainable income sources. These areas include: - Marketing Andros as a high-end ecotourism destination. To some extent, this has already begun, with high-end hotels and high prices paid for bone fishing. Specifically, whale watching and flamingo tourism could be very popular. In addition, keeping populations of wild boar down through boar hunting programs could be used to reduce the numbers of these invasive animals.
- Develop a program with ANCAT to bring volunteers to Andros to carry out manual and research work necessary for conservation efforts, which will reduce costs and raise awareness. This approach has been successfully carried out with volunteers by BNT in the Exuma Cays National Park.
- Explore untapped fisheries markets as an alternative to those that are over-exploited e.g. deep-sea snapper and stone crab
- Re-establish a fish house, where fishers agree to prices for fish, conch, crawfish and sponge as a group, therefore securing better prices, whilst generating processing-related employment on island and taking. A micro-grant could be used to provide initial funding.
- Further develop Andros as a centre for education and research for Bahamian and international students, with profits being used for conservation.
- Developing a procedure, including clearly outlined fees, for people extracting any number of goods from Andros, such as limestone, sand, water, bio-prospecting or species for restoration initiatives.
- Develop legislation and procedure to raise funds quickly from parties who damage habitats or water resources or for ship groundings that damage reefs.
- Develop a system for monitoring commercial fisheries and crab off-take, to ensure that levels are sustainable and that actions can be taken to protect the long term viability of these stocks if numbers decline suddenly.
Final Conclusions.
The habitats of Andros are one of the last remaining areas of wilderness in this region and generate enormous benefits in terms of ecosystem services and gross revenues from extractive and non-extractive activities, which are equivalent to 3.6% and 2.5% of the GDP of the Bahamas respectively. Researchers have suggested that the ratio of habitat values to economic activity in the Bahamas is 89:11 (Sutton and Costanza, 2002). This research suggests that on Andros it is 60:40. The costs of managing these habitats would be less than 0.6% of the economic benefit they generate and 1% of the gross revenues these ecosystems support each year. The potential losses in values and the loss in income, jobs and welfare could be enormous, if Andros is not properly protected from ever-increasing threats. The sources of sustainable financing identified in this report should be employed quickly, to ensure this does not happen.

60
Reference List Adger, W N, Brown, K, Cervigni, R, and Moran, D, 1995. Total Economic Value of Forests in Mexico. Ambio
(24); 286 - 296. Alcorn, J B, 1989. An economic analysis of Huastec Mayan forest management. 182 - 206. Westview Press, Ammour, T, Windevoxhel, N, and Sencion, G, 2000. Economic valuation of mangrove ecosystems and subtropical
forests in Central America. 166 - 197. Edward Elgar, Cheltenham. Balasubramanian, H, Ahmed, M, and Chong, C K, 2003. Estimating the 'Total Economic Value' of Coral Reefs in
South East Asia and the Caribbean; Trends identified, Lessons learnt and Directions for future research. International Tropical Marine Ecosystem Management Symposium.
Balmford, A, Gaston, K J, Blyth, S, James, A, and Kapos, V, 2003. Global variation in terrestrial conservation costs, conservation benefits, and unmet conservation needs. Proceedings of the National Academy of Sciences of the United States of America (100); 1046 - 1050.
Balmford, A, Gravestock, P, Hockley, N, McClean, C J, and Roberts, C M, 2004. The worldwide costs of marine protected areas. Proceedings of the National Academy of Sciences of the United States of America (101); 9694 - 9697.
Bann, C, 1997. An Economic Analysis of Alternative Mangrove Management Strategies in Koh Kong Province, Cambodia. EEPSEA research report series, Singapore.
Barnes, J I, MacGregor, J J, Nhuleipo, O, and Muteyauli, P I, 2010. The value of Namibia's forest resources: Preliminary economic asset and flow accounts. Development Southern Africa (27); 159 - 176. Routledge,
Batagoda, B M S, 2003. The economic valuation of alternative uses of mangrove forests in Sri Lanka. UNEP/Global programe of Action for the protection of the Marine Environment from Land based Activites, the Hague.,
Bell, F W and Leeworthy, V R, 1997. The economic valuation of saltwater marsh supporting marine recreational fishing in the southeastern United States. Ecological Economics (21); 243 - 254.
Berg, H, Ohman, M C, Troeng, S, and Linden, O, 1998. Environmental economics of coral reef destruction in Sri. Ambio (27); 627 - 634.
Brander, L M, Florax, R, and Vermaat, J E, 2006. The Empirics of Wetland Valuation: A Comprehensive Summary and a Meta-Analysis of the Literature. Environmental and Resource Economics (33); 223 - 250.
Brander, L M, Van Beukering, P, and Cesar, H S J, 2007. The recreational value of coral reefs: A meta-analysis. Ecological Economics (63); 209 - 218.
Brouwer, R, 1999. A meta-analysis of wetland contingent valuation studies. Regional environmental change natural and social aspects (1); 47 - 57.
Buchan, K C, 2000. The Bahamas. Marine Pollution Bulletin (41); 94 - 111. Burke, L and Maidens, J, 2004. Reefs at risk in the Caribbean. Word Resources Institute, Washington DC, USA. Cant, R V and Weech, P S, 5-30-1986. A review of the factors affecting the development of Ghyben-Hertzberg
lenses in the Bahamas. Journal of Hydrology (84); 333 - 343. Cesar, H, Beukering, P, and Berdt Romilly, G, 2003a. Mainstreaming Economic Valuation in Decision Making:
Coral Reef Examples in Selected CARICOM-Countries. World Bank and ARCADIS Euroconsult, Arnhem, The Netherlands.
Cesar, H, Burke, L, and Pet-Soede, L, 2003b. The Economics of Worldwide Coral Reef Degradation. International Coral Reef Action Network (ICRAN), Cambridge, UK.
Clarkson, R, 2000. Estimating the Social Cost of Carbon Emissions. Department of the Environment, Transport and the Regions, London, UK.
Costanza, R, d'Arge, R, de Groot, R, Farber, S, Grasso, M, Hannon, B, Limburg, K, Naeem, S, O'Neill, R V, Paruelo, J, Raskin, R G, Sutton, P, and van den Belt, M, 1997. The value of the world's ecosystem services and natural capital. Nature (387);
Costanza, R, Farber, S, and Maxwell, J, 1989. Valuation and management of wetland ecosystems. Ecological Economics (1); 335 - 361.
Costanza, R, Wilson, R M, Troy, A, Voinov, A, and Lui, S, 2006. The value of New Jersey's ecosystem services and natural capital. New Jersey Department of Environmental Protection.
Dahdouh-Guebas, F, Jayatissa, J P, Nitto, D D, Bosire, J O, Seen, D L, and Koedam, N, 2005. How effective were mangroves as a defence against the recent tsunami? Current Biology (15); 443 - 447.
61
Emerton, L and Kekulandala, L D C, 2002. Assessment of the economic vale of Muthurajawela wetland. (Occasional paper No. 4.); IUCN, Sri Lanka.
Emerton, L and Kekulandala, L D, 2003. Assessment of the Economic Value of. Muthurajawela Wetland. IUCN Sri Lanka,
FAO, 2009. NATIONAL FISHERY SECTOR OVERVIEW: THE COMMONWEALTH OF THE BAHAMAS.
Fedler, T, 2010. The Economic Impact of Flats Fishing in the Bahamas. Gunawardena, M, Edwards-Jones G, McGregor, M J, and Abeygunawardena, P, 1999. A contingent valuation
approach for a tropical rain forest: a case-study of Sinharaja rain forest reserve in Sri Lanka. Forestry Commission, London.
Gunawardena, M and Rowan, J S, 2005. Economic valuation of a mangrove ecosystem threatened by shrimp aquaculture in Sri Lanka. Environmental Management (36); 535 - 550.
Hoel, M and Sterner, T, 10-1-2007. Discounting and relative prices. Climatic Change (84); 265 - 280. Holder, J S, 1991. Managing the Caribbean Environment as Tourism's Resource. Tobago. Jameson, S C, McManus, J W, and Spalding, M D, 1995. State of the Reefs: regional and global perspectives. US
Department of Commerce, National Oceanic and Atmospheric Administration., Silver Spring, USA. Kramer, P A, Kramer, P R, and Ginsburg, R N, 2003. Status of Coral Reefs in the western Atlantic: Results of
initialSurveys, Atlantic and Gulf Rapid Reef Assessment (AGRRA) Program. Assessment of the Andros Island Reef System, Bahamas. Atoll Research Bulletin (496); 76 - 99.
Kremen, C, Niles, J O, Dalton, M G, Daily, G C, Ehrlich, P R, Fay, J P, Grewal, D, and Guillery, R P, 2000. Economic incentives for rain forest conservation across scales. Science (288); 1828 - 1832.
Krieger, D J, 2001. The Economic Value of Forest Ecosystem services: A Review. Lal, P, 1990. Conservation or Conversion of Mangroves in Fiji. (11); Leeworthy, B and Wiley, P C, 1994. Recreational use value for Clearwater Beach and Honeymoon Island State
Park, Florida. National Oceanic and Atmospheric Administration, Leeworthy, V R and Wiley, P C, 2000. Proposed Tortugas 2000 Ecological Reserve. Socioeconomic Impact
Analysis. National Oceanic and Atmospheric Administration and U.S. Department of Commerce, Washington D C.
Lellis-Dibble, K A, McGlynn, K E, and Bigford, T E, 2008. Estuarine Fish and Shellfish Species in U.S. Commercial and Recreational Fisheries: Economic Value as an Incentive to Protect and Restore Estuarine Habitat. U.S. Department of Commerce, National Oceanic and Atmospheric Administration, National Marine Fisheries Service.
Lerner, S and Poole, W, 1999. The economic benefits of parks and open space. The Trust for Public Land., Livengood, K R, 1983. Value of big game from markets for hunting leases: the hedonic approach. Land
Economics (59); 287 - 291. Martinez, M L, Intralawan, A, Vazquez, G, Perez-Maqueo, O, Sutton, P, and Landgrave, R, 8-1-2007. The coasts
of our world: Ecological, economic and social importance. Ecological Economics (63); 254 - 272. McConnell, K and Strand, I E, 1994. The Economic Value of Mid and South Atlantic Sportfishing. Department of
Agriculture and Resource Economics, Mladenov, N, Gardner, R J, Flores, E N, Mbaiwa, E J, Mmopelwa, G, and Strzepek, M K, 2007. The value of
wildlife-viewing tourism as an incentive for conservation of biodiversity in the Okavango Delta, Botswana. Development Southern Africa (24); 409 - 423. Routledge,
Navrud, S and Mungatana, E D, 1994. Environmental valuation in developing countries: The recreational value of wildlife viewing. Ecological Economics (12); 125 - 139.
Pearce, D W, 2001. The economic value of forest ecosystems. Ecosystem Health (7); 284 - 296. Raheem, N, Talberth, N J, Colt, S, Fleishman, S E, Swedeen, P, Boyle, K J, Rudd, M A, Lopez, R D, O'Higgins, T,
Willer, C, and Boumans, R M, 2010. The Economic Value of Coastal Ecosystems in California . Richardson, L and Loomis, J, 3-15-2009. The total economic value of threatened, endangered and rare species: An
updated meta-analysis. Ecological Economics (68); 1535 - 1548. Ronnback, P, 1999. The ecological basis for economic value of seafood production supported by mangrove
ecosystems. Ecological Economics (29); 235 - 252. Rubin, J, Helfand, G, and Loomis, J, 1991. A benefit-cost analysis of the northern spotted owl. Journal of Forestry
(89); 25 - 30.

62
Ruitenbeek, J, 1992. Mangrove management: an economic analysis of management options with a focus on Bintuni Bay, Irian Jaya. (8); Jakarta, Indonesia.
Sacks, A and Britton, E, 2007. The Economic Value of the Financial Services Industry in The Bahamas. Oxford Economics,
Sathirathai, S, 1998. Economic valuation of mangroves and the roles of local communities in the conservation of natural resources: case study of Surat Thani, south of Thailand. EEPSEA research, Singapore.
Sathirathai, S and Barbier, E B, 2001. Valuing mangrove conservation in southern Thailand. Contemporary Economic Policy (19); 109 - 122.
Schuhmann, P, Casey, J, and Oxenford, H A, 2008. The value of coral quality to SCUBA divers in Barbados. Sealey, N E, 1994. Bahamian Landscapes. An Introduction to the Geography of the Bahamas. (2nd); 128pp. Media
Enterprises, Nassau, Bahamas. Shrestha, R K, Alavalapati, J R, Seidl, A F, Weber, K E, and Suselo, T B, 2007. Estimating the local cost of
protecting Koshi Tappu wildlife reserve, Nepal: A contingent valuation approach. Environment development and sustainability (9); 413 - 426.
Silberman, J and Williams, N A, 1992. Estimating Existence Value for Users and Nonusers of New Jersey Beaches. Land Economics (68); 225 - 236.
Spash, C L, 2000. Assessing the benefits of improving coral reef biodiversity: the contingent valuation method. Cordio, Kalmar.
Spurgeon, J, 2001. Improving the economic effectiveness of coral reef restoration. Bulletin Marine Science (62); 1031 - 1045.
Spurgeon, J and Roxburgh, T, 2005. Enhancing the Role of Economic Valuation in Coral Reef Management. Storey, D A and Allen, P G, 11-1-1993. Economic Impact of Marine Recreational Fishing in Massachusetts. North
American Journal of Fisheries Management (13); 698 - 708. Sullivan Sealey, K, Lester Flowers, A, Nero, V A, Semon, K L, and radley, K, 2005. The state of the coast: report
on Andros and South Andros. Sullivan Sealy K, 1999. Water quality and coral reefs: Temporaland spatial comparisons of changes with coastal
development. The Nature Conservancy, The University of Miami, Florida., Sullivan, C, 2005. The importance of mangroves . Sutherland, R J and Walsh, R G, 1985. Effect of distance on the preservation value of water quality. Land
Economics (61); 281 - 291. Sutton, P C and Costanza, R, 2002. Global estimates of market and non-market values derived from nighttime
satellite imagery, land cover, and ecosystem service valuation. Ecological Economics (41); 509 - 527. Talbot, F and Wilkinson, C, 2001. Coral reefs, mangroves and seagrasses: a sourcebook for managers. Australian
Institute of Marine Science, Townsville, Australia. The Nature Conservancy, 12-20-2006. Rapid Ecological Assesment of the West Coast on Andros, Bahamas. Tobias, D and Mendelsohn, R, 1991. Valuing Ecotourism in a Tropical Rain-Forest Reserve. Ambio (20); 91 - 93. UNEP and PA, 2003. The Economic Valuation of Alternative Uses of Mangrove Forests in Sri Lanka. United
Nations Environment Program, UNEP-WCMC, 2006. In the Front Line: Shoreline Protection and other Ecosystem Services from Mangroves and
Coral Reefs. 1 - 33. UNEP-WCMC, Cambridge. US Army corps and engineers, 2004. Water Resources Assessment of the Bahamas. Valiela, I, Bowen, J L, and York, J K, 2001. Mangrove forests: One ofthe world's threatened major tropical
environments. Bioscience (51); 807 - 815. van Beukering, P J H, Cesar, H S J, and Janssen, M A, 2003. Economic valuation of the Leuser National Park on
Sumatra, Indonesia. Ecological Economics (44); 43 - 62. Wattage, P and Mardle, S, 2008. Total economic value of wetland conservation in Sri Lanka identifying use and
non-use values. Wetlands ecology and management (16); 359 - 369. White, A T, Ross, M A, and Flores, M, 2000. Benefits and costs of coral reef and wetl and management, Olango
Island, Philippines. 227 - CORDIO, Kalmar University, Sweden. Woodward, R T and Wui, Y S, 2001. The economic value of wetland services: A meta-analysis. Ecological
Economics (37); 257 - 270.
63
Appendix. A1. Recommended further reading on economic valuation of natural resources.
Daily, G. et al. 2000. “The Value of Nature and the Nature of Value.” Science 289: 395-396. Garrod, G. and K.G. Willis. 1999. “Economic Valuation of the Environment: Methods and Case Studies.”
Edward Elgar. Pagiola, S., et al.: “Assessing the Economic Value of Ecosystem Conservation.” The World Bank & IUCN.
http://cmsdata.iucn.org/downloads/pagiolaritterbishoplong.pdf Rietbetgen-McCracken, J. and H. Abaza. 2000. “Environmental Valuation: A Worldwide Compendium of Case
Studies.” London: UNEP and Earthscan Publications. U.S. DEPARTMENT OF COMMERCE, 1995. Economic Valuation of Natural Resources. A Handbook for
Coastal Resource Policymakers. NOAA Coastal Program. Decision Analysis Series No. 5. A2. Recommended further reading on value transfer, economic multipliers and discount rates.
Nelson, J P & Kennedy P E, 2009. The Use (and Abuse) of Meta-Analysis in Environmental and Natural Resource Economics: An Assessment. Environmental and Resource Economics: 42 (3); 345-377.
Turner R K et al., 2003. Valuing nature: lessons learned and future research directions. Ecological economics: 46; 493-510.
Ready R, Navrud, S. 2006. International benefit transfer: Methods and validity tests. Ecological Economics 60 (2); 429-434.
Archer, B. H. (1982). “The value of multipliers and their policy implications”. Tourism Management, 3(2); 236-241.
Farber, D. A., and P. A. Hemmersbaugh. 1993. The shadow of the future: Discount rates, later generations, and the environment. Vanderbilt Law Review 46: 267-304. On-line at: http://www.ciesin.org/docs/010-291/010-291.html.
Spash C L and Vatn A, 2006. Transferring environmental value estimates: Issues and alternatives. Ecological Economics 60 (2); 379-388.
A3. Recommended further reading on Forest Valuation.
Pearce D, 2001. The Value of Forest Ecosystems. Available on-line: http://eprints.ucl.ac.uk/17587/1/17587.pdf
Krieger, D J. 2001. Economic Value of Forest Ecosystem Services: A Review. Available on-line: http://wilderness.org/files/Economic-Value-of-Forest-Ecosystem-Services.pdf
A4. Recommended further reading on Coral Reef Valuation.
Molberg, F and Folke, C. 1999. Ecological goods and services of coral reef ecosystems. Ecological Economics 29, (2): 215-233.
Brander, L., Florax, R. & Vermaat, J.E., 2006. The recreational value of coral reefs: A meta-analysis. Ecological Economics, 63(1); 209-218.
Ahmed M, Chong, C K and Cesar, H. (eds.). Economic valuation and policy priorities for sustainable management of coral reefs. Available on-line: http://www.worldfishcenter.org/resource_centre/CoralReef_14March2006_low%20res.pdf
A5. Recommended further reading on Mangrove Valuation. Rönnbäck, P. (1999). The ecological basis for the economic value of mangrove forests in seafood production.
Ecological Economics 29: 235–252

64
Gunawardena, M and Rowan, J S. 2005. Economic Valuation of a Mangrove Ecosystem Threatened by Shrimp Aquaculture in Sri Lanka. Environmental management 36 (4); 535-550.
Spaninks, F and van Beukering, P, 1997. Economic Valuation of Mangrove Ecosystems: Potential and Limitations. CREED Working Paper No 14. Available online at: http://www.iied.org/pubs/pdfs/8133IIED.pdf
A6. Recommended further reading on Wetlands Valuation.
Brander, L M, Florax, R, and Vermaat, J E, 2006. The Empirics of Wetland Valuation: A Comprehensive Summary and a Meta-Analysis of the Literature. Environmental and Resource Economics (33); 223 - 250.
Brouwer, R, 1999. A meta-analysis of wetland contingent valuation studies. Regional environmental change natural and social aspects (1); 47 - 57.
Woodward, R T and Wui, Y S, 2001. The economic value of wetland services: A meta-analysis. Ecological Economics (37); 257 - 270.
A7. Recommended further reading on Estuary Valuation.
Kramer, R. 2005. Economic Tools for Valuing Freshwater and Estuarine Ecosystem Services. Available on-line at: http://www.iwlearn.net/abt_iwlearn/events/ouagadougou/readingfiles/dukeuniversity-valuing-freshwater-estuarine-services.pdf
A8. Recommended further reading on Seagrass Valuation.
Waycott M, 2009. Accelerating loss of sea-grasses across the globe threatens coastal ecosystems. Proc. Natl. Acad. Sci. U S A. 28; 106 (30): 12377-8.
Harborne AR et al., 2006. The functional value of Caribbean coral reef, seagrass and mangrove habitats to
ecosystem processes. Adv Mar Biol. 50: 57-189.
Orth et al (2006). A Global Crisis for Seagrass Ecosystems. Bioscience 56 (12): 987-996.
A9. Recommended further reading on Beach Valuation.
Lew D K, Larson, D M. 2005. Valuing Recreation and Amenities at San Diego County Beaches. Coastal Management 33 (1); 71-86.
A10. Recommended further reading on Water Valuation. Griffin R C. 2006. Water Resource Economics. The Analysis of Scarcity, Policies, and Projects. MIT Press
Cambridge, Massachusetts. Hanemann M. 2005. The Value of Water. Available on-line:
http://are.berkeley.edu/courses/EEP162/spring05/valuewater.pdf Young R A. 2005. Determining the Economic Value of Water: Concepts and Methods. Resources For the Future,
Washington DC. A11. Recommended background reading on Conservation Finance.
Guide to Conservation Finance. WWF, 2009. Available on-line: http://www.worldwildlife.org/what/howwedoit/conservationfinance/WWFBinaryitem13074.pdf
Financing Marine Conservation. WWF, 2004. Available on-line: http://assets.panda.org/downloads/fmcnewfinal.pdf
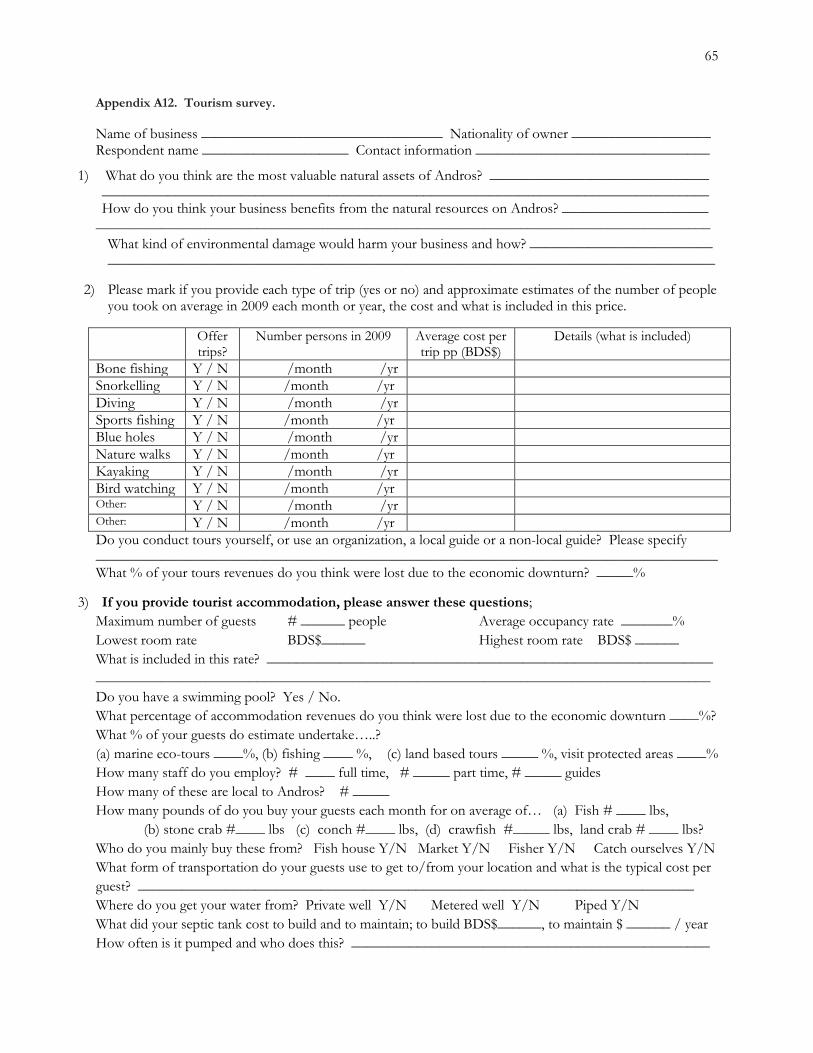
65
Appendix A12. Tourism survey. Name of business _________________________________ Nationality of owner ___________________ Respondent name ____________________ Contact information ________________________________
1) What do you think are the most valuable natural assets of Andros? ______________________________ ___________________________________________________________________________________ How do you think your business benefits from the natural resources on Andros? ____________________
____________________________________________________________________________________ What kind of environmental damage would harm your business and how? _________________________ ___________________________________________________________________________________
2) Please mark if you provide each type of trip (yes or no) and approximate estimates of the number of people you took on average in 2009 each month or year, the cost and what is included in this price.
Offer trips?
Number persons in 2009 Average cost per trip pp (BDS$)
Details (what is included)
Bone fishing Y / N /month /yr Snorkelling Y / N /month /yr Diving Y / N /month /yr Sports fishing Y / N /month /yr Blue holes Y / N /month /yr Nature walks Y / N /month /yr Kayaking Y / N /month /yr Bird watching Y / N /month /yr Other: Y / N /month /yr Other: Y / N /month /yr Do you conduct tours yourself, or use an organization, a local guide or a non-local guide? Please specify _____________________________________________________________________________________ What % of your tours revenues do you think were lost due to the economic downturn? _____%
3) If you provide tourist accommodation, please answer these questions; Maximum number of guests # ______ people Average occupancy rate _______% Lowest room rate BDS$______ Highest room rate BDS$ ______ What is included in this rate? _____________________________________________________________ ____________________________________________________________________________________ Do you have a swimming pool? Yes / No. What percentage of accommodation revenues do you think were lost due to the economic downturn ____%? What % of your guests do estimate undertake…..? (a) marine eco-tours ____%, (b) fishing ____ %, (c) land based tours _____ %, visit protected areas ____% How many staff do you employ? # ____ full time, # _____ part time, # _____ guides How many of these are local to Andros? # _____ How many pounds of do you buy your guests each month for on average of… (a) Fish # ____ lbs, (b) stone crab #____ lbs (c) conch #____ lbs, (d) crawfish #_____ lbs, land crab # ____ lbs? Who do you mainly buy these from? Fish house Y/N Market Y/N Fisher Y/N Catch ourselves Y/N What form of transportation do your guests use to get to/from your location and what is the typical cost per guest? ____________________________________________________________________________ Where do you get your water from? Private well Y/N Metered well Y/N Piped Y/N What did your septic tank cost to build and to maintain; to build BDS$______, to maintain $ ______ / year How often is it pumped and who does this? _________________________________________________

66
Appendix A13. Summary map of Ecosystem Service Values.
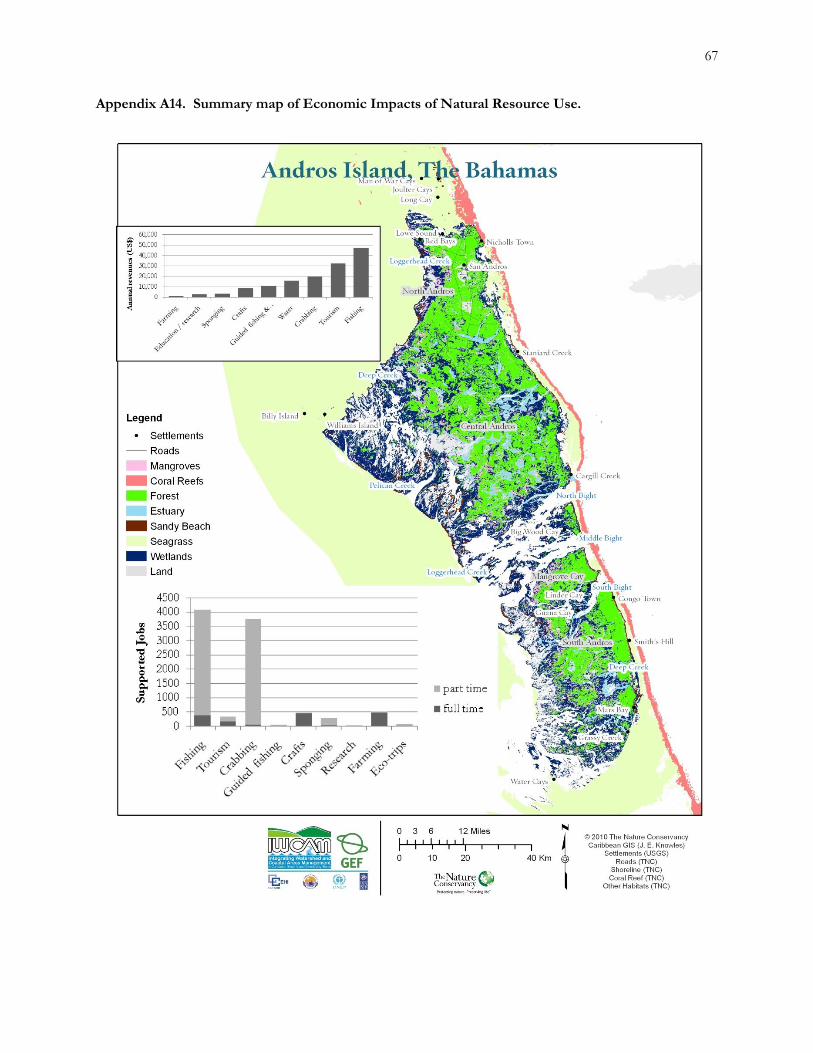
67
Appendix A14. Summary map of Economic Impacts of Natural Resource Use.
