an economic impact study june 2013 - stanford university
TRANSCRIPT

Economic Benefits of Diablo Canyon Power Plant
Prepared by:Patrick Mayeda, PrincipalDr. Kenneth Riener, Principal
In cooperation with:Pacific Gas & Electric Company
An Economic Impact StudyJune 2013
California Energy Commission
DOCKETED13-IEP-1J
TN # 71483
JULY 2 2013

In conjunction with
Produced June 2013

1
Table of Contents
Executive Summary 2
Methodology 7
Section 1: Introduction 9
Section 2: Diablo Canyon Power Plant (DCPP) 102.1 History and Information 102.2 Generation 122.3 Efficiency 122.4 U.S. Electricity Generation 13 2.5 Employment 162.6 Expenditures for Goods and Services 19 2.7 Property Taxes (Unitary) 21
Section 3: Economic and Fiscal Impacts 253.1 Local Economic Impact 283.2 California Economic Impact 333.3 National Economic Impact 403.4 Value of Environmental Benefits 46
Section 4: License Extension vs. No License Extension 484.1 Economic Impact on the Economy 484.2 Loss of Jobs 504.3 Loss of Taxes Generated 51
Section 5: Nuclear Industry Trends 525.1 Nuclear Industry Performance 555.2 Cost Competitiveness: Production Costs and Fuel Costs 56
Section 6: Community Benefits Provided by DCPP 586.1 Local Charitable Grants and Volunteerism 586.2 Environmental Preservation/Land Stewardship 606.3 Air Quality 626.4 Emergency Planning and Preparedness 646.5 Housing Values 66
Section 7: Conclusion 67
Glossary 68

2
Executive Summary
The purpose of this study is to examine the economic impacts and other benefits provided by Diablo Canyon Power Plant (DCPP), owned and operated by Pacific Gas and Electric Corporation (PG&E), on San Luis Obispo and northern Santa Barbara counties, as well as on the state of California and the United States. In 2011, DCPP supplied 9.3% of California’s electricity generation and 7% of its total consumed electricity. DCPP has operated at a steadily increasing percentage of capacity over its lifetime due to a practice of constant upgrading and updating of the equipment. The facility also boasts one of the best safety records in the industry according to the Institute of Nuclear Power Operations (INPO).
DCPP produced an estimated 18,566 megawatt hours of electricty in 2011, with a wholesale value of $675.6 million. In conjunction with the utilization of the industry-standard IMPLAN® software version 3.0 to analyze the impact of local expenditures for goods and services exceeding $22 million, a local payroll of $202.5 million, and 714 local retired PG&E employee pensions totaling over $19 million, this created a total 2011 economic impact on San Luis Obispo and Northern Santa Barbara counties of $919.8 million (Figure 1). The indirect and induced impacts totaled $244.3 million, and included positive influences on many local busi-nesses such as restaurants, real estate, wholesale trade, retail shops, financial institutions and healthcare. With 11 and 12 years remaining on the current licenses, it is expected that PG&E would continue to operate DCPP for the duration of those licenses and that the Plant would continue to generate economic benefits similar to those that exist today.
When the study area is expanded to include all of California, the economic impacts grow sig-nificantly, due primarily to two factors: larger expenditures for goods and services, and larger multipliers. DCPP purchased an average of $69.7 million in goods and services from vendors in California over the last two years. In addition to the 1,483 employees living on the Central Coast, 60 DCPP employees work and live outside the local market (mostly in San Francisco or Sacramento), which adds $7.0 million to the payroll. These expenditures increase the indi-rect impact to $90.2 million, and the induced impact to $334.3 million, for a total of $1.1 billion injected by DCPP into the California economy each year.
The total output impact for DCPP nationally is $1.969 billion. To put this number in perspective, DCPP’s production of $675.6 million of wholesale value electricity produced a total U.S. eco-nomic impact of nearly three times that number. Large expenditures averaging $291.8 million over the last two years for specialized equipment such as large steam turbines, generators and nuclear fuel (which can only be obtained outside California), causes the economic impact nationwide to increase significantly. As a comparison, San Luis Obispo County's wine industry, which includes $954.4 million in wine and grape sales and distribution, had a total national eco-nomic impact of $1.785 billion in 2007. 1
1 MKF Research LLC, "Economic Impact of Wine and Grapes in the Paso Robles AVA and the greater San Luis Obispo County 2007," Paso Robles Wine Country Alliance, 2007 (most recent available data).

3
Employment
DCPP created 3,358 jobs locally in 2011, including 1,483 jobs at the Plant. The additional 1,874 jobs created by the spending and re-spending of DCPP purchases and payroll expenditures in the local area were in varying industries including food services, hospitals and healthcare, and real estate.
To state this another way, each DCPP job has created more than one additional job in the local economy.
Due to the high-technology nature of nuclear energy production, DCPP employs a large number of highly-trained engineers, scientists, mechanical and electrical tradespeople, plant security, and other operational occupations. DCPP’s location in the largely rural area of California’s Central Coast makes it one of the few providers of a large number of well-paying, head-of-household jobs in the region. In addition, DCPP employment is not seasonal or cyclical, as are agricultural and tourism-related jobs that dominate the local labor scene. Additionally, while the public sector provides many high-paying jobs in the county, they are affected by California's State budget crisis, while DCPP jobs are not.
Although there are only 60 DCPP employees outside the local study area (statewide), the impact of the total 1,543 jobs created an additional 2,999.5 jobs in California. The skills represent a cross-section of the California labor force, from highly-trained engineers and scientists to security per-sonnel, nurses and physicians and restaurant staff. Total jobs created nationwide is similarly dra-matic: a total of 10,372 jobs were created by the operation of DCPP. As with the California analysis, these positions were in a broad spectrum of occupations and industries.
FIGURE 1: TOTAL ECONOMIC IMPACT OF DCPP
$0
$500
$1,000
$1,500
$2,000
Local
Induced
Indirect
Direct
Statewide Nationwide SLO County Wine Industr y
2007
$1.100b
$919.8m
$1.969b
Total Impact
$1.785b

4
Taxes
DCPP also had a significant impact on tax revenues. Table 1 shows that at the local level, the dominant forms of tax revenue are property taxes, which totaled $30.8 million in 2011. Of this fig-ure, over $25 million represents the Unitary Property Tax bill paid by PG&E to local entities. Most of this money goes to local school districts, County operations and other County entities. This $25 million is equivalent to what would be paid by properties with a combined assessed value of $2.5 billion, or over 5,000 homes assessed at an average $500,000 value. Additionally, at the local level, approximately $5.3 million in sales taxes are generated.
0
2,000
4,000
6,000
8,000
10,000
SLO County Wine Industry 2007
Induced
Indirect
Direct
FIGURE 2: TOTAL JOBS CREATED BY DCPP, 2011
12,000
3,358 Jobs
4,543 Jobs
10,372 Jobs
8,114 Jobs
Local Total Statewide
Total Nationwide
SLO County Wine Industry
2007

5
The total tax paid to the Federal government is substantial: $43.9 million in personal and corpo-rate income tax, $4.5 million in excise taxes and duties and $43.3 million in Social Security taxes. Social Security tax dollars fund future Social Security benefits, and the other two taxes fund vari-ous government services.
PG&E has applied for a 20 year license extension, commencing in 2024 for Reactor One and 2025 for Reactor Two. In order to derive a true representation of economic impacts resulting from a potential shutdown of the plant, the year 2027 was used as the point in time in which the Plant would continue to operate with a license extension, or would be idle due to the lack of extension.
If DCPP is granted license extension beyond 2024, the estimated economic impact for the local area in year 2027 will be $1.48 billion (See Figure 3). If license extension is not granted, only cattle grazing and the Independent Spent Fuel Storage Installation (ISFSI) operations would con-tinue at the site. The “No Extension” economic impact on the local area will be $15.2 million, a 98.9% reduction in economic benefit.
Most of the impact of a “No Extension” decision will be to the local area, and therefore is the focus of that section of the analysis. Losses of virtually all DCPP economic activity will occur, including loss of property taxes, sales taxes and direct plant expenditures.
TABLE 1: TAXES GENERATED BY DCPP, 2011
Taxes ($ millions) Local California National
Sales Taxes 5.3 7.6 19.4
Property Taxes 30.8 33.3 44.1
State & Local Taxes 42.0 51.1 84.8
Total Federal Taxes 96.5
FIGURE 3: ESTIMATED TOTAL ECONOMIC IMPACT ON LOCAL AREA (YEAR 2027), 2011
$1,476 billion
License Extension
$15.2 million
No License Extension
Direct
Indirect/Induced
$0
$200,000,000
$400,000,000
$600,000,000
$800,000,000
$1,000,000,000
$1,200,000,000
$1,400,000,000
$1,600,000,000

6
Additional Benefits
DCPP’s economics benefits to San Luis Obispo and Northern Santa Barbara County are real and measurable. In addition to recognized benchmarks including expenditures, employment, tax rev-enues, economic output and labor income, PG&E also supports the community with dollars and value not as readily measured.
PG&E takes pride in a being a good neighbor. In 2011 the company awarded more than $23 million in charitable grants to recipients throughout its service area. These donations, funded entirely by shareholders, included approximately $1.1 million distributed to more than 90 non-profit organi-zations in San Luis Obispo and Northern Santa Barbara counties. In addition, PG&E employees donated more than 31,000 hours of volunteer time to a range of local organizations serving youth, education, seniors, fine arts and environmental interests.
Land stewardship is important to PG&E, a value reflected by the company’s ongoing manage-ment of the 12,820-acres surrounding DCPP. PG&E’s commitment to stewardship has enabled coastal hiking trails to be opened for public use, including the 3.3-mile Point Buchon Trail through Montaña de Oro State Park and the Pecho Coast Trail that leads to the restored Port San Luis Lighthouse. These trails offer hiker access to spectacular coastal vistas and add to the visitor experience for the county’s important tourism industry. While these resources benefit coastal tourism, they were not valued as part of this study.
PG&E invests in and operates every day with a focus on safety and increased its expenditures for plant safety in the wake of the March 2011 Fukushima accident in Japan. In addition to extensive on site safety equipment and personnel, PG&E allocates $4 million to the San Luis Obispo County Office of Emergency Services, and anticipates spending $50 million over the next three years to meet all of the Nuclear Regulatory Commission’s post-Fukushima requirements. Many local safety systems exist because of DCPP, with emergency response trailers and emergency siren systems available for area emergencies of any kind.

7
MethodologyThe industry-standard IMPLAN 3 software and databases were used for estimating the economic impact of DCPP on local, statewide and national economies. IMPLAN was originally developed at the University of Minnesota, and then became a private firm, the Minnesota IMPLAN Group (MIG). IMPLAN software is based in the pioneering work of Nobel Prize-winning Harvard economist Wassily Leontief, who developed an Input-Output economic model that recognized the interrela-tionships among industries and between industries and households.
For instance, a dollar spent at a grocery store is divided between the suppliers of the grocery store, the workers at the grocery store, the landlord of the grocery store and the owner of the grocery store business. Any dollar spent at the grocery store is parceled out and “re-spent” by the store’s suppliers and landlord (the “indirect effect”), and the employees’ households (the “induced effect”). The “multiplier” effect of the original dollar spent combines the indirect and induced effects, often referred to as the indirect effect.
IMPLAN software and the accompanying databases all depend on the analyst to enter an input such as total employment, expected sales, or payroll in an existing or proposed business. IMPLAN then estimates the effect on revenues, payroll, employment, and taxes paid for every other sector of the economy in the study area. The key to accurate output estimates or predictions is good input estimates: purchased goods and services, number and types of employees, and average “returns to capital” for the industry/sector of the subject business or project. (IMPLAN can be also used to estimate the economic impact of not-for-profit enterprises such as schools, museums, and art shows).
In applying IMPLAN (or any other input-output analytic system) to the specific situation of DCPP, it was important to note that because most of the electricity generated by DCPP is “exported” out of San Luis Obispo County, the county does not benefit from the full retail value of the electric-ity produced. Derived from Department of Commerce, the Census Bureau, and other govern-ment sources, the economic databases used by IMPLAN appear to apply a nationwide retail price for electricity to the output of DCPP. The databases are used in estimating the GDP of San Luis Obispo County so shouldn’t be completely ignored, but to use them as a measure of the “economic impact” of DCPP on San Luis Obispo County would overstate the impact.
In order to avoid overestimating the effect of DCPP on the San Luis Obispo County/Northern Santa Barbara County market area, the authors chose to value the output at wholesale value, rather than the retail value of the electricity sold.
The IMPLAN system is a respected tool, but it does have some limitations in terms of defining an economic sector. IMPLAN relies on the North American Industry Classification System (NAICS) definitions used by the Department of Commerce (and virtually all economics researchers) for calculating the cost structure and interrelationships between a given industry and other indus-

8
tries in the economy. Relying on the IMPLAN industry/sector for electricity generation requires use of a weighted average of coal, gas, oil and nuclear power plants for determining cost struc-ture. While nuclear power is a significant player in this industry (20% nationwide), it does not dominate the category. When DCPP is analyzed as part of the electricity generation sector, the model projects a large impact on petroleum extraction, mining and rail transportation, which are clearly not appropriate for a nuclear power plant.
In order to create a model that more closely resembled a nuclear power plant, a “custom indus-try” for DCPP was created within IMPLAN. Using DCPP expenditures provided by PG&E, each expenditure was allocated using more than 100 classes of commodities and services identified within IMPLAN. IMPLAN provides an option to enter actual labor income for use in capturing the effect of employee expenditure. The data is then used to estimate the impact of household expen-ditures on the various sectors of the economy. In the present case, salary figures were provided, but in order to capture the full impact of employee spending, salary figures were increased by the estimated 40% benefit load of the health plan and retirement plan provided by PG&E to DCPP employees. The resultant impacts created the indirect and induced impacts for the model.
For the direct impact for the model, the wholesale value of the power generated was used. Note, too, that many DCPP employees who moved to the Central Coast to work at DCPP have chosen to stay here after retirement, and therefore spend their PG&E pension checks in the local economy. While a smaller factor than either employee salaries or DCPP purchases of goods and services, it is worth including in the analysis.
IMPLAN applies these inputs to the chosen economic model (local, state and national). In estimat-ing the impact of an industry, IMPLAN takes account of the interactions between industries in the study area, the import/export patterns for goods and services, and the interactions between households and industries.

9
Section 1: Introduction
The purpose of this study is to examine the economic impacts and other benefits provided by the Diablo Canyon Power Plant (DCPP), owned and operated by Pacific Gas and Electric Company (PG&E), on the Central Coast (San Luis Obispo and Northern Santa Barbara counties), state of California, and the United States. This is the third study, updating two previous reports titled “Economic Benefits of Diablo Canyon Power Plant” authored by the Nuclear Energy Institute (NEI) in 2004 and 2010, local economic impacts of decommissioning the Diablo Canyon Power Plant. Consistent with most standard economic studies, direct impacts such as employment numbers and salaries, plant expenditures, power generation sales and taxes paid are analyzed and then applied to an input/output model to estimate the indirect and induced effects on the economy. This study will quantify DCPP’s economic impacts and how those impacts relate to the overall gross product of this local area.
PG&E, California Polytechnic State University (Cal Poly), NEI and Productive Impact cooperated in the development of this study. PG&E provided detailed data on DCPP employment, expenditures and tax payments, and NEI provided recent nuclear energy trends. The methodology employed in this study utilizes standard economic impact study practices and was modified by experts from Productive Impact to more closely model a nuclear power generation plant.
Finally, faculty and staff of the Orfalea College of Business at Cal Poly peer reviewed the study to ensure that it was conducted in a manner consistent with industry standards and based on reasonable assumptions.
The report is presented in seven sections, which are:
Section 1 provides an introduction
Section 2 offers background on Diablo Canyon that includes Plant history, performance, production costs, taxes paid and local area details such as total employment and earnings
Section 3 examines the economic impacts of the Plant at local, state and national levels
Section 4 provides benefits not captured in a standard input/output analysis
Section 5 examines the net economic impact caused by license extension vs. no license extension beyond 2025
Section 6 discusses nuclear energy trends such as performance, cost competitiveness and industry safety
Section 7 provides a conclusion
A glossary is included at the end of the report
9
10
25
48
52
58
67
68

10
Section 2: Diablo Canyon Power Plant
This section includes a brief history of DCPP as well as information on the facility's capacity, per-formance and employment numbers. It also discusses national production costs, local data (such as county demographics), total employment and earnings.
2.1 History and Information
The Diablo Canyon Power Plant is located along the Pacific Coast of California about halfway between Los Angeles and San Francisco near Avila Beach. The plant occupies fewer than approxi-mately 545 acres of the 12,820 acre-property owned by Pacific Gas and Electric Company. The remaining property is maintained as part of the PG&E Land Stewardship Program. Originally owned by the Pecho and Marre families, the outlying property continues to be used for cattle grazing and agriculture under PG&E-managed leases.
DCPP began commercial operation in 1985. The plant is powered by two Westinghouse-designed 4-loop pressurized water reactors (PWR) – Unit 1 and Unit 2. The two reactors have a generation capacity of 2,300 megawatts and produce about 18,000 gigawatt hours (GWh) of electricity annually.
FIGURE 4: LOCATION OF DCPP
41
41
41
46
46
33
33
33
5858
1
1
1
1
166
46101
101
Ragged Point
San Simeon
Cambria
Harmony
Cayucos
Los Osos
Baywood Park
Morro Bay
San Miguel
Paso Robles
Templeton
Atascadero
Santa Margarita
Santa Margarita Lake
Lopez Lake
TwitchellReservoir
San Luis Obispo
Avlia Beach
Pismo BeachGrover Beach
Oceano
NipomoCuyama River
San Luis Obispo CountyDiablo CanyonPower Plant
Arroyo GrandeShell Beach
California Valley
Shandon
Lake Nacimiento
Los Angeles
San Francisco
Source: www.calpoly.edu

11
Three 500 kilovolt transmission lines, known as the Diablo Loop, connect the Diablo Canyon Nuclear Power Plant to the electrical grid by providing parallel transmission paths between two substations (Gates and Midway).
The company delivers power to 15 million customers, or one in every 20 Americans.
In 2009, PG&E filed an application with the Nuclear Regulatory Commission (NRC) to extend the operating license for DCPP. The two nuclear reactors are currently licensed until 2024 and 2025, respectively, and will be decommissioned if the Nuclear Regulatory Commission (NRC) does not extend the licenses for an additional 20 years (to 2044 and 2045).
In March 2011, a devastating earthquake struck northern Japan, creating a tsunami that caused extensive damage to the Fukushima Nuclear Power Plant. PG&E voluntarily suspended its license renewal application while it completed advanced seismic studies of earthquake faults in the region.
In addition to its ongoing investments in safe operations, DCPP expects to spend a total of $50 million over the next three years to meet internal goals and all of the NRC’s post-Fukushima requirements.
The two PWRs with steam generators are housed in two massive steel-reinforced concrete con-tainment structures centered between a turbine building, spent-fuel handling building and secu-rity facilities. Other plant components include water intake system, water discharge structure and the independent spent fuel storage installation (ISFSI) known as dry cask storage. The ISFSI is an interim storage facility built to store spent fuel used to generate electricity at DCPP.

12
2.2 Generation
Generating at least 22% of the power PG&E provides to the 48 California counties in its service territory, DCPP provides low-cost, carbon-free electricity for nearly 3 million Northern and Central California homes, and does so without the approximately 6 to 7 million tons per year of greenhouse gases (GHG) that would be emitted by conventional generation sources. Nuclear power plays a major role in meet-ing the state’s growing energy demand while helping efforts to improve air quality.
The plant has two Westinghouse-designed 4-Loop pressurized-water nuclear reactors (PWR). Together, the twin 1,150 megawatt reactors–known as Unit One and Unit Two–produce about 18,000 gigawatt hours of clean, reliable and affordable electricity annually, sent via three 500-kV lines that connect to this plant to the grid. Unit One went online on May 7, 1985, and is currently licensed to oper-ate through November 2, 2024. In 2011, Unit One generated 9,863,660 megawatt hours of electricity, at a nominal capacity factor of 100.4 percent. Unit Two went online on March 3, 1986, and is licensed to operate through August 20, 2025. In 2011, Unit Two generated 8,702,414 Mwh of electricity, at a capacity factor of 88.9% (See Table 2).
2.3 Efficiency
DCPP is a leader in the nuclear energy industry. As shown in Figure 5, DCPP maintained capacity fac-tors at or above the industry average for most of its years of operation. In the three years previous to 2011, DCPP replaced steam generators for both reactors, causing capacity factors to dip slightly dur-ing the replacement project outage. Since completing the project, DCPP has outperformed the current national average for capacity by 5.6%.
TABLE 2: DIABLO CANYON POWER PLANT GENERATION, 2011
Mw=megawatts PWR=pressurized water reactor Mwh=megawatt hours Capacity factor (output proportion of their nominal full-power capacity)
Unit Number
Net Capacity
Mw
Net Generation
Mwh
Capacity Factor
Percent
Commercial Operation
Year
License Expiration
Year
Reactor Type
1 1,122 9,863,660 100.4 1985 2024 PWR
2 1,118 8,702,414 88.9 1986 2025 PWR
FIGURE 5: HISTORICAL DCPP CAPACITY FACTORS (TOTAL PLANT), 2011
Average DCPP Units 1&2 Industry Average
120
100
80
60
40
20
0
19721975
19781981
19841987
19901993
19981999
20022005
20082011
94.689.0

13
2.4 U.S. Electricity Generation
Coal and natural gas-powered plants generate more than half of the nation’s electricity. 19% of energy Americans consume comes from nuclear sources (See Figure 6). Although renewable energy is on the rise, it still accounts for only 12.7% of overall generation. Wind power (2.9%) is second to hydroelectric power (8.0%), and continues to grow more quickly than all other renew-ables.
California’s in-state electricity generation system produces more than 200,000 gigawatt-hours each year, transported over the state’s 32,000 miles of transmission lines. In 2011, California sources produced 70% of the electricity used in the state. The remaining 30% was imported from the Pacific Northwest (10%) and the U.S. Southwest (20%). Natural gas is the main source for elec-tricity generation at 45% of the total in-state electric generation system power.
Nuclear power provides 18.4% of California’s electricity generation, with DCPP supplying 18,556,074 Mwh, or 9.3% in 2011. According to the California Energy Commission, demand for electricity in California will continue to rise despite the fact that the California industrial sec-tor’s power demands will remain flat. The main drivers for increased electricity demand lie in commercial, agricultural and residential sectors. Rise in demand will be driven by an increase in the number of households and the number of people per household as well as demand for more commercial floor space. Additionally, it is estimated that electric car charging will increase the average household demand 370 kWh by 2022. 2 Each electric vehicle load is the equivalent of add-ing two new houses to a neighborhood, if those vehicles are charged during peak energy times.
FIGURE 6: SOURCES OF U.S. ELECTRICITY GENERATION, 2011
Source: U.S. Energy Information Administration
Renewables 12.7%
Petroleum 0.7%
Natural Gas 24.3%
Coal 43.3%
Nuclear Power 19.0%
Hydropower 8.0%
Wind 2.9%
Biomass Wood 0.9%
Biomass Waste 0.5%Geothermal 0.3%
Solar 0.1%
2 Preliminary California Energy Demand Forecast 2012-2022, California Energy Commission, August 2011.

14
California’s challenge is to ensure adequate electricity supplies while reducing greenhouse gas emissions as required by Assembly Bill 32: Global Warming Solutions Act. AB32 calls for reduc-tions in greenhouse gas emissions to 1990 levels by the year 2020.
In addition, under the Renewables Portfolio Standard, the State's goal was to increase the amount of electricity generated from renewable energy resources to 20% by 2010. PG&E is on track to surpass 25% renewable energy resources in 2013. Legislation passed in 2011 pushes that goal to 33% by 2020. Currently, California’s in-state renewable generation is comprised of biomass, geothermal, small hydro, wind and solar generation sites that make up approximately 17% of the total in-state generational output.3
DCPP electricity production costs remain competitive. At 2.78 cents per kilowatt-hour, DCPP’s aver-age production costs are lower than all other forms of electricity, but are higher than the national average of 2.19 cents per kilowatt-hour for nuclear power (See Figure 7). California’s higher taxes, wages, and regulatory/corporate taxes drive up production costs for DCPP by about 20%. Production costs include the operation, maintenance and fuel costs of each type of plant.
3 California Electricity Statistics & Data, http://energyalmanac.ca.gov/electricity/index.html, 2011
Renewable 5.0%
Nuclear 19%Nuclear 22%
Hydro (All) 8%
Other 1.0%
Coal 42%
Hydro (Large) 18%
Renewable 19%
Natural Gas 25%Natural Gas 25%
Other 1%
Market Purchases 15%
FIGURE 7: 2011 ELECTRIC GENERATION PORTFOLIO MIX
PG&E vs. National Average
U.S. National Average PG&E's Portfolio

15
It is estimated that $243 billion has already been invested worldwide in renewable electricity sources, with China, Germany and the U.S. leading the way. However, geographical remoteness and high capital costs have caused the use of renewables to be less than expected. A wind farm or a solar park requires a large amount of land compared to a nuclear power plant.
To build the equivalent of a 1,000-Mw nuclear plant, a solar park would require 11,000 acres of PV solar panels and a wind farm would need 50,000 acres of wind turbines. By contrast, Diablo Canyon is able to produce twice as much power (2300 Mw) in a footprint of approximately 545 acres.4
Production costs for renewable electricity sources are currently difficult to estimate. Renewables are comparatively more expensive because of the large scale production needed for significant cost reduction. Experts believe, however, that the costs per kWh will come down over time as economies of scale improve. A cost comparison performed in 2010 of renewable production costs is shown in Figure 9.
FIGURE 8: US ELECTRICITY PRODUCTION COSTS, PER KWH
FIGURE 9: COMPARISON OF PRODUCTION COSTS, 2010
25.00
20.00
15.00
10.00
5.00
19951996
19971998
19992000
20012002
20032004
20052006
20072008
20092010
2011
21.56 cents
4.51 cents3.23 cents2.19 cents
Coal Gas Nuclear Petroleum
0
Gas/Oil
cent
s pe
r kw
h
16
14
12
10
8
6
4
2
0Solar Wind Fusion Biomass Hydroelectric Coal Nuclear
10-14 cents
7-9 cents
Range
4.0 cents3.1 cents
2.2 cents
15.0 cents
12.0 cents
10.0 cents
4 US Department of Energy, Office of Utility Technologies, Energy Efficiency and Renewable Energy & Electric Power Research Institute; US Department of Energy, Energy Information Administration; American Wind Energy Association
Source: Planetsave.com

16
2.5 Employment
DCPP provides a large number of well-paying jobs not only to residents of San Luis Obispo and Northern Santa Barbara counties, but to residents throughout California and the nation as well. With 1,483 employees living in San Luis Obispo and northern Santa Barbara counties, DCPP is the area's largest private sector employer and the fifth largest overall. Only the County of San Luis Obispo, California Polytechnic State University, Atascadero State Hospital and the California Men’s Colony employ more people than does DCPP. Locally, the payroll of DCPP in 2011 totaled $202.5 million, with an average salary of $136,561 (See Table 3). Because many of the jobs at DCPP are highly skilled, DCPP employees are compensated well above the 2010 county median household income of $57,365.5 Technical/maintenance and engineering jobs make up about 35% of all jobs held at DCPP (See Figure 10).
5 U.S. Census Bureau data; California median household income is $60,883
Other 9.8%
Building Services 3.1%
Education 4.0%
Office Administration 4.4%
Engineering 13.7%
Project Management 11.6%
Technical Repair/Maintenance 7.8%
Security Services 20.0 %
Support Services 19.4%
FIGURE 10: DCPP JOB CLASSIFICATIONS

17
TABLE 3: DCPP EMPLOYEES, 2011
Home City Employees Average Salary Total Payroll
Arroyo Grande 243 $135,778 $32,994,071
Atascadero 216 $138,340 $29,881,338
Avila Beach 29 $155,404 $4,506,729
California, not Local 60 $116,819 $7,009,114
Cayucos/Cambria 5 $164,422 $822,111
Creston/Shandon/Templeton 71 $136,710 $9,706,438
Grover Beach 109 $130,734 $14,250,046
Guadalupe/Lompoc/Orcutt 8 $112,036 $896,286
Los Osos/Morro Bay 76 $131,055 $9,960,143
Nipomo 117 $136,311 $15,948,444
Oceano 29 $143,471 $4,160,648
Paso Robles/San Miguel 128 $137,006 $17,536,712
Pismo Beach/Shell Beach 73 $145,101 $10,592,375
San Luis Obispo 238 $141,912 $33,775,156
Santa Margarita 15 $130,819 $1,962,282
Santa Maria 126 $123,234 $15,527,528
U.S., not CA 16 $140,753 $2,252,041
Subtotals
Local 1483 $136,561 $202,520,307
State 1543 $135,794 $209,529,421
National 1559 $135,844 $211,781,462

18
In addition to their base salaries, PG&E employees enjoy a higher-than-average benefit load of approximately 40%.6 PG&E's business requires finding and retaining highly qualified employ-ees to ensure that the company continues to deliver high-quality, cost effective, uninterrupted service to all of its customers.
An added benefit of DCPP salaries is that total employment numbers, salaries and benefit costs are not seasonal, subject to national economic cycles or State budget woes. In that sense, DCPP is a significant financial stabilizer to the local economy which has been buffeted in recent years by a number of factors such as fluctuations in crop values in the agriculture sector, reduced tourist spending due to the economic recession and wide fluctuations in government payroll. All have all affected local economic stability.
There are 714 retired PG&E employees who reside in San Luis Obispo and Santa Barbara coun-ties, most of whom were likely employed at DCPP. Total 2011 pension cost for the local retir-ees was estimated at $19,049,361. Since PG&E and its employees pay into Social Security, DCPP retirees also qualify for Social Security benefits. And since retirees continue to receive medical coverage from PG&E, they will likely not utilize Medi-Cal or other publicly-funded medical insur-ance programs.
6 Benefit load typically includes health benefits, 401k type plans, and retirement/pension plans.

19
2.6 Expenditures for Goods and Services
DCPP is a major purchaser of goods and services from local, state and national sources, averag-ing over $374.6 million per year nationally. Purchases include procurement of parts, tools and services from a wide variety of businesses. Expenditures vary from year to year as shown in Table 4.
Local expenditures in San Luis Obispo and Northern Santa Barbara counties in 2011 totaled about $21.8 million, owing in part to PG&E’s policy of sourcing goods and services locally wherever feasible. When specialty parts or expertise are unavailable locally, DCPP goes out of area to pur-chase goods and services. PG&E’s state and nationwide spending in 2011 totaled $78.8 million and $298.7 million, respectively. The jump in nationwide expenditures from 2010 to 2011 reflects increased fuel costs, capital expenditures and upgrades, and purchase of specialty services that cannot be found in California.
$78,846,203
$298,717,739
$21,769,134
Local Statewide National
2008 2009 2010 2011
FIGURE 11: DCPP EXPENDITURES 2008–2011
TABLE 4: DCPP EXPENDITURES BY STUDY AREA
*San Luis Obispo and Northern Santa Barbara counties
2008 2009 2010 2011 Average
Local* $18,876,057 $16,067,412 $14,648,894 $21,769,134 $17,840,374
California $64,141,332 $57,234,057 $53,334,162 $78,846,203 $63,388,938
Nationwide $492,576,885 $422,540,247 $284,930,918 $298,717,739 $374,691,447

20
DCPP benefits the community in a number of ways, including sourcing local goods and services whenever possible. San Luis Obispo and Santa Barbara counties have enjoyed–on average–$21.8 million of direct spending in the community from the operations of DCPP. The specialized nature of a nuclear plant requires that purchase, maintenance and repair of power generation equipment and parts are priorities (See Figure 12 for the top 25 impacted sectors). There are many qualified service companies in the local area that DCPP uses whenever possible.
Wholesale purchase of goods and partsMaintenance and cleaning services to building
Maintenance and repair constructionPower generation equipment and parts
Miscellaneous professional and technical servicesSpecialized design services
Environmental and other technical consulting servicesMachinery and equipment rental and leasing
Maintenance and repair of nonresidential buildingsSecurity services
Building materialsWaste management services
Food servicesEngineering services
Miscellaneous store retailersOther support services
Industrial building constructionAutomotive repair and maintenance
Advertising and related servicesSwitchgear and switchboard apparatus manufacturing
Other new constructionState and local non-education
Electronics storesTelecommunications
Management and consulting servicesAll other sectors
5,988,17210,323,555
3,353,208
1,386,5881,241,921
422,154159,097172,369215,660223,210224,547227,522
252,327270,317273,453316,539336,404348,002413,035528,508623,372835,239
1,656,5941,925,277
2,237,1632,453,893
FIGURE 12: TOP 25 EXPENDITURES IN SAN LUIS OBISPO AND SANTA BARBARA COUNTIESTOTAL 2011 LOCAL EXPENDITURES $21,769,134

21
2.7 Property Taxes (Unitary)
Public utility assets, including generating facilities like DCPP, are subject to the same taxation as other property. By State law (Article XIII, Section 19 of the California State Constitution), public utilities pay property taxes directly to the State Board of Equalization (BOE) which in turn, distrib-utes taxes back to the local taxing jurisdictions.
The BOE establishes property taxes for utility companies based on the value of all utility–oper-ated property and assets throughout the state. This is called a single "unitary" value, and is used instead of separately assigning a value to each component part. The BOE allocates the unitary value of public utility assets among taxing jurisdictions in proportion to the replacement cost new, less depreciation, value of each item of unitary property. The amount of the tax revenues distrib-uted back to each county is based on the ratio of the total unitary value to the proportion of total PG&E property located in a particular county.
Without Proposition 13 protection and as DCPP performs plant capital improvements for safety or in preparation for potential relicensing, PG&E’s unitary tax liability continues to increase each year.7 As shown in Figure 13, unitary tax distributions have a significant effect on numerous local entities, especially schools and other county and city operations.
As a result of multibillion-dollar investment made by PG&E in DCPP, the Power Plant has a very large property assessment. PG&E’s 2011/2012 Unitary Property Tax payment for San Luis Obispo County was $25,373,098.8 This is the equivalent of a one % property tax on over 5,070 single-fam-ily residences (assuming an average assessed value of $500,000 per residence). And given that DCPP provides its own water, sewer, and roads, and most of its own security and fire protection, the plant places a very low burden on County public services.
7 Proposition 13 was passed in California in 1978 and established a fixed property tax rate of 1% of assessed value (plus amounts required to repay any assessment bonds approved by the voters). Source: California State Board of Equalization, 2013 8 Data obtained from actual 2011 San Luis Obispo County tax records for PG&E. Although 88% of the actual unitary taxes paid are directly attributable to DCPP, it could be argued that without the existence of DCPP, much of the other PG&E property would not be in existence (i.e. power transmission lines, etc.)

22
SLO Co Community College $1,916,636
Education Resource Augmentation Fund (ERAF-State Transfer) $2,276,290
County School Service $1,136,971
San Luis Coastal Unified$9,241,539
$1–$24,900**
$25,000–$249,000*
Roads $295,145
General Fund $6,784,180
Lucia Mar Unified $544,903
County Library $489,972
Atascadero Unified $389,190
Port San Luis Harbor $382,246
Paso Robles Unified $356,045
FIGURE 13: PG&E 2011/2012 UNITARY TAX REVENUE ALLOCATION
*There are 17 governmental entities that receive between $25,000 to $249,999 **There are 63 governmental entities that receive between $1 to $24,999

23
To help understand the substantial effect that annual DCPP unitary tax payments have on the Central Coast, a sampling of three jurisdictions that receive unitary taxes is reviewed below.
San Luis Obispo County General Fund:
The total 2011-2012 budget for San Luis Obispo County is $464,428,463, with $383,347,164 earmarked for the General Fund. The General Fund receives 26.7% of the DCPP unitary tax payment each year. In 2011, the County of San Luis Obispo received $6,784,180 from PG&E’s tax payment, which accounts for 1.8% of the County’s General Fund. These mon-ies help fund public work projects, probation and sheriff offices and health and other vital services. This $6.8 million could fund both the Animal Shelter ($1.58 million) and Child Support Services ($4.87 million) in their entirety.
As the County budget is subject to shortfalls, DCPP’s steadily-growing property tax pay-ment helps mitigate potential cuts to funds for roads, libraries and employees' jobs and benefits. PG&E pays more property taxes than any other entity in the county because of the method of assessment and lack of Proposition 13 property tax protection. As long as Diablo Canyon operates, payments will continue.
San Luis Coastal Unified School District:
In the 2010/2011 tax year, San Luis Coastal Unified School District received $9,241,539, or 36.4% of the unitary taxes paid by PG&E. The overall school district budget for 2012/2013 is estimated at $79.9 million. PG&E’s unitary tax payment supports approximately 11.6% of the school district’s entire budget. The amount of annual property tax dollars received by the school district from PG&E has led to the district becoming a "basic aid" or "com-munity funded" district.
Basic aid districts do not receive funding based on enrollment. Rather, districts rely on a large, steady property tax base that creates a stable revenue source for the districts, mitigating the effects of State budget shortfalls. Despite its status as a basic aid school district, San Luis Coastal Unified School District is experiencing budgetary challenges and has made cuts in personnel and programs including music, adult education, special education and professional development. Cuts would have been more severe and much earlier if not for the unitary taxes paid by PG&E.

24
Port San Luis Harbor District:
In 1954, the citizens of southern San Luis Obispo County voted to create and fund a Harbor District for the Port San Luis area. The district was created to help refurbish and maintain the Harbor District’s old facilities and increase commerce for the South County. Five har-bor commissioners were elected and, in 1955, the State Legislature granted the Harbor District the area’s tidelands in trust. The State of California owns and manages the waters extending to the three-mile mark. The Harbor District owns the Harford Pier and sur-rounding property.
In 2011/2012, the Harbor District’s $4,166,400 budget was used to repair District facilities and tend to environmental responsibilities while maintaining funds needed to serve the boating and general public. PG&E’s unitary tax payment allotment to the Harbor District for 2011/2012 is $383,246, or 9.2% of the Harbor District’s total budget. In 2011/2012, the Harbor District budgeted $50,000 for Harford Pier and Canopy design and permits in preparation for a $1.5 million Pier and Canopy upgrade. Without the tax dollars paid by PG&E, that project could have been delayed or postponed indefinitely. Many additional projects - such as land craft mechanized repairs, parking lot repaving or dredging pump replacements - could be at risk without this tax revenue stream.

25
Section 3: Economic and Fiscal ImpactsMost of DCPP’s employees live in San Luis Obispo County or Northern Santa Barbara County. Wages employees receive are mainly spent in their area of residence. DCPP strives to source local vendors for its expenditures; however, a significant amount of goods and services are procured from outside the local area and much of the specialized equipment and technical expertise must be purchased outside California.
Terminology
In economic parlance, the direct impact of a business or project is the total value of the good or service generated by the business or activity being analyzed. For a private business, direct impact would generally be the sales generated by the firm. For a public service, such as a homeless shel-ter, it would be the value of the services delivered. For certain types of activities, such as retail or wholesale trade, the total output direct impact is the difference between the price of the goods purchased for sale, and the revenues received from the sale. The logic of this difference is that the wholesale price of the goods is already captured in the output of the producers of the goods.
The indirect impact of a business is the revenue generated by other firms as a result of the busi-ness' operation. For example, if a supermarket buys lettuce from a local farm, the farm’s sale to the supermarket is classified as indirect impact.
The induced impact of a business/activity is the change in household expenditures, owing to the business operation. For instance, spending by employees of the supermarket as well as employ-ees of the farm and other suppliers generate induced impact.
The distinction between indirect impact and induced impact is very important to economists but may not have as much interest to the public. Economic impact reports often combine indirect impact and induced impact, and report the total as indirect impact. This report maintains the dis-tinction between the two for readers interested in seeing the information.
Another term which needs some explanation is imputed rental activity [or IRA Value] for owner-occupied dwellings. IRA value methods were developed by national accounting economists to determine the economic effect of household expenditures used for purchasing and maintaining a home. IRA assumes that homeowners are their own landlords, and that while homeowners are not paying rent to landlords, payments for mortgages, landscaping and maintenance stimulate the economy in the same way that a landlord’s expenditures for these same expenses do and are accounted for in the national accounting totals. Even while “imputed rental value” is not as con-crete an expenditure as are purchases of food and furniture, it is a legitimate contributor to the economy.
26
Tax Effects
In addition to the local expenditures directly or indirectly attributable to the presence of DCPP, another significant benefit is the increased tax revenue from these activities. Tax revenues take several forms: personal and business income taxes, property taxes, sales taxes, building permits, auto license fees and many other taxes. Since many of these taxes are used to cover the cost of providing a related service, they are reported separately.
Value of Electricity Produced
When modeling the economic activity of DCPP, the direct impact is the value of the electricity generated at DCPP. Using production figures and daily spot wholesale rates, the value of this electricity is estimated at $675.6 million in 2011. When comparing this value to the $1.226 billion total value of all electricity generated in San Luis Obispo County as reported by the Department of Commerce, it reinforces the conservative nature of this study.
The $1.226 billion represents approximately 10% of San Luis Obispo County's total Gross Regional Product, but it has little direct effect on the people of San Luis Obispo County, since most of the power is exported to other areas of PG&E's market. And although Department of Commerce does not report DCPP's electricity output separately, there are no other significant sources of electric-ity generation in San Luis Obispo County other than the Morro Bay Power Plant, which is only put into service during times of very high demand, and two Carrizo Plains solar projects that have not yet come online. Therefore, it is safe to assume that the entire $1.226 billion estimation represents only the electricity generated by DCPP.
Model Inputs
DCPP’s spending lifts economic activity. This effect is experienced by the private sector through increased sales and employment, and by the public sector through increased tax revenue to sup-port public services. The economic and fiscal impacts of DCPP’s operations go well beyond spend-ing on employee and retiree benefits, purchases, salaries, and taxes. They also reflect the strong stimulus that plant operations provide to key measures of economic activity–the value of electric-ity production, employment, and labor income–in the economy. More important to local residents are the effects of money flowing into the local economy as a result of DCPP’s presence here. This cash stimulus comes in three main forms: local expenditures by DCPP employees, which is based upon their salaries and benefits, purchases of goods and services from local vendors and local expenditures by retired DCPP employees who have stayed in the area after retirement.

27
Employee Expenditures
The number of employees working at DCPP and residing on the Central Coast at the end of 2011 was 1,483. Total payroll during 2011 was $202,520,307. In addition to salaries, DCPP employ-ees receive competitive benefits in the form of healthcare, dental care and retirement benefits, generally about a 40% additional value. DCPP employees have a guaranteed benefit retirement plan similar to Cal Poly or municipal employees. This means that they have to set aside less in tax-deferred retirement plans and have more discretionary income to spend locally. More of their wages can be used to purchase homes, groceries, cars, meals and movie tickets. As a result, the induced impact of these wages is about the same as the direct wages–$203.2 million.
Purchases of Goods and Services
The next largest source of financial stimulus to the local economy results from DCPP’s pur-chases of goods and services from local businesses and tradespeople. The list of local vendors includes office supply stores, plumbers, fence builders, roofers, welders, painters, parts and hardware stores. The actual mix varies significantly from year to year, so 2010 and 2011 expendi-tures were averaged to obtain a representative mix. The average annual expenditure (or “spend”) was $18,209,014.
Retiree Expenditures
The third source of financial stimulus is money spent locally by DCPP retirees. There were 714 PG&E retirees living in San Luis Obispo and Northern Santa Barbara counties at the end of 2011, with estimated pensions of $19,049,361 for the year.
Study AreaLocal
(San Luis Obispo and Santa Barbara counties)
State(California)
National(USA)
Employees 1,483 1,543 1,559
Payroll $202,520,307 $209,529,421 $211,781,462
Annual Expenditures for Goods and Services
$18,209,014 $69,735,934 $293,585,539
PG&E retirees living in San Luis Obispo/Santa Barbara counties
$19,049,361 n/a n/a
Total $239,780,165 $279,266,898 $505,581,900
TABLE 5: DCPP VITAL STATISTICS 2011

28
3.1 Local Economic Impact
Economic Impact in the Local Economy
The largest economic impact of DCPP on San Luis Obispo and Santa Barbara Counties is in the imputed rental activity for owner-occupied dwellings. As described earlier, this variable is the “rent” that homeowners would pay to rent their own homes. It reflects DCPP employees and suppliers stimulus to the local economy by building and maintaining homes. Homes are seen as both an invest-ment as well as a “consumer durable good." Seven of the remaining top ten categories listed on Table 6 reflect the consumption, healthcare, and investment expenditures of DCPP employees, and employees of DCPP vendors. The only exception, wholesale business, ranks high because of DCPP’s policy of purchasing goods from local vendors where feasible. Many commodity-type goods, such as petroleum products and some office supplies, can be purchased in wholesale quantities.
Rank Description Direct* Indirect* Induced* Total
Total $675,572,354 $21,996,794 $222,253,912 $919,823,060
1 Electric power generation, transmission, and distribution $675,572,354 $113,870 $3,988,787 $679,675,011
2 Imputed rental activity for owner-occupied dwellings $0 $31,864,664 $31,864,664
3 Offices of physicians, dentists, and other health practitioners $362 $14,312,112 $14,312,474
4 Real estate establishments $213,473 $12,318,973 $12,532,446
5 Food services (i.e. restaurants) $139,381 $12,245,125 $12,384,506
6 Private hospitals $351 $10,282,620 $10,282,971
7 Wholesale trade businesses $299,395 $8,020,818 $8,320,213
8 Monetary authorities and depository credit intermediation activities $159,237 $7,486,983 $7,646,220
9 Petroleum refineries $194,874 $6,809,443 $7,004,318
10 Securities, commodity contracts, investments, and related activities $73,168 $6,289,903 $6,363,071
11 Nondepository credit intermediation and related activities $112,482 $4,717,455 $4,829,937
12 Medical and diagnostic labs and outpatient and other ambulatory care $16,396 $4,453,737 $4,470,133
13 Retail Stores - Food and beverage $4,920 $4,184,188 $4,189,108
14 Other state and local government enterprises $37,264 $3,422,775 $3,460,039
15 Retail Stores - Motor vehicle and parts $6,253 $3,167,321 $3,173,574
16 Nursing and residential care facilities $0 $3,141,147 $3,141,147
17 Telecommunications $118,315 $2,825,343 $2,943,658
18 Retail Stores - General merchandise $3,423 $2,930,800 $2,934,223
19 Facilities support services $2,667,004 $60,379 $2,727,383
20 Legal services $101,803 $2,509,997 $2,611,800
21 Management, scientific, and technical consulting services $1,442,994 $1,085,823 $2,528,817
22 Retail Nonstores - Direct and electronic sales $2,197 $2,328,031 $2,330,228
23 Civic, social, professional, and similar organizations $20,235 $2,218,715 $2,238,950
24 Retail Stores - Clothing and clothing accessories $2,379 $2,207,133 $2,209,511
25 Maintenance and repair construction of nonresidential structures $658,288 $1,337,986 $1,996,273
Total all other categories $15,608,731 $68,043,653 $83,652,384
TABLE 6: DCPP LOCAL TOTAL ECONOMIC IMPACT, 2011
Source: © 2012 Minnesota IMPLAN Group, Inc.*Direct: Total value of the good or service generated by the business or activity being anaylzed. Indirect: Revenue generated by other firms. Induced: Change in household expenditures.
29
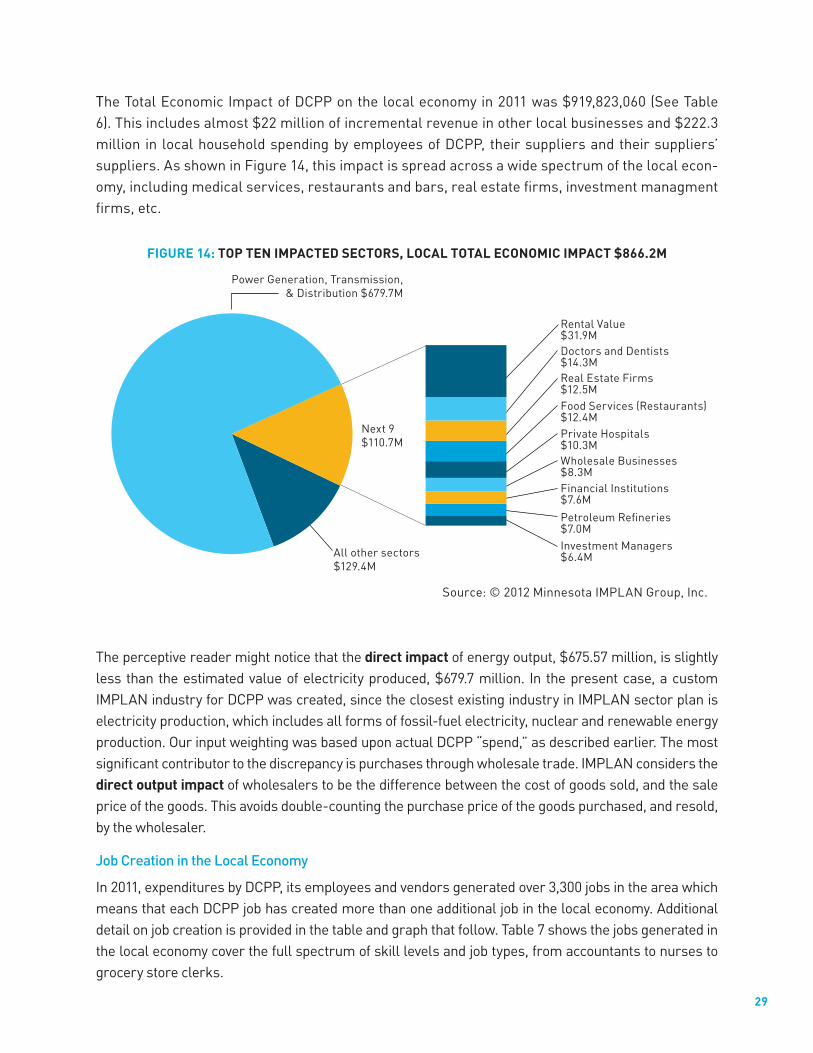
The Total Economic Impact of DCPP on the local economy in 2011 was $919,823,060 (See Table 6). This includes almost $22 million of incremental revenue in other local businesses and $222.3 million in local household spending by employees of DCPP, their suppliers and their suppliers’ suppliers. As shown in Figure 14, this impact is spread across a wide spectrum of the local econ-omy, including medical services, restaurants and bars, real estate firms, investment managment firms, etc.
Rental Value$31.9M
Wholesale Businesses$8.3M
Private Hospitals$10.3M
Food Services (Restaurants)$12.4M
Real Estate Firms$12.5M
Doctors and Dentists$14.3M
Financial Institutions$7.6MPetroleum Refineries$7.0MInvestment Managers$6.4M
Power Generation, Transmission,& Distribution $679.7M
Next 9$110.7M
All other sectors$129.4M
FIGURE 14: TOP TEN IMPACTED SECTORS, LOCAL TOTAL ECONOMIC IMPACT $866.2M
The perceptive reader might notice that the direct impact of energy output, $675.57 million, is slightly less than the estimated value of electricity produced, $679.7 million. In the present case, a custom IMPLAN industry for DCPP was created, since the closest existing industry in IMPLAN sector plan is electricity production, which includes all forms of fossil-fuel electricity, nuclear and renewable energy production. Our input weighting was based upon actual DCPP “spend,” as described earlier. The most significant contributor to the discrepancy is purchases through wholesale trade. IMPLAN considers the direct output impact of wholesalers to be the difference between the cost of goods sold, and the sale price of the goods. This avoids double-counting the purchase price of the goods purchased, and resold, by the wholesaler.
Job Creation in the Local Economy
In 2011, expenditures by DCPP, its employees and vendors generated over 3,300 jobs in the area which means that each DCPP job has created more than one additional job in the local economy. Additional detail on job creation is provided in the table and graph that follow. Table 7 shows the jobs generated in the local economy cover the full spectrum of skill levels and job types, from accountants to nurses to grocery store clerks.
Source: © 2012 Minnesota IMPLAN Group, Inc.

30
FIGURE 15: ECONOMIC IMPACTS OF DCPP EMPLOYMENT
Pensions107.03.2%
Employee Wages1,593.0
47.4%
Direct Jobs of DCPP1,483.044.2%
Expenditures174.55.2%
Rank Description Direct* Indirect* Induced* Total
Total 1,483.0 132.2 1,742.3 3,357.5
1 Electric power generation, transmission, and distribution 1,483.0 0.1 5.0 1,488.1
2 Food services (restaurants) 0.0 2.3 199.9 202.2
3 Offices of physicians, dentists, and other health practitioners 0.0 0.0 120.4 120.4
4 Private hospitals 0.0 0.0 68.6 68.6
5 Real estate establishments 0.0 1.2 66.5 67.7
6 Retail Stores - Food and beverage 0.0 0.1 64.5 64.5
7 Securities, commodity contracts, investments, and related activities 0.0 0.6 53.8 54.4
8 Private household operations 0.0 0.0 53.7 53.7
9 Wholesale trade businesses 0.0 1.9 50.7 52.6
10 Nursing and residential care facilities 0.0 0.0 51.5 51.5
11 Retail Stores - General merchandise 0.0 0.1 49.5 49.5
12 Retail Nonstores - Direct and electronic sales 0.0 0.0 40.5 40.5
13 Individual and family services 0.0 0.0 40.5 40.5
14 Retail Stores - Clothing and clothing accessories 0.0 0.0 35.4 35.4
15 Nondepository credit intermediation and related activities 0.0 0.8 34.5 35.4
16 Employment services 0.0 4.4 28.4 32.8
17 Retail Stores - Miscellaneous 0.0 0.0 32.4 32.4
18 Retail Stores - Motor vehicle and parts 0.0 0.1 32.0 32.0
19 Civic, social, professional, and similar organizations 0.0 0.3 30.5 30.8
20Medical and diagnostic labs and outpatient and other ambulatory care services
0.0 0.1 27.0 27.1
21 Services to buildings and dwellings 0.0 4.1 22.3 26.5
22 Home health care services 0.0 0.0 24.8 24.8
23 Retail Stores - Health and personal care 0.0 0.0 24.0 24.1
24 Management, scientific, and technical consulting services 0.0 13.1 9.8 22.9
25 Private elementary and secondary schools 0.0 0.0 21.3 21.3
Total all other categories 0.0 0.0 0.0 0.0
TABLE 7: JOBS CREATED IN SAN LUIS OBISPO AND SANTA BARBARA COUNTIES BY DCPP, 2011
*Direct: Total value of the good or service generated by the business or activity being anaylzed. Indirect: Revenue generated by other firms. Induced: Change in household expenditures.
Source: © 2012 Minnesota IMPLAN Group, Inc.

31
Tax Impact at the Local Level
As seen in Table 8, DCPP generated over $38 million in state and local taxes. The largest single item, $30.8 million in property tax payment, includes the $25 million paid directly by PG&E, as well as additional property taxes paid by DCPP vendors and employees. Over $5 million of sales taxes are paid annually by DCPP and their vendors and employees, which helps county and munic-ipal governments balance their budgets.
DescriptionIndirect
Business TaxHouseholds Corporations
Social Ins Tax- Employee Contribution $124,326
Social Ins Tax- Employer Contribution $288,051
Indirect Business Tax: Sales Tax $5,328,432
Indirect Business Tax: Property Tax $30,810,022
Indirect Business Tax: Motor Vehicle Lic $121,431
Indirect Business Tax: Other Taxes $1,531,435
Corporate Profits Tax $1,070,926
Personal Tax: Income Tax $2,005,062
Personal Tax: (Fines- Fees) $541,156
Personal Tax: Motor Vehicle License $87,398
Personal Tax: Property Taxes $40,083
Personal Tax: Other Tax (Fish/Hunt) $20,964
Total State and Local Tax $38,079,371 $2,818,989 $1,070,926
TABLE 8: STATE AND LOCAL TAX IMPACT, SAN LUIS OBISPO/ SANTA BARBARA COUNTIES
In addition to the size of tax revenue estimates, it is worth noting that underlying expenditures remain constant and tax revenues stable, regardless of the state of the local or State economy, and unlike revenues from more cyclical businesses and sectors that have fallen significantly from historic high peaks, such as the housing and real estate market.
A tangential question which arises when discussing property taxes is the effect DCPP closure would have on the local housing market if DCPP were to close and its employees move away. While an analysis would be highly speculative, this study examines several statistics for indica-tors. If most of the 1,483 local DCPP employees are members of different households, approxi-mately 1,450 homes would be vacated over a relatively short time period if the plant closed and DCPP employees relocated to another area. By comparison, San Luis Obispo County has averaged 1,291 new housing starts per year since 1990.
Source: © 2012 Minnesota IMPLAN Group, Inc.

32
A large number of homes for sale has the potential to significantly depress property values, in turn causing a large drop in new housing starts. If new housing starts decreased by half, it would take about 2.5 years to absorb excess inventory. A drop in local housing prices could draw a sig-nificant number of retirees and other mobile households with moderate income and net worth into the area. It appears likely that there would be, at least temporarily, a drop in housing prices, followed by corrections and eventual recovery. In the meantime the precipitous drop in new home construction, a major local source of employment, and the drop in home prices would cause major disruptions in the local economy.
Overall, this analysis shows that DCPP provides a significant stimulus to the local economy in the revenue it provides to local firms, the jobs it generates for local residents, and the tax revenues it generates to help local governments provide services to local residents. And as a non-seasonal, non-cyclical operation, DCPP is a significant stabilizer to the local economy.

33
3.2 California Economic Impact
Economic Impact on California
The total Economic Impact of DCPP on the State of California is $1.1 billion in 2011. In addition to this financial boost to the California economy, DCPP generated 4,542 jobs in California, with over 1,000 of them outside San Luis Obispo and Santa Barbara counties.
The Economic Impact of DCPP on the State of California is larger than the impact on the local market for three reasons. First, since many of the goods and services that DCPP needs are not available locally but are available elsewhere in California, total statewide purchases of goods and services are larger than the local number. Second, because dollars spent in California recirculate more times within California before “leaking out” to other states or countries, the multiplier is larger. Third, there are 60 DCPP employees who work and live in California, but outside the local DCPP area. These factors result in an across-the-board increase in the total dollar impact of DCPP on the California economy.
The $1.1 billion total Economic Impact of DCPP on the state of California (pacing far ahead of the local impact), is due in part to the greater amount of purchases of sophisticated equipment and increased fees paid for specialized engineering consulting outside the local area. The economic sectors of engineering consulting and wholesale trade, rank very high in the statewide analysis.
On the other side, those sectors most influenced by household spending, such as restaurants and bars, ranked lower. The direct impact is slightly greater because of the small number (60) of DCPP-related employees whose work location and residence are outside the local area. Total impact is greater because of the larger multiplier effect. For instance, in the local market, a pay-roll of $202,520,300 produced a total output impact of $203,211,941 for a multiplier of 1.003. The reason that the impact is not larger is that a significant proportion of an employee’s wages goes to income taxes and Social Security withholding, which reduces spendable income. At the statewide level, the net spendable income is recirculated several times throughout California before “leak-ing out” to the rest of the world. Therefore, the statewide ratio of wages to total output impact is $277,968,322 / $209,529,421, which equals 1.33.

34
Figure 16 and Table 9 show that other than the value of the electricity itself, the largest economic impact is in the imputed rental activity for owner-occupied dwellings. As mentioned earlier, this is the rent that homeowners would pay to rent their own homes. It reflects the fact that employees of DCPP and DCPP suppliers stimulate the California economy by building and maintaining their homes. It is worth noting that after housing cost, the sector most significantly affected is medical care—the combined impact of doctors and dentists, and private hospitals is $31.2 million.
FIGURE 16: TOP TEN IMPACTED SECTORS,CALIFORNIA TOTAL ECONOMIC IMPACT $1.1 BILLION
Power Generation, Transmission,& Distribution $678.8M
Next 8$120M
Rental value$41.1M
All other sectors$260.2M
Food services (Restaurants)$16.1MReal estate establishments$16.2MManagement / Technical Consulting Services$16.6MPhysicians and dentists$16.7MWholesale Trade$17.0M
Private Hospitals$14.5M
Facilities support services$12.8M
Financial Institutions$10.1M

35
TABLE 9: DCPP CALIFORNIA TOTAL ECONOMIC OUTPUT, 2011
Rank Description Direct Indirect Induced Total
Total $675,572,354 $90,162,430 $334,332,031 $1,100,066,815
1Electric power generation, transmission, and distribution
$675,572,354 $207,144 $2,982,044 $678,761,542
2Imputed rental activity for owner-occupied dwellings
0 $41,107,325 $41,107,325
3 Wholesale trade businesses $1,137,205 $15,862,428 $16,999,634
4Offices of physicians, dentists, and other health practitioners
$317 $16,690,915 $16,691,232
5Management, scientific, and technical con-sulting services
$14,805,832 $1,747,185 $16,553,017
6 Real estate establishments $940,264 $15,261,471 $16,201,735
7 Food services (Restaurants) $711,256 $15,431,963 $16,143,219
8 Private hospitals $2,554 $14,542,177 $14,544,731
9 Facilities support services $12,724,919 $81,546 $12,806,466
10Monetary authorities and depository credit intermediation activities
$758,991 $9,335,119 $10,094,110
11 Insurance carriers $391,704 $9,257,917 $9,649,622
12 Petroleum refineries $479,392 $8,965,220 $9,444,612
13Securities, commodity contracts, invest-ments, and related activities
$280,882 $8,113,495 $8,394,377
14 Employment services $6,516,550 $1,442,495 $7,959,045
15Nondepository credit intermediation and related activities
$455,927 $7,408,454 $7,864,381
16 Pharmaceutical preparation manufacturing $2,737 $6,878,461 $6,881,198
17Medical and diagnostic labs and outpatient and other ambulatory care services
$20,658 $5,723,846 $5,744,504
18 Legal services $782,549 $4,819,467 $5,602,016
19 Retail Stores - Food and beverage $15,423 $5,357,010 $5,372,432
20 Telecommunications $627,792 $4,394,548 $5,022,340
21Other state and local government enter-prises
$151,835 $4,714,653 $4,866,488
22 Retail Stores - Motor vehicle and parts $21,386 $4,550,862 $4,572,248
23 Retail Stores - General merchandise $12,429 $4,467,282 $4,479,711
24Industrial process variable instruments manufacturing
$4,397,048 $33,247 $4,430,295
25 Management of companies and enterprises $1,066,748 $3,067,555 $4,134,303
All other sources $43,650,889 $122,095,345 $165,746,234
Source: © 2012 Minnesota IMPLAN Group, Inc.
36
The sector with the second largest impact is managerial and technical consulting services, which reflects the significant amount of engineering and design work that PG&E contracts out to leading consulting firms in California. In addition, the wholesale trade business sector receives a great deal of business from selling goods such as fuels, lubricants, office supplies, paint, and nuts and bolts to DCPP. Other high-ranking sectors reflect purchases by households of employees of DCPP and their suppliers—real estate firms, food service and banking institutions, for example.
Job Creation in the California Economy
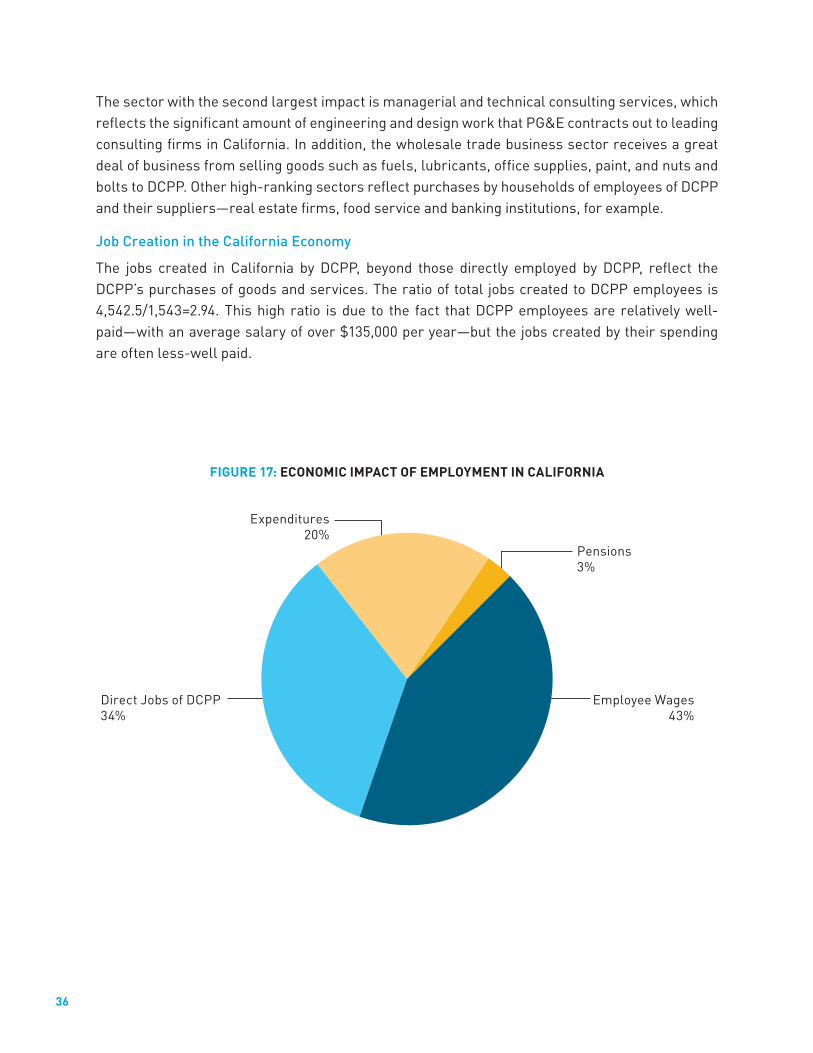
The jobs created in California by DCPP, beyond those directly employed by DCPP, reflect the DCPP’s purchases of goods and services. The ratio of total jobs created to DCPP employees is 4,542.5/1,543=2.94. This high ratio is due to the fact that DCPP employees are relatively well-paid—with an average salary of over $135,000 per year—but the jobs created by their spending are often less-well paid.
FIGURE 17: ECONOMIC IMPACT OF EMPLOYMENT IN CALIFORNIA
Expenditures 20%
Employee Wages43%
Direct Jobs of DCPP34%
Pensions3%

37
As seen in Table 10, the sector with the largest number of jobs created is food services. This illustrates the fact that jobs at both lower and higher skill levels have been created by DCPP expenditures, both to vendors and to their employees. By way of clarification, the employment services sector can include temporary employment services, which may specialize in anything from security guards to engineering and scientific talent. In addition, this sector can include union trades, where the union (electrician, plumbing) serves as a clearing house for its members.
TABLE 10: CALIFORNIA JOBS CREATED, 2011
Rank Description Direct Indirect Induced Total
Total 1,543.0 668.8 2,330.7 4,542.5
1 Electric power generation, transmission, and distribution 1,543.0 0.3 3.7 1,547.0
2 Food services (Restaurants) 11.5 248.7 260.1
3 Employment services 156.2 34.6 190.8
4 Offices of physicians, dentists, and other health practitioners 0.0 136.7 136.7
5 Management, scientific, and technical consulting services 111.2 13.1 124.3
6 Wholesale trade businesses 6.6 92.0 98.6
7 Facilities support services 97.1 0.6 97.7
8 Private hospitals 0.0 94.0 94.0
9 Private household operations 0.0 85.5 85.5
10 Real estate establishments 4.9 79.8 84.7
11 Retail Stores - Food and beverage 0.2 78.9 79.2
12 Retail Stores - General merchandise 0.2 73.3 73.5
13 Nursing and residential care facilities 0.0 65.8 65.8
14Securities, commodity contracts, investments, and related activities
2.1 59.7 61.8
15 Nondepository credit intermediation and related activities 2.9 47.6 50.5
16 Individual and family services 0.0 47.9 47.9
17 Retail Stores - Clothing and clothing accessories 0.1 44.5 44.6
18 Retail Stores - Motor vehicle and parts 0.2 44.1 44.3
19 Retail Nonstores - Direct and electronic sales 0.1 43.2 43.3
20 Business support services 30.4 8.2 38.6
21 Services to buildings and dwellings 9.0 28.6 37.6
22 Retail Stores - Miscellaneous 0.1 37.2 37.3
23Medical and diagnostic labs and outpatient and other ambu-latory care services
0.1 32.9 33.0
24Private junior colleges, colleges, universities, and profes-sional schools
0.0 32.8 32.8
25 Legal services 4.4 27.0 31.4
Source: © 2012 Minnesota IMPLAN Group, Inc.

38
DCPP impacts the California economy in many ways, raising the question: if DCPP were to shut down, what would be the net impact on California? There are many possible scenarios. Based on current State policy, it is highly unlikely that another nuclear plant would be built in California. DCPP generation could be replaced with new fossil units, renewable power, or a combination thereof. However important policy implications, like those of AB32 are outside the scope of this report. A fossil fuel plant outside California, whether in a neighboring state or Mexico, is a pos-sibility. However, citizens of these areas are expressing increasing resistance to power plants and their accompanying pollution being built in their backyards, while the power is exported to help support the California economy. While PG&E is working diligently to comply with AB32 and bring renewable sources into its energy portfolio, renewable sources of energy are more expen-sive than nuclear or fossil fuel electricity and would increase the cost of doing business or living in California. Based on these scenarios, it would be extremely difficult and expensive to replace DCPP’s electric generation.
Tax Impact at the State Level
The statewide number, $33,255,105, is $2 million more than the local impact, which indicates that counties outside the local market have benefited from DCPP’s activities. The State Corporate Income Tax, $1,650,893, would include the portion of PG&E income taxes attributable to DCPP operations, as well as taxes paid by DCPP vendors, and companies that provide goods and services to PG&E employees. The State Personal Income Tax exceeds $4.1 million, which is substantial.
TABLE 11: STATE AND LOCAL TAX IMPACT, CALIFORNIA, 2011
DescriptionIndirect
Business TaxHouseholds Corporations
Social Ins Tax- Employee Contribution $185,358
Social Ins Tax- Employer Contribution $429,457
Indirect Bus Tax: Sales Tax $7,570,844
Indirect Bus Tax: Property Tax $33,255,105
Indirect Bus Tax: Motor Vehicle Lic $172,534
Indirect Bus Tax: Other Taxes $2,175,923
Corporate Profits Tax $1,650,893
Personal Tax: Income Tax $4,169,876
Personal Tax: NonTaxes (Fines- Fees) $1,166,362
Personal Tax: Motor Vehicle License $189,064
Personal Tax: Property Taxes $83,182
Personal Tax: Other Tax (Fish/Hunt) $45,777
Total State and Local Tax $43,603,863 $5,839,619 $1,650,893
Source: © 2012 Minnesota IMPLAN Group, Inc.

39
If DCPP were replaced by a “generic” power plant producing the same amount of power, valued at $678.74 million, the IMPLAN model can be used to estimate the impact of replacing DCPP with a variety of existing power plant technologies. Briefly, the total jobs generated statewide would be 2,280, versus 4,542 for DCPP. This is due to the fact that most of the power would be generated by fossil fuels, which cost more than nuclear, and because the plants require fewer personnel. So, changing over the power plant would induce a net loss of 2,262 jobs statewide. The total economic impact statewide would be $896 million, versus $1.1 billion, which would represent a loss of $204 million in GDP. And this does not take into account the fact that, since the replace-ment power would be more expensive than DCPP power, there would be further depression of economic activity statewide.

40
3.3 National Economic Impact
Economic Impact on the National Level
On the national level, there is a dramatic increase in the amount of “spend” for goods and ser-vices. Much of the generating equipment such as turbine heat-exchangers are produced by two or three manufacturers nationally, none in California. In addition, the nuclear fuel, which averages over $75 million per year, is sourced totally from outside California. Adding the increased “multi-plier” resulting from the larger market to these expenditures results in a greatly increased total impact number: over $1.8 billion in 2011. The largest item, other than the value of the electricity itself, is the nuclear fuel component labeled “All other basic inorganic chemical manufacturing” (Table 12), also known as “Nuclear Fuel Manufacturing” (Figure 18).
Wholesale Businesses$36.7M
Employment Services$40.6M
Management / Technical Consulting$47.3M
Real Estate Firms$48.5M
Rental Value$62.8M
Business Support Services$36.0MFinancial Institutions$32.1MFood Services (Restaurants)$32.0M
Power Generation, Transmission,& Distribution $691.9M
Next 8$336.0M
Nuclear Fuel Manufacturing$64.5M
FIGURE 18: TOP TEN IMPACTED SECTORS, NATIONALTOTAL ECONOMIC IMPACT $1.845 BILLION

41
TABLE 12: NATIONAL TOTAL ECONOMIC IMPACT, 2011
Rank Description Direct Indirect Induced Total
Total 675,572,354 495,895,790 673,582,189 1,845,050,334
1 Electric power generation, transmission, and distribution $675,572,354 $6,191,423 $10,098,322 $691,862,099
2 All other basic inorganic chemical manufacturing $64,183,247 $361,027 $64,544,275
3 Imputed rental activity for owner-occupied dwellings $0 $62,771,661 $62,771,661
4 Real estate establishments $6,302,072 $42,230,609 $48,532,681
5 Management, scientific, and technical consulting services $42,246,743 $5,023,269 $47,270,011
6 Employment services $36,303,049 $4,322,258 $40,625,307
7 Wholesale trade businesses $7,388,484 $29,346,872 $36,735,356
8 Other support services $34,842,600 $1,120,723 $35,963,323
9Monetary authorities and depository credit intermediation
activities $5,533,481 $26,598,423 $32,131,903
10 Food services (Restaurants) $3,763,636 $28,191,332 $31,954,968
11 Private hospitals $4,412 $30,801,014 $30,805,426
12 Offices of physicians, dentists, and other health practitioners $1,833 $30,346,648 $30,348,481
13 Insurance carriers $2,517,829 $23,623,268 $26,141,097
14Securities, commodity contracts, investments, and related
activities $2,351,244 $22,055,089 $24,406,333
15 Petroleum refineries $6,377,427 $16,470,586 $22,848,013
16 Telecommunications $5,928,656 $16,689,432 $22,618,088
17 Nondepository credit intermediation and related activities $3,104,094 $19,177,681 $22,281,775
18 Other general purpose machinery manufacturing $20,155,500 $12,156 $20,167,657
19 Management of companies and enterprises $8,007,353 $9,988,447 $17,995,800
20 Legal services $3,808,740 $10,214,219 $14,022,959
21 Facilities support services $13,507,506 $357,985 $13,865,491
22 Pharmaceutical preparation manufacturing $9,519 $12,043,260 $12,052,779
23 Architectural, engineering, and related services $8,677,216 $2,473,363 $11,150,578
24 Industrial process variable instruments manufacturing $10,532,456 $145,358 $10,677,815
25 Other state and local government enterprises $1,262,177 $9,282,669 $10,544,846
Total all other sources $202,895,095 $383,400,752 $586,295,847
Source: © 2012 Minnesota IMPLAN Group, Inc.

42
Jobs Created at the National Level
The number of jobs created nationally is proportionally larger: over 10,372 jobs have been cre-ated by DCPP nationally, in a broad spectrum of skill levels and career paths. Each of the 1,559 direct DCPP jobs has generated over five additional jobs in other businesses serving DCPP or their employees, or their employees’ employees. This is due to the nearly self-contained nature of the US economy, where a dollar spent locally will circulate within the economy several times before “leaking out.”
FIGURE 19: NATIONAL ECONOMIC IMPACTS OF DCPP EMPLOYMENT
Expenditures50.4%
Employee Wages32.5%
Direct Jobs of DCPP15.0%
Pensions2.1%

43
TABLE 13: NATIONAL JOBS CREATED, 2011: 9477.1 JOBS
Rank Description Direct Indirect Induced Total
Total 1,559.0 3,215.0 5,598.3 10,372.3
1 Electric power generation, transmission, and distribution 1,559.0 9.8 16.0 1,584.9
2 Employment services 926.5 110.3 1,036.8
3 Food services (Restaurants) 67.2 503.1 570.2
4 Management, scientific, and technical consulting services 312.4 37.1 349.6
5 Other support services 330.6 10.6 341.2
6 Real estate establishments 41.8 280.0 321.8
7 Offices of physicians, dentists, and other health practitioners 0.0 239.8 239.9
8 Private hospitals 0.0 233.0 233.0
9 Wholesale trade businesses 43.6 173.2 216.8
10 Nursing and residential care facilities 0.0 162.2 162.2
11Securities, commodity contracts, investments, and related activities
15.3 143.2 158.5
12 Retail Stores - General merchandise 1.1 154.2 155.3
13 Retail Stores - Food and beverage 1.1 154.1 155.2
14 Nondepository credit intermediation and related activities 21.0 129.9 150.9
15 Business support services 108.6 34.0 142.6
16 Services to buildings and dwellings 49.8 84.4 134.2
17 Private household operations 0.0 120.4 120.4
18 Facilities support services 115.2 3.1 118.3
19 Civic, social, professional, and similar organizations 8.5 90.4 98.9
20 Retail Stores - Motor vehicle and parts 1.1 92.4 93.5
21 Individual and family services 0.0 91.9 91.9
22 Architectural, engineering, and related services 70.8 20.2 91.0
23 Management of companies and enterprises 39.5 49.2 88.7
24Monetary authorities and depository credit intermediation activities
14.8 71.3 86.1
25 All other basic inorganic chemical manufacturing 84.8 0.5 85.3
Total all other industries 951.4 2,593.8 3,545.2
Source: © 2012 Minnesota IMPLAN Group, Inc.

44
Tax Impact at the National Level
DCPP’s expenditures (in the process of generating electricity) generate a substantial amount of federal tax revenue. Unlike state and local tax revenues, which are dominated by property taxes, sales taxes and various fees, the federal government relies very heavily on personal and corporate income taxes to fund its operations. DCPP generates over $16 million in federal corporate income tax, $27.5 million in Federal Personal Income Taxes, $43.3 million in Social Security taxes, and $6.6 million in excise taxes, customs duties and other fees (See Table 14).
In addition to the taxes collected by the federal government, out-of-state DCPP vendors and con-sulting firms generate tax revenues for their respective states. As shown in Table 15, these rev-enues are dominated by property taxes and sales taxes, but state corporate and personal income taxes are also significant.
TABLE 14: FEDERAL TAX IMPACT, NATIONAL, 2011
DescriptionEmployee
CompensationProprietor
IncomeIndirect
Business TaxHouseholds Corporations Total
Social Insurance Tax: Employee Contribution
$21,808,360 $2,662,715 $24,471,075
Social Insurance Tax: Employer Contribution
$21,498,620 $21,498,620
Indirect Business Tax: Excise Taxes
$3,230,467 $3,230,467
Indirect Business Tax: Custom Duty
$1,267,371 $1,267,371
Indirect Business Tax: Fed NonTaxes
$2,158,076 $2,158,076
Corporate Profits Tax $16,398,957 $16,398,957
Personal Tax: Income Tax $27,487,792 $27,487,792
Total Federal Tax $43,306,980 $2,662,715 $6,655,914 $27,487,792 $16,398,957 $96,512,358

45
TABLE 15: STATE AND LOCAL TAX IMPACT, NATIONAL
DescriptionIndirect
Business TaxHouseholds Corporations
Social Security Insurance Tax- Employee Contribution $295,462
Social Security Insurance Tax- Employer Contribution $684,558
Indirect Business Tax: Sales Tax $19,424,322
Indirect Business Tax: Property Tax $44,082,572
Indirect Business Tax: Motor Vehicle Lic $403,166
Indirect Business Tax: Other Taxes $5,528,352
Corporate Profits Tax $3,006,542
Personal Tax: Income Tax $8,184,395
Personal Tax: NonTaxes (Fines- Fees) $2,273,385
Personal Tax: Motor Vehicle License $492,076
Personal Tax: Property Taxes $232,929
Personal Tax: Other Tax (Fishing/Hunting Licenses) $213,855
Total State and Local Tax $70,122,970 $11,692,102 $3,006,542
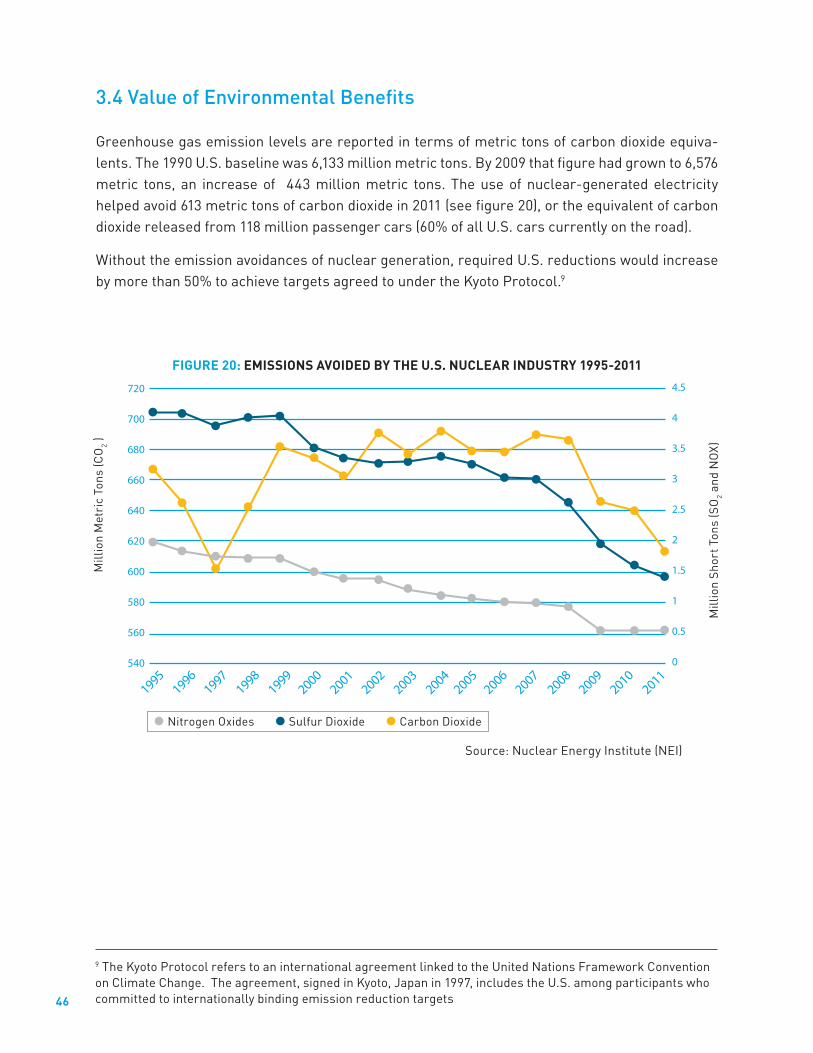
46
3.4 Value of Environmental Benefits
Greenhouse gas emission levels are reported in terms of metric tons of carbon dioxide equiva-lents. The 1990 U.S. baseline was 6,133 million metric tons. By 2009 that figure had grown to 6,576 metric tons, an increase of 443 million metric tons. The use of nuclear-generated electricity helped avoid 613 metric tons of carbon dioxide in 2011 (see figure 20), or the equivalent of carbon dioxide released from 118 million passenger cars (60% of all U.S. cars currently on the road).
Without the emission avoidances of nuclear generation, required U.S. reductions would increase by more than 50% to achieve targets agreed to under the Kyoto Protocol.9
19951996
19971998
19992000
20012002
20032004
20052006
20072008
20092010
2011
Mill
ion
Met
ric
Tons
(CO
2 )
Mill
ion
Shor
t Ton
s (S
O2 a
nd N
OX)
Nitrogen Oxides Sulfur Dioxide Carbon Dioxide
720
700
680
660
640
620
600
580
560
540
4.5
4
3.5
3
2.5
2
1.5
1
0.5
0
FIGURE 20: EMISSIONS AVOIDED BY THE U.S. NUCLEAR INDUSTRY 1995-2011
9 The Kyoto Protocol refers to an international agreement linked to the United Nations Framework Convention on Climate Change. The agreement, signed in Kyoto, Japan in 1997, includes the U.S. among participants who committed to internationally binding emission reduction targets
Source: Nuclear Energy Institute (NEI)
47
According to testimony by PG&E10, DCPP avoids the emission of seven to eight million tons per year of greenhouse gases (GHG) that would otherwise be produced by conventional generation sources such as fossil fuel plants. The cost to purchase equivalent carbon credits on the Intercontinental Exchange (ICE) for six to seven million tons of GHG ranges from $3,129,000 and $18,375,000 per year.11 A total of 1.34 million acres of pine forest would be needed to sequester carbon emitted at those levels, and 1.25 million passenger vehicles would have to be removed from service to avoid seven million tons of GHG.
Additionally, nuclear energy avoids the annual production in the U.S. of more than half a million tons of nitrogen oxide12 and 1.4 million tons of sulfur dioxide. As part of the U.S. EPA Acid Rain Program from 1990-1995, results from 21 states showed that a 16.4% increase in nuclear genera-tion avoided release of 480,000 tons of sulfur dioxide (37% of the required emissions reduction). Under the 1990 Clean Air Act Amendments, no credit was allocated to nuclear plants, but based on the average value of publicly traded sulfur dioxide credits, the savings would have a value of about $50 million.
10 Pacific Gas & Electric Company 2014 General Rate Case Prepared Testimony Exhibit (PG&E-6) Energy Supply, November 15, 2012
11 Estimate based on futures price range of $1.49–$8.75 metric ton contract on the ICE market between September 2011 and September 2012. One lot = 1000 metric tons of carbon = 3,326 metric tons of CO2
12 Equivalent to NO released by 28 million cars

48
Section 4: License Extension vs. No License ExtensionPresently, there are two nuclear reactors in operation at DCPP, with one licensed to oper-ate until 2024 and the second to 2025. If the Nuclear Regulatory Commission (NRC) does not extend the licenses for an additional 20 years (2044 and 2045), as requested by PG&E, the reactors would be decommissioned. As a centerpiece of the economies of San Luis Obispo and Northern Santa Barbara counties, DCPP produced an estimated $675.6 million of electricity in 2011,13 contributing at least $1 million to 46 different sectors of the local economy. If DCPP is granted extension to licenses, the plant would continue to generate economic benefits simi-lar to those produced today. However, if license extensions are not granted, DCPP would be required to cease operations and begin to shut down the Plant.
The year 2027 was used as the reference point for analyzing economic impacts that would result from an NRC decision to not extend licenses. This is a point in time when either full operation would continue with license extension, or the plant would be idle during the decommissioning and removal process. In either case, the Independent Spent Fuel Storage Installation (ISFSI), known as the Dry Cask Storage Facility, would continue to operate, so economic benefits associated with the ISFSI is included in all scenarios. According to the March 2010 report entitled “The Local Economic Impacts of Decommissioning the Diablo Canyon Nuclear Power Plant,” the most rea-sonable alternative use of the site after decommissioning is cattle grazing, a use that has been included in the economic analysis of no license extension.
4.1 Economic Impact on the Economy
In 2011, DCPP contributed $919.8 million of total economic impact (direct, indirect and induced) to San Luis Obispo and Northern Santa Barbara counties. The state and nation also benefited eco-nomically from the operations of DCPP, receiving $1,100 billion and $1,969 billion in total economic impact, respectively. By 2027, if DCPP is granted license extension, the total economic impact for the local area is expected to grow to $1.48 billion per year, assuming a 3-percent-per-year growth rate and no change in employment (see Figure 3). State and national economic impacts are sub-stantial as well, respectively yielding $1.76 billion and $3.16 billion in 2027.
13 According to the US Energy Information Administration, DCPP produced 18,566 MWH in 2011 and the California weighted average wholesale price (SP-15 Gen DA LMP Peak) for 2011 was $36.39 per MWH, for a total of $675,572,354 electricity produced

49
In the case of no license extension, there will be limited activity on the site. The Independent Spent Fuel Storage Installation (ISFSI) and guard station will continue to operate until the Department of Energy has taken custody of all the spent fuel. Since there is no specific date for this to occur, this report assumes operations of the ISFSI will continue well after the decommissioning of DCPP has been completed. According to PG&E, the operation of the ISFSI facility requires 41 employees with a combined payroll of $6.7 million. Because these employees will live in the local communities, they will contribute to the local economic impact. Besides employee expenditures, it is estimated that only about $203,142 local expenditures will result from ISFSI continued operations. Based on these figures, the total economic activity of the ISFSI facility is estimated to be $13.68 million in 2027.
Additionally, assuming the best alternate usage of the nearly 10,000 acre property after decom-missioning would be cattle grazing, the total direct economic impact created by this activity in the local area is $1.5 million in 2027. A total of $15.2 million of economic impact would continue to occur even after denial of DCPP relicensing. Therefore, the denial would result in a net loss of 1.46 billion (99.1% decline) to the local area in year 2027 alone. An estimated $42.5 billion would be lost over the entire re-licensing period if the extension request is denied.14
DCPP’s economic impact is not only large in size, but it has a stabilizing effect on the local econ-omy. Refueling takes place every 18 to 22 months for each reactor and occurs during the tourism industry’s off-season. Refueling brings in several hundred workers from outside the local area who stay in motels, hotels or short-term rentals and often eat at local restaurants. Each reactor alternates its refueling schedule, usually resulting in at least one refueling or significant equip-ment installation per year, typically during a slack period of the tourist season. The economic impacts of these planned outages will be discussed in a future publication.
14 Source of all ISFSI and Cattle Ranching impact estimates: The Local Economic Impacts of Decommissioning the Diablo Canyon Power Plant, March 2010
$1.476B
Local Statewide Nationwide ISFSI+Cattle Ranch Only
$1.765B
$3.159B
$15.2M
Indirect
Direct
Induced
$0.0
$0.5
$1.0
$1.5
$2.0
$2.5
$3.0
$3.5
$ B
illio
ns
FIGURE 21: ESTIMATED ECONOMIC IMPACT FOR YEAR 2027

50
4.2 Loss of Jobs
In 2011, DCPP employed 1,483 direct employees in San Luis Obispo and Northern Santa Barbara counties, which created an additional 1,875 jobs for a total of 3,358 jobs in the local economy. DCPP also employs 60 additional employees in California who do not reside in the local economy, and 16 other employees live outside California. DCPP's out-of-area impact causes a ripple effect, creating an additional 2,999.5 and 8,813 jobs, respectively. It is not expected that the number of direct jobs would increase because of license extension, but rather would stay the same or slightly reduce in number. By 2027, the total number of jobs created is estimated to be the same as the year 2011 (See Figure 22).
A report to the California Public Utilities Commision determined the best alternate usage of the nearly 12,000 acre property after decommissioning would be cattle grazing. The total direct jobs created for cattle grazing is estimated at three. Because of the ripple effect throughout the econ-omy, an additional 27.1 indirect and induced jobs would be created, where a total of 71.1 total jobs would be created in the local economy in the case of no license extension in 2027. Therefore, the loss of this stimulus would result in the elimination of more than 3,286 jobs from virtually every sector of the economy.
Jobs
3,357.1
4,542.5
10,372.3
71.1
Local Statewide National ISFSI+CattleRanch Only
Induced Indirect Direct
10,000
9,000
8,000
7,000
6,000
5,000
4,000
3,000
2,000
1,000
0
11,000
FIGURE 22: ESTIMATED TOTAL JOBS (DIRECT AND INDIRECT) FOR YEAR 2027

51
4.3 Loss of Taxes Generated
In 2011, PG&E paid over $25 million in Unitary Taxes to San Luis Obispo County related to DCPP operations. An additional $5.8 million of property taxes are generated from other indirect and induced sources, resulting in property taxes of $30.8 million paid in 2011. By 2027, it is estimated that these property taxes will grow to $49.4 million. California will receive an estimated $12.1 mil-lion in sales taxes in 2027 from DCPP operators, while combined sales taxes and property taxes generated in the local area will total $58.0 million (See Figure 23).
In the case of no license extension, the ISFSI and guard station will continue to operate, as well as the nearly 12,000–acre property would be used for grazing cattle. These activities would generate $1.253 million in local area property and sales tax; however, funds garnered will be nothing close to the scale of that which the continued operations of DCPP would produce.
It is estimated that Unitary Property Taxes paid to San Luis Obispo County would decline by 97.3% if license extension does not occur.
This decline would adversely affect the entire region. Almost all of the $12.1 million California sales tax revenue in 2027 alone would be lost.
Total Sales andProperty Taxes,
ISFSI/Cattle Grazing
SLO/SB CountyProperty Taxes
CA State SalesTaxes
$1,253,004
$12,148,982
$49,441,041
$57,991,610Total Sales and
Property Taxes,SLO/SB Counties
FIGURE 23: ESTIMATED TAXES GENERATED 2027 BY DCPP

52
Section 5: Nuclear Industry TrendsCurrently, 14% of the world’s electricity is provided by nuclear power, including 436 plants operat-ing in 30 different countries. Thirteen countries rely on nuclear power for over one-quarter of their electricity generation. The U.S. ranks number one in total worldwide nuclear power generation at 31.4% (See Figure 24).
Although the U.S. generates the most electricity worldwide, nuclear falls to the middle of the pack as a percentage of national power generation. In 2011, the U.S. generated 19.2% of its entire electricity portfolio through nuclear power. France generated 77.7% of its electricity through nuclear power, and at the other extreme, China generated most of its power through fossil fuels (mainly coal), with only 1.8% through nuclear generation (See Figure 25).
790.2421.1
161.7156.2
147.7102.3
90.087.484.8
59.3
0 100 200 300Billion Kwh
U.S. (31.4%)France (16.7%)
Russia (6.4%)Japan (6.2%)Korea (5.9%)
Germany (4.1%)Canada (3.6%)
China (3.5%)Ukraine (3.4%)Sweden (2.4%)
400 500 600 700 800 900
FIGURE 24: TOP TEN NUCLEAR POWER GENERATING COUNTRIES (2011)

53
In the aftermath of the Fukushima accident, several countries—including Germany and Switzerland—have indicated that they do not plan further nuclear expansion, but many more plan to proceed with nuclear power development. Fourteen countries are moving ahead with 66 new plants under construction; others have longer-term plans for new nuclear development. China has 51 reactors currently planned out of 120 total proposed, and India plans to build 16 reactors of a proposed 40 to keep up with demand.15 The U.S. Department of Energy projects that U.S. elec-tricity demand will rise 24% by 2035, about one percent each year. Therefore, U.S. energy com-panies have proposed to build up to 19 new nuclear plants, and has 11 reactors currently planned to start construction including three under construction at Vogtle in Georgia, Summer in South Carolina and Watts Bar in Tennessee.
In 2011, nuclear energy provided 19.2% of the United States’ electricity, or 790.2 billion kilowat-thours (bkWh) out of a total U.S. electricity generation of 4,105 bkWh (See Figure 26). There are currently 104 licensed reactors operating in 31 different states, of which 35 are boiling water reac-tors and 69 are pressurized water reactors. To put the scale of this energy generation into per-spective, the amount of electricity generated by just an average sized 1,000-MWe reactor at 90% capacity factor in one year is 7.9 billion kWh—enough to supply electricity for 690,000 households. If generated by other fuel sources, power of this magnitude would require 13.7 million barrels of oil, 3.4 million short tons of coal and 65.8 billion cubic feet of natural gas.
15 Source: NEI White Paper, “Global Nuclear Power Development: Major Expansion Continues” May 2012.
77.7%47.2%
39.6%34.6%
19.2%18.1%
17.8%17.6
15.31.8
0% 10% 20% 30%
Nuclear Generation
FranceUkraineSweden
KoreaU.S.
JapanGermany
RussiaCanada
China
40% 50% 60% 70% 80% 90% 100%
FIGURE 25: PERCENTAGE OF NATIONAL ELECTRICAL POWER (2011)

54
Although there are a number of new domestic reactors in the pipeline, additional nuclear capacity is not expected to be online until 2017, at the earliest. As the demand for electricity continues to climb, the U.S. will struggle to meet demand without new power plants. The nuclear industry has been able to generate more electricity as older reactors go offline due to increased operational efficiency (section 5.1), but license renewal for many plants is crucial to maintain current production (See Figure 27).
19731975
19771979
19811983
19851987
19891991
19931995
19971999
20012003
20052007
20092011
Coal Petroleum Natural Gas Nuclear Hydro Wood Wind Other Gases, Waste, Geothermal, Solar/PV
0.0%
10.0%
20.0%
30.0%
40.0%
50.0%
60.0%
42.2%
24.8%
19.2%
2.9%
FIGURE 26: U.S. ELECTRICITY GENERATION, 2011(Total Electricity Generated 4,105.7 billion mWh)
FIGURE 27: U.S. ELECTRICITY GENERATION(Total Operational Reactors)
19711973
19771975
19791981
19831985
19871989
19911993
19951997
19992001
20032005
20072009
2011
U.S. Total Electricity Generated U.S. Nuclear Generation Operating Reactors
104 Reactors
4105.7 billion MWh
Billi
on M
Wh
Num
ber o
f Rea
ctor
s
790.2 billion MWh
0
1000.0
2000.0
3000.0
4000.0
5000.0
0
20
40
60
80
100

55
5.1 Nuclear Industry Performance
A significant achievement of the U.S. nuclear power industry over the last 20 years has been the increase in operating efficiency due to improved maintenance and technology. This has resulted in an upward trend in capacity factor (output proportion of their nominal full-power capacity), which has gone from 56.3% in 1980 and 66% in 1990 to 89.0% in 2011.16 A major component of this upward trend is the length of refueling outages. In 1990 refueling outages averaged 107 days, but dropped to 40 days by 2,000, with the record being 15 days. Typical refueling outages happen every 18 to 24 months and create a significant decrease in capacity factor. Additionally, overall generation has increased because of improved thermal efficiency. The average thermal efficiency rose from 32.49% in 1980 to 33.85% in 1999. Nuclear power generation capacity factors are the highest of all fuel types since power can be generated 24 hours a day, seven days per week (See Table 16).
Another way to increase overall generation is through uprate, which is the process of increasing the maximum power level at which a commercial nuclear power plant operates. Power uprates at nuclear plants are very common and require additional capital investment. More than 120 uprates have been approved by the NRC and implemented, generating approximately 6,211 mWe of power or equivalent to adding another six nuclear reactors. Sixty-seven more uprate projects are cur-rently in sight, with capital costs of $250 to $500 million each. A nationwide capacity increase of 2,637 mWe by 2016 is currently under review and expected. In addition to increasing generating capacity, these uprate projects also improve the reliability of the units and support operating license extensions, which require extensive review of plant equipment condition.
Through a reduction in reactor downtime, improved thermal efficiency, and uprate projects, nuclear power generation has increased from 577 bkWh hours in 1990 to 790.2 bkWh in 2011, a 36.9% improvement, or capacity addition equivalent to approximately 29 new 1,000 MWe reactors.
TABLE 16: US CAPACITY FACTORS BY FUEL TYPE, 2011
Fuel Type Average CapacityFactors
Nuclear 89.0%
Geothermal 69.5%
Biomass 64.6%
Coal (Steam Turbine) 61.1%
Hydro 48.3%
Gas (Combined Cycle) 45.6%
Wind 31.8%
Solar 24.0%
Gas (Steam Turbine) 13.4%
Oil (Steam Turbine) 8.1%
16 Source: Nuclear Energy Institute (NEI)
Source: Nuclear Energy Institute (NEI)

56
5.2 Cost Competitiveness: Production Costs and Fuel Costs
The cost of nuclear power generation has remained flat over the last decade. Although efficiency improvements have occurred, fuel costs (including enrichment), and operating and maintenance (O&M) costs have increased. In general, the construction costs of nuclear power plants are signifi-cantly higher than for coal or gas-fired plants because of the requirements for special materials, the incorporation of sophisticated safety features and back-up control equipment. These contrib-ute to much of the nuclear generation cost, but once the plant is built the cost variations are minor.
Production CostsProduction costs include O&M and fuel costs at a power plant. Since 2001, nuclear power plants have achieved the lowest production costs compared to coal, natural gas and oil. For nuclear power plants, spent fuel management, plant decommissioning, and final waste disposal are included in the production costs. These costs, while usually external for other technologies, are internal for nuclear power (See Figure 28).
This figure shows the annual cost associated with the operation, maintenance, administration, and support of a nuclear power plant. Included are costs related to labor, material and supplies, con-tractor services, licensing fees and miscellaneous costs such as employee expenses and regula-tory fees. The average non-fuel O&M cost for a U.S. nuclear power plant in 2011 was 1.51 cents per kWh and the overall production cost was 2.19 cents per kWh. Because nuclear plants refuel every 18 to 24 months, they are not subject to fuel price volatility like natural gas and oil power plants.
25.00
20.00
15.00
10.00
5.00
19951996
19971998
19992000
20012002
20032004
20052006
20072008
20092010
2011
21.56 cents
4.51 cents3.0 cents2.19 cents
Coal Gas Nuclear Petroleum
0
FIGURE 28: U.S. ELECTRICITY PRODUCTION COSTS
Source: Nuclear Energy Institute (NEI)

57
Fuel CostsThis is the total annual cost associated with the consumption of nuclear fuel resulting from the operation of the unit. This cost is based upon the amortized costs associated with the purchasing of uranium, conversion, enrichment, and fabrication services along with storage and shipment costs and inventory (including interest) charges less any expected salvage value. The average fuel cost at a U.S. nuclear power plant in 2011 was 0.68 cents per kWh. Nuclear fuel costs were at a low of 0.51 cents per kWh in 2005, and since then, fuel costs for nuclear power plants have increased 33.3 percent.
Fuel costs make up 31% of the overall production costs of nuclear power plants. Fuel costs for coal and natural gas and oil, however, make up more than 78% of the production costs (See Figure 29) and all subject to rapid market fluctuation.
Coal
Fuel Costs Other Production Costs
Gas Nuclear Nuclear Fuel
Conversion (4%)
Fabrication (8%)
Waste Fund (15%)
Enrichment (31%)
Uranium (42%)
78%
22%11%
69%
89%
31%
FIGURE 29: FUEL AS A PERCENTAGE OF ELECTRIC POWER PRODUCTION COSTS, 2011
Source: Nuclear Energy Institute (NEI)
58
Section 6: Community Benefits Provided by DCPPIn addition to the economic benefits that DCPP contributes to San Luis Obispo and Northern Santa Barbara counties, the state and nation in the form of jobs, income, and taxes, the plant also enhances the local community in ways that are often intangible and unquantifiable. PG&E strives to be a good corporate citizen by engaging, supporting and improving the neighbor-hoods where their customers and employees live and work. PG&E’s community investment program is completely funded by shareholders and has no impact on customers’ utility rates. This section of the report includes a discussion of benefits beyond the IMPLAN economic model previously presented. Although actual quantified results of these programs are not estimated, it should be noted that each has economic value.
6.1 Local Charitable Grants and Volunteerism
Charitable Grants
PG&E has been part of California for over 100 years and believes in its responsibility to contribute to the growth and vitality of the communities PG&E serves. In 2011, through PG&E’s nationally recognized giving program, the company donated over $23 million in charitable, shareholder-funded investments.
In San Luis Obispo and northern Santa Barbara counties in 2011, more than 90 local nonprofit organizations shared a total of $1.1 million of PG&E’s charitable funds. A contribution of $250,000 to the Lucia Mar School District helped create Central Coast New Tech High, a new school offering an innovative approach to 21st century education. PG&E’s $25,000 grant to the Prado Day Center in San Luis Obispo helped reduce the homeless services center’s energy costs using weatherization, energy improvements and building repairs. PG&E employees bolstered the effort in an afternoon spent painting and refurbishing the center’s dining area and bathrooms. PG&E’s partnership with Habitat for Humanity provided a $37,500 grant to fund solar panels on three newly built homes. Not only do the solar panels help save families $500 a year on energy costs, but each panel also helps avoid the release of more than 132,000 pounds of carbon dioxide over the 30-year life of the system, or the equivalent greenhouse gas savings realized by recycling 20.9 tons of waste.

59
PG&E actively supports DCPP’s local area through various specially targeted community invest-ments programs, including:
PG&E Bright Ideas Grants: Teaching students about solar energy and conservation through a $10,000 grant for Arroyo Grande High School’s solar education project.
Cal Poly Journalism: Enabling students to develop key employment skills through a $38,000 grant for state-of-the-art audio visual equipment.
Port San Luis Marine Institute: Advancing education for underserved students in San Luis Obispo and Santa Barbara counties through a $15,000 donation to ongoing environmental education efforts.
PG&E Ambassadors: Training 40 PG&E employee ambassadors to support commu-nity events and offer public speaking presentations throughout the region.
REACH (Relief for Energy Assistance through Community Help): Relieving families in need with $25,000 of assistance to help pay energy bills.
California Mid State Fair Heritage Foundation: Assisting the fairgrounds to save money and energy through a $25,000 donation to replace outdated lighting fixtures at the fairgrounds.
Food Bank Coalition of San Luis Obispo County: Funding energy efficiency upgrades and volunteering for the group's annual Hope for the Holidays and Hunger Awareness campaigns.
More online at: www.pge.com/myhome/edusafety
Volunteerism
PG&E recognizes that its employees are an integral part of the company's community outreach and improvement efforts. Collectively, employees volunteered 32,585 hours in 2011, assisting in a range of charitable efforts throughout Northern and Central California. In December of 2011, over 100 PG&E employees from across DCPP’s local area worked with the non-profit Kaboom! and other community volunteers, collaborating to build a new playground at the Boys and Girls Club in Oceano. Over the course of a single day, the club’s barren asphalt was transformed into an impressive playground, complete with a rock-climbing wall and a twisty slide. The project also included shade structures, murals and an outdoor classroom. The work required mixing 18,000 pounds of concrete and moving 105 yards of mulch – all done by hand with the help of PG&E vol-unteers. The day culminated with a ceremony in which PG&E's chief nuclear officer presented the group a $73,000 check in support of the project.
Employee Giving
In keeping with the company’s goal to engage, support and improve the neighborhoods where its customers and employees live and work, San Luis Obispo and Northern Santa Barbara county employees pledged more than $429,000 to local organizations through PG&E's annual employee giving campaign.

60
6.2 Environmental Preservation/Land Stewardship
PG&E is proud of its long history of managing lands and waters in a responsible and environmen-tally sensitive manner. That commitment is exemplified by PG&E’s preservation of the 12,820 acres that make up the land upon which Diablo Canyon sits. The land is comprised of 14 miles of pristine coastline extending from Port San Luis Harbor to Montaña de Oro State Park and stretches inland about a mile and a half to the peaks of the Irish Hills.
Diablo Canyon is located in a unique and sensitive biome, home to fauna like American peregrine falcon, brown pelican, southern sea otter and northern elephant seal. As DCPP has a vast network of pipes and wires traversing this habitat, PG&E has an obligation to protect these resources while performing operations to meet customers’ expectations for reliability and service. Diablo Canyon’s Land Stewardship Program was initiated to manage and protect natural and cultural resources, share these resources with communities and educational organizations, provide opportunities for sustainable agricultural practices and develop managed access to promote environmental appre-ciation. The Land Stewardship team consists of professionals from many disciplines including archaeologists, biologists, engineers, land planners and foresters who closely monitor the land.
PG&E’s active stewardship of this natural resource includes livestock grazing, resulting in a healthier rangeland habitat that sustains native plant species while reducing invasive plant spe-cies. PG&E also allows researchers to explore the area’s habitat and ecology. This includes archaeology students from nearby Cal Poly who, in partnership with PG&E, are engaged in a multi-year research project focused on the prehistory of the Pecho Coast, and State Parks, Cal Poly and CALFIRE presonnel who partner with PG&E to conduct prescribed burns to restore a closed-cone Bishop Pine grove.
The property also includes two scenic trails open to the public for hiking opportunities—the 3.3-mile Point Buchon Trail (round trip is 7.5 miles), and 3.75-mile Pecho Coast Trail (round trip is 8 miles). As part of PG&E’s broader effort to promote environmental education, docent naturalists, who include plant employees, lead groups along Pecho Coast Trail and provide information about the location’s history, cultural resources and biological diversity. The Point Buchon Trail is located on the northern end of the property, and in an effort to preserve the landscape, has a daily limit of 275 hikers. This 3.3-mile trail is accessed through Montaña de Oro State Park and allows hikers to enjoy the area's pristine coastline. PG&E has partnered with the California Coastal Commission, California Conservation Corps, and Cal Poly San Luis Obispo to protect resources from hiker impact and to conduct trail maintenance. Interpretive signage has been developed to provide the public an opportunity to appreciate the natural resources of the Point Buchon Trail and build awareness of the stewardship programs (such as rotational grazing programs and prescribed burns), that the Stewardship team has developed.

61
Additionally, the Pecho Coast Trail, which has been open since 1993, offers a hike to the beautiful 1890’s Victorian Lighthouse located on the south end of the DCPP property. This docent-guided trail is available by reservation only, passing through a pathway close to the entrance of the plant’s employee access road. This 1.75-mile hike affords access to beautiful rugged cliffs and broad coastal terraces as well as the newly restored Point San Luis Lighthouse. The trail continues another 2 miles up the coast to an ancient oak grotto.
PG&E has partnered with the California Coastal Commission, California Conservation Corps, Port San Luis Harbor District and Point San Luis Lighthouse Keepers (non-profit that maintains the Lighthouse) and many volunteers to conduct trail maintenance such as eradicating noxious weeds, and develop educational programs for underserved youth. Through its Land Stewardship Program, PG&E has preserved these areas that offer examples of the Central Coast in its natural, open space context.
For more information, please visit www.pge.com/myhome/environment/commitment

62
6.3 Air Quality
One of the most important aspects of environmental stewardship is the improvement of air quality. The Clean Air Act of 1970 set standards to improve the nation’s air quality by establishing limits on the emission of nitrogen oxides (NOx), a precursor of ground-level ozone and smog; sulfur dioxide, which produces acid rain; particulate matter, such as smoke and dust; and mercury. In 1990, the U.S. Environmental Protection Agency amended the Clean Air Act by developing extensive regula-tions to reduce nitrogen oxides through creation of the Ozone Transport Commission and the NOx Budget Program to help reduce ground-level ozone in the Northeast and Mid-Atlantic states.
In 2009, the California Air Resources Board (ARB) established California’s Global Warming Solutions Act (AB32), setting the goal of reducing GHG emissions to 1990 levels by 2020. Greenhouse gas reporting regulations were enacted, requiring regulated entities such as PG&E to prepare and submit annual greenhouse gas emissions inventories to the California Air Resources Board. December 2010, ARB adopted a cap-and-trade program to place an upper limit on state-wide greenhouse gas emissions. This is the first state-level cap and trade program in the U.S. and took effect beginning 2012, with a limit that reduces by 15% over the life of the program (by 2020). It should be noted that the cap levels decrease by 2-3% per year even as the demand for electricity grows. As per AB32 requirements, PG&E began reporting greenhouse gas emissions from some of its facilities and operations to the U.S. EPA in 2011.
Nuclear energy is the world’s largest source of nearly emission-free power generation. Nuclear power plants emit absolutely no carbon dioxide, nitrogen oxides or sulphur dioxides. Heat gener-ates from fission rather than burning fuel, therefore producing no greenhouse gases or emissions associated with acid rain or urban smog. Using additional nuclear energy gives states increased flexibility in complying with clean-air requirements. For the year 2006, the Nuclear Energy Institute reported that U.S. nuclear plants prevented the emissions of almost 681.2 million metric tons of carbon dioxide. This is equivalent to removing 131 million U.S. passenger cars from service. In 2005, the 136 million U.S. passenger cars on the road generated an estimated 709.3 million metric tons of CO2 (See Figure 30). According to the World Nuclear Association (WNA), “For every 22 tons of uranium used, one million tons of CO2 emissions is averted.”

63
Nuclear power plants like DCPP emit virtually no greenhouse gases (GHGs) during the produc-tion of electricity. According to testimony by PG&E, DCPP avoids emitting seven to eight million tons of GHGs per year that would otherwise be produced by conventional generation sources, such as fossil fuel plants.17 PG&E’s most recent independently verified CO2 emissions rate of 575 pounds of CO2 per MWh is about half the national average among utilities. As a charter member of the California Climate Action Registry, PG&E was the first investor-owned utility in California to complete a third-party-verified inventory of carbon dioxide (CO2) emissions in 2003. In 2009, PG&E began voluntary reporting to The Climate Registry, a non-profit organization that sets con-sistent and transparent reporting standards for North American businesses and governments. PG&E is a founding member of The Climate Registry. In addition, PG&E has participated in the Carbon Disclosure Project since 2005. PG&E’s annual submission provides additional detail on our actions related to climate change and our greenhouse gas emissions profile.
Equivalent to CO2emmitted from 131million cars
All U.S. passenger cars(136 million cars) emittedan estimated 709.3MMT of CO2 in 2006
Nuclear Hydro Geothermal Wind Solar U.S. Cars
681.2
241.9
22.2 12.8 0.4
709.3
FIGURE 30: U.S. ELECTRICITY POWER INDUSTRY CO2 AVOIDEDMILLION METRIC TONS, 2006
17 Pacific Gas & Electric Company 2014 General Rate Case Prepared Testimony Exhibit (PG&E-6) Energy Supply, November 15, 2012
Source: Nuclear Energy Institute (NEI)
64
6.4 Emergency Planning and Preparedness
Diablo Canyon Power Plant is one of the safest and most secure industrial work environments in the country. Multiple layers of physical security, together with high levels of operations performance, protect plant workers, the public, and the environment. However, natural and man made disasters can strike, leaving devastation in their wake, such as the tsunami that hit Japan in March 2011. The timing and location of disaster events cannot accurately be predicated, but preparations can help mitigate their consequences.
PG&E strives to ensure DCPP’s local counties have the resources they need to discharge the seri-ous responsibility of emergency preparedness, planning and response in the event of radiologi-cal incident and/or the many other types of emergencies that could occur. PG&E has gone well beyond the scope of what is required by then Assemblyman Sam Blakeslee’s AB 292: “Nuclear Emergency Preparedness Funding, San Luis Obispo County” regulation. The law requires that local governments located near operating nuclear power plants develop and maintain emergency response plans with the utility, with all associated costs of plans reimbursed by the utility to the local government.
PG&E’s 2012 budget forecast of expenses related to DCPP’s offsite emergency preparedness exceeds $4 million. The State of California Nuclear Power Preparedness Fund, which supports State, County and local emergency response organizations, receives approximately $2.9 million dollars. Approximately $628,000 goes to support the Federal Emergency Management Agency (FEMA) exercise evaluation and program at DCPP.
Nearly $330,000 is spent annually on a number of programs meant to educate the public on emergency preparedness: PG&E places full-page advertisements in local telephone directories as the primary means for providing updated emergency preparedness information to the pub-lic; PG&E produced an emergency preparedness information calendar distributed throughout the DCPP Emergency Planning Zone (EPZ) as a handbook for planning special needs and protective actions; PG&E distributes siren information stickers for local businesses, parks and recreational areas within the DCPP EPZ; and PG&E assists in the funding of "No Assistance Required," a San Luis Obispo County Office of Emergency Services program that focuses on special needs popula-tion. This program helps special needs individuals to notify emergency responders that they have safely evacuated following an emergency.

65
Aside from the strong financial relationship between DCPP and the local emergency service offices, PG&E champions public education of emergency preparedness by sponsoring fun and exciting events for the community, such as a recent Preparedness Expo with the American Red Cross (ARC).
PG&E provided the ARC with $2.5 million to support their Ready Neighborhoods program, which improves disaster readiness throughout the utility’s territory.
On March 20, 2012, more than 1,000 people received information on how to prepare for a natu-ral disaster at the San Luis Obispo Veterans Hall, which provided a one-stop, public forum that touched on everything from CPR to seismic safety. About 20 local businesses, public safety agen-cies and service organizations also participated, including The Listos Program.
The Listos Program is a Spanish language disaster preparedness curriculum based in CERT (Community Emergency Response Team). PG&E is a proud supporter of Listos, which means "ready" in Spanish, and is a series of emergency preparedness courses that encourages the Spanish-speaking community to prepare for disasters and prepares residents to develop family communication plans, build specialized emergency kits, and teaches use of fire extinguishers and home utilities shut off in case of a disaster. In 2012, PG&E helped to expand the Listos Program beyond Santa Barbara County into San Luis Obispo with a $25,000 charitable grant.
Other Offsite Emergency Expenses:
Evacuation Time Estimate (funded under EP Rulemaking Project) - $250K
Offsite meteorological equipment maintenance support contract - $250K
Radiological monitoring equipment calibrations and dosimetry replacements - $45K
American Red Cross, local hospital and EMS support agreements - $30K
Contractor / staff augmentation for offsite exercise development - $20K
Joint Information Center video, mock media and spokesperson training - $20K
Annual siren test volunteer support agreement - $10K
State of CA / National Radiological Emergency Preparedness conference support - $7.5K
According to Victor Dricks, senior public affairs officer for NRC Region IV, the Commission conducted a nationwide review of nuclear power plants for their capacity to respond to earthquakes, power outages and other catastrophic events, and Diablo was found to have “a high level of preparedness and strong capability in terms of equipment and procedures to respond to severe events.”18
18 Dricks, Victor. The Santa Barbara Independent “The Eyes on Diablo.” Independent.com.

66
6.5 Housing Values
DCPP is an economic mainstay of San Luis Obispo and Santa Barbara counties, providing more than 1,483 high-paying head-of-household jobs, well above the average county wage. Unitary taxes paid by DCPP fund a large part of local school districts budgets and provide levels of public and educational services that are far above those in surrounding counties. Dispite the positive indicators of the economic benefits of DCPP, some opponents believe nuclear facilities have a neg-ative impact on real estate and property values and public and social services. However, a study published in 2006 by Roger H. Bezdek and Robert M. Wendling concluded that in areas close to nuclear power plants, total property values, assessed valuations and median housing prices were often increased at rates above the national and state averages.19 The study found that in each of its seven study regions, housing prices were several times higher than prior to the opening of the nuclear facilities. Furthermore, the study concluded that the presence of a nuclear facility actu-ally protected property values during periods of relative economic decline by providing stability and steady employment. It is impossible to quantify housing price increases resulting from DCPP due to the complexity of factors affecting prices.
Currently, the median house price in San Luis Obispo County is $365,000. An increase in new home inventory increases the prospect of owning a home (as opposed to renting), encouraging buyers to enter the housing market and creating the opportunity for the market to correct itself. The average rent for a three bedroom house is $1,456, whereas the payment for the median house is $1,455 (3.5% for 30 years). With an average salary of $136,500 and a current interest rate of 3.5 percent, a DCPP employee could qualify for a loan in excess of $736,000. The question of whether someone would purchase a home versus rent is personal, and doesn’t always follow the ability to afford. Therefore, it is inconclusive whether the presence of DCPP actually increases home prices or not.
19 Bezdek, Roger H., Wendling, Rober M. “The impacts of nuclear facilities on property values and other fac-tors in the surrounding communities”, Int. J. Nuclear Governance, Economy and Ecology, Vol. 1, No. 1, 2006.

67
Section 7: Conclusion
As an integral part of San Luis Obispo and Northern Santa Barbara counties, the economic impacts of Diablo Canyon Power Plant are real. Expenditures, jobs, tax revenues, economic impact, labor income, and contributions to the local economy make DCPP one of the most valued economic assets on the Central Coast of California.
Capturing all the economic activity generated by DCPP is difficult. This study does manage to capture the majority of it, although because of our anaylsis methodology, it does tend to produce conservative results. To more closely estimate the impacts, future studies could be performed for a detailed look at the economics of plant upgrades/modifications and unit refuelings. During these events, many out-of-town contractors descend on the local area, spending money in local hotels/motels, rentals, retail goods, food services and gasoline. Although there is generally a reduction in electricity generated during these activities, local economic activity increases dramatically.
Depending on outcome of future re-licensing activites, the opportunity costs for the local area are great. Non-license renewal will not only affect 2024 and beyond, it will also affect the near future, as plant modifications/upgrades to extend the life of the plant will no longer be necessary. Quantifying and understanding the economic impacts of DCPP is an important piece of the puzzle for the future of DCPP and the local area.

68
GlossaryAB292: Assembly Bill 292-Nuclear Emergency Preparedness Funding, San Luis Obispo County
Assembly Bill 32-California Global Warming Solutions Act (AB32): Specified greenhouse gas reduction goals for the State of California. Passed in 2006
ARB: California Air Resources Board
BLS: Bureau of Labor Statistics
BOE: State Board of Equalization
Capacity Factor: Output proportion of nomial full-power capacity
Diablo Canyon Power Plant Emergency Planning Zone (DCPP EPZ): An approximate 10 mile area around a nuclear power plant determined by the Nuclear Regulatory Commission and Environmental Protection Agency
Direct Impact: Total value of the good or service generated by the business or activity being ana-lyzed (value of electricity generated at DCPP)
FEMA: Federal Emergency Management Agency
GDP: Gross Domestic Product
Greenhouse Gases (GHG): Atmospheric gases that contribute to the greenhouse effect. Greenhouse gases absorb and emit infared radiation and include: water vapor, carbon dioxide, methane, nitrous oxide and ozone
GRP: Gross Regional Product
GWh: Gigawatt hours
ICE: Intercontinental Exchange
IMPLAN: Economic modeling software developed at the University of Minnesota and was later spun off as a private firm, the MIG
Indirect Impact: Revenue generated by other firms
Induced Impact: Change in household expenditures
Institute of Nuclear Power Operations (INPO): Formalized group to provide safety and reliability assistance to the nuclear power industry. Services include: plant evaluations, training and accre-didation, events and analysis information exchange and operations assistance
IRA Value: Imputed Rental Activity

69
ISAR: Industrial Safety Accident Rate
ISFSI: Independent Spent Fuel Storage Installation
KV: Kilovolt
MIG: Minnesota IMPLAN Group
MW: Megawatt
MWh: Megawatt hours
NAICS: Northern American Industry Classification System
NEI: Nuclear Energy Institute
NoX: Nitrogen oxides
NRC: Nuclear Regulatory Commission
NREP: National Radiological Emergency Preparedness
San Luis Obispo OES: San Luis Obispo County Office of Emergency Services
OSHA: Occupational Safety and Health Administration
O&M: Operating and Maintenance
Proposition 13: Passed in California in 1978 and established a fixed property tax rate of 1% of assessed value (plus amounts required to repay any assessment bonds approved by the voters)
PWR: Pressurized water reactors
RCLD: Replacement Cost New Less Depreciation
ROP: Reactor Oversight Process
Unitary Taxes: State corporate taxes on a corporation's global income
U.S. EPA: United States Environmental Protection Agency
Watt-Hour (Wh): Unit of measurement for electrical energy used in a circuit by a load of one watt of power for one hour
WANO: World Association of Nuclear Operators
WNA: World Nuclear Association

Prepared for: Pacific Gas and Electric Company
Prepared by: Professor Kenneth D. Riener Orfalea College of Business
California Polytechnic State University San Luis Obispo, CA 93407
Patrick Mayeda Productive Impact LLC
San Luis Obispo, CA 93401
June 2013