an economic impact analysis of the kentucky center for the
TRANSCRIPT

ECONOMIC IMPACT ANALYSIS


A research report for the Kentucky Center for the Performing Arts by Barry Kornstein, Senior Research Analyst, Urban Studies Institute, Department of Urban and Public Affairs, University of Louisville,
with the assistance of Bridget Kelley, MPA Candidate, Research Assistant, and Stacey Reason, MA/MPA Candidate, Research Assistant/Graphic Designer,
June 2014.
AN ECONOMIC IMPACT ANALYSIS OF THE KENTUCKY CENTER FOR THE
PERFORMING ARTS

SECTION ONEExecutive Summary 6The Economic and Fiscal Impact of The Kentucky Center on the Louisville Metropolitan Area 8
SECTION TWOIntroduction 14The Geographic Distribution of Attendees of The Kentucky Center for the Performing Arts Events 16School Group Attendance at The Kentucky Center for the Performing Arts 23
SECTION THREEThe Economic and Fiscal Impacts to the Louisville MSA Derived from The Kentucky Center 28Social and Community Impacts of The Kentucky Center 39

4

5

Executive Summary
The Kentucky Center for the Performing Arts (KCPA)
is currently celebrating its 30th anniversary season. Construction
began on the downtown performing arts center in 1980, using
a public-private financing package spearheaded and assembled
by Humana cofounder Wendell Cherry and Governor John Y.
Brown. The first performances at The Kentucky Center were in
the fall of 1983.
Today, The Kentucky Center has an operating budget
of nearly $13 million, with about 90 full-time employees. It
is financed through a combination of earned income (facility
rentals, ticket sales, and concession revenues), charitable
giving and foundation support, local hotel room taxes, and
state appropriations. It is the primary home for the Louisville
Orchestra, Louisville Ballet, Kentucky Opera, and Stage
One Family Theater, and hosts PNC Bank Broadway Across
America’s big touring Broadway productions. The Kentucky
Center produces its own series of comedy, dance, film, concert,
and variety performances and rents its theaters to local and
regional performing arts groups. Over 365,000 persons attended
performances at The Kentucky Center during the 2012-13 fiscal
year. One-quarter of those were school children.
The Kentucky Center also has an award winning arts
education program, including the Governor’s School for the 6
SECTI
ON
ONE

Arts, ArtsReach, and the Academies for Arts Integration. These
programs educate young artists from around the state either
directly or by assisting other arts organizations and community
centers across the state implement their own programs. They
also educate teachers and artists about how to bring the arts
into schools and integrate them seamlessly into the curriculum.
The Kentucky Center has a national reputation for award
winning arts access programs, and works with theaters locally
and around the state to ensure the arts are accessible to patrons
with disabilities.
Beyond the artistic, educational and economic impacts,
the KCPA is important for metro Louisville for another reason.
KCPA events provide a service to area and state residents that
is not provided by the private sector. There would likely be no
Classics concert series, or a place to host shows such as The
Book of Mormon or Wicked, if The Kentucky Center did not
exist. These artistic productions are clearly demanded by the
public in Louisville and Kentucky, and it is because of public
investment that we have a venue in which they can be hosted.
The events satisfy a consumer demand and raise the quality of
life in the community. The enhanced quality of life helps attract
both residents and companies, thus creating more economic
activity here than we would observe without The Kentucky
Center.
The Urban Studies Institute (USI) at the University of
Louisville was engaged by the KCPA to quantify the economic
impact of The Kentucky Center on the regional economy, and
evaluate KCPA’s economic and noneconomic contributions to
the region.
7

The economic impact of the KCPA consists of two
major pieces. The first is that its programming brings in tourists
from outside the twelve-county Louisville metropolitan area,
and the second is that its venues bring in artists who otherwise
would have likely bypassed Louisville on their national tours.
Both can be thought of as export industries of the region in the
sense that locally produced goods and services are being sold to
buyers from outside the metro area, bringing new dollars into
the Louisville metropolitan regional economy.
Among our findings were:
• Just under fourteen percent of performance ticket buyers
came from places that are more than a hundred miles from
Louisville. Overall, people attending KCPA performances
came from over 7,545 zip codes and 711 metropolitan and
micropolitan areas.
• The top ten metropolitan or micropolitan areas of origin for
attendees include five of the metro areas closest to Louisville
(Lexington, Elizabethtown, Cincinnati, Indianapolis, and
Evansville) and three of the closest micro areas (Richmond-
Berea, Bardstown, and Frankfort). It also includes, however,
quite a number of people from New York and Chicago.
• KCPA performances drew considerable numbers from
Cincinnati and Indianapolis, metros with their own quality
performing arts venues and vibrant artistic communities.
The percentages of attendees residing in Lexington,
Elizabethtown, Richmond-Berea, Cincinnati, and
Indianapolis are much greater in the current study than they
were in a previous study conducted a decade ago.
• About 69 percent of attendees came from within the
Louisville metropolitan area (Bullitt, Henry, Jefferson,
Oldham, Shelby, Spencer, and Trimble counties in Kentucky,
and Clark, Floyd, Harrison, Scott, and Washington counties
in Indiana). Performance-goers from outside the metro area
but within about 100 miles accounted for about 16 percent
of attendees, and those who traveled farther than 100 miles
to see a show made up nearly 15 percent of the attendees.
The Economic and Fiscal Impact of The Kentucky Center on the Louisville Metropolitan Area
8

• People from every state and the District of Columbia came
to see performances at The Kentucky Center. It is likely that
many of these people were in Louisville for business or leisure
unrelated to their attendance at a KCPA performance, but
they return home spreading the news about Louisville’s arts
attractions. In this regard, the KCPA is serving an important
public relations function for Louisville and Kentucky.
• Closer to home, over the 2000-2004 period, KCPA
performances drew patrons from every Kentucky county,
88 of the 93 Indiana counties and 80 of the 88 Ohio
counties. These statistics are a testament to the centrality
of the KCPA to the region’s performing arts experience.
Attendance was particularly strong from Richmond-
Berea, Madison, IN, and Campbellsville where total tickets
bought during the four year study period represent 18,
16, and 12 percent, respectively, of each micropolitan
area’s total population, despite considerable drives to
downtown Louisville. Other areas with a high percentage
of tickets sold in relation to their population were
Bardstown (23 percent) and Elizabethtown (19 percent).
• Over 300,000 students from elementary and secondary
school groups attended special KCPA performances during
the 2010 through 2013 fiscal years. This works out to an
average of around 400 students each school day. Roughly
88 percent of the school groups came from within the
Louisville metropolitan area. Eleven percent of the groups
came from outside of the metro area but within about 100
miles of The Kentucky Center. As may be expected, most
of the school groups were from Kentucky (over 92 percent).
Total
Total Performance Attendance 1,079,179
Live Outside of the Louisville Metropolitan Area 30.6%Visited Louisville Specifically to Attend KCPA Event 64.1%
Performance Attendees Relevant to Economic Impact Analysis 212,013
Attendees Who Stayed Overnight in the Metro Area 23.1%
Economic Impact Attendees - Overnight 48,870Economic Impact Attendees - Day Trip 163,143
Attendance Breakdown for Economic ImpactThe Kentucky Center, Fiscal Years 2010-2013
Note: Slightly different percentages of the three variables above were used for the touring Broadway performances. The differences were based on the slightly different geographic distribution of tickets in the database for the non-complementary tickets compared to the entire database. For the touring Broadway performances we used the results from the set of non-complementary tickets, which were a little higher for each variable. We present the weighted average.
9

• We estimate that nearly 19 percent of attendees, or about
212,000 people, were relevant to our economic impact
analysis. That is, they were both non-residents of the
Louisville metro area and in town specifically to attend an
event at The Kentucky Center. Of those, 23 percent stayed
overnight in Louisville, while the rest just came into town
for the day. On a recurring annual basis that is roughly
12,200 overnight visitors to Louisville and another 40,800
day trippers brought to Louisville by events at The Kentucky
Center. In concrete terms, the overnight visitors probably
account for around 6,500 hotel room-nights per year.
• Average annual direct personal spending by Louisville
non-residents, including lodging, food, shopping,
entertainment, and transportation is estimated to be
just under $5 million. Including the multiplier effects,
the tourist draw of The Kentucky Center leads to $8.3
million of economic output in the MSA and supports
125 jobs with an annual payroll of almost $2.4 million.
• There were nearly 10,000 students and chaperones annually
who attended KCPA performances from schools outside
of the Louisville metro area. These schools, students, and
chaperones spent around $102,000 on tickets and meals
during their stays in Louisville. Including the multiplier
effects, resident company school group performances lead
to almost $200,000 of economic output in the MSA and
support 4 jobs with an annual payroll of about $53,000.
Impact Type Employment Output Payroll
Direct Effect 115 $6,569,727 $1,791,124Indirect Effect 22 $2,619,251 $718,980Induced Effect 23 $2,969,211 $748,759
Total Effect 160 $12,158,189 $3,258,862
Indirect impact refers to business-to-business spin-off spending; Induced impact refers to household spending that is a result of increased earnings.
Average Annual Economic Impact to the Louisville MSADerived From Performance Events at
The Kentucky Center for the Arts, Fiscal Years 2010-2013
Total Tourist, Touring Shows & School Group Impact
Source: Customized IMPLAN (IMpacts for PLANing), version 3, model of the Louisville MSA, using 2011 economic data.
10

• Between the five or six touring Broadway productions and
the 40 to 50 touring artists each year, Louisville plays host
to the equivalent of a hundred people for ten weeks. That
is 7,000 people-days of spending by out-of-towners in the
local economy. Weekly spending on just personal items and
advertising is about $220,000. After the multiplier effects,
the touring productions at The Kentucky Center lead to
$3.6 million of economic output in the MSA and support
30 jobs with an annual payroll of almost $850,000.
Transient Room Taxes
Retail Sales Taxes Gasoline Taxes Totals
Jefferson County $79,835 $79,835So. Indiana Counties in MSA $6,343 $6,343State of Kentucky $79,941 $196,735 $31,805 $308,482State of Indiana $11,101 $24,609 $5,277 $40,986
Totals $177,220 $221,344 $37,082 $435,647
Local Income/ Occupational
TaxesState Income
TaxesState Sales
Taxes Totals
Jefferson County $53,298 $53,298So. Indiana Counties in MSA $9,803 $9,803State of Kentucky $94,078 $115,160 $209,239State of Indiana $28,968 $32,493 $61,462
Totals $63,101 $123,047 $147,653 $333,801
Derived From Non-Resident Attendees, Touring Shows, and School Groups
Note: The tax figures paid by MSA residents include the indirect and induced economic impacts of the tourism industry in the metro area.
Taxes Paid by Tourists, Touring Shows
Taxes Paid by MSA Residents
at The Kentucky Center for the Arts, Fiscal Years 2010-2013
Estimated Average Annual Tax Revenues
The Kentucky Center for the
Performing Arts has been
and continues to be a wise investment.
11
• Putting all three areas of economic impact together (non-
resident attendees, school groups from beyond the metro
area, and traveling production companies), the ultimate
effect of The Kentucky Center’s ability to host such
attractive performance events is $12.2 million of economic
output supporting 160 jobs with an annual payroll of about
$3.3 million.

• State and local governments benefit from over $750,000
in tax revenues generated annually by the economic
impact of The Kentucky Center. Of that, the tourists
and touring shows themselves pay $435,000 directly.
Employees of tourism affected industries, through their
income and household spending, contribute roughly
$334,000 annually to state and local governments.
• All the economic and fiscal impacts discussed are continual
and recurring benefits of The Kentucky Center’s ability to
attract productions and performers that draw visitors from
an area ranging from one to five hours drive from downtown
Louisville. The jobs that are supported by the incoming
dollars continue from year to year, while the dollars of
output, payroll, and tax revenues recur year after year.
• Thousands of people from every region of the state are
enriched each year through direct contact with local,
regional, and nationally touring artists via outreach and
education programs such as Arts in Healing, ArtsReach, and
the Governor’s School for the Arts. Many more benefit from
the valuable training that The Kentucky Center’s Academies
for Arts Integration, and Gheens Artist Residency Program
provide to teachers and community center staff from all
parts of Kentucky. With an outreach and education budget
of less than $1.5 million, it is certainly the case that, though
we cannot actually measure them, the benefits of these
programs far outweigh the costs.
The Kentucky Center for the Performing Arts has been
and continues to be a wise investment.
12

13

The Kentucky Center for the Performing Arts
(KCPA) is currently celebrating its 30th anniversary
season of programming. Since The Kentucky Center’s
opening in November of 1983 it has been Kentucky’s
premier venue for the best in music, dance, and theater.
The Kentucky Center for the Performing Arts
houses four venues within its striking glass-enclosed
building and manages a fifth offsite. The largest space
is Robert S. Whitney Hall, a grand multipurpose
concert hall seating about 2,400 people. Also onsite
is the more intimate Moritz von Bomhard Theater,
whose steeply raked aisles provide a great view from
any of the 619 seats. Rounding out the onsite venues
are the Boyd Martin Experimental Theater, a small
“black box” space often rented out to local arts and
theater groups for their productions, and the 100-
seat KentuckyShow! Theater, which is dedicated to
the multimedia KentuckyShow! celebrating the state’s
history, culture, music, and people. Offsite, the KCPA
manages the beautifully restored 1920s era 1,400 seat
W. L. Lyons Brown Theatre nearby on Broadway.
The KCPA’s resident companies – Louisville
Orchestra, Louisville Ballet, Kentucky Opera, and
Stage One Family Theater – are the finest in the region
and have been home to many nationally renowned artists over the years. The
Kentucky Center is also home to PNC Bank Broadway Across America and
is the only place in the state where one can see the biggest touring Broadway
productions, usually in extended runs of one to three weeks. In addition,
the KCPA produces its own series of comedy, dance, film, concert, and
variety performances (Kentucky Center Presents), and rents its theaters to
local and regional performing arts groups and promoters bringing national
acts to Louisville. Finally, in recent years the KCPA has been home to The
Kentucky Author Forum and IdeaFestival, making it a hub of intellectual
activity.
The Kentucky Center also operates a variety of education
and community outreach programs. It partners with schools, teachers,
community centers, colleges and universities, health care facilities, artists
and performing arts centers throughout Kentucky to provide on-site
arts experiences and resources to audiences of all ages and backgrounds.
These range from bringing the healing power of the arts to people with
physical and/or emotional disabilities or illnesses, to introducing the arts to
underserved communities, and from providing professional development
opportunities to teachers, to operating the annual Governor’s School for
the Arts.
KCPA has an operating budget of nearly $13 million, with about 90
full-time employees. It is financed through a combination of earned income
(facility rentals, ticket sales, and concession revenues), charitable giving and
foundation support, local hotel room taxes, and state appropriations.
Introduction
14
SECTI
ON
TWO
Aside from providing much used and appreciated
cultural services to the Louisville community, KCPA also has
an economic impact on the surrounding community whenever
people from outside the region purchase tickets to KCPA events
and travel to Louisville to attend those performances. This is the
type of economic effect traditionally associated with industry
- the economic activity induced by sales to nonresidents. It is
the export of a good or service which brings in new money
to the local economy. To varying extents, KCPA performances
attract hundreds of attendees from outside the region. These
nonresidents are attracted to a Louisville event and spend dollars
in the local economy that would have been spent in another state
or metropolitan area had that particular performance not been
held here. These new dollars hit our economy first at hotels,
restaurants, gift shops, and other retail establishments. They
recirculate many times through the local economy (businesses
use them to buy more supplies, some locally, and pay employees
who then spend them on their households), creating more new
businesses, earned income, job opportunities, and tax revenues.
It is this latter type of effect, which corresponds to the strict
technical sense of the term “economic impact,” and it is what
we focus on when we examine the economic and fiscal impact
of KCPA.
15
This focus on the strict sense of economic impact means
we have to both clearly define the local region from which the
goods and services are exported and the estimate of the number
of customers purchasing those goods and services (as well as
how much of which goods and services, which we will do later).
Because dollars do not respect political jurisdictions, the
unit of analysis for this report is the economic region. That
is, economic flows are captured in economic regions and not
confined to cities, counties or even states. When measuring
the economic impact of an industry or activity on a region,
economists focus on contiguous geographic areas that exhibit
a great deal of social and economic integration. Using Census
Bureau data on home-to-work commuting patterns, the Office
of Management and Budget has established several hundred
Metropolitan Statistical Areas (MSA) that, according to the
commuting patterns, tend to function as coherent economic
units. It is not a perfect system, since it is based on county
boundaries, which differ markedly in size throughout the
country. However, it is a good approximation, especially for
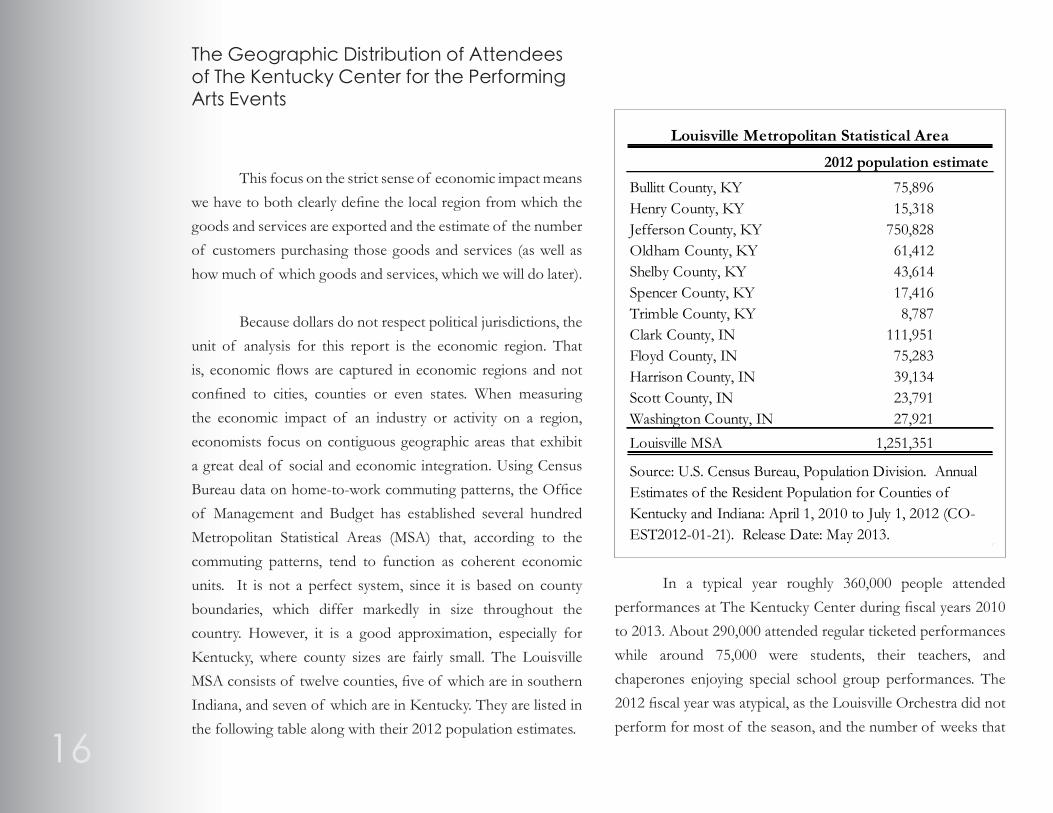
Kentucky, where county sizes are fairly small. The Louisville
MSA consists of twelve counties, five of which are in southern
Indiana, and seven of which are in Kentucky. They are listed in
the following table along with their 2012 population estimates.
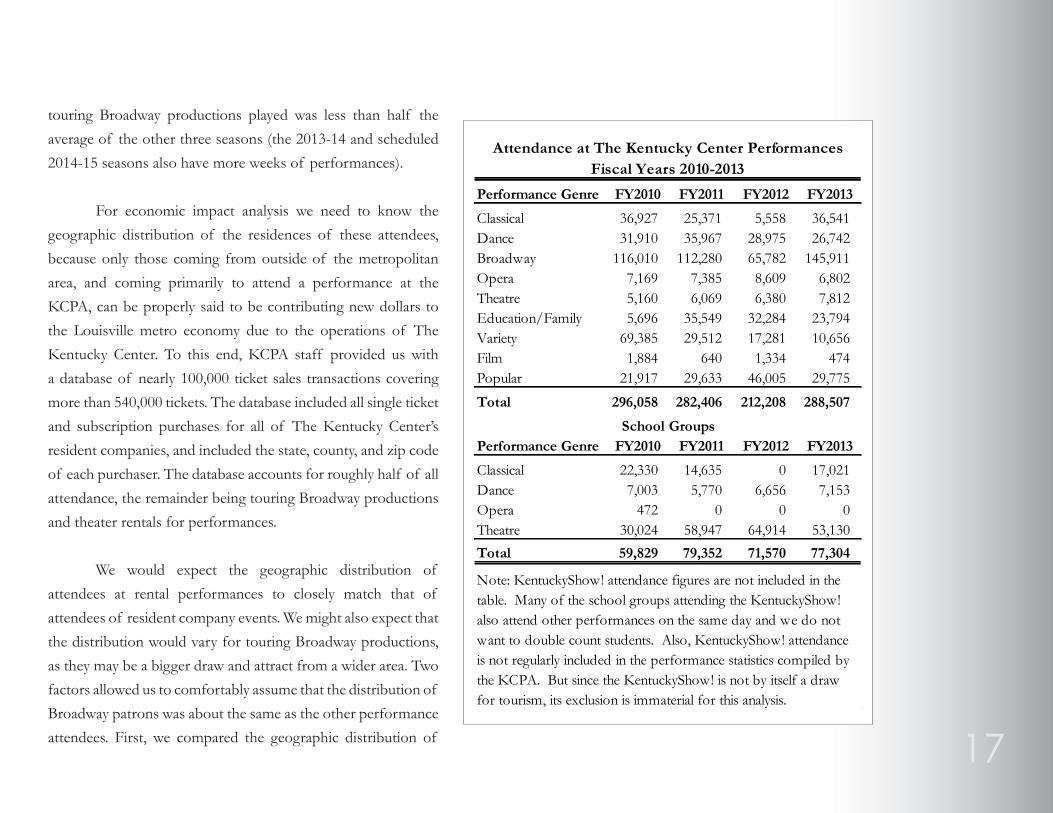
In a typical year roughly 360,000 people attended
performances at The Kentucky Center during fiscal years 2010
to 2013. About 290,000 attended regular ticketed performances
while around 75,000 were students, their teachers, and
chaperones enjoying special school group performances. The
2012 fiscal year was atypical, as the Louisville Orchestra did not
perform for most of the season, and the number of weeks that
The Geographic Distribution of Attendees of The Kentucky Center for the Performing Arts Events
2012 population estimate
Bullitt County, KY 75,896Henry County, KY 15,318Jefferson County, KY 750,828Oldham County, KY 61,412Shelby County, KY 43,614Spencer County, KY 17,416Trimble County, KY 8,787Clark County, IN 111,951Floyd County, IN 75,283Harrison County, IN 39,134Scott County, IN 23,791Washington County, IN 27,921
Louisville MSA 1,251,351
Louisville Metropolitan Statistical Area
Source: U.S. Census Bureau, Population Division. Annual Estimates of the Resident Population for Counties of Kentucky and Indiana: April 1, 2010 to July 1, 2012 (CO-EST2012-01-21). Release Date: May 2013.
16
touring Broadway productions played was less than half the
average of the other three seasons (the 2013-14 and scheduled
2014-15 seasons also have more weeks of performances).
For economic impact analysis we need to know the
geographic distribution of the residences of these attendees,
because only those coming from outside of the metropolitan
area, and coming primarily to attend a performance at the
KCPA, can be properly said to be contributing new dollars to
the Louisville metro economy due to the operations of The
Kentucky Center. To this end, KCPA staff provided us with
a database of nearly 100,000 ticket sales transactions covering
more than 540,000 tickets. The database included all single ticket
and subscription purchases for all of The Kentucky Center’s
resident companies, and included the state, county, and zip code
of each purchaser. The database accounts for roughly half of all
attendance, the remainder being touring Broadway productions
and theater rentals for performances.
We would expect the geographic distribution of
attendees at rental performances to closely match that of
attendees of resident company events. We might also expect that
the distribution would vary for touring Broadway productions,
as they may be a bigger draw and attract from a wider area. Two
factors allowed us to comfortably assume that the distribution of
Broadway patrons was about the same as the other performance
attendees. First, we compared the geographic distribution of
Performance Genre FY2010 FY2011 FY2012 FY2013
Classical 36,927 25,371 5,558 36,541Dance 31,910 35,967 28,975 26,742Broadway 116,010 112,280 65,782 145,911Opera 7,169 7,385 8,609 6,802Theatre 5,160 6,069 6,380 7,812Education/Family 5,696 35,549 32,284 23,794Variety 69,385 29,512 17,281 10,656Film 1,884 640 1,334 474Popular 21,917 29,633 46,005 29,775
Total 296,058 282,406 212,208 288,507
Performance Genre FY2010 FY2011 FY2012 FY2013
Classical 22,330 14,635 0 17,021Dance 7,003 5,770 6,656 7,153Opera 472 0 0 0Theatre 30,024 58,947 64,914 53,130
Total 59,829 79,352 71,570 77,304
Attendance at The Kentucky Center PerformancesFiscal Years 2010-2013
School Groups
Note: KentuckyShow! attendance figures are not included in the table. Many of the school groups attending the KentuckyShow! also attend other performances on the same day and we do not want to double count students. Also, KentuckyShow! attendance is not regularly included in the performance statistics compiled by the KCPA. But since the KentuckyShow! is not by itself a draw for tourism, its exclusion is immaterial for this analysis.
17

all the tickets in the database to just
the non-complementary tickets sold
(about fifteen percent of the ticket
transactions database consisted of
complementary tickets), since there
are very few comped Broadway tickets.
While the percentage of tickets going
to Jefferson County residents dropped
from 54.7 percent to 51.7 percent after
taking out the complementary tickets,
the percentages within the MSA,
within a fifty mile radius, and within
a hundred mile radius were all very
close to the percentages for the entire
database. While the distribution of
tickets within the metro area changed,
the geographic distribution outside of
the metro was nearly identical in the
full database and its subset.
Second, we estimated an
average distance traveled to The
Kentucky Center for the non-
complementary tickets and compared it
to travel distance estimates for touring
Broadway productions published by
The Broadway League, the national trade association for the Broadway industry. For all
ticket buyers residing within a 300 mile radius of the KCPA, the estimated distance traveled
was a bit under 40 miles. The Broadway League periodically conducts economic impact
studies of Touring Broadway, which utilize audience surveys. Their 2010 report covering the
2008-2009 season found that theater patrons “who reported living outside the immediate
area and said that the theatre was their main reason for coming to the area traveled an
average of 38 miles.” Since in the Broadway League study “immediate area” is generally a
city downtown, it is roughly equivalent to the 40202 zip code in Louisville. Because these
two estimates are so close and the geographic distribution of non-comped tickets outside
the metro area is the same as it is for the full database we feel confident in assuming that
the geographic distribution of attendees for touring Broadway productions closely matches
that of the resident companies.
All Tickets
Non-Complementary
Tickets All TicketsFY2010-FY2013 FY2010-FY2013 FY2001-FY2004
Jefferson County 54.1% 51.7% 68.5%Louisville MSA 69.5% 69.2% 85.2%Outside MSA, Within 100 Miles 16.7% 15.3% 9.2%Beyond 100 Miles 13.9% 15.5% 5.6%
Geographic Distribution of The Kentucky Center Performance AttendeesFiscal Years 2010 through 2013 (with comparison to FY2001-FY2004)
Note: Current study results based on database of 541,000 tickets distributed (469,000 sold, 82,000 complementary) during the four fiscal years. Previous study based on database of nearly 700,000 tickets distributed. Previous results have been updated to reflect the latest MSA definitions.
18

An analysis of the zip code data
indicates that around fourteen percent of the
individual ticket holders came from places
that are more than a two hour drive from
Louisville. Tickets were sold to residents
of 7,545 zip codes, representing 366 of the
country’s 381 metropolitan areas and 345
of the country’s 536 smaller micropolitan
areas. That is a much wider geographic
scope than we found in a previous study
we conducted for The Kentucky Center
covering the 2001 through 2004 fiscal years.
It is twice the percentage of tickets sold to
buyers residing beyond a two-hour drive
from downtown Louisville, representing
3,600 additional zip codes, 46 more metro
areas, and 99 more micropolitan areas than
were found in the previous study’s more
extensive database (it covered about three-
quarters of all tickets sold).
While 68 percent of attendees came
from Jefferson County in the previous
study ten years ago, we estimate that just 54
percent resided in Jefferson County during
the 2009-10 through 2012-13 seasons.
More than double the number of people came from outside the metropolitan area
than in the previous study’s results, just over 30 percent versus about 15 percent. The
greater geographic scope of performance-goers in recent years versus a decade prior
is in even greater display in terms of those who traveled farthest to see a show. We
estimate that nearly 14 percent of attendees during the 2010 through 2013 fiscal
years resided more than 100 miles from The Kentucky Center, while we estimated
that less than 6 percent did so a decade earlier.
19
Tickets PercentMetro- or Micro-politan Title in Database Percent FY2001-FY2004
Louisville/Jefferson County, KY-IN 375,784 69.5% 85.2%Lexington-Fayette, KY 24,085 4.5% 2.5%Elizabethtown-Fort Knox, KY 14,812 2.7% 1.8%Richmond-Berea, KY 9,244 1.7% 0.3%Cincinnati, OH-KY-IN 9,052 1.7% 0.5%Bardstown, KY 5,255 1.0% 0.8%Indianapolis-Carmel-Anderson, IN 4,519 0.8% 0.2%Frankfort, KY 3,706 0.7% 0.9%New York-Newark-Jersey City, NY-NJ-PA 3,578 0.7% 0.1%Evansville, IN-KY 2,912 0.5% 0.6%Chicago-Naperville-Elgin, IL-IN-WI 2,902 0.5% 0.1%
Note: Current study results based on database of 541,000 tickets distributed (469,000 sold, 82,000 complementary) during the four fiscal years. Previous study based on database of nearly 700,000 tickets distributed. Previous results have been updated to reflect the latest MSA definition for Louisville, but not other MSAs.
Top Ten Metropolitan and Micropolitan Areas of ResidenceThe Kentucky Center Attendees, Fiscal Years 2010 through 2013
(with comparison to FY2001-FY2004)

In the previous table we list the top ten metropolitan areas of origin
(aside from Louisville) for attendees in our sample of ticket holders along
with their estimated percentage of attendees in the previous study. As may
be expected, the list includes five of the metro areas closest to Louisville
(Lexington, Elizabethtown, Cincinnati, Indianapolis, and Evansville) and three
of the closest micro areas (Richmond-Berea, Bardstown, and Frankfort). It
also includes, however, quite a number of people from New York and Chicago.
Among the top forty metropolitan areas represented by performance attendees
were Nashville, Washington, D.C., Columbus, Atlanta, Los Angeles, Houston,
St. Louis, Austin, Miami, Dallas, Detroit, Philadelphia, Tampa, and Cleveland.
People from every state and the District of Columbia came to see performances
at The Kentucky Center during the study period. It is likely that many of these
people were in Louisville for business or leisure unrelated to their attendance at
a KCPA performance, but those people return home spreading the news about
Louisville’s arts attractions. In this regard, the KCPA serves a very important
public relations function for Louisville and Kentucky.
It is significant that KCPA performances drew considerable numbers
from Cincinnati and Indianapolis, metros with their own quality performing
arts venues and vibrant artistic communities. Furthermore, the percentages of
attendees residing in Lexington, Elizabethtown, Richmond-Berea, Cincinnati,
and Indianapolis are much greater in the current study than they were a decade
earlier.
20

The map shows the extent of the geographic coverage that the Kentucky Center performance events achieved in the
greater region. It shows the number of attendees by zip code for a 300-mile radius around Louisville. As can be seen in the
map, KCPA shows drew very well all along the interstates in Kentucky and southern Indiana and Kentucky’s parkways. To
the north, KCPA performances achieved good geographic coverage along the well-populated I-75 corridor from northern
Kentucky through Cincinnati up to Dayton. KCPA shows also drew well along the I-65 corridor all the way to Lafayette (the
KnoxvilleNashville
St. Louis
Chicago
Columbus
Toledo
Cincinnati
Dayton
Lexington
Louisville
Bowling GreenHopkinsville
Paducah
RichmondOwensboro Elizabethtown
Ashland
Frankfort
Indianapolis
Fort Wayne
Evansville
Lafayette
ColumbusBloomington
Geographic Distribution of Ticket Purchasesfor The Kentucky Center for the Performing Arts Events, Fiscals Years 2010-2013
300 Mile Radius fromThe Kentucky Center
Total Tickets Sold forThe Kentucky Center Performances
by Zip Code, FY2010-FY2013
1 - 9
10 - 99
100 - 999
1,000 - 59,510
Interstate HighwaysCounty Boundaries
Based on a database of 540,000 single performanceand subscription ticket sales for KCPA Presents andResident Company performances. The data does notinclude KCPA rentals or PNC Broadway Across Americaperformances.
21
Purdue University area). To the south, KCPA performances did very well along the
I-64/I-75 corridor through Lexington and south to the Tennessee border, and the
I-65 corridor through Bowling Green to Nashville. Of course, these are also where
the biggest population centers are, but there is also very good coverage in the area
south of Louisville between the I-65 and I-75 corridors. This area has the small
cities of Bardstown, Campbellsville, Danville, and Somerset. The map also gives a
good view of just how well The Kentucky Center performances draw in the small
cities and rural areas of central Kentucky and southern Indiana. Of the patrons
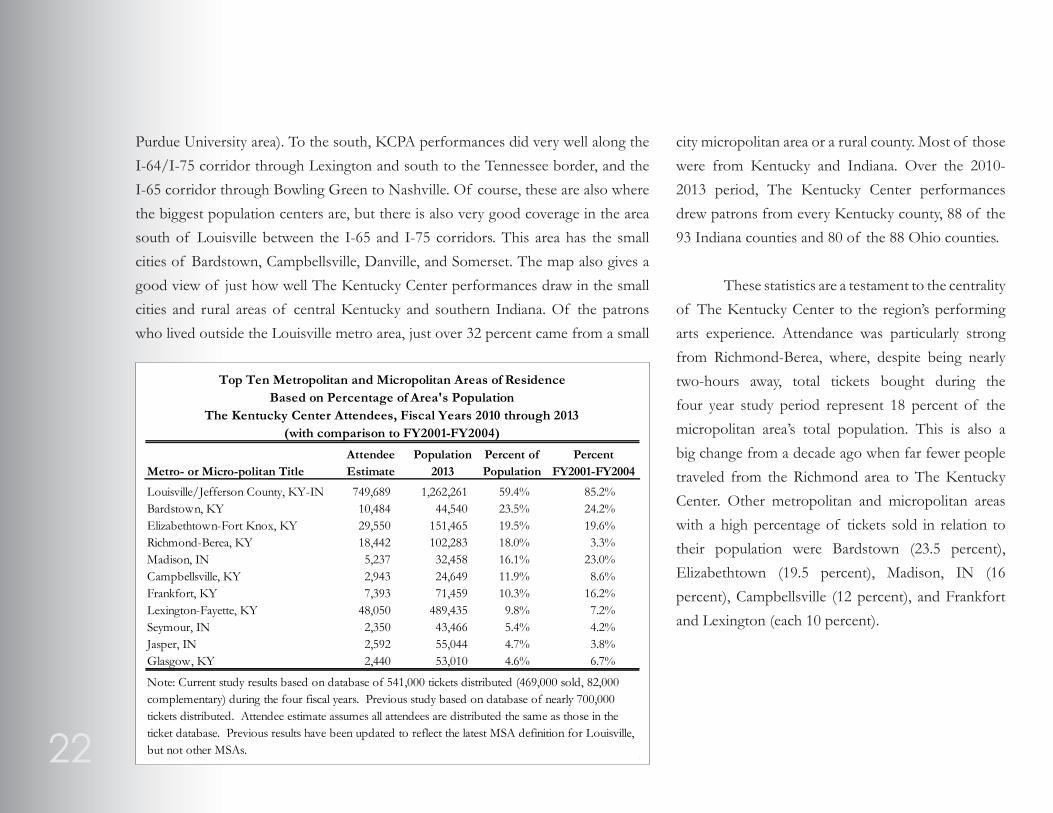
who lived outside the Louisville metro area, just over 32 percent came from a small
city micropolitan area or a rural county. Most of those
were from Kentucky and Indiana. Over the 2010-
2013 period, The Kentucky Center performances
drew patrons from every Kentucky county, 88 of the
93 Indiana counties and 80 of the 88 Ohio counties.
These statistics are a testament to the centrality
of The Kentucky Center to the region’s performing
arts experience. Attendance was particularly strong
from Richmond-Berea, where, despite being nearly
two-hours away, total tickets bought during the
four year study period represent 18 percent of the
micropolitan area’s total population. This is also a
big change from a decade ago when far fewer people
traveled from the Richmond area to The Kentucky
Center. Other metropolitan and micropolitan areas
with a high percentage of tickets sold in relation to
their population were Bardstown (23.5 percent),
Elizabethtown (19.5 percent), Madison, IN (16
percent), Campbellsville (12 percent), and Frankfort
and Lexington (each 10 percent).
Attendee Population Percent of PercentMetro- or Micro-politan Title Estimate 2013 Population FY2001-FY2004
Louisville/Jefferson County, KY-IN 749,689 1,262,261 59.4% 85.2%Bardstown, KY 10,484 44,540 23.5% 24.2%Elizabethtown-Fort Knox, KY 29,550 151,465 19.5% 19.6%Richmond-Berea, KY 18,442 102,283 18.0% 3.3%Madison, IN 5,237 32,458 16.1% 23.0%Campbellsville, KY 2,943 24,649 11.9% 8.6%Frankfort, KY 7,393 71,459 10.3% 16.2%Lexington-Fayette, KY 48,050 489,435 9.8% 7.2%Seymour, IN 2,350 43,466 5.4% 4.2%Jasper, IN 2,592 55,044 4.7% 3.8%Glasgow, KY 2,440 53,010 4.6% 6.7%
Note: Current study results based on database of 541,000 tickets distributed (469,000 sold, 82,000 complementary) during the four fiscal years. Previous study based on database of nearly 700,000 tickets distributed. Attendee estimate assumes all attendees are distributed the same as those in the ticket database. Previous results have been updated to reflect the latest MSA definition for Louisville, but not other MSAs.
Top Ten Metropolitan and Micropolitan Areas of Residence
The Kentucky Center Attendees, Fiscal Years 2010 through 2013(with comparison to FY2001-FY2004)
Based on Percentage of Area's Population
22
23
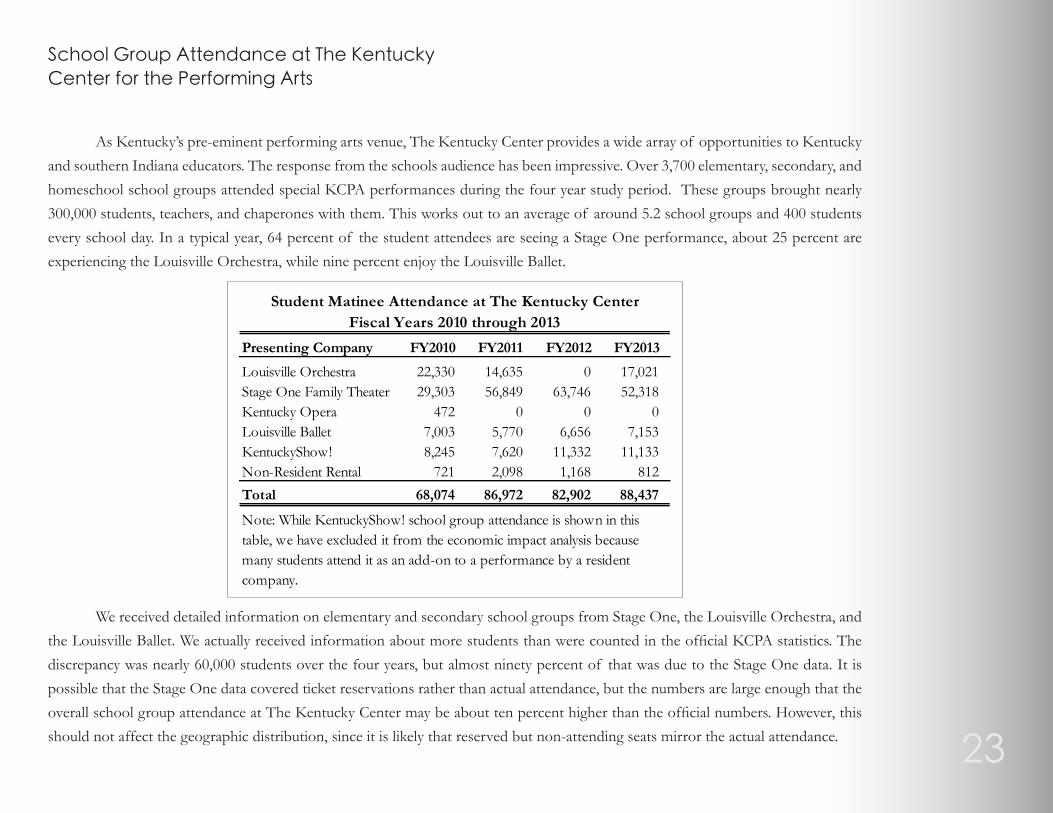
As Kentucky’s pre-eminent performing arts venue, The Kentucky Center provides a wide array of opportunities to Kentucky
and southern Indiana educators. The response from the schools audience has been impressive. Over 3,700 elementary, secondary, and
homeschool school groups attended special KCPA performances during the four year study period. These groups brought nearly
300,000 students, teachers, and chaperones with them. This works out to an average of around 5.2 school groups and 400 students
every school day. In a typical year, 64 percent of the student attendees are seeing a Stage One performance, about 25 percent are
experiencing the Louisville Orchestra, while nine percent enjoy the Louisville Ballet.
We received detailed information on elementary and secondary school groups from Stage One, the Louisville Orchestra, and
the Louisville Ballet. We actually received information about more students than were counted in the official KCPA statistics. The
discrepancy was nearly 60,000 students over the four years, but almost ninety percent of that was due to the Stage One data. It is
possible that the Stage One data covered ticket reservations rather than actual attendance, but the numbers are large enough that the
overall school group attendance at The Kentucky Center may be about ten percent higher than the official numbers. However, this
should not affect the geographic distribution, since it is likely that reserved but non-attending seats mirror the actual attendance.
School Group Attendance at The Kentucky Center for the Performing Arts
Presenting Company FY2010 FY2011 FY2012 FY2013
Louisville Orchestra 22,330 14,635 0 17,021Stage One Family Theater 29,303 56,849 63,746 52,318Kentucky Opera 472 0 0 0Louisville Ballet 7,003 5,770 6,656 7,153KentuckyShow! 8,245 7,620 11,332 11,133Non-Resident Rental 721 2,098 1,168 812
Total 68,074 86,972 82,902 88,437
Student Matinee Attendance at The Kentucky CenterFiscal Years 2010 through 2013
Note: While KentuckyShow! school group attendance is shown in this table, we have excluded it from the economic impact analysis because many students attend it as an add-on to a performance by a resident company.

The table summarizes the geographic distribution of school group attendance. Roughly 88 percent of the school groups came
from within the Louisville metropolitan area. This is more concentrated than a decade ago, especially with regard to Jefferson County,
which now accounts for 70 percent of school attendees, up from just 54 percent in the previous study. Eleven percent of the groups
came from outside of the metro area but within about 100 miles of The Kentucky Center. Finally, just one-half of a percent of the
groups traveled farther than 100 miles to see a performance. As may be expected, most of the school groups were from Kentucky (over
92 percent). The rest were from Indiana.
The map (to the right) shows that The Kentucky Center does well in attracting school groups from throughout central Kentucky,
from just west of Interstate 65 to just east of Interstate 75, but especially well in the corridor between Louisville and Elizabethtown
along Interstate 65. This is a bit of a change from the previous study, as then more school groups came from along the I-64 corridor to
Louisville’s east. The distribution of school groups has shifted to the west and a bit north.
FY2010-FY2013 FY2001-FY2004
Jefferson County 70.9% 54.3%Louisville MSA 88.3% 82.4%Outside MSA, Within 100 Miles 11.2% 15.0%Beyond 100 Miles 0.5% 2.5%
Geographic Distribution of School Group AttendanceFiscal Years 2010 through 2013 (with comparison to FY2001-FY2004)
Note: Current study results based on database of 342,000 ticket reservations during the four fiscal years. These tickets cover at least 98 percent of all school attendance. Previous study based on database of nearly 175,000 school group tickets and extrapolated. Previous results have been updated to reflect the latest MSA definitions.
24

25
Anderson
Cincinnati
Lexington
Louisville
Bowling GreenHopkinsville
Paducah
RichmondOwensboro Elizabethtown
Ashland
Frankfort
Indianapolis
Evansville
Seymour
Geographic Distribution of School Group Attendancefor The Kentucky Center for the Performing Arts Events, Fiscals Years 2010-2013
Based on a database of 3,715 elementary, secondary, andhomeschool school groups attending Stage One,Orchestra, and Ballet performances. This represents about90% of all school groups, but possibly higher since manygroups attend KentuckyShow! before or after the ResidentCompany performance.
Total School Group Attendance by Countyfor The Kentucky Center Performances, FY2010-FY2013
5 - 799
1,041 - 5,040
8,746 - 15,516
242,915
Interstate Highways
County Boundaries

26
The next table lists the top ten counties
outside of Jefferson County, KY, ranked by school
group attendance. Of the ten counties, seven are in
the Louisville metro area (Oldham, Clark, Bullitt,
Shelby, Harrison, Henry, and Floyd), two used to be a
part of the Louisville MSA (Nelson and Meade), and
the tenth includes Elizabethtown, one of the largest
population centers in central Kentucky. In terms of
economic activity, Louisville has a broader reach than
just the metropolitan area boundaries. As defined by
the U.S. Bureau of Economic Analysis, using county-
level commuting pattern and media consumption
information, Louisville’s economic area is 25 counties
large (18 counties in Kentucky and seven in Indiana).
The central contiguous block of colored counties on
the map of school group attendance is actually a near
match with the Louisville economic area.
The most notable attendance by schools
outside the Louisville economic area came from
Anderson County, where 23 groups, ranging from
pre-K to middle school sent about 2,400 students and
450 chaperones to KCPA performances over the four
years. Perhaps the longest trips by Kentucky schools
were taken by schools in Caldwell and Boyd counties
(in far southwestern and eastern Kentucky).
Teachers & TotalCounty Students Chaperones Attendance PercentJefferson County, KY 216,577 26,144 242,721 70.9%Oldham County, KY 13,701 1,815 15,516 4.5%Clark County, IN 9,515 1,328 10,843 3.2%Bullitt County, KY 9,468 1,327 10,795 3.2%Nelson County, KY 7,981 1,687 9,668 2.8%Hardin County, KY 7,816 930 8,746 2.6%Shelby County, KY 4,317 723 5,040 1.5%Harrison County, IN 3,818 676 4,494 1.3%Meade County, KY 2,851 706 3,557 1.0%Henry County, KY 2,763 443 3,206 0.9%Floyd County, IN 2,441 465 2,906 0.8%
Top Ten Counties of Origin for School GroupsFiscal Years 2010 through 2013
Note: Current study results based on database of 342,000 ticket reservations during the four fiscal years. These tickets cover at least 98 percent of all school attendance.

27

28
important reason they came to the venue area. Ideally, we would
like to know how that percentage varied with distance traveled.
But since there are both reasons to believe the percentage may
be lower for attendees from outside the metro area and also
reasons to believe it may be higher for at least some range of
distances traveled, we use the 64 percent figure as the basis for
our calculations.
From our attendance data we know about how many
people who attended performances at The Kentucky Center
came from outside of the Louisville MSA, and we have a
reasonable estimate of how many of those came specifically
to attend the performance. These are the people who are truly
adding new dollars to the local economy due to the influence of
The Kentucky Center. The next step is estimating how much
they spend and on what goods and services. With good survey
data, we could slice up the various demographic characteristics
of the performance-goers and create many possible spending
profiles for subgroups of our economic impact attendees. For
example, young couples in their twenties may spend very little on
dining compared to much older and wealthier couples. Lacking
such information, we instead rely on a number of surveys done
for similar purposes locally and our past experience to formulate
an average spending profile for KCPA performance attendees.
Estimating How Many Event Attendees are Relevant to
Economic Impact
In an economic impact study of visitors drawn to an
area because of a specific event, it is important to estimate the
percentage of event attendees who came to the area specifically
for the event in question. If a person attending the event is
visiting the area for some other reason, then any of his or her
spending associated with the event cannot be properly credited
with having been caused by the event itself. In other words, we
must assume that some level of spending by this visitor would
have occurred regardless of the event, and that the event may
have caused a reallocation of spending within the community
but not any additional spending. For the school groups, this
is very easy. We know that they have come specifically to
attend a performance at The Kentucky Center. For regular
performances, in the absence of much survey data, we must
make some assumptions.
Since we are comfortable that the distribution of
resident company and Kentucky Center Presents patrons is
very similar to rental performances and touring Broadway
productions, we turn again to the 2010 economic impact study
of Touring Broadway conducted by The Broadway League. In
that study, approximately 64 percent of survey respondents
reported that the Broadway show was either a very important or
The Economic and Fiscal Impacts to the Louisville MSA Derived from The Kentucky Center
SECTI
ON THREE

29
percentage was low at 60 miles from The Kentucky Center but
increased linearly at each 10 mile increment, reaching about 50
percent at 110 miles away and 100 percent for anyone residing
160 or more miles from downtown Louisville. We think these
are very conservative estimates. Combining the estimates of the
percentage of attendees residing at each 10 mile mark between
50 and 300 miles from The Kentucky Center and the estimates
of how many of those people stayed overnight in Louisville gave
us an estimate of the total percentage of out-of-town attendees
who stayed overnight in Louisville. It was roughly 23 percent,
which is in line with two previous studies we were involved in.
One is a visitor satisfaction survey conducted during the winter
2002-2003 Millet to Matisse special exhibition at the Speed
Museum by Horizon Research International, a regional market
research firm, while the other is a visitor survey of the 1997
St. James Court Art Show. It is also similar to the implied hotel
usage rates that can be derived (from the per person spending
patterns and estimates of room rates and persons per room)
from the The Broadway League’s economic impact study of
Touring Broadway.
There is, however, one characteristic of out-of-town
visitors for which it is critical to distinguish between groups and
estimate how many fall in to each of two camps: whether or
not they stayed overnight in Louisville. The reason is because
the spending profiles of the two groups are very different, with
overnight visitors spending much more money in the local
economy than day trippers. To do this we relied largely on the
geographic distribution of ticket holders in ticket database.
With GIS software we calculated the percentage of ticket
holders residing within 50 miles, 100 miles and 300 miles of
The Kentucky Center. We then estimated the percentage of
ticket holders residing at 10 mile increments from 50 miles to
300 miles from downtown Louisville (i.e. the cumulative percent
at 60 miles, 70 miles, 80 miles distant, etc.). We used linear
interpolation between 50 and 100 miles and a simple exponential
decay function between 100 and 300 miles. We stopped at 300
miles under the assumption that no one living beyond 300 miles
from Louisville would be visiting the area with the primary
reason being to attend a KCPA performance event. While there
may indeed be some, their exclusion is likely balanced out by
the inclusion of too many of the attendees residing at the outer
reaches of the 300 radius.
We then assigned an estimate of the percentage of
people residing at each 10 mile increment who stayed overnight
during their visit to attend a KCPA performance event. The

30
Estimating Event Attendee Spending Profiles
Spending profiles for the average overnight visitor
and the average day tripper were derived with the aid of
several studies. We again used information from The
Broadway League’s report on the economic impact on
host cities of the 2008-09 Touring Broadway season, the
Horizon Research survey of visitors to the 2002-03 Millet
to Matisse Speed Museum exhibition, and our surveys from
a study of the 1997 St. James Court Art Show. In addition
we also relied heavily on two other sources which we used
in our 2012 report on the economic impact of tourism on
the Louisville economy for the Louisville Convention and
Visitors Bureau (LCVB). The first is a 2011 visitor survey
study done for the Kentucky Department of Travel and
Tourism by Davidson-Peterson Associates which asked
tourists about their participation in many different types of
activities during their time in the state. The state is divided
into nine regions and we drew on the results that included
Louisville. The second is the 2007 Visitor Report that
Longwoods Travel USA, a leading tourism research firm,
produced for the LCVB. The Longwoods report provides
demographic and activity information broken out by various
leisure and business market segments, and includes visitor
expenditure profiles for overnight and daytrip tourists
under the broad categories of lodging, food and beverage,
Total
Total Performance Attendance 1,079,179
Live Outside of the Louisville Metropolitan Area 30.6%Visited Louisville Specifically to Attend KCPA Event 64.1%
Performance Attendees Relevant to Economic Impact Analysis 212,013
Attendees Who Stayed Overnight in the Metro Area 23.1%
Economic Impact Attendees - Overnight 48,870Economic Impact Attendees - Day Trip 163,143
Attendance Breakdown for Economic ImpactThe Kentucky Center, Fiscal Years 2010-2013
Note: Slightly different percentages of the three variables above were used for the touring Broadway performances. The differences were based on the slightly different geographic distribution of tickets in the database for the non-complementary tickets compared to the entire database. For the touring Broadway performances we used the results from the set of non-complementary tickets, which were a little higher for each variable. We present the weighted average.
The table presents our estimate of the total number of
economic impact relevant attendees who saw performance events at
The Kentucky Center over the four fiscal years, 2010 through 2013. We
estimate that just over 212,000 attendees lived outside of the Louisville
metro area and had come specifically to attend a performance at The
Kentucky Center. Of those, nearly 49,000 stayed overnight in Louisville
while about 163,000 just came in to town for the day. On a recurring
annual basis that is roughly 12,200 overnight visitors to Louisville and
another 40,800 day trippers brought to Louisville by events at The
Kentucky Center. In concrete terms, the overnight visitors probably
account for around 6,500 hotel room-nights per year.

31
transportation (in Louisville), recreation and
entertainment, and retail purchases. The
overnight tourist spending profile is further
broken out by market segment.
The spending profiles used in the
economic impact analysis are shown in
the top half of the next table, along with
estimates of the average annual spending in
those categories by out-of-town performance
attendees using the overnight and daytrip
attendance figures of the previous table.
The lodging estimate assumes a hotel in the
areas closest to The Kentucky Center but at
a price consistent with transient room tax
receipt statistics from the Metro Revenue
Commission. The transportation estimate
accounts for parking garage fees as well
as gas. We assume a meal at a moderately
upscale restaurant since attending KCPA
events is often a special occasion. The
entertainment estimate includes a portion of
the average price of a ticket sold to someone
from outside of the Louisville MSA. We
view ticket revenue for resident company and
Kentucky Center Presents performances as
staying in Louisville to help perpetuate the KCPA, so that fraction of total attendance
is the portion of the non-metro ticket price used. We assume that ticket revenue for
other performances supports touring artists and leaves Louisville. The entertainment
estimate also includes the average per order and per ticket fees each person would pay.
With overnight tourists spending an average of $181 and day trippers $66
during their stays in Louisville, total average annual spending by non-resident attendees
Overnight Tourists Daytrip Tourists
Lodging $60.00 n/a
Transportation $16.99 $10.66Food & Beverage $50.60 $20.00
Retail Purchases $15.57 $5.00Recreation/Entertainment $37.80 $30.80
Total Expenditures $180.96 $66.46
Overnight Tourists Daytrip Tourists All Tourists
Lodging $733,049 n/a $733,049
Transportation $207,578 $434,656 $642,234Food & Beverage $618,205 $815,714 $1,433,919
Retail Purchases $190,165 $203,929 $394,094Recreation/Entertainment $461,821 $1,256,200 $1,718,021
Total Expenditures $2,210,818 $2,710,499 $4,921,317
Per Person Spending Estimates
Estimates of Average Annual Direct Tourist Spending in the Louisville MSAby Non-Resident Attendees of Performance Events at
The Kentucky Center for the Arts, Fiscal Years 2010-2013
Total Tourist Spending
32
a good is imported from beyond the region, then just 75 percent
of the spending to produce the good can be re-spent by local
businesses and residents.
Input-output models work through the repeated rounds
of re-spending until all of the initial direct spending has leaked
out of the system (because good and services have been
purchased from outside the region). The result is an estimate
of how much extra economic activity has been supported by
the initial spending. An economic multiplier is simply the ratio
of the total activity to the initial activity. Multipliers capture the
full range of economic impact: direct effects, indirect effects,
and induced effects. Direct effects are changes that occur as
an immediate result of a change in expenditure. These are
front-end businesses whose facilities directly gain revenue from
additional spending. For tourism, direct effects are associated
with industries such as lodging, entertainment, restaurants,
transportation, and retail.
Indirect effects are the result of changes within industries
that supply goods and services to the businesses that experience
a direct effect. Examples of indirect effects of tourism
include industries such as linen suppliers, bulk food suppliers,
and wholesale retail suppliers. Induced effects are changes in
spending by those households earning income from sectors
directly and indirectly affected by changes in expenditure. For
of The Kentucky Center is estimated to be about $4.9 million.
Overnight visitors account for $2.2 million of that, while day
trippers spend $2.7 million annually on their visits to The Kentucky
Center. Tickets and associated fees make up 86 percent of the
$1.7 million in recreation and entertainment spending. Visiting
patrons of The Kentucky Center spend nearly three-quarters of
a million dollars on area hotels annually, and double that on food
and beverages in local restaurants.
Input-Output Models
These directly spent dollars recirculate many times
through the local economy as they are used to buy goods and
services locally and pay wages. The methodological approach we
use to calculate the result of this further activity is input-output
modeling. An input-output model is a mathematical model that
describes the flow of money between sectors within a region’s
economy. The flow of money is based on the inputs that are
purchased for the production of a good or service. This flow
reveals the money that is spent in many industries in order to
produce a particular good or service. Input-output models also
determine the proportion of sales that go to employee wages,
proprietor‘s income, and government taxes. In addition, they
include the proportion of each input bought locally versus outside
of the region. If 25 percent of the value of the inputs to produce

33
example, this would include employees of hotels
and restaurants whose wages depend on tourism
and whose spending habits change as a result of
changes in tourism.
All input-output models make a number
of simplifying assumptions. Details about these
assumptions can be quite technical, but they
basically assume that all firms in a sector use
the same production technology and there are
no economies or diseconomies of scale. Some
important variables that are not accounted for
in input-output models are changes in price,
quantity or quality of goods and services,
changes in tax structures and tax effects and any
social or environmental impacts associated with
tourism.
Implementing the Economic Impact Model
We use the IMPLAN economic impact
modeling software system to create a custom
input-output model of the Louisville MSA.
IMPLAN uses economic data on the presence
and size of industries at the national, state, and
county level in order to estimate a model of trade flows between counties. The resulting
regional models and industry multipliers take account of the ability of the regional economy
to supply inputs to each of 440 industries (as well as how much must be imported from
elsewhere to support a given level of production).
Expenditure Category IMPLAN Industry Sector
Lodging Hotels and motels, including casino hotelsOther accommodations
Transportation Retail - Gasoline stationsAutomotive equipment rental and leasingTransit and ground passenger transportationOther personal services (parking garages)
Food & Beverage Food services and drinking places
Retail Purchases Retail - Clothing and clothing accessoriesRetail - Sporting goods, hobby, book and musicRetail - General merchandiseRetail - MiscellaneousRetail - Nonstore
Recreation/ Performing arts companiesEntertainment Spectator sports
Promoters of perform. arts & sports and agents for public figuresMuseums, historical sites, zoos, and parksAmusement parks, arcades, and gambling industriesOther amusement and recreation industries
IMPLAN (Impacts for PLANning) software, version 3.1, IMPLAN Group LLC.
IMPLAN Industry Sectors Used to Model Direct Tourist Spending

34
following table. We used the per person spending
profiles for overnight and daytrip tourists as shown in
the table above and applied information from the 2007
Longwoods survey and the 2011 Davidson-Peterson
survey for the state of Kentucky on visitor experiences
and activities to apportion the broad category spending
among the more detailed industries. We then modeled
the impact of a thousand tourists of each type and
scaled up the results to our average annual tourist
estimates (12,217 overnight and 40,786 daytrip).
The results of the model indicate that direct
spending by people from outside of the Louisville metro
area attending performances at The Kentucky Center
supports about 93 jobs in the 12 county Louisville
MSA with a combined payroll of $1.3 million. This
tourism adds $4.4 million dollars of economic activity
to the regional economy. Once we account for the
multiplier effects, the tourist draw of The Kentucky
Center leads to $8.3 million of economic output in the
MSA and supports 125 jobs with an annual payroll of
almost $2.4 million.
School groups also have a small economic
impact, though they do not typically spend much
money on their trips. However, school groups often
Rather than modeling a change to a single industry we are interested
in the impact of repeated spending on a basket of goods across a range
of industries. We have translated the five broad spending categories used
in the spending profiles into 18 IMPLAN industry sectors, as shown in the
Impact Type Employment Output Payroll
Direct Effect 35 $2,001,984 $572,646Indirect Effect 7 $855,838 $234,009Induced Effect 7 $923,143 $232,214
Total Effect 49 $3,780,966 $1,038,869
Direct Effect 58 $2,370,563 $746,187Indirect Effect 8 $977,801 $274,905Induced Effect 9 $1,183,873 $299,152
Total Effect 76 $4,532,236 $1,320,245
Direct Effect 93 $4,372,547 $1,318,833Indirect Effect 15 $1,833,639 $508,914Induced Effect 17 $2,107,016 $531,366
Total Effect 125 $8,313,202 $2,359,113
Average Annual Economic Impact to the Louisville MSADerived From Non-Resident Attendees of Performance Events at
The Kentucky Center for the Arts, Fiscal Years 2010-2013
Source: Customized IMPLAN (IMpacts for PLANing), version 3, model of the Louisville MSA, using 2011 economic data.Note: Indirect impact refers to business-to-business spin-off spending; Induced impact refers to household spending that is a result of increased earnings.
Overnight Tourists
Daytrip Tourists
Total Tourism Impact

35
Impact Type Employment Output Payroll
Direct Effect 3.0 $102,326 $28,033Indirect Effect 0.4 $44,379 $12,942Induced Effect 0.4 $47,059 $11,968
Total Effect 3.8 $193,764 $52,943
Indirect impact refers to business-to-business spin-off spending; Induced impact refers to household spending that is a result of increased earnings.
Average Annual Economic Impact to the Louisville MSADerived From Non-Resident School Groups at
The Kentucky Center for the Arts, Fiscal Years 2010-2013
Total School Group Impact
Source: Customized IMPLAN (IMpacts for PLANing), version 3, model of the Louisville MSA, using 2011 economic data.
stop to have lunch at area fast food restaurants, thereby adding dollars to the
local economy. We assumed a figure of three dollars per head in fast food
spending for out-of-town school groups (children are likely to spend more
per person, but not every group eats at such an establishment). Ticket revenue
from school groups outside of the metropolitan area is new money to the
local economy that helps directly support The Kentucky Center’s resident
companies. The average school group performance ticket price during the four
fiscal years was $7.25. There were on average 9,983 school group attendees
per year from outside of the Louisville MSA in the school group database.
We therefore estimate that annual economic impact relevant spending by
school groups attending KCPA school performances was $72,377 for tickets
and $29,949 for meals. We applied those figures to the IMPLAN sectors for
performing arts companies and food and drinking places and estimated the
model. The results indicate that direct spending by
non-MSA school groups attending performances at
The Kentucky Center supports about 3 jobs in the
Louisville metro area with a combined payroll of
$28,000, and adding $102,000 dollars of economic
activity to the regional economy. Once we account
for the multiplier effects, the school groups activities
of the resident companies leads to almost $200,000
of economic output in the MSA and supports 4
jobs with an annual payroll of about $53,000.
While school groups have an admittedly
small economic impact, touring Broadway shows
and other touring artists have a much bigger effect
on the local economy. Some of the more elaborate
Broadway productions, such as Lion King or
Wicked, bring as many as 120 people with them
(aside from cast members there are stagehands,
musicians, make-up artists, hairdressers, wardrobe
assistants, physical therapists, and maybe even
tutors for child cast members). Louisville has been
averaging about eight-and-a-half weeks of touring
Broadway productions for the past six years. In
addition, the Kentucky Center hosts 40 to 50 touring
artists (musicians or musical groups, dance troupes,
etc.) each year and they all bring more people than

36
just the performers on stage to town. We estimate that this is the equivalent of about another week-and-a-half of Broadway sized
productions. Assuming an average touring Broadway production brings 100 people, ten weeks of hosting such casts and crews means
70 days and 7,000 people-days of spending by out-of-towners in the local economy.
It is very difficult to get a good grasp of any local spending that touring artists may do that is directly associated with putting
on their shows, such as renting equipment or hiring local labor, so we will only estimate the economic impact of spending we can
discuss with some authority, which is the personal spending of cast and crew and local advertising. According to The Broadway
League, a touring production in a city of Louisville’s size spends roughly $140,000 on advertising during a one week run. Our
IMPLAN model therefore includes $1.4 million assigned to the advertising and related services sector.
Impact Type Employment Output Payroll
Direct Effect 18 $2,094,855 $444,257Indirect Effect 6 $741,232 $197,124Induced Effect 6 $815,136 $205,425
Total Effect 30 $3,651,223 $846,806
Source: Customized IMPLAN (IMpacts for PLANing), version 3, model of the Louisville MSA, using 2011 economic data.
Indirect impact refers to business-to-business spin-off spending; Induced impact refers to household spending that is a result of increased earnings.
Note: Impact takes into account personal spending of all performers and other personnel traveling with touring shows, and advertising costs.
Average Annual Economic Impact to the Louisville MSADerived From Touring Broadway and Other Touring Shows at
The Kentucky Center for the Arts, Fiscal Years 2010-2013
Total Touring Shows Impact

37
During the time period of our study the Actors
Equity Union contract per diem rate for touring Broadway
productions was about $120. Company members can spend
this any way they like, but the contract also set an average hotel
room cost (the producers must present two official housing
choices) of about $70 per night. Since the salaries of the
company members are actually quite modest (and their time
is constrained) we assume they are not spending additional
money. We divide the remaining $50 per diem as follows:
$25 spent in area restaurants; $10 spent on groceries; $5 on
incidentals, mostly personal items; and $10 going unspent
and pocketed. On an annual basis that amounts to $490,000
spent in area hotels, $175,000 in restaurants, $70,000 in grocery
stores, and $35,000 in health and personal care retail.
The IMPLAN results estimate that direct spending by
personnel traveling with touring artists who perform at The
Kentucky Center supports about 18 jobs in the 12 county
Louisville MSA with a combined payroll of close to $445,000.
This activity adds $2.1 million dollars to the regional economy.
After the multiplier effects, the touring productions at The
Kentucky Center lead to $3.6 million of economic output in
the MSA and support 30 jobs with an annual payroll of almost
$850,000.

38
Combined Tourist, School Group, and Traveling
Company Economic Impact
Putting all three areas of economic impact together
(non-resident attendees, school groups from beyond the
metro area, and traveling production companies), we estimate
that performance events at The Kentucky Center are annually
responsible for $7.2 million in new direct spending in the
Louisville metropolitan area, supporting 115 jobs in the 12
county Louisville MSA with a combined payroll of $1.8
million. The ongoing local economic output supported is $6.6
million. But after the subsequent rounds of spending and re-
spending of that money by local businesses and households,
the ultimate effect of The Kentucky Center’s fine facilities
being able to host such attractive performance events is $12.2
million of economic output supporting 160 jobs with an
annual payroll of about $3.3 million.
The Tax Impact for Local and State Governments
Tourists pay taxes directly to state and local
governments in the form of transient room taxes, sales
taxes on retail purchases and automobile rental, and gasoline
taxes. Additionally, the people employed in tourism related
industries pay local income and occupational taxes and state
income and sales taxes. These are the largest taxes collected
Impact Type Employment Output Payroll
Direct Effect 115 $6,569,727 $1,791,124Indirect Effect 22 $2,619,251 $718,980Induced Effect 23 $2,969,211 $748,759
Total Effect 160 $12,158,189 $3,258,862
Indirect impact refers to business-to-business spin-off spending; Induced impact refers to household spending that is a result of increased earnings.
Average Annual Economic Impact to the Louisville MSADerived From Performance Events at
The Kentucky Center for the Arts, Fiscal Years 2010-2013
Total Tourist, Touring Shows & School Group Impact
Source: Customized IMPLAN (IMpacts for PLANing), version 3, model of the Louisville MSA, using 2011 economic data.
by state and local governments and for which we can make informed estimates.
Our estimates of the tax revenues generated by tourism activity are summarized
in the next table.
State and local governments benefit from over three-quarters of a
million dollars in tax revenues generated annually by the economic impact of
The Kentucky Center. Of that, the tourists and touring shows themselves pay
$435,000 directly, half in sales taxes and about 40 percent in transient room
taxes when they stay in area hotels, motels, and Bed & Breakfast establishments.
While Jefferson County benefits from about $80,000 in transient room tax
collections, the state of Kentucky gains the lion’s share, with $308,000 in sales
and gasoline tax revenues from tourist and touring show spending each year.
Employees of tourism affected industries, through their income and
household spending, contribute roughly $334,000 annually to state and local

39
governments. About two-thirds of that benefit goes to the state of Kentucky in the form of income and sales taxes. The state of
Indiana collects $61,000 in taxes from its residents’ KCPA tourism related income. Local governments in Jefferson County benefit
from $53,000 in occupational taxes on income directly or indirectly associated with The Kentucky Center’s tourism attraction. Of that,
Jefferson County Public Schools receive about $15,000.
It is important to note that all the economic and fiscal impacts discussed are continual and recurring benefits of The Kentucky
Center’s ability to attract productions and performers that draw visitors from an area ranging from one to five hours drive from
downtown Louisville. The jobs that are supported by the incoming dollars continue from year to year, while the dollars of output,
payroll, and tax revenues recur year after year.
Transient Room Taxes
Retail Sales Taxes Gasoline Taxes Totals
Jefferson County $79,835 $79,835So. Indiana Counties in MSA $6,343 $6,343State of Kentucky $79,941 $196,735 $31,805 $308,482State of Indiana $11,101 $24,609 $5,277 $40,986
Totals $177,220 $221,344 $37,082 $435,647
Local Income/ Occupational
TaxesState Income
TaxesState Sales
Taxes Totals
Jefferson County $53,298 $53,298So. Indiana Counties in MSA $9,803 $9,803State of Kentucky $94,078 $115,160 $209,239State of Indiana $28,968 $32,493 $61,462
Totals $63,101 $123,047 $147,653 $333,801
Derived From Non-Resident Attendees, Touring Shows, and School Groups
Note: The tax figures paid by MSA residents include the indirect and induced economic impacts of the tourism industry in the metro area.
Taxes Paid by Tourists, Touring Shows
Taxes Paid by MSA Residents
at The Kentucky Center for the Arts, Fiscal Years 2010-2013
Estimated Average Annual Tax Revenues

40
Some of the benefits of The Kentucky Center do not
lend themselves to quantification in an economic impact analysis,
but are important to consider in a comprehensive treatment
of KCPA impacts. We cannot know how many residents have
businesses that actively seek out or depend on The Kentucky
Center performance-goers or touring productions and artists for
a significant chunk of their revenues. We also do not know how
many businesses decided on a location in the Louisville region
in part because of the presence of amenities like The Kentucky
Center’s excellent performance venues, resident companies,
and schedule of touring shows and artists. Another important
but difficult to measure impact is how The Kentucky Center
contributes to the economic vitality of downtown Louisville,
though we know that the area is vastly different and better than
it was thirty years ago. Finally, some events have a philanthropic
component that improves the well-being of residents who
benefit from the event.
Ignoring community and social impacts of The
Kentucky Center diminishes the value of an economic analysis.
However, guesses about the value of some impacts are likewise
unacceptable. Perhaps the best alternative is descriptive material
offered in addition to the impact analysis to provide the reader
with a more comprehensive understanding of the full scope
of the benefits of The Kentucky Center to the Louisville and
Kentucky economy.
We conclude this report with a description of benefits
that were not captured by the economic analysis. We begin with
community outreach programs, then discuss advanced student
education programs, and finally programs for educators.
Community Outreach Programs
The Kentucky Center engages the community through
several outreach programs. From children’s programming
to nurturing aspiring artists to bettering the lives of hospital
patients, The Kentucky Center’s outreach efforts add to its
economic impact on the city of Louisville. Many of the benefits
of these programs are hard to capture in a truly economic sense,
but their effects are far-reaching; they contribute to an overall
positive environment, develop community spirit, and support
mental, emotional, and creative health. The programs that bring
these benefits to the community are Arts in Healing, ArtsReach,
and ArtsReach Kentucky.
Arts in Healing
Arts in Healing is a program designed to bring the joy
of the arts to patients healing from whatever ails them, from
substance abuse to movement disorders, from adults suffering
wounds of war to children recovering from physical and
emotional abuse and abandonment, from seniors embracing the
Social and Community Impacts of The Kentucky Center

41
pursuit to bring the arts to people in need. As expected, the
surveys are only completed by willing and able participants, but
are able to provide a picture of the mood and disposition both
pre- and post-program. While this evaluation process includes
the collection and analysis of quantitative and qualitative data,
KCPA does not correlate any of the outcomes with health
diagnoses or prognoses. The incentive for these programs is to
help people living with health conditions and to alleviate stress
for both patients and caregivers, not to seek cures for their
participants. By following national and international research
on the topic of arts in healthcare and arts in healing, KCPA is
equipped with knowledge about the potential positive effects
of such programming. Additionally, they include such research
in many of their foundation applications and reports, setting
an industry standard for responsibility and stewardship. The
budget for this program is $150,000, and the staff consists of
one full-time employee and one intern. The program operates
through the use of 19 contract artists, who put in about 620.5
contact hours per year, at a rate of $65 per contact hour. Most,
if not all, of the artists who participate in Arts in Healing are
residents of the Louisville metro area. Arts in Healing serves
over 17,500 people per year, including over 9,000 patients, over
4,000 staff, and nearly 4,000 caregivers and family members.
end of life to families dealing with homelessness, or patients
undergoing cancer treatment. The Kentucky Center partners
with Kentucky’s vibrant arts scene and Louisville’s renowned
healthcare providers to select professional local artists and
provide them with intensive training from national and regional
trainers. Individually designed programs are developed around
the needs of patients, family and staff of healthcare facilities,
ensuring the most effective and impactful experience for all
participants.
The Arts in Healing programs take place in healthcare
facilities of varying kinds across the city, in an attempt to bring
the arts into the community, as well as to better serve participants,
many of whom are unable to leave their facilities. There are
many benefits to the Arts in Healing program, including creative
self-expression, relief from pain and anxiety, and empowerment
in an environment where patients and families often have little
control. Patients, health workers and caregivers have all praised
the program for providing positive experiences during difficult
times.
The success of the program is measured using a three-
prong evaluation, which involves surveying artists, staff, and
participants. The results from these surveys are evidence of
the unique community in which the programs are provided and
allow KCPA to better facilitate each specific population in their

42
ArtsReach
When The Kentucky Center opened its doors 30
years ago, one of its key missions was to bring the arts to the
community. Not only by providing a home for the performing
arts but also by making the arts accessible to everyone. That
is exactly what ArtsReach does. By serving as a community
connection, ArtsReach is nurturing and developing new,
young, and diverse artists and audiences. ArtsReach is also
dedicated to providing professional development and network
opportunities for local community center staff. In addition to
quarterly meetings, ArtsReach offers an Institute through which
community center staff members immerse themselves in hands-
on art workshops, learn about raising funds for the arts and how
to design and implement art programs.
For 23 years, ArtsReach has collaborated with community
centers and organizations throughout Jefferson County. Since
1991, ArtsReach has engaged youth in community settings
through studio arts instruction in dance, violin, and visual
arts, residencies with renowned artists, affordable tickets to
performances, and the opportunity to perform at The Kentucky
Center at the monthly Open Mic series, and the annual Keepers
of the Dream Celebration of Dr. King’s Vision and Showcase
programs. All of those performance opportunities are produced
in collaboration with River City Drum Corp.
There are several pieces to the ArtsReach program, including:
ArtsReach Studio: This program provides ongoing
arts instruction with professional artists in Suzuki violin, visual
arts and dance. Students receive an average of three hours
of instruction per week and participate in special residency
workshops with guest artists. Participants learn new skills,
expand their horizons and develop a sense of self, well-being
and belonging. Dance and violin students perform in the annual
Keepers of the Dream & ArtsReach Showcase.
Keepers of the Dream, a Community Art Celebration of
Dr. Kings’ Vision: ArtsReach produces Keepers of the Dream in
collaboration with River City Drum Corp and Louisville Metro
Government. The annual celebration features inspirational and
thought provoking performances by ArtsReach Studio students,
and numerous community artists, as well as the presentation of
Louisville Metro’s Dr. Martin Luther King Freedom Award,
which recognizes citizens that have dedicated their lives to
promoting justice, peace, freedom, non-violence, racial equality
and civic activism.
KCard: The Kentucky Center’s KCard gives ArtsReach
Studio students and participating ArtsReach community centers
the chance to experience some of the world’s finest in performing
arts for just $3 per ticket. Nurturing and developing new and

43
young audiences is an important step toward creating a sustainable arts
environment in the community.
Open Mic: This program provides a safe and supportive
environment for young people to express themselves and share their
talents. ArtsReach partners with River City Drum Corp’s Music Production
Mentoring Group to produce the monthly Open Mic series that welcomes
performer of all ages and disciplines.
Arts Reach Far Reaching: This program provides art supplies,
workshops, residencies and subsidized tickets to teens with autism and
youth living in residential treatment facilities. The project is funded by the
Crusade for Children and partners with Dreams with Wings, Alternative
Placement Services, YMCA Safe Place Services, St. Josephs, Uspiritus, and
Maryhurst.
ArtsReach Kentucky: Fully supported by the Kentucky Arts
Council, The Kentucky Center partners with arts and community
organizations in six counties (Boyd, Christian, Fayette, Franklin,
McCracken and Montgomery) to focus on professional development and
grant opportunities.
While the staff consists of just one full-time and one part-time
employee, the budget is nearly $400,000, and ArtsReach and ArtsReach
Far Reaching annually contract with more than forty artists who put in
nearly 1,300 contact hours.
44
Advanced Student Education Programs
Governor’s School for the Arts
A three week residential summer program for the state’s
finest high school artists, The Kentucky Center Governor’s
School for the Arts (GSA), with its faculty of professional
teaching artists, provides high level arts training for over two
hundred students. Starting in 2014, Centre College will be the
host campus of this often life-changing experience. The free
program provides conservatory style instruction in nine art
disciplines, master classes with world-renowned guest artist
faculty, leadership mentoring, community service opportunities
and an inter-disciplinary philosophy that allows for graduates
to be college and career ready. In addition, the GSA summer
college fair hosts 40 plus universities and colleges. GSA has a
full time artist-in-residence who provides leadership training, a
full time counselor, and a counseling support staff person. The
budget for the summer program is nearly $350,000, and served
223 students from 49 Kentucky counties in 2014. The budget
helps support 40 part-time employees as well as contract artists
serving as faculty, counselors, artists-in-residence, and guest
artists.
Prior to the summer program, beginning during
the previous fall two parts of the GSA program are vital to
enhancing its mission of providing a potentially life-changing
arts experience to young artists from all corners of the state. The
first is recruitment initiatives and the second is the ArtShops
program.
There are five recruiters who each fall visit any area of
the state that has not had a student apply and/or attend GSA
for 3 years. Two multi-cultural recruiters work in Fayette and
Jefferson counties with a focus on increasing the diversity of
the student population, and three recruiters work throughout
the eastern, south central and western parts of the state. The
recruitment budget is about $3,500, and 1,144 students were
served last year. Of those, 242 were minority students.
Every fall, GSA holds a one-day ArtShops throughout
the state. They are free outreach sessions that focus on increasing
diversity and participation in GSA’s summer program by
reaching underserved high school students throughout the state.
The day-long sessions allow high school freshmen, sophomores
and juniors to participate in a hands-on arts enrichment
opportunity close to their hometown under the guidance of
professional teaching artists from their region. In addition,
these workshops assist students with preparation for their GSA
audition. ArtShops also include parent/teacher workshops that
discuss the GSA summer program and potential scholarship
opportunities. The budget for ArtShops is about $16,000, which
helps fund the 27 contract artists involved in the program.
Alumni of the Governor’s School for the Arts are
eligible for 24 GSA specific scholarships, invited to attend the
College and Career Day in the fall (where representatives from

45
Teachers attending the Academies for Arts Integration
receive training in understanding relevant Kentucky curriculum
standards, how to integrate creative and performance art
activities and strategies with other subjects, how to properly
assess creative work, how to make collaborative lesson planning
and co-teaching work for the classroom, and what accountability
in this process means. While there is a competitive application
process for attending an Academy, priority is often given to
teams of teachers of different subjects from the same school
attending together.
The Academies are funded by the Kentucky Department
of Education, and it has a budget of $60,000. This helps
supports 3 KCPA staff members as well as 8 trainers.
In addition to helping teachers bring the arts to their
students The Kentucky Center also helps bring practicing artists
into the schools. The Gheens Artist Residency Program helps
make possible community outreach by some of the nationally
recognized artists who perform on The Kentucky Center’s
stages. It facilitates workshops, short performances, talks,
master classes and creative interactions at various locations out
in the Louisville community, including schools, hospitals, and
community centers. It serves well over 6,000 people each year
and eight staff members administer the program.
as many as 80 colleges and universities from across the country
audition and interview graduates), and can apply up to twice a
year for professional development monies through the Toyota
Alumni Fund (which has funded $100,000 worth of projects
over the last ten years, from singing tours of Europe to dance
training at The American Ballet Theatre).
About half of the more than $850,000 total budget
comes from the Kentucky General Assembly, and the remaining
funding necessary to run the program is raised by The Kentucky
Center from a variety of public and private sources. There
are three full-time staff members who work year-round as
administrators.
Teacher Education Programs
The Kentucky Center has a number of teacher training
initiatives that seek to help teachers integrate the arts with other
parts of the school curriculum. Chief among these initiatives is
The Kentucky Center Academies for Arts Integration. These
are five-day teacher professional development seminars that
focus on the arts (two art forms) or arts integration (with such
subjects as World Languages, Social Studies, and Literacy).
They are held at various sites throughout the state, often in the
summer months. Recent and future locations include Bowling
Green, Danville, Frankfort, Murray, and Manchester.

45
Each of the community outreach and education
programs we have highlighted (Arts in Healing, ArtsReach,
Governor’s School for the Arts, Academies for Arts Integration,
and Gheens Artist Residency Program) impacts people from all
regions of the state. Thousands of people each year are enriched
through direct contact with local, regional, and nationally touring
artists. And many more benefit from the valuable training that
KCPA programs provide to teachers and community center
staff from all parts of Kentucky. The Kentucky Center is able to
do all of this with an outreach and education budget of less than
$1.5 million. Though we cannot actually measure them, it seems
safe to say that the benefits of these programs far outweigh the
costs. The Kentucky Center for the Performing Arts has been
and continues to be a wise investment.