an economic assessment of the tariff reform program for...
TRANSCRIPT

An Economic Assessment of the Tariff Reform Program
for the Philippine Fisheries Sector
June 2002
Elizabeth Tan

Table of Contents
I. Introduction II. Objectives III. Trade Policy Reform in the Fisheries Sector
a. The Tariff Reform Program b. Non-Tariff Measures: Import Restrictions and
the Exchange Rate
IV. Trade in the Fisheries Sector a. Import Patterns b. Export Performance
V. Conclusions and Policy Recommendations This report was prepared by Elizabeth Tan under contract from the Sustainability Assessment Project of WWF-Philippines. The author wishes to acknowledge the comments of Jose Padilla, WWF-SEAPP and Mireille Perrin, WWF International and research assistance of Cathy Aragon, WWF-SEAPP. All errors are mine. Please send further comments and or questions to [email protected].

2
I. Introduction Trade policy reform has been pursued by many developing countries since the 1980s as part of their structural adjustment programs: tariffs were reduced substantially, non-tariff barriers relaxed and/or removed, and exchange controls liberalized. The purported economic benefits are higher growth rates, more efficient allocation of resources, reduced monopoly power, increased competition and higher consumer welfare, all generally accepted results of freer trade1. A vast literature over a span of three decades has studied extensively and documented the role of international trade to growth. Countries which pursued outward-oriented trade policy have performed better than those who did otherwise. 2 The more recent changes in global trading conditions in the nineties continue to guide trade policy towards greater regional cooperation through the establishment of free trading areas and engagement in bilateral and multilateral trade negotiations with the aim of establishing and/or gaining greater market access for exports of developing countries, as manifested by the DOHA WTO Ministerial Declaration in November 2001. 3 There is a downside to these developments- externalities, the assessment of which are not usually included in studies mostly focused on economic impacts. These externalities, positive or negative, between trade and environment was recognized in the early 1970s4. The continued and growing interest in the environmental and social impacts of trade policy reforms points to the need for a more comprehensive review trade policy and the use of integrated approaches that go beyond the purview of environmental impact assessments (EIAs) which will enable policy makers to make full assessment of the impact of trade policy on sustainable development. One such approach that has emerged is the use of Sustainability Assessment (SA). The primary aim of SA is to analyze how trade policy in particular and other factors in general contribute to sustainability or unsustainability of the natural resource sector under study. The specific aims of SA are twofold. The first is to identify, qualify and quantify a range of economic and other factors that affect the sector from a sustainable development perspective. The second is to inform decision-makers about the gains and as well as losses due to trade factors, and hence help formulate better trade negotiating positions; and three, to develop and formulate domestic policy recommendations that meet the objectives of trade, economic growth and sustainable development. SAs can also provide avenues for greater transparency in the analysis and development of these positions through the participation and involvement of various stakeholders, such as governments, NGOs, the private sector, the academe, etc.
The study is divided into three main parts. The first introduces trade policy reform
within the context of the overall trade reform in the Philippine economy and discusses trade policies affecting the fishery sector in greater detail. The second analyzes the effects of trade reforms and assess the gains, a brief discussion on export and import trends, and correlation analysis to explore how import trends move with changes in policy variables. . A simpler approach is used for exports: a review of the top ten fishery
1 Krugman, Paul and Maurice Obstfeld. International Economics:Theory and Policy. ( 3rd Edition, 1994) 2 Chapter 5. World Development Report ( World Bank, 1987) . 3 www-scva.wto-ministerial.org 4 Background Document on Trade and Environment , Trade and Environment Division, WTO

3
exports from 1991-2000. The third concludes this preliminary study and suggests policy implications for the fishery sector and areas for further research. II. Objectives This paper provides the trade component on the analysis of trade reform policies which forms part of a bigger study, the SA Project in the Philippines titled “Sustainability Assessment of Trade-Related Policies in the Philippines: Capacity Building at the National Level and Applications to the Fisheries Sector”. It is prepared as an independent report but written with an overall design to be part of the main study. The major objective of the SA Project is to create a constituency for sustainability assessment of trade-related policies in the Philippines. The choice of a fishery sector was the recommendation of a WWF-SEAPP workshop held in 06 April 2001, prompted by an upcoming trade negotiation in the fishery sector in year 2004. The objectives of this paper are: a) to document and analyze trade policy reform in the Fishery sector within the overall
reform process in the Philippines; b) to assess the effects of trade policy reform on the levels of imports and exports by
using simple correlation analysis; c) using results from the correlation analysis combined with additional criteria, identify
or suggest the specific fishery subsector(s) ideal for a case study on SA.
III. Trade Policy Reform in The Fishery Sector A. The Tariff Reform Program In the Philippines, trade reform started in 1981 when the first Tariff Reform Program (TRP) was implemented. It was the first of a series of trade reforms that continued for more than two decades. TRP I covered 80% of all HS lines and was complemented with an The Import Liberalization Program (ILP), removal and or equalization of differential sales taxes and abolition of all taxes on exports except logs. 5 The aim was to bring down very high levels of protection and remove distortions created by the trade regime of the seventies. The ILP was postponed due to the political crisis and the ensuing recession in 1983. Though substantially more difficult to implement, the ILP resumed and gained progress in the years 1986-1989, when it was first made part of the recovery program and rode on the crest of the consumption led- growth of the late eighties.
The nineties was ripe for another round of reform. After one year of negotiations
with the private sector and amidst difficult years 1991-1992, with the economy slowing down, the second TRP was implemented in order to sustain and preserve the gains made in TRP I and the ILP of the mid-eighties. The overall policy direction of Executive Order (EO) 470, issued in July 1991, was to move towards a more neutral tariff policy by reducing the number of commodities with very high tariffs and increase the number of commodity lines with low tariff to achieve rates clustering around 10%, 20% and 30%; tariff reduction was spread over a five- year period, from 1991-1995.
5 HS – Harmonized System , an 8-digit international system of commodity classification for purposes of tariff identification and customs administration.

4
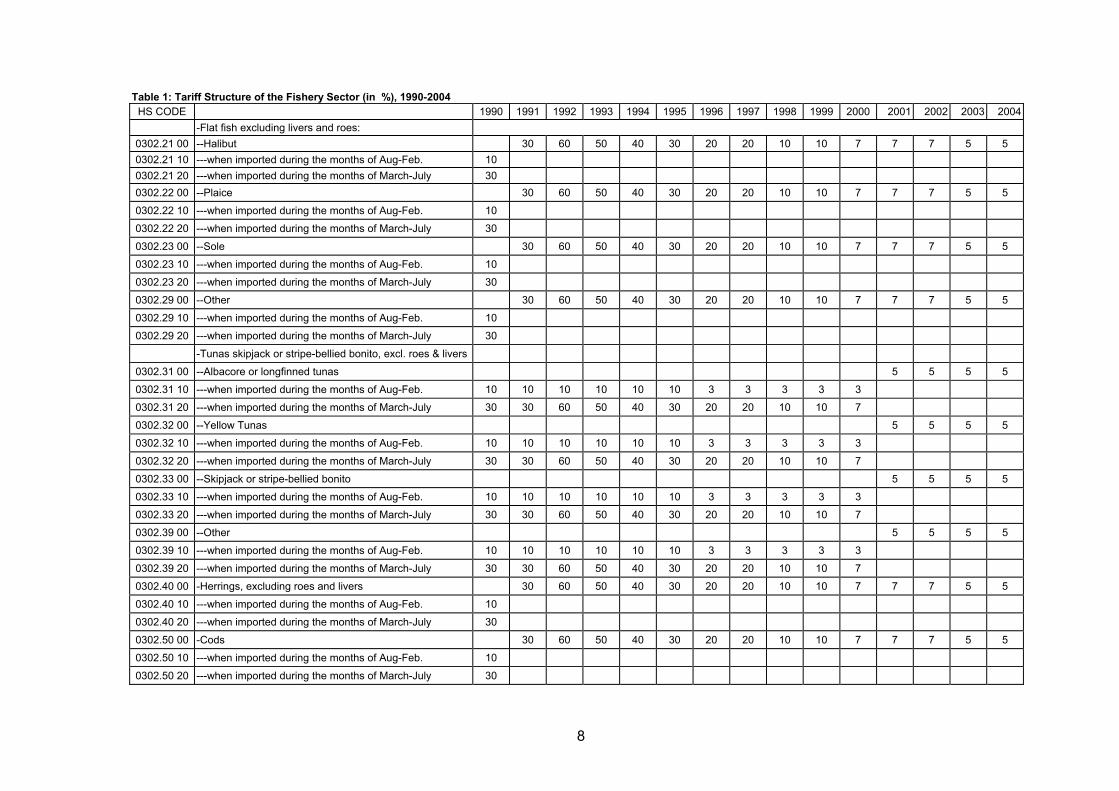
E.O. 470 introduced a major change in the tariff policy in the fishery sector. First, the two-tier 10% and 30% seasonal tariff on all types of fish - live, fresh/chilled, frozen and fish fillet, was replaced by a uniform rate of 30% which was maintained until 1995. However, the two-tier seasonal tariff remained in effect for tunas, sardines and mackerel whether fresh/chilled or frozen. During peak domestic production months of March to July , a 30% tariff was imposed while during the lean months of August to February, a 10% tariff was in place. The rationale behind the off-peak rate of 10% was to allow imports to fill in insufficient domestic supply during lean production months. The additional supply from imports also has the effect of mitigating price increases due lean months. The peak rate, on the other hand, was to protect the local fishery industry.
E.O. 470 did not provide for any tariff reduction for the fishery commodities
mentioned. On the contrary, the removal of seasonal tariffs, was in effect a quasi-increase: the off-peak rate of 10% was unified at 30%. (See Table 1. Tariff Structure for the Philippine Fishery Sector, 1991-2001).
For other fishery commodities, HS lines 03.05 –Dried/Smoked Fish, HS lines
03.06- Crustaceans, HS lines 03.07 – Molluscs, and Prepared/Preserved Fish –16.04, a general and gradual phase down of tariffs from 50%-45%-40%-45%-30% was applied over the period 1991-1995. By 1995, the ceiling rate for the entire fishery sector was 30%, the maximum rate targeted in E.O. 470.
One year after the implementation of E.O. 470 and in anticipation of the lifting of
quantitative restrictions (QRs), E.O. 8, issued in July 1992, provided for the replacement of QRs with its equivalent tariffs. The replacement of QRs with its equivalent tariff has some advantages: one, trade policy becomes more transparent as import licenses, construed as rents, are translated into tariffs; two, it transfers rents from the holders of importation rights to the government in the form of revenues; three, it links domestic prices with world prices such that changes in the latter can be transmitted to domestic economy; four, the cost of administering the licenses is removed.
The conversion of QRs to their equivalent tariffs takes its cue from price
comparison between world and domestic prices. The excess of domestic price over world price for a comparable commodity approximates the protective effect of QRs and hence is converted to an equivalent tariff. The difficulty with this exercise is availability of comparable world and domestic prices. It also assumes that price differentials between domestic and world prices are due to QRs.
The tariff adjustments contained in E.O. 8 produced a ratchet effect: to arrive at
the equivalent tariffs of QRs in 1992 , the general approach then was to double the tariffs in 1991, instead of using price comparisons. The general approach was seen by policy makers as the more efficient way of implementing the conversion as it prevented different interest groups from lobbying for their respective rates. The increase was time-bound for three years , i.e, a gradual phase-down until it reaches its terminal rate in 1995 provided for by EO 470. E.O. 8 provided tariff conversion for 153 HS lines , 59 of which were for the fishery sector.
E.O. 8 affected the seasonal tariffs by changing only the tariff for the peak months of March to July in the same fashion as all other HS lines, a doubling of their rates in 1991 and a gradual phase down from 60% back to 30% from 1992-1995. The off-peak rate though was consistently maintained at 10% for the same period.
For 3.04 ( Fish Fillet), 3.05 ( Dried/Smoked Fish), 3.06 ( Crustaceans), 3.07 (
Molluscs) and 16.04-16.06 ( Prepared/Preserved Fish, Crustaceans/Molluscs), the

5
adjustment was similar: their respective rates in 1992 was double their respective rates in 1991, phased down from 100%-80%-60%-30% in 1995. The strongest ratchet effect was felt in these particular HS lines where peak rates of 100% were provided to some HS lines, a rate primarily targeted for removal by the first TRP in1981. The ceiling rate of 30% was still achieved in 1995, which was the original target of EO 470.
Towards the end of 1994, one year prior to the final year of the second TRP, the Philippine government made as a unilateral commitment to implement a 5% uniform tariff by 2004. There was very little public debate and resistance over the uniform tariff though there were concerns regarding the appropriateness of the 5% rate. A series of global developments such as the creation of the Asia Pacific Economic Cooperation (APEC) in 1989, the creation of the World Trade Organization and Philippine’s signing and membership in the WTO in 1994, new regional trading arrangements such as the NAFTA and the full integration of the European Union into a common market, indicated that the world was working towards greater economic cooperation and moving towards freer trade. These developments, results of numerous years of planning and negotiations both at the political and economic level, were in place and perceived as irreversible: hence, policy reversals in the domestic economy were made more difficult to initiate. Global developments, together with the policy of uniform tariff , set the direction of all future trade reforms, sent clear signals to private sector and gave continuity and credibility and therefore sustained the whole process of trade reform in the Philippines. All future trade reforms were eventually designed within the overall goal of moving towards the 5% uniform rate in 2004.
To achieve the goal of a uniform 5% tariff in 2004, two more rounds of tariff
reforms were implemented from 1996-2001. The statutory rates in 1995 for the entire economy were still around the 10%-30% range with a few around the 50% and 0 (zero). A series of E.O.s were issued to implement the third TRP with an objective of achieving a two-tier structure of 3% and 10% for raw materials and finished products, respectively; moreover, tariffs were to be reduced over the period 1996-2000 by 2003 in preparation for the implementation of the 5% uniform tariff by 2004.
After the TRP I of 1981, tariff reductions in the fishery sector actually started
again in 1996, as provided for in E.O. 288 issued in January 1996 after temporary increases and or quasi-increases in the early nineties. The policy of seasonal tariffs was maintained for tunas, sardines and mackerel but reductions took place within the two–tier tariffs. There was a reduction from 1996 all the way to 2001 and a leveling off of these rates to be maintained at either 3% or 5% and was consistent with the overall policy commitment, via a unilateral move in 1995, to implement a 5% uniform tariff by 2004. All the policy changes from 1996 up to 2004 were all done within this context.
Further adjustments after EO 288 was provided for by EO 465 which reduced
tariff rates further: The most important change was the removal of the two-tier seasonal tariffs for frozen tunas, sardines and mackerel; it was replaced with a flat rate of 5% and to remain at 5% until 2004. The rationale behind the move was apparently driven by environmental factors: the traditional peak and off-peak production period cannot be observed during the months March – June and August-February , respectively anymore; hence, the two-tiered tariffs is redundant. The production cycle has become unpredictable because global warming has affected the time and place fish species spawn.


7
Table 1: Tariff Structure of the Fishery Sector (in %), 1990-2004 1/ HS CODE 1990 1991 1992 1993 1994 1995 1996 1997 1998 1999 2000 2001 2002 2003 2004
03.01 Live Fish 0301.10 00 -Ornamental fish 30 60 50 40 30 3 3 3 3 3 3 3 3 3
0301.10 10 ---when imported during the months of Aug-Feb. 10
0301.10 20 ---when imported during the months of March-July 30
-Other live fish
0301.91 00 --Trout 30 60 50 40 30 3 3 3 3 3 3 3 3 3
0301.91 10 ---when imported during the months of Aug-Feb. 10
0301.91 20 ---when imported during the months of March-July 30
0301.92 00 -- Eels 30 60 50 40 30 3 3 3 3 3 3 3 3 3
0301.92 10 ---when imported during the months of Aug-Feb. 10
0301.92 20 ---when imported during the months of March-July 30
0301.93 00 -- Carp 30 60 50 40 30 3 3 3 3 3 3 3 3 3
0301.93 10 ---when imported during the months of Aug-Feb. 10
0301.93 20 ---when imported during the months of March-July 30
0301.99 00 -- Other 30 60 50 40 30
0301.99 10 ---Milkfish or lapulapu fry 10 3 3 3 3 3 3 3 3 3
0301.99 20 ---Milkfish breeder 30 3 3 3 3 3 3 3 3 3
0301.99 90 ---Other 10 10 10 10 7 7 7 5 5
03.02 Fish, Fresh or chilled
-Salmonidae, excluding livers and roes:
0302.11 00 --Trout 30 60 50 40 30 20 20 10 10 7 5 5 5 5
0302.11 10 ---when imported during the months of Aug-Feb. 10
0302.11 20 ---when imported during the months of March-July 30
0302.12 00 --Pacific,Atlantic, Danube Salmon 30 60 50 40 30 20 20 10 10 7 7 7 5 5
0302.12 10 ---when imported during the months of Aug-Feb. 10
0302.12 20 ---when imported during the months of March-July 30
0302.19 00 --Other 30 60 50 40 30 20 20 10 10 7 7 7 5 5
0302.19 10 ---when imported during the months of Aug-Feb. 10
0302.19 20 ---when imported during the months of March-July 30
1/ Source of Basic data: Tariff Commission and various Executive Orders
8
Table 1: Tariff Structure of the Fishery Sector (in %), 1990-2004
HS CODE 1990 1991 1992 1993 1994 1995 1996 1997 1998 1999 2000 2001 2002 2003 2004 -Flat fish excluding livers and roes:
0302.21 00 --Halibut 30 60 50 40 30 20 20 10 10 7 7 7 5 5 0302.21 10 ---when imported during the months of Aug-Feb. 10 0302.21 20 ---when imported during the months of March-July 30 0302.22 00 --Plaice 30 60 50 40 30 20 20 10 10 7 7 7 5 5 0302.22 10 ---when imported during the months of Aug-Feb. 10 0302.22 20 ---when imported during the months of March-July 30 0302.23 00 --Sole 30 60 50 40 30 20 20 10 10 7 7 7 5 5 0302.23 10 ---when imported during the months of Aug-Feb. 10 0302.23 20 ---when imported during the months of March-July 30 0302.29 00 --Other 30 60 50 40 30 20 20 10 10 7 7 7 5 5 0302.29 10 ---when imported during the months of Aug-Feb. 10 0302.29 20 ---when imported during the months of March-July 30
-Tunas skipjack or stripe-bellied bonito, excl. roes & livers 0302.31 00 --Albacore or longfinned tunas 5 5 5 5 0302.31 10 ---when imported during the months of Aug-Feb. 10 10 10 10 10 10 3 3 3 3 3 0302.31 20 ---when imported during the months of March-July 30 30 60 50 40 30 20 20 10 10 7 0302.32 00 --Yellow Tunas 5 5 5 5 0302.32 10 ---when imported during the months of Aug-Feb. 10 10 10 10 10 10 3 3 3 3 3 0302.32 20 ---when imported during the months of March-July 30 30 60 50 40 30 20 20 10 10 7 0302.33 00 --Skipjack or stripe-bellied bonito 5 5 5 5 0302.33 10 ---when imported during the months of Aug-Feb. 10 10 10 10 10 10 3 3 3 3 3 0302.33 20 ---when imported during the months of March-July 30 30 60 50 40 30 20 20 10 10 7 0302.39 00 --Other 5 5 5 5 0302.39 10 ---when imported during the months of Aug-Feb. 10 10 10 10 10 10 3 3 3 3 3 0302.39 20 ---when imported during the months of March-July 30 30 60 50 40 30 20 20 10 10 7 0302.40 00 -Herrings, excluding roes and livers 30 60 50 40 30 20 20 10 10 7 7 7 5 5 0302.40 10 ---when imported during the months of Aug-Feb. 10 0302.40 20 ---when imported during the months of March-July 30 0302.50 00 -Cods 30 60 50 40 30 20 20 10 10 7 7 7 5 5 0302.50 10 ---when imported during the months of Aug-Feb. 10 0302.50 20 ---when imported during the months of March-July 30

9
Table 1: Tariff Structure of the Fishery Sector (in %), 1990-2004
HS CODE 1990 1991 1992 1993 1994 1995 1996 1997 1998 1999 2000 2001 2002 2003 2004 -Other fish excluding livers and roes
0302.61 00 --Sardines, sardinella, brisling or sprats 5 5 5 5 0302.61 10 ---when imported during the months of Aug-Feb. 10 10 10 10 10 10 3 3 3 3 3 0302.61 20 ---when imported during the months of March-July 30 30 60 50 40 30 20 20 10 10 7 0302.62 00 --Haddock 30 60 50 40 30 20 20 10 10 7 5 5 5 5 0302.62 10 ---when imported during the months of Aug-Feb. 10 0302.62 20 ---when imported during the months of March-July 30 0302.63 00 --Coalfish 30 60 50 40 30 20 20 10 10 7 5 5 5 5 0302.63 10 ---when imported during the months of Aug-Feb. 10 0302.63 20 ---when imported during the months of March-July 30 0302.64 00 --Mackerel 5 5 5 5 0302.64 10 ---when imported during the months of Aug-Feb. 10 10 10 10 10 10 3 3 3 3 3 0302.64 20 ---when imported during the months of March-July 30 30 60 50 40 30 20 20 10 10 7 0302.65 00 --Dogfish and other sharks 30 60 50 40 30 20 20 10 10 7 7 7 5 5 0302.65 10 ---when imported during the months of Aug-Feb. 10 0302.65 20 ---when imported during the months of March-July 30 0302.66 00 --Eels 30 60 50 40 30 20 20 10 10 7 7 7 5 5 0302.66 10 ---when imported during the months of Aug-Feb. 10 0302.66 20 ---when imported during the months of March-July 30 0302.69 00 --Other 30 60 50 40 30 20 20 10 10 7 7 7 5 5 0302.69 10 ---Milkfish 0302.69 11 ---when imported during the months of Aug-Feb. 10 0302.69 12 ---when imported during the months of March-July 30 0302.69 90 ---Other 0302.69 91 ---when imported during the months of Aug-Feb. 10 0302.69 92 ---when imported during the months of March-July 30 0302.70 00 --Livers and Roes 30 30 30 30 30 20 20 10 10 7 7 7 5 5 0302.70 10 ---when imported during the months of Aug-Feb. 10 0302.70 20 ---when imported during the months of March-July 30
3.03 Fish, frozen, exlcuding fish fillets & other fish meat 0303.10 00 -Pacific Salmon 30 30 30 30 30 20 20 10 10 7 7 7 5 5 0303.10 10 ---when imported during the months of Aug-Feb. 10 0303.10 20 ---when imported during the months of March-July 30

10
Table 1: Tariff Structure of the Fishery Sector (in %), 1990-2004
HS CODE 1990 1991 1992 1993 1994 1995 1996 1997 1998 1999 2000 2001 2002 2003 2004 -Other salmonidae, excluding livers and roes:
0303.21 00 --Trout 30 30 30 30 30 20 20 10 10 7 7 7 5 5 0303.21 10 ---when imported during the months of Aug-Feb. 10 0303.21 20 ---when imported during the months of March-July 30 0303.22 00 --Atlantic Salmon and danube Salmon 30 30 30 30 30 20 20 10 10 7 7 7 5 5 0303.22 10 ---when imported during the months of Aug-Feb. 10 0303.22 20 ---when imported during the months of March-July 30 0303.29 00 --Other 30 30 30 30 30 20 20 10 10 7 7 7 5 5 0303.29 10 ---when imported during the months of Aug-Feb. 10 0303.29 20 ---when imported during the months of March-July 30
-Flat fish, excluding livers and roes: 0303.31 00 --Halibut 30 30 30 30 30 20 20 10 10 7 7 7 5 5 0303.31 10 ---when imported during the months of Aug-Feb. 10 0303.31 20 ---when imported during the months of March-July 30 0303.32 00 --Plaice 30 30 30 30 30 20 20 10 10 7 7 7 5 5 0303.32 10 ---when imported during the months of Aug-Feb. 10 0303.32 20 ---when imported during the months of March-July 30 0303.33 00 --Sole 30 30 30 30 30 20 20 10 10 7 7 7 5 5 0303.33 10 ---when imported during the months of Aug-Feb. 10 0303.33 20 ---when imported during the months of March-July 30 0303.39 00 --Other 30 30 30 30 30 20 20 10 10 7 7 7 5 5 0303.39 10 ---when imported during the months of Aug-Feb. 10 0303.39 20 ---when imported during the months of March-July 30
-Tunas skipjack or stripe-bellied bonito, excl. roes & livers 0303.41 00 --Albacore or longfinned tunas 5 5 5 5 0303.41 10 ---when imported during the months of Aug-Feb. 10 10 10 10 10 10 3 3 3 3 3 0303.41 20 ---when imported during the months of March-July 30 30 30 30 30 30 20 20 10 10 7 0303.42 00 --Yellowfin Tunas 5 5 5 5 0303.42 10 ---when imported during the months of Aug-Feb. 10 10 10 10 10 10 3 3 3 3 3 0303.42 20 ---when imported during the months of March-July 30 30 30 30 30 30 20 20 10 10 7 0303.43 00 --Skipjack or stripe-bellied bonito 5 5 5 5 0303.43 10 ---when imported during the months of Aug-Feb. 10 10 10 10 10 10 3 3 3 3 3 0303.43 20 ---when imported during the months of March-July 30 30 30 30 30 30 20 20 10 10 7

11
Table 1: Tariff Structure of the Fishery Sector (in %), 1990-2004
HS CODE 1990 1991 1992 1993 1994 1995 1996 1997 1998 1999 2000 2001 2002 2003 2004 0303.49 00 --Other 5 5 5 5 0303.49 10 ---when imported during the months of Aug-Feb. 10 10 10 10 10 10 3 3 3 3 3 0303.49 20 ---when imported during the months of March-July 30 30 30 30 30 30 20 20 10 10 7 0303.50 00 -Herrings, excluding livers and roes 30 30 30 30 30 20 20 10 10 7 7 7 5 5 0303.50 10 ---when imported during the months of Aug-Feb. 10 0303.50 20 ---when imported during the months of March-July 30 0303.60 00 -Cod, exclduing livers and roes 30 30 30 30 30 20 20 10 10 7 7 7 5 5 0303.60 10 ---when imported during the months of Aug-Feb. 10 0303.60 20 ---when imported during the months of March-July 30
-Other fish excluding livers and roes 0303.71 00 --Sardines 5 5 5 5 0303.71 10 ---when imported during the months of Aug-Feb. 10 10 10 10 10 10 3 3 3 3 3 0303.71 20 ---when imported during the months of March-July 30 30 30 30 30 30 20 20 10 10 7 0303.72 00 --Haddock 30 30 30 30 30 20 20 10 10 7 7 7 5 5 0303.72 10 ---when imported during the months of Aug-Feb. 10 0303.72 20 ---when imported during the months of March-July 30 0303.73 00 --Coalfish 30 30 30 30 30 20 20 10 10 7 7 7 5 5 0303.73 10 ---when imported during the months of Aug-Feb. 10 0303.73 20 ---when imported during the months of March-July 30 0303.74 00 --Mackerel 5 5 5 5 0303.74 10 ---when imported during the months of Aug-Feb. 10 10 10 10 10 10 3 3 3 3 3 0303.74 20 ---when imported during the months of March-July 30 30 30 30 30 30 20 20 10 10 7 0303.75 00 --Dogfish and other sharks 30 30 30 30 30 20 20 10 10 7 7 7 5 5 0303.75 10 ---when imported during the months of Aug-Feb. 10 0303.75 20 ---when imported during the months of March-July 30 0303.76 00 --Eels 30 30 30 30 30 20 20 10 10 7 7 7 5 5 0303.76 10 ---when imported during the months of Aug-Feb. 10 0303.76 20 ---when imported during the months of March-July 30 0303.77 00 --Sea Bass 30 30 30 30 30 20 20 10 10 7 7 7 5 5 0303.77 10 ---when imported during the months of Aug-Feb. 10 0303.77 20 ---when imported during the months of March-July 30 0303.78 00 --Hake 30 30 30 30 30 20 20 10 10 7 7 7 5 5 0303.78 10 ---when imported during the months of Aug-Feb. 10 0303.78 20 ---when imported during the months of March-July 30

12
Table 1: Tariff Structure of the Fishery Sector (in %), 1990-2004 HS CODE 1990 1991 1992 1993 1994 1995 1996 1997 1998 1999 2000 2001 2002 2003 2004
0303.79 00 --Other 30 20 20 10 10 7 7 7 5 5 0303.79 10 ---Milkfish 60 50 40 30 0303.79 11 ---when imported during the months of Aug-Feb. 10 0303.79 12 ---when imported during the months of March-July 30 0303.79 90 ---Other 30 30 30 30 0303.79 91 ---when imported during the months of Aug-Feb. 10 0303.79 92 ---when imported during the months of March-July 30 0303.80 00 -Livers and Roes 30 30 30 30 30 20 20 10 10 7 7 7 5 5 0303.80 10 ---when imported during the months of Aug-Feb. 10 0303.80 20 ---when imported during the months of March-July 30
3.04 Fish Fillet & Other Fish Meat, fresh,chilled or frozen 0304.10 00 -Fresh or chilled 30 20 20 10 10 7 7 7 5 5 0304.10 10 ---Fillet 10 60 50 40 30 0304.10 20 ---Other 30 0304.10 90 ---Other 30 30 30 30 0304.20 00 -Frozen fillets 30 20 20 10 10 7 7 7 5 5 0304.20 10 ---when imported during the months of Aug-Feb. 10 60 50 40 30 0304.20 20 ---when imported during the months of March-July 30 0304.20 90 ---Other 30 30 30 30 0304.90 00 -Other 30 30 30 30 30 20 20 10 10 7 7 7 5 5 0304.90 10 ---when imported during the months of Aug-Feb. 10 0304.90 20 ---when imported during the months of March-July 30
03.05 Fish Dried,salted or in brine;smoked fish, whether or not cooked before or during the smoking process; flours meals and pellets of fish, fit for human consumption
0305.10 00 -Flours,meals and pellets of fish 50 50 45 40 35 30 30 30 20 20 15 15 10 7 5 0305.20 00 -Livers & roes, dried,smoked,salted or in brine 50 50 45 40 35 30 30 30 20 20 15 15 10 7 5 0305.30 00 -Fish fillet dried,salted or in brine not smoked 50 50 45 40 35 30 30 30 20 20 15 15 10 7 5
-Smoked fish, including fillets 0305.41 00 --Pacific, Atlantic,Danube Salmon 50 50 100 80 60 30 30 30 20 20 15 15 10 7 5 0305.42 00 --Herrings 50 50 100 80 60 30 30 30 20 20 15 15 10 7 5

13
Table 1: Tariff Structure of the Fishery Sector (in %), 1990-2004
HS CODE 1990 1991 1992 1993 1994 1995 1996 1997 1998 1999 2000 2001 2002 2003 2004 0305.49 00 --Others 30 30 20 20 15 15 10 7 5 0305.49 10 ---Milkfish 50 50 100 80 60 30 0305.49 90 ---Other 50 50 100 80 60 30
Dried fish, whether or not salted butnot smoked 0305.51 00 --Cod 50 50 100 80 60 30 30 30 20 20 15 15 10 7 5 0305.59 00 --Other 50 50 100 80 60 30 30 30 20 20 15 15 10 7 5
-Fish, salted but not dried or smoked and fish in brine 0305.61 00 --Herrings 50 50 100 80 60 30 30 30 20 20 15 15 10 7 5 0305.62 00 --Cod 50 50 100 80 60 30 30 30 20 20 15 15 10 7 5 0305.63 00 --Anchovies 50 50 100 80 60 30 30 30 20 20 15 15 10 7 5 0305.69 00 --Other 50 50 100 80 60 30 30 30 20 20 15 15 10 7 5
03.06 Crustaceans, whether in shell or not, live, fresh, chilled, frozen, dried, salted or in brine; crustaceans in shell cooked by steaming or by boiling in water, whether or not chilled, frozen, dried, salted or in brine; flours, meals and pellets of crustaceans, fit for human consumption -Frozen
0306.11 00 --Rock lobster and other sea crawfish 50 50 100 80 60 30 20 20 10 10 7 7 7 5 5 0306.12 00 --Lobster 50 50 100 80 60 30 20 20 10 10 7 7 7 5 5 0306.13 00 --Shrimps and prawns 50 50 100 80 60 30 30 30 20 20 15 15 10 7 5 0306.14 00 --Crabs 50 50 100 80 60 30 30 30 20 20 15 15 10 7 5 0306.19 00 --Others, incl. flours,meals, & pellets of crustaceans, fit 50 50 100 80 60 30 30 30 20 20 15 15 10 7 5
for human consumption -Not frozen
0306.21 00 --Rock Lobster & other sea crawfish 50 50 100 80 60 30 20 20 10 10 7 7 5 5 5 0306.22 00 --Lobster 50 50 100 80 60 30 20 20 10 10 7 7 7 5 5 0306.23 00 --Shrimps and prawns 50 50 100 80 60 30 30 30 20 20 15 15 10 7 5 0306.24 00 --Crabs 50 50 100 80 60 30 30 30 20 20 15 15 10 7 5 0306.29 00 --Others, incl. flours,meals, & pellets of crustaceans, 50 50 100 80 60 30 30 30 20 20 15 5 5 5 5
fit for human consumption

14
Table 1: Tariff Structure of the Fishery Sector (in %), 1990-2004
HS CODE 1990 1991 1992 1993 1994 1995 1996 1997 1998 1999 2000 2001 2002 2003 2004 03.07 Molluscs, whether in shell or not, live, fresh, chilled
frozen,dried, salted or in brine; aquatic invertebrates other than crustaceans and molluscs, live, fresh, chilled,frozen, dried ,salted or in brine; flours ,meals and pellets of aquatic invertebrates other than crustaceans, fit for human consumption
0307.10 00 -Oysters 50 50 100 80 60 30 30 30 20 20 15 15 10 7 5 -Scallops, including queen scallops
0307.21 00 --Live, fresh or chilled 50 50 100 80 60 30 30 30 20 20 15 15 10 7 5 0307.29 00 --Other 50 50 100 80 60 30 30 30 20 20 15 15 10 7 5
-Mussels 0307.31 00 --Live,fresh or chilled 50 50 100 80 60 30 30 30 20 20 15 15 10 7 5 0307.39 00 --Other 50 50 100 80 60 30 30 30 20 20 15 15 10 7 5
-Cuttle fish 0307.41 00 --Live,fresh or chilled 50 50 100 80 60 30 20 10 10 3 3 3 3 3 3 0307.49 00 --Other 50 50 100 80 60 30 20 10 10 3 3 3 3 3 3
-Octopus 0307.51 00 --Live,fresh or chilled 50 50 100 80 60 30 20 10 10 3 3 3 3 3 3 0307.59 00 --Other 50 50 100 80 60 30 20 10 10 3 3 3 3 3 3 0307.60 00 -Snails, other than sea snails 50 50 45 40 35 30 30 30 20 20 15 15 10 7 5
-Other incl flours, meals and pellets of aquatic invertebrates
other than crustaceans, fit for human consumption 0307.91 00 --Live,fresh or chilled 50 50 100 80 60 30 30 30 20 20 15 15 10 7 5 0307.99 00 --Other 50 50 100 80 60 30 30 30 20 20 15 15 10 7 5
16.03 Prepared or preserved fish; caviar and caviar substitutes prepared from fish eggs. -'Fish, whole or pieces, but not minced:
1604.11 00 --Salmon 50 50 30 30 20 20 15 15 10 7 5 1604.11 10 ---In aritight containers 100 80 60 30 1604.11 90 ---Other 45 40 35 30

15
Table 1: Tariff Structure of the Fishery Sector (in %), 1990-2004
HS CODE 1990 1991 1992 1993 1994 1995 1996 1997 1998 1999 2000 2001 2002 2003 2004 1604.12 00 --Herring 50 50 30 30 20 20 15 15 10 7 5 1604.12 10 ---In aritight containers 100 80 60 30 1604.12 90 ---Other 45 40 35 30 1604.13 00 --Sardines, sardinella and brisling or sprats 30 30 30 30 30 30 30 20 20 15 15 10 7 5 1604.13 10 ---Sardines 30 1604.13 20 ---Sardinella and brisling or sprats 50 1604.14 00 --Tunas,Skipjack & Atlantic Bonito 30 30 30 30 30 30 30 20 20 15 15 10 7 5 1604.14 10 ---Tuna 30 1604.14 20 ---Skipjack and Atlandtic bonito 50 1604.15 00 --Mackerel 30 30 30 30 30 30 30 30 20 20 15 15 10 7 5 1604.16 00 --Anchovies 50 50 45 40 35 30 30 20 20 15 15 15 10 7 5 1604.19 00 --Other 50 50 30 30 20 20 15 15 10 7 5 1604.19 10 ---Milkfish in airtight containers 100 80 60 30 1604.19 90 ---Other 45 40 35 30 1604.20 00 -Other prepared or preserved fish 50 50 45 40 35 30 30 20 20 20 15 15 10 7 5 1604.30 00 -Caviar and caviar substitutes 50 50 45 40 35 30 30 20 20 15 15 15 10 7 5
16.05 Crustaceans, molluscs and other aquatic invertebrates, prepared or preserved.
1605.10 00 -Crab 50 50 45 40 35 30 30 20 20 15 15 15 10 7 5 1605.20 00 -Shrimps and prawns 50 50 30 30 20 20 15 15 10 7 5 1605.20 10 ---In aritight containers 100 80 60 30 1605.20 90 ---Other 45 40 35 30 1605.30 00 -Lobster 50 50 45 40 35 30 30 20 20 15 15 15 10 7 5 1605.40 00 -Other Crustaceans 50 50 45 40 35 30 30 20 20 15 15 15 10 7 5 1605.90 00 -Other 50 45 40 35 30 30 20 20 15 15 15 10 7 5 1605.90 10 ---Squid or cuttle fish 20 1605.90 90 ---Other 50

16
The four phases of the TRP for the Philippine fishery sector are provided in Table 2 which shows the overall progress. One, a reduction of overall tariffs, as shown by a decreasing average tariff from 29.1% in 1990 to 4.8% by 2004. Two, a narrowing of the tariff range from 10%-30%-50% in 1990 to about 10%-30% in 1995, with some adjustments in the years 1991-1994 due to removal of QRs and their conversion to their respective tariff equivalent; the changes in 1996 have actually increased the tariff ranges by adding 2 tariffs levels- 3% and 20%; in 2000, the tariff range is 3%-7%-15% , a substantially improvement from 1995 and the tariff range will be a two tier 3%-5% by 2004.
Table 2. Frequency Distribution of Tariff Rates of the Fishery Sector, 1990-2004 Rates 1990 1991 1992 1993 1994 1995 1996 1997 1998 1999 2000 2001 2002 2003 2004
3 18 18 18 22 22 10 10 10 105 16 17 54 937 53 38 37
10 55 12 12 12 12 12 1 5 57 53 15 6 40 39 39 39 20 1 56 59 40 34 30 58 56 31 31 31 109 40 33 35 15 40 15 28 45 15 50 48 46 28 60 28 35 80 35
100 35 Total 162 114 121 121 121 121 115 115 115 115 115 103 103 103 103Ave. 1/ 29.1 53.6 57.1 48.3 39.6 28.0 20.7 19.8 12.4 11.9 9.0 9.3 9.3 8.6 4.8
Source: Table 1
B. Non-tariff measures: Quantitative Restrictions and the Exchange Rate An equally important development was the lifting of quantitative restrictions
(QRs). The first major implementation was in 1986: QRs on 35 fishery commodities by PSCC 6 were lifted; by 1991, QRs on 33 PSCC lines remain. The easiest way to see what these commodities were would be to look at their tariffs in 1992: if their rates in 1992 are double their rates in 1991, QRs on these commodities were lifted. Automatic import licensing, mainly to safeguard public health, safety, security , welfare and to meet international treaty organizations remains as a policy and is generally considered as a technical barrier to trade.
Trade reform would have been incomplete if parallel moves to liberalize the
foreign exchange market did not take place. Relaxing foreign exchange controls is consistent with the lifting of QRs and the overall goal of achieving policy transparency. Exchange controls were not lifted in the early eighties because it was inconsistent with the existing stabilization program; another factor was the Philippines has had a long history of inflation due to devaluation and hence the obvious aversion. Nevertheless, the inflation stemming from devaluation was due to the peso being overvalued for a long time; huge discrete adjustments were made usually in response to a balance of payments crisis.
6 Philippine Standard Commodity Classification (PSCC)
17
A partial lifting was effected in January 1992 where most controls on trade and non-trade transactions were lifted, in effect removing the requirement of a Central Bank permit and or allocation to buy or sell foreign exchange. The most significant provision was allowing exporters 100% of foreign exchange retention and the complete free use of export proceeds. Towards the end of 1992, the capital account in the balance of payments was also liberalized: it allowed the free entry and exit of foreign portfolio funds.
Post June 1997, there was a complete rethinking in many Asian countries of
allowing free entry and exit of short term foreign portfolio funds as these contributed to the volatility of the exchange rate, i.e., reimposing exchange controls. The general rule was if portfolio funds are permanent, i.e., some measure indicating that if funds remain anywhere from three months to one year, it can be considered permanent and hence would be exempt from taxation.
One of the effects of lifting exchange control and liberalizing the foreign
exchange market is that it changes relative prices between one, the tradable sector and the non-tradable sector; two, relative prices within the tradable sector, i.e., importables will become more expensive relative to exportable. The second effect is of direct interest and importance to this study because changes in relative prices affect not only resource allocation but also resource depletion and or management of fishing stocks. This also has implications on the effectiveness of using trade policy as a policy option in addressing environmental problems.
The expectations that lifting exchange controls would lead to huge currency
devaluations which in turn which create inflationary pressures did not materialize in 1992 or in the ensuing years; in fact what actually happened was the peso appreciated, in nominal and real terms, while inflation was moderate. See Table 3. There are a number of reasons for the nominal appreciation: one, the weak demand for US dollars because of an economic slowdown in 1992; two, a surge in the inflow of foreign portfolio investments due to interest rate arbitrage and the bull run in the stock market in early to mid-nineties. The inflationary pressures stemming from lifting of exchange controls did not happen since the economy slowed down in 1992 and aggregate demand was weak. Another major factor was that the nominal currency appreciation reversed inflationary expectations and contributed to the lowering of domestic prices.
Table 3 shows that after the lifting of exchange controls in 1992, the peso
appreciated in nominal terms in 1992, 1994 and 1995 and in 1999 when the competitive Asian devaluation tapered off ; the only year that the peso depreciated in nominal terms was in 1993- by about 6.3%. The huge depreciation in 1997 and 1998 were due to the Asian Financial Crisis and not directly from the lifting of exchange controls.
Currency depreciation alters prices between tradables and non-tradables and
within tradables too. But currency depreciation or appreciation is also directly linked to changes in domestic prices levels. To see the final effect, currency depreciation or appreciation should be measured in real terms. Assuming constant inflation rates and no major currency revaluation in the countries’ major trading partners, real depreciation can be attributed to the nominal depreciation and domestic inflation. If the rate of nominal depreciation and inflation rate are equal, then the nominal exchange rate is equal to the real exchange rate. A currency depreciates in real terms only if the rate of nominal depreciation is greater than domestic inflation; if domestic inflation rate is greater than the rate of nominal depreciation, the currency then appreciates in real terms.

18
Table 3 Exchange Rates and Inflation Rates, 1990-2000 Nominal Rate of Inflation Rate of Exchange depreciation depreciation Rate (nominal) (real)
1990 24.3 8.5 13.2 -4.71991 27.5 13.2 18.5 -5.31992 25.5 -7.3 8.6 -15.81993 27.1 6.3 7.0 -0.71994 26.4 -2.6 8.3 -10.91995 25.7 -2.7 8.0 -10.71996 26.2 1.9 9.1 -7.11997 29.5 12.6 5.9 6.71998 40.9 38.6 9.7 28.91999 39.1 -4.4 6.7 -11.12000 44.2 13.0 4.4 8.7
Source of basic data: ADB Key Indicators, 2000
The peso appreciated in real terms from 1992 until 1997 rather than depreciated
and was mainly brought about by a nominal appreciation combined with positive inflation rates. The real appreciation of the peso from 1992-1996 altered relative prices in favor of non-tradables over tradables. The export sector suffered while the non-tradable sector, notably construction and real estate, experienced a mild boom. Within the tradable sector, importables became cheaper relative to exportables. A real depreciation of the peso occurred only post June 1997 via a nominal depreciation couple with single-digit inflation rates. By then, the Asian Financial Crisis has triggered competitive devaluations.
To view the overall gains from trade reform, one has to view protection as
relative. When an activity/sector is protected, it is always at the expense of another activity or sector. The simplest way to view this is using nominal tariffs. If tariffs are positive, and there are no export subsidies, there is an implicit export tax equivalent to the nominal tariff. This implicit tax is manifested in two ways: one, higher costs of imported raw materials; two, tariffs create trade distortions which causes the domestic currency to appreciate which penalizes exports. A 5% percent tariff on imports together with a 5% subsidy on exports amounts to the same protection as a 5% depreciation of the currency. In general and assuming there are no export subsidies to the fishery sector, there was an implicit export tax of about 9% on the entire fishery export sector in 2000. See Table 2. This would be most relevant to the fishing export sector which uses importables as raw materials.
In the foreign exchange market, there are generally two sources of distortion. One,
is trade distortions: the demand for imports, hence the demand for foreign currency, is suppressed by high tariffs and or QRs; two, the supply of exports , and hence the supply of foreign currency is distorted by exports taxes and foreign exchange controls. Two, balance of payments disequilibrium (BOP) where unsustainable foreign borrowing or foreign exchange rationing is used to defend the official exchange rate. These two distortions create a difference between the official exchange rate and the shadow exchange rate. 7
7 If there are no trade distortions and the foreign exchange market is not regulated, the official rate and the market rate would be the same. In the presence of distortions, the true economic price is termed shadow price.

19
Average tariffs in 2000 were low- around 8% for entire economy; most QRs have been lifted and the remaining restrictions are largely in the agricultural sector. Therefore, most of the trade distortion effects on the exchange rate have been greatly reduced and will be even lower by year 2004.
IV. Trade in Fisheries Sector The Project commissioned the National Statistics Office (NSO) to provide monthly data on fishery imports and exports from 1991-2001 using the Harmonized Coding System (HS). The fishery sector is defined to be inclusive of all HS lines in Chapter 3 of the Tariff and Customs Code (TCC) and two sections of Chapter 16, 16.03 and 16.04. Nevertheless, only chapter 3 contains unprocessed ( HS 03.02, 03.03) and slightly processed ( 03.05, 03.06) fishery products and are the focus of this study due to their direct connection to environmental issues, such as overfishing, habitat conversion, different production methods/use and choice of inputs, etc. The codes of about 200 HS lines were provided to NSO on a year to year basis and were used for the special runs and in matching the correlation with the primary coding system of NSO, the Philippine Standard Commodity Classification Code (PSCC). This was necessary as there were numerous changes in the HS over the nineties, partly reflecting changes in tariff policy ,as in simplifying the tariff structure and nomenclature system; in addition, the PSCC underwent two major revisions too, one in 1992 and another in 1998. These changes in the two major coding system also made it difficult in many instances to track the data of certain specific commodities for a consistent time period to make useful analysis. a. Imports: 1991- 2001 All types of fish and fish products were freely importable, i.e., QRs were lifted, by 1992, and together with liberalization of foreign exchange in the same year, trade in the fishery sector became more transparent and moved towards freer trade.
A cursory look at import trends from 1991-2001 in Table 4 shows that for many fish species there were actually no imports from 1991-1995, except for Salmon. This is easily attributed to a combination of QRs that existed until late 1992 and the prohibitive tariffs conferred by E.O. 8. By 1993, the prohibitive, if not high tariffs in place due to E.O. 8 were still in effect. By 1995, tariffs on all fish products was still 30%, coupled with the real appreciation of the peso, minimal imports of fish species such as Salmon, Trout, some specie of flat fish, herring and cod .
The most important imports in terms of their ranking in total fishery imports are
shown in Table 5. Tuna, sardines and mackerel were consistently the top three imports since 1991 though ranking was not consistent for a single product. These imports are used mainly as raw materials in the fish canning industry. To find out whether fishery imports are influenced by policy variables, the tariff and the exchange rate, a single correlation analysis was done for all HS lines were possible. Monthly imports in volume, net Kg. were used and correlated with monthly nominal tariffs and monthly average e exchange rate. The results of the correlation analysis (CA) are shown in Table 6. Table 6 uses all monthly observations from 1991-May 2001, inclusive of all zero levels of imports. The results from Table 6 show that the all correlation coefficient were below 0.5. The highest correlation coefficient with the correct sign was observed for frozen pacific salmon and frozen mackerel, around –0.40.

20
Table 4. Annual Imports by Volume (in Metric tons ) , 1991-2000 HS Code Description 1991 1992 1993 1994 1995 1996 1997 1998 1999 2000
03.01 Live Fish 03.01 99 00 --Other 89.9 .03.01 99 20 ---Milkfish Breeder 196.1
03.02 Fish, Fresh or chilled - Other salmonidae,excl livers/roes:
0302.12 00 -- Pacific, Atlantic,Danube Salmon 25.7 14.5 31.4 2.3 4.6 0302.64 00 --Mackerel 285.7 3.0 30.5 236.2 124.5
03.03 Fish, frozen, excl. fish fillets & other fish meat 0303.10 00 -Pacific Salmon:Frozen 106.6 505.0 266.4 386.0 356.9 373.0
- Other salmonidae,excl livers/roes: 0303.21 00 -- Trout 6.1 14.9 15.6 14.8 43.9 4.0 0303.22 00 -- Atlantic/Danube Salmon 1.0 9.7 20.7 0303.29 00 --Other 143.3 438.4 98.4 167.5 148.4 462.1
-Flat Fish, excluding livers and roes 0303. 31 00 --Halibut 0.5 5.8 1.1 1.5 0303. 33 00 --Sole 0.2 3.4 3.8 4.6 0.5 0.2 0303. 39 00 --Other 0.9 5.2 3.6 0.5 39.2 6.8
-Tunas skipjack or stripe-bellied bonito,excl. roes and livers 0303. 41 00 --Albacore or longfinned tunas 15.5 49.5 319.0 24.5 0.6 0303. 42 00 --Yellow-fin Tuna 1175.7 4363.6 241.5 3225.8 133.1 130.2 3996.3 7058.1 5072.9 49.6 0303. 43 00 --Skipjack or stripe-bellied bonito 13496.3 12463.2 3214.8 3160.0 2254.0 13854.1 47557.6 47909.3 47693.0 31169.1 0303. 49 00 --Other 26635.4 39271.5 33983.1 29491.7 40762.2 35624.8 2217.8 14929.0 4471.0 2809.4 0303 50 00 -Herrings 17.3 0.1 317.1 29.2 120.2 12.0 0303.60.00 -Cod 34.0 120.1 405.6 148.1 95.7 50.8
-Other fish excluding livers and roes 0303 71 00 --Sardines 91431.4 53946.8 27322.1 25254.7 14545.5 6247.6 9137.2 3347.2 38318.3 47545.5 0303 74 00 --Mackerel 12255.9 28470.5 50453.2 56769.0 49249.1 98439.0 94293.8 41147.9 60980.4 44419.9 0303 76 00 --Eels 7.4 0.7 2.6 7.1 5.2 0303.77 00 --Sea Bass 0.8 7.6 19.2
03.05 Fish Dried,salted or in brine, smoked fish,whether or not cooked before or during the smoking process; flours meals and pelles of fish, fit for human consumption
0305 41 00 --Pacific, Atlantic,Danube Salmon 1.5 2.9 7.1 5.5 6.6 10.3 21.0 29.2 8.7 12.5 03.06 Crustaceans, whether in shell or not, live, fresh, chilled,
frozen, dried, salted or in brine; crustaceans in shell cooked by steaming or by boiling in water, whether or not chilled, frozen, dried, salted or in brine; flours, meals and pellets of crustaceans, fit for human consumption -Frozen
0306.12 00 --Lobster 0.7 1.2 8.8 5.2 3.6 2.6 0.0 0.3 2.0 5.3 0306.13 00 - - Shrimps and prawns 7.9 25.6 37.7 3.3 37.9 9.8 19.7 19.5 23.2 6.2 0306.14 00 --Crabs 0.1 0.2 8.5 24.6 0.4 14.2 16.8 13.9 100.6 17.9
-Not Frozen 03.06.23 00 - - Shrimps and prawns 0.5 1.1 47.2 13.8 12.3 1.2 3.7
Source of database: National Statistics Office

21
Table 5. Top Ten Imports ( in % of total imports) 1/ 1999 1998 1997 1996 1995 1994 1993 1992 1991
03037100 Sardines ( Frozen) 22.3 2.8 5.4 3.9 12.7 20.5 22.9 38.4 62.403037400 Mackerel (Frozen) 35.5 34.2 55.6 61.3 43.0 46.1 42.3 20.3 8.403034300 Skipjack or stripe-bellied bonito (frozen) 27.7 39.8 28.1 8.6 2.0 2.6 2.7 8.9 9.2
- Cuttlefish 03074900 - - Other ( not fresh/chilled/frozen) 6.6 2.8 4.8 2.8 3.7 3.6 2.8 1.1
- Other fish excluding livers and roes 03037900 Other fish (frozen) - - - - - 0.1 - 03034900 Other Tunas (frozen) 2.6 12.4 1.3 22.2 35.6 23.9 28.5 27.9 18.203049000 Other fish fillet 0.6 0.6 0.2 0.1 - - - 03023300 Skipjack or stripe-bellied bonito
(fresh./chilled) - - - - - - - - 0.7
03031000 Pacific Salmon 0.2 0.3 - - - - 16059000 Other crustaceans 0.2 0.7 - 1.1 - - - -
Total Fishery Imports ( in tons) 172 120 169 161 114 123 119 141 147
1/ Ranked by its share in total annual Fishery Imports. Please refer to Table 1 for HS nomenclature.
With respect to the nominal monthly exchange rate, the CA showed that imports did not move significantly as expected, i.e., in the opposite direction. The highest correlation coefficient of -.56 was observed for Skipjack (HS 3.0343).
The exchange rate is part of the cost of importing a good but, unlike the tariff, the information is known ex post. The period with which to search for information occurs with a lag; on the contrary, the information on the tariff is available ex ante. Therefore, it would be instructive to test the correlation between monthly imports and the lagged exchange rate: imports for the current month would depend on expectations on the exchange rate; since the current information is not known yet, present decision is formed based on observations on the exchange rates in the previous periods; whether it occurs with one month or two month lag is an empirical problem. This hypothesis forms the basis for performing CA between monthly imports and a three and six-month month lag. The results are incorporated in Table 6 for comparative purposes. The correlation coefficients improved as the lag becomes longer for a few commodities, i.e., (0302.12 00) Fresh/Chilled Pacific,Atlantic,Danube Salmon, (0303.33 00) Frozen Sole, (0303.7400) Frozen Mackerel and (0306.1300/0306.2300) Shrimp and prawns, frozen and not frozen; however, the correlations were still weak, as the coefficients hovered around –0.20 or lower. To improve the analysis on policy variables, additional tests were done between the exchange rate and imports using annual data and CA was performed for both tariffs and the exchange rate. The results are shown in Table 7. The correlation coefficients improved for both variables but the improvement was more substantial in the case of tariffs. In the case of tariffs, the improvement was in terms of higher coefficients and getting the correct sign and can be observed for almost all commodities. Correlation coefficients as high as -.90 for frozen livers and roes, -0.85 for frozen Skipjack, and -0.83 for frozen Pacific Salmon can be cited as cases where annual tariffs are highly correlated with annual imports in real terms. There was no improvement though in one of the top imports, sardines while the coefficient was slightly lower for frozen mackerel. The improvement in using annual average exchange rate was much less, i.e., the improvements in the coefficients were not as large as the ones observed for results using annual tariffs. There was only one exception, -0.79 for other frozen tuna.

22
Table 6. Results of Correlation Analysis Using Montly Data HS Description t ER ER t-3 ER t-6
03.01 Live Fish 03.01 99 00 --Other
---Milkfish Fry/ Breeder -0.24 0.54 0.53 0.4903.02 Fish, Fresh or chilled
- Other salmonidae,excl livers/roes: 0302.12 00 -- Pacific, Atlantic,Danube Salmon -0.06 -0.11 -0.18 -0.200302.64 00 --Mackerel -0.07 -0.12 -0.12 -0.11
03.03 Fish, frozen, excl. fish fillets & other fish meat 0303.10 00 -Pacific Salmon:Frozen -0.42 0.29 0.27 0.27
- Other salmonidae,excl livers/roes: 0303.21 00 -- Trout -0.24 0.15 0.20 0.200303.22 00 -- Atlantic/Danube Salmon -0.24 0.31 0.35 0.320303.29 00 --Other -0.19 0.15 0.12 0.11
-Flat Fish, excluding livers and roes 0303. 31 00 --Halibut -0.07 0.00 -0.01 -0.010303. 33 00 --Sole -0.05 -0.08 -0.14 -0.140303. 39 00 --Other -0.28 0.27 0.27 0.29
-Tunas skipjack or stripe-bellied bonito,excl. roes and livers 0303. 41 00 --Albacore or longfinned tunas -0.10 0.20 0.13 0.160303. 42 00 --Yellow-fin Tuna 0.05 0.04 0.06 0.060303. 43 00 --Skipjack or stripe-bellied bonito 0.15 -0.56 0.30 0.320303. 49 00 --Other 0.24 -0.48 -0.48 -0.450303 50 00 -Herrings -0.08 0.04 -0.02 -0.020303.60.00 -Cod -0.14 0.04 0.01 -0.01
-Other fish excluding livers and roes 0303 71 00 --Sardines -0.03 -0.06 -0.04 0.000303 74 00 --Mackerel -0.41 -0.14 -0.16 -0.180303 76 00 --Eels -0.23 0.17 0.16 0.160303.77 00 --Sea Bass -0.27 0.30 0.25 0.25 0303.80 00 -Livers and Roes -0.30 0.25 0.20 0.21
03.05 Fish Dried,salted or in brine, smoked fish,whether or not cooked before or during the smoking process; flours meals and pellets of fish, fit for human consumption
0305 41 00 --Pacific, Atlantic,Danube Salmon -0.23 0.30 0.27 0.2003.06 Crustaceans, whether in shell or not, live, fresh, chilled,
frozen, dried, salted or in brine; crustaceans in shell cooked by steaming or by boiling in water, whether or not chilled, frozen, dried, salted or in brine; flours, meals and pellets of crustaceans, fit for human consumption -Frozen
0306.12 00 --Lobster 0.10 0.11 0.10 0.070306.13 00 - - Shrimps and prawns 0.08 -0.08 -0.12 -0.120306.14 00 --Crabs -0.25 0.23 0.21 0.24
-Not Frozen 03.06.23 00 - - Shrimps and prawns 0.36 -0.15 -0.16 -0.19
t- monthly tariff ER - average monthly exchange rate ER t-3 - average monthly exchange rate ( lagged by three months) ER t-6 - average monthly exchange rate ( lagged by six months)

23
Table 7. Results of Correlation Analysis Using Annual vs Montly Data
HS Description t ta ER ERa 03.01 Live Fish
03.01 99 00 --Other ---Milkfish Fry/ Breeder -0.24 -0.21 0.54 0.49
03.02 Fish, Fresh or chilled - Other salmonidae,excl livers/roes:
0302.12 00 -- Pacific, Atlantic,Danube Salmon -0.06 -0.15 -0.11 -0.270302.64 00 --Mackerel -0.07 0.26 -0.12 -0.39
03.03 Fish, frozen, excl. fish fillets & other fish meat 0303.10 00 -Pacific Salmon:Frozen -0.42 -0.83 0.29 0.61
- Other salmonidae,excl livers/roes: 0303.21 00 -- Trout -0.24 -0.62 0.15 0.460303.22 00 -- Atlantic/Danube Salmon -0.24 -0.60 0.31 0.570303.29 00 --Other -0.19 -0.66 0.15 0.50
-Flat Fish, excluding livers and roes 0303. 31 00 --Halibut -0.07 -0.16 0.00 -0.010303. 33 00 --Sole -0.05 -0.15 -0.08 -0.190303. 39 00 --Other -0.28 -0.54 0.27 0.46
-Tunas skipjack or stripe-bellied bonito,excl. roes and livers 0303. 41 00 --Albacore or longfinned tunas -0.10 -0.47 0.20 0.490303. 42 00 --Yellow-fin Tuna 0.05 -0.36 0.04 0.330303. 43 00 --Skipjack or stripe-bellied bonito 0.15 -0.85 -0.56 0.740303. 49 00 --Other 0.24 0.79 -0.48 -0.790303 50 00 -Herrings -0.08 -0.26 0.04 0.110303.60.00 -Cod -0.14 -0.37 0.04 0.17
-Other fish excluding livers and roes 0303 71 00 --Sardines -0.03 0.29 -0.06 -0.010303 74 00 --Mackerel -0.41 -0.38 -0.14 -0.090303 76 00 --Eels -0.23 -0.76 0.17 0.550303.77 00 --Sea Bass -0.27 -0.55 0.30 0.570303.80 00 -Livers and Roes: Frozen -0.30 -0.90 0.25 0.76
03.05 Fish Dried,salted or in brine, smoked fish,whether or not cooked before or during the smoking process; flours meals and pellets of fish, fit for human consumption
0305 41 00 --Pacific, Atlantic,Danube Salmon 0.00 -0.59 0.00 0.5603.06 Crustaceans, whether in shell or not, live, fresh, chilled,
frozen, dried, salted or in brine; crustaceans in shell cooked by steaming or by boiling in water, whether or not chilled, frozen, dried, salted or in brine; flours, meals and pellets of crustaceans, fit for human consumption -Frozen
0306.12 00 --Lobster 0.10 0.38 0.11 0.050306.13 00 --Shrimps and prawns 0.08 0.34 -0.08 -0.230306.14 00 --Crabs -0.25 -0.19 0.23 0.22
-Not Frozen 03.06.23 00 --Shrimps and prawns 0.36 0.73 -0.15 -0.32
T - monthly tariff rate; ER- average monthly exchange rate Ta- average annual tariff rate; ERa- average annual exchange rate

24
Another explanation for the poor correlation between imports and the exchange rate in general is there were policy shifts or major changes in the the exchange rate regimes. The four phases of TRP actually constituted one major policy direction , i.e., reducing protection and lowering the differential between products and or sectors. There were major changes in the exchange rate policy though. The first period, 1991-1992 was characterized by exchange controls and in effect imposed a two-tier exchange rate system, one for importables, another for exportables; the exchange rate was relatively fixed with heavy Central Bank intervention and major discrete adjustments are only made when approaching a crisis level. The second period, 1993- June 1997, was characterized by liberalized trading of foreign exchange: transactions demand as well as asset demand largely from foreign sources played important roles in the market; the Central Bank continued to play a key role in the market that was relatively freer. The third period, July 1997 to 2001, does not actually represent a policy shift but captures the Asian Financial Crisis which was exogenous to the domestic economy. CA was performed using monthly imports and the monthly exchange rate by truncating the entire data set into three, as described above to capture the policy shifts. The results are contained in Table 8. There are some improvements in the correlation coefficients for the first period under column R1: higher correlation coefficients with correct signs and correlation coefficients with correct signs; but these improvements are also matched by surprises, deteriorations: from low correlation coefficients with correct signs, to wrong signs or no correlation at all. The are slightly more improvements using the second truncated data set ( R2) relative to the untruncated data set (ER) and from the first truncated set (R1) but results for some commodities shows deterioration in the correlation coefficients relative to ER and R1. The were more improvements for the third set of truncated data with higher correlation coefficients with less deterioration. Overall, the are improvements matched by deteriorations while the improved results remained poor or weak, with no coefficients higher than –0.56 observed for frozen Skipjack. It is difficult to accept these results as conclusive since tariffs and the exchange rate are a substantial component of importing cost. The most significant component in importing cost is the world price of the commodity; tariffs and other taxes and the exchange rate exert additional and or marginal effects. Aside from the tedious task of collecting comparable world prices for all the fishery products examined, correlating the world price cum tariffs and exchange rate would not shed insight into how trade policy can affect fishery import patterns. It would be more instructive to perform a regression analysis that shows the casual relationship between the dependent variable, imports and each policy variables and therefore show the relative effectiveness or ineffectiveness of each policy tool. In correlation analysis, the ceteris paribus condition is not operating and this is a possible explanation why the correlation coefficients are low. A cursory look at the unweighted annual nominal tariffs for the entire fishery sector in Table 2 and annual exchange rate in Table 3 shows that both variables are moving in the opposite directions, the, former with a decreasing trend from 1991-2000 while the latter with a increasing trend from 1991-2000. Since both tariffs and the exchange rate are inversely related to imports, the weak or poor correlation of imports with tariffs or the exchange rate is due to other factors which are not being held constant when the single correlation analysis is performed; moreover, another policy variable, the exchange rate is actually moving in the opposite trend, hence, exerting an opposite effect on imports. What is not analyzed here is which policy variable has a greater impact on imports. To be able to say more on this, the more appropriate tool to use is regression analysis.

25
Table 8. Correlation Analysis Using Truncated Data HS Description ER R1 R2 R3
03.01 Live Fish 03.01 99 00 --Other
---Milkfish Fry/ Breeder 0.54 0.00 -0.20 0.7003.02 Fish, Fresh or chilled
- Other salmonidae,excl livers/roes: 0302.12 00 -- Pacific, Atlantic,Danube Salmon 0.00 0.00 -0.18 -0.200302.64 00 --Mackerel -0.12 0.04 -0.04 0.00
03.03 Fish, frozen, excl. fish fillets & other fish meat 0303.10 00 -Pacific Salmon:Frozen 0.29 0.00 -0.12 -0.09
- Other salmonidae,excl livers/roes: 0303.21 00 -- Trout 0.15 0.00 -0.15 -0.150303.22 00 -- Atlantic Danube Salmon 0.31 0.00 0.00 0.280303.29 00 --Other 0.15 0.00 -0.07 0.13
-Flat Fish, excluding livers and roes 0303. 31 00 --Halibut 0.00 0.00 -0.01 -0.340303. 33 00 --Sole -0.08 0.00 -0.06 -0.340303. 39 00 --Other 0.27 0.00 0.08 0.11
-Tunas skipjack or stripe-bellied bonito,excl. roes and livers 0303. 41 00 --Albacore or longfinned tunas 0.20 0.26 0.00 -0.060303. 42 00 --Yellow-fin Tuna 0.04 -0.11 0.13 -0.180303. 43 00 --Skipjack or stripe-bellied bonito -0.56 0.03 0.06 -0.470303. 49 00 --Other -0.48 -0.44 -0.12 0.070303 50 00 -Herrings 0.00 0.00 -0.24 -0.420303.60.00 -Cod 0.04 0.00 -0.06 -0.44
-Other fish excluding livers and roes 0303 71 00 --Sardines -0.06 0.06 0.22 0.090303 74 00 --Mackerel -0.14 -0.38 -0.14 -0.540303 76 00 --Eels 0.17 0.00 -0.02 0.110303.77 00 --Sea Bass 0.30 0.00 -0.01 0.12
03.05 Fish Dried,salted or in brine, smoked fish,whether or not cooked before or during the smoking process; flours meals and pelles of fish, fit for human consumption
0305 41 00 --Pacific, Atlantic,Danube Salmon 0.30 -0.26 -0.05 0.1203.06 Crustaceans, whether in shell or not, live, fresh, chilled,
frozen, dried, salted or in brine; crustaceans in shell cooked by steaming or by boiling in water, whether or not chilled, frozen, dried, salted or in brine; flours, meals and pellets of crustaceans, fit for human consumption -Frozen
0306.12 00 --Lobster 0.11 -0.05 0.32 0.330306.13 00 --Shrimps and prawns -0.08 -0.16 0.06 0.020306.14 00 --Crabs 0.22 0.04 0.09 -0.08
-Not Frozen 03.06.23 00 --Shrimps and prawns -0.15 -0.23 0.04 -0.01
R1- first exchange rate regime: exchange controls were in place: 1990-1992 R2- second exchange rate regime: 1993-June 1997; R3- competitive Asian Devaluation: July 1997- 2001 ER- the entire period, 1991-2000.

26
From all CA results, the ideal candidate sector for a detail inquiry to provide for a case study on SA would then either frozen tuna (Skipjack) and or frozen mackerel as shown by their relatively higher correlation coefficients with respect to the tariff and the exchange rate. Using volume in trade, exports and imports would point to either tunas ( skipjack), sardines and mackerel. Since SA incorporates social as well as environmental factors, additional criteria should be formulated to arrive at a better decision. b. Exports: 1990-2000
There are no export taxes imposed on fish. Discretionary export licensing remains though which are required for one, regulated products for reasons of national interest and international agreements; two, prohibited products for environmental reasons or to conserve depletable raw materials. At present, the export of the following fish products are classified as prohibited: bangus fry, mother bangus, prawn-spawner and fry.
Total Philippine exports in 1999 and 2000 was valued at 35 and 38 billion US
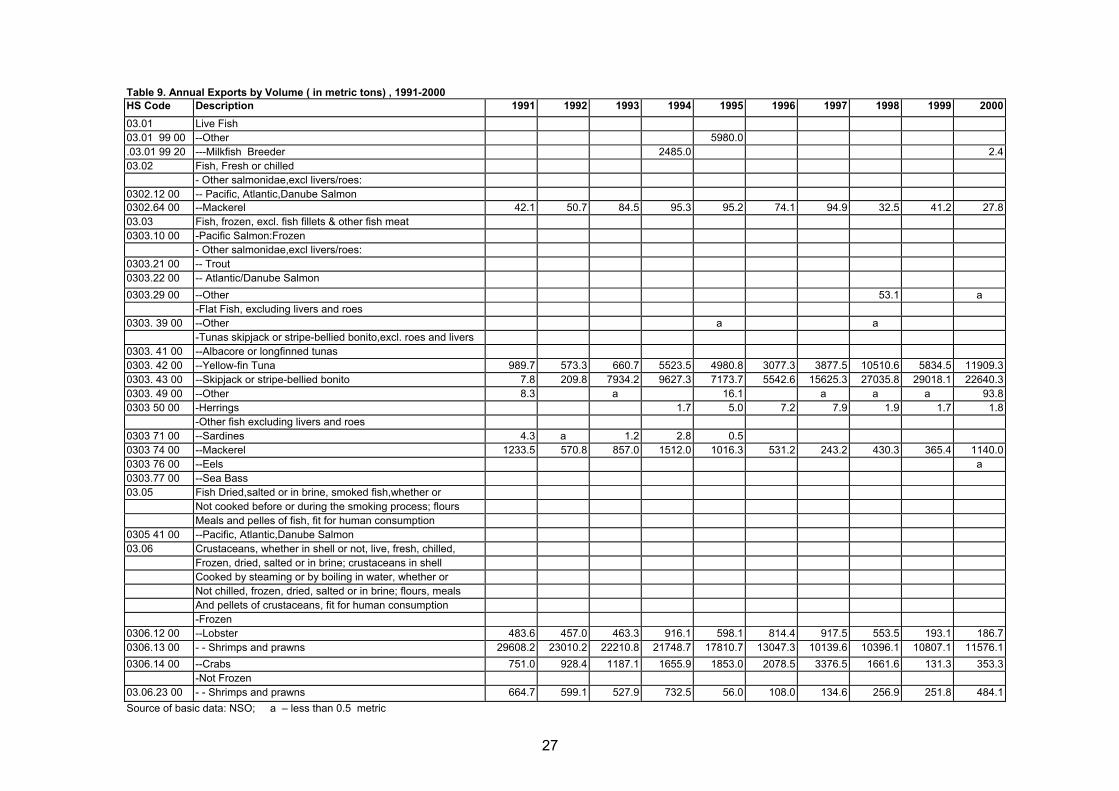
dollars, respectively. Marine products accounted for about 1.06% and 1.05% in the same respective years with tuna ( fresh/chilled/frozen, dried/smoked and canned) taking the top spot. 8 Table 9 shows the Philippine fishery export trend from 1991- 2000: frozen shrimps and prawns (HS 0306.13) showed promise in the early nineties but volume of exports started to decline in the mid-nineties; frozen yellow-fin tuna and skipjack ( HS 0303.42 and 0303.43), are two of the most promising exports, with volume of exports that has continued to increased though the growth rates have been quite uneven. Within the fishery Sector, the top performers have changed considerably over the years. Table 9 shows the top ten Philippine fishery products from 1991-2000: in the early nineties, shrimp and prawns were the top exports, accounting for more than half of total fishery exports 1991-1992. It slid to the top two in 1994 and eventually lost to frozen tuna by late nineties. Smoked/preserved tunas became the top export earner starting 1994 until 2000. Frozen tunas- yellow fin and skipjack, emerged as the top two and top three exports starting 1998 up to 2000 accounting for about 25%-30% of total fishery exports. Inching up to the top ten slots are live ornamental fish and crabs, not frozen.
Noteworthy is that frozen tuna imports were also substantial and to a lesser
extent, frozen mackerel too. Without any further data or information , there seems to be some intra-industry trade within this product, though it is not known with which country.
The decline in the importance of frozen shrimps and prawns exports could be
attributed to over supply in South East Asia as Thailand and Indonesia invested substantially too in shrimp aqaculture. The appreciation, in real terms, of the peso from 1992 – 1996 has also changed relative prices, making Philippine exports more expensive relative to its imports. Despite a 40% nominal depreciation in 1997, the volume of exports of shrimp and prawns continue to drop from an impressive 29.6 million metric tons in 1991 to only 11.6 million metric tons in 2000.
8 Source:www.dti.tradephilonline.gov.ph.
27
Table 9. Annual Exports by Volume ( in metric tons) , 1991-2000
HS Code Description 1991 1992 1993 1994 1995 1996 1997 1998 1999 2000 03.01 Live Fish 03.01 99 00 --Other 5980.0 .03.01 99 20 ---Milkfish Breeder 2485.0 2.4 03.02 Fish, Fresh or chilled
- Other salmonidae,excl livers/roes: 0302.12 00 -- Pacific, Atlantic,Danube Salmon 0302.64 00 --Mackerel 42.1 50.7 84.5 95.3 95.2 74.1 94.9 32.5 41.2 27.8 03.03 Fish, frozen, excl. fish fillets & other fish meat 0303.10 00 -Pacific Salmon:Frozen
- Other salmonidae,excl livers/roes: 0303.21 00 -- Trout 0303.22 00 -- Atlantic/Danube Salmon 0303.29 00 --Other 53.1 a
-Flat Fish, excluding livers and roes 0303. 39 00 --Other a a
-Tunas skipjack or stripe-bellied bonito,excl. roes and livers 0303. 41 00 --Albacore or longfinned tunas 0303. 42 00 --Yellow-fin Tuna 989.7 573.3 660.7 5523.5 4980.8 3077.3 3877.5 10510.6 5834.5 11909.3 0303. 43 00 --Skipjack or stripe-bellied bonito 7.8 209.8 7934.2 9627.3 7173.7 5542.6 15625.3 27035.8 29018.1 22640.3 0303. 49 00 --Other 8.3 a 16.1 a a a 93.8 0303 50 00 -Herrings 1.7 5.0 7.2 7.9 1.9 1.7 1.8
-Other fish excluding livers and roes 0303 71 00 --Sardines 4.3 a 1.2 2.8 0.5 0303 74 00 --Mackerel 1233.5 570.8 857.0 1512.0 1016.3 531.2 243.2 430.3 365.4 1140.0 0303 76 00 --Eels a 0303.77 00 --Sea Bass 03.05 Fish Dried,salted or in brine, smoked fish,whether or
Not cooked before or during the smoking process; flours Meals and pelles of fish, fit for human consumption
0305 41 00 --Pacific, Atlantic,Danube Salmon 03.06 Crustaceans, whether in shell or not, live, fresh, chilled,
Frozen, dried, salted or in brine; crustaceans in shell Cooked by steaming or by boiling in water, whether or Not chilled, frozen, dried, salted or in brine; flours, meals And pellets of crustaceans, fit for human consumption -Frozen
0306.12 00 --Lobster 483.6 457.0 463.3 916.1 598.1 814.4 917.5 553.5 193.1 186.7 0306.13 00 - - Shrimps and prawns 29608.2 23010.2 22210.8 21748.7 17810.7 13047.3 10139.6 10396.1 10807.1 11576.1 0306.14 00 --Crabs 751.0 928.4 1187.1 1655.9 1853.0 2078.5 3376.5 1661.6 131.3 353.3
-Not Frozen 03.06.23 00 - - Shrimps and prawns 664.7 599.1 527.9 732.5 56.0 108.0 134.6 256.9 251.8 484.1 Source of basic data: NSO; a – less than 0.5 metric

28
Table 10. Top Ten Exports of the Fishery Sector, 1991-2000
HS 2000 1999 1998 1997 1996 1995 1994 1993 1992 1991 Preserved/Prepared
16041400 Tunas, skipjack and atlantic bonito 26.6 31.3 38.9 47.6 46.8 37.9 42.1 - - -
03034300 Skipjack or stripe-belllied bonito (Frozen) 16.5 24.6 19.8 13.2 4.4 5.8 7.0 13.4 0.5
03034200 Yellow fin tunas (Frozen) 8.7 5.0 7.7 3.3 2.5 4.0 4.0 1.1 1.3 1.9
03061300 Shrimps and prawns (Frozen) 8.4 9.2 7.6 8.6 10.4 14.4 15.8 37.6 53.3 57.9
03075900 Octopus (not fresh,chilled or frozen) 7.4 9.5 6.1 8.8 5.5 5.5 5.4 11.6 12.6 11.8
03023200 Yellow tunas ( fresh or chilled) 5.4 5.4 5.8 2.1 5.9 7.6 3.7 12.9 5.6 8.0
03019990 Other Live Fish 4.8 - - - - - - - -
03011000 Live Ornamental fish 4.2 4.7 4.0 4.9 14.4 5.2 4.5 - - -
03037900 Other Frozen Fish 3.9 - - - - - - - - -
03062400 Crabs ( Not frozen) 3.0 2.6 0.0 0.0 Total Exports ( in MT) 137.0 117.7 136.5 118.1 125.2 123.4 138.1 59.1 43.2 51.1
1/ Ranking is based on % share in total exports in (MT)
a – sum of HS Code 16041410 and 16041420

29
IV. Conclusion and Policy Recommendations
Trade policy reform in the fishery sector has been pursued within the overall policy framework of trade reform in the Philippines. It has therefore followed the overall policy objectives and goal of trade reform. In general, there was a reduction of tariffs with the goal of reaching 5% in 2004 and the removal of all QRs except for health and public safety reasons.
The CA results using monthly data show that imports do not correlate with tariffs nor the exchange rate. However, the additional tests using annual data shows that many fishery imports are highly correlated with the average annual tariff rate though the correlation remained weak with the exchange rate. The results using truncated data can at best be interpreted to be suggestive: there were shifts in the exchange rate regime as shown by improvements in the results but almost equally matched with deterioration in results for other commodities. Even if there were improvements, the correlation coefficients were low.
The results suggests one, that tariffs are a more effective tool relative to the exchange rate in influencing imports, two, the decision to import in the fishery sector is actually not a short term behavior, as shown by poor results using monthly data, whether lagged or unlagged, but rather a long term behavioral pattern. The policy implication suggests that short term changes in tariffs will not be effective in changing volume of imports and the results emphasizes further the need for policy continuity based on long term objectives. Since regression analysis was not performed, there is an implicit assumption that there is a casual relationship between imports and tariffs and the exchange rate. As discussed in the previous sections, the results should not be take as final because the results make use of correlation analysis only; the high correlation cannot be used to conclude how effective the policy variables were. It is only indicative that trade policy can be effective in affecting imports To add more substance and rigor to the policy analysis , regression analysis is suggested; moreover, it would make possible a comparative analysis of which policy is more effective by comparing the regression coefficients. This can be an area for further research.
Another interesting policy implication that can be gleaned from the results is that trade policy has different effects on trade patterns and in effect fishery stocks and domestic resource management. The effect of trade policy reform has been to reduce the bias against exportables and make fish imports more expensive. As fishery exportable sector becomes more profitable, more resources will flow to the production of exportables and this will mean a faster depletion of existing fishery stocks and or increased habitat conversion to produce exportables. As imports become more expensive and to the extent that imports of fishery products are highly substitutable with domestic fish species, domestic demand will increase and put additional stress too on existing fishery stocks. Thus, the economic objective of pursuing freer trade is inconsistent with the objective of fishery stock conservation or domestic resource management. This points to the dilemma of using trade policy to pursue environmental objectives, specifically on the effects of the exchange rate, nominal and real on resource allocation. As such, the lesson learned here is to use other policies other than trade to achieve environmental objectives. This point to another possible area for further research by studying how trade policy can affect fishery exports to make a better case on how the exchange rate affects trade patterns and hence, better policies on domestic resource management to achieve environmental objectives.
30
References Thomas, Vinod, K. Matin and Jonh Nash. “Lessons in Trade Policy Reform” Policy and Research Series PRS10 ( The World Bank, 1990) Jenkins, Glen. Methodology for Project Appraisal. Paper submitted to ADB, 1993. World Development Report 1987. World Bank, 1987. Medalla, Erlinda, V. Pineda and E. Tan “ Estimation of Shadow Prices for the Philippines” Project Paper submitted to ADB, July 1993. ( unpublished) Tan, Elizabeth. “ Effects of the Five Percent Uniform Tariff” PTTAF-PSC, TC and PIDS Project Paper No. 95-04. July 1997. A Primer on New Developments in Trade and Tariff Policy, Philippine Tariff Commission, June 2001. Philippine Export Development Plan 2001. Trade Policy Review on the Philippines. September 1999 www.wto.org