an economic assessment of renewable energy … · options for rural electrification in pacific...
TRANSCRIPT
An Economic Assessment of RenewOptions for Rural Electrification in P
Countries
Allison Woodruff Pacific Islands Applied Geoscience Commission (SOPAC)
February 2007 SOPAC Technica
able Energy acific Island
l Report 397

[2]
For copies of this report contact:
The Director SOPAC Secretariat
Private Mail Bag GPO, Suva Fiji Islands
Phone: (679) 338 1377 Fax: (679) 337 0040
http://www.sopac.org/
Cataloguing in Publication Data: Woodruff, Allison
An economic assessment of renewable energy options for rural electrification in Pacific Island Countries/Allison Woodruff. – Suva: SOPAC, 2007. 96 p. : ill.; 30 cm ISSN : 1605-4377 1. Renewable energy sources 2. Economic assessment – renewable energy – Oceania I. SOPAC Technical Report 397 II. Title
[SOPAC Technical Report 397 – Woodruff]

[3]
TABLE OF CONTENTS ACRONYMS ..................................................................................................................................................................6 EXECUTIVE SUMMARY ...............................................................................................................................................7 ACKNOWLEDGEMENTS ..............................................................................................................................................9
1. INTRODUCTION .....................................................................................................................................................10 1. 1 The Global Situation .........................................................................................................................................11 1.2 The Rural Electrification Challenge ...................................................................................................................12 1.3. Renewable Energy Potential for Rural Electrification in the Pacific ..................................................................12 1.4 Petroleum Dependence in Pacific Island Countries...........................................................................................14
2. ECONOMIC ASSESSMENT OF RURAL ELECTRIFICATION PROJECTS............................................................17 2.1 Introduction to Economic Evaluation .................................................................................................................17 2.2 Economic versus Financial Project Analysis .....................................................................................................17 2.3 Identifying and Quantifying Benefits and Costs .................................................................................................19 2.4 Comparing Benefits and Costs ..........................................................................................................................22 2.5 Methodology Used in this Study ........................................................................................................................23
3. CONVENTIONAL OPTIONS FOR RURAL ELECTRIFICATION.............................................................................25 3.1 Electrical Grid Extension ...................................................................................................................................25 3.2 Decentralised Diesel-Powered Stand-alone Generators: ..................................................................................26
4. SOLAR ENERGY – PV SOLAR HOME SYSTEMS.................................................................................................30 4.1 Experience with Solar Power in the Pacific .......................................................................................................30 4.2 PV System Technology .....................................................................................................................................30 4.3 Costs of PV Systems.........................................................................................................................................31 4.4 Reliability of PV Systems...................................................................................................................................34 4.5 Case Study − The Ha’apai Solar Electrification Project, ‘O’ua Island, Tonga....................................................34
5. MICRO-HYDRO ELECTRICITY ..............................................................................................................................41 5.1 Micro-hydroelectricity System Technology ........................................................................................................41 5.2 Micro-hydroelectric Potential in the Pacific ........................................................................................................42 5.3 Micro-hydroelectricity Production Costs ............................................................................................................43 5.4 Micro-Hydro System Reliability..........................................................................................................................44 5.5 Case Study − Bulelavata Micro-Hydroelectricity Project, Solomon Islands .......................................................45
6. WIND ENERGY .......................................................................................................................................................51 6.1 Wind Turbine Technology:.................................................................................................................................51 6.2 The PIC Experience with Electricity Production from Wind Energy ...................................................................52 6.3 Costs of Producing Wind Energy.......................................................................................................................53 6.4 Case Study − Mangaia Grid-Connected Wind Farm, Cook Islands...................................................................53
7. COCONUT BIOFUEL ..............................................................................................................................................60 7.1 Coconut Biofuel Technology..............................................................................................................................60 7.2 Experience in the Pacific ...................................................................................................................................62 7.3 Economic Impact ...............................................................................................................................................62 7.4 Case Study − The Fiji Biofuel Programme ........................................................................................................65
8. CONCLUSIONS AND RECOMMENDATIONS........................................................................................................71 8.1 Conclusions .......................................................................................................................................................71 8.2 Recommendations.............................................................................................................................................72
REFERENCES ............................................................................................................................................................73
[SOPAC Technical Report 397 – Woodruff]

[4]
APPENDICES Appendix 1 – Life-Cycle Costs of PV and Diesel Systems in Ha’apai and Least-Cost Analysis ..................................79 Appendix 2 – Least-Cost Analysis: Diesel versus Micro-Hydro in Bulelavata, Solomon Islands ................................83 Appendix 3 – Cost-Benefit Analysis of the Mangaia Wind Project ...............................................................................86 Appendix 4 – Glossary.................................................................................................................................................91
LIST OF FIGURES & TABLES List of Tables Table 1. Percent of households with access to electricity in Pacific Island Countries. .......................................14 Table 2. Pacific Island fuel imports. ......................................................................................................15 Table 3. Breakdown of fuel costs in Pacific Islands...................................................................................16 Table 4. Different types of rural electrification schemes in Fiji 1975-1992 ......................................................26 Table 5. Cost comparison of diesel generators. .......................................................................................27 Table 6. Cost comparison of solar home systems by country (US$). ............................................................32 Table 7. List of PREFACE project islands and number of systems installed. .................................................36 Table 8. Summary of solar system and diesel generator life-cycle costs. .......................................................38 Table 9. Sensitivity of diesel generator life-cycle costs to changes in the price of fuel and generator efficiency. .....39 Table 10. Sensitivity of PV system life-cycle costs to changes in battery life. .................................................39 Table 11. Life-cycle cost sensitivity analysis using various discount rates. .....................................................39 Table 12. Summary of Hydroelectric Schemes in the Pacific.......................................................................43 Table 13. Typical costs of a micro-hydro system. ....................................................................................44 Table 14. Community Micro-hydro Schemes in the Solomon Islands. ...........................................................45 Table 15. Summary of micro-hydro system and diesel generator life-cycle costs. ...........................................49 Table 16. Sensitivity of diesel generator life-cycle costs to changes in efficiency and fuel price...........................49 Table 17. Life-cycle cost sensitivity analysis using various discount rates (US$.).............................................50 Table 18. Wind energy production in Mangaia. ........................................................................................57 Table 19. Present value of costs and benefits associated with the Mangaia Wind Project.. ................................58 Table 20. Sensitivity analysis using various discount rates (US$).................................................................58 Table 21. Present value of costs and benefits associated with the optimised Mangaia wind-hybrid system............59
Table A1. Life-Cycle Cost Analysis: Diesel Mini-grid versus Solar Home Systems on ‘O’ua, Tonga.........................81 Table A2. Total Life-Cycle Costs of Diesel and Micro-hydro Systems.........................................................................85 Table A3. Costs and benefits of adding wind turbines to the Mangaia electricity production system. ........................89
List of Figures Figure 1. Oil drums sitting on wharf in Vanua Balavu, Fiji............................................................................................16 Figure 2. Benefits of electricity.....................................................................................................................................21 Figure 3. Electrical grid ................................................................................................................................................25 Figure 4. Generator powerhouse, Welagi Village, Fiji ..................................................................................................26 Figure 5. Diesel generator, Vanua Balavu, Fiji.............................................................................................................27 Figure 6. Components of a PV solar home system......................................................................................................31 Figure 7. Cost-effectiveness of PV and diesel systems according to the number of households served ....................33 Figure 8. The Ha'apai Group, Tonga ......................................................................................................................... 354 Figure 9. Household PV System located on ‘O’ua Island, Tonga ................................................................................35 Figure 10. PV System battery ......................................................................................................................................35 Figure 11. Contribution of each PV system component to overall capital cost ............................................................37 Figure 12. Typical set-up of a micro-hydro system ......................................................................................................42
[SOPAC Technical Report 397 – Woodruff]
[5]
Figure 13. Location of Bulelavata Village,....................................................................................................................45 Figure 14. Bulelavata Weir...........................................................................................................................................46 Figure 15. Youth in front of Bulelavata Weir ...............................................................................................................47 Figure 16. Location of Mangaia, Cook Islands.............................................................................................................53 Figure 17. Two 20-kW turbines on Mangaia ................................................................................................................54 Figure 18. Electricity production system set-up on Mangaia........................................................................................54 Figure 19. Maximum allowable energy produced from wind in the Mangaia electrical grid .........................................55 Figure 20. Wind and diesel power contribution to total energy production...................................................................57 Figure 21. Coconut trees .............................................................................................................................................60 Figure 22. Biofuel generator, Vanua Balavu, Fiji..........................................................................................................61 Figure 23. Coconut pile, Sawana Village, Vanua Balavu, Fiji ......................................................................................61 Figure 24. World coconut oil prices (1960-2005) .........................................................................................................63 Figure 25. The effect of remoteness on fuel and coconut product prices ....................................................................64 Figure 26. Price comparison of diesel and local coconut oil prices in selected PICs...................................................64 Figure 27. Defunct Coconut oil mill in Vanua Balavu, Fiji ...........................................................................................66 Figure 28. Coconut oil and diesel fuel price comparison for Vanua Balavu, Fiji ..........................................................67 Figure 29. Coconut oil and diesel fuel price comparison in Taveuni (Welagi), Fiji .......................................................68
[SOPAC Technical Report 397 – Woodruff]

[6]
ACRONYMS
ADB Asian Development Bank APACE-VFEG Appropriate Technology for Community and Environment – Village First Electrification
Group AWEA American Wind Energy Association BCA Benefit-Cost Analysis CIF Cost + Insurance + Freight CIDA Coconut Industry Development Authority (Fiji) EIA Energy Information Administration (US Department of Energy) ESMAP Energy Sector Management Assistance Programme (World Bank/UNDP) FOB Free on Board GDP Gross Domestic Product IEA International Energy Association IMF International Monetary Fund IRR Internal Rate of Return ITDG Intermediate Technology Development Group MDG Millennium Development Goals NGO Non-Government Organisation NPV Net Present Value O&M Operation and Maintenance LCC Life-Cycle Cost OECD Organisation for Economic Cooperation and Development PIC Pacific Island Country PIFS Pacific Islands Forum Secretariat PIEPSAP Pacific Islands Energy Policy and Strategic Actions Plan Project (SOPAC) PREFACE Pacific Rural Renewable Energy France Australia Common Endeavor PV Photovoltaic REEP Renewable Energy and Energy Efficiency Program for the Pacific (ADB) RET Renewable Energy Technology SIDS Small Island Developing State SOPAC Pacific Islands Applied Geoscience Commission SHS Solar Home System SPC Secretariat of the Pacific Community SPREP Secretariat of the Pacific Regional Environment Programme UN United Nations UNDP United Nations Development Programme UNCTAD United Nations Commission on Trade and Development WSSD World Summit on Sustainable Development Energy and Power Units AC Alternating Current DC Direct Current KVA Kilo-Volt-Amperes kWh Kilo-watt-hour m/s Meter per second MW Megawatt RPM Revolutions per minute Wh Watt-hour Wp Watts peak power
[SOPAC Technical Report 397 – Woodruff]

[7]
EXECUTIVE SUMMARY There is an important and growing economic role for renewable energy systems within the energy
sector. This is demonstrated by the fact that over the past few years, the use of renewable energy
technologies has expanded rapidly. In 2005, renewable energy technologies, including
hydropower, accounted for 17% of global energy production.
Renewable energy technologies provide a cost-effective source of electricity in rural areas where
distances are large, populations are small, and demand for energy is low. This is a market that,
traditionally, has been very difficult for developing country governments to serve in a cost-
effective manner. As a result, a large proportion of households living in rural areas still lack
access to modern forms of energy. However, access to basic energy services has been identified
as a necessary condition for the achievement of many of the Millennium Development Goals. This
is because access to energy can promote improved outcomes in the areas of health, education,
and economic development.
Pacific Island Countries face a particularly difficult challenge when it comes to rural electrification.
As a result of the unique geographical situation in the region, where long distances separate
sparsely-populated areas, and markets are too small to achieve cost savings through economies
of scale in electricity production, the costs of supplying electricity to rural areas are enormous.
This has resulted in a situation where approximately 70% (or approximately 50% excluding Papua
New Guinea) of the region’s population still lacks access to electricity. In addition, Pacific Island
Countries, despite their abundance of renewable energy resources, remain almost completely
dependent on imported fossil fuels for meeting their energy needs. Imported petroleum products
account for an average of 40% of countries’ gross domestic products. With rising petroleum
prices, and growing trade deficits, the current situation is likely to be unsustainable in the future.
As part of this study, four rural electrification projects were selected in order to assess the cost-
effectiveness of a particular renewable energy technology option in a rural Pacific Island setting.
First, the island of ‘O’ua, which is part of the Ha’apai Solar Electrification Project in Tonga, was
examined in order to compare the cost-effectiveness of individual solar home systems compared
with a village diesel generator for supplying basic household electricity services. Using least-cost
analysis, it was determined that solar home systems would provide the most cost-effective means
of supplying electricity. Next, again using least-cost analysis, it was determined that micro-
hydroelectricity was the least-cost option, compared with diesel generators, for supplying
electricity to Bulelavata Village, a rural community located in the Western Province of the
Solomon Islands. Benefit-cost analysis was used to assess the benefits, in terms of diesel
[SOPAC Technical Report 397 – Woodruff]

[8]
savings, associated with a wind-hybrid system on the island of Mangaia, in the Cook Islands,
compared with the costs of integrating wind turbines into the current electricity production system.
Since the fuels savings envisioned under the project have largely failed to materialise, it was
determined that the wind-hybrid system was not a cost-effective option for electricity production
on the island. Finally, the biofuel pilot projects on the islands of Taveuni and Vanua Balavu, in Fiji,
were examined in order to compare the costs of producing electricity from a generator, using
coconut oil versus diesel fuel. It was determined that although, in theory, coconut oil could
present a more cost-effective option for powering village generators, supply constraints and high
labour costs at the micro-economic level, prevent this from occurring in practice.
It is important to highlight that there is not one technology that is least-cost, and it is very much
dependent on local conditions, and renewable resource availability. Also, hours of service and
power availability vary considerably between different energy options. The results from the study,
which indicate that renewable energy technologies are the least-cost option for rural
electrification, depend critically on the fact that shipping costs are high, which makes diesel fuel
expensive, populations are small and per capita demand for energy is low, which does not allow
for economies of scale in energy production.
Based on the results from this study it is recommended that governments actively promote the
use of renewable energy technologies, by developing policies, which require renewable energy
options to be adequately considered in energy planning. Also, it is further recommended that
Pacific Island Governments focus on developing appropriate models for managing renewable
energy projects in order to ensure that systems are adequately maintained and that user fees are
collected in full, and set at a level which ensures financial sustainability. Regional cooperation is
needed for countries to share their experiences with the successful implementation of renewable
energy projects. Finally, since the start-up costs associated with renewable energy technologies
tend to be high, it is recommended that policies be introduced, which assist in lowering the initial
costs, which is another major barrier to their use. However, given the limited amount of resources
available for spending on public investment projects, trade-offs between sectors exist, and so
renewable energy investment decisions should be integrated into national development planning
processes.
[SOPAC Technical Report 397 – Woodruff]
[9]
ACKNOWLEDGEMENTS
The funding for this study was provided by the Australian Agency for International Development
(AusAID).
The author would like to thank all of the people who provided data and information and/or
assisted with the fieldwork conducted as part of this study. Thanks to Tevita Tukunga, ‘Ofa
Sefana, Kilisimasi Lutui and Emeline Veikoso at the Energy Planning Unit, Tonga, and the
community on ‘Oua Island in the Ha’apai Group of Tonga. Thanks to Intiyaz Khan, of the Fiji
Department of Energy and the communities of Welagi, Sawana and Lomaloma in Fiji, for the
valuable information provided during interviews. Thanks also to Peter Vail and Paul Bryce at
APACE-VFEG for providing valuable information on the Bulelavata micro-hydro system in the
Solomon Islands.
Finally, thanks to Jan Cloin, Rupeni Mario, Paula Holland and Paul Fairbairn at SOPAC, and to
Chris Cheatham, for their time and effort spent in reviewing and providing valuable input into this
study.
[SOPAC Technical Report 397 – Woodruff]

[10]
1. INTRODUCTION The global use of renewable energy technology options has expanded rapidly over the past two
decades as their technological feasibility, reliability and cost-effectiveness has been successfully
demonstrated in a number of niche markets. Given the high cost of supplying electricity to
isolated rural communities, decentralised renewable energy options often can compete on cost
with conventional supply options such as grid extension. However, despite their abundance of
renewable energy resources, Pacific Island Countries (PICs) remain almost completely
dependent on fossil fuels for meeting their energy needs (World Bank, 1992; Wade and others,
2005).
Improving access to electricity has been made a priority among Pacific Island Countries, where
approximately 70% (50%, excluding Papua New Guinea) of the population lacks access to
electricity, (SOPAC 2004; Wade and others, 2005). This poses an enormous challenge to a
region where most countries consist of a number of dispersed islands with isolated populations,
poorly developed infrastructure, and limited financial resources to invest in electrification projects.
In addition, with global oil prices rising to over US$70 per barrel, the costs of supplying electricity
through conventional means has become unsustainably costly, thereby exerting pressure on the
countries’ trade balances, government budgets and the incomes of energy consumers.
Traditionally in PICs, outside of urban areas, when grid extension is not economically feasible,
electricity is supplied by decentralised diesel generators (Cheatham, 1990). Although, initial
capital investment requirements are low, diesel generators are very costly to operate and
maintain, which often makes this technology option unsustainable in isolated rural communities
where household income is low, and skilled labour scarce. Under these circumstances, renewable
energy options, which are relatively simple to maintain, and do not require imported fuel inputs,
provide an increasingly attractive means of promoting rural electrification (Liebenthal and others,
1994).
The aim of this study is to conduct an economic and financial evaluation of a number of
technologically-proven renewable energy projects, which have been implemented in Pacific Island
Countries, in order to assess the potential for renewable energy to play a larger role in rural
electrification strategies in the region. These include projects that utilise technologies such as
solar photovoltaic (PV) home systems, wind-hybrid systems, coconut biofuel-powered generators
and micro-hydroelectric systems. Using case studies from various Pacific Islands, the least-cost
means of supplying electricity to rural communities is assessed by comparing the life-cycle costs
of a particular renewable energy technology with the costs of supplying electricity with a diesel
generator over the estimated life of a project. The case studies selected as part of the study were
[SOPAC Technical Report 397 – Woodruff]

[11]
chosen in order to reflect as wide a range of renewable technologies as possible in a variety of
different Pacific Island settings. These include O’ua Island, which is part of the Ha’apai Solar
Electrification Project in Tonga; the Mangaia Wind Power Project in the Cook Islands; the Welagi
and Vanua Balavu Biofuel Projects in Fiji; and the Bulelavata Micro-Hydroelectric Project in the
Solomon Islands.
1. 1 The Global Situation
In 2004, about US$55 billion1 was invested in renewable energy power systems, which is just
over one-third the amount that was invested in conventional power plants. In 2005, renewable
energy, (including hydropower) supplied 17% of the world’s primary energy (World Bank, 2006).
Much of this growth in use has occurred in developing countries, which account for 44% of the
world’s renewable generating capacity and receive half a billion dollars each year to fund
investments in this sector (REN21, 2005a; World Bank, 2006). Currently PV systems provide
lighting for more than 2 million homes worldwide (REN21, 2005b).
There is an important and growing economic niche for renewable energy systems within the
energy sector. Renewable energy competes with conventional energy in four main areas: power
generation, hot water and space heating, transport fuels, and rural off-grid energy. The costs of
renewable energy have declined significantly over the past 10 to 15 years with improvements in
technology and economies of scale in production. For off-grid applications, mini-grid and stand-
alone renewable energy systems can be a cost-effective alternative to grid-based rural
electrification, which is often too costly for sparsely-populated and remote areas (World Bank,
2006). The future prospects for renewable energy technologies are even more promising due to
continually falling prices, and the growing awareness of the environmental and energy security
benefits that such technologies provide.
In addition, concerns about global climate change have lead to growing interest in the use of
renewable energy technologies for energy production. For example, industrialised countries have
made a significant number of investments in developing countries, in areas such as renewable
energy, under the Clean Development Mechanism included in the Kyoto Protocol, in order to earn
carbon credits by investing in project activities that reduce greenhouse gas emissions and
promote sustainable development. There is also an incentive for developing countries, although
they are not significant emitters of greenhouse gases on a global scale, to promote the use of
renewable energy in order to address climate change, since they are expected to bear many of
1 US$30 billion excluding hydropower
[SOPAC Technical Report 397 – Woodruff]
[12]
the negative consequences associated with climate change, including sea-level rise and the
increased frequency of storms, floods and droughts.
1.2 The Rural Electrification Challenge
Access to affordable and reliable energy supplies is a necessary prerequisite to economic
development and poverty reduction (REN21, 2005b). This is because rural electrification leads to
a number of quality of life improvements, such as improved communications, educational
attainment and health services. Access to electricity services was explicitly identified by the World
Summit on Sustainable Development (WSSD) as an essential for achieving the UN Millennium
Development Goals for halving poverty by 2015 in the world’s poorest countries (Modi and others,
2006; REN21, 2005b).
Despite the benefits of rural electrification, more than 1.6 billion people living in rural areas
worldwide lack access to electricity (Modi and others, 2006). One reason for this is that it is
extremely costly to provide electricity to rural areas through conventional means, such as through
electrical grid extension or stand-alone diesel generation, due to remoteness and low population
densities disallowing for economies of scale in the provision of electricity services (World Bank,
2001). As a result, there is a need to find more cost-effective ways to provide electricity to remote
rural areas.
The advantage of many renewable energy technologies is that they are either decentralised, do
not require transmission lines, or do not require imported fuel, so that they can be deployed in
remote areas, where household demand for energy is low, at a relatively low cost compared to
more conventional energy systems.
1.3. Renewable Energy Potential for Rural Electrification in the Pacific
Pacific Island Countries, which are characterised by their small size, long distances between
islands, and isolated populations are faced with a unique and difficult challenge in supplying
electricity to rural households. Often energy markets on Pacific Islands are fragmented, small and
difficult to serve, with little potential for achieving economies of scale in infrastructure planning. On
most Pacific Islands, grid-based, publicly distributed electricity is provided only on the main island
and supply to rural areas is limited (Wade and others, 2005). However, the proportion of the
population with access to electricity in the region varies considerably from country to country, with
100% access to electricity available in Niue, compared to less than 10% in Papua New Guinea,
[SOPAC Technical Report 397 – Woodruff]
[13]
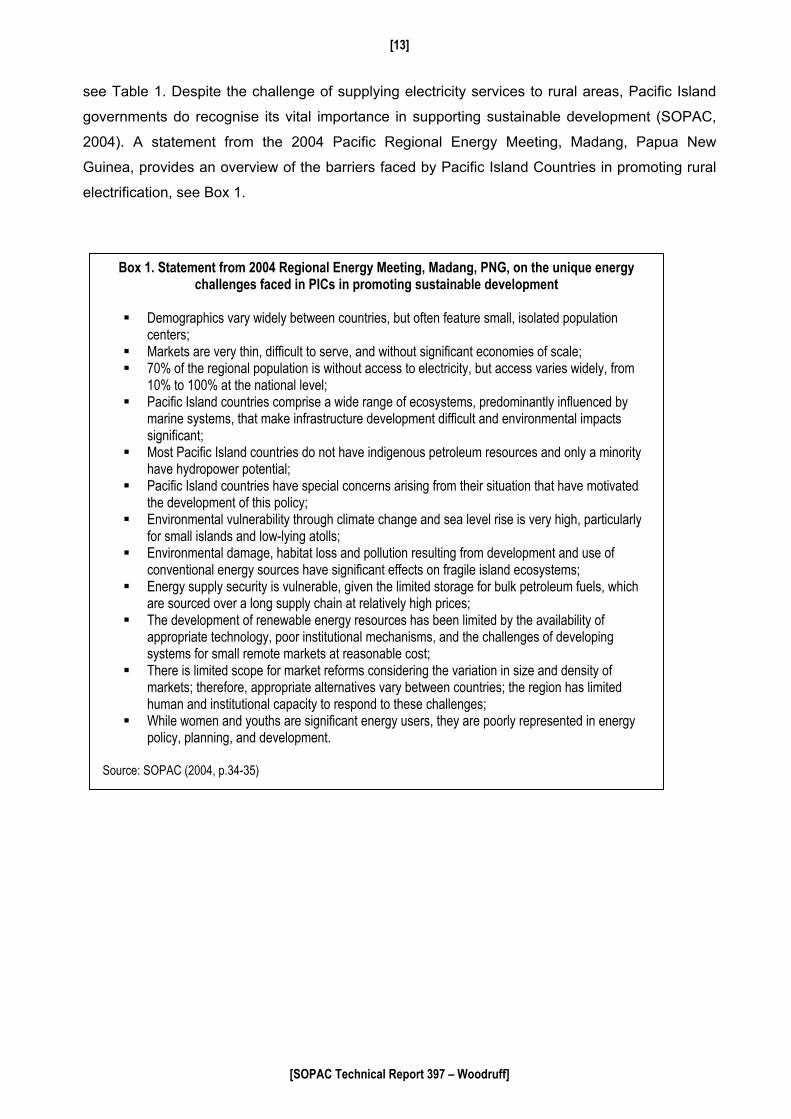
see Table 1. Despite the challenge of supplying electricity services to rural areas, Pacific Island
governments do recognise its vital importance in supporting sustainable development (SOPAC,
2004). A statement from the 2004 Pacific Regional Energy Meeting, Madang, Papua New
Guinea, provides an overview of the barriers faced by Pacific Island Countries in promoting rural
electrification, see Box 1.
Box 1. Statement from 2004 Regional Energy Meeting, Madang, PNG, on the unique energy challenges faced in PICs in promoting sustainable development
Demographics vary widely between countries, but often feature small, isolated population
centers; Markets are very thin, difficult to serve, and without significant economies of scale; 70% of the regional population is without access to electricity, but access varies widely, from
10% to 100% at the national level; Pacific Island countries comprise a wide range of ecosystems, predominantly influenced by
marine systems, that make infrastructure development difficult and environmental impacts significant;
Most Pacific Island countries do not have indigenous petroleum resources and only a minority have hydropower potential;
Pacific Island countries have special concerns arising from their situation that have motivated the development of this policy;
Environmental vulnerability through climate change and sea level rise is very high, particularly for small islands and low-lying atolls;
Environmental damage, habitat loss and pollution resulting from development and use of conventional energy sources have significant effects on fragile island ecosystems;
Energy supply security is vulnerable, given the limited storage for bulk petroleum fuels, which are sourced over a long supply chain at relatively high prices;
The development of renewable energy resources has been limited by the availability of appropriate technology, poor institutional mechanisms, and the challenges of developing systems for small remote markets at reasonable cost;
There is limited scope for market reforms considering the variation in size and density of markets; therefore, appropriate alternatives vary between countries; the region has limited human and institutional capacity to respond to these challenges;
While women and youths are significant energy users, they are poorly represented in energy policy, planning, and development.
Source: SOPAC (2004, p.34-35)
[SOPAC Technical Report 397 – Woodruff]

[14]
Table 1. Percent of households with access to electricity in Pacific Island Countries. Country Year Population Percent of Households
with access to Electricity Cook Islands 2004 18,000 99% Federated States of Micronesia 2000 107,000 54% Fiji 1996 844,000 67% Kiribati 1993 85,000 29% Marshall Islands 1999 54,600 63% Nauru 2002 10,100 100% Niue 2003 1,700 100% Palau 2004 19,100 97% Papua New Guinea 2003 5,200,000 < 10% Samoa 2001 176,100 93% Solomon Islands 1999 457,000 16% Tokelau 2003 1,500 100% Tonga 1999 100,000 80% Tuvalu 2003 9,300 > 95% Vanuatu 1999 212,000 19% Total 7,285,300.00 78% Total (excluding Papua New Guinea) 2,095,400.00 48% Source: Wade and others (2005)
1.4 Petroleum Dependence in Pacific Island Countries
Pacific Island Countries are heavily dependent on imported fossil fuel products. On average,
petroleum product imports account for approximately 40% of GDP, but the figure is significantly
higher in countries such as Kiribati and Palau (Osborne, 1996). Furthermore, with the exception
of Papua New Guinea (PNG), Pacific Islands have few indigenous sources of fossil fuel (World
Bank, 1992). As a result, imported oil is the primary energy source in all countries, accounting for
between 8-37% of total imports, as Table 2 demonstrates.
The high ratio of petroleum imports to total exports for most countries highlights the fact that
Pacific Island Countries are vulnerable to world oil price shocks. In addition, Table 2 shows that
the export structure of many PICs is such that it is insufficient to even cover countries’ oil imports,
which may not be a sustainable situation in the long run.2
2 Such a situation is sustainable as long as Pacific Island Countries are able to finance their current account deficits through foreign exchange reserves and/or net inflows from abroad.
[SOPAC Technical Report 397 – Woodruff]

[15]
Table 2. Pacific Island fuel imports.
Country Fuel Import Value ($US millions)
Fuel Imports as a Share of Total Imports (%)
Fuel Imports as a Share of Total Exports (%)
Papua New Guinea 358.7 25.1 16.2 Fiji 340.2 23.5 50.0 Solomon Islands 11.7 27.4 15.8 Samoa 22.6 15.1 160.3 Vanuatu 12.8 14.3 64.3 Federated States of Micronesia (FSM) 17.3 13.0 88.3 Tonga 17.6 25.5 293.3 Kiribati 5.7 10.0 172.7 Marshall Islands 20.4 37.3 224.2 Cook Islands 6.2 8.4 86.1 Palau 12.4 13.0 104.5
Source: IMF3 and ADB (2005)
Given this heavy dependence on imports, and the narrow export base of many PICs, it is not
surprising that many countries in the region have faced significant balance of payments problems,
where imports greatly exceed exports.4 For example, since the mid-1980s, Kiribati has had import
levels that are ten times greater than export levels (Osborne, 1996). If the current trend of rising
oil prices continues, growing pressure will be exerted on the balance of payments of many PICs,
as their trade deficits continue to rise.
The size and structure of Pacific Island economies also makes them vulnerable to trade shocks,
which can compromise economic stability, by affecting variables such as the exchange rate,
inflation and debt levels. For example, oil price increases can exert a large amount of inflationary
pressure on PIC economies if the value of oil imports accounts for a significant portion of GDP.
Therefore, it is important to look at ways in which these chronic balance of payments problems
can be eased, especially through the development of renewable energy technologies.
Another factor that adds to the high cost of petroleum products in Pacific Island Countries is the
nature of the fuel supply chain. Small markets have resulted in a lack of economies of scale,
which limits the potential for competition between fuel suppliers and ensures that fuel prices
remain high. Also, the monopoly position of multi-national oil companies in many countries has
allowed companies to earn returns on investment comparable to large rapidly growing economies
(Morris, 2005).
3 IMF country reports for various years. 4 With the exception of Papua New Guinea and the Solomon Islands.
[SOPAC Technical Report 397 – Woodruff]

[16]
Table 3. Breakdown of fuel costs in Pacific Islands.
Location Fuel Cost Component (excluding taxes)
Percent of Total Cost of Fuel in PICs
Singapore FOB 90-95% Primary Ports Freight Costs to Primary Port5 4.5-9.5% Insurance and Loss 0.5-0.6% Secondary Ports
Transport, handling and distribution costs to ship to secondary ports
Added 15-30% to total cost at primary ports
Source: Rizer and Tavanavanua (1988)
In addition, infrastructure constraints mean that petroleum products can only be shipped in 200
litre drums to most outer islands of the Pacific. The fixed costs of barrels prevent economies of
scale from being achieved, which would be available if fuel was shipped in larger quantities
(Morris, 2006).6 Furthermore, in many cases fuel drums must be ‘floated’ on to shore due to
inadequate port facilities, which also imposes a high potential environmental risk if fuel is released
into the coastal environment (Coutrot, 1987).
Figure 1. Oil drums sitting on the wharf in Vanua Balavu, Fiji.
5 Primary ports include: Vuda Point, Suva, Guam, Port Moresby and Apia 6However, Morris (2006) emphasises the importance of considering the negative consequences associated with reducing the volume of diesel being shipped to outer islands. This is because diesel accounts for a significant share of total shipping revenues, and a reduction in diesel shipments may lead to increased freight charges to compensate for lost revenues.
[SOPAC Technical Report 397 – Woodruff]
[17]
2. ECONOMIC ASSESSMENT OF RURAL ELECTRIFICATION PROJECTS
2.1 Introduction to Economic Evaluation
Rural electrification projects are generally viewed as costly, but are justified on the basis that they
yield important social and economic benefits. However, meeting the basic energy needs of rural
households places competing demands on limited resources allocated for rural development.
Access to electricity is but one essential service needed to meet the basic needs of rural
households (other services include water and sanitation, health services, etc.). Ideally, all remote
communities would be electrified through electrical grid extension, in order to maximise the quality
of energy services and the hours that electricity is available to households. However, this cannot
always be justified on economic grounds since the costs of undertaking such a project are
enormous compared with the benefits people receive. Also, greater returns to investment might
be obtained if resources were invested in projects in order sectors such as health and education.
Consequently, it is important that resources allocated to the energy sector are used as efficiently
as possible (ESMAP/NRECA, 2000).
Decision-makers must make informed decisions by taking into account all of the different costs
and benefits associated with the alternative means of providing electricity to rural dwellers. This
involves estimating the total economic benefits and costs associated with each potential project.
An investment is desirable from an economic perspective if total benefits exceed total costs. For
rural electrification projects, the project with the greatest ‘net benefits’ (benefits less costs) should
be chosen among all technologically feasible options for providing electricity to rural households.
In addition, the net benefits should exceed to a sufficient degree, the net benefits to investing in
other competing projects for which resources could be used. For example, the returns from
investing in an education or public health project in a rural community may exceed the returns
from investing in rural electrification.
2.2 Economic versus Financial Project Analysis
Economic analysis considers the costs and benefits associated with a project from the
perspective of society, whereas financial analysis considers these factors from the perspective of
the investor(s). The scope of economic analysis is much wider compared with financial analysis,
since financial analysis considers only the direct, monetary values associated with establishing
and operating a project (OECD and IEA, 1991). As a result, a project is considered to be
[SOPAC Technical Report 397 – Woodruff]
[18]
financially viable when a project’s revenues exceed its costs. Economic analysis, on the other
hand, considers both the monetary and non-monetary, as well as the direct and indirect, costs
and benefits of a project. This is because economic analysis takes into consideration the value of
all goods and services, including those that are not traded in the market, and therefore have no
market price assigned to them. A project is considered to be economically viable when its benefits
exceed its costs, including market and non-market values.
Because of this distinction between market and non-market values, a project that is economically
viable may or may not be financially viable, and vice-versa. In the first case, it may be desirable
from an economic perspective to pursue a solar power service project that provides electricity to
homes in a remote community, even if the costs of providing this service exceed the expected
revenue streams. This is because a project may yield important non-market benefits such as
improvements in health and education. In the second case, there may be non-market costs
associated with a project that are borne by society but not a private investor. For example, if a
profitable hydro-electricity project results in massive deforestation and erosion, the project would
be economically unviable if total costs, including the monetary value of environmental damage,
exceeded the benefits.
In economic analysis, unlike financial analysis, economic costs of resources are valued using
their ‘opportunity cost’, in order to ensure that resources are put to their most efficient use. The
opportunity cost is cost of not using resources for their next best use. For example, the
opportunity of capital used to invest in a particular project, is the commercial interest rate, since
the funds could otherwise have been put into a bank account in order to earn interest. When there
are no distortions in the market, the market price can be used to reflect the opportunity cost of a
particular resource such as labour or capital (e.g. wage rate or interest rate). However, when
market distortions exist, ‘shadow’ prices must be used. For example, when evaluating a project, a
shadow exchange rate must generally be used in place of a country’s official exchange rate. This
even with a free-floating exchange rate regime, if any taxes or subsidies on demand and supply
exist, if there are any commodity or factor price distortions; or if the current account deficit is not
sustainable (ADB, 2001). Use of the official exchange rate rather than the shadow exchange rate,
may affect the economic analysis of a project which uses tradable inputs. This is because if an
official exchange is overvalued, then projects which produce non-tradable with tradable inputs are
favored relative to projects which produce tradable outputs with non-tradable inputs; and
represents a misallocation of resources (Lagman-Martin, 2004).7
7 For guidelines on calculating shadow prices see ADB (2001).
[SOPAC Technical Report 397 – Woodruff]

[19]
2.3 Identifying and Quantifying Benefits and Costs Costs and benefits are identified by comparing a ‘with’ projects situation with the ‘without’ projects
situation (its counterfactual), where the ‘without’ project situation is the situation which would
prevail in absence of the project.8 The benefits and costs of a project can be measured as the
difference between the two situations.
Monetary benefits associated with an electricity project may include cost savings on other forms
of energy such as kerosene. Monetary costs would include all the costs associated with
designing, installing, operating and maintaining the electricity project. However, in most cases
electricity projects will also generate non-monetary costs and benefits. These benefits could
provide an important contribution to the broader economic viability of a project, and therefore
ideally be considered when conducting an economic analysis. For example a solar electrification
project may result in reduced carbon dioxide emissions if it replaces fossil fuel-based forms of
energy. In order to measure and quantify the economic value of non-market costs and benefits,
several economic valuation techniques exist. When evaluating the economic viability of a project, costs and benefits must be considered over
the entire lifetime of each project. Costs and benefits that do not arise until the future are
considered to be worth less than those that arise today, because of the time value of money
which leads people to place less value on future costs and benefits. Thus, a ‘discount rate’ must
be used to weigh present and future costs and benefits associated with a project. The discount
rate reflects the amount individuals or society are willing to accept as compensation for foregoing
benefits. The choice of discount rate will vary from country to country, and is based on factors
such as opportunity cost of capital, inflation and risk and uncertainty. For example, the
commercial interest rate is often used as the discount rate for private individuals. On the other
hand, it is often argued that communities as a whole have lower discount rates, as they are willing
to delay benefits longer, compared with private individuals. Discount rates for public projects often
vary between 5 and 10% (OECD and IEA, 1991). However, the Asian Development Bank uses a
discount rate of 10-12% in the economic analysis of proposed projects (ADB, 2001).
8 It is important to note that the ‘without project’ situation is not equal to the pre-project situation, since many variables will change over time, which are not directly attributable to the project.
[SOPAC Technical Report 397 – Woodruff]

[20]
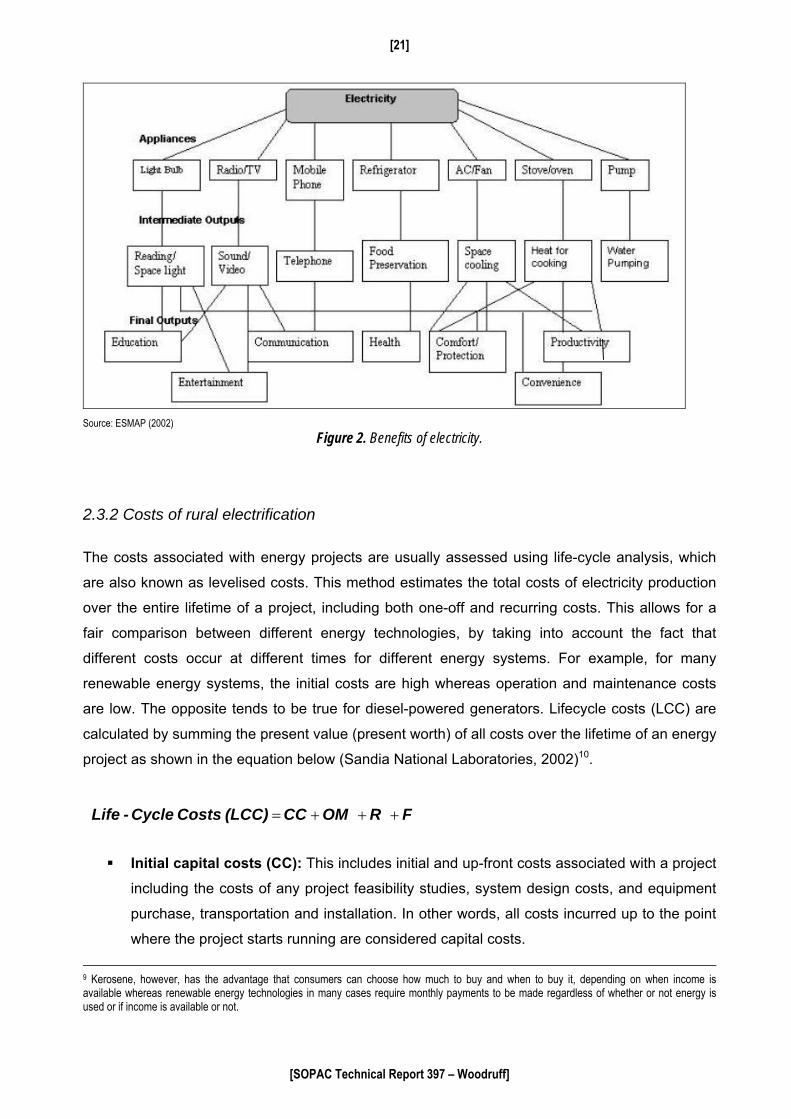
2.3.1 Benefits of rural electrification Electricity alone does not produce benefits, rather it is the services provided as a result of
electricity, such as lighting and household appliances, which yield benefits to energy users.
These benefits are illustrated in Figure 2.
Benefits fall under the following categories:
Improved Lighting: This may be in terms of better quality of lighting, or greater reliability of
lighting. For example, in the case of kerosene, if fuel is not available, it will not be possible
to operate lamps.
Education: improved lighting enables longer hours of study that may lead to improved
educational outcomes over time.
Health: This may come in the form of improved hygiene as a result of being able to store
food property or reduction in indoor pollution levels.
Entertainment and Communication: electricity allows for the use of devices such as radios,
mobile phones and video players.
Improved Productivity Levels: Household members may be able to engage in productive
activities for longer hours each day (e.g. weaving handicrafts) as a result of better quality
lighting at night; or saving time doing other domestic chores as a result of electrical
appliance use.
Increased Savings: costs avoided if electricity is cheaper than alternative, e.g. kerosene
and dry cell batteries9.
Improved safety as a result of the reduced risk from fires associated with the use of
kerosene lamps and fuel wood.
[SOPAC Technical Report 397 – Woodruff]
[21]
Source: ESMAP (2002)
Figure 2. Benefits of electricity.
2.3.2 Costs of rural electrification
The costs associated with energy projects are usually assessed using life-cycle analysis, which
are also known as levelised costs. This method estimates the total costs of electricity production
over the entire lifetime of a project, including both one-off and recurring costs. This allows for a
fair comparison between different energy technologies, by taking into account the fact that
different costs occur at different times for different energy systems. For example, for many
renewable energy systems, the initial costs are high whereas operation and maintenance costs
are low. The opposite tends to be true for diesel-powered generators. Lifecycle costs (LCC) are
calculated by summing the present value (present worth) of all costs over the lifetime of an energy
project as shown in the equation below (Sandia National Laboratories, 2002)10.
FROM CC (LCC)Costs Cycle -Life +++=
Initial capital costs (CC): This includes initial and up-front costs associated with a project
including the costs of any project feasibility studies, system design costs, and equipment
purchase, transportation and installation. In other words, all costs incurred up to the point
where the project starts running are considered capital costs.
9 Kerosene, however, has the advantage that consumers can choose how much to buy and when to buy it, depending on when income is available whereas renewable energy technologies in many cases require monthly payments to be made regardless of whether or not energy is used or if income is available or not.
[SOPAC Technical Report 397 – Woodruff]

[22]
Operation and maintenance costs (OM): This includes any costs associated with
maintaining and operating the project such as administrative costs, wages and transport
costs associated with operating the project.
Replacement costs (R): These are the costs of purchasing spare parts and the
replacement and repair of equipment.
Fuel costs (F): These include the market value of the annual costs of any fuel used,
(diesel or biofuel).
All costs are converted into present value terms. Also, for an economic analysis, any indirect and
non-monetary costs should also be considered.
2.4 Comparing Benefits and Costs
2.4.1 Benefit-cost analysis
When the benefits of a project can be valued, they are discounted and aggregated, and
compared with the associated aggregate costs over the lifetime of a project. Comparison between
project costs and benefits can be conducted in the following ways (ADB, 2001):
Benefit-cost ratio: compares the total discounted benefits of electrification with total discounted
costs, as a ratio, and provides an indication of the scale of return on the investment. This is done
by examining the ratio of the present value of benefits to the present value of costs. If the ratio of
benefits to costs is greater than one, the project can be viewed as desirable from an economic
point of view.
Net present value (NPV): compares the present value of project cost streams with the
associated present value of benefit streams. Rather than taking the ratio of benefits to costs, total
discounted costs are subtracted from total discounted benefits. If the resulting NPV is greater
than zero, then a project is determined to be economically viable.
Internal rate of return (IRR): identifies the discount rate at which the present value of the net
benefit stream is equal to the present value of the net cost stream. If the resulting IRR is greater
than the chosen discount rate, the project is deemed to be economically viable.
10 Note that in the rural Pacific Island context, salvage values are generally irrelevant due to high transport costs between islands. As a result, these are not subtracted from total life-cycle costs at the end of the project life.
[SOPAC Technical Report 397 – Woodruff]

[23]
2.4.2 Least-cost analysis Many of the benefits associated with rural electrification are non-market, which makes them
difficult to quantify in monetary terms. For example, in order to measure benefits from a rural
electrification project such as improved educational outcomes in monetary terms, data would be
needed on the earning potential of students, following graduation, living in a rural community
before and after the project was implemented; and this would have to be collected over a number
of years.
However, if it is assumed that the benefits of an electrification project are equal regardless of the
energy technology employed, energy options can be compared on the basis of cost alone. This
method, which is known as least-cost, or cost-effectiveness analysis is more straightforward and
less time consuming compared with benefit-cost analysis since it avoids the need to collect the
large amounts of data needed to identify and enumerate the benefits associated with each energy
option.
Least-cost analysis identifies the most cost-effective option for supplying electricity to meet
estimated demand. This involves identifying and ranking mutually-exclusive ways of producing
identical outputs of equal quality. Since it is assumed that benefits are equal, it is only necessary
to compare projects on the basis of the present value of their cost. Alternative project options can
be based on different technologies, designs, scales or time phasing (ADB, 2001).
2.4.3 Sensitivity analysis
In order to test the robustness of results obtained from the economic evaluation of electrification
projects, all analyses should undergo a sensitivity analysis. This involves varying the values, over
which there is some uncertainty, such as the choice of discount rate, the price of diesel, the fuel
efficiency of a diesel generator or life of batteries used in solar home systems, in order to assess
how robust the results of the analyses are to the underlying assumptions used.
2.5 Methodology Used in this Study
Given the difficulty of identifying all direct and indirect benefits associated with electricity projects
and quantifying them in monetary terms, this study uses least-cost analysis to assess the
economic viability of solar PV and micro-hydro systems for the Ha’apai Solar Electrification
Project and the Bulelavata Community Micro-hydroelectricity Project, respectively, when
compared with the conventional option of using decentralised diesel-powered generators to
[SOPAC Technical Report 397 – Woodruff]

[24]
supply electricity to rural areas. For simplicity, this approach compares renewable and
conventional energy technologies used for supplying rural households with electricity on the basis
of end-use, i.e. basic lighting or entertainment services, rather than the actual quantity of energy,
(in kWh) supplied by each type of system. For example, even though, diesel systems can
generally support larger loads compared with solar photovoltaic home systems, if both systems
are used to supply basic lighting to households in the evenings, the benefits from each system
can be viewed as equal. Comparisons between technologically feasible energy options are made
on the basis of total lifecycle costs over the estimated life of the project. Where relevant, the non-
quantifiable monetary benefits associated with each project are presented in descriptive form.
For a wind hybrid energy system used in the Mangaia Wind Energy Project in the Cook Islands,
that combines wind turbines with conventional diesel generators, benefit-cost analysis is used to
assess the optimal means of supplying electricity on the island. The costs associated with adding
the additional renewable energy generating capacity are compared with the benefits in terms of
fuel savings. The main project benefits are easy to measure since it is relatively straightforward to
calculate fuel savings in monetary terms.
Following the methodologies used in other economic analyses conducted in Pacific Island
Countries, including Greer (2006) and Lal and others (2005; 2006), this study uses a discount
rate of 10%.
The lifetime of a particular renewable energy project is assumed to be 20 years, based on the
average working life of selected renewable energy technologies. Also, for the purposes of
analysis, all values associated with the costs of purchasing, installing, operating and maintaining
various energy technologies have been converted into 2005 US dollar terms.
[SOPAC Technical Report 397 – Woodruff]

[25]
3. CONVENTIONAL OPTIONS FOR RURAL ELECTRIFICATION
3.1 Electrical Grid Extension
Extension of an existing electrical grid, where adequate capacity exists, is generally the preferred
option for supplying power to remote areas. In general, this option is preferred because it allows
for the provision of 24-hour power, minimises maintenance costs and maximises reliability and
efficiency, compared with smaller stand-alone diesel generators (Cheatham, 1990; NRECA,
2000). Unlike stand-alone energy options, there is virtually no limit on power consumption, so
enough electricity is provided to supply rural industries in addition to household lighting and
appliances (NRECA, 2000; ESMAP, 2000).
However, in the Pacific Island context grid
extension to supply rural areas with isolated
populations is generally not feasible due to the
long distances involved and low population
densities, especially in the case of remote outer
islands (Cheatham, 1990). For example, most
Fijian villages consist of 10-50 homes in isolated
areas where the distance to the grid is too far to
connect households at a reasonable cost (Wade,
1983). Cheatham (1990) estimated that grid
extension in the Pacific costs an average of
$12,000/km, which is extremely high when compared to the global average of $7,000/km
estimated by NRECA (2000).11
Figure 3. Electrical grid. (Source, NRECA, 2000)
Furthermore, in some countries the quality of power from the grid may be so poor that grid
extension is not desirable due to low reliability. Also, given the costs involved, grid-extension may
not be the best option in the short- to medium-term since communities may have to wait for years
while the government acquires sufficient resources to connect communities to the grid.
Consequently, interim measures are still needed to ensure access to electricity.
11 Cheatham (1990) estimated that the cost of grid-extension ranges from approximately $7,000/km for flat, open areas in the Pacific to 15,000/km in highland bush areas.
[SOPAC Technical Report 397 – Woodruff]
[26]
3.2 Decentralised Diesel-Powered Stand-alone Generators
When electrical grid extension is too costly, installation of decentralised diesel generators is
generally regarded as the next-best option for meeting the energy needs of rural consumers with
low energy demands in PICs (Cheatham, 1990; ESMAP, 2000). This is despite high fuel costs
and unreliable fuel delivery. For example, under Fiji’s Rural Electrification Programme in 2004, of
the 48 villages that were electrified, 42 were either supplied with diesel generators or connected
to the electrical grid, whereas only 6 villages were supplied solar PV systems (Fiji Department of
Energy, 2005).
Table 4. Different types of rural electrification schemes in Fiji 1975-1992. Electrification method Number of Schemes
1975-1992 1994-2002 Diesel 205 562 Grid Extension 0 260 Solar 0 13 Hydro 0 5 Hybrid 0 2 Source: Matakiviti and Pham (2003)
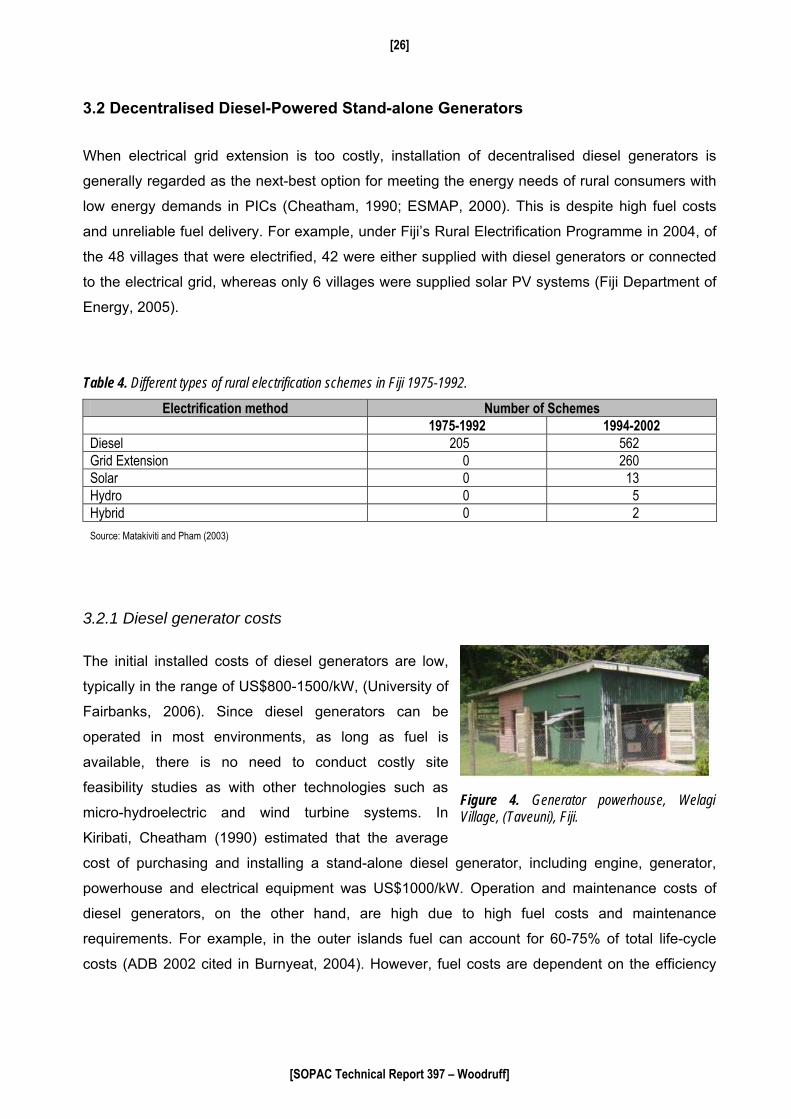
3.2.1 Diesel generator costs
The initial installed costs of diesel generators are low,
typically in the range of US$800-1500/kW, (University of
Fairbanks, 2006). Since diesel generators can be
operated in most environments, as long as fuel is
available, there is no need to conduct costly site
feasibility studies as with other technologies such as
micro-hydroelectric and wind turbine systems. In
Kiribati, Cheatham (1990) estimated that the average
cost of purchasing and installing a stand-alone diesel generator, including engine, generator,
powerhouse and electrical equipment was US$1000/kW. Operation and maintenance costs of
diesel generators, on the other hand, are high due to high fuel costs and maintenance
requirements. For example, in the outer islands fuel can account for 60-75% of total life-cycle
costs (ADB 2002 cited in Burnyeat, 2004). However, fuel costs are dependent on the efficiency
Figure 4. Generator powerhouse, Welagi Village, (Taveuni), Fiji.
[SOPAC Technical Report 397 – Woodruff]

[27]
and load of the generator. Efficiency is affected by age and maintenance, and in remote settings,
generator efficiency as low as 22% is not uncommon (Prasad, 1997).12
In general, diesel-powered generators provide the least-cost option for high, concentrated loads,
which are typically found in urban areas.13 According to Liebenthal and others (1994), the
operating costs of a village-scale diesel generator in a remote rural location can be estimated to
be approximately US$1-2/kWh, based purely on operating costs. This is about 3-4 times more
expensive compared with urban areas.
Decentralised diesel-powered generators are subject to
economies of scale, since the marginal cost of
connecting additional users to the mini-grid is low, as
long as sufficient capacity exists. As a result, average
costs tend to decline as the number of households
increases and/or demand for energy increases. The
latter is due to the fact that generators are more fuel-
efficient when the size of the load increases. This is
demonstrated by the figures presented in Table 5 for
diesel-generated power in French Polynesia.
Figure 5. Diesel generator, Vanua Balavu, Fiji.
Table 5. Cost comparison of diesel generators. Island kWh/day $US/kWh Number of households Takakoto 41 3.5 32 Nukutavaka 46 2.1 36 Fakahina 65 2.4 35 Tureia 72 2.7 35 Amanu 123 1.1 45 Makemo 230 1.1 81 Rikitea 452 0.74 100 Mataura 1600 0.56 234 Source: Coutrot (1987)
However, anticipated high growth in demand for power presents particular problems for diesel
systems, since if the generator is oversized initially due to anticipated growth in electricity use,
there will be poor fuel efficiency when lightly loaded, and maintenance costs will be higher per
12 The fuel efficiency of a diesel generator can be defined as the amount of power an engine can produce per amount of fuel it burns. The efficiency of a diesel engine can approach forty percent (University of Fairbanks, 2006). 13 The exception would be where large-scale production of hydro-electricity is possible.
[SOPAC Technical Report 397 – Woodruff]

[28]
unit. On the other hand an additional diesel generator will be required if demand exceeds the
capacity of a single generator, which raises electricity production costs.
3.2.2 Life-cycle costs of diesel generators To assess the life-cycle costs of diesel generators, the following assumptions based on estimates
provided by Wade and others (2002) for various Pacific Islands are used:
• Initial generator purchase and installation costs: US$1000/kW.14
• Cost of establishing a distribution system (to connect village of approximately 40
households): US$15,000.
• Operation and Maintenance costs: 5% of initial capital costs annually; engine overhaul
costs at 25% of initial capital costs every 5 years; generator and switching system
overhaul every 7 years at a cost of 20% of initial capital costs; and major engine
overhaul costs at 100% of initial capital cost every 10 years
• Life of generator is assumed to be 20 years.
• Fuel efficiency is assumed to be 0.2 litres/kWh (unless actual data on generator
efficiency is available).
3.2.3 Reliability and quality of service: In rural areas, diesel generators rarely operate for 24 hours per day because noise and high fuel
costs associated with lightly-loaded engines in keeping with the low demand for power during
night-time hours. Typically they operate 4-5 hours per day in the early morning and evening
(Matakiviti and Pham, 2003).
Diesel generators have high maintenance requirements, and reliability tends to be low in remote
settings due to a lack of locally-available spare parts and trained technicians (Liebenthal and
others, 1994). For example, diesel engines require routine inspections and adjustments, periodic
oil changes every 500-2,000 hours and major overhauls every 30-50,000 hours (University of
Fairbanks, 2006). A study conducted by the World Bank cited in Liebenthal and others (1994)
found the lack of adequately trained operators and mechanics to be a major factor in the poor
performance and short life of diesel generators, and that diesel generators generally operated
much less reliably, for shorter periods of time, and at higher costs, compared with other energy
technologies.
[SOPAC Technical Report 397 – Woodruff]
[29]
For example, in a remote Pacific Island context, in the event of mechanical failure, it can take up
to a month of technician time to repair and return a generator to service (Cheatham, 1990). Often
a technician must be brought to the remote site, the spare parts must be ordered, and then the
technician must return from considerable distances to install them. The entire process can take
months. For example, according to Liebenthal and others (1994), the result of a 1991 survey
conducted by Fiji Department of Public Works found that diesel generators were out of service for
an average of 77 days per year in remote locations in Fiji. The most common causes for
interruption in service were awaiting repairs and unavailability of diesel. Furthermore, often when
training is provided to local technicians on how to maintain and repair diesel engines, they are
more likely to migrate to urban areas, taking their skills with them.
14 Based on cost estimate provided by Cheatham (1990)
[SOPAC Technical Report 397 – Woodruff]

[30]
4. SOLAR ENERGY – PV SOLAR HOME SYSTEMS
Pacific islands have an abundance of solar resources. Solar radiation can be used to generate
electricity either through photovoltaic (PV) or thermal technology. This chapter explores the cost-
effectiveness of using solar PV systems, as a source of off-grid power, for producing electricity to
meet the energy demands of rural households.
4.1 Experience with Solar Power in the Pacific
Over the past two decades, PV systems have become the most widely adopted renewable
energy option for providing electricity to rural areas in the Pacific (Wade and others, 2005). Most
countries in the region have experimented with the use of solar PV systems for supplying
electricity to rural areas. However, early trials failed to live up to expectations due to short battery
life, poor maintenance, lack of financial sustainability and inappropriate institutional structures
(Liebenthal and others, 1994). However, more recently the use of PV systems to provide energy
services to rural households has been successfully demonstrated in the Pacific, especially by the
Kiribati Solar Electric Company, which has installed and maintained over 2,000 systems on
eighteen islands since 1984 (Akura, 2006).
4.2 PV System Technology
Solar PV systems convert sunlight directly into electricity using solar cells. On an annual basis, in
typical weather conditions, the average solar panel can generate approximately 4-5 hours of peak
power per day (Toyo Engineering Corp. and others, 2005). However, the size of the solar PV
system and available sunlight determines how much electricity is available for use.
The typical solar home system consists of a 20-100 Wp panel, a battery for storing the energy
generated during the day, a battery charge controller (to avoid excessive charging and
discharging), several fluorescent lights, and a power-point for connecting low-energy consuming
appliances such as a radio or television (Cabraal and others, 1996). A solar system many also
include an inverter, which allows AC appliances to be used. The simplicity of the system and low
maintenance requirements make PV systems an attractive option for supplying electricity in
remote areas (Owens, 2002). The typical setup of a solar home system is illustrated in Figure 6.
[SOPAC Technical Report 397 – Woodruff]

[31]
Source: Toyo Engineering Corporation and others (2005)
Figure 6. Components of a PV solar home system.
4.3 Costs of PV Systems
With improvements in technology and rising manufacturing levels, the cost of PV systems has
fallen significantly over time. For example, the cost of solar PV modules, on an average per peak-
Watt (Wp) basis, has fallen from $100 in 1970 to less than $5 in 2006 (Solarbuzz, 2006; Tenesol,
2006). It is expected that the price of solar modules will decline further to approximately US$1.50-
2.00/Wp within the next 10 years (Toyo Engineering Corp. and others, 2005).15
PV systems, despite their high initial capital costs, have very low operation and maintenance
costs. Also, with individual solar home systems, the need to construct costly transmission lines is
avoided. Typically, capital costs account for 75% of overall life-cycle costs, whereas annual
operation and maintenance costs account for 1% of the initial capital costs, excluding battery and
controller replacement costs (Cabraal and others, 1996; Foster and others, 1998). This contrasts
with stand-alone diesel generators in rural areas, where the initial purchase cost of a diesel
generator is low, but fuel and maintenance costs are significant.
The costs of PV systems increase proportionately with the size of the module and battery. The
module, which is the most important component, accounts for approximately 50-60% of total
system costs (Cabraal and others, 1996; Toyo Engineering Corp. and others 2005).16 Also,
15 This is based on the expectation of further technological improvements and a 20-30% increase in production volume. 16 Appropriate sizing of the solar system is important. Over-sizing the system can significantly raise costs. However, under-sizing a PV system can also increase overall life-cycle costs. For example if the panel is too small, the battery may be discharged too deeply, and will have to be replaced more often, thereby raising PV system costs.
[SOPAC Technical Report 397 – Woodruff]

[32]
although the initial capital cost of batteries is not significant, they must be replaced every 5-10
years, which raises the overall life-cycle costs associated with operating PV systems. As a result,
unlike diesel-powered systems, PV solar home systems benefit only from very slight economies
of scale, and solar rural electrification project costs increase both with the number of households,
and electricity demand per household (Reiche and others, 2000).
The costs of PV systems vary widely from country to country, as Table 6 shows, due to factors
such as sales volumes, dealer margins, maturity of local manufacturing and marketing
infrastructure, duties and taxes, level of competition, etc. For example Indonesia and China have
some of the lowest systems costs because of low duties and taxes, high sales volumes and low
manufacturing costs (World Bank, 2006; Cabraal, 1996). Also, in the Pacific, local manufacture of
batteries in Fiji, and controllers in Kiribati assist in keeping component costs low.
Table 6. Cost comparison of solar home systems by country (US$).
Panel Size (Wp)
China Philippines Indonesia Sri Lanka
India Kenya Zambia Average Cost ($/ Wp)
10 85 8.5 15 120 80.0 20 150 300 302 300 13.2 30 203 6.8 40 520 303 419 307 9.7 50 660 300-408 480 360 822 11.3 75 640 750-1000 686 11.5
Source: World Bank, 2006
Since the cost of energy generated by PV systems tends to be quite high on a per kWh basis,
and they do not enjoy economies of scale in energy production, PV systems provide the most
cost-effective technology option only under certain circumstances i.e. when demand for electricity
is low, the population is isolated, and fuel costs are high (ESMAP, 2000; Cabraal and others,
1996). Typically solar home systems are appropriate for households that currently use kerosene
for lighting and batteries to power small appliances such as radios and televisions. The average
household tends to consume approximately 0.5-1L of kerosene per day (15-30L per month) and
2-16 dry cell batteries per month (Cabraal and others, 1996). Under these circumstances,
switching to PV systems, when capital costs are subsidised, can lead to reduced household
energy expenditures (Cabraal and others, 1996).
[SOPAC Technical Report 397 – Woodruff]
[33]
Liebenthal and others (1994) find that in a remote Pacific context, where fuel transport costs and
maintenance requirements for diesel generators are high, PV systems are the least-cost option
for supplying electricity to rural areas when household demand for energy is low and load growth
is not expected to be significant. Similarly, in a case study of Kiribati, Cheatham (1990) finds that
in Kiribati, PV systems were the least-cost option for supplying basic electricity services to 250
households. On the other hand, stand-alone diesel generators were found to be the least-cost
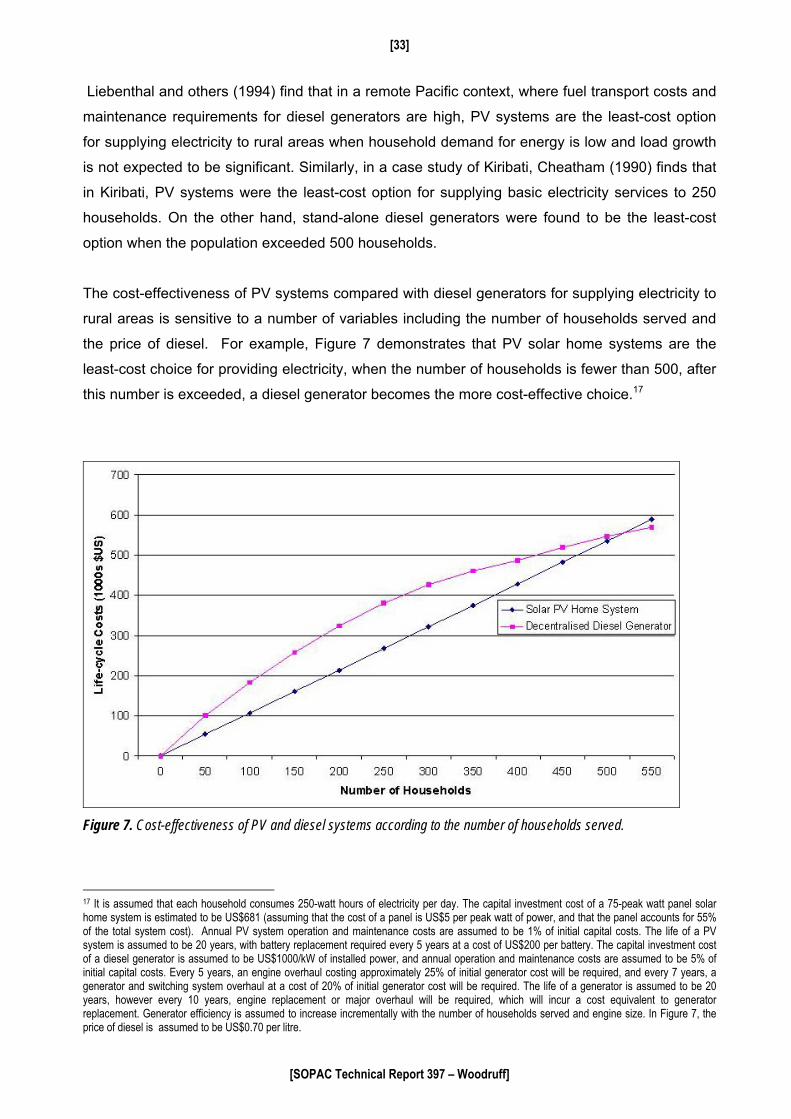
option when the population exceeded 500 households.
The cost-effectiveness of PV systems compared with diesel generators for supplying electricity to
rural areas is sensitive to a number of variables including the number of households served and
the price of diesel. For example, Figure 7 demonstrates that PV solar home systems are the
least-cost choice for providing electricity, when the number of households is fewer than 500, after
this number is exceeded, a diesel generator becomes the more cost-effective choice.17
Figure 7. Cost-effectiveness of PV and diesel systems according to the number of households served.
17 It is assumed that each household consumes 250-watt hours of electricity per day. The capital investment cost of a 75-peak watt panel solar home system is estimated to be US$681 (assuming that the cost of a panel is US$5 per peak watt of power, and that the panel accounts for 55% of the total system cost). Annual PV system operation and maintenance costs are assumed to be 1% of initial capital costs. The life of a PV system is assumed to be 20 years, with battery replacement required every 5 years at a cost of US$200 per battery. The capital investment cost of a diesel generator is assumed to be US$1000/kW of installed power, and annual operation and maintenance costs are assumed to be 5% of initial capital costs. Every 5 years, an engine overhaul costing approximately 25% of initial generator cost will be required, and every 7 years, a generator and switching system overhaul at a cost of 20% of initial generator cost will be required. The life of a generator is assumed to be 20 years, however every 10 years, engine replacement or major overhaul will be required, which will incur a cost equivalent to generator replacement. Generator efficiency is assumed to increase incrementally with the number of households served and engine size. In Figure 7, the price of diesel is assumed to be US$0.70 per litre.
[SOPAC Technical Report 397 – Woodruff]

[34]
4.4 Reliability of PV Systems
One major advantage that PV systems have over conventional diesel systems is that they do not
require imported fuel inputs, which reduces operating costs and improves system reliability where
transport is expensive and irregular. In addition, compared with diesel-powered mini-grid, solar
home systems are more reliable since only a single household loses power (Liebental and others,
1994). This is an important feature in remote areas of the Pacific where it can take weeks to
months to repair a diesel generator when it fails. Also the fact that PV systems need less
maintenance compared with diesel generators, which require costly overhauls at regular intervals,
makes them more reliable than the latter in remote settings where skilled technicians are scarce.
4.5 Case Study − The Ha’apai Solar Electrification Project, ‘O’ua Island, Tonga
In 2002, households on six islands in the
Ha’apai Group of Tonga (see Figure 8) gained
access to the electricity provided by solar PV
home systems. In total 169 systems were
installed under the Ha’apai Solar Electrification
Project (Wade and others, 2002). The Ha’apai
Solar Electrification Project was implemented
under the Pacific Rural Energy France
Australia Common Endeavour (PREFACE)
Project administered by SPC.
The Ha’apai Solar Committee was formed and
made responsible for managing the project,
including the overseeing of operation and
maintenance work, collecting user fees and
managing project funds. A technician on each
island was made responsible for carrying out
routine maintenance and repairs on PV
systems (SPC, 2003).
Source: http://www.worldtrip.de
[SOPAC Technical Rep
Figure 8. The Ha'apai Group, Tonga.
ort 397 – Woodruff]

[35]
Households were required to pay an initial US$10818 fee to have a PV system installed in their
homes. Monthly user fees intended to cover routine system maintenance, repair and replacement
costs were set at US$6 per month (SPC, 2003).
4.5.1 Background: geography and socio-economic conditions
The six islands that are part of the Ha’apai solar project are remote and only accessible by boat.
Weather can be unpredictable which makes transport both costly and unreliable between the
islands (SPC, 2000).
At the time that the feasibility study for the project was conducted, incomes per household ranged
from US$54 to $108 per week. In addition, ninety percent of households on the islands relied on
mat weaving and fishing as sources of income, as well as remittances from relatives. There is a
high rate of emigration from these islands, which has led to a population decline in recent years
(SPC, 2000).
4.5.2 PV system design
Each solar PV home system consisted of the following
components:
150 Wp PV array, consisting of two 75 Wp panels.
A 12 Volt-130 Amp battery.
Three 13-watt fluorescent tube lights (two indoor
and one outdoor).
Figure 9. Household PV System located on ‘O’ua Island, Tonga.
¼ Watt nightlight.
A 12-Volt power point to which a DC radio can be
connected.
Although the PV systems installed on ‘O’ua are able to meet the
basic energy needs of households- typically lighting and the use of
basic appliances such as a radio- they are unable to cater for larger
loads. Overall rates of collection of fees are high, which indicates that
user satisfaction with the electricity service provided is high (SOPAC,
Figure 10. PV System battery. 18 All values in US dollar 2005 terms unless specified otherwise
[SOPAC Technical Report 397 – Woodruff]

[36]
2006a). However, during interviews on ‘O’ua Island, residents did express a desire to be able to
eventually use more appliances such as washing machines and refrigerators. The number of PV
systems installed on each project island is listed in Table 7.
Table 7. List of PREFACE project islands and number of systems installed.
Island Number of Systems Fonoifua 24 ‘O’ua 38 Kotu 35 Tungua 32 Matuku 22 Fotuha’a 18 Total 169 Source: Wade and others (2002)
Some of the benefits which have been realised as a result of the solar energy project in ‘O’ua
include:19
• Quality of life: Previously, the majority of residents on these islands relied on kerosene
lamps and batteries to satisfy their energy needs. Households interviewed mentioned
several improvements in their quality of life. These included improved lighting, which has
allowed children to study more and for women to engage in weaving for longer hours at
night.
• Costs avoided: In addition, given the subsidised costs of the project, households have
also benefited from reduced energy expenditures. In ‘O’ua, the average household
previously spent about US$27 per month on kerosene, compared with an average of
US$5 and US$6 currently spent on kerosene and PV, respectively.
• Reliability: In terms of reliability, the only disruption in service, (until now) has occurred as
a result of light bulb failure. Since parts have to be brought from the main island of Pangai,
residents must sometimes wait several days to have bulbs replaced. However, this
problem could be easily resolved by keeping a stock of spare parts on each island.
19 This information was obtained during a field visit to ‘O’ua Island where household interviews were conducted.
[SOPAC Technical Report 397 – Woodruff]

[37]
4.5.3 Least-cost analysis: PV home systems vs. stand-alone diesel generator with mini-grid A least-cost analysis was conducted as part of the study in order to identify, which of PV or diesel
offered the most cost-effective means of supplying electricity to forty households in ‘O’ua, one of
the islands included in the Ha’apai Solar Electrification Project.
The initial capital costs of the solar home systems used in the project were estimated to be
approximately US$2,000 per system (Tunkunga, 2003). It is assumed that batteries must be
replaced after 10 years at a cost of US$243, and that operation and maintenance costs are
approximately 1% of the initial system costs per year. The contribution of each component to the
overall system cost is presented in Figure 11. For the purposes of analysis, project administration
costs and technicians’ wages are omitted from total operation and maintenance costs, since it is
assumed that these costs would be similar to a diesel project. The total present value of life-cycle
cost of the 150 Wp panel solar home systems was estimated to be approximately US$93,805 over
20 years for the solar PV home systems on ‘O’ua Island (see Appendix 1 for details).
13%
28%
7%8%2%11%
12%
12%7%
BatteryPanel (2)ControllerLights (4)Post WiringTransportLabourOther
Total installed cost = US$2000 per system
Source: adapted from estimates provided by Tukunga (2003)
Figure 11. Contribution of each PV system component to overall capital cost.
For the purposes of comparison, the costs of purchasing, installing, operating and maintaining a
diesel generator over a 20-year period on ‘O’ua was estimated. It was estimated that it would cost
approximately $36,000 to purchase and install a 36 kW diesel generator, and $15,000 to
construct a village mini-grid in ‘O’ua. Also, due to the low demand for electricity at night, it is
assumed that the generator operates for only 5 hours per day20. The cost of diesel in May 2006
20 The costs of running a diesel generator for a small remote village for 24-hours a day would be prohibitively expensive due to high fuel wastage in lightly-loaded engines.
[SOPAC Technical Report 397 – Woodruff]

[38]
on Pangai, the main town in the Ha’apai Group was US$1.20 per litre. However, the actual price
in ‘O’ua is likely to be higher due to high transportation costs. The total life-cycle costs of
operating a diesel generator were estimated to be approximately US$97,792 over 20 years (see
Appendix 1 for details).
Therefore, the present value of the life-cycle costs of individual solar PV home systems are less
than the costs associated with a diesel generator. It is important to note that the level of service
would be higher with a diesel generator compared with a PV system, since it would be able to
support higher loads. However, for the purposes of analysis, diesel and PV systems are being
compared on the basis of end-use i.e. basic lighting and entertainment/communication (from
radio) services.
4.5.4 PV system design considerations
As discussed above, the costs of PV systems increase proportionally with the size and number of
panels, so that larger PV systems rarely present the least cost option for rural electrification
compared with diesel. The Ha’apai solar project PV system design is unusual since a 150 Wp PV
array system was installed to provide basic lighting and communications (radio). In theory, a 75
Wp array would meet the basic electricity needs of households on ‘O’ua (see Appendix 1 for PV
system sizing considerations). The rationale for installing such large panels was to provide an
inexpensive means of providing street lighting during the night, by using outdoor lights on houses,
and to preserve the life of batteries (SOPAC, 2006a).
However, for the purpose of analysis, given that this end-use would not be available with a diesel
system, it will be assumed that each PV system is made up of a 75 Wp panel array, which does
not allow street lighting (for PV system sizing see Appendix 1 for details). Furthermore, as a result
of having smaller panels, it is also assumed that batteries must now be replaced every 5 years.
For 40 solar home systems, each with a 75 Wp panel array, the total life-cycle costs fall to
US$87,090 over 20 years.
Table 8. Summary of solar system and diesel generator life-cycle costs.
System Type Life-Cycle Costs ($US)
Diesel Generator (36 kW) 97,792
150 Wp Solar PV System 93,805
75 Wp Solar PV System 87,090
[SOPAC Technical Report 397 – Woodruff]
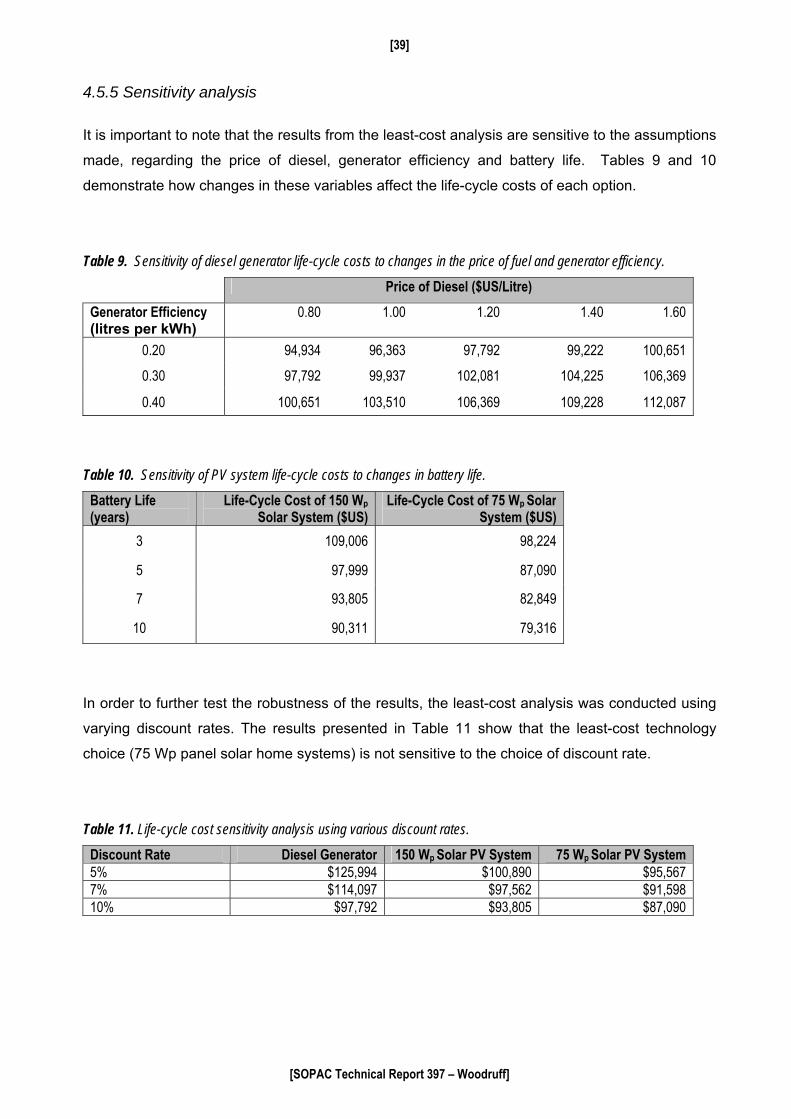
[39]
4.5.5 Sensitivity analysis
It is important to note that the results from the least-cost analysis are sensitive to the assumptions
made, regarding the price of diesel, generator efficiency and battery life. Tables 9 and 10
demonstrate how changes in these variables affect the life-cycle costs of each option.
Table 9. Sensitivity of diesel generator life-cycle costs to changes in the price of fuel and generator efficiency. Price of Diesel ($US/Litre) Generator Efficiency (litres per kWh)
0.80 1.00 1.20 1.40 1.60
0.20 94,934 96,363 97,792 99,222 100,651
0.30 97,792 99,937 102,081 104,225 106,369
0.40 100,651 103,510 106,369 109,228 112,087
Table 10. Sensitivity of PV system life-cycle costs to changes in battery life. Battery Life (years)
Life-Cycle Cost of 150 Wp Solar System ($US)
Life-Cycle Cost of 75 Wp Solar System ($US)
3 109,006 98,224
5 97,999 87,090
7 93,805 82,849
10 90,311 79,316
In order to further test the robustness of the results, the least-cost analysis was conducted using
varying discount rates. The results presented in Table 11 show that the least-cost technology
choice (75 Wp panel solar home systems) is not sensitive to the choice of discount rate.
Table 11. Life-cycle cost sensitivity analysis using various discount rates.
Discount Rate Diesel Generator 150 Wp Solar PV System 75 Wp Solar PV System 5% $125,994 $100,890 $95,567 7% $114,097 $97,562 $91,598 10% $97,792 $93,805 $87,090
[SOPAC Technical Report 397 – Woodruff]

[40]
4.5.6 Discussion and Conclusions
The results from this case study are consistent with much of the research conducted on the cost-
effectiveness of solar PV systems, which find that appropriately-sized PV systems represent the
least-cost choice of technology when they are serving remote communities of a small number of
households with small demands for electricity. In many rural areas, as per capita demand for
energy grows over time, especially as economic development proceeds and household incomes
grow, diesel systems usually become the most cost-effective option for electricity supply.
However, given the migration patterns from the outer islands in Ha’apai, growth in energy
demand may not be large enough to justify installing diesel generators even in the medium- to
long-term.
Other factors, which cannot be easily quantified in monetary terms, may also influence the cost-
effectiveness of solar PV systems. These include:
i. Increased reliability and energy security (when diesel generators fail or diesel fuel is
unavailable), for example, if women are unable to weave at night due to generator
failure, they would forfeit opportunities to generate income.
ii. Lower environmental costs such as less noise and pollution associated with the use of
solar PV systems.
iii. Longer hours of electricity with PV systems (however this must be weighted against
the fact that a diesel generator can support larger household loads).
iv. The use of PV systems for the provision of household electricity services can act as a
hedge against any future increase in oil prices.
[SOPAC Technical Report 397 – Woodruff]

[41]
5. MICRO-HYDRO ELECTRICITY
Hydroelectricity is one of the oldest applications of renewable energy, since the use of water
wheels for irrigation goes back over 2,000 years (ITDGb, no date). Micro-hydroelectric systems
provide a simple, low cost and independent source of electricity for remote rural communities.
Also, unlike large hydro schemes, micro-hydro systems do not require water catchments or
storage and therefore have no significant environmental impacts.
5.1 Micro-hydroelectricity System Technology
Unlike diesel generators, site-specific conditions that include seasonal variation in water flow,
determine the technological feasibility of a given micro-hydro scheme. As a result, detailed
hydrological studies must be carried out at the site before a potential project proceeds. In general
micro-hydro schemes are generally between 5-100 kW in size, whereas larger hydroelectric
schemes are at least 1 MW (ITDGb, no date).
The technology associated with ‘run of the river’ micro-hydro schemes is straightforward. A weir
or small dam is built across a river to trap and raise the height of the water. The water is then
diverted to a headrace or power canal, which is either an open canal or a low-pressure pipe. This
forces water into a forebay, where sediment and precipitate settle, before it enters the penstock, a
high-pressure pipe that carries the water to the turbine, which is generally located in a
powerhouse. When water hits the turbines, it forces them to spin, and the energy from falling
water is converted into rotational energy. Finally, a generator converts the rotational energy
produced by the turbine into electrical energy. The faster the flow of the river, the larger the
volume of water, and the higher the drop, the larger the potential for electricity production. The
amount of electricity produced by the system will be significantly reduced when water levels are
low. A diagram of the setup of a typical micro-hydro system is presented in Figure 12.
[SOPAC Technical Report 397 – Woodruff]

[42]
5.2 Mi
Hydroe
larger,
Vanuat
Federa
scale m
where
larger-s
electric
hydroe
Source: ITDG (n.d.)
Figure 12. Typical set-up of a micro-hydro system.
cro-hydroelectric Potential in the Pacific
lectricity is limited in its application in Pacific Islands, since it is generally only suitable for
mountainous islands in countries such as Fiji, Papua New Guinea, Solomon Islands,
u and on some islands in Samoa. There is also limited potential for hydropower in the
ted States of Micronesia, the Cook Islands and Tonga (Wade and others, 2005). Smaller-
icro-hydro schemes have even greater potential for rural electrification in Pacific Islands
dispersed and isolated populations do not allow for the economies of scale required for
cale hydro projects. Initial capital costs are very high and a high threshold level of
ity demand is required for larger-scale hydroprojects to be cost-effective. For a summary of
lectric schemes, which have been constructed in various Pacific Islands, see Table 12.
[SOPAC Technical Report 397 – Woodruff]
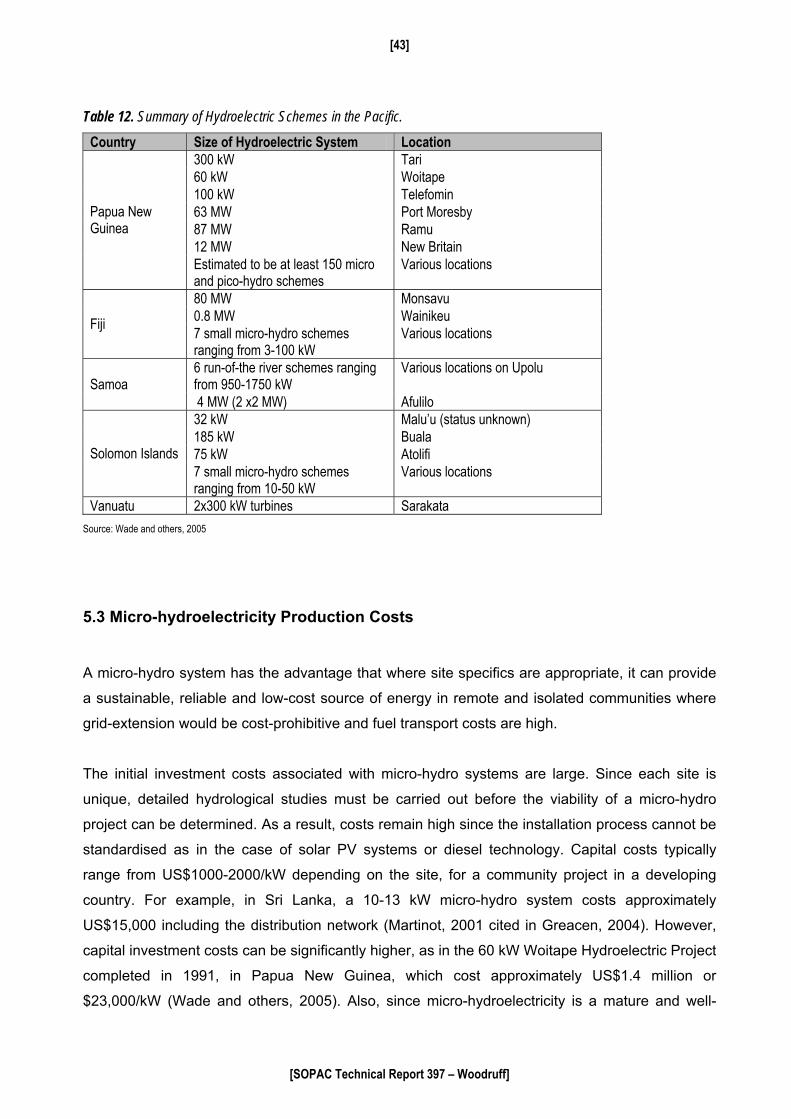
[43]
Table 12. Summary of Hydroelectric Schemes in the Pacific. Country Size of Hydroelectric System Location
300 kW Tari 60 kW Woitape 100 kW Telefomin 63 MW Port Moresby 87 MW Ramu 12 MW New Britain
Papua New Guinea
Estimated to be at least 150 micro and pico-hydro schemes
Various locations
80 MW Monsavu 0.8 MW Wainikeu Fiji 7 small micro-hydro schemes ranging from 3-100 kW
Various locations
6 run-of-the river schemes ranging from 950-1750 kW
Various locations on Upolu Samoa
4 MW (2 x2 MW) Afulilo 32 kW Malu’u (status unknown) 185 kW Buala 75 kW Atolifi Solomon Islands 7 small micro-hydro schemes ranging from 10-50 kW
Various locations
Vanuatu 2x300 kW turbines Sarakata Source: Wade and others, 2005
5.3 Micro-hydroelectricity Production Costs
A micro-hydro system has the advantage that where site specifics are appropriate, it can provide
a sustainable, reliable and low-cost source of energy in remote and isolated communities where
grid-extension would be cost-prohibitive and fuel transport costs are high.
The initial investment costs associated with micro-hydro systems are large. Since each site is
unique, detailed hydrological studies must be carried out before the viability of a micro-hydro
project can be determined. As a result, costs remain high since the installation process cannot be
standardised as in the case of solar PV systems or diesel technology. Capital costs typically
range from US$1000-2000/kW depending on the site, for a community project in a developing
country. For example, in Sri Lanka, a 10-13 kW micro-hydro system costs approximately
US$15,000 including the distribution network (Martinot, 2001 cited in Greacen, 2004). However,
capital investment costs can be significantly higher, as in the 60 kW Woitape Hydroelectric Project
completed in 1991, in Papua New Guinea, which cost approximately US$1.4 million or
$23,000/kW (Wade and others, 2005). Also, since micro-hydroelectricity is a mature and well-
[SOPAC Technical Report 397 – Woodruff]

[44]
established technology, unlike other newer renewable energy systems, its costs have generally
not fallen over the past 5 years (Toyo Engineering Corp and others, 2005). The typical
component costs for a micro-hydro scheme are presented in Table 13.
One major advantage of micro-hydro compared with conventional alternative sources of power, is
that operation and maintenance costs are very low (ITDGb, no date.). This makes electricity very
affordable to rural energy users if initial capital costs are subsidised. Also, the approximate life of
a micro-hydro system tends to be long compared with diesel-powered generators, which
minimises the overall life-cycle costs. The typical lives of 1-kW and 100-kW micro-hydro schemes
are 15 and 30 years, respectively (Toyo Engineering Corp. and others, 2005).
Table 13. Typical costs of a micro-hydro system.
Head 5 m – Power 5 kW Item Percentage of total Minimum Cost $/kW Plant 33% 330 Installation and commission 9% 90 Civil engineering 36% 360 Electrical engineering 6% 60 Design and management 7% 70 Contingency 10% 100 Total 1010 Source: Owens (2002)
5.4 Micro-Hydro System Reliability
Since micro-hydro systems require no fuel inputs other than water, when there is low variability in
water flows, reliability is higher compared with diesel systems that depend on the delivery of
regular fuel supplies to remote areas. Also, although regular inspection and maintenance of
micro-hydro systems is necessary, unlike diesel generators, these systems do not require major
overhauls every few years. In addition, micro-hydro systems can supply 24-hour power to remote
communities, which would be too costly to do using diesel generators in remote locations on
Pacific Islands because of high fuel costs. Micro-hydro systems with sufficient capacity are also
able to support high loads unlike other renewable energy systems such as solar PV home
systems. The micro-hydro technology is more sustainable in the medium- to long-term, since it
can meet growing household demand for electricity, and even supply electricity for small-scale
industrial activities.
[SOPAC Technical Report 397 – Woodruff]

[45]
5.5 Case Study − Bulelavata Micro-Hydroelectricity Project, Solomon Islands
Bulelavata is a remote community of approximately 300
people, located in the Western Province of the Solomon
Islands (Bryce and Soo, 2004). It is only accessible by sea,
which increases the cost and unreliability of fuel supply.
5.5.1 Project background
The Bulelavata scheme, which was constructed in 1999, is
one of a number of community micro-hydro schemes,
implemented in the Solomon Islands over the past 20 years,
with assistance from the Australian-based NGO,
Appropriate Technology for Community and Environment
(APACE). The Solomon Islands micro-hydro projects were implemented using the ‘Village First’
model developed by APACE that was designed to improve project success and sustainability by
promoting community ownership of the micro-hydro schemes. Under this model, communities
were required to make financial contributions towards carrying out feasibility studies, and donate
local materials and labour for the construction of micro-hydro systems. Once construction was
completed, the community would then retain ownership of the scheme and be responsible for
operating and maintaining the system, by ensuring that revenues received through fee collection
were sufficient to cover all project costs (Pio and Tutua, 2004). A list of all of the Village First
projects that have been or are being implemented in the Solomon Islands is presented in Table
14.21
Figure 13. Location of Bulelavata Village, Solomon Islands. (Source: University of Texas)
Table 14. Community Micro-hydro Schemes in the Solomon Islands.
Location Year Installed Turbine Capacity Generation (kW) Iriri Settlement 1983 10 kW 3-4 Vavanga 1994 10 kW 4-5 Ghatere 1997 12 kW Manawai Harbour 1997 50 kW 15-25 Bulelavata 1999 29 kW 14 Raeao 2002 25 kW 14 Nariaoa 2004 25 kW
Source. Johnston and Vos (2005)
21 Note that not all of these schemes are currently operating.
[SOPAC Technical Report 397 – Woodruff]
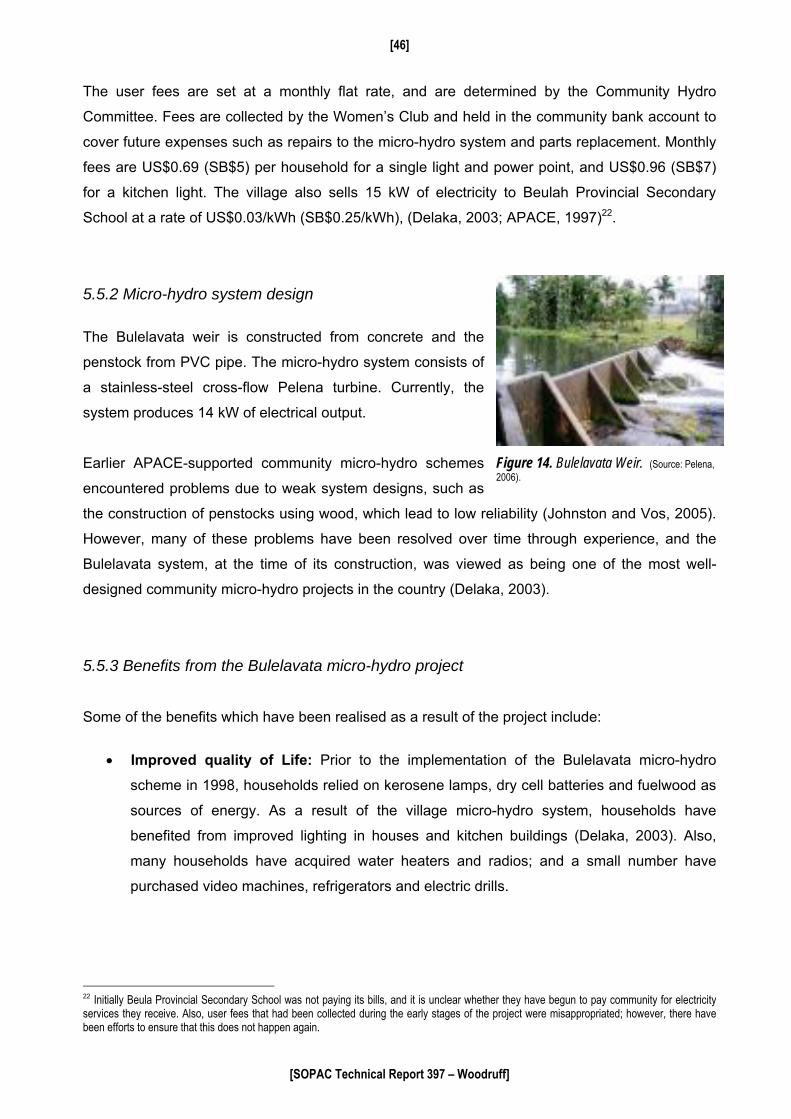
[46]
The user fees are set at a monthly flat rate, and are determined by the Community Hydro
Committee. Fees are collected by the Women’s Club and held in the community bank account to
cover future expenses such as repairs to the micro-hydro system and parts replacement. Monthly
fees are US$0.69 (SB$5) per household for a single light and power point, and US$0.96 (SB$7)
for a kitchen light. The village also sells 15 kW of electricity to Beulah Provincial Secondary
School at a rate of US$0.03/kWh (SB$0.25/kWh), (Delaka, 2003; APACE, 1997)22.
5.5.2 Micro-hydro system design
The Bulelavata weir is constructed from concrete and the
penstock from PVC pipe. The micro-hydro system consists of
a stainless-steel cross-flow Pelena turbine. Currently, the
system produces 14 kW of electrical output.
Earlier APACE-supported community micro-hydro schemes
encountered problems due to weak system designs, such as
the construction of penstocks using wood, which lead to low reliability (Johnston and Vos, 2005).
However, many of these problems have been resolved over time through experience, and the
Bulelavata system, at the time of its construction, was viewed as being one of the most well-
designed community micro-hydro projects in the country (Delaka, 2003).
Figure 14. Bulelavata Weir. (Source: Pelena, 2006).
5.5.3 Benefits from the Bulelavata micro-hydro project Some of the benefits which have been realised as a result of the project include:
• Improved quality of Life: Prior to the implementation of the Bulelavata micro-hydro
scheme in 1998, households relied on kerosene lamps, dry cell batteries and fuelwood as
sources of energy. As a result of the village micro-hydro system, households have
benefited from improved lighting in houses and kitchen buildings (Delaka, 2003). Also,
many households have acquired water heaters and radios; and a small number have
purchased video machines, refrigerators and electric drills.
22 Initially Beula Provincial Secondary School was not paying its bills, and it is unclear whether they have begun to pay community for electricity services they receive. Also, user fees that had been collected during the early stages of the project were misappropriated; however, there have been efforts to ensure that this does not happen again.
[SOPAC Technical Report 397 – Woodruff]
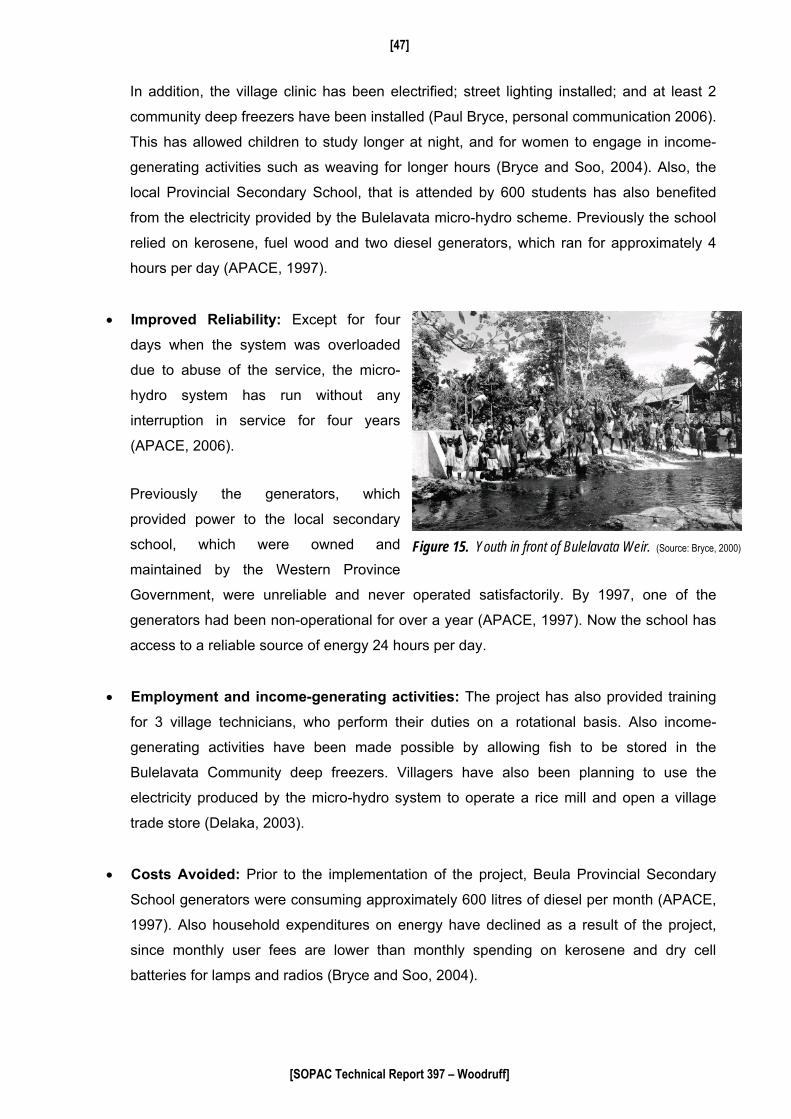
[47]
In addition, the village clinic has been electrified; street lighting installed; and at least 2
community deep freezers have been installed (Paul Bryce, personal communication 2006).
This has allowed children to study longer at night, and for women to engage in income-
generating activities such as weaving for longer hours (Bryce and Soo, 2004). Also, the
local Provincial Secondary School, that is attended by 600 students has also benefited
from the electricity provided by the Bulelavata micro-hydro scheme. Previously the school
relied on kerosene, fuel wood and two diesel generators, which ran for approximately 4
hours per day (APACE, 1997).
• Improved Reliability: Except for four
days when the system was overloaded
due to abuse of the service, the micro-
hydro system has run without any
interruption in service for four years
(APACE, 2006).
Previously the generators, which
provided power to the local secondary
school, which were owned and
maintained by the Western Province
Government, were unreliable and never operated satisfactorily. By 1997, one of the
generators had been non-operational for over a year (APACE, 1997). Now the school has
access to a reliable source of energy 24 hours per day.
Figure 15. Youth in front of Bulelavata Weir. (Source: Bryce, 2000)
• Employment and income-generating activities: The project has also provided training
for 3 village technicians, who perform their duties on a rotational basis. Also income-
generating activities have been made possible by allowing fish to be stored in the
Bulelavata Community deep freezers. Villagers have also been planning to use the
electricity produced by the micro-hydro system to operate a rice mill and open a village
trade store (Delaka, 2003).
• Costs Avoided: Prior to the implementation of the project, Beula Provincial Secondary
School generators were consuming approximately 600 litres of diesel per month (APACE,
1997). Also household expenditures on energy have declined as a result of the project,
since monthly user fees are lower than monthly spending on kerosene and dry cell
batteries for lamps and radios (Bryce and Soo, 2004).
[SOPAC Technical Report 397 – Woodruff]

[48]
5.5.4 Least-Cost Analysis: micro-hydroelectricity versus diesel system costs in Bulelavata
In order to determine the least-cost option for providing electricity for the rural community of
Bulelavata and the local provincial secondary school, the total life-cycle costs of installing,
operating and maintaining the micro-hydro system were compared with the hypothetical costs of
operating a diesel generator to supply electricity for Bulelavata Village and the nearby provincial
secondary school.
Life-cycle costs for diesel generators and micro-hydro systems
Most households have several basic lights, a number of houses have water heaters, and
several homes have refrigerators23. With the 24-hour power street lighting and deep
freezers provided by the micro-hydro system, it is estimated that total daily energy
consumption for an estimated 50 households is 140 kWh, including distribution losses (see
Appendix 2 for details). Alternatively, in the absence of the micro-hydro systems, and
assuming that electricity were supplied by a diesel generator for only 5 hours daily, demand
for electricity is estimated to be approximately 48 kWh per day.24
The initial capital costs of the micro-hydro project were approximately US$230,008
(APACE, personal communication, 2006 ). This included equipment purchase, shipping,
distribution system costs, labour, training, and local material costs.25 Operation and
maintenance costs for the micro-hydro system, including the costs of parts replacement,
based on current costs, are approximately US$103 per year or approximately 0.04% of
initial capital investment costs (Nixon Silas Pio, personal communication, 2006).26
Furthermore, the life of a micro-hydro system is estimated to be 20 years.
It is estimated that the total initial capital costs of installing generators and distribution lines
in the community and the school would be approximately US$85,00027. Using data on
diesel consumption rates of the Beula Provincial Secondary School generators, and
23 For the purposes of analysis, it is estimated that 10% of homes have refrigerators, and 30% have water heaters. 24 This figure is lower compared with the micro-hydro system, since it is assumed street lighting and deep freezers would not be provided. 25 In order to make a fair comparison with diesel generator costs, in-kind contributions and personnel costs were omitted from the capital investment cost calculations. 26 Operation and maintenance costs are based on the replacement costs of spare parts, grease and other expenses. 27 According to APACE (1997), the cost of building a transmission line to the school was $13,000, and it was estimated that constructing a village distribution system was approximately $15,000.
[SOPAC Technical Report 397 – Woodruff]

[49]
assuming that the village generator had an efficiency of 0.2 litres/kWh, it is estimated that
total fuel costs would be approximately US$11, 500 per year (See Appendix 2 for details). 28
The total life-cycle costs of the diesel generators over 20 years was estimated to be
US$267,842 compared with the total life-cycle costs of $229,794 for the micro-hydro system
(see Appendix 2 for details).
Table 15. Summary of micro-hydro system and diesel generator life-cycle costs.
System Type Estimated Total Life-Cycle Costs (US$) over 20 years Micro-hydroelectric system 229,794 Diesel Generators 267,842
5.5.5. Sensitivity analysis
In order to test the robustness of the results, a sensitivity analysis was conducted by re-estimating
the total life-cycle costs of the diesel generators using different generator fuel efficiency levels
and fuel costs. Except for the case when diesel costs $0.70 per litre and the generators have a
fuel efficiency of 0.20 L/kWh, the micro-hydro system presents the least-cost option for supplying
electricity to the community.
Table 16. Sensitivity of diesel generator life-cycle costs to changes in efficiency and fuel price. Price of Diesel ($US/Litre)
Fuel Efficiency of Generator (litres per kWh)
0.70 1.00 1.30 1.60
0.2 222,705 245,274 267,842 290,410
0.3 232,944 259,901 286,857 313,814
0.4 243,183 274,528 305,873 337,217
In addition, the least-cost option for electricity production in Bulelavata Village appears to be
insensitive to the choice of discount rate applied in the analysis as demonstrated by the results
presented in Table 17.
28 In May 2006, the price of a litre of diesel in the town of Gizo in the Western Province of the Solomon Islands was US$1.30 excluding taxes (Nixon Silas, personal communication, 2006). In reality, with added transportation costs, the cost of diesel is likely to be even higher in Bulelavata Village. A generator fuel efficiency of 0.35 litres per kWh was assumed.
[SOPAC Technical Report 397 – Woodruff]
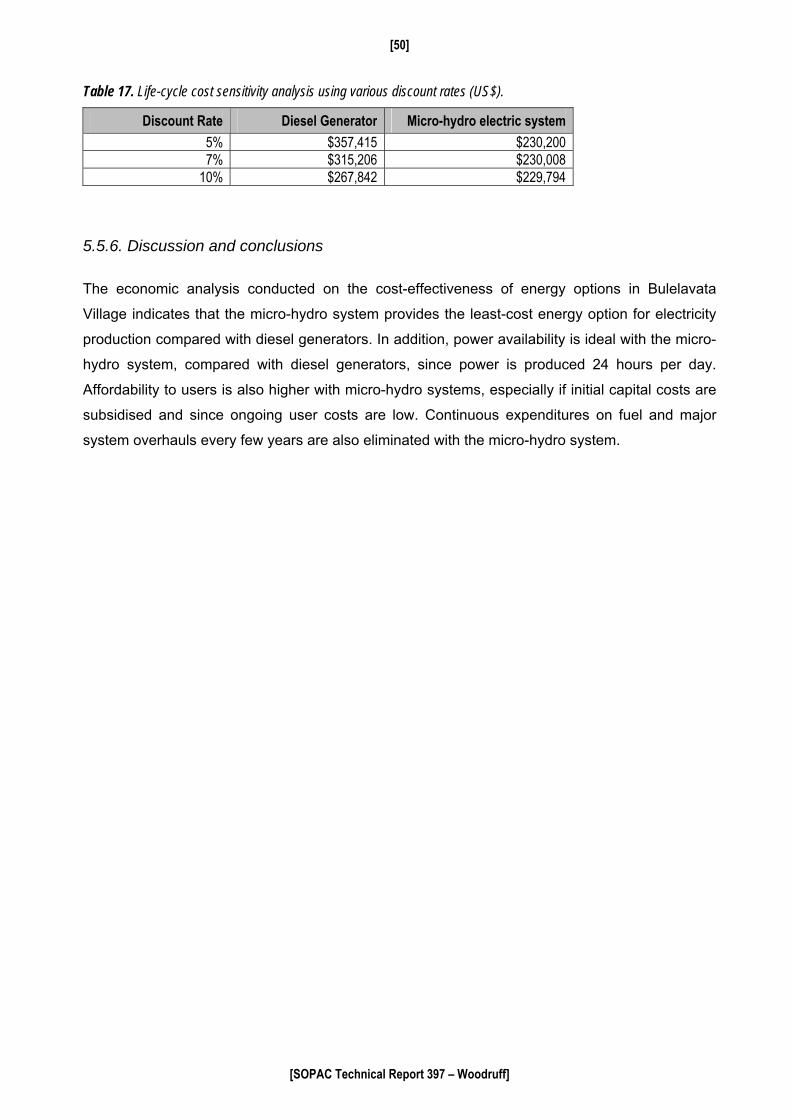
[50]
Table 17. Life-cycle cost sensitivity analysis using various discount rates (US$).
Discount Rate Diesel Generator Micro-hydro electric system 5% $357,415 $230,200 7% $315,206 $230,008
10% $267,842 $229,794
5.5.6. Discussion and conclusions
The economic analysis conducted on the cost-effectiveness of energy options in Bulelavata
Village indicates that the micro-hydro system provides the least-cost energy option for electricity
production compared with diesel generators. In addition, power availability is ideal with the micro-
hydro system, compared with diesel generators, since power is produced 24 hours per day.
Affordability to users is also higher with micro-hydro systems, especially if initial capital costs are
subsidised and since ongoing user costs are low. Continuous expenditures on fuel and major
system overhauls every few years are also eliminated with the micro-hydro system.
[SOPAC Technical Report 397 – Woodruff]
[51]
6. WIND ENERGY The use of wind to generate power dates back many centuries. In the 7th century AD the Persians
built windmills for milling and irrigation. Direct current wind-powered electricity was first developed
in 1888, however, it was not until the 1930s that the development of large-scale AC turbines
began. During the oil crises in the late 1970 and early 1980s, there was renewed interest in wind
energy, which led to the development of modern, highly-sophisticated wind turbines (ITDGa, no
date).
The potential for wind energy production is dependent on wind speed, which varies on a global,
regional and even local basis, often following seasonal patterns (Owens, 2002). This means that
detailed wind resource assessments must be carried out at a potential site before the feasibility of
wind energy project can be determined, since the potential for wind production is location
specific.29 Because of the intermittent nature of wind energy, the potential for electricity produced
by wind to completely substitute for conventional sources of power such as diesel generators in
rural areas is limited, so wind energy is better suited to supplement, rather than replace existing
electricity generation. In remote locations isolated from the grid, wind turbines are often combined
with PV or diesel systems to create a more reliable hybrid energy systems (ITDGa, no date).
However, this also adds to the complexity of the system that is problematic in remote areas where
there is highly likely to be a shortage of skilled technicians.
6.1 Wind Turbine Technology
A wind power turbine converts kinetic energy from wind into electric power through rotor blades
connected to a generator. Wind turbines can provide power ranging from 50W to more than 1.0
MW (ITDGa, no date). Wind turbines can be classified into two types, those whose blades rotate
on a horizontal axis, and those that rotate on a vertical axis, with the former being the most
common design (Economist, 2006). Blade lengths increase with the size of the wind turbines and
longer lengths result in more energy capture. Small wind turbines can be used for off-grid, mini-
grid, and grid-connected applications. On the other hand, larger wind turbines, are used
exclusively for grid-connected power supply.
The major components of a (horizontal axis) small wind turbine include (Toyo Engineering Corp
and others, 2005):
29 Because of seasonal variations in wind, surveying must be carried out over at least a one-year, and preferably, a two-year period.
[SOPAC Technical Report 397 – Woodruff]
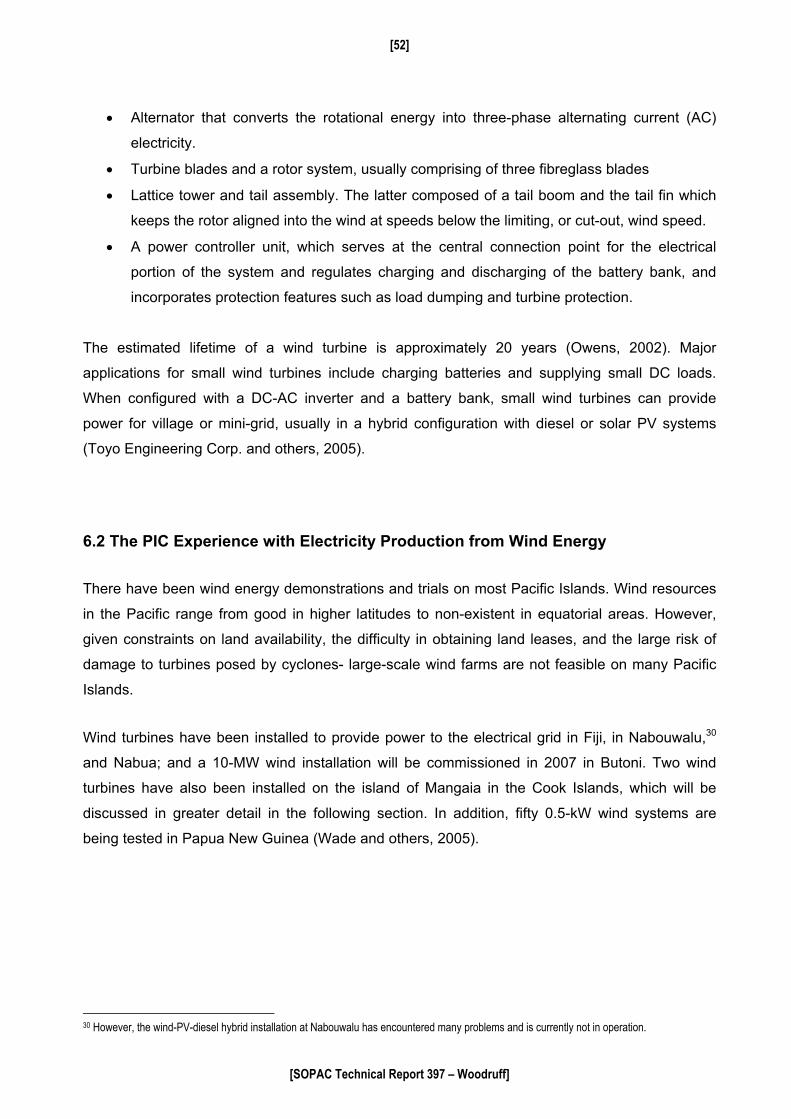
[52]
• Alternator that converts the rotational energy into three-phase alternating current (AC)
electricity.
• Turbine blades and a rotor system, usually comprising of three fibreglass blades
• Lattice tower and tail assembly. The latter composed of a tail boom and the tail fin which
keeps the rotor aligned into the wind at speeds below the limiting, or cut-out, wind speed.
• A power controller unit, which serves at the central connection point for the electrical
portion of the system and regulates charging and discharging of the battery bank, and
incorporates protection features such as load dumping and turbine protection.
The estimated lifetime of a wind turbine is approximately 20 years (Owens, 2002). Major
applications for small wind turbines include charging batteries and supplying small DC loads.
When configured with a DC-AC inverter and a battery bank, small wind turbines can provide
power for village or mini-grid, usually in a hybrid configuration with diesel or solar PV systems
(Toyo Engineering Corp. and others, 2005).
6.2 The PIC Experience with Electricity Production from Wind Energy
There have been wind energy demonstrations and trials on most Pacific Islands. Wind resources
in the Pacific range from good in higher latitudes to non-existent in equatorial areas. However,
given constraints on land availability, the difficulty in obtaining land leases, and the large risk of
damage to turbines posed by cyclones- large-scale wind farms are not feasible on many Pacific
Islands.
Wind turbines have been installed to provide power to the electrical grid in Fiji, in Nabouwalu,30
and Nabua; and a 10-MW wind installation will be commissioned in 2007 in Butoni. Two wind
turbines have also been installed on the island of Mangaia in the Cook Islands, which will be
discussed in greater detail in the following section. In addition, fifty 0.5-kW wind systems are
being tested in Papua New Guinea (Wade and others, 2005).
30 However, the wind-PV-diesel hybrid installation at Nabouwalu has encountered many problems and is currently not in operation.
[SOPAC Technical Report 397 – Woodruff]

[53]
6.3 Costs of Producing Wind Energy Wind energy production costs have been falling with wind turbine technology improvements that
has resulted in larger-sized wind turbines, larger blades, improved power electronics and taller
towers. The costs of utility-scale wind installations have fallen by 90% over the past two decades,
and the costs of wind energy production can be as low as $0.05/kWh (AWEA, 2001; AWEA,
2005).
Wind energy has been demonstrated to be competitive with both conventional sources of energy
and solar energy when produced on a large-scale, e.g. wind farms (Economist, 2006). However,
available wind resources, size of wind turbines and wind-speed are critical factors in determining
the amount of electricity produced by turbines, and therefore directly affect the cost-effectiveness
of wind energy. To be cost-effective, generally, an average annual wind speed of 6
meters/second (m/s) at 10 m height is required from large-scale wind turbines, and 5 m/s for
smaller wind turbines. The average cost of a wind turbine is about US$1000 per kW of capacity,
while the tower cost is approximately US$1500 per m. Installation costs vary with soil conditions
and the distance to the power grid, but are typically US$15,000 or less (Owens, 2002). Wind
energy can also be combined with PV or diesel systems, which may result in lower energy
production costs.
6.4 Case Study − Mangaia Grid-Connected Wind Farm, Cook Islands
Mangaia is the most southerly, and second largest island in the
Cook Islands. In October 2003, two 20-kW wind turbines were
installed in Mangaia under the Pacific Renewable Energy France
Australia Common Endeavor (PREFACE) Project. The turbines
are connected to the electrical grid, and are operated and
maintained by the Mangaia Power Utility (Cloin and Mario, 2004).
The purpose of installing wind capacity on the island was to utilise
wind resources in order to reduce the dependence of diesel-
powered electricity (SOPAC, 2006a).
Figure 16. Location of Mangaia, Cook Islands. (Source: Cloin and Mario, 2004)
[SOPAC Technical Report 397 – Woodruff]
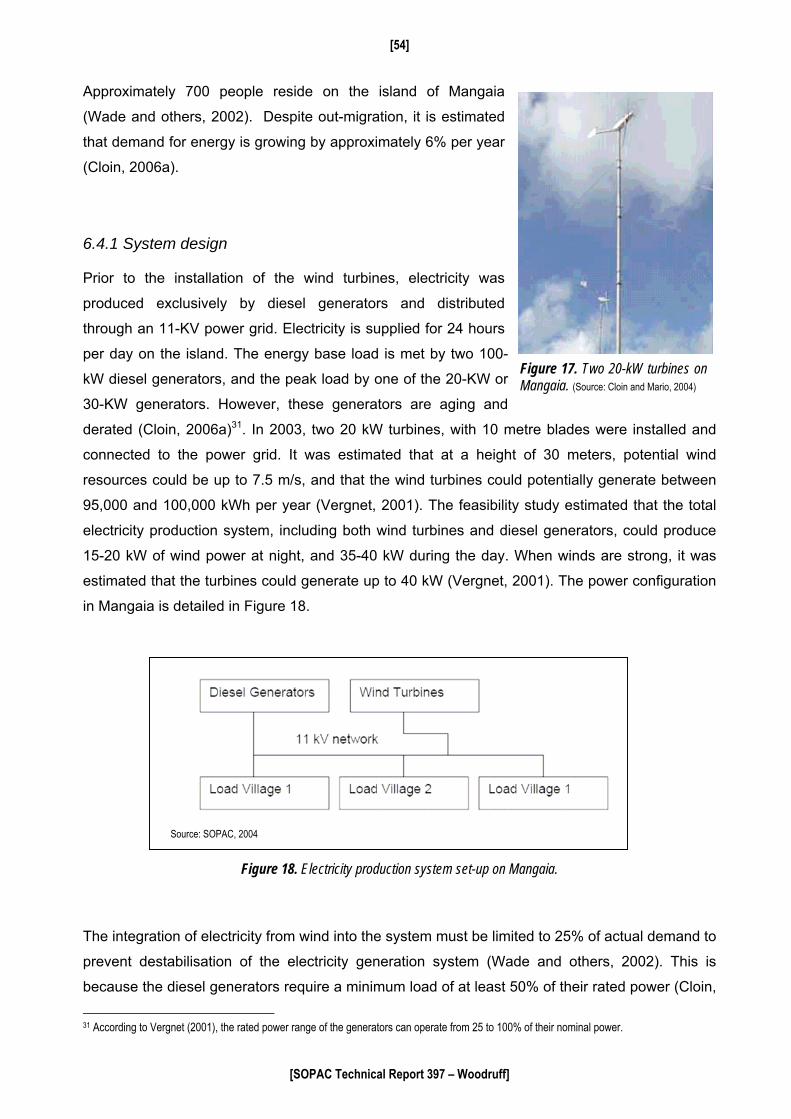
[54]
Approximately 700 people reside on the island of Mangaia
(Wade and others, 2002). Despite out-migration, it is estimated
that demand for energy is growing by approximately 6% per year
(Cloin, 2006a).
6.4.1 System design Prior to the installation of the wind turbines, electricity was
produced exclusively by diesel generators and distributed
through an 11-KV power grid. Electricity is supplied for 24 hours
per day on the island. The energy base load is met by two 100-
kW diesel generators, and the peak load by one of the 20-KW or
30-KW generators. However, these generators are aging and
derated (Cloin, 2006a)31. In 2003, two 20 kW turbines, with 10 metre blades were installed and
connected to the power grid. It was estimated that at a height of 30 meters, potential wind
resources could be up to 7.5 m/s, and that the wind turbines could potentially generate between
95,000 and 100,000 kWh per year (Vergnet, 2001). The feasibility study estimated that the total
electricity production system, including both wind turbines and diesel generators, could produce
15-20 kW of wind power at night, and 35-40 kW during the day. When winds are strong, it was
estimated that the turbines could generate up to 40 kW (Vergnet, 2001). The power configuration
in Mangaia is detailed in Figure 18.
Figure 17. Two 20-kW turbines on Mangaia. (Source: Cloin and Mario, 2004)
Source: SOPAC, 2005
Source: SOPAC, 2004
Figure 18. Electricity production system set-up on Mangaia.
The integration of electricity from wind into the system must be limited to 25% of actual demand to
prevent destabilisation of the electricity generation system (Wade and others, 2002). This is
because the diesel generators require a minimum load of at least 50% of their rated power (Cloin,
31 According to Vergnet (2001), the rated power range of the generators can operate from 25 to 100% of their nominal power.
[SOPAC Technical Report 397 – Woodruff]

[55]
2006a). Therefore, in order to avoid destabilising the system, one of the turbines must be
disconnected at night when the demand for electricity is low (less than 30 kW). Figure 19
presents the electricity demand profile on Mangaia for the 30th of December 2004, which
illustrates the maximum allowable contribution of wind energy to total production throughout the
day. The demand profile demonstrates that it is only for five hours per day (between 19.00 and
24.00 hours), that the wind turbines can contribute energy to the system up to their full potential of
40 kW.
6.4.2 Benefits of wind energy The main benefit of installing wind turbines in Mangaia is the significant diesel savings that this
project could potentially yield. Like other Pacific Islands, the Cook Islands are heavily dependent
on petroleum imports. The production of wind energy helps not only to reduce this dependence
on diesel fuel imports, but it also allows for hedging against future increases in the price of oil.
The increased contribution of wind power to overall production of electricity in Mangaia also
represents reductions in carbon dioxide emissions. Vergnet (2001) estimated that 240 tonnes of
greenhouse gas emissions would be saved over the life of the project, if the anticipated diesel
savings materialised.
Figure 19. Maximum allowable energy produced from wind in the Mangaia electrical grid.
(Source: Cloin, 2006a)
6.4.3 Life-cycle costs
[SOPAC Technical Report 397 – Woodruff]

[56]
Capital investment costs were estimated to be US$164,000, and operation and maintenance
costs approximately us$7,000 per year32. Thus, the total present value of the cost of the project
over its assumed 20-year life is estimated to be US$237,000 (Vergnet, 2001; see Appendix 3 for
details).
6.4.4 Actual diesel savings
Total energy requirements in Mangaia are approximately 1,149 kWh per day, with a peak demand
of about 128 KVA (Cloin, 2006a). During the period 2004-2005, the Mangaia Power Utility sold
approximately 386,472 kWh of power to its customers.33 Load profiles have only increased slightly
compared to what was expected at the time when the feasibility studies for this project were being
carried out. Diesel savings realised by the addition of the two wind turbines are dependent on the
energy actually produced by the turbines, which is determined by the amount of wind resources
available, the configuration of the power grid, and the capacity to integrate the maximum amount
of available wind energy produced by the turbines. During the feasibility stage of this project, it
was estimated that 30,000 litres of diesel could be saved with the addition of the two wind
turbines (Wade and others, 2002).
The contribution of the wind turbines to total energy production on Mangaia has been lower than
expected due to a sub-optimal power configuration, explained in the next section that has
reduced potential diesel savings (Cloin, 2006a). For example, using 2004-2005 data on energy
production, it is estimated that wind turbines produce an average of 2,317 kWh per month (see
Table 18 for details). As Figure 20 illustrates, the contribution of wind to total energy production
has been minimal. It is estimated that wind energy contributes approximately 6% to total energy
production, however it is important to note that there is significant variation in monthly contribution
rates.
32 Cost data was obtained from the Vergnet (2001) project feasibility study. 33 Mangaia wind and diesel energy production and sales data provided by Anthony Whyte.
[SOPAC Technical Report 397 – Woodruff]
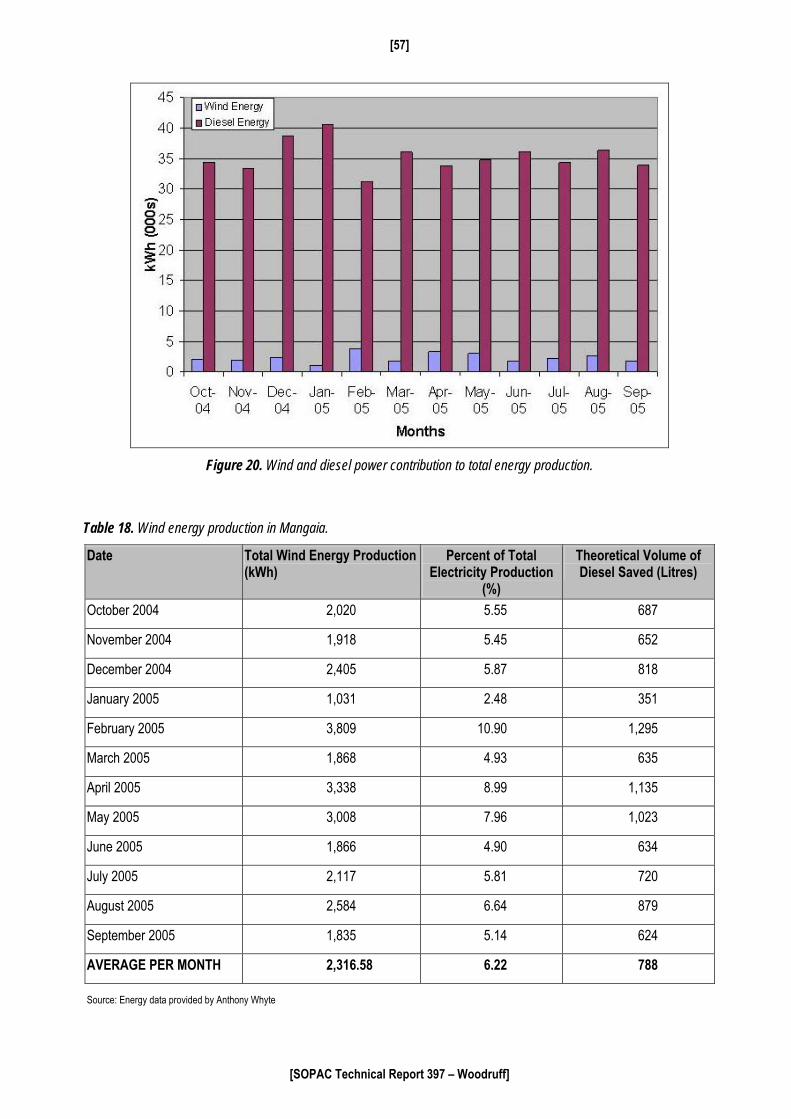
[57]
Figure 20. Wind and diesel power contribution to total energy production.
Table 18. Wind energy production in Mangaia.
Date Total Wind Energy Production (kWh)
Percent of Total Electricity Production
(%)
Theoretical Volume of Diesel Saved (Litres)
October 2004 2,020 5.55 687
November 2004 1,918 5.45 652
December 2004 2,405 5.87 818
January 2005 1,031 2.48 351
February 2005 3,809 10.90 1,295
March 2005 1,868 4.93 635
April 2005 3,338 8.99 1,135
May 2005 3,008 7.96 1,023
June 2005 1,866 4.90 634
July 2005 2,117 5.81 720
August 2005 2,584 6.64 879
September 2005 1,835 5.14 624
AVERAGE PER MONTH 2,316.58 6.22 788
Source: Energy data provided by Anthony Whyte
[SOPAC Technical Report 397 – Woodruff]
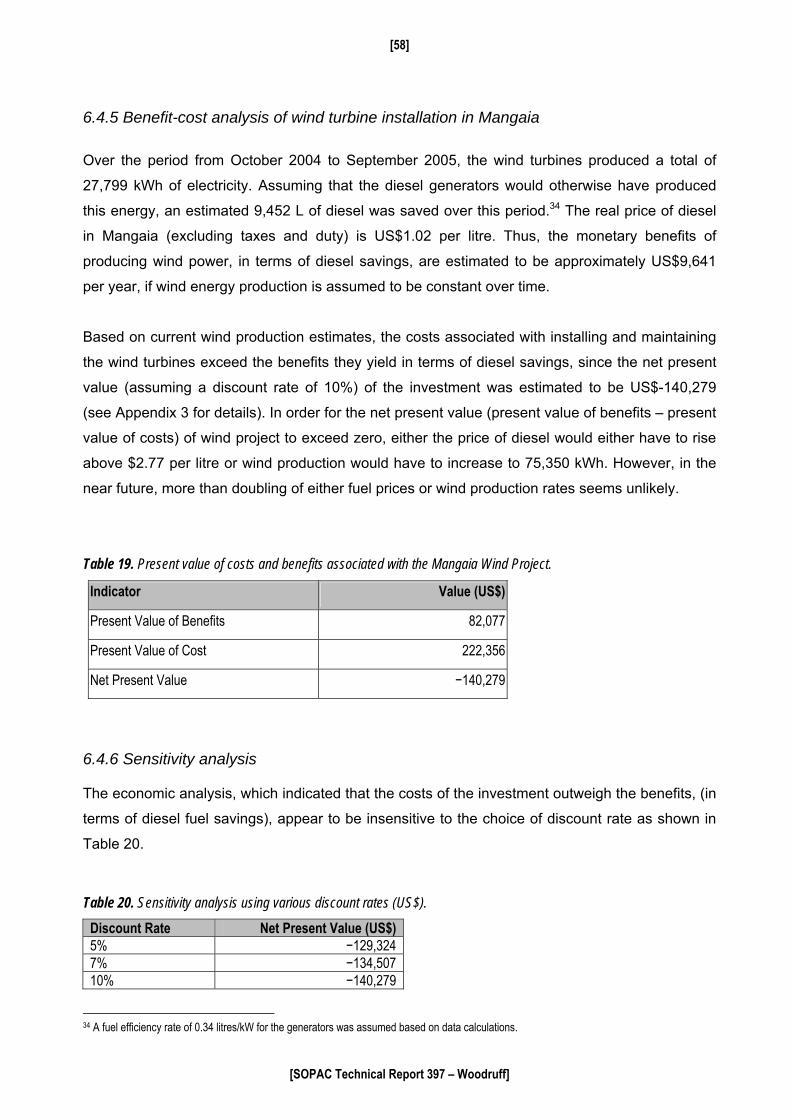
[58]
6.4.5 Benefit-cost analysis of wind turbine installation in Mangaia Over the period from October 2004 to September 2005, the wind turbines produced a total of
27,799 kWh of electricity. Assuming that the diesel generators would otherwise have produced
this energy, an estimated 9,452 L of diesel was saved over this period.34 The real price of diesel
in Mangaia (excluding taxes and duty) is US$1.02 per litre. Thus, the monetary benefits of
producing wind power, in terms of diesel savings, are estimated to be approximately US$9,641
per year, if wind energy production is assumed to be constant over time.
Based on current wind production estimates, the costs associated with installing and maintaining
the wind turbines exceed the benefits they yield in terms of diesel savings, since the net present
value (assuming a discount rate of 10%) of the investment was estimated to be US$-140,279
(see Appendix 3 for details). In order for the net present value (present value of benefits – present
value of costs) of wind project to exceed zero, either the price of diesel would either have to rise
above $2.77 per litre or wind production would have to increase to 75,350 kWh. However, in the
near future, more than doubling of either fuel prices or wind production rates seems unlikely.
Table 19. Present value of costs and benefits associated with the Mangaia Wind Project.
Indicator Value (US$)
Present Value of Benefits 82,077
Present Value of Cost 222,356
Net Present Value −140,279
6.4.6 Sensitivity analysis The economic analysis, which indicated that the costs of the investment outweigh the benefits, (in
terms of diesel fuel savings), appear to be insensitive to the choice of discount rate as shown in
Table 20.
Table 20. Sensitivity analysis using various discount rates (US$).
Discount Rate Net Present Value (US$) 5% −129,324 7% −134,507 10% −140,279
34 A fuel efficiency rate of 0.34 litres/kW for the generators was assumed based on data calculations.
[SOPAC Technical Report 397 – Woodruff]
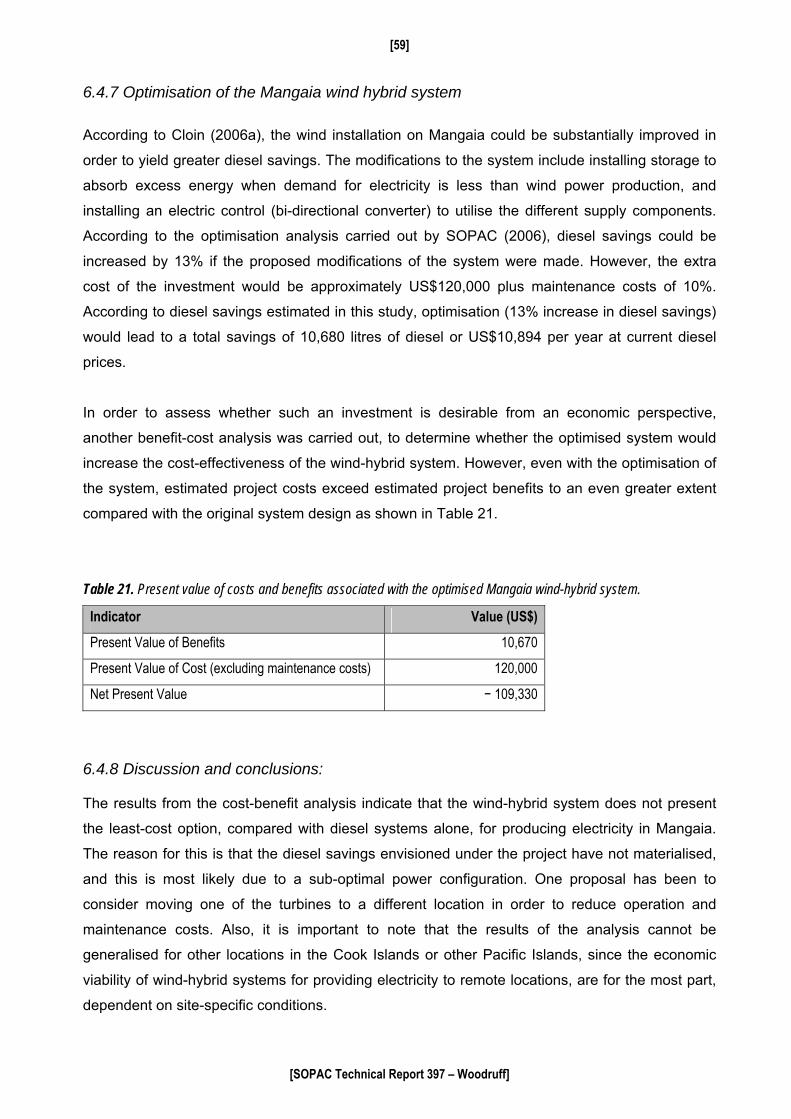
[59]
6.4.7 Optimisation of the Mangaia wind hybrid system According to Cloin (2006a), the wind installation on Mangaia could be substantially improved in
order to yield greater diesel savings. The modifications to the system include installing storage to
absorb excess energy when demand for electricity is less than wind power production, and
installing an electric control (bi-directional converter) to utilise the different supply components.
According to the optimisation analysis carried out by SOPAC (2006), diesel savings could be
increased by 13% if the proposed modifications of the system were made. However, the extra
cost of the investment would be approximately US$120,000 plus maintenance costs of 10%.
According to diesel savings estimated in this study, optimisation (13% increase in diesel savings)
would lead to a total savings of 10,680 litres of diesel or US$10,894 per year at current diesel
prices.
In order to assess whether such an investment is desirable from an economic perspective,
another benefit-cost analysis was carried out, to determine whether the optimised system would
increase the cost-effectiveness of the wind-hybrid system. However, even with the optimisation of
the system, estimated project costs exceed estimated project benefits to an even greater extent
compared with the original system design as shown in Table 21.
Table 21. Present value of costs and benefits associated with the optimised Mangaia wind-hybrid system.
Indicator Value (US$) Present Value of Benefits 10,670
Present Value of Cost (excluding maintenance costs) 120,000
Net Present Value − 109,330
6.4.8 Discussion and conclusions: The results from the cost-benefit analysis indicate that the wind-hybrid system does not present
the least-cost option, compared with diesel systems alone, for producing electricity in Mangaia.
The reason for this is that the diesel savings envisioned under the project have not materialised,
and this is most likely due to a sub-optimal power configuration. One proposal has been to
consider moving one of the turbines to a different location in order to reduce operation and
maintenance costs. Also, it is important to note that the results of the analysis cannot be
generalised for other locations in the Cook Islands or other Pacific Islands, since the economic
viability of wind-hybrid systems for providing electricity to remote locations, are for the most part,
dependent on site-specific conditions.
[SOPAC Technical Report 397 – Woodruff]

[60]
7. COCONUT BIOFUEL
The coconut tree is a vital component of island ecosystems and
economies, and traditionally copra has been an important source
of rural income on many Pacific islands. In recent years, another
important use of coconut resources has been identified, which is
the use of coconut oil as a biofuel substitute for diesel fuel.
Although the technology has been around for many years, it has
only been in the last 10 years, that there has been renewed
interest in using coconut oil as a biofuel in the Pacific (Cloin,
2005). The development of coconut oil as a renewable energy in
the region not only provides the opportunity to reduce reliance on
imported fossil fuels but also to provide rural communities with a
cost-effective source of energy, and to stimulate rural development by creating markets for
locally-produced coconut oil.
Figure 21. Coconut trees.
7.1 Coconut Biofuel Technology
Compared with other renewable energy technologies such as PV systems, the use of coconut oil
in modified and unmodified diesel engines has the advantage that the technology is familiar, since
diesel engines used in generators and vehicles are commonly found in remote areas of the
Pacific.
7.1.1 Use of pure coconut oil The use of un-modified vegetable oils as fuels, including copra oil, has been proved to be
technologically viable in short-term trials. Some trials have demonstrated that it is technically
possible to use pure coconut oil as a 100% substitute for diesel fuel in unmodified direct injection
engines. However, problems generally occur, especially when the generator load is below 60%,
because of the viscosity of coconut oil and incomplete combustion that results in carbon deposits
on pistons, valves and combustion chambers.35 Thus, when vegetable oil content in fuel blends
exceeds 20%, the long-term durability of engines is questionable (Cloin and others, 2005). As a
result, it is generally not recommended to use coconut oil/diesel blends without special
supervision.
35 With indirect injection engines, however, it is argued that such problems are avoided (Vaitilingom, 2006).
[SOPAC Technical Report 397 – Woodruff]

[61]
Diesel engines can be modified by making adaptations to the fuel supply system and injectors, by
installing a dual fuel tank system and a fuel heater, in order to avoid the problems encountered
using pure coconut oil as discussed above (CocoGen, 2005). This allows an engine to be started
on diesel fuel, and switched to coconut oil, once it has been heated to a temperature of 70-80
degrees Celsius and its viscosity has been reduced.36
7.1.2 Production of biofuel
It is important to note that the energy content of coconut oil is
lower than diesel since it requires approximately 1.08 litres of
coconut oil to produce the same amount of energy as 1 litre of
diesel. As a result, a larger volume of the former is required to
produce an equivalent amount of energy as the latter.
Coconut oil can either be produced using labour-intensive or
capital-intensive production processes. Coconut oil can also be
produced on a small-scale in rural areas with high labour inputs,
where copra is cut and dried manually, and is then heated, pressed and filtered to produce oil.
The entire coconut oil production process can be mechanised from the initial dehusking of whole
coconuts stage, through to the end product, where the only labour required is for the collection of
coconuts.
Figure 22. Biofuel generator, Vanua Balavu, Fiji.
One potential barrier to the development of coconut oil as an
alternative energy source, is the limited availability of copra,
since in many Pacific Islands, the copra industry has been in
decline for many years, due to a combination of volatile
prices, weak management, limited investment, natural
disasters and rising labour costs (CocoGen, 2005). As a
result copra production in many countries like Samoa, Tonga,
Papua New Guinea and Fiji, has virtually ceased, despite the
existence of abundant coconut resources. Therefore, the feasibility of using coconut oil as a
renewable energy in the region may depend not only on the viability of current technology, but
also on the revitalisation of the copra industry.
Figure 23. Coconut pile, Sawana Village, Vanua Balavu, Fiji.
36 Also, as the engine is about to switch off, the system again switches to diesel fuel to ensure that there is no coconut oil in the system when the engine is started again.
[SOPAC Technical Report 397 – Woodruff]
[62]
7.2 Experience in the Pacific
Interest in using coconut oil as a biofuel in Pacific Island Countries only began recently, and
successful trials in Fiji, Vanuatu and New Caledonia have shown this to be technologically viable.
However, experience with using coconut oil as a diesel substitute in rural electrification projects in
the Pacific to date remains limited. Rural electrification projects that have demonstrated the use of
coconut oil as a diesel substitute have been implemented in New Caledonia and Fiji. While the
New Caledonia experience with using coconut oil in adapted diesel generators has generally
been viewed as a success, Fiji’s experience, which is discussed in more detail in Section 7.4, has
been a mixed success (Courty 2000; SOPAC, 2006b). SOPAC and UNDP have recently initiated
biofuel projects in Samoa, Marshall Islands and Kiribati. Also, a feasibility study for using coconut
oil as a diesel substitute in Rotuma, as a follow-up to the ADB Renewable Energy and Energy
Efficiency Programme, was carried out in 2006 by the PIEPSAP.
7.3 Economic Impact
7.3.1 Macroeconomic impact of biofuel production
As already noted, fuel imports exert a large amount of pressure on the trade balances and the
foreign exchange reserves of many Pacific Island Countries, since they account for a significant
portion of total imports. The development of coconut oil as a viable substitute for diesel could
assist in addressing these macroeconomic imbalances.
At the same time, the widespread use of coconut oil as a fuel substitute could promote rural
economic development in Pacific Islands by creating a stable market for locally-produced copra.
At the moment, there is little incentive for copra production in Pacific Island Countries, except in
countries with low labour costs, since the world price of copra oil is very volatile as Figure 8
illustrates. For example, the halving or doubling of coconut oil prices within the period of one year
is not unusual, which discourages production since potential returns are very uncertain
(Etherington, 2005). In addition, Pacific Island producers only account for a small share of total
world coconut oil production, and are therefore ‘price-takers’ since they have no influence on
world price.
[SOPAC Technical Report 397 – Woodruff]
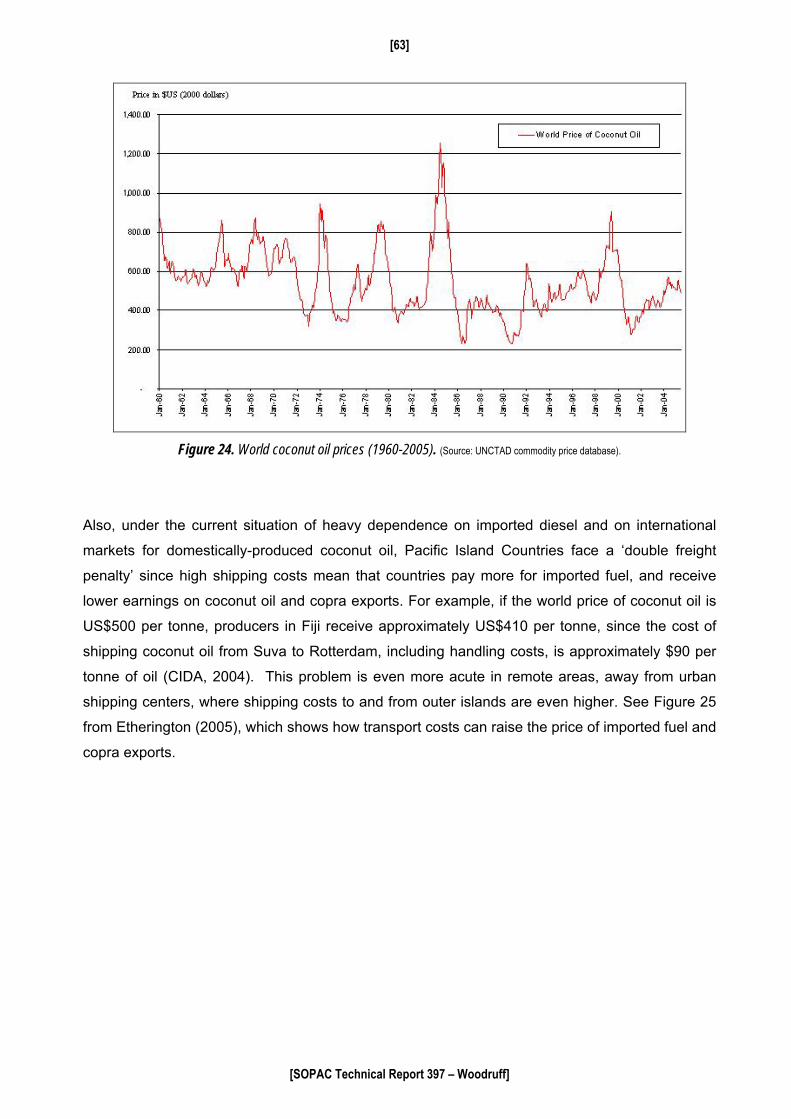
[63]
Figure 24. World coconut oil prices (1960-2005). (Source: UNCTAD commodity price database).
Also, under the current situation of heavy dependence on imported diesel and on international
markets for domestically-produced coconut oil, Pacific Island Countries face a ‘double freight
penalty’ since high shipping costs mean that countries pay more for imported fuel, and receive
lower earnings on coconut oil and copra exports. For example, if the world price of coconut oil is
US$500 per tonne, producers in Fiji receive approximately US$410 per tonne, since the cost of
shipping coconut oil from Suva to Rotterdam, including handling costs, is approximately $90 per
tonne of oil (CIDA, 2004). This problem is even more acute in remote areas, away from urban
shipping centers, where shipping costs to and from outer islands are even higher. See Figure 25
from Etherington (2005), which shows how transport costs can raise the price of imported fuel and
copra exports.
[SOPAC Technical Report 397 – Woodruff]

[64]
Source: Etherington, 2005
Figure 25. The effect of remoteness on fuel and coconut product prices.
For example, in Vanua Balavu, located in the outer islands in Fiji, energy consumers pay
approximately US$0.22 per litre extra to ship diesel from the main port of Suva. In addition, they
must pay approximately $57 per tonne of dry copra in shipping charges (Tevita Fotofili, personal
communication, 2005). The substantial price differentials between the cost of imported diesel and
price of coconut oil in PICs is illustrated in Figure 26.
Figure 26. Price comparison of diesel and local coconut oil prices in selected PICs.
(Source: Cloin, 2006b)
[SOPAC Technical Report 397 – Woodruff]

[65]
Therefore, there is a large potential for the substitution of diesel for coconut oil given abundant
coconut resources, and the price differentials between these commodities.
7.3.2 Micro-economic impact of biofuel production
However, at the local level, although there is a large potential for copra oil production in many
countries, such opportunities are not being exploited due to poor economic incentives. Copra
production in the Pacific has been regarded as a last-resort source of income, in the absence of
alternatives, because of the hard work involved and low returns (Etherington, 2005). With
advancing development in PICs, along with an expansion in economic opportunities, and
increasing remittance flows to rural areas, copra production has been abandoned in many places
in the Pacific, because of the increasing cost of labour. Coconuts are now used mainly to meet
household needs and for livestock (Etherington, 2005). Also, due to the relatively high value that
many people place on leisure time, relatively high returns must be offered in order to induce
individuals to spend time producing copra. However, if a local market for biofuel was created, this
could result in a rise in domestic demand for copra, leading to increased returns to copra
producers. Also, as an alternative to high-cost, labour-intensive production of coconut oil,
centralised production facilities have been created in several Pacific Islands to produce coconut
oil using industrial processes. Since labour inputs are minimised, it is possible to make a
reasonable profit. Therefore, the main challenge to the viability of using biofuel as a substitute for
imported diesel is to ensure that returns to copra producers are high enough to guarantee a
steady supply; while keeping coconut oil production costs low enough for biofuel to be price
competitive. If this can be achieved, coconut oil could present the least-cost option for rural
electrification when used in adapted diesel generators.
7.4 Case Study − The Fiji Biofuel Programme
7.4.1 Background
In order to promote rural electrification and sustainable livelihoods, and demonstrate the use of
biofuel as a substitute for diesel, the Fiji Department of Energy, with support from the Secretariat
of the Pacific Community and the French Government, installed specially adapted generators in
Welagi Village located on Taveuni Island in 2001, and in Sawana Village on the island of Vanua
Balavu, in the Northern Lau group, in 2000 (Courty, 2000).37
37 The biofuel generator installed in Vanua Balavu, although located in Sawana, is intended to supply electricity to the villages of Lomaloma, Sawana, and the settlement of Naquara.
[SOPAC Technical Report 397 – Woodruff]

[66]
The rationale behind the two demonstration projects was that by using locally-produced coconut
oil as a fuel for electricity generation, these communities could reduce their dependence on costly
diesel imports (Courty, 2000). Village committees were made responsible for overseeing the
operation and maintenance of the generators, as well as setting and collecting user fees in order
to promote project sustainability (Fiji Department of Energy, 2001). In Welagi, it was intended that
the village would produce its own coconut oil from its vast coconut resources, using the crusher
provided under the project to power the generator. In Vanua Balavu, it was expected that coconut
oil for the generator would be supplied from the local mill. Villages were required to cover 10% of
the initial capital costs, while the French Government provided funds for the generators and
coconut oil presses, and the Fiji Government covered the local and logistical costs associated
with the project setup.
Figure 27. Defunct Coconut oil mill in Vanua Balavu, Fiji.
7.4.2 Project design
Welagi was provided with a 45-kVA adapted generator and mini-grid intended to supply electricity
to 57 households; while a 95-kVA generator was installed on Vanua Balavu to supply power to
198 households, plus the hospital, the junior/secondary school and government quarters (Khan,
2005). Each household participating in the projects was supplied with two tube lights and a power
point.
7.4.3 Costs of coconut oil versus diesel
Given that biofuel and diesel employ virtually the same technology for electricity production, they
can be compared on fuel price differences alone, rather than on the basis of system life-cycle
costs. Since coconut oil is an exportable good, its economic price is equal to the price received by
[SOPAC Technical Report 397 – Woodruff]

[67]
the producer (world price) minus the costs of transport, handling and distribution, minus any net
taxes.
The figures below present the economic price trends for both wholesale automotive diesel, and
coconut oil over a 10-year period on Taveuni and Vanua Balavu, in Fiji (Jared Morris, Import
Management Adviser, PIFS, personal communication, 2005; UNCTAD commodity price
database).38 Figure 28 illustrates the fact that, on Vanua Balavu, where the cost of diesel is
approximately $0.22 higher per litre than at the main port of Suva, except for a brief coconut oil
price ‘spike’ between mid-1998 and 2000, coconut oil enjoys a clear price advantage over diesel
fuel.
Figure 28. Coconut oil and diesel fuel price comparison for Vanua Balavu, Fiji.
Similarly, in Welagi, on the island of Taveuni, coconut oil has a slight price advantage over
imported diesel as shown in Figure 29. However, since the cost of transporting diesel to the
island are much lower (US$0.04 per litre) compared with Vanua Balavu, the price difference
between the two commodities is narrower, and as a result coconut oil does not always have a
clear price advantage over diesel fuel.
38 Due to data availability, data is not taken at regular intervals. All prices have been adjusted for inflation; taxes and transport costs have also been subtracted from diesel and coconut oil prices. Fuel prices have been converted into US$ using the official FJ$/$US exchange rate, rather than the shadow exchange rate. However, given that the shadow exchange conversion factor for the $FJ/$US official exchange rate in recent years, (on average) has been approximately 0.95 (Lagman-Martin, 2004), the results from the analysis should not be significantly affected.
[SOPAC Technical Report 397 – Woodruff]

[68]
Figure 29. Coconut oil and diesel fuel price comparison in Taveuni (Welagi), Fiji.
In theory, rural communities served by stand-alone diesel-powered generators could switch
between using diesel and coconut oil depending on which fuel was less expensive. For example,
when diesel prices are low, locally-produced coconut oil could be sold for other uses. However,
supply contracts, which effectively commit buyers and sellers to purchasing a given quantity of
diesel or coconut oil at a certain price, may make it difficult to enjoy this flexibility.
7.4.4 Impact of the Fiji biofuel programme39
Access to electricity: Prior to the implementation of the biofuel project, residents in Welagi relied
on kerosene, benzene and small gasoline generators to meet their energy needs. This did lead to
quality of life improvements such as allowing children to study longer hours at night, and allowing
households to use refrigerators for food preservation.
Costs avoided: In Vanua Balavu, prior to the installation of the biofuel generator, the villages of
Sawana, Lomaloma and Naqara enjoyed access to electricity supplied by the diesel generator
operated by the now defunct coconut oil mill. However, it was hoped that with the implementation
of the biofuel project, substitution of diesel for locally-produced coconut oil would reduce the costs
of operating the generator.
39 This section is based on observations and conclusions from SOPAC (2006b)
[SOPAC Technical Report 397 – Woodruff]
[69]
To date neither of the project generators are running on coconut oil. The Welagi generator
currently runs on diesel and the Vanua Balavu generator, at the time of writing, was non-
operational (only for a brief initial period, did either the Welagi or Vanua Balavu generators run on
coconut oil). The reasons for the demonstration projects not operating as intended include both
economic and non-economic factors.
Obstacles to the use of locally-produced coconut oil for electricity production
i. High opportunity cost of labour: the returns to copra production, which is processed
into coconut oil, are very low. Currently residents in Welagi can earn much higher returns
producing dalo for sale, and using the proceeds to purchase either diesel or commercially-
produced coconut oil; rather than using this time to produce coconut oil themselves for use
in the biofuel generator (for details see SOPAC, 2006b). In Vanua Balavu, remittances from
Suva and abroad reduce the incentives for copra production.
ii. Supply constraints: there is no longer a local supply of coconut oil available on Vanua
Balavu, due to the closure of the coconut oil mill in 2000; and as a result, shipping costs
from Vanua Levu make coconut oil more expensive than diesel, which was sold at
approximately F$1.80 per litre at the time the research for this study was being conducted.
Also, in Welagi, the local coconut oil producer, who produces mostly for niche export
markets is apparently reluctant to supply fuel for the village generator (Intiyaz Khan,
personal communication, Senior Scientific Officer, Fiji Department of Energy, 2006).
It is vital that a local supply of coconut is available for these projects to be viable. Otherwise
imported coconut oil from other islands can become more costly than importing diesel due
to weak distribution networks. However, there seems to be a fundamental trade-off between
ensuring returns to copra production are high enough to induce an adequate local
production of copra, while maintaining the price of coconut oil at a low enough level to
compete with diesel.
7.4.5 Discussion and conclusions
In theory, coconut oil presents the least-cost choice compared with diesel in Fiji’s remote outer
islands, where transport costs are very high. At the micro-level in the villages that were examined
as part of this study, the high opportunity cost of labour and other supply constraints reduce the
economic feasibility of using locally-produced coconut oil for electricity production. However,
[SOPAC Technical Report 397 – Woodruff]

[70]
similar biofuel projects for rural electrification could be feasible if a certain set of conditions held.
First, if labour costs were low, production costs would be minimised, which would keep the price
of coconut oil competitive with diesel. Second, if coconut oil production was centralised and
mechanised, economies of scale could be achieved, and labour inputs minimised, thereby
increasing its price competitiveness. Third, the location of a biofuel project would have to be
isolated enough so that transports costs would make diesel imports very costly.
On the other hand, the introduction of coconut oil production subsidies, which would assist in
making locally-produced biofuel more competitive with diesel, may be justified on public goods
grounds, since switching from the use of diesel to coconut oil would not only have environmental
benefits, but would also reduce dependence on imported fossil fuel and help to hedge against
future oil price increases.
[SOPAC Technical Report 397 – Woodruff]

[71]
8. CONCLUSIONS AND RECOMMENDATIONS
8.1 Conclusions
Pacific Islands face an enormous challenge in supplying electricity to rural areas, particularly in
remote areas, where electrical grid extension is not economically feasible due to the high costs
involved. At the same time, access to basic electricity services is regarded as a necessary
condition for sustainable development. In the Pacific Region, many rural households lack access
to modern forms of energy, although the proportion of the population with access to electricity
varies considerably from country to country.
Currently, Pacific Islands are heavily dependent on imported fossil fuels for meeting the bulk of
their energy needs. However, this situation is likely to be unsustainable in the long run with rising
fuel costs and the growing trade deficits faced by many Pacific Island Countries. Renewable
energy technologies, used in a number of demonstration projects, including solar, wind,
hydropower and coconut biofuel have proven to be technically feasible options for electricity
production in remote locations in recent years,. Furthermore, the results from this study indicate
that renewable energy technologies can provide a cost-effective means of supplying electricity to
rural areas, where distances are high, and population densities and per capita demand for energy
is low.
It is important to highlight that there is not one technology that is least-cost, and it is very much
dependent on local conditions, and renewable resource availability. Also, the hours of service,
and energy loads that can be supported at any point in time, vary considerably between different
energy options
In addition to the direct energy cost savings associated with renewable energy technologies,
other benefits, which are not measured in this study, may include increased reliability of energy
services, longer hours of daily service, reduced noise and pollution, and increased energy
independence. Also, with more widespread use of renewable energy technologies in place of
conventional fossil fuel-based alternatives, Pacific Island Countries can assist in addressing
global climate change by limiting their green house gas emissions.
[SOPAC Technical Report 397 – Woodruff]

[72]
8.2 Recommendations Although, renewable energy technologies have been demonstrated to offer a cost-effective
source of energy for rural electrification, the greatest barriers to their wider use in rural
electrification strategies are institutional in nature. It is critical to develop effective models for
managing renewable energy projects in order to ensure their long-term sustainability. In
particular, projects should be designed to ensure that equipment is properly maintained, and that
user fees are both collected and set to a level, which ensures that projects are financially
sustainable. It is important that experiences with different institutional models applied to
renewable energy projects in Pacific Island Countries are shared between countries, so that
successful models can be replicated and adapted to local conditions in future projects, and the
repetition of past errors avoided.
Also, in order to promote the use of renewable energy technologies, countries should develop
policies, which ensure that renewable energy technologies are adequately considered as options
in energy planning. For example, only Palau requires the utility to consider renewable energy
options in the development of energy plans (Wade and others, 2005).
Finally, since the start-up costs associated with renewable energy technologies tend to be high, it
is recommended that policies be introduced, which assist in lowering the initial costs. This is
another major barrier to their use. Lowering initial costs can be achieved in a number of ways
such as through the use of cost-sharing schemes, import tax exemptions, the provision of soft
loans, or increasing users’ ability to pay for energy, through the introduction of income-generating
schemes in conjunction with electrification projects. It is important to ensure that rural
electrification strategies are integrated into national development plans because of the investment
trade-offs between sectors, given the limited availability of resources.
[SOPAC Technical Report 397 – Woodruff]
[73]
REFERENCES AWEA. 2001. Comparative Cost of Wind and Other Energy Sources. Factsheet.
http://awea.org/pubs/factsheets/cost2001.pdf
AWEA. 2005. The Economics of Wind Energy. Factsheet. http://www.awea.org/pubs/factsheets/economicsofwind -feb2005.pdf
ADB. 2001. Guidelines for the Economic Analysis of Projects. Manila: Asian Development Bank. ADB. 2005. Economic Outlook. Manila, Asian Development Bank.
http://www.adb.org/Documents/Books/ADO/2005/default.asp Akura, T. 2006. Private Sector Involvement: The Renewable Energy Service Company Approach
in Kiribati. Presentation made at the Asian Development Bank Renewable Energy and Efficiency Workshop, CATD, Nadave, Fiji, 20-24 February 2006.
APACE. 1997. Biulah PSS Hydro-electric Extension Costs and Benefits. Report prepared for the
Western Province Assembly. Sydney, APACE. APACE. 2006. Bulelavata Project Details. Available on website at http://www.apace.uts.edu.au/docpublish/bulelav_det.html. Bengaly, S., Bertarelli, L., Boyce, J., Hammond, A.B., Cornland, D., Derrick, A., Graham, J.,
Lazarus, M., Leach, G., Ruggeiro, M., Shanker, A. & Sokona, Y. 1999. Energy as A Tool for Development for African, Caribbean and Pacific Countries. European Commission and United Nations Development Programme, New York.
Blair, C. 2004. A Technology Assessment using Actor-Network Theory to Analyse the Potential
for Coconut Oil Bioenergy in the Fiji Islands. MSc Dissertation, Centre for Environmental Technology, Imperial College of Science, Technology and Medicine, University of London.
Bryce, D. 2000. Community Action for Renewable Energy. Tiempo. Issue 36/37.
http://www.cru.uea.ac.uk/tiempo/fllor0/recent/issue/3637/t3637a5.htm. Bryce, D. and Ching Soo, C. 2004. Bulelavata Women Speak. Energia, 6(2), pp.19-20. Bryce. 2000. Bulelavata Integrated Community Development and Energy Supply Project: the
Village First Program, A Development Initiative Using Renewable Energy Technology for Rural Villages in the Solomon Islands. APACE Activity Report and Financial Acquittal.
Burnyeat, W. 2004. What’s Next for the Tree of Life? A Socio-Economic Analysis of Coconut Oil
as a Potential Substitute for Diesel in Tuvalu. MSc. Dissertation.
California Energy Commission. 2006. Glossary of Energy Terms. http//www.energy.ca.gov/glossary/index.html Cabraal, A., Cosgrave-Davies, M. and Schaeffer, L.1996. Best Practices for Photovoltaic
Household Electrification Programs. World Bank Technical Paper Number 324. World Bank, Washington DC.
Cheatham, C. 1990. A Comparison of Grid Extensions, Stand-Alone Diesel Generators, and
Photovoltaics for Rural Electrification: A Case Study of North Tarawa”. Prepared for the
[SOPAC Technical Report 397 – Woodruff]

[74]
Pacific Regional Household and Rural Energy Seminar, Port Vila, Vanuatu, 5-9 November. United Nations, Pacific Energy Development Programme, Suva.
CIDA. 2004. Annual Report. Coconut Industry Development Authority, Suva. Cloin, J. 2005. Coconut Oil as a Biofuel in Pacific Islands: Challenges and Opportunities. SOPAC
Miscellaneous Report 592. SOPAC Secretariat, Suva. Cloin, J. 2006a. Optimisation of Mangaia Power Grid. Draft Report. SOPAC Secretariat, Suva. Cloin, J. 2006b. Overview of Pacific Regional Biofuel Activities. Paper presented at the Annual
Science, Technology Resources Network Conference, September 26th, Honiara, Solomon Islands.
Cloin, J. and R. Mario. 2004. Energy Mission to the Cook Islands. Miscellaneous Report 581.
SOPAC Secretariat, Suva. Cloin, J., Vaïtilingom, G., Cheatham, C., Forstreuter, W. 2005. CocoGen Feasibility Study of
Coconut Oil Power Generation in Samoa. SOPAC/UNDP Report. Cocogen Team, 2005. Cocogen Debriefing Report, Samoa. SOPAC Preliminary Report 142.
SOPAC Secretariat, Suva. Courty, P. 2000. Copra Biofuel for a Sustainable Decentralised Rural Electrification. Presentation
made at 9th PPA Conference and Trade Exhibition, 21st-24th August 2000, Brisbane. Coutrot, V. 1987. Photovoltaic Energy for Rural Electrification and Other Remote Applications.
Paper presented at First National Seminar on Renewable Energy for Rural Development, 23-26 June, University of Papua New Guinea.
Delaka, E. 2003. Bulelavata Evaluation. Unpublished Report Prepared by the Bulelavata Hydro
Committee. Economist. 2006. Turning Wind Power on its Side. March 9th. EIA.2006. Glossary. http//www.eia.doe.gov/glossary/index.html ESMAP. 2000. Photovoltaic Applications in Rural Areas of the Developing World. ESMAP
Technical Paper 009. World Bank, Washington D.C. ESMAP. 2002. Rural Electrification and Development in the Philippines: Measuring the Social and
Economic Benefits. World Bank, Washington D.C. Etherington, D. 2005. Bringing Hope to Remote Island Communities with Virgin Coconut Oil
Production. Paper presented at International Coconut Forum, Cairnes, Queensland, 22-23 November.
Fifita, S. 2001. Sustainable Rural Electrification in the Pacific Islands, Mission Impossible?.
Noumea, Secretariat of the Pacific Community. Fiji Department of Energy. 2005. Rural Electrification Unit Projects for 2005. http://www.fdoe.gov.fj/Rural%20Electrification.htm Fiji Department of Energy. 2001. Memorandum of Understanding between the Department of
Energy and Welagi Villagers.
[SOPAC Technical Report 397 – Woodruff]

[75]
Foster, R., Cisneros, G. and Hanley, C. (1998) “Life-Cycle Cost Analysis for Photovoltaic Water Pumping Systems in Mexico” Paper presented at 2nd World Conference on Photovoltaic Solar Energy Conversion, 6-10 July, Vienna.
Goldemberg, J (2001) “Rural Energy in Developing Countries”, In World Energy Assessment:
Energy and the Challenge of Sustainability. UNDP, New York. Gorkhali, S.P. 2005. Energy and Economic Welfare (Cost-Benefit Analysis of Micro-Hydro
Systems in Nepal). IEE Work Papers Volume 179. Ruhr University. Bochum. Greacen, C.E. 2004. The Marginalization of “Small is Beautiful” PhD Dissertation, University of
California, Berkeley. Greer Consulting Services 2006, Economic Analysis of Aggregate Mining on Tarawa. EU-SOPAC
Project Report 71. SOPAC Secretariat, Suva. IMF (2005, 2004, 2003, 2002, 2001) Country Reports and Statistical Appendices ITDGa. No date. Wind Electricity Generation. Technical Brief. Intermediate Technology
Development Group ITDGb. No date. Micro-Hydro Power. Technical Brief. Intermediate Technology Development
Group. Johnston, P and J. Vos. 2005. Pacific Regional Energy Assessment 2004: An Assessment of the
Key Energy Issues, Barriers to Development of Renewable Energy to Mitigate Climate Change, and Capacity Development Needs to Removing the Barriers: Solomon Islands National Report. Volume 12. SPREP, Apia.
Khan, I. 2005. Biofuels in Fiji: Socio-Economic and Technical Constraints and Opportunities
through Experiences in Welagi and Lomaloma”. Paper presented at PPA Workshop, Nadi. 17th November 2005.
Khennas, S. and Barnett, A. 2000. Best Practices for Sustainable Development of Micro-Hydro Power in Developing Countries. Final Synthesis Report prepared for DFID and World Bank. Lagman-Martin, A. 2004. Shadow Exchange Rates for Project Economic Analysis: Towards
Improving Practice at the Asian Development Bank. ERD Technical Note No. 11. ADB, Manila.
Lal, P. Saloa, K. and Uili, F. 2006, Economics of Liquid Waste Management in Funafuti, Tuvalu,
Pacific Islands Forum Secretariat, SPREP and IWP-Tuvalu. Lal, P. and Takau, L. 2005, Economic Costs of Waste in Tonga, Pacific Islands Forum
Secretariat, SPREP and IWP-Tonga. Liebenthal, A., Mathur, S. and Wade, H. (1994) “Solar Energy: Lessons from the Pacific”. World
Bank Technical Paper Number 244. World Bank, Washington DC. Matakiviti, A. and T. Pham. 2003. Review of the Fiji Government 1993 Rural Electrification Policy.
SOPAC Technical Report 368. Modi, V., S. McDade, D. Lallement, and J. Saghir (2006) Energy and the Millennium Development
Goals, New York: Energy Sector Management Assistance Programme, UNDP, UN Millennium Project, World Bank.
[SOPAC Technical Report 397 – Woodruff]

[76]
Moriss, J. 2005. Small Island States Bulk Procurement of Petroleum Products: Feasibility Study. Pacific Studies Series. Towards a New Pacific Regionalism. Working Paper No. 13, Volume 3. An Asian Development Bank-Commonwealth Secretariat Joint Report to the Pacific Islands Forum Secretariat.
Morris, J. 2006. Petroleum Outlook. Presentation made at the Asian Development Bank
Renewable Energy and Efficiency Workshop, CATD, Nadave, Fiji, 20-24 February 2006. NRECA International Ltd. 2000. Reducing the Cost of Grid Extension for Rural Electrification.
Joint UNDP/World Bank Energy Sector Management Assistance Programme. OECD and IEA. 1991. Renewable Technology Applications: Guidelines for Economic Analysis.
Paris: OECD. Osborne, P. 1996. Trade Issues and Development Prospects of Island Developing Countries in
the Pacific. Report prepared for South Pacific Forum Secretariat. Owens, G. 2002.Best Practices Guide: Economic and Financial Evaluation of Renewable Energy
Projects. Prepared for Energy and Environment Training Program, Office of Energy, Environment and Technology, Global Bureau, Center for Environment, USAID.
Pelena. 2006. Pelena Rural Energy Solomon Islands. http://www.pelena.com.au/PRESI.htm PIFS. Pacific Fuel Price Monitor. Editions 1-13. Suva, Pacific Islands Forum Secretariat. http://www.forumsec.org.fj/division/TID/TID%20Statistical%20Documents/PFPM/pfpm.htm Pio, N.S. and J. Tutua. 2004. Village Power in the Solomon Islands: A Grassroots Development.
Energia, 6(2), pp. 14-16. Prasad. S. 1997. Rural Electrification using Diesel-Power Systems in Fiji: A review. Paper
presented at the American Society of Mechanical Engineers 1997 Congress and Exhibition, Singapore, September 30th-October 2nd.
PREFACE (2000) “Tonga (Ha’apai) Feasibility Study” PREFACE 2nd PCC Meeting, November.
SPC, Noumea. Reiche, K., A Covarrubias, and E. Martinot. (2000) Expanding Electricity Access to Remote
Areas: Off-Grid Rural Electrification in Developing Countries. In. WorldPower 2000, Guy Isherwood, ed. London: Isherwood Production Ltd. pp. 52-60
REN21 Renewable Energy Policy Network. 2005a. “Renewables 2005 Global Status Report”
Washington DC: Worldwatch Institute. REN21 Renewable Energy Policy Network. 2005b. “Energy for Development: The Potential Role
of Renewable Energy in Meeting the Millennium Development Goals.” Washington, DC: Worldwatch Institute.
Rizer, J. and G. Tavanavanua. 1988. Report of the Conference. Pacific Islands Energy Ministers’
Conference 10-12 Augst, Honolulu, Hawaii. Sandia National Laboratories (2002) “Life Cycle Costing” Photovoltaic Systems Research and
Development. http://www.sandia.gov/pv/docs/Lccost.htm Solarbuzz. 2006. Website. http://www.solarbuzz.com.
[SOPAC Technical Report 397 – Woodruff]
[77]
SOPAC. 2004. Linking Policy and Strategy with Human Resource Development, Access to Finance and Budgets. Joint Regional Energy Meeting and PIEPSAP Regional Planning and Consultative Meeting, Record of Meeting. 29 November -3 December, Madang, Papua New Guinea. SOPAC Miscellaneous Report 596. SOPAC Secretariat, Suva.
SOPAC. 2006a. Workshop Report: Sustainable Utilisation of Renewable Energy, 01-05 May
2006, Ha’apai, Kingdom of Tonga. SOPAC Miscellaneous Report 617. SOPAC Secretariat, Suva.
SOPAC. 2006b. Evaluation of the Biofuels Projects in Taveuni and Vanua Balavu, Fiji Islands.
Technical Report 392. SOPAC Secretariat, Suva. SPC. 2000. Tonga Feasibility Study. Paper prepared for the PREFACE 2nd Project Coordination
Committee Meeting, November 2000. SPC. 2003. The Ha’apai Solar Electrification Project. Secretariat of the Pacific Community,
Noumea. Tenesol. 2006. Buying Panels from China. http://www.enf.cn/trade.html Toyo Engineering Corporation, Chubu Electric Power Co. Inc., Princeton Energy Resources
International, Energy Technology Enterprises Corp., The Energy and Resources Institute. 2005. Technical and Economic Assessment: Off Grid, Mini-Grid and Grid Electrification Technologies. Final Report. Energy Unit, Energy and Water Development. World Bank.
Tukunga, T. (2003) “Estimates of Revenue and Expenditures of the Ha’apai Solar Electric
Community for 2003-2007” Presentation at “Institutional Capacity Building on Renewable Energy Training in Pacific Island Developing States: Renewable Energy Training Needs Assessment Consultation and Pilot Training on Solar Photovoltaic Project Development” 24-28 November 2003, SOPAC, Fiji.
University of Fairbanks. 2006. Diesel Electric Generators. http://www.uaf/edu/energyin/webpage/pages/heat_engines/DEG.htm University of Texas Libraries. Map of the Solomon Islands. http://www.lib.utexas.edu/maps/solomon_islands.html UNCTAD. 2006. Commodity Price Database. Geneva, United Nations Commission on Trade and
Development. Vaitilingom, G. 2006. Biofuels for the Pacific: Technical Options. Presentation given at Renewable
Energy and Efficiency Workshop, CATD, Nadave, Fiji, 20-24 February 2006. Vergnet. 2001. Mangaia Grid Connected Wind Power Feasibility Study. Preliminary Report.
Prepared for PREFACE, SPC. Wade, H. 1983. The Use of Photovoltaic Systems for Rural Lighting: An Economic Analysis of the
Alternatives. Paper Presented to Solar World Congress, Perth, 14-19 August. Wade, H. 2002. Solar Photovoltaic Project Development: Text for Teachers. UNESCO Toolkit of
Learning and Teaching Materials. UNESCO, Paris. Wade, H., Lambert, Y, and M. Ferguson. 2002. Review of the PREFACE Project: A Joint
France/Australia Renewable Energy Development Programme. SPC, Noumea.
[SOPAC Technical Report 397 – Woodruff]
[78]
Wade, H., Johnston, P. and Vos, J. 2005. Pacific Regional Energy Assessment 2004: An Assessment of the Key Energy Issues, Barriers to Development of Renewable Energy to Mitigate Climate Change, and Capacity Development Needs to Removing the Barriers, Regional Overview Report. Volume 1. SPREP, Apia.
World Bank. 1992. Pacific Regional Energy Assessment Volume I: Overview. World Bank,
Washington D.C. World Bank, 2001. Rural Electrification: Lessons Learned. Findings Number 177. Washington DC:
World Bank. World Bank. 2006. Renewable Energy Toolkit Website.
http://web.worldbank.org/WBSITE/EXTERNAL/TOPICS/EXTENERGY/EXTRETOOLKIT/0,,contentMDK:20750927~menuPK:2069844~pagePK:64168445~piPK:64168309~theSitePK:1040428,00.html.
[SOPAC Technical Report 397 – Woodruff]
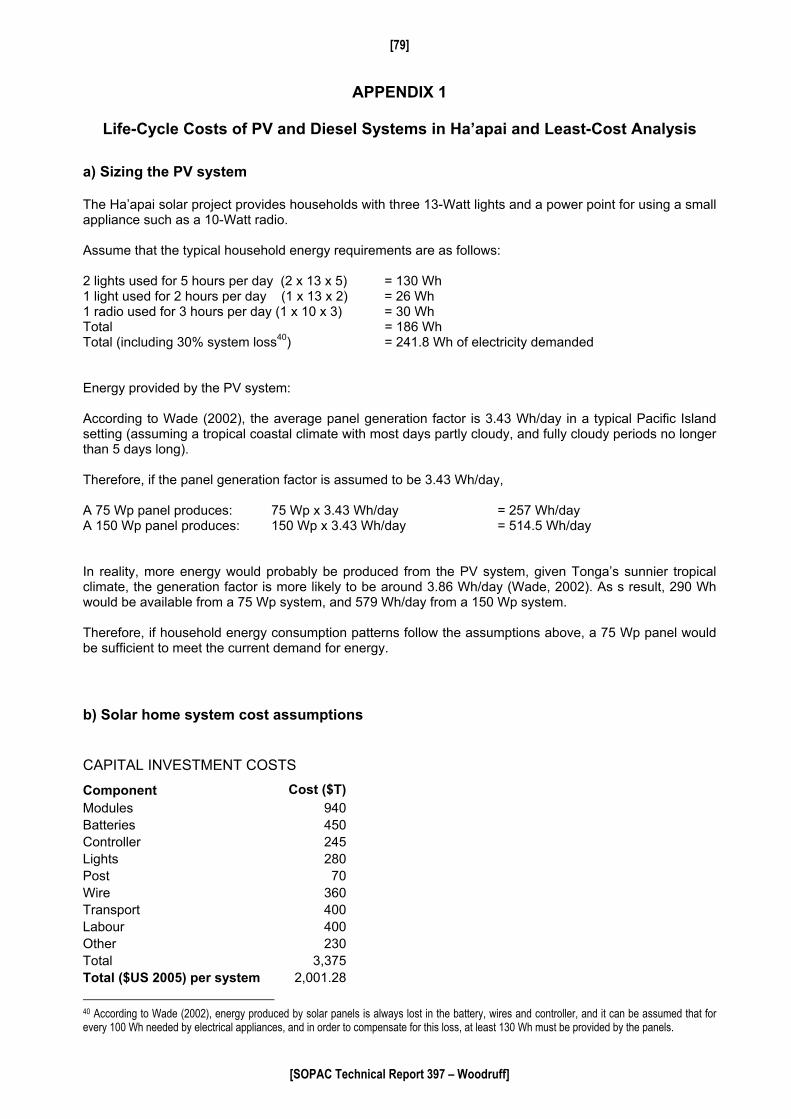
[79]
APPENDIX 1
Life-Cycle Costs of PV and Diesel Systems in Ha’apai and Least-Cost Analysis
a) Sizing the PV system The Ha’apai solar project provides households with three 13-Watt lights and a power point for using a small appliance such as a 10-Watt radio. Assume that the typical household energy requirements are as follows: 2 lights used for 5 hours per day (2 x 13 x 5) = 130 Wh 1 light used for 2 hours per day (1 x 13 x 2) = 26 Wh 1 radio used for 3 hours per day (1 x 10 x 3) = 30 Wh Total = 186 Wh Total (including 30% system loss40) = 241.8 Wh of electricity demanded Energy provided by the PV system: According to Wade (2002), the average panel generation factor is 3.43 Wh/day in a typical Pacific Island setting (assuming a tropical coastal climate with most days partly cloudy, and fully cloudy periods no longer than 5 days long). Therefore, if the panel generation factor is assumed to be 3.43 Wh/day, A 75 Wp panel produces: 75 Wp x 3.43 Wh/day = 257 Wh/day A 150 Wp panel produces: 150 Wp x 3.43 Wh/day = 514.5 Wh/day In reality, more energy would probably be produced from the PV system, given Tonga’s sunnier tropical climate, the generation factor is more likely to be around 3.86 Wh/day (Wade, 2002). As s result, 290 Wh would be available from a 75 Wp system, and 579 Wh/day from a 150 Wp system. Therefore, if household energy consumption patterns follow the assumptions above, a 75 Wp panel would be sufficient to meet the current demand for energy.
b) Solar home system cost assumptions CAPITAL INVESTMENT COSTS Component Cost ($T)Modules 940Batteries 450Controller 245Lights 280Post 70Wire 360Transport 400Labour 400Other 230Total 3,375Total ($US 2005) per system 2,001.28
40 According to Wade (2002), energy produced by solar panels is always lost in the battery, wires and controller, and it can be assumed that for every 100 Wh needed by electrical appliances, and in order to compensate for this loss, at least 130 Wh must be provided by the panels.
[SOPAC Technical Report 397 – Woodruff]

[80]
OPERATION AND MAINTENANCE COSTS
Annual operation and maintenance costs are assumed to be 1% of initial system capital investment cost. Batteries life is assumed to be 7 years for a 150 Wp panel system, and 5 years for a 75 Wp panel system. c) Diesel mini-grid cost assumptions CAPITAL INVESTMENT COSTS Installed generator cost: US$36,000 (36 kW generator @ $1,000/kW, assumed life of 20 years) Construction of distribution network: $15,000 OPERATION AND MAINTENANCE COSTS Fuel costs are based on energy consumption of: 10 kWh per day for 40 households Distribution losses: 15% Total Energy Consumption = 11.5 kWh per day Fuel efficiency of generator: 0.2 Litres/kWh Total annual fuel consumption = 839.5 litres Cost of fuel: US$1.20/litre Annual Fuel Costs = US$1,007.40 See Section 3.2.2 for other diesel cost assumptions Discount rate: 10%
[SOPAC Technical Report 397 – Woodruff]
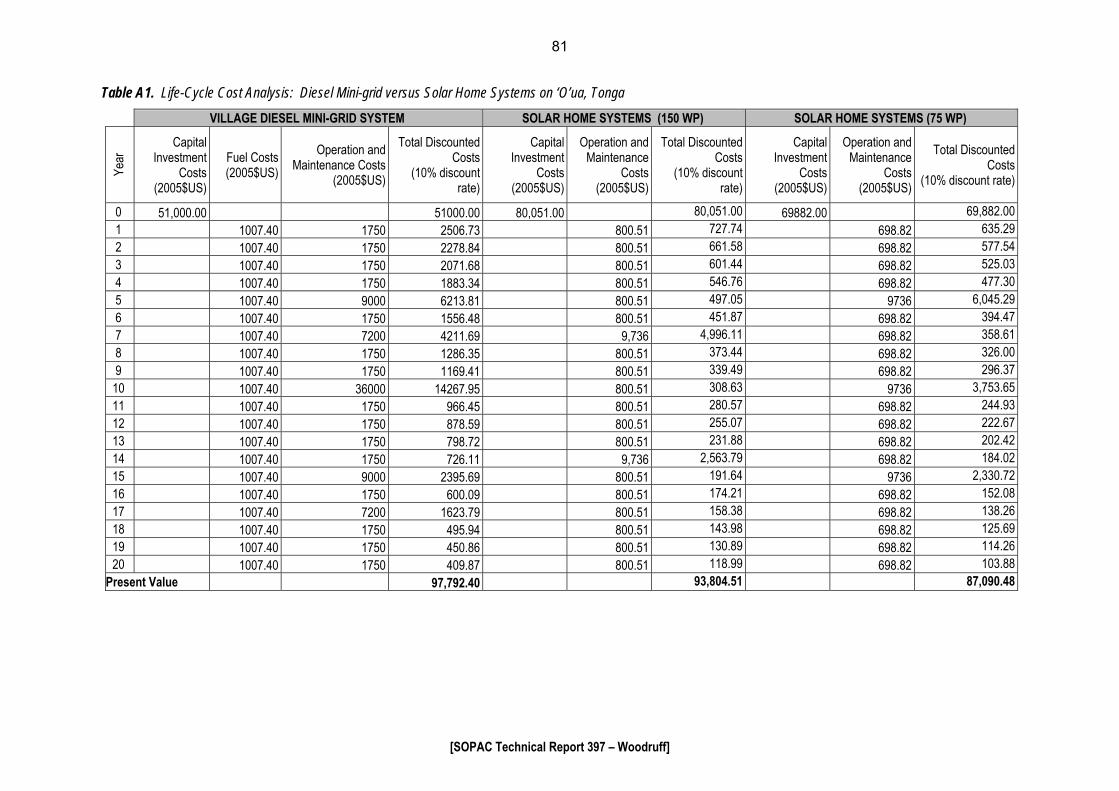
81
Table A1. Life-Cycle Cost Analysis: Diesel Mini-grid versus Solar Home Systems on ‘O’ua, Tonga
VILLAGE DIESEL MINI-GRID SYSTEM SOLAR HOME SYSTEMS (150 WP) SOLAR HOME SYSTEMS (75 WP) Ye
ar Capital
Investment Costs
(2005$US)
Fuel Costs (2005$US)
Operation and Maintenance Costs
(2005$US)
Total Discounted Costs
(10% discount rate)
Capital Investment
Costs (2005$US)
Operation and Maintenance
Costs (2005$US)
Total Discounted Costs
(10% discount rate)
Capital Investment
Costs (2005$US)
Operation and Maintenance
Costs (2005$US)
Total Discounted Costs
(10% discount rate)
0 51,000.00 51000.00 80,051.00 80,051.00 69882.00 69,882.00 1 1007.40 1750 2506.73 800.51 727.74 698.82 635.29 2 1007.40 1750 2278.84 800.51 661.58 698.82 577.54 3 1007.40 1750 2071.68 800.51 601.44 698.82 525.03 4 1007.40 1750 1883.34 800.51 546.76 698.82 477.30 5 1007.40 9000 6213.81 800.51 497.05 9736 6,045.29 6 1007.40 1750 1556.48 800.51 451.87 698.82 394.47 7 1007.40 7200 4211.69 9,736 4,996.11 698.82 358.61 8 1007.40 1750 1286.35 800.51 373.44 698.82 326.00 9 1007.40 1750 1169.41 800.51 339.49 698.82 296.37 10 1007.40 36000 14267.95 800.51 308.63 9736 3,753.65 11 1007.40 1750 966.45 800.51 280.57 698.82 244.93 12 1007.40 1750 878.59 800.51 255.07 698.82 222.67 13 1007.40 1750 798.72 800.51 231.88 698.82 202.42 14 1007.40 1750 726.11 9,736 2,563.79 698.82 184.02 15 1007.40 9000 2395.69 800.51 191.64 9736 2,330.72 16 1007.40 1750 600.09 800.51 174.21 698.82 152.08 17 1007.40 7200 1623.79 800.51 158.38 698.82 138.26 18 1007.40 1750 495.94 800.51 143.98 698.82 125.69 19 1007.40 1750 450.86 800.51 130.89 698.82 114.26 20 1007.40 1750 409.87 800.51 118.99 698.82 103.88
Present Value 97,792.40 93,804.51 87,090.48
[SOPAC Technical Report 397 – Woodruff]


83
APPENDIX 2
Least-Cost Analysis: Diesel versus Micro-Hydro in Bulelavata, Solomon Islands
VILLAGE LOAD CALCULATIONS a. Diesel
Appliance Unit Power Level Number Hours Total kWh Number HH Total Wh
Domestic Lighting 28 2 5 280 50 14,000 Radio 10 1 5 50 50 2,500 Water heater 1000 1 1 1000 15 15,000 Refrigerator 400 1 5 2000 5 10,000 41500 Wh/day Distribution loss (15%) 47,725Wh/day 47.73kW/day TOTAL 1,431.75 kW/month
b. Micro-hydro
Appliance Unit Power Level Number Hours Total kWh Number HH Total Wh
Domestic Lighting 28 2 6 336 50 16,800 Radio 10 1 5 50 50 2,500 Water heater 1000 1 1 1000 15 15,000 Refrigerator 400 1 12 4800 5 24,000 Street lighting 28 50 11 15400 n/a 15,400 Deep Freezer 2000 2 12 48000 48,000 121,700 Wh/day Distribution loss (15%) 139,500Wh/day 139.96 kWh/day TOTAL 4,198.65 kWh/month
A. DIESEL SYSTEM COSTS Capital Investment Costs It is assumed that one 35-kW generator would be required by Beula Provincial Secondary School and that a 35 kW generator would be required by the village, at a total cost of US$70,000 (assuming installed costs of US$1000/kW). It is estimated that a village distribution system would cost approximately $15,000. Total estimated capital costs for electricity provided by diesel generators are as follows:
2 x 35 kW diesel generators US$70,000
Transmission and Distribution System US$15,000
TOTAL CAPITAL COSTS US$85,000
[SOPAC Technical Report 397 – Woodruff]

84
Operation and Maintenance Costs Diesel Consumption Estimates:
Based on previous studies, it was estimated that Beula Provincial Secondary School consumed approximately 600L of diesel per month before joining the micro-hydro scheme (APACE, 1997). Given that the school generators were old and as a result, likely very inefficient for the purpose of analysis, it is assumed that fuel consumption is 75% of this figure, or 450 litres per month (this is likely to be an underestimate of fuel consumption in the absence of micro-hydro system since kerosene and fuel-wood were also used in addition to diesel generators).
Total Village Energy Consumption 1,431.75kWh/monthAssumed diesel generator efficiency 0.2 litres/kWh Total Village Fuel Consumption 286.35 litres Total School Fuel Consumption 450 litres Total Fuel Consumption 736.35 litres/month 8,836.2 litres/year Diesel Fuel Cost per Litre $1.30US Total Diesel Fuel Cost $11,487.06 US/year
Price of diesel in Gizo SB$9.80/litre (SB$1,750 per 200 litre drum) Sales tax SB$0.10/litre Excise tax SB$0.22/litre Actual Cost SB$9.48 US$/SB$ exchange rate 0.137 Actual cost of diesel = US$1.30/litre
B. MICRO-HYDROELECTRICITY SYSTEM COSTS
Capital Investment Costs Capital cost estimates provided by APACE (project design, equipment purchase, installation, transport and labour): US$228,919 Operation and Maintenance Costs
The life of the micro-hydroelectric system is assumed to be 20 years. Annual costs of operation and maintenance estimated by the technician: US$102.75 (includes costs of replacing minor parts such as belts every few years).
[SOPAC Technical Report 397 – Woodruff]

85
Table A2. Total Life-Cycle Costs of Diesel and Micro-hydro Systems.
DIESEL MINI-GRID SYSTEMS MICRO-HYDRO SYSTEM
Year
Capital InvestmentCosts
(2005$US)
Annual FuelCosts
(2005$US)
Operationand
MaintenanceCosts
TotalDiscountedCosts (10%
discount rate)
Capital Investment
Costs (2005$US)
Operation and
Maintenance Costs
(2005$US
Total Discounted Costs (10%
discount rate)
0 268,857 85,000.00 228,919.58 228,919.58 1 11,487.06 4,250.00 14,306.42 102.75 93.41 2 11,487.06 4,250.00 13,005.83 102.75 84.92 3 11,487.06 4,250.00 11,823.49 102.75 77.20 4 11,487.06 4,250.00 10,748.62 102.75 70.18 5 11,487.06 21,250.00 20,327.14 102.75 63.80 6 11,487.06 4,250.00 8,883.16 102.75 58.00 7 11,487.06 17,000.00 14,618.37 102.75 52.73 8 11,487.06 4,250.00 7,341.45 102.75 47.93 9 11,487.06 4,250.00 6,674.05 102.75 43.58 10 11,487.06 70,000.00 31,416.79 102.75 39.61 11 11,487.06 4,250.00 5,515.74 102.75 36.01 12 11,487.06 4,250.00 5,014.31 102.75 32.74 13 11,487.06 4,250.00 4,558.47 102.75 29.76 14 11,487.06 4,250.000.00 4,144.06 102.75 27.06 15 11,487.06 21,250.00 6,819.58 102.75 24.60 16 11,487.06 4,250.00 3,424.84 102.75 22.36 17 11,487.06 17,000.00 6,476.85 102.75 20.33 18 11,487.06 4,250.00 2,830.45 102.75 18.48 19 11,487.06 4,250.00 2,573.14 102.75 16.80 20 11,487.06 4,250.00 2,339.21 102.75 15.27
TOTAL ($US) 267,842.07 229,794.35
[SOPAC Technical Report 397 – Woodruff]

86
APPENDIX 3
Cost-Benefit Analysis of the Mangaia Wind Project
Diesel Costs
Components of diesel price in Mangaia $NZ $US
Bulk price diesel Rarotonga (incl. Tax) 1.93 1.22Taxes VAT (12.5%) 0.24 0.15 Levy 0.22 0.14 Freight to Mangaia 0.15 0.10 Nominal price (bulk price + transport) 1.31Real price (bulk price + transport – tax) 1.02 Actual wind production Oct 2004 − Sept 2005: 27,799 kWh.
Assumed efficiency of diesel generators: 0.34 litres/kWh.
Total annual diesel savings (based on real price of diesel): US$9,640.69.
It is assumed that demand for energy is increasing 6% per annum.
Cost estimates were obtained from the Vergnet (2001) Mangaia pre-feasibility study.
CAPITAL COST ESTIMATES $NZ Total Price ($NZ) % of Total2 Wind turbines 20 KW 90,000.00 24.0064Control connection box (2) 12,000.00 3.200854Remote control system 10,000.00 2.667378Transformer 13,500.00 3.60096Freight 16,700.00 4.454521Taxes 136,200.00 36.32969Civil works 13,100.00 3.494265Levelling 1,200.00 0.320085Technical building 1,200.00 0.32008511 KV grid connection 13,000.00 3.467591Telephone 4,000.00 1.066951Assembly and wiring 44,000.00 11.73646Consulting and commissioning 20,000.00 5.334756TOTAL (incl duty) 374,900.00 100 duty free 238,700.00 163,898.84 $US 2005 (NZ$1=US$0.63)
[SOPAC Technical Report 397 – Woodruff]

87
ANNUAL OPERATION AND MAINTENANCE COSTS Site visit 7,500.00 Servicing 1,500.00 Parts replacement 1,000.00 TOTAL 10,000.00 Per year 6,866.31 $US 2005
[SOPAC Technical Report 397 – Woodruff]

89
Table A3. Costs and benefits of adding wind turbines to the Mangaia electricity production system.
Electricity Supplied (kWh) Diesel Fuel Used (litres) Cost Effects of Wind
Capital Cost of Total System
($US) Energy Supplied Total System
Net Wind Supply to
Load Net Diesel
Supply to Load Fuel Consumed
without Wind Fuel Consumed
with Wind Fuel Saved
with Wind
Price of Fuel ($US/litre)
Value of Fuel Saved
Years
O&M Net Benefit(10% discount
rate)
0 163,898.84 –163,898.84 1 458,640.00 27,799.00 430,841.00 155,937.60 146,485.94 9,451.66 1.02 9,640.69 6,866.31 2,522.17 2 486,158.40 27,799.00 458,359.40 165,293.86 155,842.20 9,451.66 1.02 9,640.69 6,866.31 2,292.88 3 515,327.90 27,799.00 487,528.90 175,211.49 165,759.83 9,451.66 1.02 9,640.69 6,866.31 2,084.43 4 546,247.58 27,799.00 518,448.58 185,724.18 176,272.52 9,451.66 1.02 9,640.69 6,866.31 1,894.94 5 579,022.43 27,799.00 551,223.43 196,867.63 187,415.97 9,451.66 1.02 9,640.69 6,866.31 1,722.67 6 613,763.78 27,799.00 585,964.78 208,679.68 199,228.02 9,451.66 1.02 9,640.69 6,866.31 1,566.07 7 650,589.61 27,799.00 622,790.61 221,200.47 211,748.81 9,451.66 1.02 9,640.69 6,866.31 1,423.70 8 689,624.98 27,799.00 661,825.98 234,472.49 225,020.83 9,451.66 1.02 9,640.69 6,866.31 1,294.27 9 731,002.48 27,799.00 703,203.48 248,540.84 239,089.18 9,451.66 1.02 9,640.69 6,866.31 1,176.61
10 774,862.63 27,799.00 747,063.63 263,453.29 254,001.63 9,451.66 1.02 9,640.69 6,866.31 1,069.64 11 821,354.39 27,799.00 793,555.39 279,260.49 269,808.83 9,451.66 1.02 9,640.69 6,866.31 972.40 12 870,635.65 27,799.00 842,836.65 296,016.12 286,564.46 9,451.66 1.02 9,640.69 6,866.31 884.00 13 922,873.79 27,799.00 895,074.79 313,777.09 304,325.43 9,451.66 1.02 9,640.69 6,866.31 803.64 14 978,246.22 27,799.00 950,447.22 332,603.71 323,152.05 9,451.66 1.02 9,640.69 6,866.31 730.58 15 1,036,940.99 27,799.00 1,009,141.99 352,559.94 343,108.28 9,451.66 1.02 9,640.69 6,866.31 664.17 16 1,099,157.45 27,799.00 1,071,358.45 373,713.53 364,261.87 9,451.66 1.02 9,640.69 6,866.31 603.79 17 1,165,106.90 27,799.00 1,137,307.90 396,136.34 386,684.68 9,451.66 1.02 9,640.69 6,866.31 548.90 18 1,235,013.31 27,799.00 1,207,214.31 419,904.53 410,452.87 9,451.66 1.02 9,640.69 6,866.31 499.00 19 1,309,114.11 27,799.00 1,281,315.11 445,098.80 435,647.14 9,451.66 1.02 9,640.69 6,866.31 453.63 20 1,387,660.96 27,799.00 1,359,861.96 471,804.72 462,353.06 9,451.66 1.02 9,640.69 6,866.31 412.39
Present Value − 140,278.96
[SOPAC Technical Report 397 – Woodruff]


91
APPENDIX 4
Glossary
Definitions of the following energy terms were obtained from EIA (2006) and the California Energy Commission (2006). Alternating Current (AC): An electric current that reverses its direction at regularly recurring intervals, usually 50 or 60 times per second. Biofuels: Liquid fuels and blending components produced from biomass (plant), used for electricity production and transportation. Ampere: The unit of measurement of electrical current produced in a circuit by 1 volt acting through a resistance of 1 Ohm. Diesel: Fuel for diesel engines obtained from the distillation of petroleum. It is composed chiefly of aliphatic hydrocarbons. Its volatility is similar to that of gas oil. Diesel fuel system: Diesel engines are internal combustion engines that burn diesel oil rather than gasoline. Injectors are used to spray droplets of diesel oil into the combustion chambers, at or near the top of the compression stroke. Ignition follows due to the very high temperature of the compressed intake air, or to the use of "glow plugs," which retain heat from previous ignitions (spark plugs are not used). Diesel engines are generally more fuel-efficient than gasoline engines but must be stronger and heavier because of high compression ratios Direct Current (DC): Electricity that flows continuously in the same direction. Distribution System: The substations, transformers and lines that convey electricity from high-power transmission lines to ultimate consumers. Economy of scale: The principle that larger production facilities have lower unit costs than smaller facilities. Efficiency: The fuel efficiency of a diesel generator can be defined as the amount of power an engine can produce per amount of fuel it burns. Emissions: Anthropogenic releases of gases to the atmosphere. In the context of global climate change, they consist of radiatively important greenhouse gases (e.g., the release of carbon dioxide during fuel combustion) Gross domestic product (GDP): The total value of goods and services produced by labor and property located in the United States. As long as the labor and property are located in the United States, the supplier (that is, the workers and, for property, the owners) may be either U.S. residents or residents of foreign countries. Kerosene: Certain colorless, low-sulfur oil products that burn without producing much smoke.
Kilowatt (kW): One thousand (1,000) watts. A unit of measure of the amount of electricity needed to operate given equipment.
Kilowatt-hour (kWh): The most commonly-used unit of measure telling the amount of electricity consumed over time. It means one kilowatt of electricity supplied for one hour.
Life-Cycle Cost (LCC): The present value of the total cost of purchasing, installing, operating, maintaining and repairing a energy generating system over its economic life.
[SOPAC Technical Report 397 – Woodruff]
92
Levelised cost: see life-cycle cost Load: The amount of electric power supplied to meet one or more end-user's needs. Megawatt (MW): One million watts of electricity. Peak watt: A manufacturer's unit indicating the amount of power a photovoltaic cell or module will produce at standard test conditions (normally 1,000 watts per square meter and 25 degrees Celsius). Peak Load: The highest electrical demand within a particular period of time. Daily electric peaks on weekdays occur in the late afternoon and early evening. Petroleum: A broadly-defined class of liquid hydrocarbon mixtures. Included are crude oil, lease condensate, unfinished oils, refined products obtained from the processing of crude oil, and natural gas plant liquids. Petroleum products: Petroleum products are obtained from the processing of crude oil (including lease condensate), natural gas, and other hydrocarbon compounds. Petroleum products include unfinished oils, liquefied petroleum gases, pentanes plus, aviation gasoline, motor gasoline, naphtha-type jet fuel, kerosene-type jet fuel, kerosene, distillate fuel oil, residual fuel oil, petrochemical feedstocks, special naphthas, lubricants, waxes, petroleum coke, asphalt, road oil, still gas, and miscellaneous products. Photovoltaic cell (PVC): An electronic device consisting of layers of semiconductor materials fabricated to form a junction (adjacent layers of materials with different electronic characteristics) and electrical contacts capable of converting incident light directly into electricity (direct current). Power: Electricity for use as energy. Renewable Energy: Resources that constantly renew themselves or that are regarded as practically inexhaustible. These include solar, wind, geothermal, hydro and wood. Renewable resources also include some experimental or less-developed sources such as tidal power, sea currents and ocean thermal gradients. Solar energy: The radiant energy of the sun, which can be converted into other forms of energy, such as heat or electricity. Volt (V): The volt is the International System of Units (SI) measure of electric potential or electromotive force. A potential of one volt appears across a resistance of one ohm when a current of one ampere flows through that resistance. Reduced to SI base units, 1 V = 1 kg times m2 times s-3 times A-1 (kilogram meter squared per second cubed per ampere). Watt (W): The unit of electrical power equal to one ampere under a pressure of one volt. A Watt is equal to 1/746 horsepower.
Watt-hour (Wh): The electrical energy unit of measure equal to one watt of power supplied to, or taken from, an electric circuit steadily for one hour. Wind energy: Energy present in wind motion that can be converted to mechanical energy for driving pumps, mills, and electric power generators. Wind pushes against sails, vanes, or blades radiating from a central rotating shaft.
[SOPAC Technical Report 397 – Woodruff]