an economic analysis of the food and agriculture sector in...
TRANSCRIPT

An Economic Analysis of the Food
and Agriculture Sector in Nevada
2017
Administration Division
Nevada Department of Agriculture

Economic Analysis of the Food & Agriculture Sector in Nevada – 2017
Nevada Department of Agriculture
page | 1
An Economic Analysis of the Food and Agriculture Sector in
Nevada
Introduction: Agriculture, natural resources and related food manufacturing industries represent a set of economic
activities which produce goods and services that contribute to economy of Nevada. These industries use
natural resources from forests, croplands and ranches in Nevada to produce raw food commodities. These
raw and unprocessed commodities are converted into finished products by the food manufacturing
industries, and finished goods then move through the wholesale and retail distribution chain to final
consumers or to other industry sectors as intermediate goods for further processing.
The economic impact analysis assesses the effect of a new or present activity on the overall economy of a
region such as a state, county or city. Any activity that generates payments has an effect on other parts of
the local economy, and any expenditure by one person or entity becomes income to another entity. In the
economic impact analysis, these are called secondary effects and are measured through economic
multipliers for each type of activity (industry sector) obtained from regional economic models. This report
provides estimates of the economic contributions of broadly defined industries comprising agriculture
production and related food manufacturing activities to the economy of the state and counties of Nevada
in 2015.
Methodology: Data for this analysis were obtained from the IMPLAN database for all seventeen counties in the state of
Nevada for 2015, which in turn were derived from the National Income and Product Accounts for the United
States (U.S. Department of Commerce, Bureau of Economic Analysis), the Quarterly Census of Employment
and Wages (U.S. Bureau of Labor Statistics) and other sources.
The total agriculture sector is defined by agriculture production industries and food manufacturing
industries. The IMPLAN model accounts for industrial and commodity production, employment, labor
income, household and institutional consumption and domestic and international trade (imports, exports).
Economic multipliers are calculated for each industry to estimate the secondary effects of economic
activity. Indirect effects multipliers represent the economic activity generated in the supply chain through
the purchase of intermediate inputs from vendor firms, while induced effects multipliers represent the
impacts of spending by industry employee households and governments. The total economic impacts were
calculated as the sum of direct, indirect, and induced effects. Therefore, while the estimates of this analysis
are referred to as "economic impacts," these values may be better understood as "economic contributions"
because they represent the ongoing economic activity of existing industries rather than a change resulting
from new activity introduced to economy of these counties.
Executive Summary: Agriculture production industries and related food manufacturing industries remain a significant part of
Nevada’s economy, and it is important to recognize their economic contributions. The NDA will evaluate
the economic contributions of these industries to the total economy of Nevada and each county in 2015.

Economic Analysis of the Food & Agriculture Sector in Nevada – 2017
Nevada Department of Agriculture
page | 2
This analysis was conducted using the IMPLAN regional economic modeling system and county databases
to estimate economic multipliers that capture the additional economic activity generated by the re-
spending of income in the local economy arising from a new final demand created by an existing demand
for products and inputs. The industry sectors included in this analysis represent a broad array of activities
and include agricultural and natural resource commodity production and food manufacturing industries.
The total agriculture sector of each county is defined by two major agriculture areas: agriculture production
industries and food manufacturing industries that have a significant presence in each county
The report will provide facts about farm and ranching operations, like number of farms, number of
operators and value of cash receipts from selling agriculture and food products, but the extent of the total
effects of a particular activity or event in each county is measured by employment, output, labor income,
export and import. Export sales bring dollars into the county economy, providing for future economic
growth. Import sales act as leakages from the county economy. It is important to analyze the changes in
the economic activity of the agriculture sector to determine and measure the contribution these activities
have on the total economy of each county.
Geographically, the size and composition of agriculture production and related food manufacturing
industries varies across the state of Nevada due to differences in climate, natural resources, and
population. The largest economic contributions occurred in the major metro areas of Clark County and
Washoe County where there are large demands for agriculture and food products and a large workforce
available for the food manufacturing industry. The economic contributions of agriculture and related food
manufacturing industries are also important in many rural areas where these industries represent a higher
share of total economic activity.
Agriculture remains an important part of the Nevada economy. The states’ farms combined cover nearly
40.5% of Nevada’s total land area in 2012. However, the economic contributions of agriculture extend well
beyond the farm.
Nevada is also home to many agriculture-related processing and manufacturing establishments, such as
bread and bakery manufacturing operations, frozen food manufacturing operations and many others.
These establishments are found all over the state—from the largest cities to the more rural areas, and they
employ more than 8,0001 Nevadans total.
The total Nevada population in 2015 was 2.9 million. Rural population was 270,633 people, and 2.6 million
residents lived in urban areas.2
Using data from 2015, this study updates a prior analysis of the contribution agriculture gives to the Nevada
economy. For consistency with the prior analysis, agriculture is defined as food and agriculture production
and value-added food processing (food and agriculture manufacturing). Production refers to the crop and
livestock industries, as well as forestry and agricultural support services. Within the North American
Industry Code System (NAICS) industry classification scheme, production activities refer to any industry
1 Source: IMPLAN Data 2 Source: https://data.ers.usda.gov/reports.aspx?ID=10633
Economic Analysis of the Food & Agriculture Sector in Nevada – 2017
Nevada Department of Agriculture
page | 3
classified in sector 11. The processing and manufacturing activities refer to industries that utilize farm and
forest products as the key input into their finished goods – sector 31.
The main objectives of this report are to look into the following:
1. general trends (2010 to 2015) of agriculture production activities for Nevada 2. economic impact – an update of the contribution of agriculture sector to the Nevada economy 3. economic analysis of various sector components of Nevada agriculture 4. economic impact – an update of the contribution of agriculture sector to each county.
Food and Agriculture Sector in Nevada
Overview and Findings:
This report provides a profile of the agriculture sector and an overview of the economic impact the
agriculture sector has on the economy of Nevada.
There were 4,200 farm operations in 2015 in Nevada, covering approximately 6 million acres of
land.
In 2015, Nevada’s total value of the agriculture sector output was $4.6 billion accounting for 2% of
the total production output. The largest agriculture production industries by output value were:
Beef cattle ranching and farming, including feedlots ($377 million)
All other crop farming including hay ($221 million).
Dairy cattle and milk production ($170 million)
These industries account for more than 17% of the total agriculture sector output.
The largest food manufacturing industries by output value level were:
Bread and bakery products manufacturing ($404 million)
Bottled and canned soft drinks & water ($349 million)
Fluid milk manufacturing ($289 million).
These industries account for more than 22% of Nevada’s agriculture sector output.
The total state employment was 1.6 million. The agriculture sector had 15,583 employees
accounting for 1% of the total state employment. In 2015, the labor income of the agriculture
sector in Nevada was $526 million accounting for 0.7% of the total state’s income.
The agriculture sector total exports were $3.9 billion, and $98.3 million were total foreign exports
to international markets. The top 3 exporting agriculture production industries were:
Beef cattle ($258 million)
All other crops ($123 million)
Dairy cattle and milk products ($108 million)
In 2015, given the economic inter-linkage and multiplier effect, the total economic contribution to
the Nevada’s economy from all the agricultural sector activities was $1.8 billion. The total
Economic Analysis of the Food & Agriculture Sector in Nevada – 2017
Nevada Department of Agriculture
page | 4
employment impacts from activity of the agriculture sector was 9,454 jobs and $395.8 million in
labor income. The total economic contribution of agriculture production activities to the state
economy was an estimated $1.1 billion. The total employment impact from agriculture production
activities was 7,147 jobs and $270 million in labor income. The food manufacturing activities total
economic contribution to state economy was $793.7 million. The total employment impact was an
estimated 2,307 jobs with $125 million in labor income.
Economic Analysis – General Trends:
Agriculture Land and Farms:
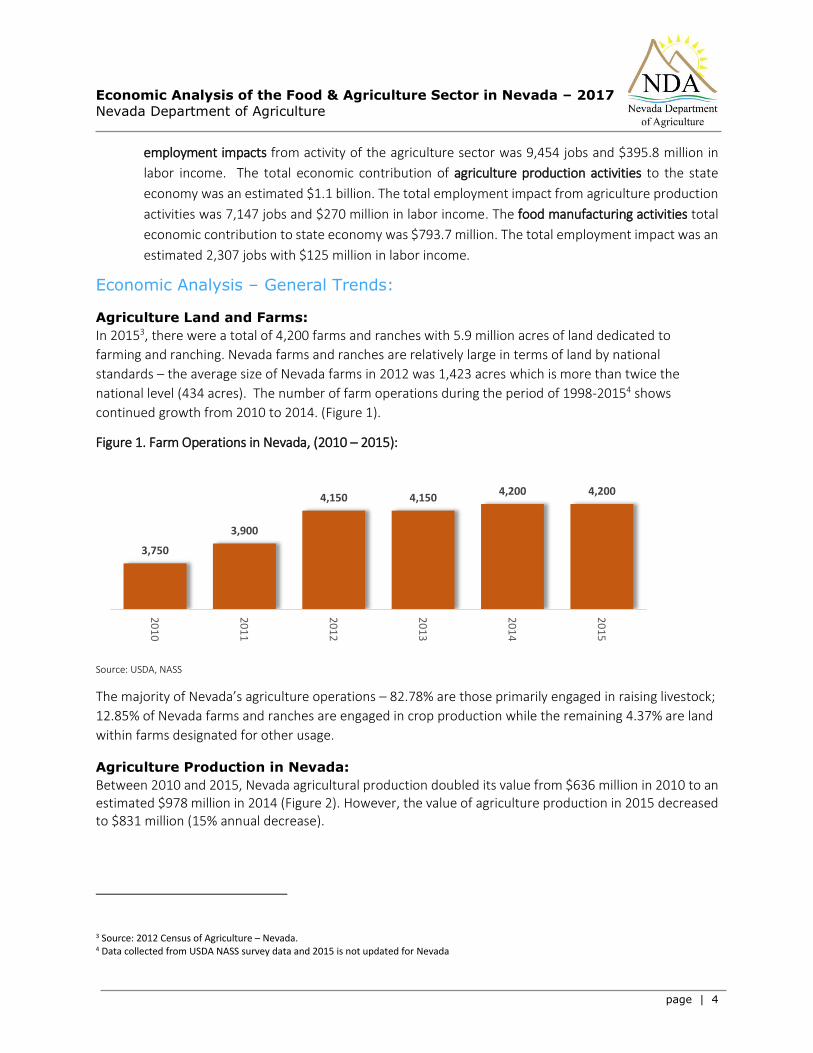
In 20153, there were a total of 4,200 farms and ranches with 5.9 million acres of land dedicated to
farming and ranching. Nevada farms and ranches are relatively large in terms of land by national
standards – the average size of Nevada farms in 2012 was 1,423 acres which is more than twice the
national level (434 acres). The number of farm operations during the period of 1998-20154 shows
continued growth from 2010 to 2014. (Figure 1).
Figure 1. Farm Operations in Nevada, (2010 – 2015):
Source: USDA, NASS
The majority of Nevada’s agriculture operations – 82.78% are those primarily engaged in raising livestock;
12.85% of Nevada farms and ranches are engaged in crop production while the remaining 4.37% are land
within farms designated for other usage.
Agriculture Production in Nevada:
Between 2010 and 2015, Nevada agricultural production doubled its value from $636 million in 2010 to an estimated $978 million in 2014 (Figure 2). However, the value of agriculture production in 2015 decreased to $831 million (15% annual decrease).
3 Source: 2012 Census of Agriculture – Nevada. 4 Data collected from USDA NASS survey data and 2015 is not updated for Nevada
3,750
3,900
4,150 4,1504,200 4,200
20
10
20
11
20
12
20
13
20
14
20
15

Economic Analysis of the Food & Agriculture Sector in Nevada – 2017
Nevada Department of Agriculture
page | 5
Figure 2. Value of Agriculture Production in Nevada ($millions), (2010 – 2015)
Source: USDA, NASS
The value of agriculture production decreased due to decline in the value of crop production. The value of crop production declined by 39% from 2014 to 2015, while the value of animal and products production decreased by 7%. Nevada farmers and ranchers sold a total of $729 million worth of unprocessed agricultural commodities in 2015. Agriculture production in Nevada is directed primarily toward range livestock production. Approximately 74% of the agriculture production sales originate from animal and products, and 25.8% from crop production. Figure 3. shows cash receipts from selling agriculture production commodities. The total value of cash receipts in the 2015 declined by 19% from the previous year. The cash receipts from selling animals and animal products show a constant increase in the period from 2010 to 2014. The 30% decline in the value of cash receipts received from selling crop products in 2015 could be explained due to drought conditions in the state. The value of cash receipts from animals and animal products production decreased by 15% in 2015.
Figure 3. Annual Cash Receipts by Commodity in Nevada ($millions), (2010 – 2015):
Source: USDA, NASS
Nevada’s Gross Domestic Product:
It is also important to examine how the growth in the agriculture sector compares to the growth of Nevada’s overall economy. Nevada’s Gross Domestic Product (GDP), the value added by all industries in the
634,847
796,957 774,132 790,241
978,431
831,246
2010 2011 2012 2013 2014 2015
350,835413,724
457,929 463,477
638,747
541,538
224,616
299,620258,791
229,762266,602
187,831
2010 2011 2012 2013 2014 2015

Economic Analysis of the Food & Agriculture Sector in Nevada – 2017
Nevada Department of Agriculture
page | 6
state, was $319 billion in 2015. GDP for the Nevada economy decline by 20% from 2014 to 2015. Food and agriculture production accounted for 0.23%, around $319 million, of Nevada’s GDP (Table 1.)
Table 1. Nevada’s Gross Domestic Product 2010 – 2015 (millions)
Year Food and
Agriculture Production
Share in Total GDP
Food and Agriculture Sector
Share in Total GDP
Total GDP
($ millions) ($ millions) ($ millions)
2010 307 0.26% 4,727 3.9% 121,713
2011 394 0.32% 4,761 3.8 % 124,445
2012 289 0.23% 4,705 3.8% 125,440
2013 308 0.24% 5,215 4.1% 128,321
2014 319 0.24% 5,807 4.3% 133,784
2015 319 0.23% Source: U.S. Department of Commerce, Bureau of Economic Analysis
Determining the role of the food and agriculture sector in Nevada’s economy depends in part on how agriculture is defined. In general, many industries are related to farm production; however, the degree of linkage varies significantly.
From a broad perspective, approximately 2585 establishments in food manufacturing, in addition to agriculture production establishments in Nevada, are closely linked to agriculture production. Also, food produced and sold in Nevada may not be as dependent on local farm production. However, with more than 20,000 workers employed in the food service, wholesale and retail industry, their relation to the farming sector can be determined. By combining these industries, the share of the food and agriculture sector accounts for approximately 4% of the total state GDP and is increasing.
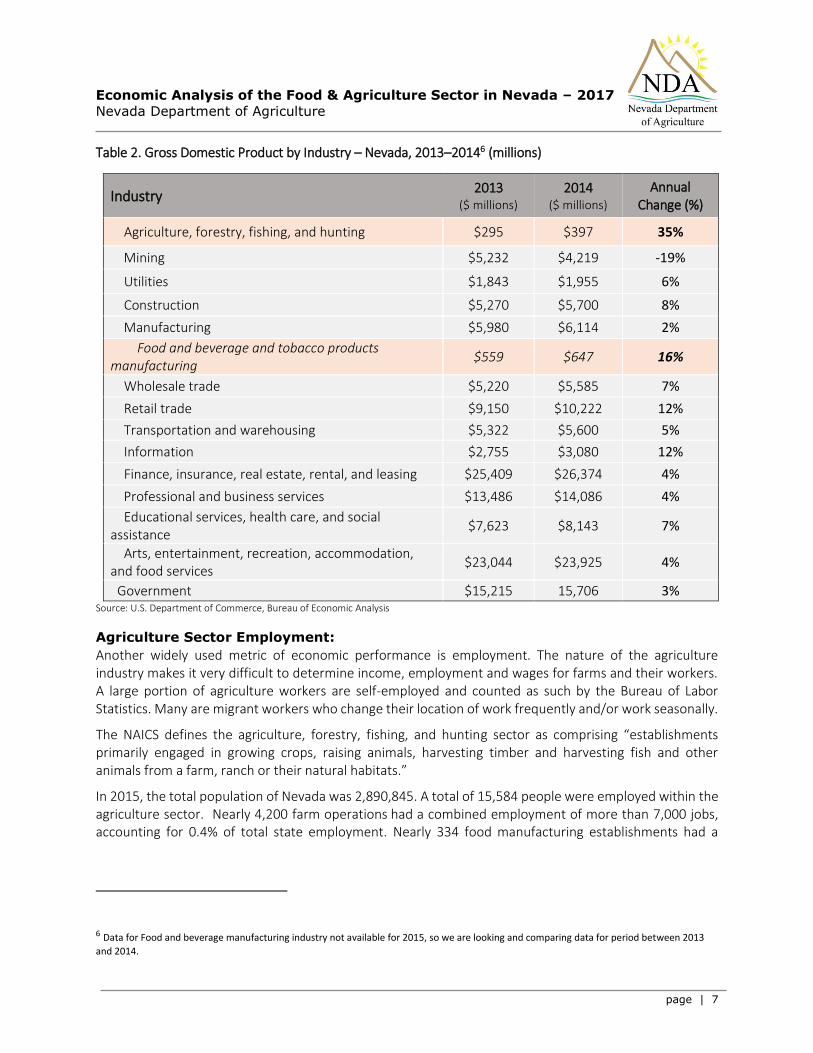
Comparing agriculture production with other industries that contribute to the overall GDP of the state, in the period of 2013 to 2014, agriculture production growth rate was 35%, the highest annual increase. Food processing, another important component of the Nevada agricultural sector, experienced an increase of 16% in value, the second largest annual increase (Table 2).
5 Source: Bureau of Labor Statistics, data for 2015 – annual averages (private establishments only)
139,724
Economic Analysis of the Food & Agriculture Sector in Nevada – 2017
Nevada Department of Agriculture
page | 7
Table 2. Gross Domestic Product by Industry – Nevada, 2013–20146 (millions)
Industry 2013
($ millions)
2014 ($ millions)
Annual Change (%)
Agriculture, forestry, fishing, and hunting $295 $397 35%
Mining $5,232 $4,219 -19%
Utilities $1,843 $1,955 6%
Construction $5,270 $5,700 8%
Manufacturing $5,980 $6,114 2%
Food and beverage and tobacco products manufacturing
$559 $647 16%
Wholesale trade $5,220 $5,585 7%
Retail trade $9,150 $10,222 12%
Transportation and warehousing $5,322 $5,600 5%
Information $2,755 $3,080 12%
Finance, insurance, real estate, rental, and leasing $25,409 $26,374 4%
Professional and business services $13,486 $14,086 4%
Educational services, health care, and social assistance
$7,623 $8,143 7%
Arts, entertainment, recreation, accommodation, and food services
$23,044 $23,925 4%
Government $15,215 15,706 3% Source: U.S. Department of Commerce, Bureau of Economic Analysis
Agriculture Sector Employment:
Another widely used metric of economic performance is employment. The nature of the agriculture industry makes it very difficult to determine income, employment and wages for farms and their workers. A large portion of agriculture workers are self-employed and counted as such by the Bureau of Labor Statistics. Many are migrant workers who change their location of work frequently and/or work seasonally.
The NAICS defines the agriculture, forestry, fishing, and hunting sector as comprising “establishments primarily engaged in growing crops, raising animals, harvesting timber and harvesting fish and other animals from a farm, ranch or their natural habitats.”
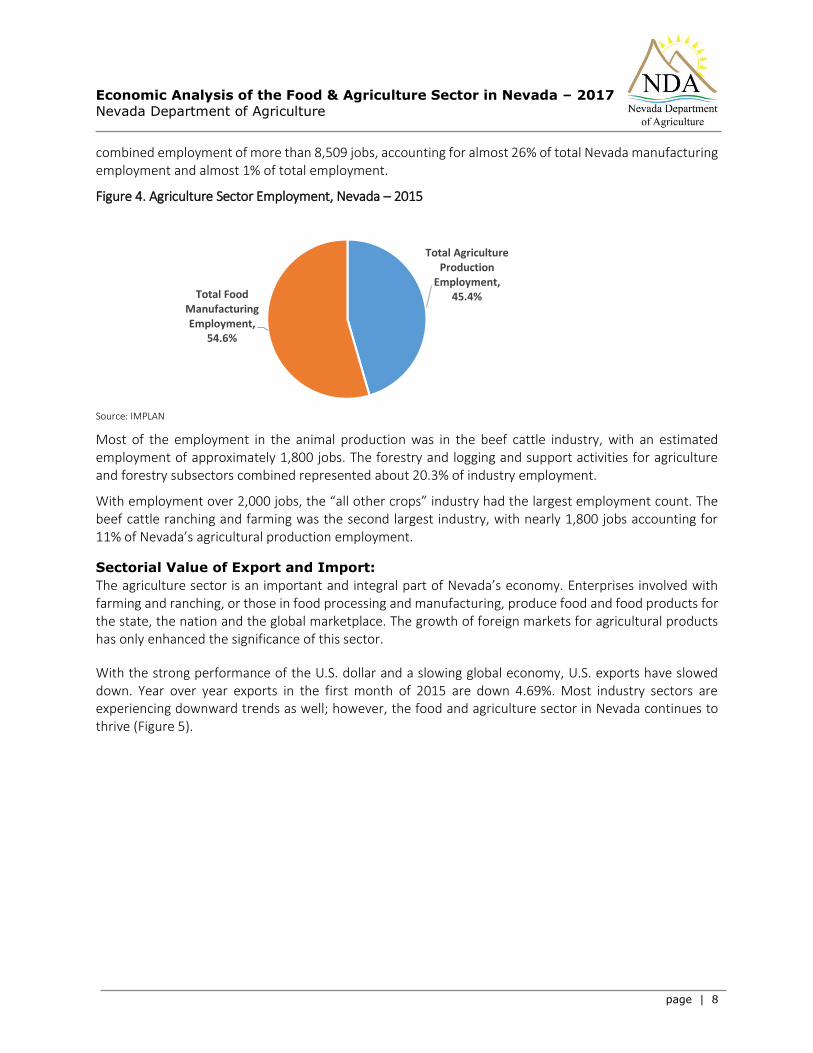
In 2015, the total population of Nevada was 2,890,845. A total of 15,584 people were employed within the agriculture sector. Nearly 4,200 farm operations had a combined employment of more than 7,000 jobs, accounting for 0.4% of total state employment. Nearly 334 food manufacturing establishments had a
6 Data for Food and beverage manufacturing industry not available for 2015, so we are looking and comparing data for period between 2013
and 2014.
Economic Analysis of the Food & Agriculture Sector in Nevada – 2017
Nevada Department of Agriculture
page | 8
combined employment of more than 8,509 jobs, accounting for almost 26% of total Nevada manufacturing employment and almost 1% of total employment.
Figure 4. Agriculture Sector Employment, Nevada – 2015
Source: IMPLAN
Most of the employment in the animal production was in the beef cattle industry, with an estimated employment of approximately 1,800 jobs. The forestry and logging and support activities for agriculture and forestry subsectors combined represented about 20.3% of industry employment.
With employment over 2,000 jobs, the “all other crops” industry had the largest employment count. The beef cattle ranching and farming was the second largest industry, with nearly 1,800 jobs accounting for 11% of Nevada’s agricultural production employment.
Sectorial Value of Export and Import:
The agriculture sector is an important and integral part of Nevada’s economy. Enterprises involved with farming and ranching, or those in food processing and manufacturing, produce food and food products for the state, the nation and the global marketplace. The growth of foreign markets for agricultural products has only enhanced the significance of this sector.
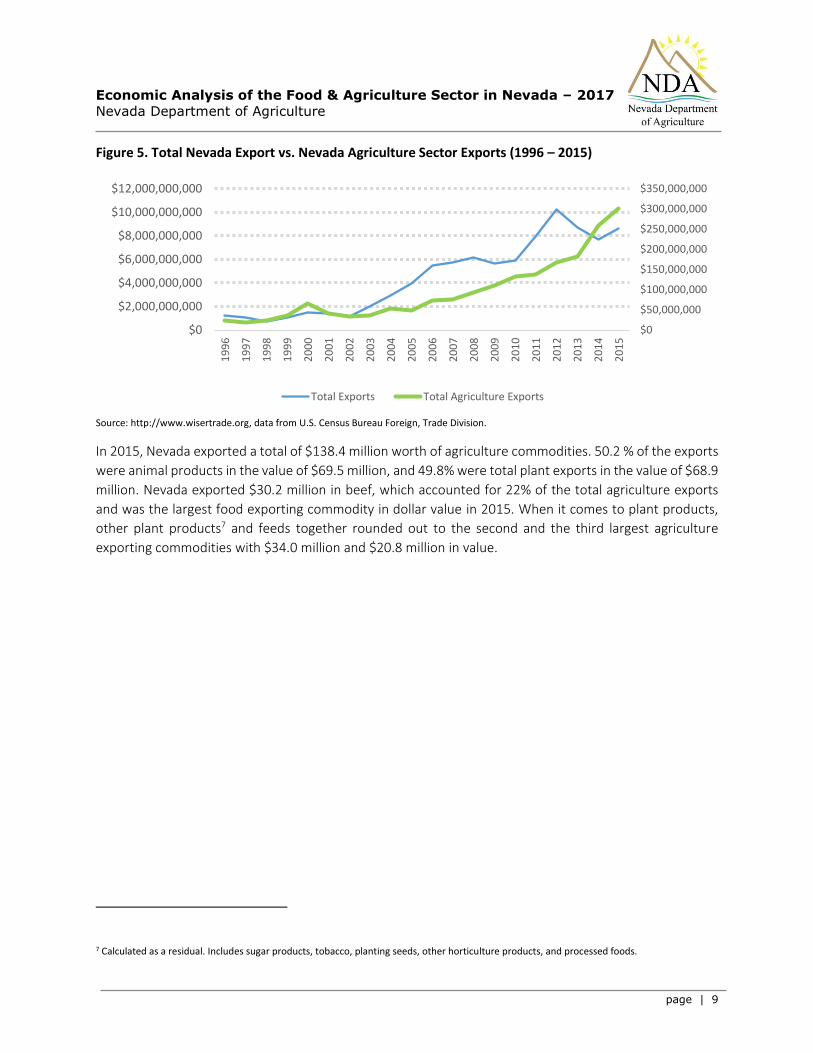
With the strong performance of the U.S. dollar and a slowing global economy, U.S. exports have slowed down. Year over year exports in the first month of 2015 are down 4.69%. Most industry sectors are experiencing downward trends as well; however, the food and agriculture sector in Nevada continues to thrive (Figure 5).
Total Agriculture Production
Employment, 45.4%Total Food
Manufacturing Employment,
54.6%
Economic Analysis of the Food & Agriculture Sector in Nevada – 2017
Nevada Department of Agriculture
page | 9
Figure 5. Total Nevada Export vs. Nevada Agriculture Sector Exports (1996 – 2015)
Source: http://www.wisertrade.org, data from U.S. Census Bureau Foreign, Trade Division.
In 2015, Nevada exported a total of $138.4 million worth of agriculture commodities. 50.2 % of the exports
were animal products in the value of $69.5 million, and 49.8% were total plant exports in the value of $68.9
million. Nevada exported $30.2 million in beef, which accounted for 22% of the total agriculture exports
and was the largest food exporting commodity in dollar value in 2015. When it comes to plant products,
other plant products7 and feeds together rounded out to the second and the third largest agriculture
exporting commodities with $34.0 million and $20.8 million in value.
7 Calculated as a residual. Includes sugar products, tobacco, planting seeds, other horticulture products, and processed foods.
$0
$50,000,000
$100,000,000
$150,000,000
$200,000,000
$250,000,000
$300,000,000
$350,000,000
$0
$2,000,000,000
$4,000,000,000
$6,000,000,000
$8,000,000,000
$10,000,000,000
$12,000,000,000
19
96
19
97
19
98
19
99
20
00
20
01
20
02
20
03
20
04
20
05
20
06
20
07
20
08
20
09
20
10
20
11
20
12
20
13
20
14
20
15
Total Exports Total Agriculture Exports
Economic Analysis of the Food & Agriculture Sector in Nevada – 2017
Nevada Department of Agriculture
page | 10
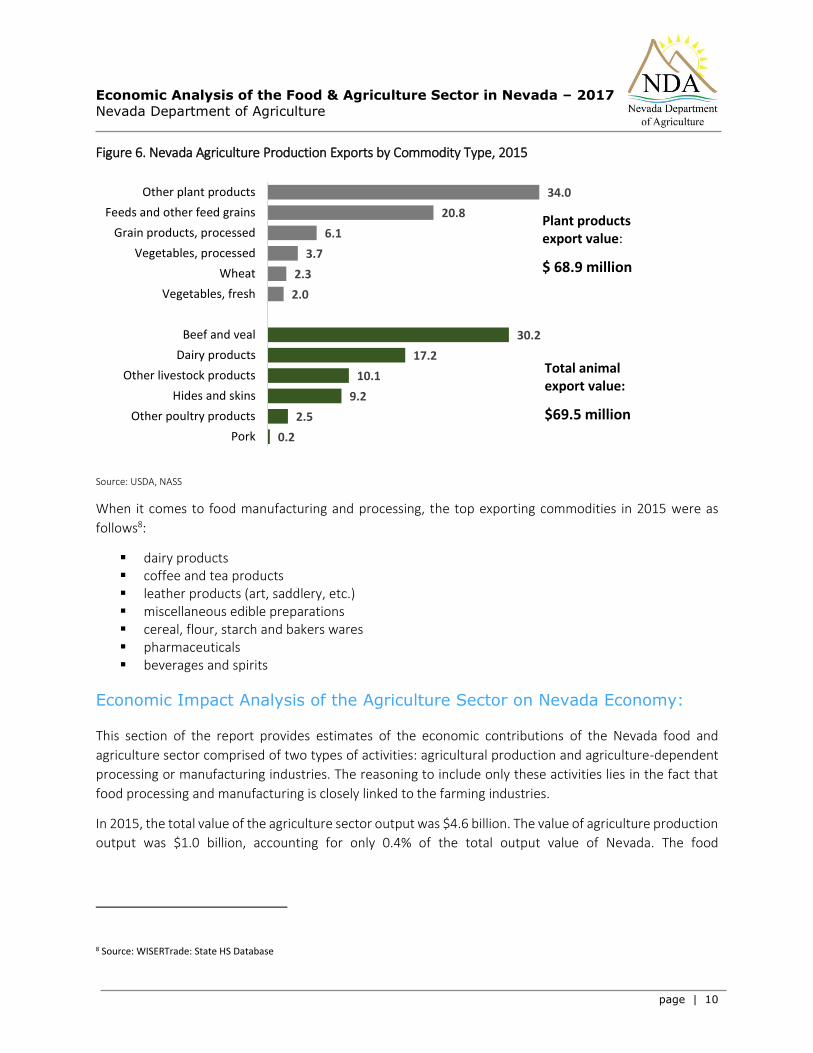
Figure 6. Nevada Agriculture Production Exports by Commodity Type, 2015
Source: USDA, NASS
When it comes to food manufacturing and processing, the top exporting commodities in 2015 were as
follows8:
dairy products coffee and tea products leather products (art, saddlery, etc.) miscellaneous edible preparations cereal, flour, starch and bakers wares pharmaceuticals beverages and spirits
Economic Impact Analysis of the Agriculture Sector on Nevada Economy:
This section of the report provides estimates of the economic contributions of the Nevada food and
agriculture sector comprised of two types of activities: agricultural production and agriculture-dependent
processing or manufacturing industries. The reasoning to include only these activities lies in the fact that
food processing and manufacturing is closely linked to the farming industries.
In 2015, the total value of the agriculture sector output was $4.6 billion. The value of agriculture production
output was $1.0 billion, accounting for only 0.4% of the total output value of Nevada. The food
8 Source: WISERTrade: State HS Database
0.2
2.5
9.2
10.1
17.2
30.2
2.0
2.3
3.7
6.1
20.8
34.0
Pork
Other poultry products
Hides and skins
Other livestock products
Dairy products
Beef and veal
Vegetables, fresh
Wheat
Vegetables, processed
Grain products, processed
Feeds and other feed grains
Other plant products
Plant productsexport value:
$ 68.9 million
Total animal export value:
$69.5 million

Economic Analysis of the Food & Agriculture Sector in Nevada – 2017
Nevada Department of Agriculture
page | 11
manufacturing output value accounted for 1.5% of the total county’s output with a value of $3.6 billion.
(Figure 7.)
Figure 7. Agriculture Sector Allocation in Total Value of Output (2015)
Source: Minnesota IMPLAN Group, Inc., 2015
In 2015, the total economic contribution of the agriculture sector on Nevada’s economy was an estimated
$1.8 billion. Give the multiplier impact, the total economic impact generated by Nevada agriculture
production activities was $1.1 billion. The total economic impact generated by agriculture and food
manufacturing operations was $793.7 million.
Table 3. Economic Impact of Agriculture Sector Industries in Nevada in 2015
Industry
Total Impact
Output Employment Labor Income ($mill) (Jobs) ($ mill)
Agriculture Production 1.1 2,307 270.5
Food Manufacturing 0.79 7,147 125.3
Total Agriculture Sector 1.8 9,454 395.8
Source: IMPLAN data for Nevada (2015)
When it comes to total employment, the total employment impact of the agriculture sector was 9,454 jobs.
Total employment impact from agriculture production industries was 2,307, and food manufacturing was
7,147 jobs. The multiplier offers a useful way to interpret these ripple effects. Table 4 shows the sector
multiplier.
Table 4. Industry Multipliers for the Agriculture Sector Industries on the Nevada Economy, 2015
Industry Employment
(Jobs) Total Output
($mill)
Total Agriculture Sector 1.9 1.6 Source: IMPLAN data for Nevada (2015)
Agriculture Production
Output, 0.4%
Food Manufacturing Output,
1.5%
Other Industries Output, 98.1%
Economic Analysis of the Food & Agriculture Sector in Nevada – 2017
Nevada Department of Agriculture
page | 12
The ratio of total direct impact to impact value yields a multiplier of 1.6, meaning that every dollar invested
in Nevada’s agriculture sector industries stimulates another $0.60 in additional economic activity in other
industries in the state. The employment multiplier was 1.9, meaning that every 10 jobs directly related to
agriculture support an additional 9 jobs in the state.
Economic Impact Analysis of the Agriculture Production Industries:
Agriculture production activities include primarily livestock and crop production, while agriculture support
activities are those associated with farm operations such as soil preparation, planting and harvesting. The
agriculture production industries include establishments primarily engaged in growing and harvesting
crops, raising animals, harvesting timber, etc. Establishments are described as farms, ranches, dairies,
greenhouses, nurseries, orchards or hatcheries and can be operated by the operator alone or with the
assistance of members of the household or hired employees.
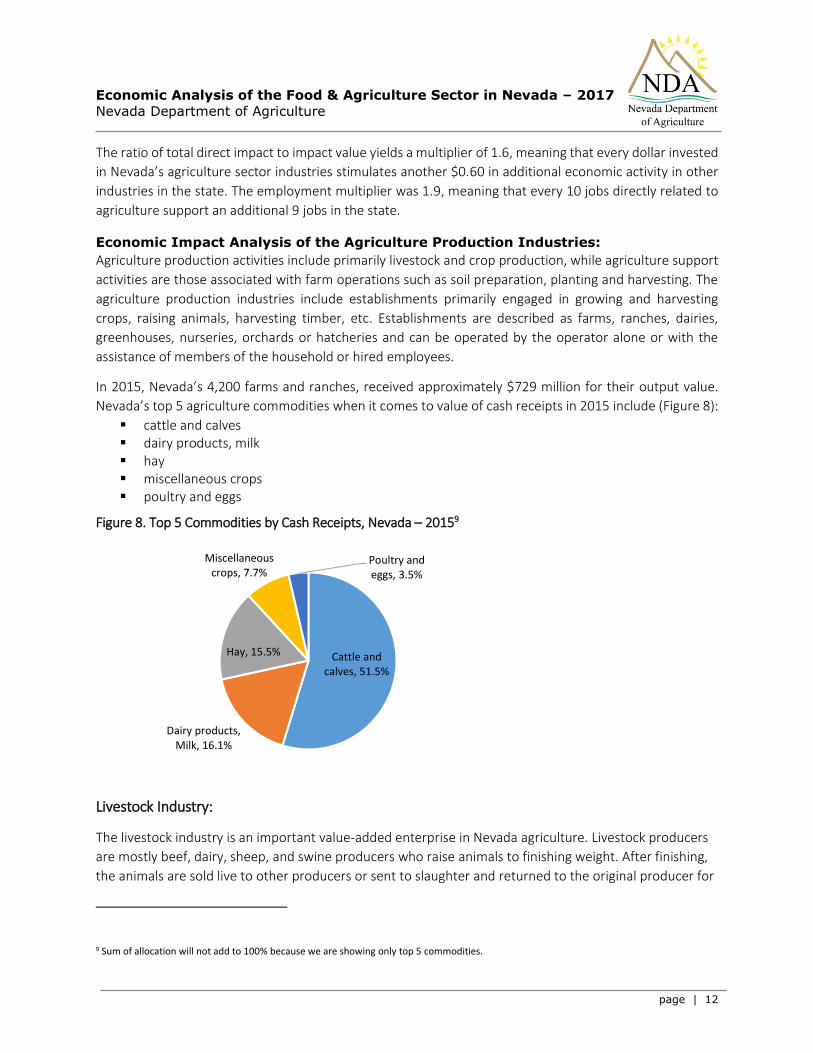
In 2015, Nevada’s 4,200 farms and ranches, received approximately $729 million for their output value.
Nevada’s top 5 agriculture commodities when it comes to value of cash receipts in 2015 include (Figure 8):
cattle and calves dairy products, milk hay miscellaneous crops poultry and eggs
Figure 8. Top 5 Commodities by Cash Receipts, Nevada – 20159
Livestock Industry:
The livestock industry is an important value-added enterprise in Nevada agriculture. Livestock producers
are mostly beef, dairy, sheep, and swine producers who raise animals to finishing weight. After finishing,
the animals are sold live to other producers or sent to slaughter and returned to the original producer for
9 Sum of allocation will not add to 100% because we are showing only top 5 commodities.
Cattle and calves, 51.5%
Dairy products, Milk, 16.1%
Hay, 15.5%
Miscellaneous crops, 7.7%
Poultry and eggs, 3.5%

Economic Analysis of the Food & Agriculture Sector in Nevada – 2017
Nevada Department of Agriculture
page | 13
retail sale. Major markets for producers to sell their products are on-site, to farmers markets and to retail
stores or restaurants. Many producers identified the lack of a USDA processing facility nearby as a barrier
to selling to a local market.
The industry sold about $541.58 million worth of goods. Figure 9 shows the allocation of cash receipts by
type of livestock commodity.
Figure 9. Cash receipts Allocation by Livestock Commodity in Nevada, 2015
Source: USDA/ERS
After beef industry, dairy and dairy products bring in the highest cash receipts ($117 million), accounting
for 90.9% of total cash receipts in 2015.
Economic Impact of the Nevada Livestock Industry
This report provides estimates of the economic contributions of the Nevada livestock industry, comprised
of the following activities:
beef cattle ranching and farming, including feedlots and dual-purpose ranching and farming dairy cattle and milk production poultry and egg production animal production, except cattle and poultry and eggs
Table 5 shows the economic impact of the livestock industry in 2015.
Table 5. Economic Impact of Livestock Industry, Nevada – 2015
Industry
Total Impact
Output Employment Labor Income ($mill) (Jobs) ($ mill)
Livestock Industry 755 3,962 154
Multipliers 1.9 2.2
Source: IMPLAN
Cattle and calves, 69.2%
Hogs, 0.2%
Dairy products,
Milk, 21.7%
Poultry and eggs, 4.7%
Miscellaneous animals and
products, 4.3%

Economic Analysis of the Food & Agriculture Sector in Nevada – 2017
Nevada Department of Agriculture
page | 14
The total economic contribution of the livestock industry on the Nevada economy was estimated at $755
million. This includes both direct and backward linked indirect economic activity resulting from livestock
industries. The total employment impact on the economy was 3,962 jobs with total labor income impact of
$154 million.
The value added multiplier was 1.8, meaning that every dollar invested in Nevada’s livestock production stimulates $0.80 in additional economic activity in the state. The employment multiplier of 2.2 means that every 10 jobs directly related to livestock industry support an additional 12 jobs in the state.
In this section, the report will provide estimates of the economic contribution of the top three livestock
industries when it comes to the value of cash receipts in 2015.
1. The Cattle and Calf Industry in Nevada
Nevada had an estimated 430,000 cattle and calves in inventory in 2015. Value of inventory in 2015 was
$748 million (Figure 10).
Figure 10. Cattle and Calf Industry Value of Inventory, Nevada (2010 – 2015)
Source: USDA/ERS
During 2015 there were 205,307 animals shipped to several different states. The following arbitrary
classifications were made to describe the movement of the Nevada cattle:
major destinations – states where more than 10,000 animals of all types is received minor destinations – states that received between 2,000 and 10,000 animals of all types from.
States that receive less than 2,000 animals from Nevada are not listed in our table.
Under this classification, approximately 78% of all cattle moved were shipped to five major destinations, 20% to six minor destinations (Table 7).
414,000,000460,000,000
554,600,000 547,400,000 575,000,000
748,200,000
2010 2011 2012 2013 2014 2015
Economic Analysis of the Food & Agriculture Sector in Nevada – 2017
Nevada Department of Agriculture
page | 15
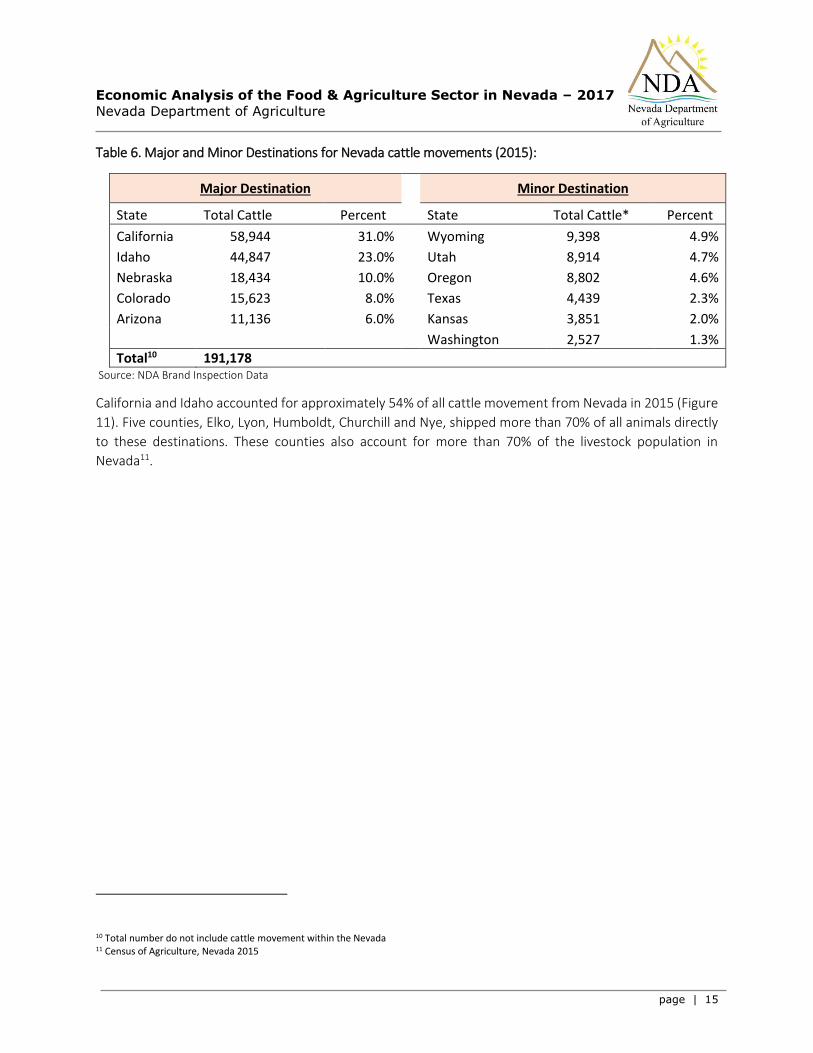
Table 6. Major and Minor Destinations for Nevada cattle movements (2015):
Major Destination Minor Destination
State Total Cattle Percent State Total Cattle* Percent
California 58,944 31.0% Wyoming 9,398 4.9%
Idaho 44,847 23.0% Utah 8,914 4.7%
Nebraska 18,434 10.0% Oregon 8,802 4.6%
Colorado 15,623 8.0% Texas 4,439 2.3%
Arizona 11,136 6.0% Kansas 3,851 2.0%
Washington 2,527 1.3%
Total10 191,178 Source: NDA Brand Inspection Data
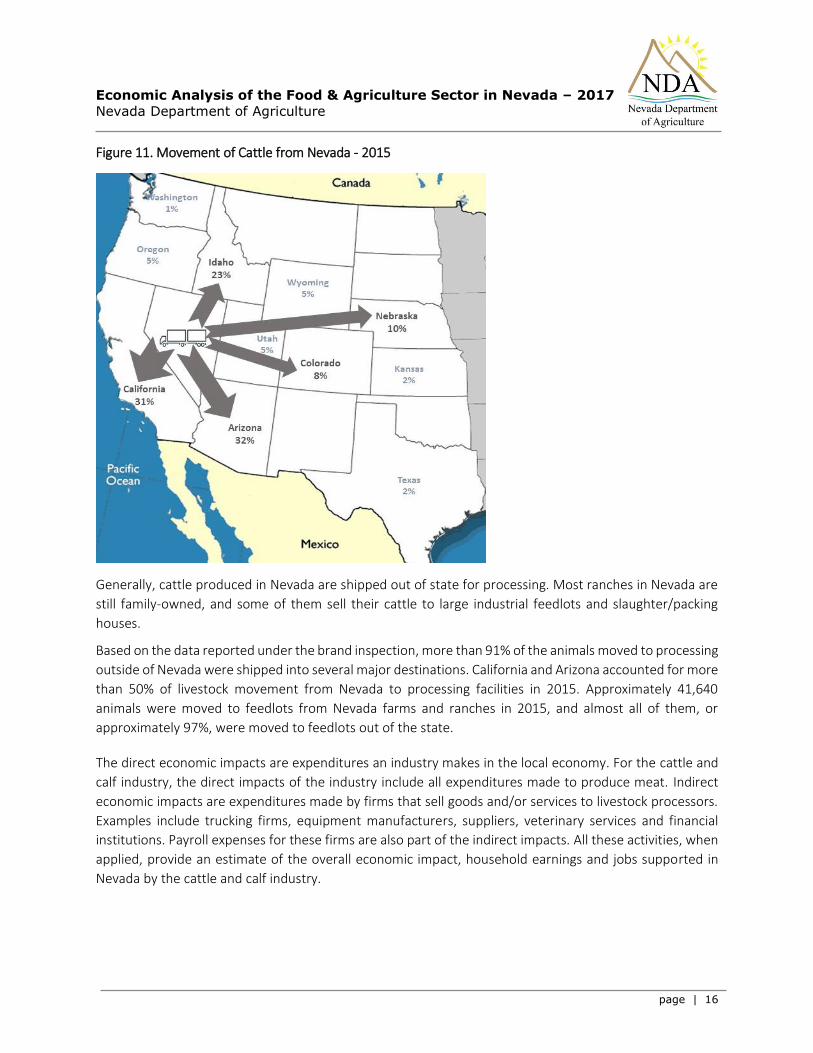
California and Idaho accounted for approximately 54% of all cattle movement from Nevada in 2015 (Figure
11). Five counties, Elko, Lyon, Humboldt, Churchill and Nye, shipped more than 70% of all animals directly
to these destinations. These counties also account for more than 70% of the livestock population in
Nevada11.
10 Total number do not include cattle movement within the Nevada 11 Census of Agriculture, Nevada 2015
Economic Analysis of the Food & Agriculture Sector in Nevada – 2017
Nevada Department of Agriculture
page | 16
Figure 11. Movement of Cattle from Nevada - 2015
Generally, cattle produced in Nevada are shipped out of state for processing. Most ranches in Nevada are
still family-owned, and some of them sell their cattle to large industrial feedlots and slaughter/packing
houses.
Based on the data reported under the brand inspection, more than 91% of the animals moved to processing
outside of Nevada were shipped into several major destinations. California and Arizona accounted for more
than 50% of livestock movement from Nevada to processing facilities in 2015. Approximately 41,640
animals were moved to feedlots from Nevada farms and ranches in 2015, and almost all of them, or
approximately 97%, were moved to feedlots out of the state.
The direct economic impacts are expenditures an industry makes in the local economy. For the cattle and
calf industry, the direct impacts of the industry include all expenditures made to produce meat. Indirect
economic impacts are expenditures made by firms that sell goods and/or services to livestock processors.
Examples include trucking firms, equipment manufacturers, suppliers, veterinary services and financial
institutions. Payroll expenses for these firms are also part of the indirect impacts. All these activities, when
applied, provide an estimate of the overall economic impact, household earnings and jobs supported in
Nevada by the cattle and calf industry.

Economic Analysis of the Food & Agriculture Sector in Nevada – 2017
Nevada Department of Agriculture
page | 17
Economic Impact of the Cattle and Calf Industry
Table 7. shows the economic impact of the cattle and calf industry on Nevada in 2015.
Table 7. Economic Impact of Cattle and Calf Industry, Nevada – 2015
Industry
Total Impact
Output Employment Labor Income ($mill) (Jobs) ($ mill)
Cattle and Calf Industry 642 3,431 125
Multipliers 1.9 2.2 Source: IMPLAN
The total economic contribution of the cattle and calf industry on Nevada’s economy was estimated at
$642 million. This includes both direct and backward linked indirect economic activity resulting from the
livestock industry. The total employment impact on the economy was 3,431 jobs with the total labor
income impact of $125 million.
The value added multiplier was 1.9, meaning that every dollar invested in Nevada’s cattle and calf
production industry production stimulates $0.90 in additional economic activity in the state. The
employment multiplier was 2.2 so for every 10 jobs directly related, cattle and calf production industry
supports an additional 12 jobs in the state.
2. The Dairy and Milk Production Industry:
Milk production in Nevada was estimated at 669 million pounds in 2015. Nevada’s dairy and milk
production in 2015 was estimated at $118 million, or approximately 22% of the total Nevada livestock
production (Figure 12.).
Figure 12. Milk Production Value, Nevada (2010 – 2015)
Source: USDA/ERS
$112,216,000
$137,862,000 $125,685,000 $129,717,000
$171,120,000
$118,413,000
2010 2011 2012 2013 2014 2015
Economic Analysis of the Food & Agriculture Sector in Nevada – 2017
Nevada Department of Agriculture
page | 18
Economic Impact of the Dairy and Milk Production Industry
The total economic contribution of the dairy and milk production industry on Nevada’s economy was
estimated at $103 million. This includes both direct and backward linked indirect economic activity resulting
from the dairy and milk production industry. Total employment impact on the economy was 460 jobs with
a total labor income impact of $25 million.
The value added multiplier was 1.6, meaning that every dollar invested in Nevada’s dairy and milk
production industry production stimulates $0.60 in additional economic activity in the state. The
employment multiplier was 2.3, that every 10 jobs directly related to the dairy and milk production industry
production support an additional 13 jobs in the state (Table 8.).
Table 8. Economic Impact of Dairy and Milk Production Industry, Nevada – 2015
Industry
Total Impact
Output Employment Labor Income ($mill) (Jobs) ($ mill)
Dairy and Milk Production 103 460 25
Multipliers 1.6 2.3 Source: IMPLAN
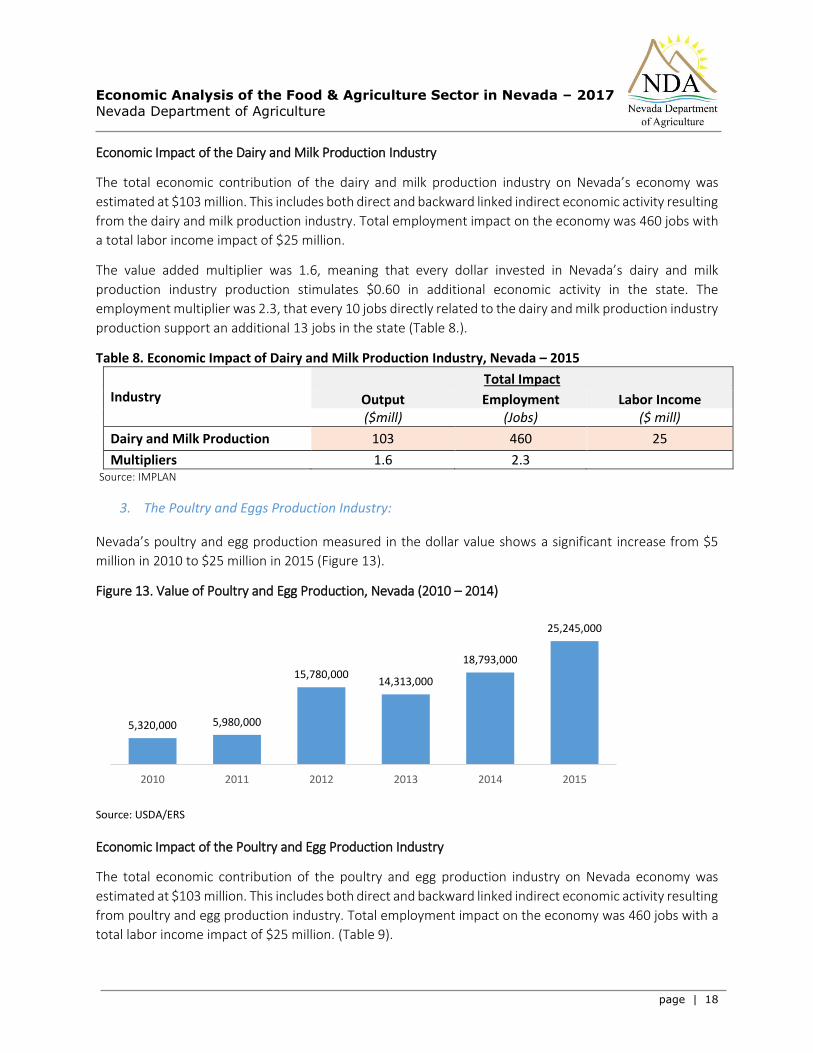
3. The Poultry and Eggs Production Industry:
Nevada’s poultry and egg production measured in the dollar value shows a significant increase from $5
million in 2010 to $25 million in 2015 (Figure 13).
Figure 13. Value of Poultry and Egg Production, Nevada (2010 – 2014)
Source: USDA/ERS
Economic Impact of the Poultry and Egg Production Industry
The total economic contribution of the poultry and egg production industry on Nevada economy was
estimated at $103 million. This includes both direct and backward linked indirect economic activity resulting
from poultry and egg production industry. Total employment impact on the economy was 460 jobs with a
total labor income impact of $25 million. (Table 9).
5,320,000 5,980,000
15,780,00014,313,000
18,793,000
25,245,000
2010 2011 2012 2013 2014 2015
Economic Analysis of the Food & Agriculture Sector in Nevada – 2017
Nevada Department of Agriculture
page | 19
Table 9. Economic Impact of Poultry and Egg Production Industry, Nevada – 2015
Industry
Total Impact
Output Employment Labor Income ($mill) (Jobs) ($ mill)
Poultry and Egg Production 1.1 3 207
Multipliers 1.4 2.4 Source: IMPLAN
The value-added multiplier was 1.4, meaning that every dollar invested in Nevada’s poultry and egg industry
production stimulates $0.40 in additional economic activity in the state. The employment multiplier was
2.4, that every 10 jobs directly related to poultry and egg production support an additional 4 jobs in the
state.
Plant Industry:
The plant industry is an important part of Nevada’s food and agriculture production industry, not only for
providing fresh food to a growing population but also for providing farm originated production inputs, like
feed crops and seeds to support livestock and other industries. The main crop product categories are food
grains (wheat), feed crops (hay), fruits and vegetables (onions, garlic, potatoes, and other), greenhouse,
nursery and floriculture and all other miscellaneous crops (mushrooms, etc.).
Fruit and nut tree production as well as many other vegetables and fruits were produced in the state but
their production is small, and for that reason the value of production is in the “other” category. Fruits and
vegetables grown by local producers were tomatoes, lettuce, peppers, onions, garlic, berries and apples.
Additional products, like pomegranate, melons, pumpkins, asparagus, eggplant, carrots, basil, peaches,
eggs and microgreens are also grown in Nevada.
The total value of the Nevada crop production, including potatoes and other crops, in 2015 was $173 million
(Figure 14.).

Economic Analysis of the Food & Agriculture Sector in Nevada – 2017
Nevada Department of Agriculture
page | 20
Figure 14. Value of Crop Production, Nevada (2010 – 2015)12
Source: USDA/ERS
The cash receipts from marketing crop products were $188 million in 2015. Feed crops contributed 60% to
the state’s crop cash receipts in 2015 (Figure 15).
Figure 15. Cash Receipts by Crop Commodity in Nevada, 2014
Source: USDA/ERS
All other miscellaneous crops are the second largest commodity bringing almost 30% of the total crop cash
receipts.
Economic Impact of the Nevada Plant Industry
The report provides the estimates of the economic contributions of Nevada’s plant industry comprised of the following activities:
grain farming (wheat)
12 Total value exclude horticulture
222,669,000
297,449,000
245,414,000221,138,000
282,123,000
172,823,000
2010 2011 2012 2013 2014 2015
Food grains, 2.2%
Feed crops, 60.3%
Vegetables and melons,
7.8%
All other crops, 29.7%
Economic Analysis of the Food & Agriculture Sector in Nevada – 2017
Nevada Department of Agriculture
page | 21
vegetable and melon farming fruit farming tree nut farming greenhouse, nursery and floriculture production all other crop farming (hay)
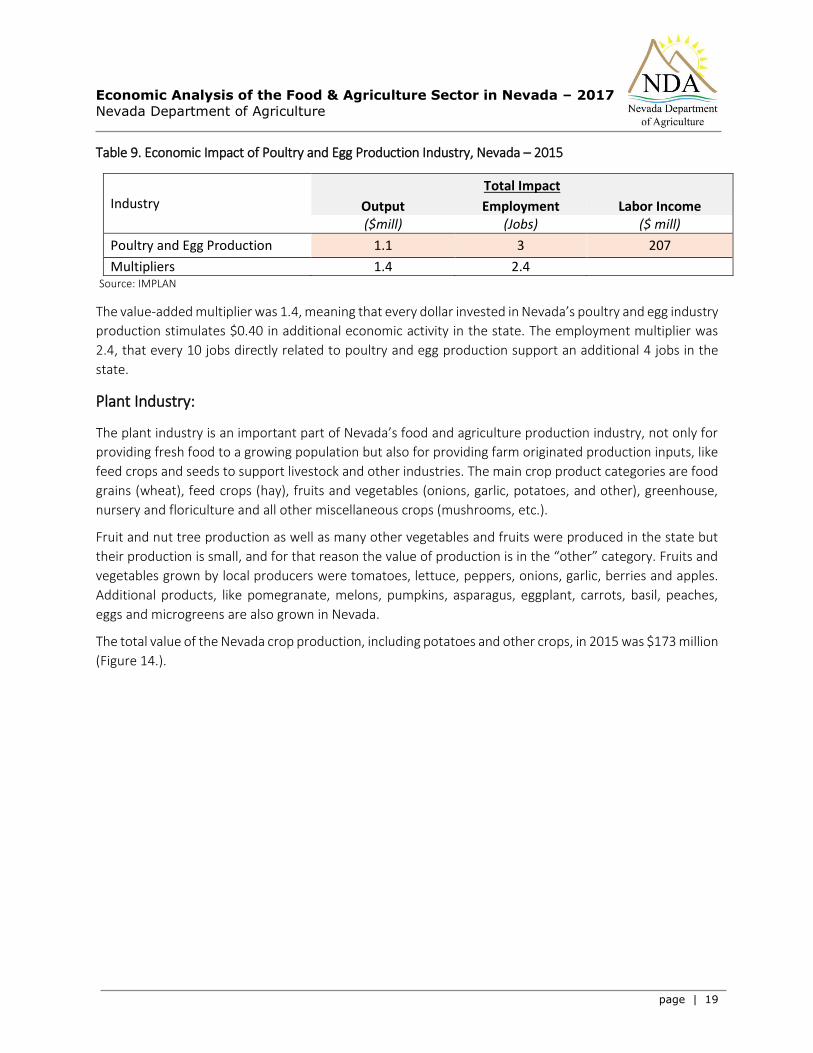
Table 9. Economic Impact of Plant Industry, Nevada – 2015
Industry
Total Impact
Output Employment Labor Income ($mill) (Jobs) ($ mill)
Plant Industry 265 2,641 102
Multipliers 1.6 1.4
Source: IMPLAN
The total economic contribution of the plant industry on Nevada’s economy was estimated at $265 million.
This includes both direct and backward linked indirect economic activity resulting from the plant industries.
The total employment impact on the economy was 2,641 jobs with total labor income impact of $102
million.
The value-added multiplier was 1.6, meaning that every dollar invested in Nevada’s plant industry
stimulates $0.60 in additional economic activity in the state. The employment multiplier of 1.4 means every
10 jobs directly related to plant industry support an additional 4 jobs in the state.
The report will provide analysis of the economic contribution of the top 3 plant industries.
1. Feed Crops
The main crop commodity produced in Nevada is hay. Nevada’s climate and irrigable soil are conducive to
the production of high quality and specialty hays. The total production of hay in 2015 was 1.1 million tons
with a total value measured at $196.2 million. Production of alfalfa was 860,000 tons and the value of the
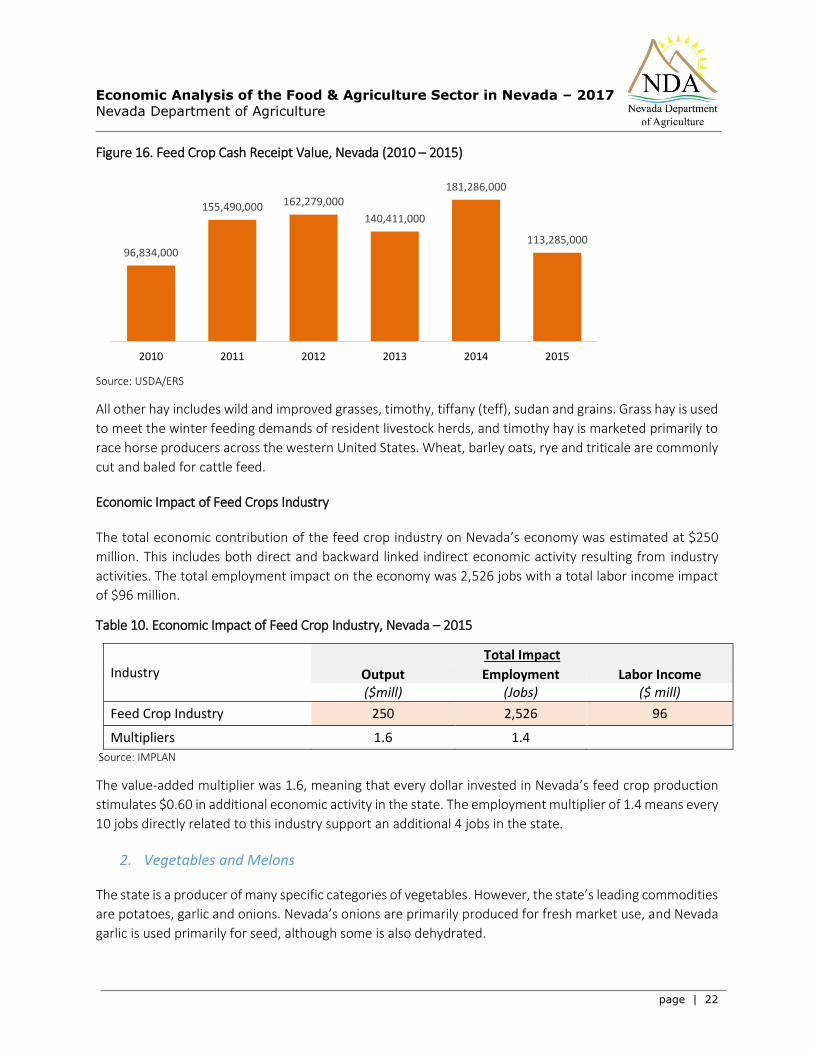
production was $145.3 million. In 2015, the cash receipts from selling feed crops were $113 million
showing a decrease from 2014 when the value was $181 million (Figure 16).
Economic Analysis of the Food & Agriculture Sector in Nevada – 2017
Nevada Department of Agriculture
page | 22
Figure 16. Feed Crop Cash Receipt Value, Nevada (2010 – 2015)
Source: USDA/ERS
All other hay includes wild and improved grasses, timothy, tiffany (teff), sudan and grains. Grass hay is used
to meet the winter feeding demands of resident livestock herds, and timothy hay is marketed primarily to
race horse producers across the western United States. Wheat, barley oats, rye and triticale are commonly
cut and baled for cattle feed.
Economic Impact of Feed Crops Industry
The total economic contribution of the feed crop industry on Nevada’s economy was estimated at $250
million. This includes both direct and backward linked indirect economic activity resulting from industry
activities. The total employment impact on the economy was 2,526 jobs with a total labor income impact
of $96 million.
Table 10. Economic Impact of Feed Crop Industry, Nevada – 2015
Industry
Total Impact
Output Employment Labor Income ($mill) (Jobs) ($ mill)
Feed Crop Industry 250 2,526 96
Multipliers 1.6 1.4
Source: IMPLAN
The value-added multiplier was 1.6, meaning that every dollar invested in Nevada’s feed crop production
stimulates $0.60 in additional economic activity in the state. The employment multiplier of 1.4 means every
10 jobs directly related to this industry support an additional 4 jobs in the state.
2. Vegetables and Melons
The state is a producer of many specific categories of vegetables. However, the state’s leading commodities
are potatoes, garlic and onions. Nevada’s onions are primarily produced for fresh market use, and Nevada
garlic is used primarily for seed, although some is also dehydrated.
96,834,000
155,490,000 162,279,000
140,411,000
181,286,000
113,285,000
2010 2011 2012 2013 2014 2015
Economic Analysis of the Food & Agriculture Sector in Nevada – 2017
Nevada Department of Agriculture
page | 23
Most of the acreage planted for these crops is in Lyon County. The value of onion production in 2015 was
approximately $9 million, and the value of garlic production for the same year was $1 million.
Along with onions and garlic, potatoes are another important row crop in Nevada. The value of potato
production was $4 million, according to 2015 data.
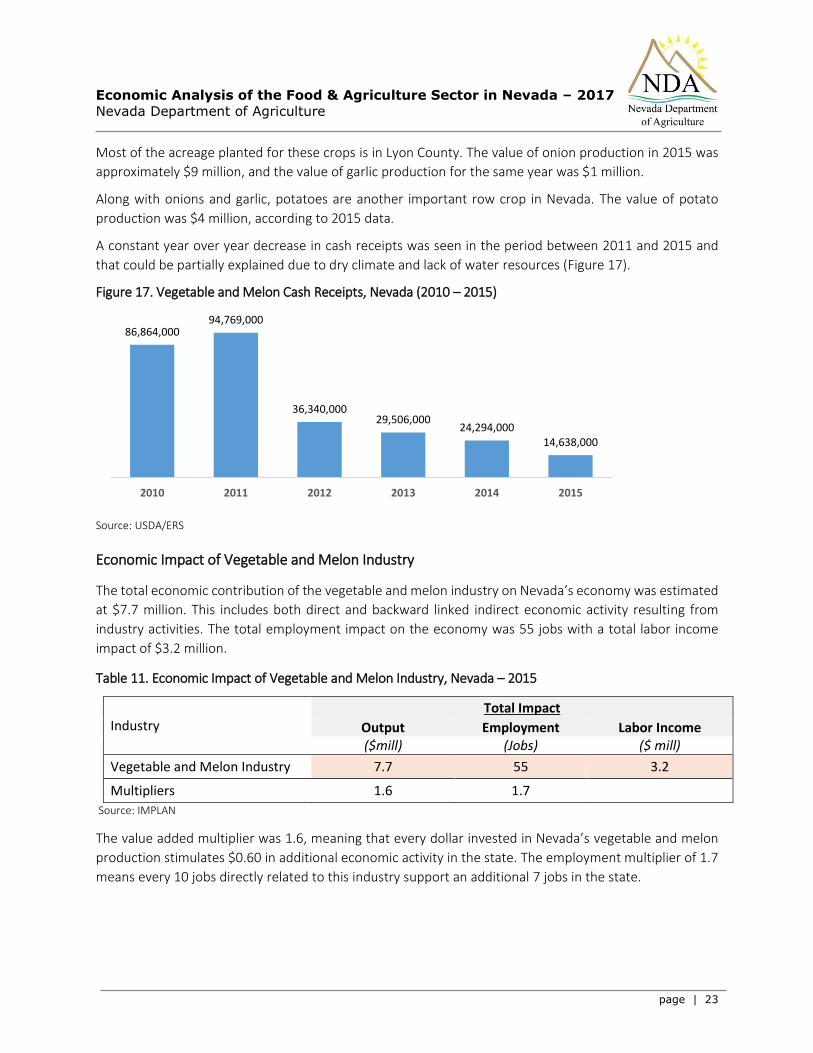
A constant year over year decrease in cash receipts was seen in the period between 2011 and 2015 and
that could be partially explained due to dry climate and lack of water resources (Figure 17).
Figure 17. Vegetable and Melon Cash Receipts, Nevada (2010 – 2015)
Source: USDA/ERS
Economic Impact of Vegetable and Melon Industry
The total economic contribution of the vegetable and melon industry on Nevada’s economy was estimated
at $7.7 million. This includes both direct and backward linked indirect economic activity resulting from
industry activities. The total employment impact on the economy was 55 jobs with a total labor income
impact of $3.2 million.
Table 11. Economic Impact of Vegetable and Melon Industry, Nevada – 2015
Industry
Total Impact
Output Employment Labor Income ($mill) (Jobs) ($ mill)
Vegetable and Melon Industry 7.7 55 3.2
Multipliers 1.6 1.7
Source: IMPLAN
The value added multiplier was 1.6, meaning that every dollar invested in Nevada’s vegetable and melon
production stimulates $0.60 in additional economic activity in the state. The employment multiplier of 1.7
means every 10 jobs directly related to this industry support an additional 7 jobs in the state.
86,864,00094,769,000
36,340,00029,506,000
24,294,00014,638,000
2010 2011 2012 2013 2014 2015

Economic Analysis of the Food & Agriculture Sector in Nevada – 2017
Nevada Department of Agriculture
page | 24
3. Greenhouse, Nursery, and Floriculture Production
Greenhouse and nursery crops are considered high value crops. They are typically grown in greenhouses
and nurseries, and they are grown mostly for residential and commercial landscaping, gardening or indoor
use. They usually do not require significant land; however, they do require a significant amount of water,
fertilizers and pesticides so their production could be considered fairly capital-intensive. Growing food
under cover or indoors is becoming a popular method of crop production.
Growth in urban areas of the state has provided a demand base for these crops. The estimated market
value of products sold was $17.5 million in 201213 (Figure 18).
Figure 18. Nursery, Greenhouse, Floriculture Value of Cash Receipts, Nevada (1997 - 2012):
Source: USDA/ERS
Economic Analysis of Food Manufacturing Industries in Nevada:
In 2015, Nevada was home to 334 private food manufacturing establishments, receiving approximately
$3.6 billion for their output. The largest concentration of food and manufacturing and processing industry
establishments is evident in two major urban counties: Washoe and Clark County. Those two counties have
the largest population, and they are also the major markets for food and agriculture products.
The top 5 food manufacturing industries in Nevada by output value are:
Bread and bakery product, except frozen, manufacturing
Bottled and canned soft drinks & water
Fluid milk manufacturing
Ice cream and frozen dessert manufacturing
All other food manufacturing
These industries account for 42% of the total food manufacturing output in Nevada. (Figure 19.)
13 Source of data is Census of Agriculture, Nevada and data is available only for 2012.
$16,000,000
$10,000,000 $12,000,000
$17,484,949
1997 2002 2007 2012

Economic Analysis of the Food & Agriculture Sector in Nevada – 2017
Nevada Department of Agriculture
page | 25
Figure 19. Top 5 Food Manufacturing Industries by Value of Production, Nevada – 2015:14
Source: IMPLAN 2015
The importance of bread and bakery product entrepreneurs can be seen in the size of the bread and bakery
production industry in the state, which accounts for more than $404.1 million in industry sales. Another
important industry is the bottled and canned soft drinks & water manufacturing industry totaling $349.1
million in production value. The size of the Nevada dairy industry is reflected in the size of the fluid milk
industry, and the production of other dairy products with total industry sales of $289.2 million in 2015.
This report provides estimates of the economic contributions of the Nevada food manufacturing industries,
comprised of the 36 activities. These 36 activities are grouped into 10 main food manufacturing activities:
Animal Food Manufacturing Grain and Oilseed Milling Sugar and Confectionery Product Fruit and Vegetable Preserving Specialty Food Dairy Product Manufacturing Animal Slaughtering and Processing Bakeries and Tortilla Manufacturing Other Food Manufacturing Beverage and Tobacco Product Manufacturing
Table 13. shows the economic contribution of these 10 food manufacturing activities on Nevada’s economy.
14 Sum of allocation will not add to 100% because we are showing only top 5 commodities.
Bread and bakery product, except frozen, manufacturing,
11.2%
All other food manufacturing,
6.4%Ice cream and frozen dessert manufacturing,
6.5%
Bottled and canned soft
drinks & water, 9.7%
Frozen specialties
manufacturing, 4.1%

Economic Analysis of the Food & Agriculture Sector in Nevada – 2017
Nevada Department of Agriculture
page | 26
Table 13. Economic Impact of Food Manufacturing Industry Activities, Nevada – 2015
Industry
Total Impact
Output Employment Labor Income ($mill) (Jobs) ($ mill)
Animal Food Manufacturing 10.8 21 1.2
Grain and Oilseed Milling 20.7 34 2.0
Bakeries and Tortilla Manufacturing 76.7 512 21.1
Sugar and Confectionery Product 2.8 11 0.5
Fruit and Vegetable Preserving 7.7 55 3.2
Specialty Food 23.5 79 4.2
Dairy Product Manufacturing 178.9 522 32.1
Animal Slaughtering and Processing 8.4 28 1.3
Other Food Manufacturing 14.1 57 2.6
Beverage and Tobacco Product Manufacturing 89.0 251 14.8
Source: IMPLAN
Conclusion: The Nevada agriculture sector is an important part of Nevada’s economy. This report addressed the
dynamics of the entire sector: how industries are related to each other, what jobs are created due to this
interconnection and how much income is generated, directly and indirectly.
The food and agriculture system is fairly complex and interconnected. Inputs are used at the farm level to
produce crops, livestock, milk, fruits and vegetables. Farm products are then collected, graded, sorted, etc.
Next, the commodities are sent to food processors to create manufactured food products or in the case of
fresh fruits and vegetables, sent to wholesalers and brokers to be sold to retailers such as supermarkets or
the food service industry. The manufactured food products are then wholesaled and retailed or consumed
in restaurants.
Agriculture has the closest linkages with manufacturing of food products, beverages and tobacco (deliveries
of fodder and fodder supplements for the animals), market services (wholesale, transport and storage, real
estate, renting and business services and financial intermediation) and electricity, gas and hot water supply.
In addition, agriculture is relatively less dependent on imports.
Locally-produced food has larger multiplier effects than food “imported” from outside the region that is
consumed in Nevada. Local production and processing/manufacturing means that more money stays in the
region than would otherwise be the case, yielding a larger overall local economic impact (roughly two to
one). Expansion of cost-competitive agriculture, as well as increased food-related processing and
production, should be an economic development target.
Economic Analysis of the Food & Agriculture Sector in Nevada – 2017
Nevada Department of Agriculture
page | 27
Nevada’s food and agriculture sector accounts for a total of almost $1.8 billion in total economic activity
and more than 15,584 jobs. Given these figures, the importance of the food and agriculture system on the
economy is evident. Because food is a necessity, the food and agriculture system is more resistant to the
negative impacts of a recession.
An Economic Analysis of the Food and Agriculture Sector in
Nevada – Counties
The following part of the report will provide the economic analysis of agriculture sector in each county.
CARSON CITY:
Overview: This report provides a profile of the agriculture sector and an overview of the economic impact the
agriculture sector has on the economy of Carson City.
From the Census data, Carson City had 21 farms, covering only 3% of land. More than 80% of farms
were small size farms between 1 to 49 acres.
In 2015, Carson City’s total value of the agriculture sector output was $145 million accounting for
3% of the total county’s production output. The largest agriculture production industries by output
value were:
Commercial fishing ($62.7 million)
Dairy cattle and milk production ($14.9 million)
Vegetable and melon farming ($4.5 million)
These industries account for more than 57% of total agriculture sector output.
The largest food manufacturing industries by output value level were:
Bread and bakery product ($26.2 million)
Non chocolate confectionery manufacturing ($12.1 million)
Meat processed from carcasses ($11.4)
These industries accounts for 34% of Carson City agriculture sector output.
The total county employment was 37,067. The agriculture sector in Carson City had 547 employees accounting for 1% of the total county employment.
In 2015, Carson City labor income of the agriculture sector was $26.3 million accounting for 1% of the total county’s income.
The agriculture sector total exports were $134 million, and $45.5 million were total foreign exports to international markets. The agriculture production had $57.6 million more in exports than
Economic Analysis of the Food & Agriculture Sector in Nevada – 2017
Nevada Department of Agriculture
page | 28
imports. The agricultural production industries in Carson City had a positive balance of trade. This shows the importance of agriculture production to Carson City’s economy.
However, the food and manufacturing industries had negative trade balance of $120.6 million. A negative trade balance shows that most of Carson City food manufacturing commodities were purchased from outside of the county.
In 2015, given the economic inter-linkage and multiplier effect, the total economic impact to the county’s economy from all the agricultural sector activities was $102 million. The total employment impacts from activity of the agricultural sectors was 808 jobs and $39 million in labor income.
Food and Agriculture Sector – Carson City:
Agriculture Land and Farms:
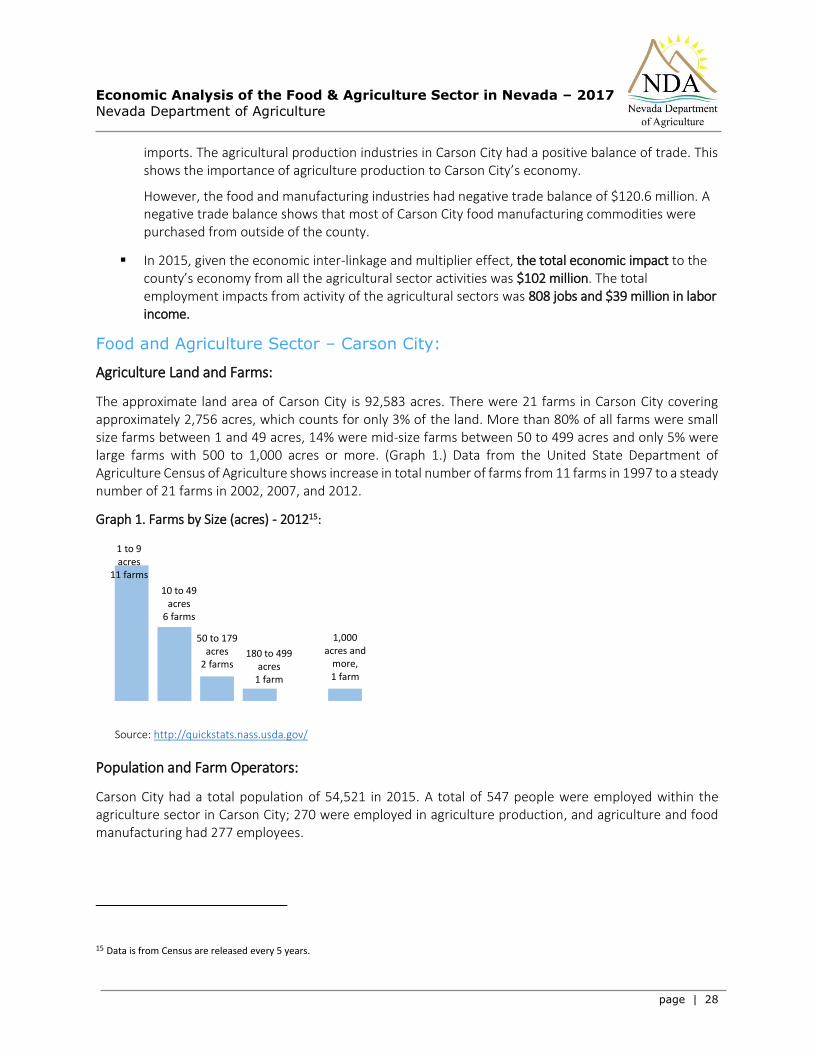
The approximate land area of Carson City is 92,583 acres. There were 21 farms in Carson City covering approximately 2,756 acres, which counts for only 3% of the land. More than 80% of all farms were small size farms between 1 and 49 acres, 14% were mid-size farms between 50 to 499 acres and only 5% were large farms with 500 to 1,000 acres or more. (Graph 1.) Data from the United State Department of Agriculture Census of Agriculture shows increase in total number of farms from 11 farms in 1997 to a steady number of 21 farms in 2002, 2007, and 2012.
Graph 1. Farms by Size (acres) - 201215:
Source: http://quickstats.nass.usda.gov/
Population and Farm Operators:
Carson City had a total population of 54,521 in 2015. A total of 547 people were employed within the agriculture sector in Carson City; 270 were employed in agriculture production, and agriculture and food manufacturing had 277 employees.
15 Data is from Census are released every 5 years.
1 to 9 acres
11 farms
10 to 49 acres
6 farms
50 to 179 acres
2 farms180 to 499
acres 1 farm
1,000 acres and
more, 1 farm
Economic Analysis of the Food & Agriculture Sector in Nevada – 2017
Nevada Department of Agriculture
page | 29
Analysis of Agriculture Sector Economic Data:
From the IMPLAN input-output model databases (2015), there were approximately 227 different industries in Carson City, and only 8 were the agriculture production industries:
Greenhouse, nursery, and floriculture production
All other crop farming
Beef cattle ranching and farming
Dairy cattle and milk production
Animal production, except cattle and poultry and eggs
Commercial fishing
Commercial logging
Support activities for agriculture and forestry
Food manufacturing industries of Carson City are listed below:
Bread and bakery product manufacturing
No chocolate confectionery manufacturing
Meat processed from carcasses
Coffee and tea manufacturing
Breweries
Tortilla manufacturing
Frozen cakes and other pastries manufacturing
Food manufacturing industries, combined with the agriculture production industries, provide the economic description of the agriculture sector of Carson City.
Sectorial Value of Output, Employment and Labor Income:
In 2015, the total value of the agriculture sector output was $145 million. The value of agriculture production output was $83 million, accounting for only 2% of the total output value of Carson City. The agriculture and food manufacturing output value accounted for 1% of the total county’s output with value of $62 million. (Graph 2.)

Economic Analysis of the Food & Agriculture Sector in Nevada – 2017
Nevada Department of Agriculture
page | 30
Graph 2. Agriculture Sector Allocation in Total Value of Output (2015):
Source: Minnesota IMPLAN Group, Inc., 2015
The agriculture sector employment accounts for only 1% of the total county’s employment in 2015. When looking at the levels of labor income, the agriculture sector made up approximately 1% of the total Carson City labor income valued at approximately $26.3 million.
Sectorial Value of Export and Import:
The agriculture sector export value in 2015 was $133.6 million and foreign exports to international markets were $45.5 million.
The total value of agriculture production exports was $81.6 million and the value of imports was $23.9 million, creating a positive trade balance of $57.7 million. The commodities with positive trade balance were dairy cattle and milk products, fish and greenhouse, nursery and floriculture products, while fruits, vegetables and melons and beef cattle were the largest importing commodities within the agriculture production sector. By identifying input-output sector commodities that are imported, the county can target these for import substitution efforts. The agricultural production sector in Carson City is a positive economic sector in its contribution to the favorable balance of trade. This shows the importance of agriculture production to the Carson City economy.
The food manufacturing sector imports were $120.6 million more than exports. The negative trade balance shows that most of Carson City food manufacturing commodities were purchased from outside of the county.
Economic Impact Analysis of the Agriculture Sector on Carson City Economy:
The economic impact analysis shows the impact of agriculture production and food manufacturing activities on the total Carson City economy. Table 1. shows the impacts of the agriculture sector industries on the Carson City economy.
In 2015, the total economic impact of the agriculture sector on Carson City’s economy was $183.9 million. Give the multiplier impact, the total economic impact generated by Carson City agriculture production activities was $101.8 million. The total economic impact generated by agriculture and food manufacturing operations was $82 million.
Agriculture Production
Output, 2.0%
Food Manufacturing Output, 1.0%
Other Industries Output, 97.0%
Economic Analysis of the Food & Agriculture Sector in Nevada – 2017
Nevada Department of Agriculture
page | 31
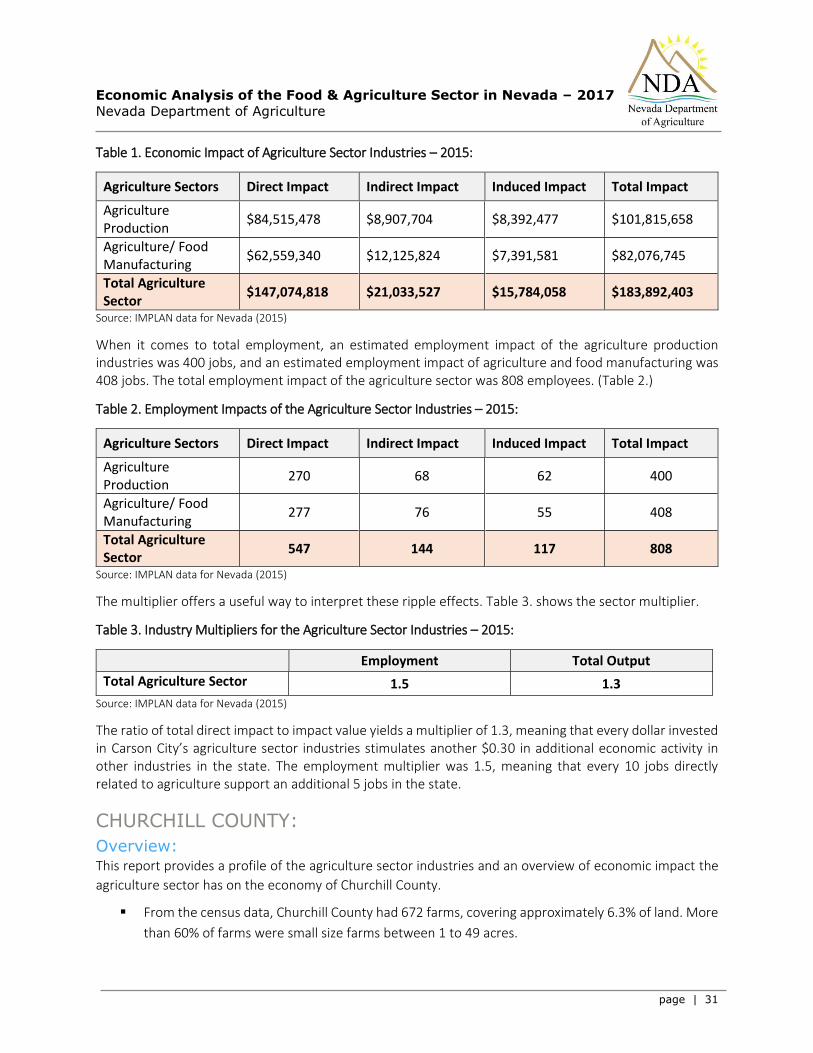
Table 1. Economic Impact of Agriculture Sector Industries – 2015:
Agriculture Sectors Direct Impact Indirect Impact Induced Impact Total Impact
Agriculture Production
$84,515,478 $8,907,704 $8,392,477 $101,815,658
Agriculture/ Food Manufacturing
$62,559,340 $12,125,824 $7,391,581 $82,076,745
Total Agriculture Sector
$147,074,818 $21,033,527 $15,784,058 $183,892,403
Source: IMPLAN data for Nevada (2015)
When it comes to total employment, an estimated employment impact of the agriculture production industries was 400 jobs, and an estimated employment impact of agriculture and food manufacturing was 408 jobs. The total employment impact of the agriculture sector was 808 employees. (Table 2.)
Table 2. Employment Impacts of the Agriculture Sector Industries – 2015:
Agriculture Sectors Direct Impact Indirect Impact Induced Impact Total Impact
Agriculture Production
270 68 62 400
Agriculture/ Food Manufacturing
277 76 55 408
Total Agriculture Sector
547 144 117 808
Source: IMPLAN data for Nevada (2015)
The multiplier offers a useful way to interpret these ripple effects. Table 3. shows the sector multiplier.
Table 3. Industry Multipliers for the Agriculture Sector Industries – 2015:
Employment Total Output
Total Agriculture Sector 1.5 1.3
Source: IMPLAN data for Nevada (2015)
The ratio of total direct impact to impact value yields a multiplier of 1.3, meaning that every dollar invested in Carson City’s agriculture sector industries stimulates another $0.30 in additional economic activity in other industries in the state. The employment multiplier was 1.5, meaning that every 10 jobs directly related to agriculture support an additional 5 jobs in the state.
CHURCHILL COUNTY:
Overview: This report provides a profile of the agriculture sector industries and an overview of economic impact the
agriculture sector has on the economy of Churchill County.
From the census data, Churchill County had 672 farms, covering approximately 6.3% of land. More
than 60% of farms were small size farms between 1 to 49 acres.
Economic Analysis of the Food & Agriculture Sector in Nevada – 2017
Nevada Department of Agriculture
page | 32
In 2015, Churchill County’s total value of agriculture sector output was $224.3 million accounting
for 9% of the total county’s production output. The largest agriculture production industries by
output value were:
Dairy cattle and milk production ($50.5 million)
All other crop farming including hay ($28.6 million)
Beef cattle ranching and farming ($27.7 million)
These industries account for more than 48% of total agriculture sector output.
The largest food manufacturing industries by output value level were:
Dry, condensed, and evaporated dairy product manufacturing ($71.3 million)
Animal, except poultry, slaughtering ($27.3 million)
Bread and bakery product, except frozen, manufacturing ($1.3 million)
These industries accounted for 45% of Churchill County’s agriculture sector output.
The total county employment was 23,500. The agriculture sector in Churchill County had 965
employees accounting for 4% of the total county employment.
In 2015, Churchill County’s labor income of the agriculture sector was $38.0 million accounting for
5% of the total county’s income.
The agriculture sector total exports were $192 million, and $15.9 million were total foreign exports
to international markets. The agriculture production made $58.9 million more in exports than
imports creating a positive trade balance. Agriculture production in Churchill County was a positive
economic sector in its contribution to the favorable balance of trade, showing importance of the
agriculture sector to the Churchill County economy. The agriculture and food manufacturing
industries created $1.2 million more in imports than exports. The negative trade balance showed
that most of Churchill County food manufacturing commodities were purchased from outside of
the county.
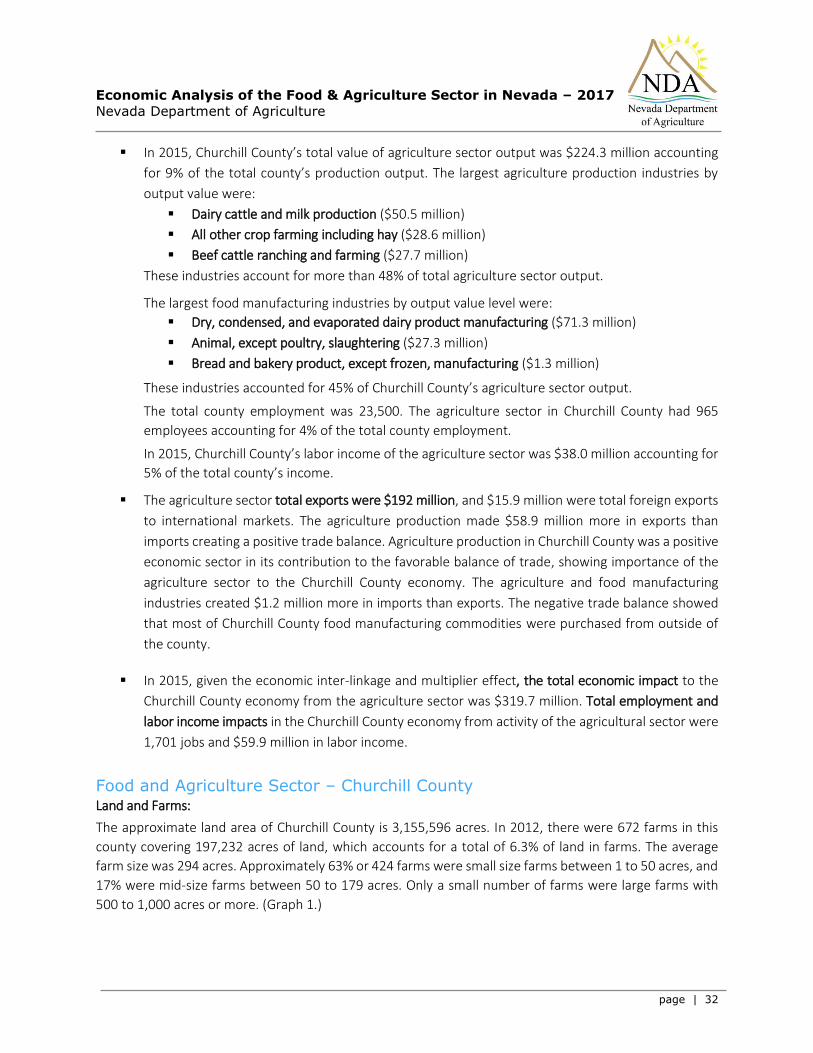
In 2015, given the economic inter-linkage and multiplier effect, the total economic impact to the
Churchill County economy from the agriculture sector was $319.7 million. Total employment and
labor income impacts in the Churchill County economy from activity of the agricultural sector were
1,701 jobs and $59.9 million in labor income.
Food and Agriculture Sector – Churchill County
Land and Farms:
The approximate land area of Churchill County is 3,155,596 acres. In 2012, there were 672 farms in this
county covering 197,232 acres of land, which accounts for a total of 6.3% of land in farms. The average
farm size was 294 acres. Approximately 63% or 424 farms were small size farms between 1 to 50 acres, and
17% were mid-size farms between 50 to 179 acres. Only a small number of farms were large farms with
500 to 1,000 acres or more. (Graph 1.)
Economic Analysis of the Food & Agriculture Sector in Nevada – 2017
Nevada Department of Agriculture
page | 33
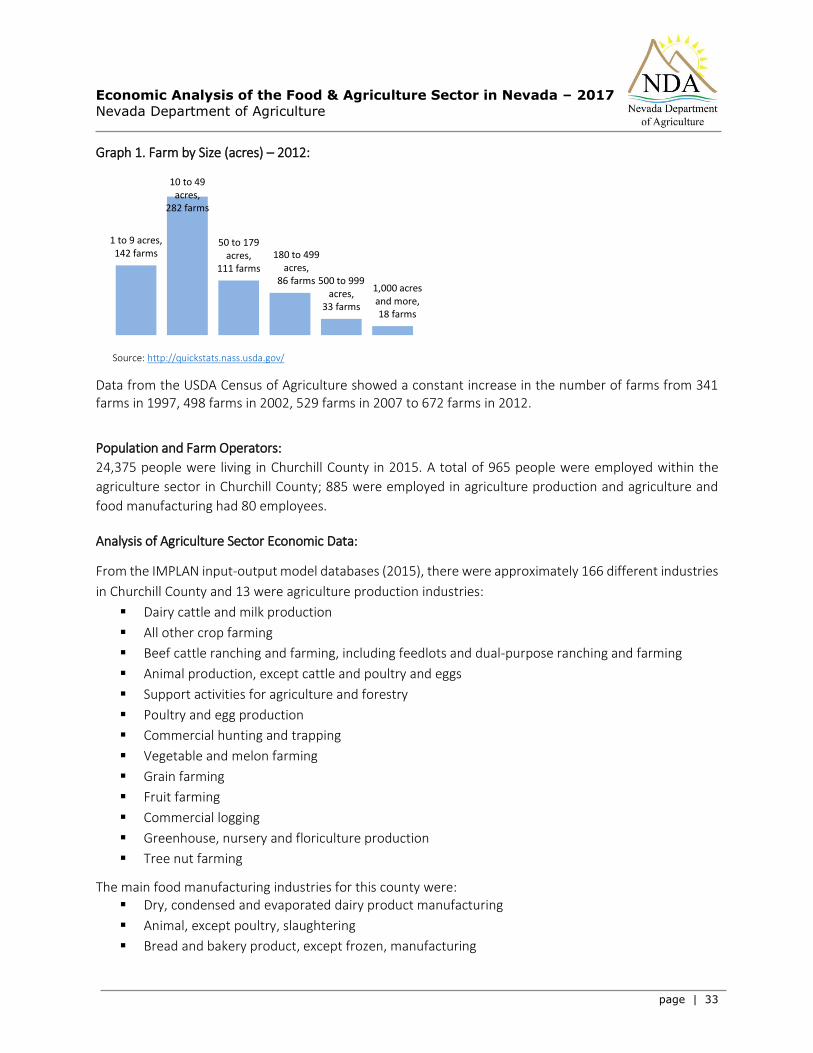
Graph 1. Farm by Size (acres) – 2012:
Source: http://quickstats.nass.usda.gov/
Data from the USDA Census of Agriculture showed a constant increase in the number of farms from 341 farms in 1997, 498 farms in 2002, 529 farms in 2007 to 672 farms in 2012.
Population and Farm Operators:
24,375 people were living in Churchill County in 2015. A total of 965 people were employed within the
agriculture sector in Churchill County; 885 were employed in agriculture production and agriculture and
food manufacturing had 80 employees.
Analysis of Agriculture Sector Economic Data:
From the IMPLAN input-output model databases (2015), there were approximately 166 different industries
in Churchill County and 13 were agriculture production industries:
Dairy cattle and milk production
All other crop farming
Beef cattle ranching and farming, including feedlots and dual-purpose ranching and farming
Animal production, except cattle and poultry and eggs
Support activities for agriculture and forestry
Poultry and egg production
Commercial hunting and trapping
Vegetable and melon farming
Grain farming
Fruit farming
Commercial logging
Greenhouse, nursery and floriculture production
Tree nut farming
The main food manufacturing industries for this county were: Dry, condensed and evaporated dairy product manufacturing
Animal, except poultry, slaughtering
Bread and bakery product, except frozen, manufacturing
1 to 9 acres, 142 farms
10 to 49 acres,
282 farms
50 to 179 acres,
111 farms
180 to 499 acres,
86 farms 500 to 999 acres,
33 farms
1,000 acres and more, 18 farms
Economic Analysis of the Food & Agriculture Sector in Nevada – 2017
Nevada Department of Agriculture
page | 34
Frozen cakes and other pastries manufacturing
The food manufacturing industries, combined with agriculture production industries, provide the economic
description of the agriculture sector of Churchill County.
Sectorial Value of Output, Employment and Labor Income:
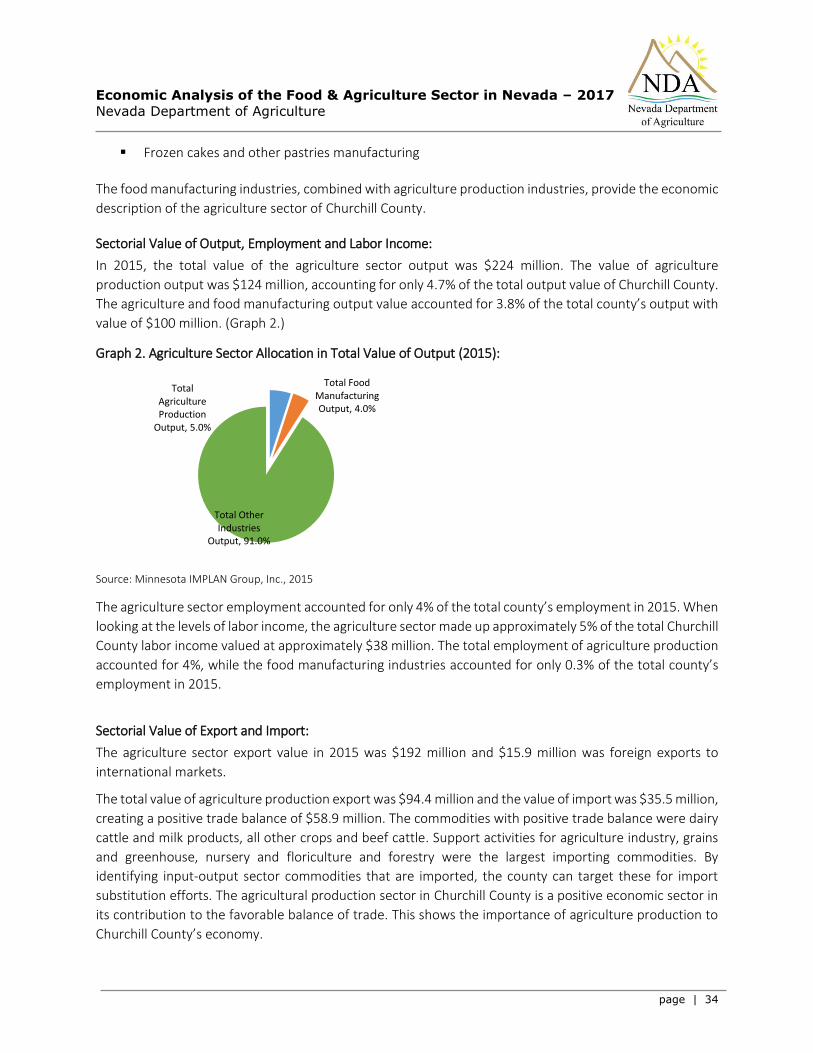
In 2015, the total value of the agriculture sector output was $224 million. The value of agriculture
production output was $124 million, accounting for only 4.7% of the total output value of Churchill County.
The agriculture and food manufacturing output value accounted for 3.8% of the total county’s output with
value of $100 million. (Graph 2.)
Graph 2. Agriculture Sector Allocation in Total Value of Output (2015):
Source: Minnesota IMPLAN Group, Inc., 2015
The agriculture sector employment accounted for only 4% of the total county’s employment in 2015. When
looking at the levels of labor income, the agriculture sector made up approximately 5% of the total Churchill
County labor income valued at approximately $38 million. The total employment of agriculture production
accounted for 4%, while the food manufacturing industries accounted for only 0.3% of the total county’s
employment in 2015.
Sectorial Value of Export and Import:
The agriculture sector export value in 2015 was $192 million and $15.9 million was foreign exports to
international markets.
The total value of agriculture production export was $94.4 million and the value of import was $35.5 million,
creating a positive trade balance of $58.9 million. The commodities with positive trade balance were dairy
cattle and milk products, all other crops and beef cattle. Support activities for agriculture industry, grains
and greenhouse, nursery and floriculture and forestry were the largest importing commodities. By
identifying input-output sector commodities that are imported, the county can target these for import
substitution efforts. The agricultural production sector in Churchill County is a positive economic sector in
its contribution to the favorable balance of trade. This shows the importance of agriculture production to
Churchill County’s economy.
Total Agriculture Production
Output, 5.0%
Total Food Manufacturing Output, 4.0%
Total Other Industries
Output, 91.0%
Economic Analysis of the Food & Agriculture Sector in Nevada – 2017
Nevada Department of Agriculture
page | 35
The food manufacturing sector created $1.2 million more in imports than exports. Negative trade balance
shows that most of Churchill County food manufacturing commodities were purchased from outside of the
county.
Economic Impact Analysis of the Agriculture Sector on Churchill County Economy:
The economic impact analysis shows the impact of agriculture production and food manufacturing activities
on the total Churchill County economy. Table 1. shows the impacts of the agriculture sector industries on
Churchill’s County economy.
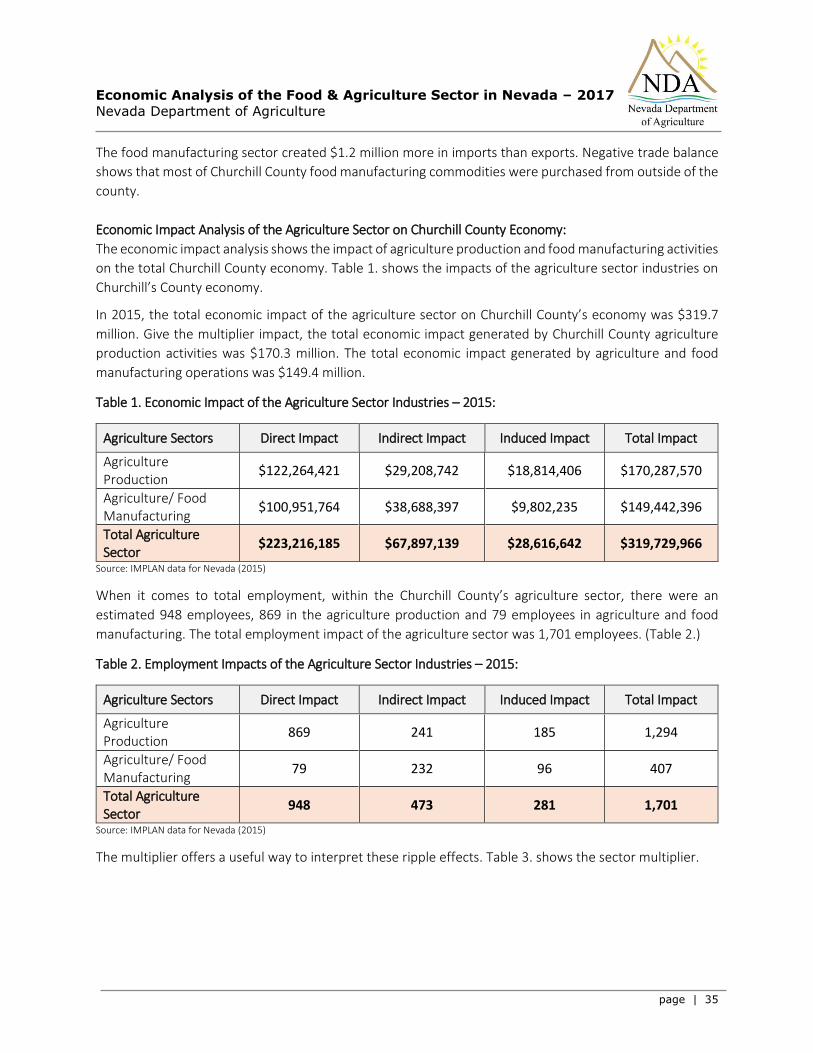
In 2015, the total economic impact of the agriculture sector on Churchill County’s economy was $319.7
million. Give the multiplier impact, the total economic impact generated by Churchill County agriculture
production activities was $170.3 million. The total economic impact generated by agriculture and food
manufacturing operations was $149.4 million.
Table 1. Economic Impact of the Agriculture Sector Industries – 2015:
Agriculture Sectors Direct Impact Indirect Impact Induced Impact Total Impact
Agriculture Production
$122,264,421 $29,208,742 $18,814,406 $170,287,570
Agriculture/ Food Manufacturing
$100,951,764 $38,688,397 $9,802,235 $149,442,396
Total Agriculture Sector
$223,216,185 $67,897,139 $28,616,642 $319,729,966
Source: IMPLAN data for Nevada (2015)
When it comes to total employment, within the Churchill County’s agriculture sector, there were an
estimated 948 employees, 869 in the agriculture production and 79 employees in agriculture and food
manufacturing. The total employment impact of the agriculture sector was 1,701 employees. (Table 2.)
Table 2. Employment Impacts of the Agriculture Sector Industries – 2015:
Agriculture Sectors Direct Impact Indirect Impact Induced Impact Total Impact
Agriculture Production
869 241 185 1,294
Agriculture/ Food Manufacturing
79 232 96 407
Total Agriculture Sector
948 473 281 1,701
Source: IMPLAN data for Nevada (2015)
The multiplier offers a useful way to interpret these ripple effects. Table 3. shows the sector multiplier.
Economic Analysis of the Food & Agriculture Sector in Nevada – 2017
Nevada Department of Agriculture
page | 36
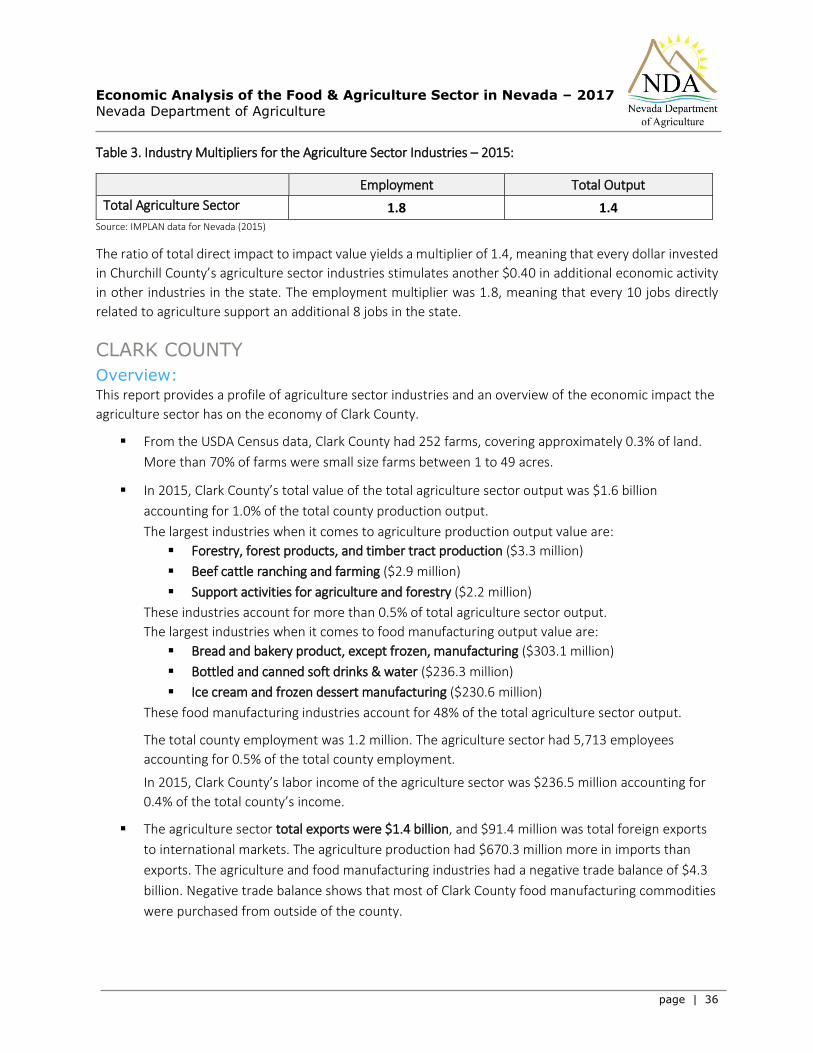
Table 3. Industry Multipliers for the Agriculture Sector Industries – 2015:
Employment Total Output
Total Agriculture Sector 1.8 1.4 Source: IMPLAN data for Nevada (2015)
The ratio of total direct impact to impact value yields a multiplier of 1.4, meaning that every dollar invested
in Churchill County’s agriculture sector industries stimulates another $0.40 in additional economic activity
in other industries in the state. The employment multiplier was 1.8, meaning that every 10 jobs directly
related to agriculture support an additional 8 jobs in the state.
CLARK COUNTY
Overview: This report provides a profile of agriculture sector industries and an overview of the economic impact the
agriculture sector has on the economy of Clark County.
From the USDA Census data, Clark County had 252 farms, covering approximately 0.3% of land.
More than 70% of farms were small size farms between 1 to 49 acres.
In 2015, Clark County’s total value of the total agriculture sector output was $1.6 billion
accounting for 1.0% of the total county production output.
The largest industries when it comes to agriculture production output value are:
Forestry, forest products, and timber tract production ($3.3 million)
Beef cattle ranching and farming ($2.9 million)
Support activities for agriculture and forestry ($2.2 million)
These industries account for more than 0.5% of total agriculture sector output.
The largest industries when it comes to food manufacturing output value are:
Bread and bakery product, except frozen, manufacturing ($303.1 million)
Bottled and canned soft drinks & water ($236.3 million)
Ice cream and frozen dessert manufacturing ($230.6 million)
These food manufacturing industries account for 48% of the total agriculture sector output.
The total county employment was 1.2 million. The agriculture sector had 5,713 employees
accounting for 0.5% of the total county employment.
In 2015, Clark County’s labor income of the agriculture sector was $236.5 million accounting for
0.4% of the total county’s income.
The agriculture sector total exports were $1.4 billion, and $91.4 million was total foreign exports
to international markets. The agriculture production had $670.3 million more in imports than
exports. The agriculture and food manufacturing industries had a negative trade balance of $4.3
billion. Negative trade balance shows that most of Clark County food manufacturing commodities
were purchased from outside of the county.
Economic Analysis of the Food & Agriculture Sector in Nevada – 2017
Nevada Department of Agriculture
page | 37
In 2015, given the economic inter-linkage and multiplier effect, the total economic impact to
Nevada’s economy from all the agricultural sector activities was $245.4 million. The total
employment impacts from the agriculture sector activity were 1,062 jobs and $51.5 million in
labor income.
Food and Agriculture Sector – Clark County
Agriculture Land and Farms:
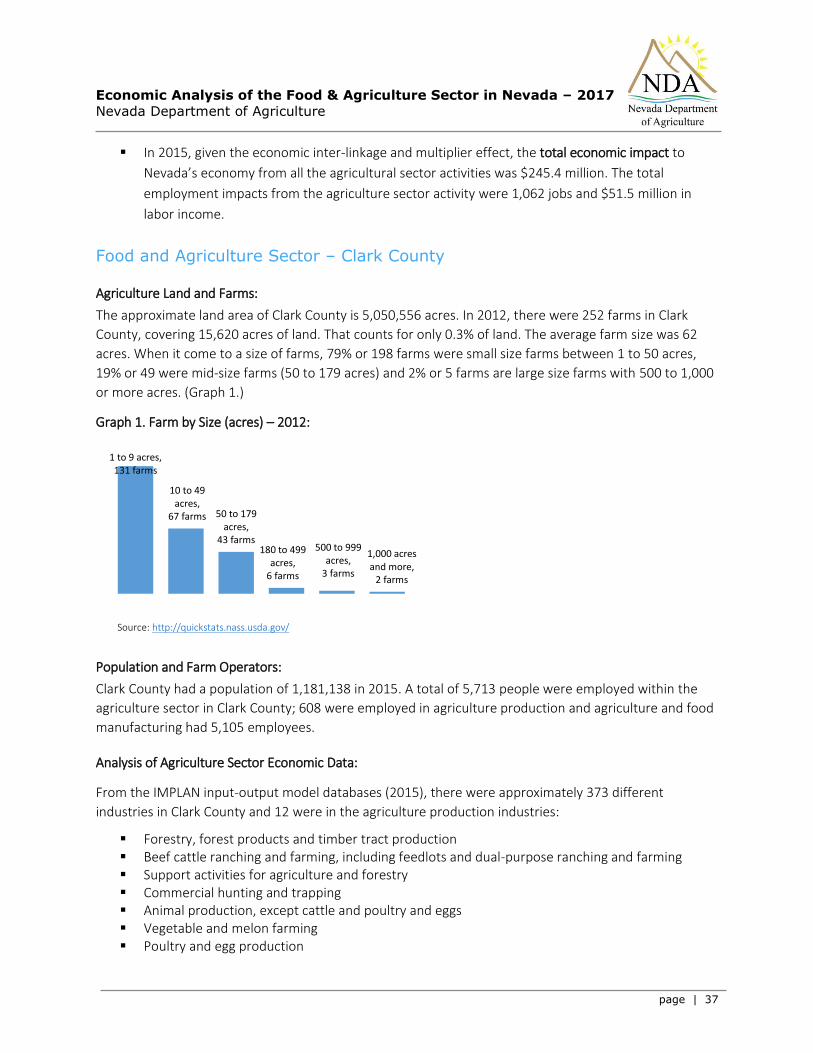
The approximate land area of Clark County is 5,050,556 acres. In 2012, there were 252 farms in Clark
County, covering 15,620 acres of land. That counts for only 0.3% of land. The average farm size was 62
acres. When it come to a size of farms, 79% or 198 farms were small size farms between 1 to 50 acres,
19% or 49 were mid-size farms (50 to 179 acres) and 2% or 5 farms are large size farms with 500 to 1,000
or more acres. (Graph 1.)
Graph 1. Farm by Size (acres) – 2012:
Source: http://quickstats.nass.usda.gov/
Population and Farm Operators:
Clark County had a population of 1,181,138 in 2015. A total of 5,713 people were employed within the
agriculture sector in Clark County; 608 were employed in agriculture production and agriculture and food
manufacturing had 5,105 employees.
Analysis of Agriculture Sector Economic Data:
From the IMPLAN input-output model databases (2015), there were approximately 373 different
industries in Clark County and 12 were in the agriculture production industries:
Forestry, forest products and timber tract production Beef cattle ranching and farming, including feedlots and dual-purpose ranching and farming Support activities for agriculture and forestry Commercial hunting and trapping Animal production, except cattle and poultry and eggs Vegetable and melon farming Poultry and egg production
1 to 9 acres, 131 farms
10 to 49 acres,
67 farms 50 to 179 acres,
43 farms180 to 499
acres, 6 farms
500 to 999 acres,
3 farms
1,000 acres and more,
2 farms
Economic Analysis of the Food & Agriculture Sector in Nevada – 2017
Nevada Department of Agriculture
page | 38
Fruit farming All other crop farming Greenhouse, nursery and floriculture production Grain farming Tree nut farming
Food manufacturing sector had a significant presence in Clark County. The food manufacturing industries
that were included in agriculture sector analysis are listed below:
Bread and bakery product, except frozen, manufacturing Bottled and canned soft drinks & water Ice cream and frozen dessert manufacturing All other food manufacturing Fluid milk manufacturing Mayonnaise, dressing and sauce manufacturing Canned fruits and vegetables manufacturing Frozen specialties manufacturing Meat processed from carcasses Confectionery manufacturing from purchased chocolate Dry pasta, mixes and dough manufacturing Other snack food manufacturing Breweries Distilleries Cookie and cracker manufacturing Tortilla manufacturing Coffee and tea manufacturing Frozen cakes and other pastries manufacturing Seafood product preparation and packaging Dog and cat food manufacturing Tobacco product manufacturing Non-chocolate confectionery manufacturing Spice and extract manufacturing Rendering and meat byproduct processing Manufactured ice Poultry processing
Sectorial Value of Output, Employment and Labor Income:
In 2015, the total value of the agriculture sector output was $1.6 billion. The value of agriculture production
output was $17.5 million, accounting for only 1.1% of the total output value of Clark County. The agriculture
and food manufacturing output value accounted for 1% of the total county’s output with value of $1.6
billion. (Graph 2.)
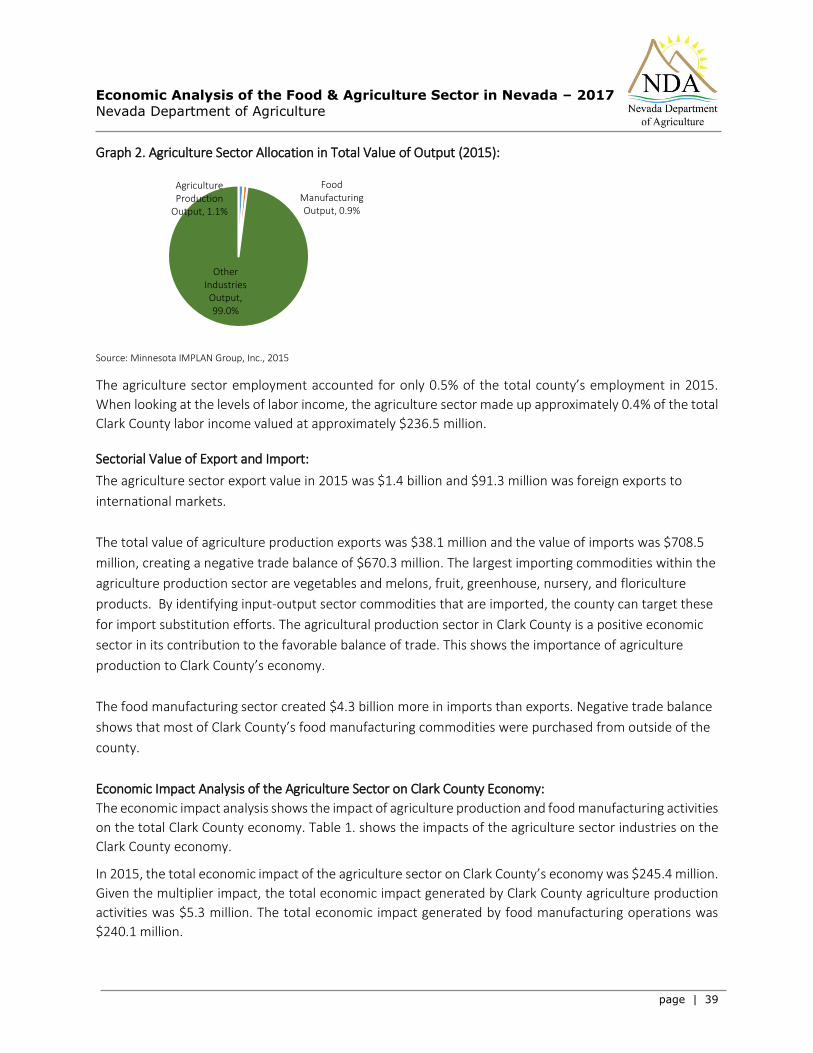
Economic Analysis of the Food & Agriculture Sector in Nevada – 2017
Nevada Department of Agriculture
page | 39
Graph 2. Agriculture Sector Allocation in Total Value of Output (2015):
Source: Minnesota IMPLAN Group, Inc., 2015
The agriculture sector employment accounted for only 0.5% of the total county’s employment in 2015.
When looking at the levels of labor income, the agriculture sector made up approximately 0.4% of the total
Clark County labor income valued at approximately $236.5 million.
Sectorial Value of Export and Import:
The agriculture sector export value in 2015 was $1.4 billion and $91.3 million was foreign exports to
international markets.
The total value of agriculture production exports was $38.1 million and the value of imports was $708.5
million, creating a negative trade balance of $670.3 million. The largest importing commodities within the
agriculture production sector are vegetables and melons, fruit, greenhouse, nursery, and floriculture
products. By identifying input-output sector commodities that are imported, the county can target these
for import substitution efforts. The agricultural production sector in Clark County is a positive economic
sector in its contribution to the favorable balance of trade. This shows the importance of agriculture
production to Clark County’s economy.
The food manufacturing sector created $4.3 billion more in imports than exports. Negative trade balance
shows that most of Clark County’s food manufacturing commodities were purchased from outside of the
county.
Economic Impact Analysis of the Agriculture Sector on Clark County Economy:
The economic impact analysis shows the impact of agriculture production and food manufacturing activities
on the total Clark County economy. Table 1. shows the impacts of the agriculture sector industries on the
Clark County economy.
In 2015, the total economic impact of the agriculture sector on Clark County’s economy was $245.4 million.
Given the multiplier impact, the total economic impact generated by Clark County agriculture production
activities was $5.3 million. The total economic impact generated by food manufacturing operations was
$240.1 million.
Agriculture Production
Output, 1.1%
Food Manufacturing Output, 0.9%
Other Industries Output, 99.0%
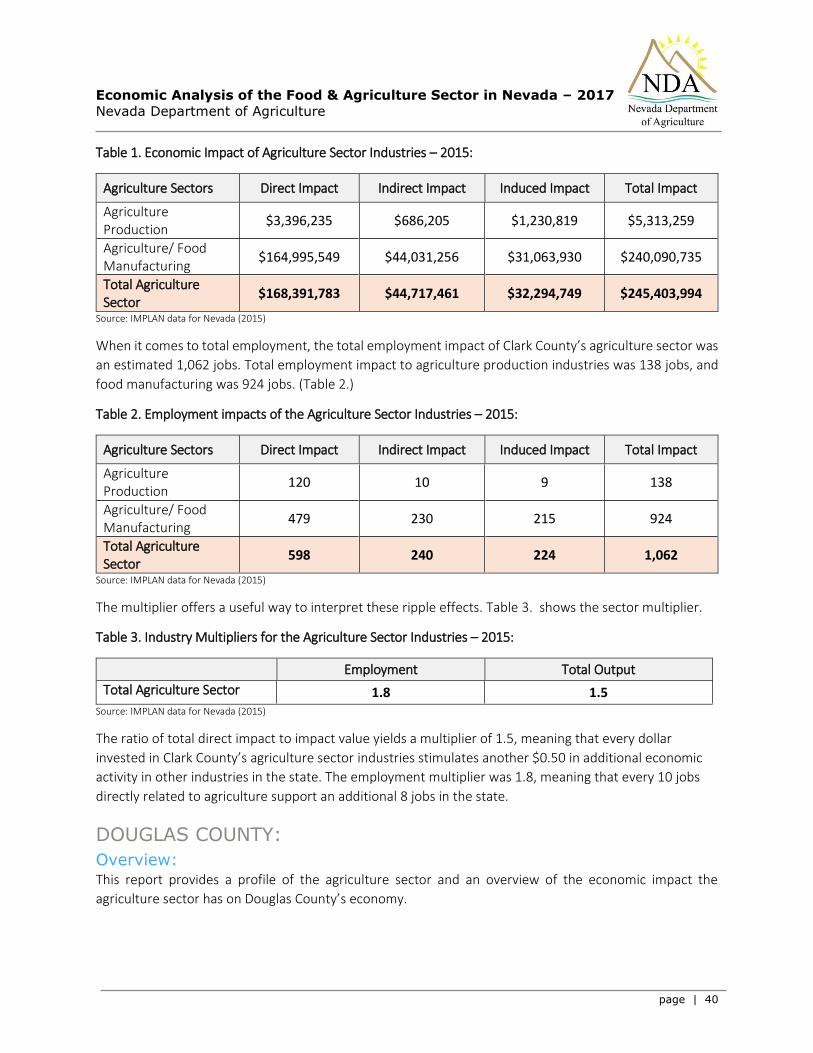
Economic Analysis of the Food & Agriculture Sector in Nevada – 2017
Nevada Department of Agriculture
page | 40
Table 1. Economic Impact of Agriculture Sector Industries – 2015:
Agriculture Sectors Direct Impact Indirect Impact Induced Impact Total Impact
Agriculture Production
$3,396,235 $686,205 $1,230,819 $5,313,259
Agriculture/ Food Manufacturing
$164,995,549 $44,031,256 $31,063,930 $240,090,735
Total Agriculture Sector
$168,391,783 $44,717,461 $32,294,749 $245,403,994
Source: IMPLAN data for Nevada (2015)
When it comes to total employment, the total employment impact of Clark County’s agriculture sector was
an estimated 1,062 jobs. Total employment impact to agriculture production industries was 138 jobs, and
food manufacturing was 924 jobs. (Table 2.)
Table 2. Employment impacts of the Agriculture Sector Industries – 2015:
Agriculture Sectors Direct Impact Indirect Impact Induced Impact Total Impact
Agriculture Production
120 10 9 138
Agriculture/ Food Manufacturing
479 230 215 924
Total Agriculture Sector
598 240 224 1,062
Source: IMPLAN data for Nevada (2015)
The multiplier offers a useful way to interpret these ripple effects. Table 3. shows the sector multiplier.
Table 3. Industry Multipliers for the Agriculture Sector Industries – 2015:
Employment Total Output
Total Agriculture Sector 1.8 1.5 Source: IMPLAN data for Nevada (2015)
The ratio of total direct impact to impact value yields a multiplier of 1.5, meaning that every dollar
invested in Clark County’s agriculture sector industries stimulates another $0.50 in additional economic
activity in other industries in the state. The employment multiplier was 1.8, meaning that every 10 jobs
directly related to agriculture support an additional 8 jobs in the state.
DOUGLAS COUNTY:
Overview: This report provides a profile of the agriculture sector and an overview of the economic impact the
agriculture sector has on Douglas County’s economy.
Economic Analysis of the Food & Agriculture Sector in Nevada – 2017
Nevada Department of Agriculture
page | 41
From the USDA Census data, Douglas County had 255 farms, covering approximately 22% of land.
More than 50% of farms were small size farms between 1 to 49 acres.
In 2015, Douglas County’s total value of agriculture sector output was $211.8 million accounting
for 5% of the total county production output.
The three largest industries when it comes to agriculture production output value were:
Beef cattle ranching and farming ($9.1 million)
All other crop farming including hay ($5.0 million)
Animal production, except cattle and poultry and eggs ($2.2 millions)
These industries account for more than 7.7% of total Douglas County’s agriculture sector output.
The largest food manufacturing industries by output value level were:
Frozen fruits, juices and vegetables manufacturing ($95.1 million)
Coffee and tea manufacturing ($75.7 million)
Canned fruits and vegetables manufacturing ($8.8 million)
These industries account for more than 85% of Douglas County’s agriculture sector output.
Total county employment was 28,737. The agriculture sector in Douglas County had 842 employees
accounting for 3% of the total county employment.
In 2015, Douglas County labor income of the agriculture sector was $28.2 million accounting for
2.4% of the total county’s labor income.
The agriculture sector total exports were $188.9 million, and $20.9 million were total foreign
exports to international markets. The agriculture production had $43.3 million more in imports
than exports. However, the food and manufacturing industries had a positive trade balance of
$25.0 million.
In 2015, given the economic inter-linkage and multiplier effect, the total economic impact to the
Nevada’s economy from all the agricultural sector activities was $300.7 million. The total
employment impact from activity of the agricultural sectors was 1,546 jobs and $51.4 million in
labor income.
Food and Agriculture Sector – Douglas County:
Agriculture Land and Farms:
The approximate land area of Douglas County is 454,220 acres. There were 255 farms in Douglas County
covering 100,944 acres of land, which counts for 22.2% of land. The average farm size was 396 acres. More
than 60% or 166 farms were small size farms between 1 to 49 acres, 27% were mid-size farms between 50
to 499 acres, and 7% were large farms with 500 to 1,000 or more acres. (Graph 1.)
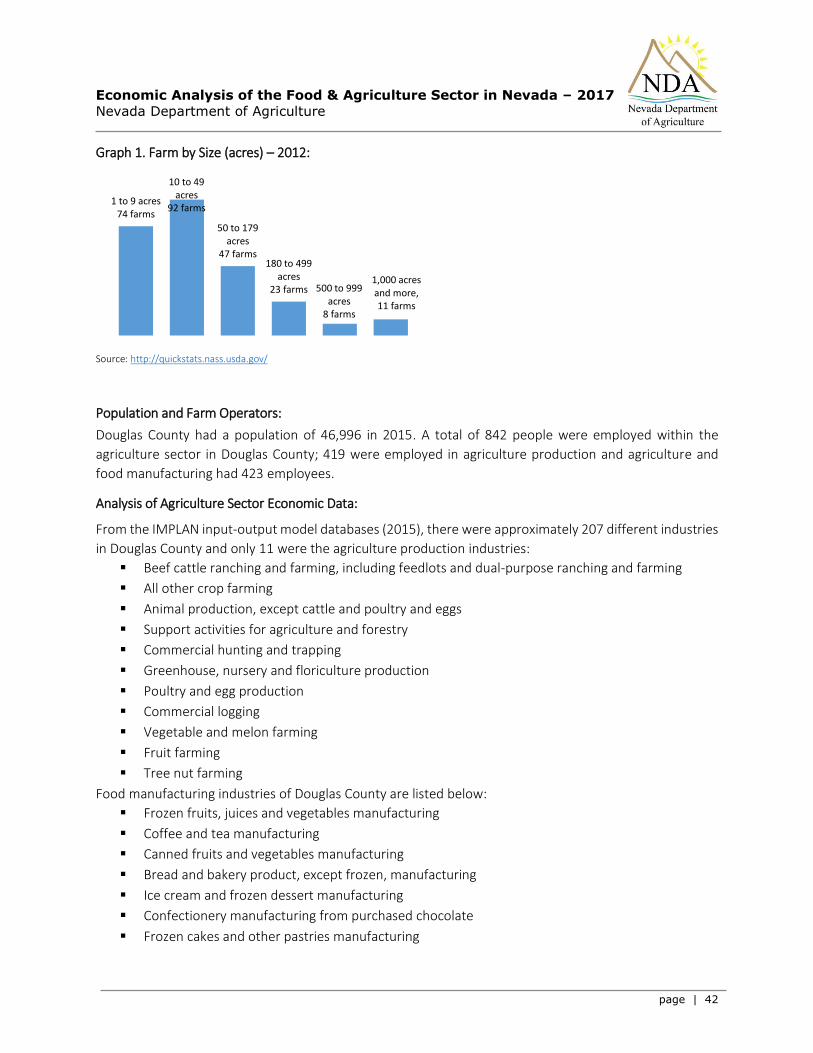
Economic Analysis of the Food & Agriculture Sector in Nevada – 2017
Nevada Department of Agriculture
page | 42
Graph 1. Farm by Size (acres) – 2012:
Source: http://quickstats.nass.usda.gov/
Population and Farm Operators:
Douglas County had a population of 46,996 in 2015. A total of 842 people were employed within the
agriculture sector in Douglas County; 419 were employed in agriculture production and agriculture and
food manufacturing had 423 employees.
Analysis of Agriculture Sector Economic Data:
From the IMPLAN input-output model databases (2015), there were approximately 207 different industries
in Douglas County and only 11 were the agriculture production industries:
Beef cattle ranching and farming, including feedlots and dual-purpose ranching and farming
All other crop farming
Animal production, except cattle and poultry and eggs
Support activities for agriculture and forestry
Commercial hunting and trapping
Greenhouse, nursery and floriculture production
Poultry and egg production
Commercial logging
Vegetable and melon farming
Fruit farming
Tree nut farming
Food manufacturing industries of Douglas County are listed below:
Frozen fruits, juices and vegetables manufacturing
Coffee and tea manufacturing
Canned fruits and vegetables manufacturing
Bread and bakery product, except frozen, manufacturing
Ice cream and frozen dessert manufacturing
Confectionery manufacturing from purchased chocolate
Frozen cakes and other pastries manufacturing
1 to 9 acres 74 farms
10 to 49 acres
92 farms
50 to 179 acres
47 farms180 to 499
acres 23 farms 500 to 999
acres 8 farms
1,000 acres and more, 11 farms

Economic Analysis of the Food & Agriculture Sector in Nevada – 2017
Nevada Department of Agriculture
page | 43
Agriculture and food manufacturing industries, combined with agriculture production industries, in this
report provide the economic description of the agriculture sector of Douglas County.
Sectorial Value of Output, Employment and Labor Income:
The total value of the agriculture sector output in 2015 was $211.8 million, accounting for only 5.0% of the
total output value of Douglas County. The value of agriculture production output was $21.8 million,
accounting for only 0.5% of the total output value of Douglas County. The agriculture and food
manufacturing output value accounted for 5% of the total county’s output with value of $190.0 million.
(Graph 2.)
Graph 2. Agriculture Sector Allocation in Total Value of Output (2012):
Source: Minnesota IMPLAN Group, Inc., 2015
The agriculture sector employment accounted for only 3% of the total county’s employment in 2015. When looking at the levels of labor income, the agriculture sector made up approximately 2.4% of the total Douglas County labor income valued at approximately $28.2 million.
Sectorial Value of Export and Import:
The agriculture sector export value in 2015 was $188.9 million and foreign exports to international markets
were $20.9 million.
The total value of agriculture production exports was $12.8 million and the value of imports was $56.1
million, creating a negative trade balance of $43.3 million. The commodities with a positive trade balance
were beef cattle, wild game products, and animal products, except cattle and poultry and eggs. Fruits,
vegetables and melons and fish products were the largest import commodities within the agriculture
production sector. By identifying input-output sector commodities that are imported, the county can target
these for import substitution efforts. The food manufacturing sector created $25 million more in exports
than imports, creating a positive trade balance. The commodities with a positive trade balance were coffee
and tea, frozen fruits, juices and vegetables and canned fruits and vegetables.
Total Agriculture Production
Sector, 1.0%
Total Food Manufacturin
g, 5.0%
Total Other Industires,
94.0%
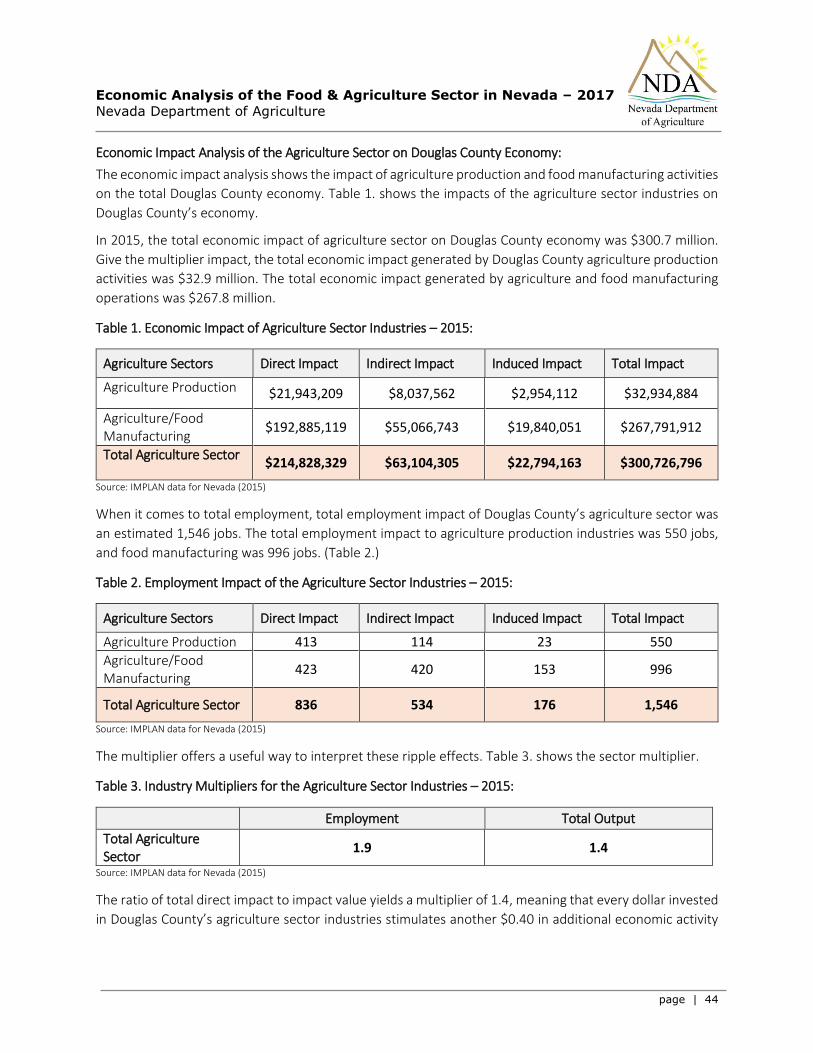
Economic Analysis of the Food & Agriculture Sector in Nevada – 2017
Nevada Department of Agriculture
page | 44
Economic Impact Analysis of the Agriculture Sector on Douglas County Economy:
The economic impact analysis shows the impact of agriculture production and food manufacturing activities
on the total Douglas County economy. Table 1. shows the impacts of the agriculture sector industries on
Douglas County’s economy.
In 2015, the total economic impact of agriculture sector on Douglas County economy was $300.7 million.
Give the multiplier impact, the total economic impact generated by Douglas County agriculture production
activities was $32.9 million. The total economic impact generated by agriculture and food manufacturing
operations was $267.8 million.
Table 1. Economic Impact of Agriculture Sector Industries – 2015:
Agriculture Sectors Direct Impact Indirect Impact Induced Impact Total Impact
Agriculture Production $21,943,209 $8,037,562 $2,954,112 $32,934,884
Agriculture/Food Manufacturing
$192,885,119 $55,066,743 $19,840,051 $267,791,912
Total Agriculture Sector $214,828,329 $63,104,305 $22,794,163 $300,726,796
Source: IMPLAN data for Nevada (2015)
When it comes to total employment, total employment impact of Douglas County’s agriculture sector was
an estimated 1,546 jobs. The total employment impact to agriculture production industries was 550 jobs,
and food manufacturing was 996 jobs. (Table 2.)
Table 2. Employment Impact of the Agriculture Sector Industries – 2015:
Agriculture Sectors Direct Impact Indirect Impact Induced Impact Total Impact
Agriculture Production 413 114 23 550
Agriculture/Food Manufacturing
423 420 153 996
Total Agriculture Sector 836 534 176 1,546
Source: IMPLAN data for Nevada (2015)
The multiplier offers a useful way to interpret these ripple effects. Table 3. shows the sector multiplier.
Table 3. Industry Multipliers for the Agriculture Sector Industries – 2015:
Employment Total Output
Total Agriculture Sector
1.9 1.4
Source: IMPLAN data for Nevada (2015)
The ratio of total direct impact to impact value yields a multiplier of 1.4, meaning that every dollar invested
in Douglas County’s agriculture sector industries stimulates another $0.40 in additional economic activity

Economic Analysis of the Food & Agriculture Sector in Nevada – 2017
Nevada Department of Agriculture
page | 45
in other industries in the state. The employment multiplier was 1.9, meaning that every 10 jobs directly
related to agriculture support an additional 9 jobs in the state.
ELKO COUNTY:
Overview: This report provides a profile of the agriculture sector and an overview of the economic impact the
agriculture sector has on the economy of Elko County.
From the USDA Census data, Elko County had 552 farms, covering approximately 19.4% of land.
Farm size was evenly distributed between small, mid and large-size farms measured in acres.
In 2015, Elko County’s total value of agriculture sector output was $159.6 million accounting for
3.9% of the total county production output.
The largest industries when it comes to agriculture production output value were:
Beef cattle ranching and farming ($95.4 million)
All other crop farming including hay($15.6 million)
Dairy cattle and milk production ($14.9 million)
These industries accounted for more than 79% of total Elko County’s agriculture sector output.
The largest food manufacturing industries were:
Bottled and canned soft drinks & water ($13.0 million)
Bread and bakery product, except frozen, manufacturing ($6.1 million)
Breweries ($5.9 million)
These industries accounted for more than 16% of Elko County’s agriculture sector output.
Total county employment was 25,124. The agriculture sector in Elko County had 879 employees
accounting for 3.5% of the total county employment.
In 2015, Elko County’s labor income of the agriculture sector was $31.3 million accounting for 2.3%
of the total county’s labor income.
The agriculture sector total exports were $153.9 million, and total foreign exports to international
markets were $3 million. Agriculture production had $78.1 million more in exports than imports.
Agriculture production industries in Elko County had a positive balance of trade. This shows the
importance of agriculture production to Elko County’s economy.
However, the food and manufacturing industries had a negative trade balance of $132.5 million.
Negative trade balance shows that most of Elko County food manufacturing commodities were
purchased from outside of the county.
In 2015, given the economic inter-linkage and multiplier effect, the total economic impact to the
Nevada’s economy from all the agricultural sector activities was $24.6 million. The total
employment impact from activity of the agricultural sectors was 246 jobs and $10.9 million in labor
income.

Economic Analysis of the Food & Agriculture Sector in Nevada – 2017
Nevada Department of Agriculture
page | 46
Food and Agriculture Sector – Elko County
Agriculture Land and Farms:
In 2012, approximate land area of Elko County was 10,988,685 acres. There were 552 farms in Elko County
covering 2,126,980 acres of land, which counts for 19.4% of land in farms. Average farm size was 3,853
acres. Approximately 37% or 204 farms were small size farms between 1 to 50 acres, 19% were farms are
mid-size farms (50 to 179 acres) and 25% are large size farms with 500 to 1,000 or more acres. (Graph 1.)
Graph 1. Farm by Size (acres) – 2012:
Source: http://quickstats.nass.usda.gov/
Population and Farm Operators:
Elko County had a population of 25,124 in 2015. A total of 879 people were employed within the agriculture
sector in Elko County; 795 were employed in agriculture production and agriculture and food
manufacturing had 84 employees.
Analysis of Agriculture Sector Economic Data:
From the IMPLAN input-output model databases (2015), there were approximately 180 different industries
in Elko County and only 13 were the agriculture production industries:
Grain farming
Vegetable and melon farming
Fruit farming
Tree nut farming
Greenhouse, nursery and floriculture production
All other crop farming
Beef cattle ranching and farming, including feedlots and dual-purpose ranching and farming
Dairy cattle and milk production
Poultry and egg production
Animal production, except cattle and poultry and eggs
Commercial logging
Commercial hunting and trapping
Support activities for agriculture and forestry
1 to 9 acres, 89 farms
10 to 49 acres, 115
farms50 to 179 acres, 105
farms180 to 499 acres, 69
farms 500 to 999 acres, 35
farms
1,000 acres and more, 139 farms

Economic Analysis of the Food & Agriculture Sector in Nevada – 2017
Nevada Department of Agriculture
page | 47
Food manufacturing industries in Elko County are listed below:
Bread and bakery product, except frozen, manufacturing
Frozen cakes and other pastries manufacturing
Bottled and canned soft drinks & water
Manufactured ice
Breweries
These agriculture and food manufacturing industries combined with agriculture production industries,
provide the economic description of total agriculture sector of Elko County.
Sectorial Value of Output, Employment and Labor Income:
The total value of agriculture sector output in 2015 was $159.6 million, accounting for 3.9% of the total
output value of Elko County. The value of agriculture production output was $133.7 million, accounting for
only 3.2% of the total output value. The food manufacturing output accounted for only 0.6% of total output
value with $25.9 million in 2015. (Graph 2.)
Graph 2. Agriculture Sector Allocation in Total Value of Output (2015):
Source: Minnesota IMPLAN Group, Inc., 2015
The agriculture sector employment accounted for only 3.5% of the total county’s employment in 2015. When looking at the levels of labor income, the agriculture sector made up approximately 2.3% of the total Elko County labor income valued at approximately $31.3 million.
Sectorial Value of Export and Import:
The agriculture sector export value in 2015 was $153.9 million and $3.0 million was foreign exports to
international markets.
The total value of agriculture production exports was $128.1 million and the value of imports was $45
million, creating a positive trade balance of $78.1 million. The commodities with a positive trade balance
were beef cattle, dairy cattle and milk production, and all other crops. Support activities for agriculture and
forestry, grains, and vegetables and melons were the largest import commodities within the agriculture
production sector. By identifying input-output sector commodities that are imported, the county can target
these for import substitution efforts. The agricultural production sector in Elko County is a positive
Total Agriculture Production, 3%
Total Food Manufacturing
Output, 1%
Total Other Industries
Output, 96%
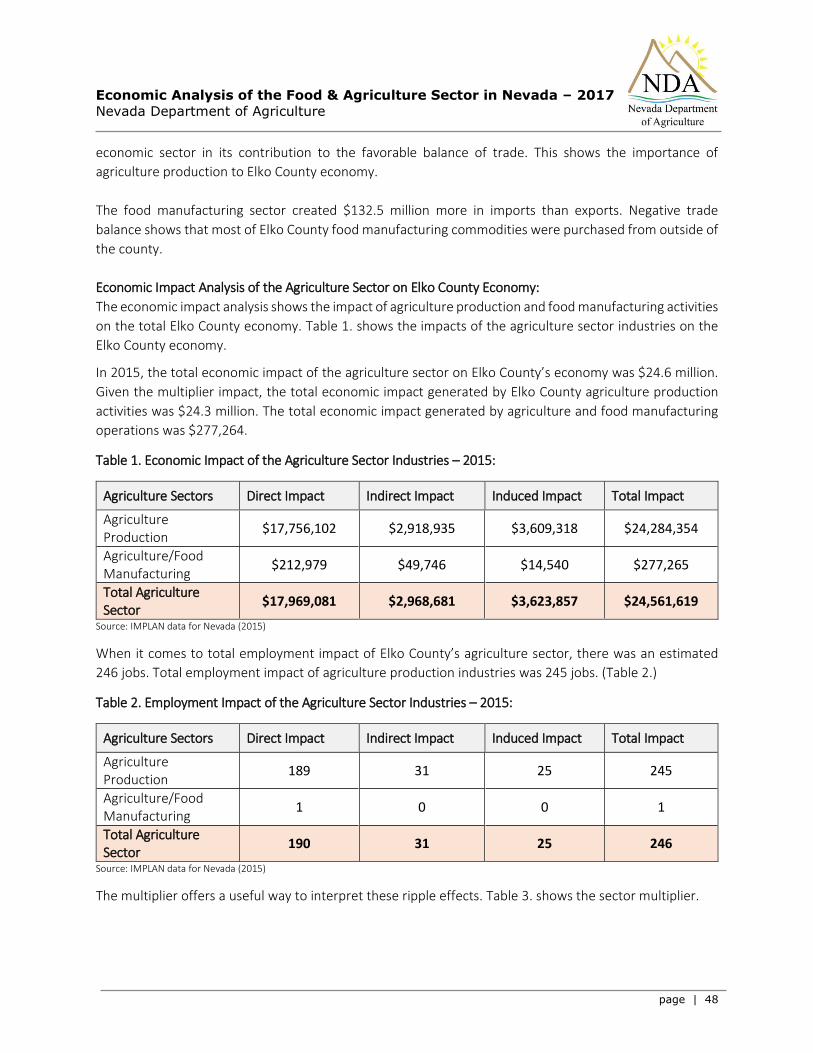
Economic Analysis of the Food & Agriculture Sector in Nevada – 2017
Nevada Department of Agriculture
page | 48
economic sector in its contribution to the favorable balance of trade. This shows the importance of
agriculture production to Elko County economy.
The food manufacturing sector created $132.5 million more in imports than exports. Negative trade
balance shows that most of Elko County food manufacturing commodities were purchased from outside of
the county.
Economic Impact Analysis of the Agriculture Sector on Elko County Economy:
The economic impact analysis shows the impact of agriculture production and food manufacturing activities
on the total Elko County economy. Table 1. shows the impacts of the agriculture sector industries on the
Elko County economy.
In 2015, the total economic impact of the agriculture sector on Elko County’s economy was $24.6 million.
Given the multiplier impact, the total economic impact generated by Elko County agriculture production
activities was $24.3 million. The total economic impact generated by agriculture and food manufacturing
operations was $277,264.
Table 1. Economic Impact of the Agriculture Sector Industries – 2015:
Agriculture Sectors Direct Impact Indirect Impact Induced Impact Total Impact
Agriculture Production
$17,756,102 $2,918,935 $3,609,318 $24,284,354
Agriculture/Food Manufacturing
$212,979 $49,746 $14,540 $277,265
Total Agriculture Sector
$17,969,081 $2,968,681 $3,623,857 $24,561,619
Source: IMPLAN data for Nevada (2015)
When it comes to total employment impact of Elko County’s agriculture sector, there was an estimated
246 jobs. Total employment impact of agriculture production industries was 245 jobs. (Table 2.)
Table 2. Employment Impact of the Agriculture Sector Industries – 2015:
Agriculture Sectors Direct Impact Indirect Impact Induced Impact Total Impact
Agriculture Production
189 31 25 245
Agriculture/Food Manufacturing
1 0 0 1
Total Agriculture Sector
190 31 25 246
Source: IMPLAN data for Nevada (2015)
The multiplier offers a useful way to interpret these ripple effects. Table 3. shows the sector multiplier.
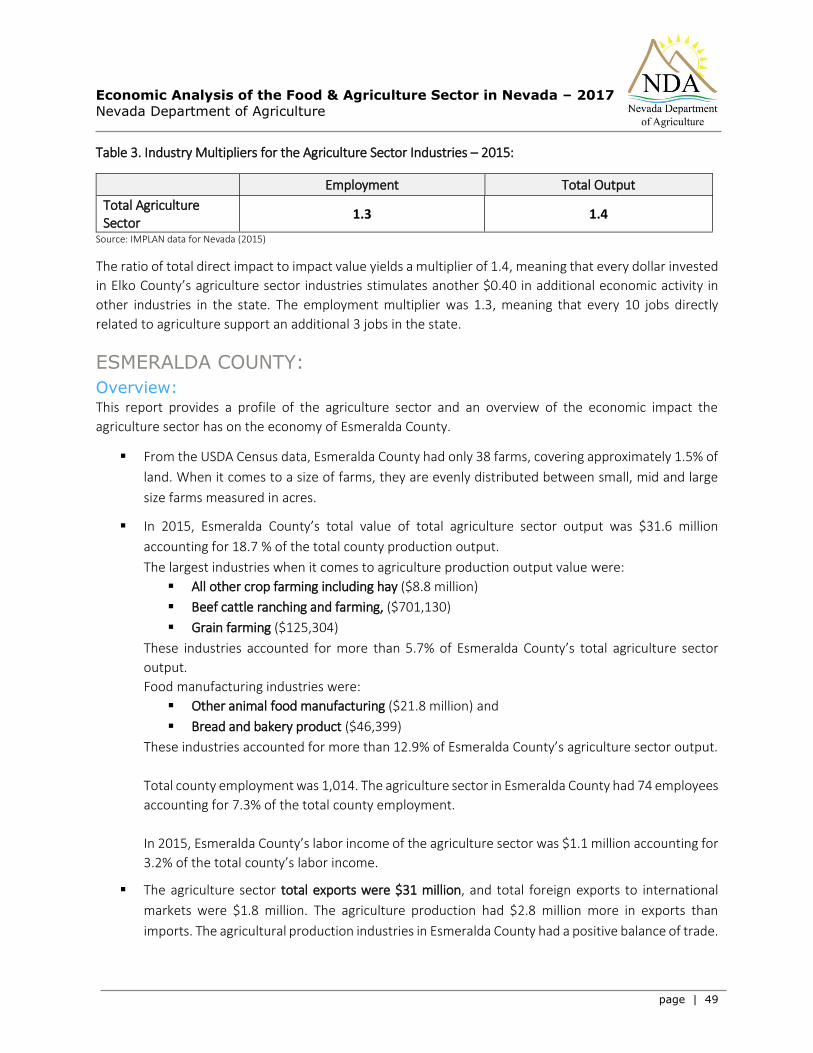
Economic Analysis of the Food & Agriculture Sector in Nevada – 2017
Nevada Department of Agriculture
page | 49
Table 3. Industry Multipliers for the Agriculture Sector Industries – 2015:
Employment Total Output
Total Agriculture Sector
1.3 1.4
Source: IMPLAN data for Nevada (2015)
The ratio of total direct impact to impact value yields a multiplier of 1.4, meaning that every dollar invested
in Elko County’s agriculture sector industries stimulates another $0.40 in additional economic activity in
other industries in the state. The employment multiplier was 1.3, meaning that every 10 jobs directly
related to agriculture support an additional 3 jobs in the state.
ESMERALDA COUNTY:
Overview: This report provides a profile of the agriculture sector and an overview of the economic impact the
agriculture sector has on the economy of Esmeralda County.
From the USDA Census data, Esmeralda County had only 38 farms, covering approximately 1.5% of
land. When it comes to a size of farms, they are evenly distributed between small, mid and large
size farms measured in acres.
In 2015, Esmeralda County’s total value of total agriculture sector output was $31.6 million
accounting for 18.7 % of the total county production output.
The largest industries when it comes to agriculture production output value were:
All other crop farming including hay ($8.8 million)
Beef cattle ranching and farming, ($701,130)
Grain farming ($125,304)
These industries accounted for more than 5.7% of Esmeralda County’s total agriculture sector
output.
Food manufacturing industries were:
Other animal food manufacturing ($21.8 million) and
Bread and bakery product ($46,399)
These industries accounted for more than 12.9% of Esmeralda County’s agriculture sector output.
Total county employment was 1,014. The agriculture sector in Esmeralda County had 74 employees
accounting for 7.3% of the total county employment.
In 2015, Esmeralda County’s labor income of the agriculture sector was $1.1 million accounting for
3.2% of the total county’s labor income.
The agriculture sector total exports were $31 million, and total foreign exports to international
markets were $1.8 million. The agriculture production had $2.8 million more in exports than
imports. The agricultural production industries in Esmeralda County had a positive balance of trade.
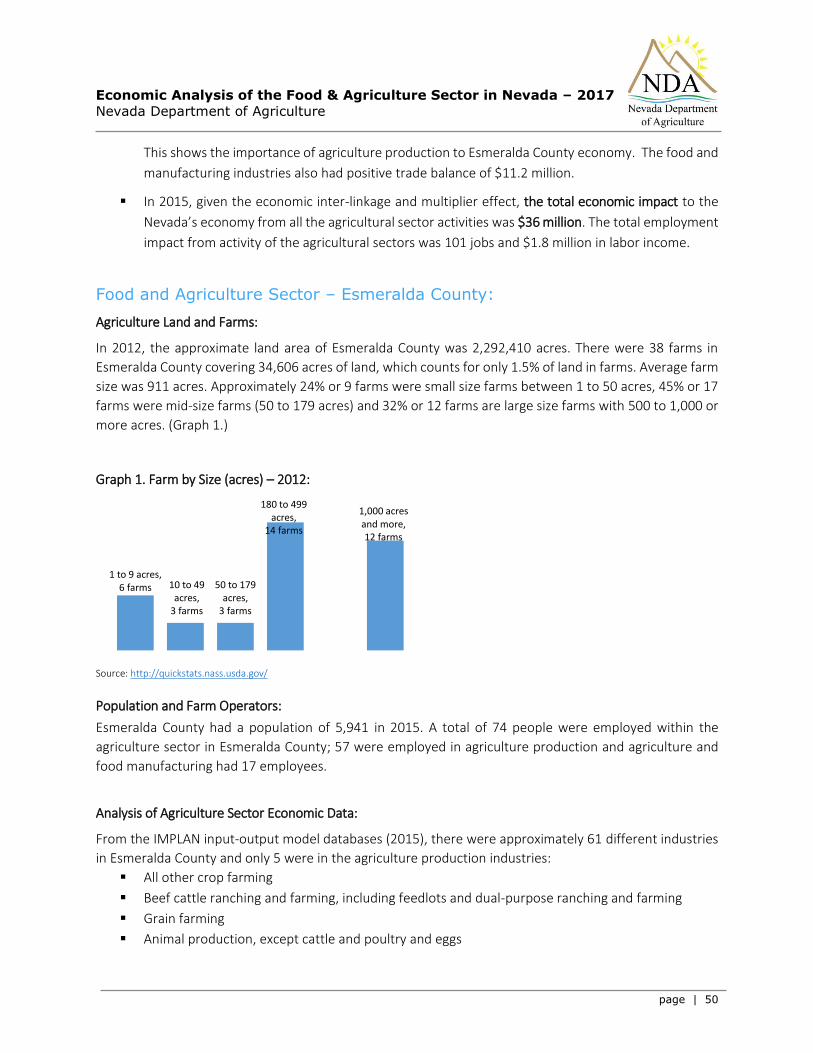
Economic Analysis of the Food & Agriculture Sector in Nevada – 2017
Nevada Department of Agriculture
page | 50
This shows the importance of agriculture production to Esmeralda County economy. The food and
manufacturing industries also had positive trade balance of $11.2 million.
In 2015, given the economic inter-linkage and multiplier effect, the total economic impact to the
Nevada’s economy from all the agricultural sector activities was $36 million. The total employment
impact from activity of the agricultural sectors was 101 jobs and $1.8 million in labor income.
Food and Agriculture Sector – Esmeralda County:
Agriculture Land and Farms:
In 2012, the approximate land area of Esmeralda County was 2,292,410 acres. There were 38 farms in
Esmeralda County covering 34,606 acres of land, which counts for only 1.5% of land in farms. Average farm
size was 911 acres. Approximately 24% or 9 farms were small size farms between 1 to 50 acres, 45% or 17
farms were mid-size farms (50 to 179 acres) and 32% or 12 farms are large size farms with 500 to 1,000 or
more acres. (Graph 1.)
Graph 1. Farm by Size (acres) – 2012:
Source: http://quickstats.nass.usda.gov/
Population and Farm Operators:
Esmeralda County had a population of 5,941 in 2015. A total of 74 people were employed within the
agriculture sector in Esmeralda County; 57 were employed in agriculture production and agriculture and
food manufacturing had 17 employees.
Analysis of Agriculture Sector Economic Data:
From the IMPLAN input-output model databases (2015), there were approximately 61 different industries
in Esmeralda County and only 5 were in the agriculture production industries:
All other crop farming
Beef cattle ranching and farming, including feedlots and dual-purpose ranching and farming
Grain farming
Animal production, except cattle and poultry and eggs
1 to 9 acres, 6 farms 10 to 49
acres, 3 farms
50 to 179 acres,
3 farms
180 to 499 acres,
14 farms
1,000 acres and more, 12 farms

Economic Analysis of the Food & Agriculture Sector in Nevada – 2017
Nevada Department of Agriculture
page | 51
Poultry and egg production
The major food manufacturing industries were:
Other animal food manufacturing
Bread and bakery product.
Agriculture and food manufacturing industries, combined with agriculture production industries, provide
the economic description of agriculture sector of Esmeralda County.
Sectorial Value of Output, Employment and Labor Income:
The total value of the agriculture sector output was $31.6 million, accounting for 18.7% of the total output
value of Esmeralda County. The agriculture production output value was $9.8 million accounting for 5.8%
of the total Esmeralda County’s production output. The agriculture and food manufacturing output was
$19.1 million accounting for 17.8% of the total county output.
Graph 2. Agriculture Sector Allocation in Total Value of Output (2015):
Source: Minnesota IMPLAN Group, Inc., 2015
The agriculture sector employment accounted for only 1% of the total county’s employment in 2015. When looking at the levels of labor income, the agriculture sector made up approximately 1% of the total Esmeralda County labor income valued at approximately $26.3 million.
Sectorial Value of Export and Import:
The agriculture sector export value in 2015 was $31.1 million and foreign exports to international markets
were $1.8 million.
The total value of agriculture production exports was $81.6 million and the value of imports was $6.7
million, creating a positive trade balance of $2.8 million. The commodities with a positive trade balance
were all other crops, forest, timber and forest nursery products. Grains, support activities for agriculture
and fish were the largest import commodities within the agriculture production sector. By identifying input-
output sector commodities that are imported, the county can target these for import substitution efforts.
The agricultural production sector in Esmeralda County is a positive economic sector in its contribution to
Total Agriculture Production Output, 6%
Total Food Manufacturing Output, 13%
Total Other Industries
Output, 81%

Economic Analysis of the Food & Agriculture Sector in Nevada – 2017
Nevada Department of Agriculture
page | 52
the favorable balance of trade. This shows the importance of agriculture production to Esmeralda County
economy. The food manufacturing sector created $11.5 million more in export than imports also creating
a positive trade balance.
Economic Impact Analysis of the Agriculture Sector on Esmeralda County Economy:
The economic impact analysis shows the impact of agriculture production and food manufacturing activities
on the total Esmeralda County economy. Table 1. shows the impacts of the agriculture sector industries on
Esmeralda County’s economy.
In 2015, the total economic impact of the agriculture sector on Esmeralda County economy was $36 million.
Given the multiplier impact, the total economic impact generated by Esmeralda County agriculture
production activities was $10.8 million. The total economic impact generated by agriculture and food
manufacturing operations was $25.2 million.
Table 1. Economic Impact of the Agriculture Sector Industries – 2015:
Agriculture Sectors Direct Impact Indirect Impact Induced Impact Total Impact
Agriculture Production
$9,780,306 $886,943 $177,401 $10,844,651
Agriculture/ Food Manufacturing
$22,260,707 $2,799,692 $113,797 $25,174,195
Total Agriculture Sector
$32,041,013 $3,686,635 $291,198 $36,018,846
Source: IMPLAN data for Nevada (2015)
The total employment impact of the agriculture sector was 101 employees. (Table 2.)
Table 2. Employment Impacts of the Agriculture Sector Industries – 2015:
Agriculture Sectors Direct Impact Indirect Impact Induced Impact Total Impact
Agriculture Production
57 4 1 62
Agriculture/ Food Manufacturing
17 21 1 39
Total Agriculture Sector
74 25 2 101
Source: IMPLAN data for Nevada (2015)
The multiplier offers a useful way to interpret these ripple effects. Table 3. shows the sector multiplier.
Table 3. Industry Multipliers for the Agriculture Sector Industries – 2015:
Employment Total Output
Total Agriculture Sector 1.4 1.1 Source: IMPLAN data for Nevada (2015)
Economic Analysis of the Food & Agriculture Sector in Nevada – 2017
Nevada Department of Agriculture
page | 53
The ratio of total direct impact to impact value yields a multiplier of 1.1, meaning that every dollar
invested in Esmeralda County’s agriculture sector industries stimulates another $0.10 in additional
economic activity in other industries in the state. The employment multiplier was 1.4, meaning that every
10 jobs directly related to agriculture support an additional 4 jobs in the state.
EUREKA COUNTY:
Overview: This report provides a profile of the agriculture sector and an overview of the economic impact the
agriculture sector has on the economy of Eureka County.
From the USDA Census data, Eureka County had 101 farms, covering approximately 23.9% of land.
When it comes to a size of farms, approximately 50% were large farms with 1,000 acres or more.
In 2015, Eureka County’s total value of total agriculture sector output was $35.1 million accounting
for 1.4% of the total county production output.
The largest industries when it comes to agriculture production output value were:
All other crop farming including hay ($17 million)
Beef cattle ranching and farming, ($16.4 million)
Support activities for agriculture and forestry ($1.3 million)
These industries accounted for more than 1.4% of total Eureka County’s agriculture sector output.
There is no significant presence of food manufacturing in Eureka County.
Total county employment was 5,504. The agriculture sector in Eureka County had 197 employees
accounting for 3.6% of the total county employment.
In 2015, Eureka County labor income of the agriculture sector was $7.0 million accounting for 1.3%
of the total county’s labor income.
The agriculture sector total exports were $27.9 million, and total foreign exports to international
markets were $1.8 million. Agriculture production had $24.1 million more in exports than imports.
Agriculture production industries in Eureka County had a positive balance of trade. This shows the
importance of agriculture production to Eureka County economy.
However, the food and manufacturing industries had a negative trade balance of $7.6 million.
Negative trade balance shows that most of Eureka County food manufacturing commodities were
purchased from outside of the county.
In 2015, given the economic inter-linkage and multiplier effect, the total economic impact to the
Nevada’s economy from all the agricultural sector activities was $46.1 million. The total
employment impact from activity of the agricultural sectors was 245 jobs and $9.0 million in labor
income.

Economic Analysis of the Food & Agriculture Sector in Nevada – 2017
Nevada Department of Agriculture
page | 54
Food and Agriculture Sector – Eureka County:
Agriculture Land and Farms:
In 2012, the approximate land area of Eureka County was 2,672,436 acres. There were 101 farms in Eureka
County, covering 638,848 acres of land, which counts for 23.9% of land in farms. Average farm size was
6,325 acres. Approximately 50% or 50 farms were large farms with 500 to 1,000 or more acres, 42% were
mid-size farms between 50 to 499 acres, and 9% were small size farms between 1 to 49 acres. (Graph 1.)
Graph 1. Farm by Size (acres) – 2012:
Source: http://quickstats.nass.usda.gov/
Population and Farm Operators:
Eureka County had a population of 17,408 in 2015. A total of 197 people were employed within the
agriculture sector in Eureka County; 196 were employed in agriculture production and agriculture and food
manufacturing had 1 employee.
Analysis of Agriculture Sector Economic Data:
From the IMPLAN input-output model databases (2015), there were approximately 81 different industries
in Eureka County and only 7 were in the agriculture production sector:
Grain farming
All other crop farming
Beef cattle ranching and farming, including feedlots and dual-purpose ranching and farming
Poultry and egg production
Animal production, except cattle and poultry and eggs
Commercial hunting and trapping
Support activities for agriculture and forestry
Food manufacturing industries did not have significant presence in Eureka County. Bread and bakery
Industry only was included in the definition of the agriculture sector.
Sectorial Value of Output, Employment and Labor Income:
In 2015, the total value of the agriculture sector output was $35.1 million, accounting for 1.4% of the total
output value of Eureka County. (Graph 2.)
1 to 9 acres, 7 farms
10 to 49 acres, 2 farms
50 to 179 acres,
18 farms
180 to 499 acres,
24 farms
500 to 999 acres,
21 farms
1,000 acres and more, 29 farms

Economic Analysis of the Food & Agriculture Sector in Nevada – 2017
Nevada Department of Agriculture
page | 55
Graph 2. Agriculture Sector Allocation in Total Value of Output (2015):
Source: Minnesota IMPLAN Group, Inc., 2015
The agriculture sector employment was 197 employees accounting for 3.6% of the total county’s employment in 2015. When looking at the levels of labor income, the agriculture sector made up approximately 1.3% of the total Eureka County labor income valued at approximately $7.0 million.
Sectorial Value of Export and Import:
The agriculture sector export value in 2015 was $27.9 million and $1.8 million was foreign exports to
international markets.
The total value of agriculture production exports was $27.9 million and the value of imports was $11.4
million, creating a positive trade balance of $14.5 million. The commodities with positive trade balance
were all other crops, beef cattle, and forest, timber and forest nursery products, support activities for
agriculture. The largest importing commodities were grains and vegetables and melons. By identifying
input-output sector commodities that are imported, the county can target these for import substitution
efforts. The agricultural production sector in Eureka County is a positive economic sector in its contribution
to the favorable balance of trade. This shows the importance of agriculture production to Eureka County’s
economy.
The food manufacturing sector created $7.6 million more in imports than exports. Negative trade balance
shows that most of Eureka County food manufacturing commodities were purchased from outside of the
county.
Economic Impact Analysis of the Agriculture Sector on Eureka County Economy:
The economic impact analysis shows the impact of agriculture production and food manufacturing activities
on the total Eureka County economy. Table 1. shows the impacts of the agriculture sector industries on the
Eureka County economy.
In 2015, the total economic impact of agriculture sector on Eureka County’s economy was $46.1 million.
Given the multiplier impact, the total economic impact generated by Eureka County agriculture production
activities was $46 million.
Total Agriculture Production Output, 1%
Total Other Industries
Output, 99%
Economic Analysis of the Food & Agriculture Sector in Nevada – 2017
Nevada Department of Agriculture
page | 56
Table 1. Economic Impact of the Agriculture Sector Industries – 2015:
Agriculture Sectors Direct Impact Indirect Impact Induced Impact Total Impact
Total Agriculture Sector
$34,778,839 $10,412,717 $875,601 $46,067,157
Source: IMPLAN data for Nevada (2015)
The total employment impact of the agriculture sector was 245 employees. (Table 2.)
Table 2. Employment Impact of the Agriculture Sector Industries – 2015:
Agriculture Sectors Direct Impact Indirect Impact Induced Impact Total Impact
Total Agriculture Sector
181 61 4 245
Source: IMPLAN data for Nevada (2015)
The multiplier offers a useful way to interpret these ripple effects. Table 3. shows the sector multiplier.
Table 3. Industry Multipliers for the Agriculture Sector Industries – 2015:
Employment Total Output
Total Agriculture Sector 1.4 1.3 Source: IMPLAN data for Nevada (2015)
The ratio of total direct impact to impact value yields a multiplier of 1.3, meaning that every dollar invested
in Eureka County’s agriculture sector industries stimulates another $0.30 in additional economic activity in
other industries in the state. The employment multiplier was 1.4, meaning that every 10 jobs directly
related to agriculture support an additional 4 jobs in the state.
HUMBOLDT COUNTY:
Overview: This report provides a profile of the agriculture sector and an overview of the economic impact the
agriculture sector has on the economy of Humboldt County.
From the USDA Census data, Humboldt County had 359 farms, covering approximately 13.1% of
land. When it comes to size of farms measured in acres, they are evenly distributed between small,
mid and large size.
In 2015, Humboldt County’s total value of agriculture sector output was $132.5 million accounting
for 5.5% of the total county production output.
The largest industries when it comes to agriculture production output value were:
Beef cattle ranching and farming ($47.5 million)
All other crop farming ($47.2 million)
Dairy cattle and milk production ($14.9 million)
Economic Analysis of the Food & Agriculture Sector in Nevada – 2017
Nevada Department of Agriculture
page | 57
These industries accounted for more than 83% of total Humboldt County’s agriculture sector
output.
The top food manufacturing industries were:
Tortilla manufacturing ($3.5 million)
Dehydrated food products manufacturing ($2.0 million)
Mayonnaise, dressing and sauce manufacturing ($2.0 million)
These industries accounted for approximately 6% of Humboldt County’s agriculture sector output.
Total county employment was 10,361. The agriculture sector in Humboldt County had 757
employees accounting for 7.3% of the total county employment.
In 2015, Humboldt County labor income of the agriculture sector was $31.2 million accounting for
4.9% of the total county’s labor income.
The agriculture sector total exports were $116.4 million, and total foreign exports to international
markets were $6.4 million. Agriculture production had $38.8 million more in exports than imports.
The agricultural production industries in Humboldt County had a positive balance of trade. This
shows the importance of agriculture production to Humboldt County economy.
However, the food and manufacturing industries had a negative trade balance of $49.5 million.
Negative trade balance shows that most of Humboldt County food manufacturing commodities
were purchased from outside of the county.
In 2015, given the economic inter-linkage and multiplier effect, the total economic impact to the
Nevada’s economy from all the agricultural sector activities was $179.7 million. The total
employment impact from activity of the agricultural sector was 1,106 jobs and $42.9 million in
labor income.
Food and Agriculture Sector – Humboldt County:
Agriculture Land and Farms:
In 2012, the approximate land area of Humboldt County was 6,170,097 acres. There were 359 farms in
Humboldt County covering 808,872 acres of land, which counts for 13.1% of land in farms. Average farm
size was 2,253 acres. Approximately 36% or 130 farms were small size farms between 1 to 49 acres, 26%
were mid-size farms between 50 to 499 acres, and 38% were large size farms with 500 to 1,000 acres and
more. (Graph 1.)
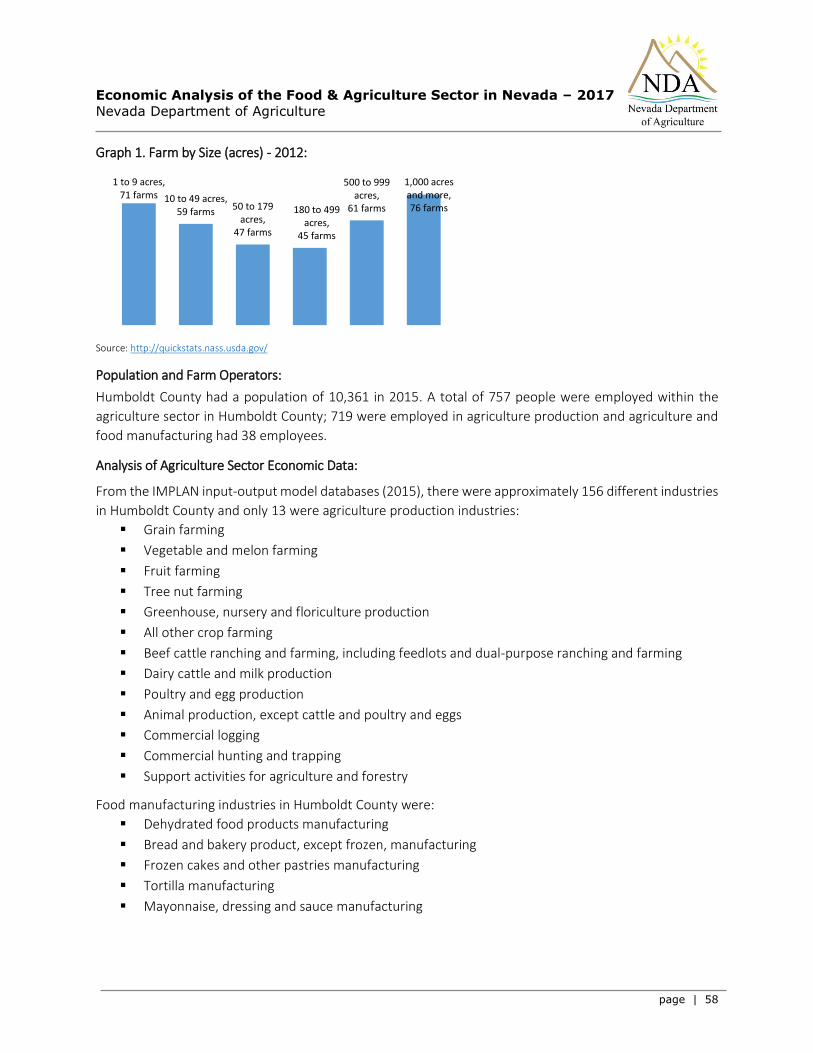
Economic Analysis of the Food & Agriculture Sector in Nevada – 2017
Nevada Department of Agriculture
page | 58
Graph 1. Farm by Size (acres) - 2012:
Source: http://quickstats.nass.usda.gov/
Population and Farm Operators:
Humboldt County had a population of 10,361 in 2015. A total of 757 people were employed within the
agriculture sector in Humboldt County; 719 were employed in agriculture production and agriculture and
food manufacturing had 38 employees.
Analysis of Agriculture Sector Economic Data:
From the IMPLAN input-output model databases (2015), there were approximately 156 different industries
in Humboldt County and only 13 were agriculture production industries:
Grain farming
Vegetable and melon farming
Fruit farming
Tree nut farming
Greenhouse, nursery and floriculture production
All other crop farming
Beef cattle ranching and farming, including feedlots and dual-purpose ranching and farming
Dairy cattle and milk production
Poultry and egg production
Animal production, except cattle and poultry and eggs
Commercial logging
Commercial hunting and trapping
Support activities for agriculture and forestry
Food manufacturing industries in Humboldt County were:
Dehydrated food products manufacturing
Bread and bakery product, except frozen, manufacturing
Frozen cakes and other pastries manufacturing
Tortilla manufacturing
Mayonnaise, dressing and sauce manufacturing
1 to 9 acres, 71 farms 10 to 49 acres,
59 farms50 to 179
acres, 47 farms
180 to 499 acres,
45 farms
500 to 999 acres,
61 farms
1,000 acres and more, 76 farms
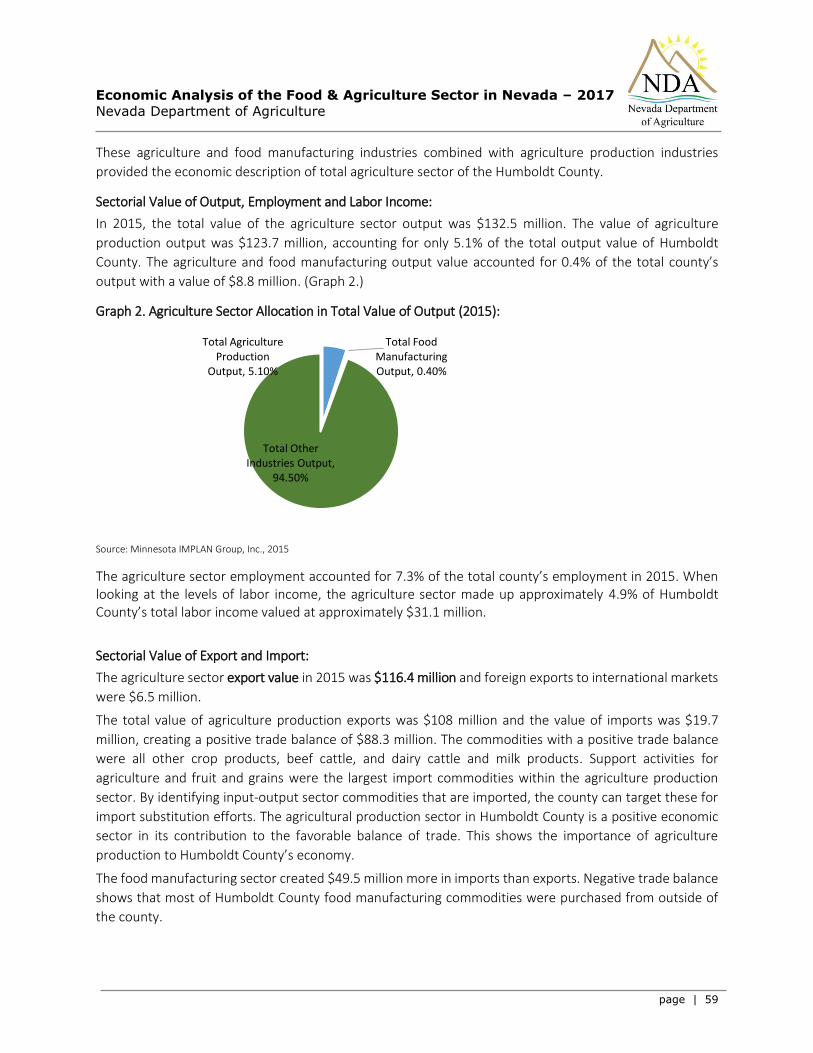
Economic Analysis of the Food & Agriculture Sector in Nevada – 2017
Nevada Department of Agriculture
page | 59
These agriculture and food manufacturing industries combined with agriculture production industries
provided the economic description of total agriculture sector of the Humboldt County.
Sectorial Value of Output, Employment and Labor Income:
In 2015, the total value of the agriculture sector output was $132.5 million. The value of agriculture
production output was $123.7 million, accounting for only 5.1% of the total output value of Humboldt
County. The agriculture and food manufacturing output value accounted for 0.4% of the total county’s
output with a value of $8.8 million. (Graph 2.)
Graph 2. Agriculture Sector Allocation in Total Value of Output (2015):
Source: Minnesota IMPLAN Group, Inc., 2015
The agriculture sector employment accounted for 7.3% of the total county’s employment in 2015. When looking at the levels of labor income, the agriculture sector made up approximately 4.9% of Humboldt County’s total labor income valued at approximately $31.1 million.
Sectorial Value of Export and Import:
The agriculture sector export value in 2015 was $116.4 million and foreign exports to international markets
were $6.5 million.
The total value of agriculture production exports was $108 million and the value of imports was $19.7
million, creating a positive trade balance of $88.3 million. The commodities with a positive trade balance
were all other crop products, beef cattle, and dairy cattle and milk products. Support activities for
agriculture and fruit and grains were the largest import commodities within the agriculture production
sector. By identifying input-output sector commodities that are imported, the county can target these for
import substitution efforts. The agricultural production sector in Humboldt County is a positive economic
sector in its contribution to the favorable balance of trade. This shows the importance of agriculture
production to Humboldt County’s economy.
The food manufacturing sector created $49.5 million more in imports than exports. Negative trade balance
shows that most of Humboldt County food manufacturing commodities were purchased from outside of
the county.
Total Agriculture Production
Output, 5.10%
Total Food Manufacturing Output, 0.40%
Total Other Industries Output,
94.50%

Economic Analysis of the Food & Agriculture Sector in Nevada – 2017
Nevada Department of Agriculture
page | 60
Economic Impact Analysis of the Agriculture Sector on Humboldt County Economy:
The economic impact analysis shows the impact of agriculture production and food manufacturing activities
on the total Humboldt County economy. Table 1. shows the impacts of the agriculture sector industries on
the Humboldt County economy.
In 2015, the total economic impact of the agriculture sector on Humboldt County economy was $179.7
million. Given the multiplier impact, the total economic impact generated by Humboldt County’s
agriculture production activities was $171.1 million. The total economic impact of agriculture production
activities was $171 million. The total economic impact generated by agriculture and food manufacturing
operations was $8.5 million.
Table 1. Economic Impact of the Agriculture Sector Industries – 2015:
Agriculture Sectors Direct Impact Indirect Impact Induced Impact Total Impact
Agriculture Production
$125,356,338 $31,545,545 $14,242,293 $171,144,176
Agriculture/ Food Manufacturing
$6,930,854 $1,118,885 $467,256 $8,516,995
Total Agriculture Sector
$132,287,191 $32,664,431 $14,709,549 $179,661,171
Source: IMPLAN data for Nevada (2015)
The total employment impact of the agriculture sector was 1,105 employees. (Table 2.)
Table 2. Employment Impact of the Agriculture Sector Industries – 2015:
Agriculture Sectors Direct Impact Indirect Impact Induced Impact Total Impact
Agriculture Production
719 234 109 1,062
Agriculture/ Food Manufacturing
34 6 4 44
Total Agriculture Sector
753 241 112 1,105
Source: IMPLAN data for Nevada (2015)
The multiplier offers a useful way to interpret these ripple effects. Table 3. shows the sector multiplier.
Table 3. Industry Multipliers for the Agriculture Sector Industries – 2015:
Employment Total Output
Total Agriculture Sector 1.5 1.4 Source: IMPLAN data for Nevada (2015)
The ratio of total direct impact to impact value yields a multiplier of 1.4, meaning that every dollar invested
in Humboldt County’s agriculture sector industries stimulates another $0.40 in additional economic activity
Economic Analysis of the Food & Agriculture Sector in Nevada – 2017
Nevada Department of Agriculture
page | 61
in other industries in the state. The employment multiplier was 1.5, meaning that every 10 jobs directly
related to agriculture support an additional 5 jobs in the state.
LANDER COUNTY:
Overview: This report provides a profile of the agriculture sector and an overview of the economic impact the
agriculture sector has on the economy of Lander County.
From the USDA Census data, Lander County had 124 farms, covering approximately 8.9% of land.
When it comes to size of farms, 32% of them are large size with 1,000 and more acres.
In 2015, Lander County’s total value of agriculture sector output was $30.7 million accounting for
2.2% of the total county production output.
The largest industries when it comes to agriculture production output value were:
All other crop farming including hay ($16 million)
Beef cattle ranching and farming ($11.8 million)
Vegetable and melon farming ($871,164)
These industries accounts for more than 94% of total Lander County’s agriculture sector output.
The agriculture and food manufacturing industries were:
Bread and bakeries
Frozen Cakes and other pastries manufacturing
Food manufacturing only related to bread and bakery industry within the big chain grocery stores
in this county making its impact insignificant.
Total county employment was 4,493. The agriculture sector in Lander County had 208 employees
accounting for 4.6% of the total County employment.
In 2015, Lander County labor income of the agriculture sector was $12.1 million accounting for
3.4% of the total county’s labor income.
The agriculture sector total exports were $25.4 million, and $1.8 million were total foreign exports
to international markets. The agriculture production had $20.8 million more in exports than
imports. The agricultural production industries in Lander County had a positive balance of trade.
This shows the importance of agriculture production to Lander County’s economy.
However, the food and manufacturing industries had a negative trade balance of $16.2 million.
Negative trade balance shows that most of Lander County food manufacturing commodities were
purchased from outside of the county.
In 2015, given the economic inter-linkage and multiplier effect, the total economic impact to the
Nevada’s economy from all the agricultural sector activities was $41.6 million. The total
employment impacts from activity of the agricultural sectors was 271 jobs and $15.2 million in
labor income.
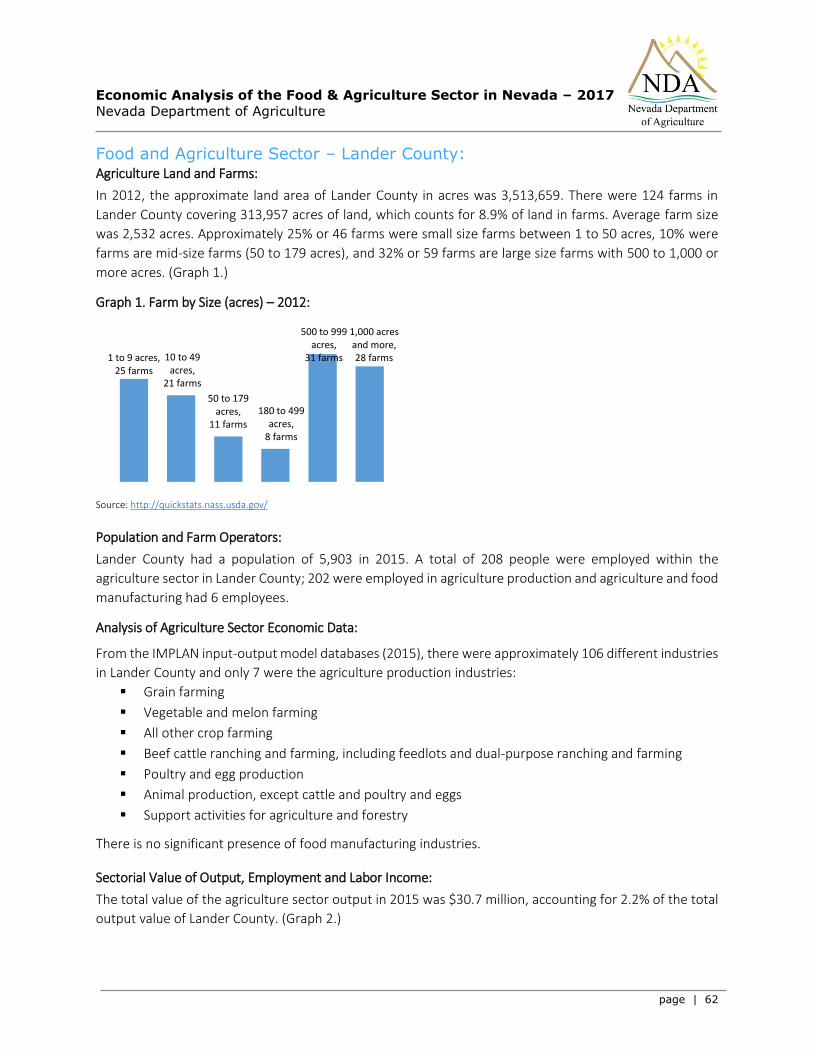
Economic Analysis of the Food & Agriculture Sector in Nevada – 2017
Nevada Department of Agriculture
page | 62
Food and Agriculture Sector – Lander County:
Agriculture Land and Farms:
In 2012, the approximate land area of Lander County in acres was 3,513,659. There were 124 farms in
Lander County covering 313,957 acres of land, which counts for 8.9% of land in farms. Average farm size
was 2,532 acres. Approximately 25% or 46 farms were small size farms between 1 to 50 acres, 10% were
farms are mid-size farms (50 to 179 acres), and 32% or 59 farms are large size farms with 500 to 1,000 or
more acres. (Graph 1.)
Graph 1. Farm by Size (acres) – 2012:
Source: http://quickstats.nass.usda.gov/
Population and Farm Operators:
Lander County had a population of 5,903 in 2015. A total of 208 people were employed within the
agriculture sector in Lander County; 202 were employed in agriculture production and agriculture and food
manufacturing had 6 employees.
Analysis of Agriculture Sector Economic Data:
From the IMPLAN input-output model databases (2015), there were approximately 106 different industries
in Lander County and only 7 were the agriculture production industries:
Grain farming
Vegetable and melon farming
All other crop farming
Beef cattle ranching and farming, including feedlots and dual-purpose ranching and farming
Poultry and egg production
Animal production, except cattle and poultry and eggs
Support activities for agriculture and forestry
There is no significant presence of food manufacturing industries.
Sectorial Value of Output, Employment and Labor Income:
The total value of the agriculture sector output in 2015 was $30.7 million, accounting for 2.2% of the total
output value of Lander County. (Graph 2.)
1 to 9 acres, 25 farms
10 to 49 acres,
21 farms
50 to 179 acres,
11 farms
180 to 499 acres,
8 farms
500 to 999 acres,
31 farms
1,000 acres and more, 28 farms
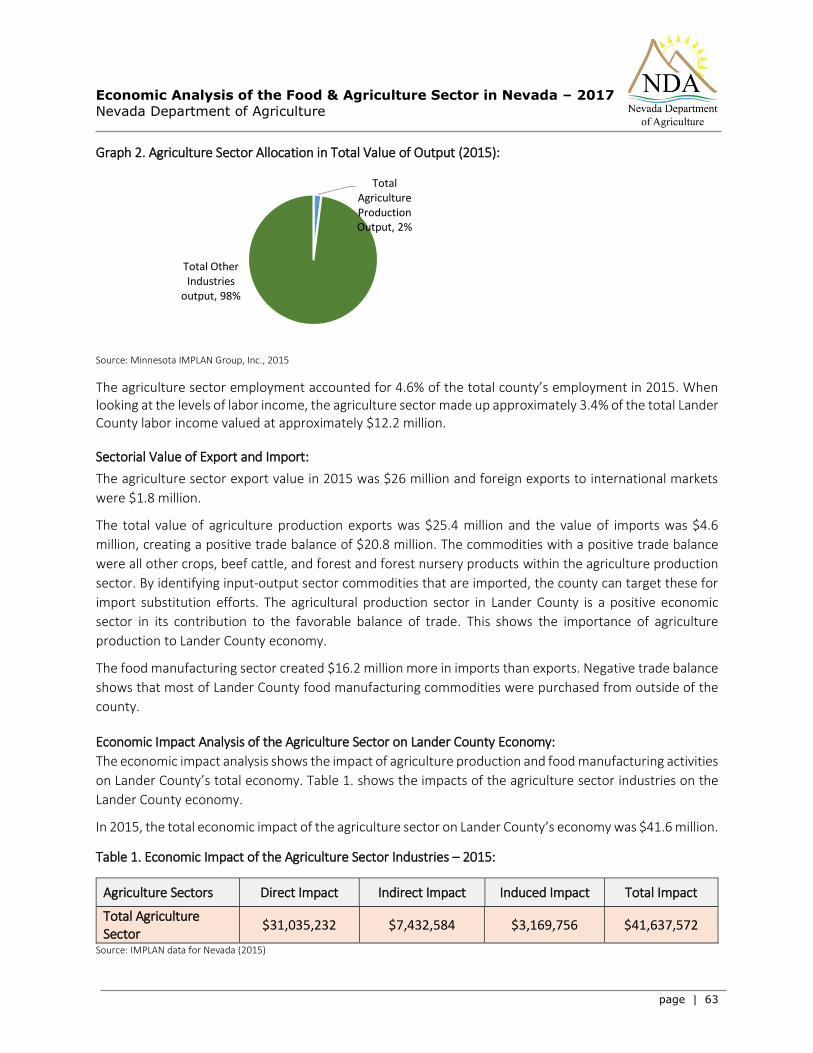
Economic Analysis of the Food & Agriculture Sector in Nevada – 2017
Nevada Department of Agriculture
page | 63
Graph 2. Agriculture Sector Allocation in Total Value of Output (2015):
Source: Minnesota IMPLAN Group, Inc., 2015
The agriculture sector employment accounted for 4.6% of the total county’s employment in 2015. When looking at the levels of labor income, the agriculture sector made up approximately 3.4% of the total Lander County labor income valued at approximately $12.2 million.
Sectorial Value of Export and Import:
The agriculture sector export value in 2015 was $26 million and foreign exports to international markets
were $1.8 million.
The total value of agriculture production exports was $25.4 million and the value of imports was $4.6
million, creating a positive trade balance of $20.8 million. The commodities with a positive trade balance
were all other crops, beef cattle, and forest and forest nursery products within the agriculture production
sector. By identifying input-output sector commodities that are imported, the county can target these for
import substitution efforts. The agricultural production sector in Lander County is a positive economic
sector in its contribution to the favorable balance of trade. This shows the importance of agriculture
production to Lander County economy.
The food manufacturing sector created $16.2 million more in imports than exports. Negative trade balance
shows that most of Lander County food manufacturing commodities were purchased from outside of the
county.
Economic Impact Analysis of the Agriculture Sector on Lander County Economy:
The economic impact analysis shows the impact of agriculture production and food manufacturing activities
on Lander County’s total economy. Table 1. shows the impacts of the agriculture sector industries on the
Lander County economy.
In 2015, the total economic impact of the agriculture sector on Lander County’s economy was $41.6 million.
Table 1. Economic Impact of the Agriculture Sector Industries – 2015:
Agriculture Sectors Direct Impact Indirect Impact Induced Impact Total Impact
Total Agriculture Sector
$31,035,232 $7,432,584 $3,169,756 $41,637,572
Source: IMPLAN data for Nevada (2015)
Total Agriculture Production Output, 2%
Total Other Industries
output, 98%

Economic Analysis of the Food & Agriculture Sector in Nevada – 2017
Nevada Department of Agriculture
page | 64
The total employment impact of the agriculture sector was 271 employees. (Table 2.)
Table 2. Employment Impacts of the Agriculture Sector Industries – 2015:
Agriculture Sectors Direct Impact Indirect Impact Induced Impact Total Impact
Total Agriculture Sector
208 42 22 271
Source: IMPLAN data for Nevada (2015)
The multiplier offers a useful way to interpret these ripple effects. Table 3. shows the sector multiplier.
Table 3. Industry Multipliers for the Agriculture Sector Industries – 2015:
Employment Total Output
Total Agriculture Sector 1.3 1.3 Source: IMPLAN data for Nevada (2015)
The ratio of total direct impact to impact value yields a multiplier of 1.3, meaning that every dollar
invested in Lander County’s agriculture sector industries stimulates another $0.30 in additional economic
activity in other industries in the state. The employment multiplier was 1.3, meaning that every 10 jobs
directly related to agriculture support an additional 3 jobs in the state.
LINCOLN COUNTY:
Overview: This report provides a profile of the agriculture sector and an overview of the economic impact the
agriculture sector has on the economy of Lincoln County.
From the USDA Census data, Lincoln County had 185 farms. When it comes to size of farms, they
are somewhat evenly distributed between small, mid and large size farms.
In 2015, Lincoln County’s total value of agriculture sector output was $49.9 million accounting for
19.2% of the total county production output.
The largest industries when it comes to agriculture production output value were:
Beef cattle ranching and farming ($30.1 million)
All other crop farming including hay($10.1 million)
Greenhouse, nursery and floriculture production ($3.4 million)
These industries accounted for more than 88% of total Lincoln County’s agriculture sector output.
Total county employment was 4,494. The agriculture sector in Lincoln County had 208 employees
accounting for 4.6% of the total county employment.
In 2015, Lincoln County labor income of the agriculture sector was $12.2 million accounting for
3.6% of the total County’s labor income.
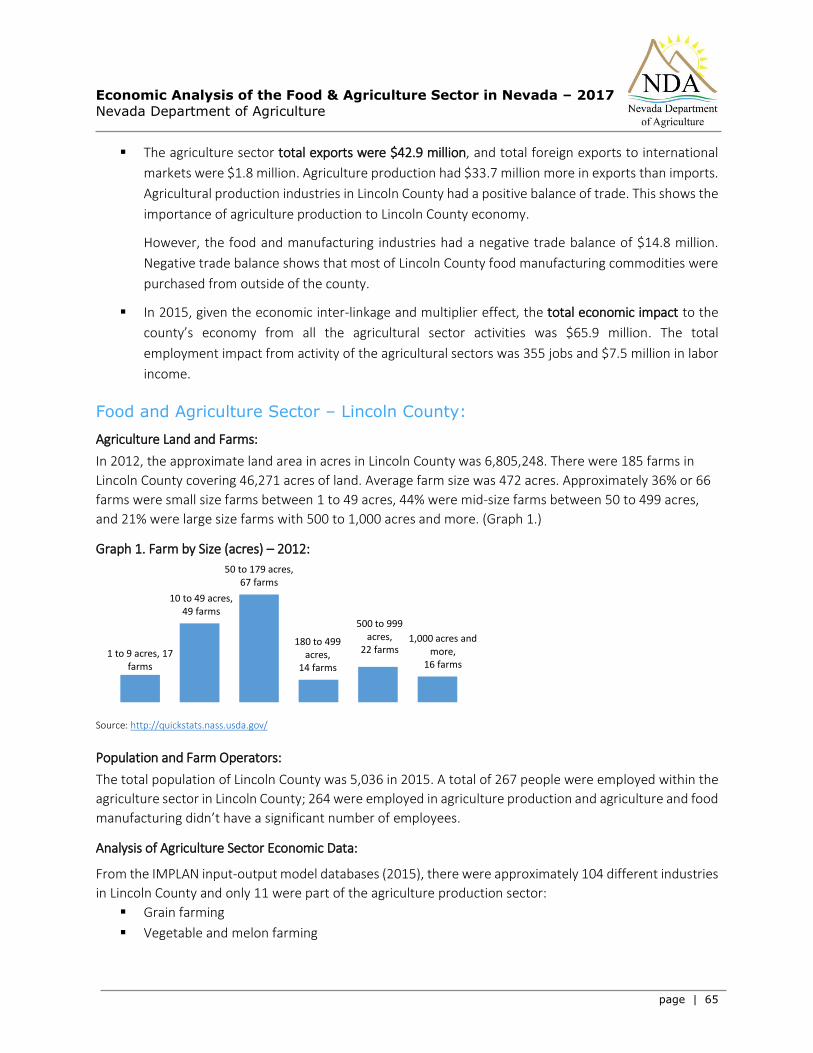
Economic Analysis of the Food & Agriculture Sector in Nevada – 2017
Nevada Department of Agriculture
page | 65
The agriculture sector total exports were $42.9 million, and total foreign exports to international
markets were $1.8 million. Agriculture production had $33.7 million more in exports than imports.
Agricultural production industries in Lincoln County had a positive balance of trade. This shows the
importance of agriculture production to Lincoln County economy.
However, the food and manufacturing industries had a negative trade balance of $14.8 million.
Negative trade balance shows that most of Lincoln County food manufacturing commodities were
purchased from outside of the county.
In 2015, given the economic inter-linkage and multiplier effect, the total economic impact to the
county’s economy from all the agricultural sector activities was $65.9 million. The total
employment impact from activity of the agricultural sectors was 355 jobs and $7.5 million in labor
income.
Food and Agriculture Sector – Lincoln County:
Agriculture Land and Farms:
In 2012, the approximate land area in acres in Lincoln County was 6,805,248. There were 185 farms in
Lincoln County covering 46,271 acres of land. Average farm size was 472 acres. Approximately 36% or 66
farms were small size farms between 1 to 49 acres, 44% were mid-size farms between 50 to 499 acres,
and 21% were large size farms with 500 to 1,000 acres and more. (Graph 1.)
Graph 1. Farm by Size (acres) – 2012:
Source: http://quickstats.nass.usda.gov/
Population and Farm Operators:
The total population of Lincoln County was 5,036 in 2015. A total of 267 people were employed within the
agriculture sector in Lincoln County; 264 were employed in agriculture production and agriculture and food
manufacturing didn’t have a significant number of employees.
Analysis of Agriculture Sector Economic Data:
From the IMPLAN input-output model databases (2015), there were approximately 104 different industries
in Lincoln County and only 11 were part of the agriculture production sector:
Grain farming
Vegetable and melon farming
1 to 9 acres, 17 farms
10 to 49 acres, 49 farms
50 to 179 acres, 67 farms
180 to 499 acres,
14 farms
500 to 999 acres,
22 farms1,000 acres and
more, 16 farms

Economic Analysis of the Food & Agriculture Sector in Nevada – 2017
Nevada Department of Agriculture
page | 66
Fruit farming
Tree nut farming
Greenhouse, nursery and floriculture production
All other crop farming
Beef cattle ranching and farming, including feedlots and dual-purpose ranching and farming
Poultry and egg production
Animal production, except cattle and poultry and eggs
Commercial hunting and trapping
Support activities for agriculture and forestry
There is no significant presence of the food manufacturing industries, so agriculture production industries
will be the only segment of the agriculture sector in Lincoln County.
Sectorial Value of Output, Employment and Labor Income:
The total value of the agriculture production sector output in 2015 was $49.9 million, accounting for 19.2%
of the total output value of Lincoln County. (Graph 2.)
Graph 2. Agriculture Sector Allocation in Total Value of Output (2015):
Source: Minnesota IMPLAN Group, Inc., 2015
The agriculture sector employment accounted for 12.7% of the total county’s employment in 2015. When looking at the levels of labor income, the agriculture sector made up approximately 7.6% of the total Lincoln County labor income valued at approximately $5.6 million.
Sectorial Value of Export and Import:
The agriculture sector export value in 2015 was $42.9 million and foreign exports to international markets
were $41 million.
The total value of agriculture production exports was $42.4 million and the value of imports was $8.8
million, creating a positive trade balance of $33.7 million. The commodities with a positive trade balance
were beef cattle, all other crops, and greenhouse, nursery and floriculture products within the agriculture
production sector. By identifying input-output sector commodities that are imported, the county can target
these for import substitution efforts. The agricultural production sector in Lincoln County is a positive
Total Agriculture
Sector Output, 19.20%
Total Other Industries Output, 80.80%

Economic Analysis of the Food & Agriculture Sector in Nevada – 2017
Nevada Department of Agriculture
page | 67
economic sector in its contribution to the favorable balance of trade. This shows the importance of
agriculture production to Lincoln County’s economy.
The food manufacturing sector created $14.8 million more in imports than exports. Negative trade balance
shows that most of Lincoln County food manufacturing commodities were purchased from outside of the
county.
Economic Impact Analysis of the Agriculture Sector on Lincoln County Economy:
The economic impact analysis shows the impact of agriculture production and food manufacturing activities
on Lincoln County’s total economy. Table 1. shows the impacts of the agriculture sector industries on the
Lincoln County economy.
In 2015, the total economic impact of the agriculture sector on Lincoln County’s economy was $65.9 million.
Table 1. Economic Impact of the Agriculture Sector Industries – 2015:
Agriculture Sectors Direct Impact Indirect Impact Induced Impact Total Impact
Total Agriculture Sector
$50,522,926 $13,365,402 $1,971,343 $65,859,671
Source: IMPLAN data for Nevada (2015)
When it comes to total employment, the total employment impact of the agriculture sector was 355
employees. (Table 2.)
Table 2. Employment Impacts of the Agriculture Sector Industries – 2015:
Agriculture Sectors Direct Impact Indirect Impact Induced Impact Total Impact
Total Agriculture Sector
267 73 15 355
Source: IMPLAN data for Nevada (2015)
The multiplier offers a useful way to interpret these ripple effects. Table 3. shows the sector multiplier.
Table 3. Industry Multipliers for the Agriculture Sector Industries – 2015:
Employment Total Output
Total Agriculture Sector 1.3 1.3 Source: IMPLAN data for Nevada (2015)
The ratio of total direct impact to impact value yields a multiplier of 1.3, meaning that every dollar invested
in Lincoln County’s agriculture sector industries stimulates another $0.30 in additional economic activity in
other industries in the state. The employment multiplier was 1.3, meaning that every 10 jobs directly
related to agriculture support an additional 3 jobs in the state.

Economic Analysis of the Food & Agriculture Sector in Nevada – 2017
Nevada Department of Agriculture
page | 68
LYON COUNTY:
Overview: This report provides a profile of the agriculture sector and an overview of the economic impact the
agriculture sector has on the economy of Lyon County.
From the USDA Census data, Lyon County had 462 farms covering 28.6% of land. More than 50%
of farms were small size farms between 1 to 49 acres.
In 2015, Lyon County’s total value of agriculture sector output was $236.6 million accounting for
8.5% of the total county production output.
The largest industries when it comes to agriculture production output value were:
Beef cattle ranching and farming ($55.1 million)
Vegetable and melon farming ($38.8 million)
Dairy cattle and milk production ($29.8 million)
These industries accounted for 52% of total Lyon County’s agriculture sector output.
The largest food manufacturing industries were:
Meat processed from carcasses ($40.5 million)
Confectionery manufacturing from purchased chocolate ($7.7 million)
Dehydrated food products manufacturing ($6.9 million)
These industries accounted for 23% of the total value of agriculture sector output.
Total county employment was 16,417. The agriculture sector in Lyon County had 1,084 employees
accounting for 6.6% of the total County employment.
In 2015, Lyon County labor income of agriculture sector was $46.6 million accounting for 6.6% of
the total County’s labor income.
The agriculture sector total exports were $197.3 million, and total foreign exports to international
markets were $11.9 million. The agriculture production had $111.2 million more in exports than
imports, creating a positive trade balance. This shows the importance of agriculture production to
Lyon County economy.
However, the agriculture and food manufacturing industries had a negative trade balance of $94.4
million. Negative trade balance shows that most of Lyon County food manufacturing commodities
were purchased from outside of the county.
In 2015, given the economic inter-linkage and multiplier effect, the total economic impact to the
Nevada’s economy from all the agricultural sector activities was $330.1 million. The total
employment impacts from activity of the agricultural sector were 1,665 jobs and $66 million in
labor income.
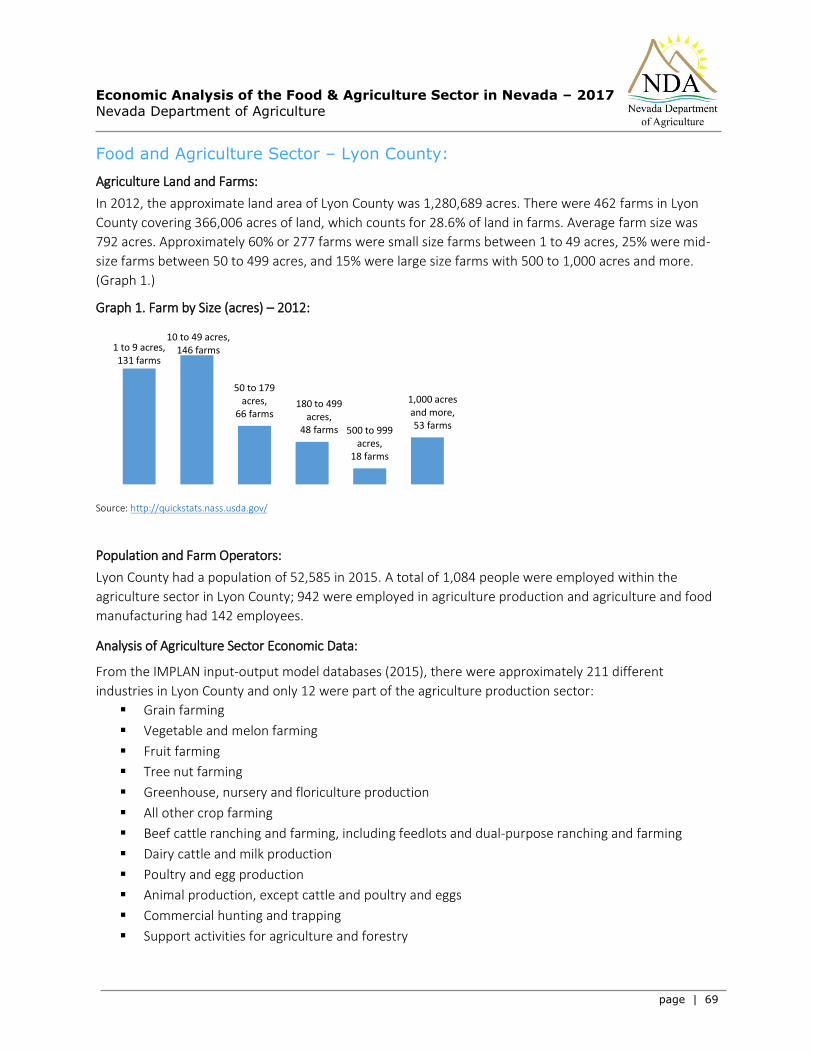
Economic Analysis of the Food & Agriculture Sector in Nevada – 2017
Nevada Department of Agriculture
page | 69
Food and Agriculture Sector – Lyon County:
Agriculture Land and Farms:
In 2012, the approximate land area of Lyon County was 1,280,689 acres. There were 462 farms in Lyon
County covering 366,006 acres of land, which counts for 28.6% of land in farms. Average farm size was
792 acres. Approximately 60% or 277 farms were small size farms between 1 to 49 acres, 25% were mid-
size farms between 50 to 499 acres, and 15% were large size farms with 500 to 1,000 acres and more.
(Graph 1.)
Graph 1. Farm by Size (acres) – 2012:
Source: http://quickstats.nass.usda.gov/
Population and Farm Operators:
Lyon County had a population of 52,585 in 2015. A total of 1,084 people were employed within the
agriculture sector in Lyon County; 942 were employed in agriculture production and agriculture and food
manufacturing had 142 employees.
Analysis of Agriculture Sector Economic Data:
From the IMPLAN input-output model databases (2015), there were approximately 211 different
industries in Lyon County and only 12 were part of the agriculture production sector:
Grain farming
Vegetable and melon farming
Fruit farming
Tree nut farming
Greenhouse, nursery and floriculture production
All other crop farming
Beef cattle ranching and farming, including feedlots and dual-purpose ranching and farming
Dairy cattle and milk production
Poultry and egg production
Animal production, except cattle and poultry and eggs
Commercial hunting and trapping
Support activities for agriculture and forestry
1 to 9 acres, 131 farms
10 to 49 acres, 146 farms
50 to 179 acres,
66 farms180 to 499
acres, 48 farms 500 to 999
acres, 18 farms
1,000 acres and more, 53 farms
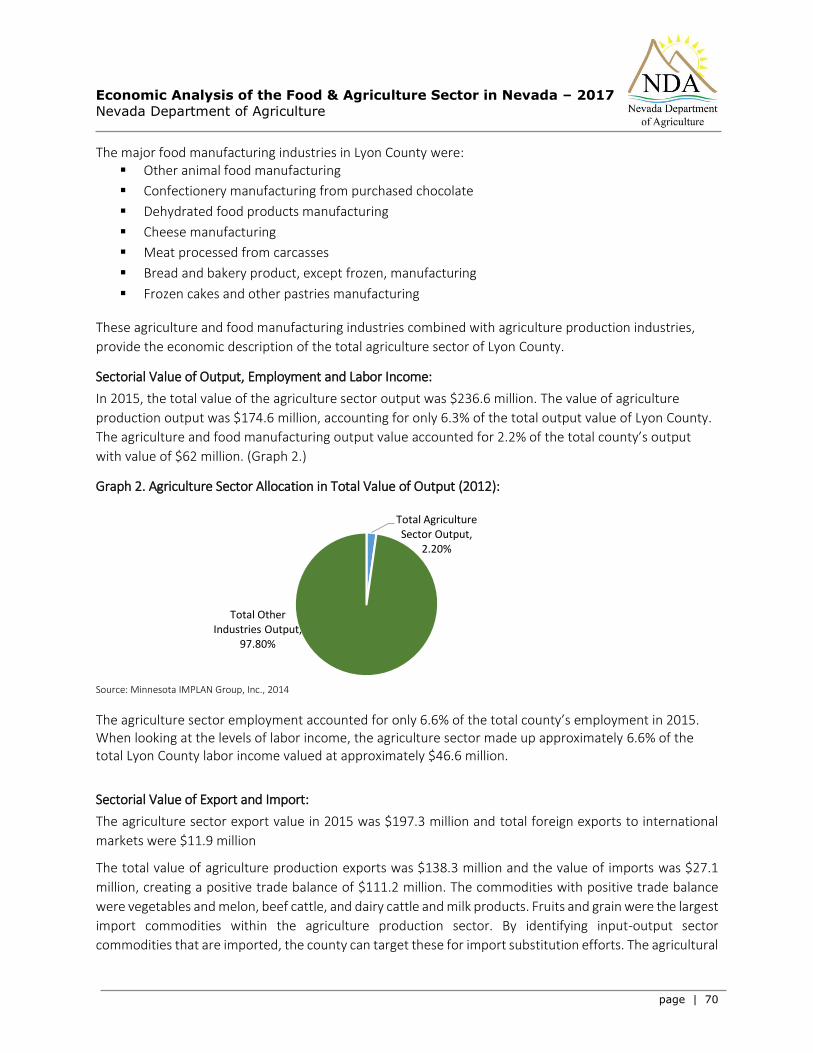
Economic Analysis of the Food & Agriculture Sector in Nevada – 2017
Nevada Department of Agriculture
page | 70
The major food manufacturing industries in Lyon County were: Other animal food manufacturing
Confectionery manufacturing from purchased chocolate
Dehydrated food products manufacturing
Cheese manufacturing
Meat processed from carcasses
Bread and bakery product, except frozen, manufacturing
Frozen cakes and other pastries manufacturing
These agriculture and food manufacturing industries combined with agriculture production industries,
provide the economic description of the total agriculture sector of Lyon County.
Sectorial Value of Output, Employment and Labor Income:
In 2015, the total value of the agriculture sector output was $236.6 million. The value of agriculture
production output was $174.6 million, accounting for only 6.3% of the total output value of Lyon County.
The agriculture and food manufacturing output value accounted for 2.2% of the total county’s output
with value of $62 million. (Graph 2.)
Graph 2. Agriculture Sector Allocation in Total Value of Output (2012):
Source: Minnesota IMPLAN Group, Inc., 2014
The agriculture sector employment accounted for only 6.6% of the total county’s employment in 2015. When looking at the levels of labor income, the agriculture sector made up approximately 6.6% of the total Lyon County labor income valued at approximately $46.6 million.
Sectorial Value of Export and Import:
The agriculture sector export value in 2015 was $197.3 million and total foreign exports to international
markets were $11.9 million
The total value of agriculture production exports was $138.3 million and the value of imports was $27.1
million, creating a positive trade balance of $111.2 million. The commodities with positive trade balance
were vegetables and melon, beef cattle, and dairy cattle and milk products. Fruits and grain were the largest
import commodities within the agriculture production sector. By identifying input-output sector
commodities that are imported, the county can target these for import substitution efforts. The agricultural
Total Agriculture Sector Output,
2.20%
Total Other Industries Output,
97.80%

Economic Analysis of the Food & Agriculture Sector in Nevada – 2017
Nevada Department of Agriculture
page | 71
production sector in Lyon County is a positive economic sector in its contribution to the favorable balance
of trade. This shows the importance of agriculture production to Lyon County economy.
The food manufacturing sector spent $94.4 million more in imports than exports. Negative trade balance
shows that most of Lyon County food manufacturing commodities were purchased from outside of the
county.
Economic Impact Analysis of the Agriculture Sector on Lyon County Economy:
The economic impact analysis shows the impact of agriculture production and food manufacturing activities
on the total Lyon County economy. Table 1. shows the impacts of the agriculture sector industries on the
Lyon County economy.
In 2015, the total economic impact of agriculture sector on Lyon County economy was $330.1 million. Given
the multiplier impact, the total economic impact generated by Lyon County agriculture production activities
was $242.2 million. The total economic impact generated by agriculture and food manufacturing
operations was $87.9 million.
Table 1. Economic Impact of the Agriculture Sector Industries – 2015:
Agriculture Sectors Direct Impact Indirect Impact Induced Impact Total Impact
Agriculture Production
$177,000,963 $46,625,391 $18,569,498 $242,195,852
Agriculture/ Food Manufacturing
$62,889,818 $21,597,089 $3,397,319 $87,884,226
Total Agriculture Sector
$239,890,781 $68,222,480 $21,966,817 $330,080,078
Source: IMPLAN data for Nevada (2015)
When it comes to total employment, the total employment impact of the agriculture sector was 1,665
employees. (Table 2.)
Table 2. Employment Impacts of the Agriculture Sector Industries – 2015:
Agriculture Sectors Direct Impact Indirect Impact Induced Impact Total Impact
Agriculture Production
942 309 146 1,397
Agriculture/ Food Manufacturing
141 100 27 268
Total Agriculture Sector
1,083 409 173 1,665
Source: IMPLAN data for Nevada (2015)
The multiplier offers a useful way to interpret these ripple effects. Table 3. shows the sector multiplier.
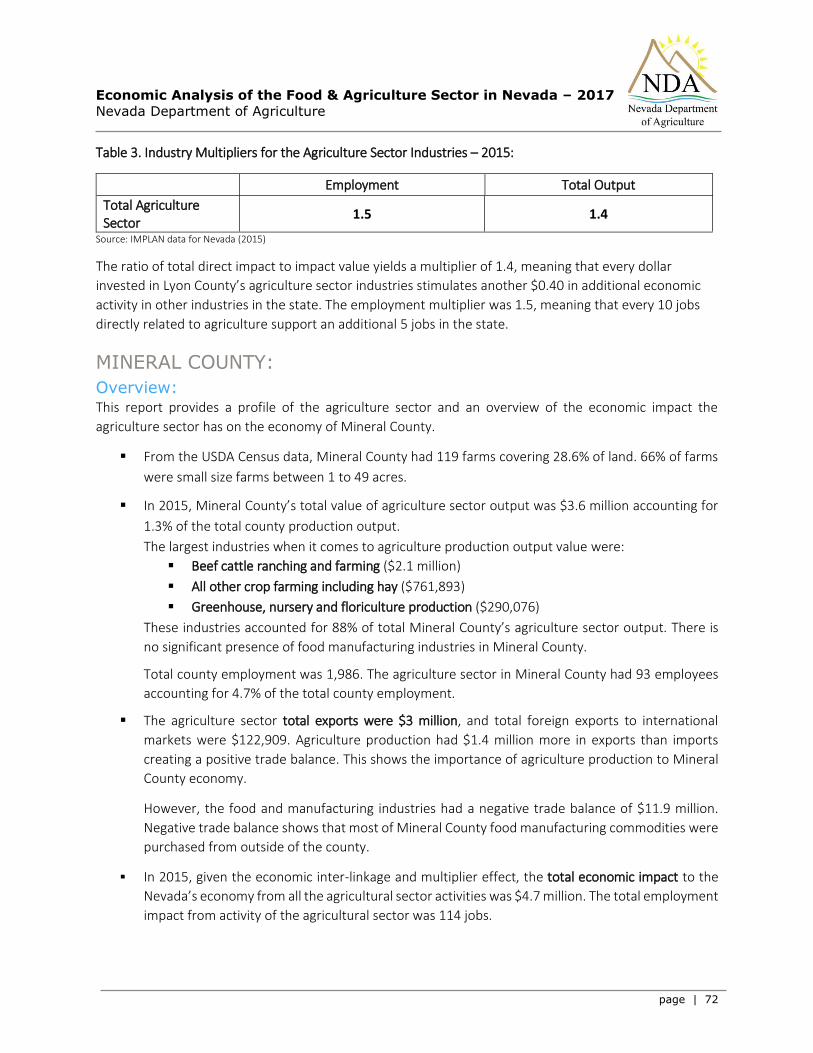
Economic Analysis of the Food & Agriculture Sector in Nevada – 2017
Nevada Department of Agriculture
page | 72
Table 3. Industry Multipliers for the Agriculture Sector Industries – 2015:
Employment Total Output
Total Agriculture Sector
1.5 1.4
Source: IMPLAN data for Nevada (2015)
The ratio of total direct impact to impact value yields a multiplier of 1.4, meaning that every dollar
invested in Lyon County’s agriculture sector industries stimulates another $0.40 in additional economic
activity in other industries in the state. The employment multiplier was 1.5, meaning that every 10 jobs
directly related to agriculture support an additional 5 jobs in the state.
MINERAL COUNTY:
Overview: This report provides a profile of the agriculture sector and an overview of the economic impact the
agriculture sector has on the economy of Mineral County.
From the USDA Census data, Mineral County had 119 farms covering 28.6% of land. 66% of farms
were small size farms between 1 to 49 acres.
In 2015, Mineral County’s total value of agriculture sector output was $3.6 million accounting for
1.3% of the total county production output.
The largest industries when it comes to agriculture production output value were:
Beef cattle ranching and farming ($2.1 million)
All other crop farming including hay ($761,893)
Greenhouse, nursery and floriculture production ($290,076)
These industries accounted for 88% of total Mineral County’s agriculture sector output. There is
no significant presence of food manufacturing industries in Mineral County.
Total county employment was 1,986. The agriculture sector in Mineral County had 93 employees
accounting for 4.7% of the total county employment.
The agriculture sector total exports were $3 million, and total foreign exports to international
markets were $122,909. Agriculture production had $1.4 million more in exports than imports
creating a positive trade balance. This shows the importance of agriculture production to Mineral
County economy.
However, the food and manufacturing industries had a negative trade balance of $11.9 million.
Negative trade balance shows that most of Mineral County food manufacturing commodities were
purchased from outside of the county.
In 2015, given the economic inter-linkage and multiplier effect, the total economic impact to the
Nevada’s economy from all the agricultural sector activities was $4.7 million. The total employment
impact from activity of the agricultural sector was 114 jobs.
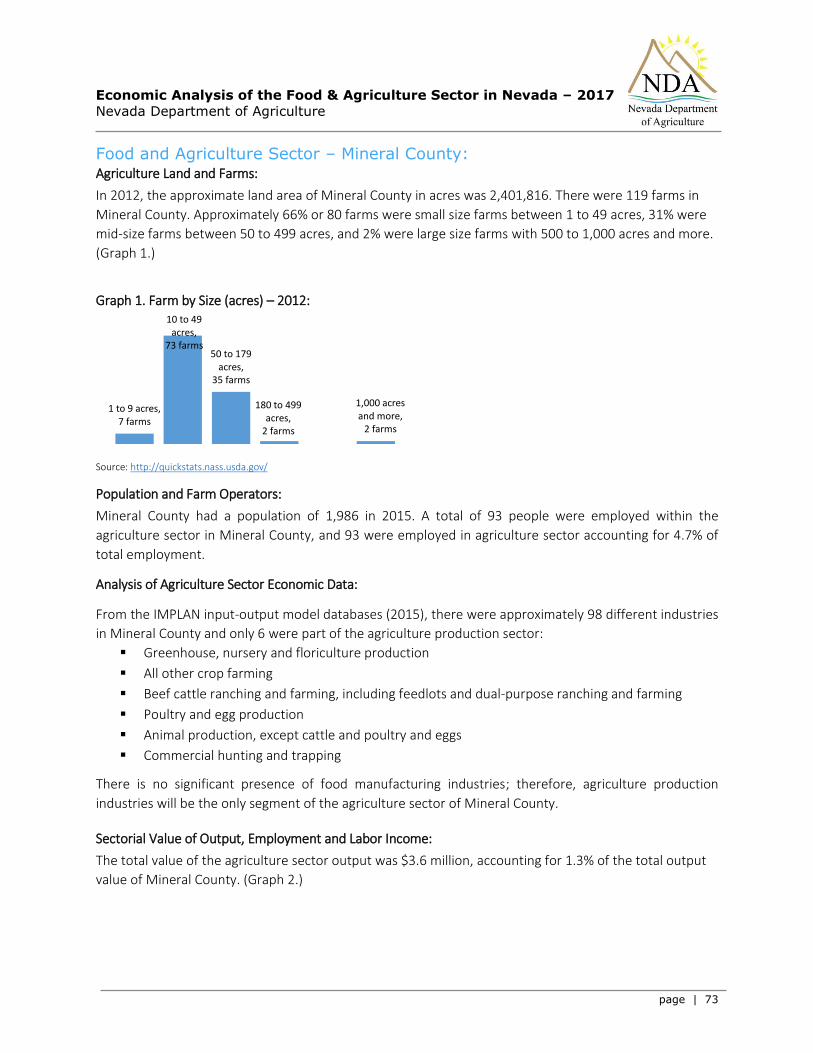
Economic Analysis of the Food & Agriculture Sector in Nevada – 2017
Nevada Department of Agriculture
page | 73
Food and Agriculture Sector – Mineral County: Agriculture Land and Farms:
In 2012, the approximate land area of Mineral County in acres was 2,401,816. There were 119 farms in
Mineral County. Approximately 66% or 80 farms were small size farms between 1 to 49 acres, 31% were
mid-size farms between 50 to 499 acres, and 2% were large size farms with 500 to 1,000 acres and more.
(Graph 1.)
Graph 1. Farm by Size (acres) – 2012:
Source: http://quickstats.nass.usda.gov/
Population and Farm Operators:
Mineral County had a population of 1,986 in 2015. A total of 93 people were employed within the
agriculture sector in Mineral County, and 93 were employed in agriculture sector accounting for 4.7% of
total employment.
Analysis of Agriculture Sector Economic Data:
From the IMPLAN input-output model databases (2015), there were approximately 98 different industries
in Mineral County and only 6 were part of the agriculture production sector:
Greenhouse, nursery and floriculture production
All other crop farming
Beef cattle ranching and farming, including feedlots and dual-purpose ranching and farming
Poultry and egg production
Animal production, except cattle and poultry and eggs
Commercial hunting and trapping
There is no significant presence of food manufacturing industries; therefore, agriculture production
industries will be the only segment of the agriculture sector of Mineral County.
Sectorial Value of Output, Employment and Labor Income:
The total value of the agriculture sector output was $3.6 million, accounting for 1.3% of the total output
value of Mineral County. (Graph 2.)
1 to 9 acres, 7 farms
10 to 49 acres,
73 farms50 to 179
acres, 35 farms
180 to 499 acres,
2 farms
1,000 acres and more,
2 farms
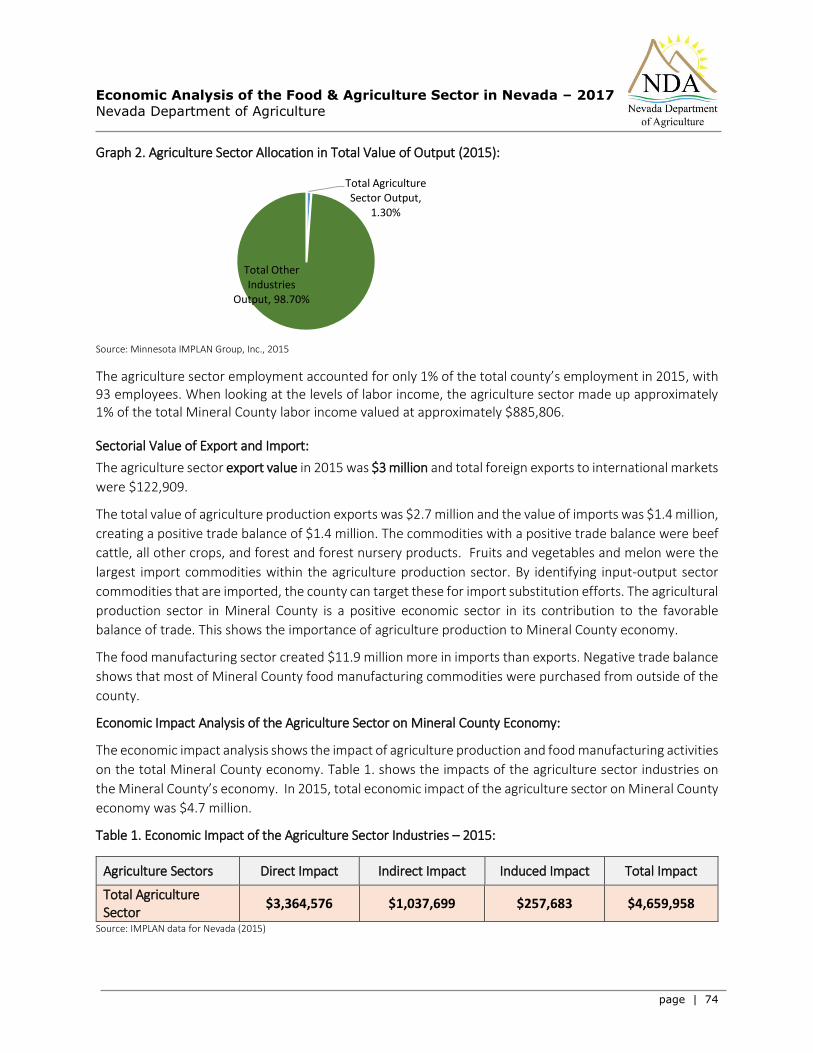
Economic Analysis of the Food & Agriculture Sector in Nevada – 2017
Nevada Department of Agriculture
page | 74
Graph 2. Agriculture Sector Allocation in Total Value of Output (2015):
Source: Minnesota IMPLAN Group, Inc., 2015
The agriculture sector employment accounted for only 1% of the total county’s employment in 2015, with 93 employees. When looking at the levels of labor income, the agriculture sector made up approximately 1% of the total Mineral County labor income valued at approximately $885,806.
Sectorial Value of Export and Import:
The agriculture sector export value in 2015 was $3 million and total foreign exports to international markets
were $122,909.
The total value of agriculture production exports was $2.7 million and the value of imports was $1.4 million,
creating a positive trade balance of $1.4 million. The commodities with a positive trade balance were beef
cattle, all other crops, and forest and forest nursery products. Fruits and vegetables and melon were the
largest import commodities within the agriculture production sector. By identifying input-output sector
commodities that are imported, the county can target these for import substitution efforts. The agricultural
production sector in Mineral County is a positive economic sector in its contribution to the favorable
balance of trade. This shows the importance of agriculture production to Mineral County economy.
The food manufacturing sector created $11.9 million more in imports than exports. Negative trade balance
shows that most of Mineral County food manufacturing commodities were purchased from outside of the
county.
Economic Impact Analysis of the Agriculture Sector on Mineral County Economy:
The economic impact analysis shows the impact of agriculture production and food manufacturing activities
on the total Mineral County economy. Table 1. shows the impacts of the agriculture sector industries on
the Mineral County’s economy. In 2015, total economic impact of the agriculture sector on Mineral County
economy was $4.7 million.
Table 1. Economic Impact of the Agriculture Sector Industries – 2015:
Agriculture Sectors Direct Impact Indirect Impact Induced Impact Total Impact
Total Agriculture Sector
$3,364,576 $1,037,699 $257,683 $4,659,958
Source: IMPLAN data for Nevada (2015)
Total Agriculture Sector Output,
1.30%
Total Other Industries
Output, 98.70%

Economic Analysis of the Food & Agriculture Sector in Nevada – 2017
Nevada Department of Agriculture
page | 75
When it comes to total employment, the total employment impact of the agriculture sector was 114
employees. (Table 2.)
Table 2. Employment Impacts of the Agriculture Sector Industries – 2015:
Agriculture Sectors Direct Impact Indirect Impact Induced Impact Total Impact
Total Agriculture Sector
92 21 2 114
Source: IMPLAN data for Nevada (2015)
The multiplier offers a useful way to interpret these ripple effects. Table 3. shows the sector multiplier.
Table 3. Industry Multipliers for the Agriculture Sector Industries – 2015:
Employment Total Output
Total Agriculture Sector
1.2 1.4
Source: IMPLAN data for Nevada (2015)
The ratio of total direct impact to impact value yields a multiplier of 1.4, meaning that every dollar invested
in Mineral County’s agriculture sector industries stimulates another $0.40 in additional economic activity
in other industries in the state. The employment multiplier was 1.2, meaning that every 10 jobs directly
related to agriculture support an additional 2 jobs in the state.
NYE COUNTY:
Overview: This report provides a profile of the agriculture sector and an overview of the economic impact the
agriculture sector has on the economy of Nye County.
From the USDA Census data, Nye County had 198 farms covering less than 1% of land. More than
60% of farms were small size farms between 1 to 49 acres.
In 2015, Nye County’s total value of agriculture sector output was $97.7 million accounting for 3.7%
of the total county production output.
The largest industries when it comes to agriculture production output value were:
Dairy cattle and milk production ($29.8 million)
Beef cattle ranching and farming ($23.6 million)
All other crop farming ($8.3 million)
These industries accounted for 63% of total Nye County’s agriculture sector output.
The largest food manufacturing industries were:
Fluid milk and butter manufacturing ($21.2 million)
Coffee and tea manufacturing ($6.3 million)
Bread and Bakery manufacturing ($2.1 million)
These industries accounted for 30% of the total value of agriculture sector output.
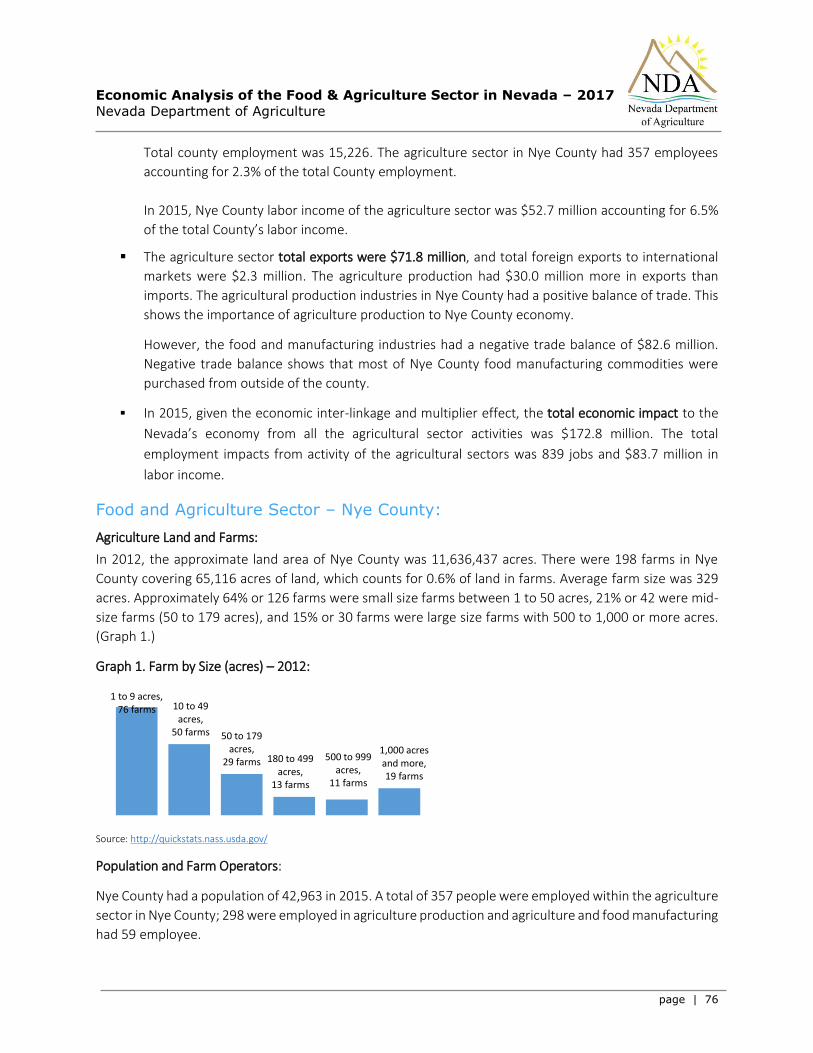
Economic Analysis of the Food & Agriculture Sector in Nevada – 2017
Nevada Department of Agriculture
page | 76
Total county employment was 15,226. The agriculture sector in Nye County had 357 employees
accounting for 2.3% of the total County employment.
In 2015, Nye County labor income of the agriculture sector was $52.7 million accounting for 6.5%
of the total County’s labor income.
The agriculture sector total exports were $71.8 million, and total foreign exports to international
markets were $2.3 million. The agriculture production had $30.0 million more in exports than
imports. The agricultural production industries in Nye County had a positive balance of trade. This
shows the importance of agriculture production to Nye County economy.
However, the food and manufacturing industries had a negative trade balance of $82.6 million.
Negative trade balance shows that most of Nye County food manufacturing commodities were
purchased from outside of the county.
In 2015, given the economic inter-linkage and multiplier effect, the total economic impact to the
Nevada’s economy from all the agricultural sector activities was $172.8 million. The total
employment impacts from activity of the agricultural sectors was 839 jobs and $83.7 million in
labor income.
Food and Agriculture Sector – Nye County:
Agriculture Land and Farms:
In 2012, the approximate land area of Nye County was 11,636,437 acres. There were 198 farms in Nye
County covering 65,116 acres of land, which counts for 0.6% of land in farms. Average farm size was 329
acres. Approximately 64% or 126 farms were small size farms between 1 to 50 acres, 21% or 42 were mid-
size farms (50 to 179 acres), and 15% or 30 farms were large size farms with 500 to 1,000 or more acres.
(Graph 1.)
Graph 1. Farm by Size (acres) – 2012:
Source: http://quickstats.nass.usda.gov/
Population and Farm Operators:
Nye County had a population of 42,963 in 2015. A total of 357 people were employed within the agriculture
sector in Nye County; 298 were employed in agriculture production and agriculture and food manufacturing
had 59 employee.
1 to 9 acres, 76 farms 10 to 49
acres, 50 farms 50 to 179
acres, 29 farms 180 to 499
acres, 13 farms
500 to 999 acres,
11 farms
1,000 acres and more, 19 farms
Economic Analysis of the Food & Agriculture Sector in Nevada – 2017
Nevada Department of Agriculture
page | 77
Analysis of Agriculture Sector Economic Data:
From the IMPLAN input-output model databases (2015), there were approximately 173 different industries
in Nye County and 12 were agriculture production industries:
Vegetable and melon farming
Fruit farming
Tree nut farming
Greenhouse, nursery and floriculture production
All other crop farming
Beef cattle ranching and farming, including feedlots and dual-purpose ranching and farming
Dairy cattle and milk production
Poultry and egg production
Animal production, except cattle and poultry and eggs
Commercial logging
Commercial hunting and trapping
Support activities for agriculture and forestry
The food manufacturing industries in Nye County are listed below:
Fluid milk manufacturing
Bread and bakery product, except frozen, manufacturing
Frozen cakes and other pastries manufacturing
Coffee and tea manufacturing
Manufactured ice
The food manufacturing industries combine with agriculture production industries provide the economic
description of total agriculture sector of Nye County.
Sectorial Value of Output, Employment and Labor Income:
In 2015, the total value of the agriculture sector output was $97.7 million. The total value of agriculture
production sector output was $67.7 million, accounting for only 2.6% of the total output value of Nye
County. The food manufacturing industries total output was valued at $29.9 million which was 1.1% of the
total county’s output value. (Graph 2.)
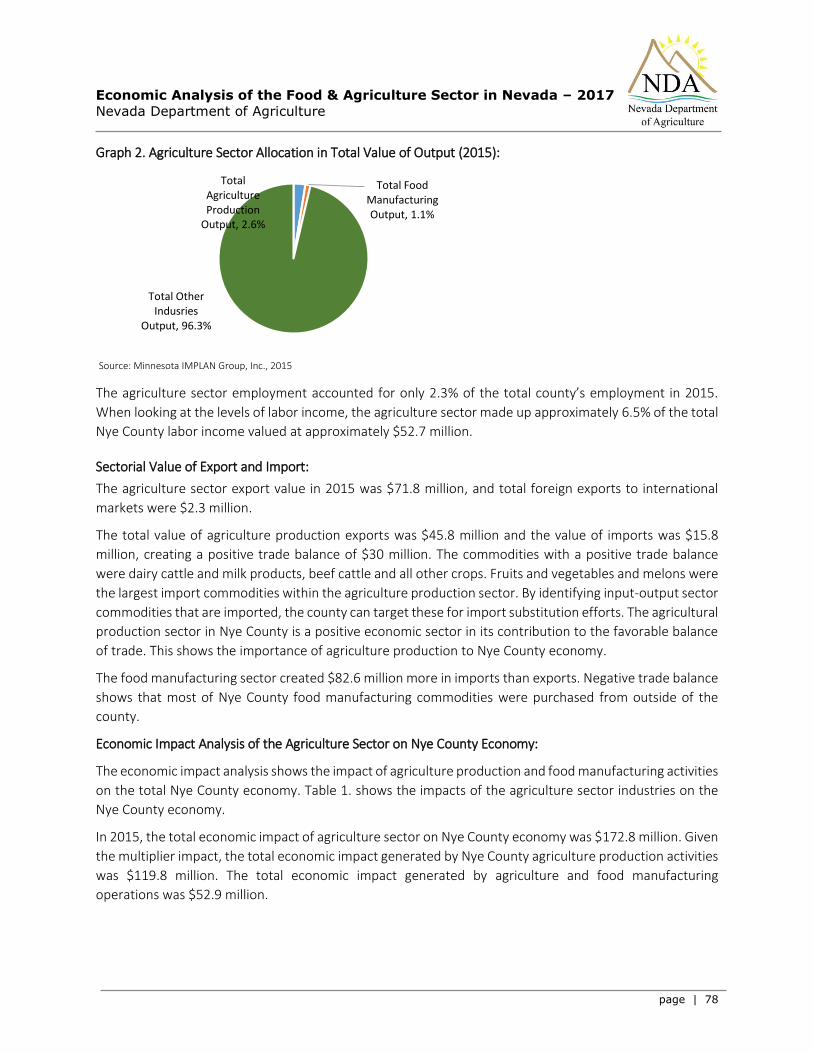
Economic Analysis of the Food & Agriculture Sector in Nevada – 2017
Nevada Department of Agriculture
page | 78
Graph 2. Agriculture Sector Allocation in Total Value of Output (2015):
Source: Minnesota IMPLAN Group, Inc., 2015
The agriculture sector employment accounted for only 2.3% of the total county’s employment in 2015.
When looking at the levels of labor income, the agriculture sector made up approximately 6.5% of the total
Nye County labor income valued at approximately $52.7 million.
Sectorial Value of Export and Import:
The agriculture sector export value in 2015 was $71.8 million, and total foreign exports to international
markets were $2.3 million.
The total value of agriculture production exports was $45.8 million and the value of imports was $15.8
million, creating a positive trade balance of $30 million. The commodities with a positive trade balance
were dairy cattle and milk products, beef cattle and all other crops. Fruits and vegetables and melons were
the largest import commodities within the agriculture production sector. By identifying input-output sector
commodities that are imported, the county can target these for import substitution efforts. The agricultural
production sector in Nye County is a positive economic sector in its contribution to the favorable balance
of trade. This shows the importance of agriculture production to Nye County economy.
The food manufacturing sector created $82.6 million more in imports than exports. Negative trade balance
shows that most of Nye County food manufacturing commodities were purchased from outside of the
county.
Economic Impact Analysis of the Agriculture Sector on Nye County Economy:
The economic impact analysis shows the impact of agriculture production and food manufacturing activities
on the total Nye County economy. Table 1. shows the impacts of the agriculture sector industries on the
Nye County economy.
In 2015, the total economic impact of agriculture sector on Nye County economy was $172.8 million. Given
the multiplier impact, the total economic impact generated by Nye County agriculture production activities
was $119.8 million. The total economic impact generated by agriculture and food manufacturing
operations was $52.9 million.
Total Agriculture Production
Output, 2.6%
Total Food Manufacturing Output, 1.1%
Total Other Indusries
Output, 96.3%

Economic Analysis of the Food & Agriculture Sector in Nevada – 2017
Nevada Department of Agriculture
page | 79
Table 1. Economic Impact of the Agriculture Sector Industries – 2015:
Agriculture Sectors Direct Impact Indirect Impact Induced Impact Total Impact
Agriculture Production
$68,657,512 $22,178,277 $29,013,392 $119,849,181
Agriculture/ Food Manufacturing
$30,132,019 $17,926,443 $4,850,261 $52,908,722
Total Agriculture Sector
$98,789,531 $40,104,719 $33,863,653 $172,757,903
Source: IMPLAN data for Nevada (2015)
When it comes to total employment, the total employment impact of the agriculture sector was 839
employees. (Table 2)
Table 2. Employment Impacts of the Agriculture Sector Industries – 2015:
Agriculture Sectors Direct Impact Indirect Impact Induced Impact Total Impact
Agriculture Production
298 157 223 678
Agriculture/ Food Manufacturing
58 66 37 161
Total Agriculture Sector
356 223 260 839
Source: IMPLAN data for Nevada (2015)
The multiplier offers a useful way to interpret these ripple effects. Table 3. shows the sector multiplier.
Table 3. Industry Multipliers for the Agriculture Sector Industries – 2015:
Employment Total Output
Total Agriculture Sector 2.4 1.7 Source: IMPLAN data for Nevada (2015)
The ratio of total direct impact to impact value yields a multiplier of 1.7, meaning that every dollar invested
in Nye County’s agriculture sector industries stimulates another $0.70 in additional economic activity in
other industries in the state. The employment multiplier was 2.4, meaning that every 10 jobs directly
related to agriculture support an additional 14 jobs in the state.
PERSHING COUNTY:
Overview: This report provides a profile of the agriculture sector and an overview of the economic impact the
agriculture sector has on the economy of Pershing County.
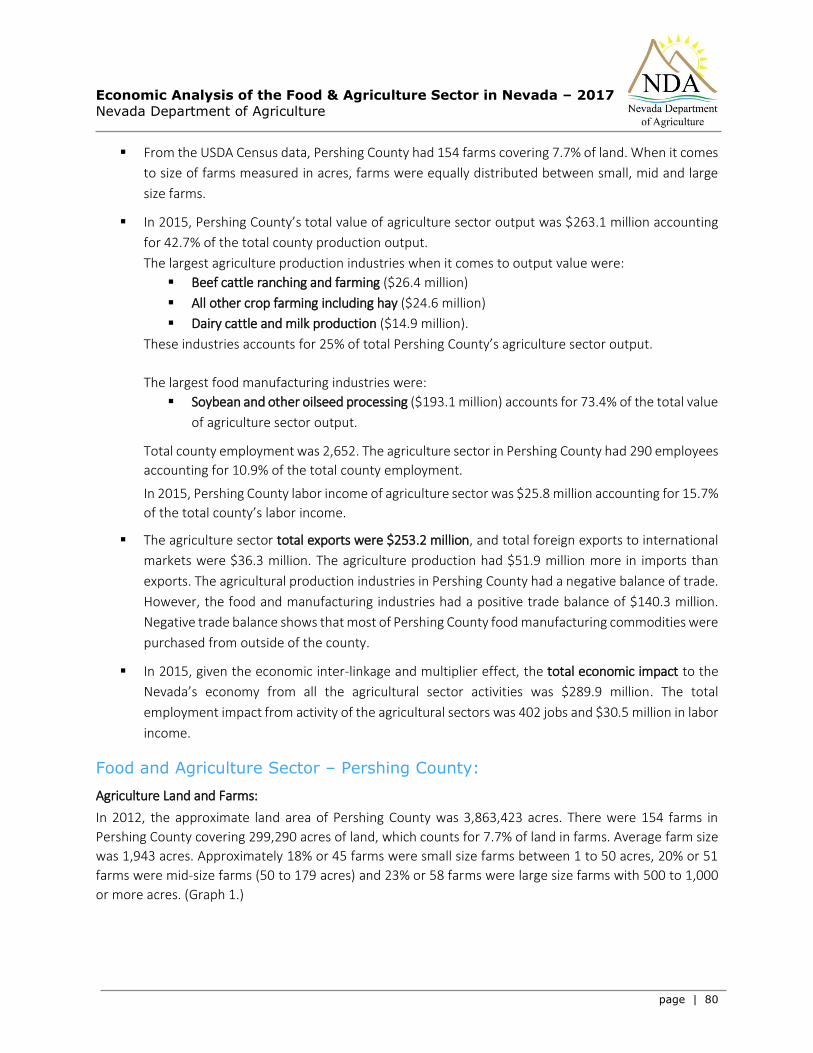
Economic Analysis of the Food & Agriculture Sector in Nevada – 2017
Nevada Department of Agriculture
page | 80
From the USDA Census data, Pershing County had 154 farms covering 7.7% of land. When it comes
to size of farms measured in acres, farms were equally distributed between small, mid and large
size farms.
In 2015, Pershing County’s total value of agriculture sector output was $263.1 million accounting
for 42.7% of the total county production output.
The largest agriculture production industries when it comes to output value were:
Beef cattle ranching and farming ($26.4 million)
All other crop farming including hay ($24.6 million)
Dairy cattle and milk production ($14.9 million).
These industries accounts for 25% of total Pershing County’s agriculture sector output.
The largest food manufacturing industries were:
Soybean and other oilseed processing ($193.1 million) accounts for 73.4% of the total value
of agriculture sector output.
Total county employment was 2,652. The agriculture sector in Pershing County had 290 employees
accounting for 10.9% of the total county employment.
In 2015, Pershing County labor income of agriculture sector was $25.8 million accounting for 15.7%
of the total county’s labor income.
The agriculture sector total exports were $253.2 million, and total foreign exports to international
markets were $36.3 million. The agriculture production had $51.9 million more in imports than
exports. The agricultural production industries in Pershing County had a negative balance of trade.
However, the food and manufacturing industries had a positive trade balance of $140.3 million.
Negative trade balance shows that most of Pershing County food manufacturing commodities were
purchased from outside of the county.
In 2015, given the economic inter-linkage and multiplier effect, the total economic impact to the
Nevada’s economy from all the agricultural sector activities was $289.9 million. The total
employment impact from activity of the agricultural sectors was 402 jobs and $30.5 million in labor
income.
Food and Agriculture Sector – Pershing County:
Agriculture Land and Farms:
In 2012, the approximate land area of Pershing County was 3,863,423 acres. There were 154 farms in
Pershing County covering 299,290 acres of land, which counts for 7.7% of land in farms. Average farm size
was 1,943 acres. Approximately 18% or 45 farms were small size farms between 1 to 50 acres, 20% or 51
farms were mid-size farms (50 to 179 acres) and 23% or 58 farms were large size farms with 500 to 1,000
or more acres. (Graph 1.)
Economic Analysis of the Food & Agriculture Sector in Nevada – 2017
Nevada Department of Agriculture
page | 81
Graph 1. Farm by Size (acres) – 2012:
Source: http://quickstats.nass.usda.gov/
Population and Farm Operators:
Pershing County had a population of 6,634 in 2015. The total number of agriculture sector employment
was 290 jobs, 252 within agriculture production industries and 38 employees in agriculture and food
manufacturing.
Analysis of Agriculture Sector Economic Data:
From the IMPLAN input-output model databases (2015), there were approximately 113 different industries
in Pershing County and 12 were agriculture production industries:
Grain farming
Fruit farming
Tree nut farming
Greenhouse, nursery, and floriculture production
All other crop farming
Beef cattle ranching and farming, including feedlots and dual-purpose ranching and farming
Dairy cattle and milk production
Poultry and egg production
Animal production, except cattle and poultry and eggs
Commercial logging
Commercial hunting and trapping
Support activities for agriculture and forestry
Food manufacturing industries of the Pershing County economy are listed below:
Soybean and other oilseed processing
Bread and bakery product manufacturing
The food manufacturing industries combined with the agriculture production industries provide the economic description of total agriculture sector of Pershing County.
1 to 9 acres, 12 farms
10 to 49 acres,
33 farms 50 to 179 acres,
23 farms
180 to 499 acres,
28 farms500 to 999
acres, 22 farms
1,000 acres and more, 36 farms

Economic Analysis of the Food & Agriculture Sector in Nevada – 2017
Nevada Department of Agriculture
page | 82
Sectorial Value of Output, Employment and Labor Income:
In 2015, the total value of the agriculture sector output was $263.1 million. The value of agriculture
production output was $69.9 million, accounting for only 11.4% of the total output value of Pershing
County. The agriculture and food manufacturing output value accounted for 31.4% of the total county’s
output with value of $193.2million. (Graph 2.)
Graph 2. Agriculture Sector Allocation in Total Value of Output (2015):
Source: Minnesota IMPLAN Group, Inc., 2015
The agriculture sector employment accounted for only 10.9% of the total county’s employment in 2015. When looking at the levels of labor income, the agriculture sector made up approximately 15.7% of the total Pershing County labor income valued at approximately $25.8 million.
Sectorial Value of Export and Import:
The agriculture sector export value in 2015 was $253.2 million and total foreign exports to international
markets were $36.3 million.
The total value of agriculture production exports was $65.5 million and the value of imports was $117.5
million, creating a negative trade balance of $51.9 million. The commodities with a positive trade balance
were dairy cattle and milk products, beef cattle and all other crops. Oil and grains were the largest import
commodities within the agriculture production sector. By identifying input-output sector commodities that
are imported, the county can target these for import substitution efforts.
The food manufacturing sector created $140.2 million more in exports than imports. The commodities with
a positive trade balance were soybean and other oilseed processing and fats and oils refining and blending,
while commodities with the largest negative trade balance were other animal food and bottled and canned
soft drinks and water.
Economic Impact Analysis of the Agriculture Sector on Pershing County Economy:
The economic impact analysis shows the impact of agriculture production and food manufacturing activities
on the total Pershing County economy. Table 1. shows the impacts of the agriculture sector industries on
the Pershing County economy.
Total Agriculture production
Output, 11%
Total Food Manufacturing Output, 31%
Total Other Industries Output,
57%

Economic Analysis of the Food & Agriculture Sector in Nevada – 2017
Nevada Department of Agriculture
page | 83
In 2015, the total economic impact of the agriculture sector on Pershing County’s economy was $289.9
million. Given the multiplier impact the total economic impact generated by Pershing County agriculture
production activities was $78.3 million. The total economic impact generated by agriculture and food
manufacturing operations was $82 million.
Table 1. Economic Impact of the Agriculture Sector Industries – 2015:
Agriculture Sectors Direct Impact Indirect Impact Induced Impact Total Impact
Agriculture Production
$68,863,732 $4,624,356 $4,816,070 $78,304,158
Agriculture/ Food Manufacturing
$197,100,571 $12,225,465 $876,128 $210,202,165
Total Agriculture Sector
$267,356,638 $16,934,880 $5,702,384 $289,993,902
Source: IMPLAN data for Nevada (2015)
When it comes to total employment impact, the agriculture sector activities supported 402 jobs in the
county. (Table 2)
Table 2. Employment Impacts of the Agriculture Sector Industries – 2015:
Agriculture Sectors Direct Impact Indirect Impact Induced Impact Total Impact
Agriculture Production
250 29 29 307
Agriculture/ Food Manufacturing
37 51 5 93
Total Agriculture Sector
288 80 34 402
Source: IMPLAN data for Nevada (2015)
The multiplier offers a useful way to interpret these ripple effects. Table 3. shows the sector multiplier.
Table 3. Industry Multipliers for the Agriculture Sector Industries, 2015:
Employment Total Output
Total Agriculture Sector
1.4 1.1
Source: IMPLAN data for Nevada (2015)
The ratio of total direct impact to impact value yields a multiplier of 1.1, meaning that every dollar
invested in Pershing County’s agriculture sector industries stimulates another $0.10 in additional
economic activity in other industries in the state. The employment multiplier was 1.4, meaning that every
10 jobs directly related to agriculture support an additional 4 jobs in the state.

Economic Analysis of the Food & Agriculture Sector in Nevada – 2017
Nevada Department of Agriculture
page | 84
STOREY COUNY:
Overview: This report provides a profile of the agriculture sector and an overview of the economic impact the
agriculture sector has on the economy of Storey County.
From the USDA Census data, Storey County had 6 farms covering 0.1% of land. Those farms were
small size farms between 1 to 49 acres.
In 2015, Storey County’s total value of agriculture sector output was $225.0 million accounting
for 16% of the total county production output.
The largest industry when it comes to production output value was support activities for agriculture
and forestry. The largest food manufacturing industry was dog and cat food manufacturing.
Total county employment was 6,204. The agriculture sector in Storey County had 310 employees
accounting for 5.0% of the total county employment.
In 2015, Storey County’s labor income of the agriculture sector was $14.1 million accounting for
4.5% of the total county’s labor income.
The agriculture sector total exports were $244.4 million, and total foreign exports to international
markets were $14.7 million. The agriculture production had $12.9 million more in imports than
exports, creating a negative trade balance. However, the food and manufacturing industries had a
positive trade balance of $137.3 million.
In 2015, given the economic inter-linkage and multiplier effect, the total economic impact to the
Nevada’s economy from all the agricultural sector activities was $244.7 million. The total
employment impacts from activity of the agricultural sector were 428 jobs and $20.1 million in
labor income.
Food and Agriculture Sector – Storey County:
Agriculture Land and Farms:
In 2012, the approximate land area of Storey County was 168,269 acres. There were 6 farms in Storey
County covering 86 acres of land, which counts for 0.1% of land in farms. Average farm size was 14 acres.
All of the farms in Storey County were small size farms between 1 to 49 acres. (Graph 1.)
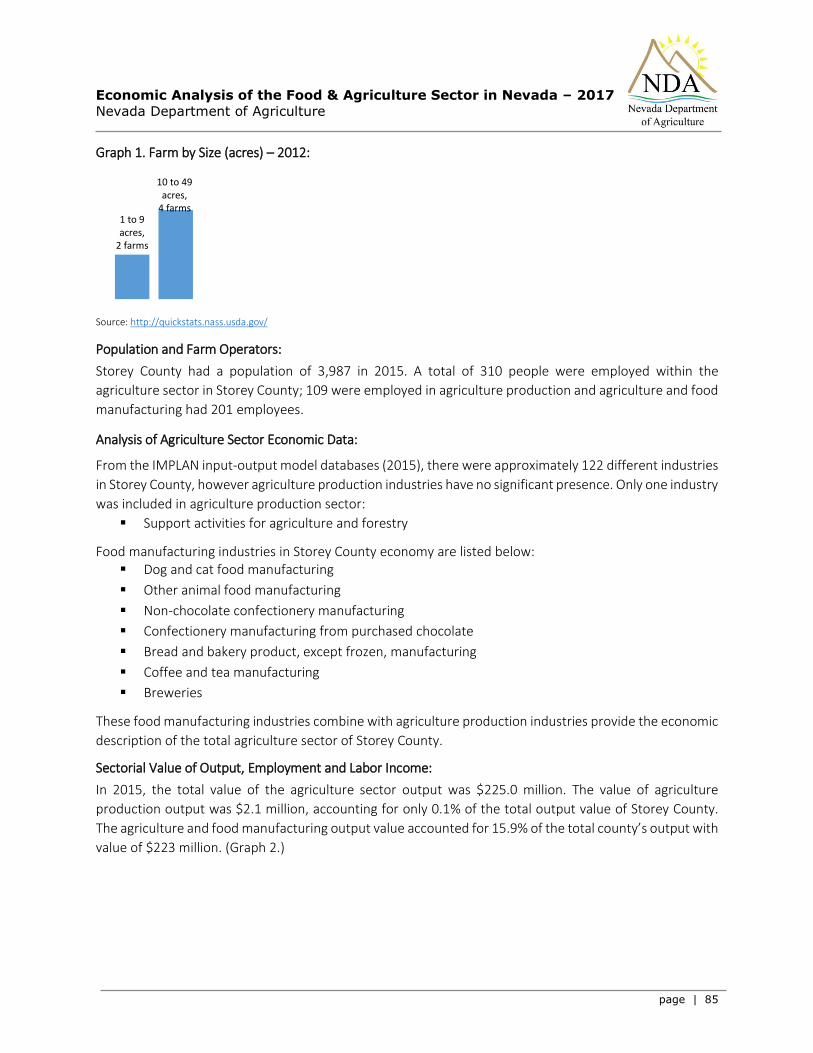
Economic Analysis of the Food & Agriculture Sector in Nevada – 2017
Nevada Department of Agriculture
page | 85
Graph 1. Farm by Size (acres) – 2012:
Source: http://quickstats.nass.usda.gov/
Population and Farm Operators:
Storey County had a population of 3,987 in 2015. A total of 310 people were employed within the
agriculture sector in Storey County; 109 were employed in agriculture production and agriculture and food
manufacturing had 201 employees.
Analysis of Agriculture Sector Economic Data:
From the IMPLAN input-output model databases (2015), there were approximately 122 different industries
in Storey County, however agriculture production industries have no significant presence. Only one industry
was included in agriculture production sector:
Support activities for agriculture and forestry
Food manufacturing industries in Storey County economy are listed below: Dog and cat food manufacturing
Other animal food manufacturing
Non-chocolate confectionery manufacturing
Confectionery manufacturing from purchased chocolate
Bread and bakery product, except frozen, manufacturing
Coffee and tea manufacturing
Breweries
These food manufacturing industries combine with agriculture production industries provide the economic
description of the total agriculture sector of Storey County.
Sectorial Value of Output, Employment and Labor Income:
In 2015, the total value of the agriculture sector output was $225.0 million. The value of agriculture
production output was $2.1 million, accounting for only 0.1% of the total output value of Storey County.
The agriculture and food manufacturing output value accounted for 15.9% of the total county’s output with
value of $223 million. (Graph 2.)
1 to 9 acres,
2 farms
10 to 49 acres,
4 farms
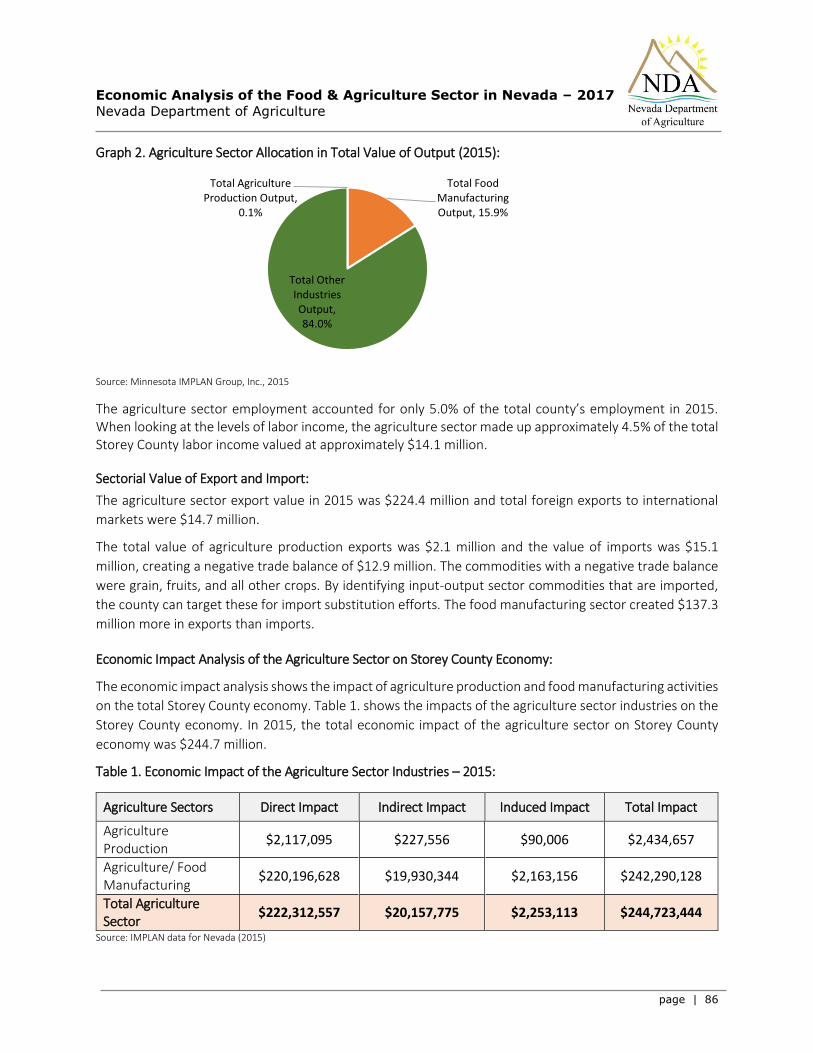
Economic Analysis of the Food & Agriculture Sector in Nevada – 2017
Nevada Department of Agriculture
page | 86
Graph 2. Agriculture Sector Allocation in Total Value of Output (2015):
Source: Minnesota IMPLAN Group, Inc., 2015
The agriculture sector employment accounted for only 5.0% of the total county’s employment in 2015. When looking at the levels of labor income, the agriculture sector made up approximately 4.5% of the total Storey County labor income valued at approximately $14.1 million.
Sectorial Value of Export and Import:
The agriculture sector export value in 2015 was $224.4 million and total foreign exports to international
markets were $14.7 million.
The total value of agriculture production exports was $2.1 million and the value of imports was $15.1
million, creating a negative trade balance of $12.9 million. The commodities with a negative trade balance
were grain, fruits, and all other crops. By identifying input-output sector commodities that are imported,
the county can target these for import substitution efforts. The food manufacturing sector created $137.3
million more in exports than imports.
Economic Impact Analysis of the Agriculture Sector on Storey County Economy:
The economic impact analysis shows the impact of agriculture production and food manufacturing activities
on the total Storey County economy. Table 1. shows the impacts of the agriculture sector industries on the
Storey County economy. In 2015, the total economic impact of the agriculture sector on Storey County
economy was $244.7 million.
Table 1. Economic Impact of the Agriculture Sector Industries – 2015:
Agriculture Sectors Direct Impact Indirect Impact Induced Impact Total Impact
Agriculture Production
$2,117,095 $227,556 $90,006 $2,434,657
Agriculture/ Food Manufacturing
$220,196,628 $19,930,344 $2,163,156 $242,290,128
Total Agriculture Sector
$222,312,557 $20,157,775 $2,253,113 $244,723,444
Source: IMPLAN data for Nevada (2015)
Total Agriculture Production Output,
0.1%
Total Food Manufacturing Output, 15.9%
Total Other Industries Output, 84.0%

Economic Analysis of the Food & Agriculture Sector in Nevada – 2017
Nevada Department of Agriculture
page | 87
When it comes to employment, the total employment impact of the agriculture sector was 427 employees.
(Table 2.)
Table 2. Employment Impacts of the Agriculture Sector Industries – 2015:
Agriculture Sectors Direct Impact Indirect Impact Induced Impact Total Impact
Agriculture Production
109 1 1 111
Agriculture/ Food Manufacturing
193 111 13 317
Total Agriculture Sector
302 112 14 427
Source: IMPLAN data for Nevada (2015)
The multiplier offers a useful way to interpret these ripple effects. Table 3. shows the sector multiplier.
Table 3. Industry Multipliers for the Agriculture Sector Industries – 2015:
Employment Total Output
Total Agriculture Sector
1.4 1.1
Source: IMPLAN data for Nevada (2015)
The ratio of total direct impact to impact value yields a multiplier of 1.1, meaning that every dollar
invested in Storey County’s agriculture sector industries stimulates another $0.10 in additional economic
activity in other industries in the state. The employment multiplier was 1.4, meaning that every 10 jobs
directly related to agriculture support an additional 4 jobs in the state.
WASHOE COUNTY:
Overview: This report provides a profile of the agriculture sector and an overview of the economic impact the
agriculture sector has on the economy of Washoe County.
From the USDA Census data, Washoe County had 479 farms covering 11.0% of land. Approximately
69% of farms were small size farms between 1 to 49 acres.
In 2015, Washoe County’s total value of agriculture sector output was $1.1 billion accounting for
3.0% of the total county production output.
The largest industries when it comes to agriculture production output value were:
Commercial fishing ($19.0 million)
Greenhouse, nursery and floriculture production ($11.4 million)
Beef cattle ranching and farming ($9.3 million)
These industries accounted for 3.5% of total Washoe County’s agriculture sector output.

Economic Analysis of the Food & Agriculture Sector in Nevada – 2017
Nevada Department of Agriculture
page | 88
The largest food manufacturing industries were:
Spice and extract manufacturing ($178.8 million)
Breakfast cereal manufacturing ($149.1 million)
Fluid milk manufacturing ($136.1 million)
These industries accounted for 41% of the total value of food manufacturing output.
The total county employment was 263,129. The agriculture sector in Washoe County had 2,738
employees accounting for 1.0% of the total county employment.
In 2015, Washoe County’s labor income of the agriculture sector was $120.6 million accounting for
less than 1% of the total county’s labor income.
The agriculture sector total exports were $1.1 billion, and total foreign exports to international
markets were $62.6 million. Agriculture production had $235.1 million more in imports than
exports. The agricultural production industries in Washoe County had a negative balance of trade.
The food and manufacturing industries had a negative trade balance of $373.8 million. Negative
trade balance shows that most of Washoe County food manufacturing commodities were
purchased from outside of the county.
In 2015, given the economic inter-linkage and multiplier effect, the total economic impact to the
Nevada’s economy from all the agricultural sector activities was $1.7 billion. The total employment
impacts from activity of the agricultural sectors was 5,938 jobs and $292.8 million in labor income.
Food and Agriculture Sector – Washoe County:
Agriculture Land and Farms:
In 2012, the approximate land area of Washoe County was 4,033,516 acres. There were 479 farms in
Washoe County covering 442,697 acres of land, which counts for 11.0% of land in farms. Average farm
size was 924 acres. Approximately 69% or 332 farms were small size farms between 1 to 50 acres, 24% or
113 were mid-size farms (50 to 179 acres) and 7% or 34 farms were large size farms with 500 to 1,000 or
more acres. (Graph 1.)
Graph 1. Farm by Size (acres) – 2012:
Source: http://quickstats.nass.usda.gov/
1 to 9 acres, 171 farms
10 to 49 acres,
161 farms 50 to 179 acres,
96 farms
180 to 499 acres,
17 farms
500 to 999 acres,
16 farms
1,000 acres and more, 18 farms

Economic Analysis of the Food & Agriculture Sector in Nevada – 2017
Nevada Department of Agriculture
page | 89
Population and Farm Operators:
Washoe County had a population of 446,903 in 2015. A total of 2,738 people were employed within the
agriculture sector in Washoe County; 719 were employed in agriculture production and agriculture and
food manufacturing had 2,019 employees.
Analysis of Agriculture Sector Economic Data:
From the IMPLAN input-output model databases (2015), there were approximately 333 different industries
in Washoe County and 11 were agriculture production industries:
Vegetable and melon farming
Fruit farming
Tree nut farming
Greenhouse, nursery and floriculture production
All other crop farming
Beef cattle ranching and farming, including feedlots and dual-purpose ranching and farming
Poultry and egg production
Animal production, except cattle and poultry and eggs
Commercial logging
Commercial fishing
Support activities for agriculture and forestry
Food manufacturing industries in Washoe County are listed below:
Other animal food manufacturing
Breakfast cereal manufacturing
Non-chocolate confectionery manufacturing
Confectionery manufacturing from purchased chocolate
Frozen specialties manufacturing
Canned specialties
Fluid milk manufacturing
Cheese manufacturing
Meat processed from carcasses
Rendering and meat byproduct processing
Seafood product preparation and packaging
Bread and bakery product, except frozen, manufacturing
Frozen cakes and other pastries manufacturing
Dry pasta, mixes and dough manufacturing
Tortilla manufacturing
Coffee and tea manufacturing
Flavoring syrup and concentrate manufacturing
Mayonnaise, dressing and sauce manufacturing
Spice and extract manufacturing
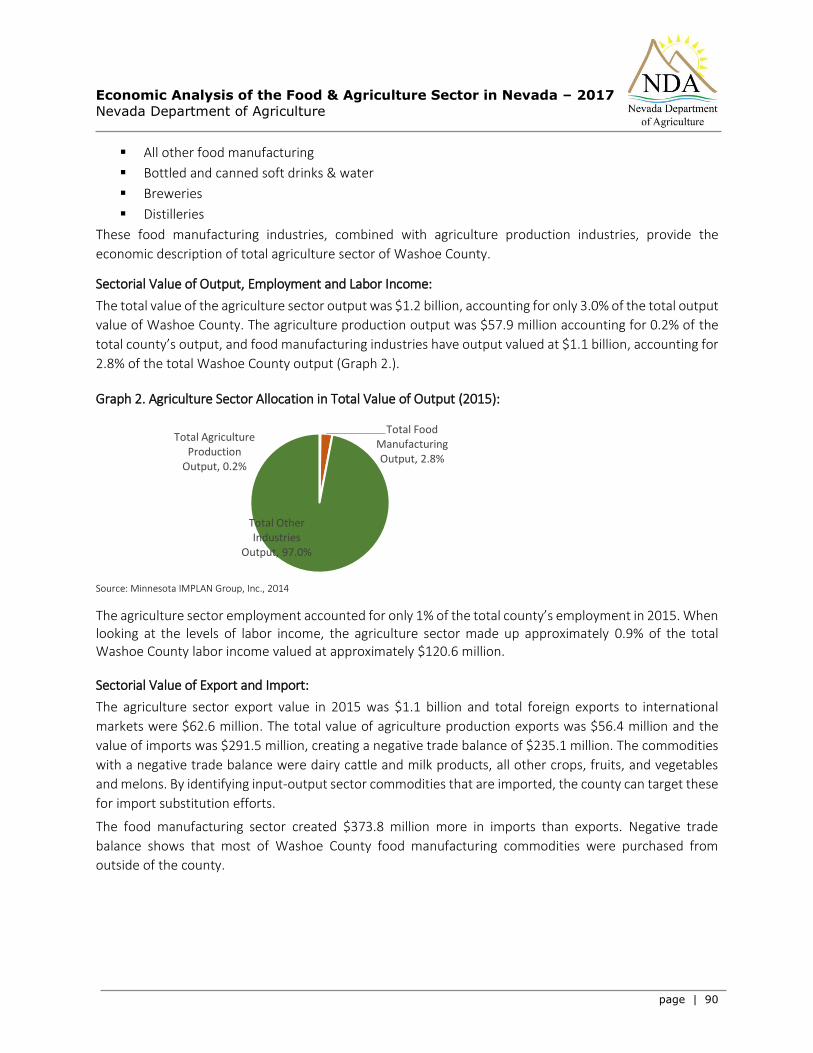
Economic Analysis of the Food & Agriculture Sector in Nevada – 2017
Nevada Department of Agriculture
page | 90
All other food manufacturing
Bottled and canned soft drinks & water
Breweries
Distilleries
These food manufacturing industries, combined with agriculture production industries, provide the
economic description of total agriculture sector of Washoe County.
Sectorial Value of Output, Employment and Labor Income:
The total value of the agriculture sector output was $1.2 billion, accounting for only 3.0% of the total output
value of Washoe County. The agriculture production output was $57.9 million accounting for 0.2% of the
total county’s output, and food manufacturing industries have output valued at $1.1 billion, accounting for
2.8% of the total Washoe County output (Graph 2.).
Graph 2. Agriculture Sector Allocation in Total Value of Output (2015):
Source: Minnesota IMPLAN Group, Inc., 2014
The agriculture sector employment accounted for only 1% of the total county’s employment in 2015. When looking at the levels of labor income, the agriculture sector made up approximately 0.9% of the total Washoe County labor income valued at approximately $120.6 million.
Sectorial Value of Export and Import:
The agriculture sector export value in 2015 was $1.1 billion and total foreign exports to international
markets were $62.6 million. The total value of agriculture production exports was $56.4 million and the
value of imports was $291.5 million, creating a negative trade balance of $235.1 million. The commodities
with a negative trade balance were dairy cattle and milk products, all other crops, fruits, and vegetables
and melons. By identifying input-output sector commodities that are imported, the county can target these
for import substitution efforts.
The food manufacturing sector created $373.8 million more in imports than exports. Negative trade
balance shows that most of Washoe County food manufacturing commodities were purchased from
outside of the county.
Total Agriculture Production
Output, 0.2%
Total Food Manufacturing Output, 2.8%
Total Other Industries
Output, 97.0%
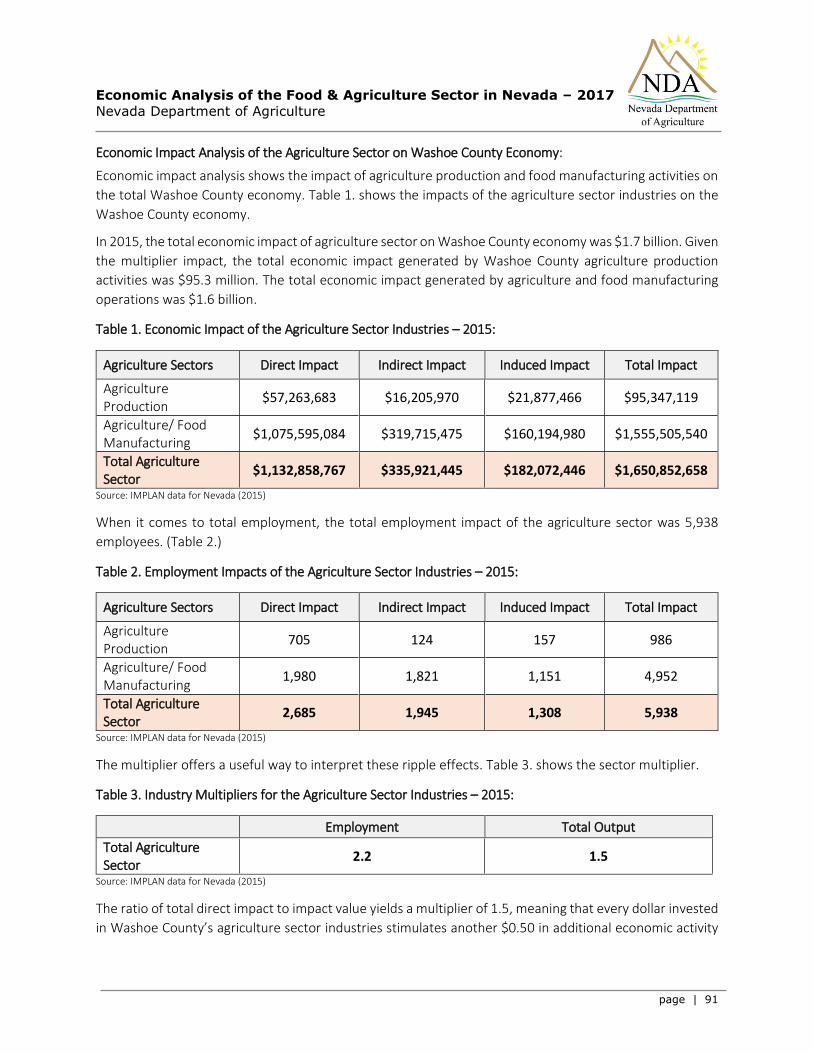
Economic Analysis of the Food & Agriculture Sector in Nevada – 2017
Nevada Department of Agriculture
page | 91
Economic Impact Analysis of the Agriculture Sector on Washoe County Economy:
Economic impact analysis shows the impact of agriculture production and food manufacturing activities on
the total Washoe County economy. Table 1. shows the impacts of the agriculture sector industries on the
Washoe County economy.
In 2015, the total economic impact of agriculture sector on Washoe County economy was $1.7 billion. Given
the multiplier impact, the total economic impact generated by Washoe County agriculture production
activities was $95.3 million. The total economic impact generated by agriculture and food manufacturing
operations was $1.6 billion.
Table 1. Economic Impact of the Agriculture Sector Industries – 2015:
Agriculture Sectors Direct Impact Indirect Impact Induced Impact Total Impact
Agriculture Production
$57,263,683 $16,205,970 $21,877,466 $95,347,119
Agriculture/ Food Manufacturing
$1,075,595,084 $319,715,475 $160,194,980 $1,555,505,540
Total Agriculture Sector
$1,132,858,767 $335,921,445 $182,072,446 $1,650,852,658
Source: IMPLAN data for Nevada (2015)
When it comes to total employment, the total employment impact of the agriculture sector was 5,938
employees. (Table 2.)
Table 2. Employment Impacts of the Agriculture Sector Industries – 2015:
Agriculture Sectors Direct Impact Indirect Impact Induced Impact Total Impact
Agriculture Production
705 124 157 986
Agriculture/ Food Manufacturing
1,980 1,821 1,151 4,952
Total Agriculture Sector
2,685 1,945 1,308 5,938
Source: IMPLAN data for Nevada (2015)
The multiplier offers a useful way to interpret these ripple effects. Table 3. shows the sector multiplier.
Table 3. Industry Multipliers for the Agriculture Sector Industries – 2015:
Employment Total Output
Total Agriculture Sector
2.2 1.5
Source: IMPLAN data for Nevada (2015)
The ratio of total direct impact to impact value yields a multiplier of 1.5, meaning that every dollar invested
in Washoe County’s agriculture sector industries stimulates another $0.50 in additional economic activity
Economic Analysis of the Food & Agriculture Sector in Nevada – 2017
Nevada Department of Agriculture
page | 92
in other industries in the state. The employment multiplier was 2.2, meaning that every 10 jobs directly
related to agriculture support an additional 12 jobs in the state.
WHITE PINE COUNTY:
Overview: This report provides a profile of the agriculture sector and an overview of the economic impact the agriculture sector has on the economy of White Pine County.
From the USDA Census data, White Pine County had 160 farms covering 3.4% of land. Farms were
distributed evenly between small size (1 to 49 acres), mid-size (50 to 499 acres) and large size farms
(500 to 1,000 or more).
In 2015, White Pine County’s total value of agriculture sector output was $32.7 million accounting
for 2.8% of the total county production output.
The largest industries when it comes to agriculture production output value were:
Cattle ranching and farming ($18.9 million).
All other crop farming including hay ($7.2 million)
Animal production, except cattle and poultry and eggs ($2.4 million)
These industries accounted for 87% of White Pine County’s total agriculture sector output.
There is no significant food manufacturing presence in White Pine County.
Total county employment was 5,558. The agriculture sector in White Pine County had 269
employees accounting for 4.8% of the total county employment.
In 2015, White Pine County labor income of the agriculture sector was $2.8 million accounting for
0.9% of the total county’s labor income.
The agriculture sector total exports were $25.5 million, and total foreign exports to international
markets were $1.1 million. The agriculture production had $19.5 million more in exports than
imports. The agricultural production industries in White Pine County had a positive balance of
trade. This shows the importance of agriculture production to White Pine County economy.
However, the food and manufacturing industries had a negative trade balance of $29.5 million.
Negative trade balance shows that most of White Pine County food manufacturing commodities
were purchased from outside of the county.
In 2015, given the economic inter-linkage and multiplier effect, the total economic impact to the
Nevada’s economy from all the agricultural sector activities was $47.3 million. The total
employment impacts from activity of the agricultural sectors were 392 jobs and $4.5 million in
labor income.
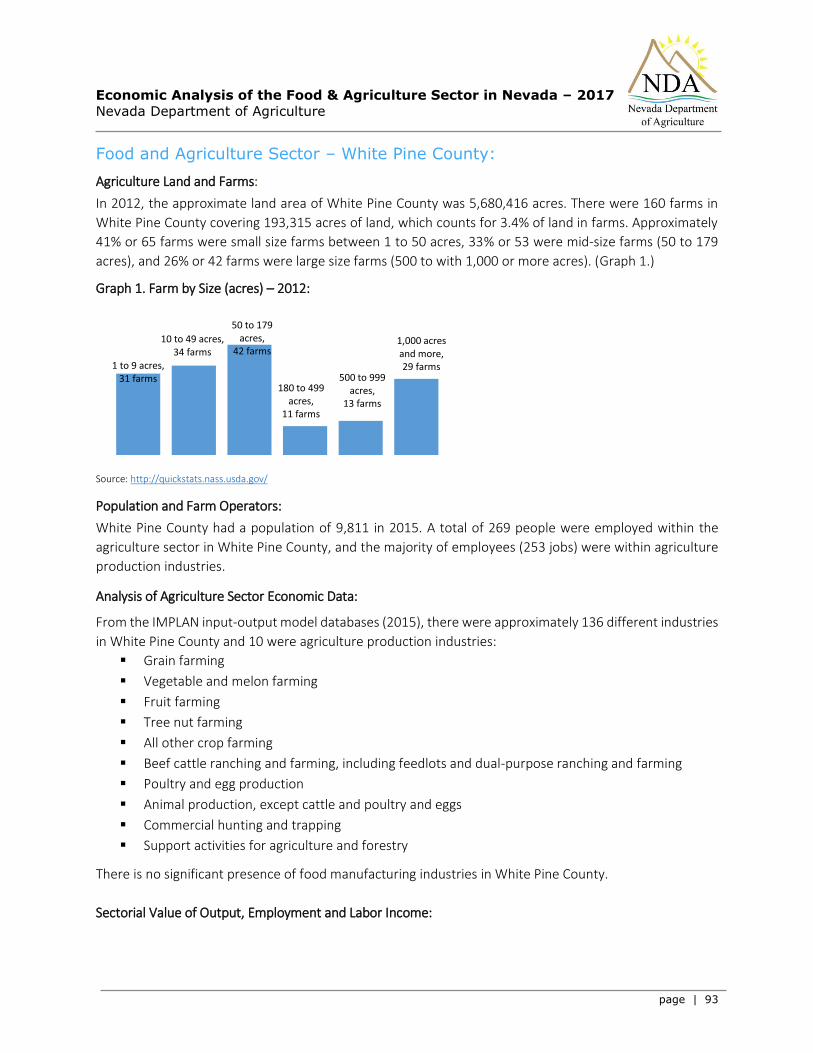
Economic Analysis of the Food & Agriculture Sector in Nevada – 2017
Nevada Department of Agriculture
page | 93
Food and Agriculture Sector – White Pine County:
Agriculture Land and Farms:
In 2012, the approximate land area of White Pine County was 5,680,416 acres. There were 160 farms in
White Pine County covering 193,315 acres of land, which counts for 3.4% of land in farms. Approximately
41% or 65 farms were small size farms between 1 to 50 acres, 33% or 53 were mid-size farms (50 to 179
acres), and 26% or 42 farms were large size farms (500 to with 1,000 or more acres). (Graph 1.)
Graph 1. Farm by Size (acres) – 2012:
Source: http://quickstats.nass.usda.gov/
Population and Farm Operators:
White Pine County had a population of 9,811 in 2015. A total of 269 people were employed within the
agriculture sector in White Pine County, and the majority of employees (253 jobs) were within agriculture
production industries.
Analysis of Agriculture Sector Economic Data:
From the IMPLAN input-output model databases (2015), there were approximately 136 different industries
in White Pine County and 10 were agriculture production industries:
Grain farming
Vegetable and melon farming
Fruit farming
Tree nut farming
All other crop farming
Beef cattle ranching and farming, including feedlots and dual-purpose ranching and farming
Poultry and egg production
Animal production, except cattle and poultry and eggs
Commercial hunting and trapping
Support activities for agriculture and forestry
There is no significant presence of food manufacturing industries in White Pine County.
Sectorial Value of Output, Employment and Labor Income:
1 to 9 acres, 31 farms
10 to 49 acres, 34 farms
50 to 179 acres,
42 farms
180 to 499 acres,
11 farms
500 to 999 acres,
13 farms
1,000 acres and more, 29 farms
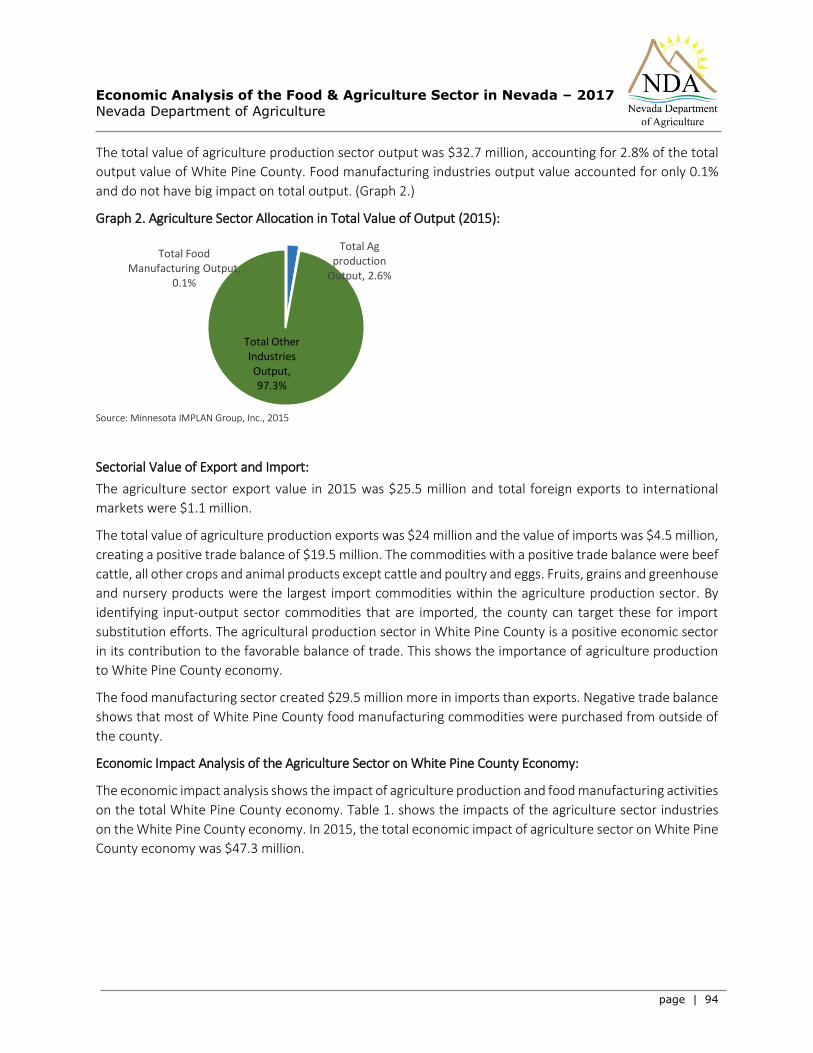
Economic Analysis of the Food & Agriculture Sector in Nevada – 2017
Nevada Department of Agriculture
page | 94
The total value of agriculture production sector output was $32.7 million, accounting for 2.8% of the total
output value of White Pine County. Food manufacturing industries output value accounted for only 0.1%
and do not have big impact on total output. (Graph 2.)
Graph 2. Agriculture Sector Allocation in Total Value of Output (2015):
Source: Minnesota IMPLAN Group, Inc., 2015
Sectorial Value of Export and Import:
The agriculture sector export value in 2015 was $25.5 million and total foreign exports to international
markets were $1.1 million.
The total value of agriculture production exports was $24 million and the value of imports was $4.5 million,
creating a positive trade balance of $19.5 million. The commodities with a positive trade balance were beef
cattle, all other crops and animal products except cattle and poultry and eggs. Fruits, grains and greenhouse
and nursery products were the largest import commodities within the agriculture production sector. By
identifying input-output sector commodities that are imported, the county can target these for import
substitution efforts. The agricultural production sector in White Pine County is a positive economic sector
in its contribution to the favorable balance of trade. This shows the importance of agriculture production
to White Pine County economy.
The food manufacturing sector created $29.5 million more in imports than exports. Negative trade balance
shows that most of White Pine County food manufacturing commodities were purchased from outside of
the county.
Economic Impact Analysis of the Agriculture Sector on White Pine County Economy:
The economic impact analysis shows the impact of agriculture production and food manufacturing activities
on the total White Pine County economy. Table 1. shows the impacts of the agriculture sector industries
on the White Pine County economy. In 2015, the total economic impact of agriculture sector on White Pine
County economy was $47.3 million.
Total Ag production
Output, 2.6%
Total Food Manufacturing Output,
0.1%
Total Other Industries Output, 97.3%
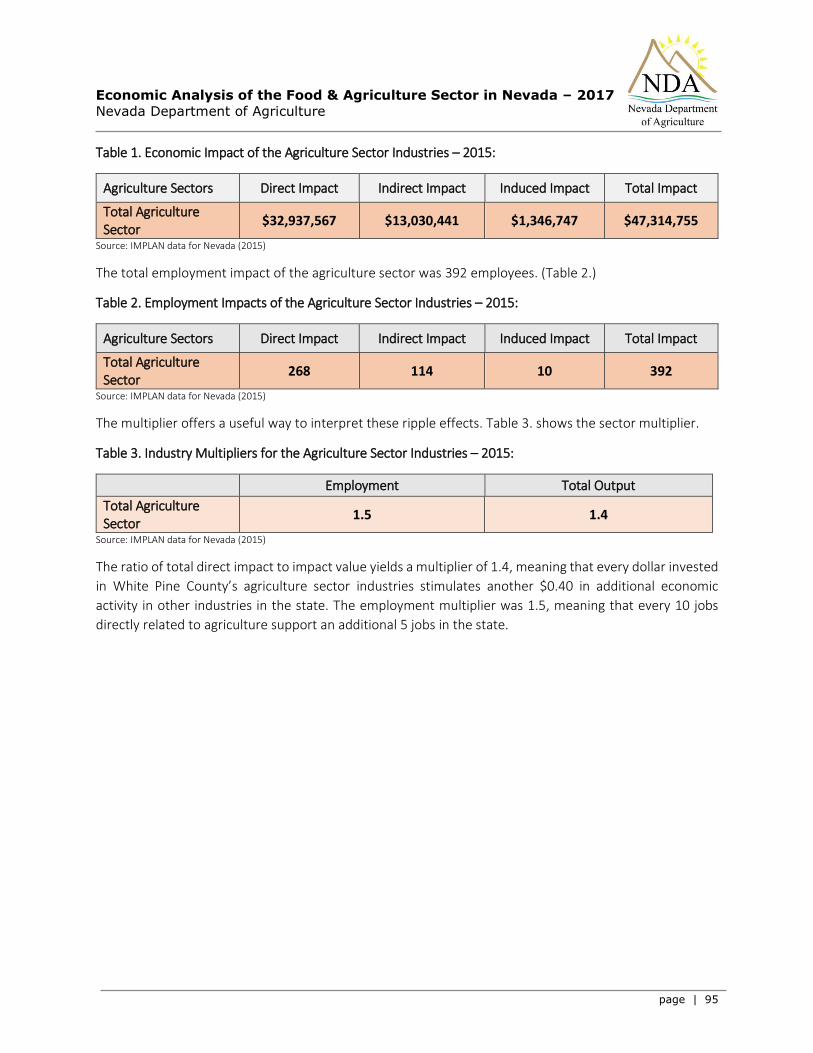
Economic Analysis of the Food & Agriculture Sector in Nevada – 2017
Nevada Department of Agriculture
page | 95
Table 1. Economic Impact of the Agriculture Sector Industries – 2015:
Agriculture Sectors Direct Impact Indirect Impact Induced Impact Total Impact
Total Agriculture Sector
$32,937,567 $13,030,441 $1,346,747 $47,314,755
Source: IMPLAN data for Nevada (2015)
The total employment impact of the agriculture sector was 392 employees. (Table 2.)
Table 2. Employment Impacts of the Agriculture Sector Industries – 2015:
Agriculture Sectors Direct Impact Indirect Impact Induced Impact Total Impact
Total Agriculture Sector
268 114 10 392
Source: IMPLAN data for Nevada (2015)
The multiplier offers a useful way to interpret these ripple effects. Table 3. shows the sector multiplier.
Table 3. Industry Multipliers for the Agriculture Sector Industries – 2015:
Employment Total Output
Total Agriculture Sector
1.5 1.4
Source: IMPLAN data for Nevada (2015)
The ratio of total direct impact to impact value yields a multiplier of 1.4, meaning that every dollar invested
in White Pine County’s agriculture sector industries stimulates another $0.40 in additional economic
activity in other industries in the state. The employment multiplier was 1.5, meaning that every 10 jobs
directly related to agriculture support an additional 5 jobs in the state.

Economic Analysis of the Food & Agriculture Sector in Nevada – 2017
Nevada Department of Agriculture
page | 96
Appendix 1 – Data Source:
This appendix lists the data sources that we consulted as part of industry and economic impact analysis in
our report.
Research Studies and Papers
Animal Agriculture Economic Analysis: Nevada 2002 – 2012; A Report for United Soybean Board,
July 2013
Analysis of the Impact of the Agriculture Cluster on the State of Nevada – Prepared for NNDA,
August 2012 Estimated Economic Impact of the Cattle Ranching and Farming Sector of the Elko
County Economy – University of Nevada Reno Technical Report, UCED 2005
Nevada Agriculture Statistical Bulletin – 2012 – 2013, USDA
2012 Census of Agriculture, Nevada
Websites
http://www.bea.gov/itable/index.cfm
http://www.census.gov/manufacturing/exports/
http://www.ctre.iastate.edu/marketsize/about.html#limitations
https://data.ers.usda.gov/reports.aspx?ID=10633
http://nercrd.psu.edu/publications/rdppapers/rdp26.pdf
http://www.statsamerica.org/innovation/reports/aggregated_cluster_definitions.pdf
http://www.nortec.org/mc/NoRTEC%20Natural%20Res%20Cluster%20060612%20FINAL.pdf
http://www.coeccc.net/environmental_scans/ag_scan_cv_11.pdf
Databases
Nevada Department of Agriculture - Certified Producers
Quarterly Census of Employment and Wages (QCEW)
Nevada Workforce Informer - Nevada Employer Directory
Nevada workforce Informer - Find a Business in Nevada
USDA – NASS Stats
WISERTrade: State HS Database
IMPLAN Pro data set 2015

Economic Analysis of the Food & Agriculture Sector in Nevada – 2017
Nevada Department of Agriculture
page | 97
Appendix 2 - Definitions: Commercial fishing - NAICS code 11411
This industry comprises establishments primarily engaged in the commercial catching or taking of finfish,
shellfish, or miscellaneous marine products from a natural habitat.
114111 Finfish Fishing 114112 Shellfish Fishing 114119 Other Marine Fishing Forestry, forest products & timber – NAICS code 113210 Forest Nurseries and Gathering of Forest Products:
This industry comprises establishments primarily engaged in (1) growing trees for reforestation and/or (2) gathering forest products, such as gums, barks, balsam needles, rhizomes, fibers, Spanish moss, ginseng, and truffles. Example: Forest nurseries for reforestation, growing trees Gathering of forest products (e.g., barks, gums, needles, seeds) Gathering, extracting, and selling tree seeds Agriculture and forestry support activities – NAICS 115 Support Activities for Agriculture and Forestry:
Industries in the Support Activities for Agriculture and Forestry subsector provide support services that are an essential part of agricultural and forestry production. These support activities may be performed by the agriculture or forestry producing establishment or conducted independently as an alternative source of inputs required for the production process for a given crop, animal, or forestry industry.
Example: 115112 Soil Preparation, Planting, and Cultivating 115113 Crop Harvesting, Primarily by Machine 115114 Postharvest Crop Activities (except Cotton Ginning) 115115 Farm Labor Contractors and Crew Leaders 115116 Farm Management Services Other food manufacturing – NAICS 3119 Other Food Manufacturing:
This industry group comprises establishments primarily engaged in manufacturing food (except animal food; grain and oilseed milling; sugar and confectionery products; preserved fruits, vegetables, and specialty foods; dairy products; meat products; seafood products; and bakery products and tortillas). This industry group includes industries with different production processes, such as snack food manufacturing; coffee and tea manufacturing; concentrate, syrup, condiment, and spice manufacturing; and, in general, an entire range of other miscellaneous food product manufacturing.

Economic Analysis of the Food & Agriculture Sector in Nevada – 2017
Nevada Department of Agriculture
page | 98
Animal products, except poultry slaughtering – NAICS 311611 Animal (except Poultry) Slaughtering:
This U.S. industry comprises establishments primarily engaged in slaughtering animals (except poultry and small game). Establishments that slaughter and prepare meats are included in this industry. Example: Hides and skins produced in slaughtering plants, Bacon, slab and sliced, produced in slaughtering plants, Fats, animal (except poultry, small game), produced in slaughtering plants, Sausage casings, natural, produced in slaughtering plant, etc.