an economic analysis of salinity problems in - welcome to eepsea
TRANSCRIPT
Research Reports
An Economic Analysis of Salinity Problems in theMahaweli River System H Irrigation Scheme in Sri Lankaby Selliah Thiruchelvam and S. Pathmarajah
1.0 INTRODUCTION
1.1 Rationale and Background
The world is entering a period of intense competition for limited supplies of water for alternative uses in agriculture, urban development and industries. Despite the overall shortage of water, there are no incentives for efficient water use in developing countries (FAO 1992). Agriculture uses the largest share (75%) of water. The existing zero pricing of irrigation water, central planning, poor design, mismanagement and lack of responsibilities of the farmers have led to sub-optimal, unsustainable patterns of water use and environmental degradation (UN 1997).
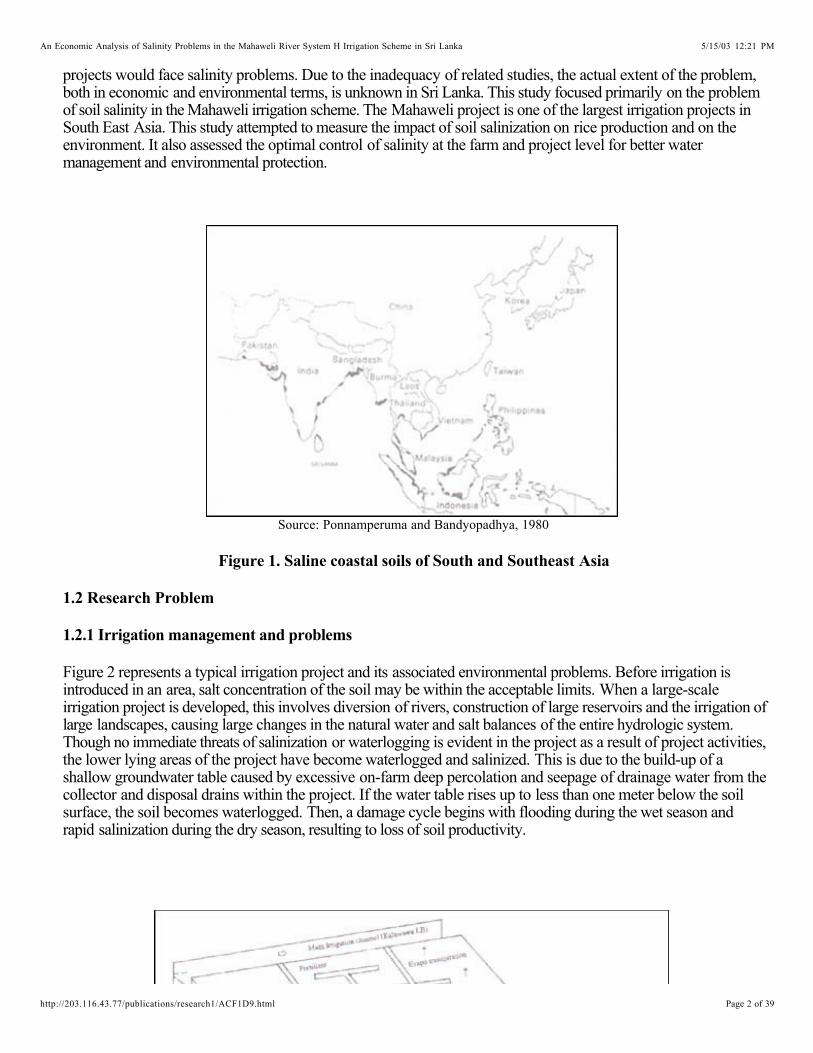
Irrigation-induced salinity was reckoned as a pervasive threat to agricultural production and the environment in view of its adverse effects on sustainable use of land and water resources. Excessive irrigation and inadequate drainage are the principal causes of salinity. They contribute to waterlogging and waste the water itself. Approximately 40% of the world’s irrigated area is affected by salinization (Pearce et al. 1994). Some of the most serious of these problems occur in semi-arid regions associated with the great river systems of Asia. However, not all salinity problems are confined to the semi-arid regions of the world. Ponnamperuma and Bandyopadhya (1980) reported that some 20% of the potentially exploitable saline soils of the world are in the humid regions of South and Southeast Asia and about half of these (30 million ha) are coastal saline soils (Figure 1). Most of these soils, along with the others in similar latitude throughout the humid tropics, are supporting mangrove vegetation. They represent a large potential land resource for growing rice.
Salinity problems are primarily associated with coastal areas and irrigated lands in the dry zone of Sri Lanka, where the total irrigated area is about 0.5 million hectares. Since irrigation has been practiced in these areas from ancient times, salinity might have been a problem at least in patches of irrigated lands. With the development ofmodern irrigation networks, it is anticipated that salinity would become a problem over the years as in many other countries.
Only a few systematic studies exist on the soil salinization problem in Sri Lanka, and there are no records of the actual extent of lands affected by salinity, or data that indicate its trend. Most of the available information comes from sporadic surveys. Recently, however, concerns were expressed that most of the large-scale
5/15/03 12:21 PMAn Economic Analysis of Salinity Problems in the Mahaweli River System H Irrigation Scheme in Sri Lanka
Page 1 of 39http://203.116.43.77/publications/research1/ACF1D9.html
projects would face salinity problems. Due to the inadequacy of related studies, the actual extent of the problem, both in economic and environmental terms, is unknown in Sri Lanka. This study focused primarily on the problem of soil salinity in the Mahaweli irrigation scheme. The Mahaweli project is one of the largest irrigation projects in South East Asia. This study attempted to measure the impact of soil salinization on rice production and on the environment. It also assessed the optimal control of salinity at the farm and project level for better water management and environmental protection.
Source: Ponnamperuma and Bandyopadhya, 1980
Figure 1. Saline coastal soils of South and Southeast Asia
1.2 Research Problem
1.2.1 Irrigation management and problems
Figure 2 represents a typical irrigation project and its associated environmental problems. Before irrigation is introduced in an area, salt concentration of the soil may be within the acceptable limits. When a large-scale irrigation project is developed, this involves diversion of rivers, construction of large reservoirs and the irrigation of large landscapes, causing large changes in the natural water and salt balances of the entire hydrologic system. Though no immediate threats of salinization or waterlogging is evident in the project as a result of project activities,the lower lying areas of the project have become waterlogged and salinized. This is due to the build-up of a shallow groundwater table caused by excessive on-farm deep percolation and seepage of drainage water from the collector and disposal drains within the project. If the water table rises up to less than one meter below the soil surface, the soil becomes waterlogged. Then, a damage cycle begins with flooding during the wet season and rapid salinization during the dry season, resulting to loss of soil productivity.
5/15/03 12:21 PMAn Economic Analysis of Salinity Problems in the Mahaweli River System H Irrigation Scheme in Sri Lanka
Page 2 of 39http://203.116.43.77/publications/research1/ACF1D9.html
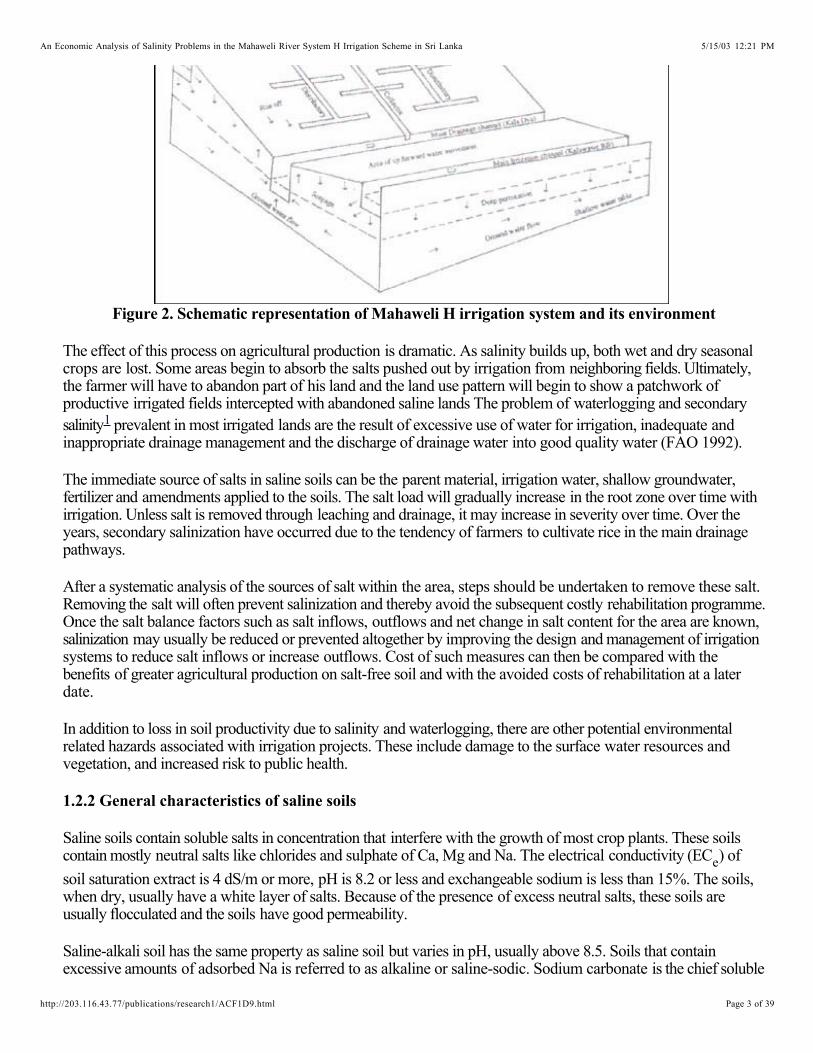
Figure 2. Schematic representation of Mahaweli H irrigation system and its environment
The effect of this process on agricultural production is dramatic. As salinity builds up, both wet and dry seasonal crops are lost. Some areas begin to absorb the salts pushed out by irrigation from neighboring fields. Ultimately, the farmer will have to abandon part of his land and the land use pattern will begin to show a patchwork of productive irrigated fields intercepted with abandoned saline lands The problem of waterlogging and secondary salinity prevalent in most irrigated lands are the result of excessive use of water for irrigation, inadequate and inappropriate drainage management and the discharge of drainage water into good quality water (FAO 1992).
1
The immediate source of salts in saline soils can be the parent material, irrigation water, shallow groundwater, fertilizer and amendments applied to the soils. The salt load will gradually increase in the root zone over time with irrigation. Unless salt is removed through leaching and drainage, it may increase in severity over time. Over theyears, secondary salinization have occurred due to the tendency of farmers to cultivate rice in the main drainage pathways.
After a systematic analysis of the sources of salt within the area, steps should be undertaken to remove these salt. Removing the salt will often prevent salinization and thereby avoid the subsequent costly rehabilitation programme. Once the salt balance factors such as salt inflows, outflows and net change in salt content for the area are known, salinization may usually be reduced or prevented altogether by improving the design and management of irrigation systems to reduce salt inflows or increase outflows. Cost of such measures can then be compared with the benefits of greater agricultural production on salt-free soil and with the avoided costs of rehabilitation at a later date.
In addition to loss in soil productivity due to salinity and waterlogging, there are other potential environmental related hazards associated with irrigation projects. These include damage to the surface water resources and vegetation, and increased risk to public health.
1.2.2 General characteristics of saline soils
Saline soils contain soluble salts in concentration that interfere with the growth of most crop plants. These soils contain mostly neutral salts like chlorides and sulphate of Ca, Mg and Na. The electrical conductivity (EC ) of
soil saturation extract is 4 dS/m or more, pH is 8.2 or less and exchangeable sodium is less than 15%. The soils,when dry, usually have a white layer of salts. Because of the presence of excess neutral salts, these soils are usually flocculated and the soils have good permeability.
e
Saline-alkali soil has the same property as saline soil but varies in pH, usually above 8.5. Soils that contain excessive amounts of adsorbed Na is referred to as alkaline or saline-sodic. Sodium carbonate is the chief soluble
5/15/03 12:21 PMAn Economic Analysis of Salinity Problems in the Mahaweli River System H Irrigation Scheme in Sri Lanka
Page 3 of 39http://203.116.43.77/publications/research1/ACF1D9.html

salt. These soils have a high pH up to 10.5 and affect the transmission and availability of several nutrients. It is important to distinguish between these two categories because efforts to control these processes and to reclaim the deteriorated lands are likely to require specific approaches. The following scale provides a general guide to classify saline soils based on the threshold level up to which plant growth may not be severely affected.
Salinity in Saturated Soil Extract Based on Scale of ECe
Relative Salt Level EC dS/m Plant Condition
Low 0 - 2.5 Salinity Effects Mostly Negligible
Medium 2.5 - 5.0 Very Sensitive Plants Affected
High 5.0 - 7.5 Many Plants Affected
Excessive Above 7.5 Only Salt Tolerant Plants Grow
Source: USDA Information Bulletin, 194 1994
Because crop plants differ quite markedly in their level of salt tolerance, the effect of salinity on yield is a function of the threshold salinity above which yield declines, and the percentage of yield decrease per unit of salinity increases above the threshold. Figure 3 shows the salt tolerance for different crop species. The presence of salt could exert an adverse effect on plant growth. Salts make the nutrients less available because of osmotic pressure. Excess salt becomes toxic to plants. The long-term presence of excess salts can damage the soil irreversibly.
Source: Reeve and Fireman 1967
Figure 3. Salt tolerance curves for a range of crop plants
5/15/03 12:21 PMAn Economic Analysis of Salinity Problems in the Mahaweli River System H Irrigation Scheme in Sri Lanka
Page 4 of 39http://203.116.43.77/publications/research1/ACF1D9.html

1.2.3 Effect of salinity on the rice plant
Rice is generally considered to be a salt-tolerant crop. Maas and Hoffman (1977) showed that rice threshold EC is 3 dS/m and a 1dS/m increase in salinity reduces yield by 12%. Moorman and Breeman (1978) reported that EC value of 6-10 dS/m is associated with a 50% decrease in yield. Pearsons and Ayres (1960) found that salt tolerance of rice varied with its growth stages. The plant is tolerant during germination, but young seedlings are sensitive until the age of four weeks. An increase in salt tolerance occurs up to tillering, but the plant again becomes sensitive during flowering. Sensitivity again diminishes during the maturation period.
IRRI in 1978 reported that during the reproductive stage, salts adversely affected the number of spikelets per panicle. Further, yield reduction under salinity was due to adverse effects on panicle formation and grain setting, which can reduce the yield of even the more tolerant crops.
1.3 The Salinity Problems in the Mahaweli H Area
Land degradation due to salinity and waterlogging is primarily associated with coastal areas and irrigated lands in the dry zone of Sri Lanka, which covers half a million hectares (TAMS/USAID 1980). The dry zone of Sri Lanka is the most important area as far as irrigation is considered. In Sri Lanka the dry zone occupies nearly two thirds of the land where people depend mainly on arable farming for food and income (Figure 4).
In Sri Lanka, although irrigation projects have contributed substantially in improving agricultural production, most of the large-scale projects today face salinity problems. The literature available on the salinity effect on production and environment and its trends in Sri Lanka is scarce; papers which examine the environmental impacts are even fewer. Relevant international researches have addressed the salinity problem, in isolation to production and environment.
Figure 4. Location of Mahaweli System H Irrigatiton System Sri Lanka
5/15/03 12:21 PMAn Economic Analysis of Salinity Problems in the Mahaweli River System H Irrigation Scheme in Sri Lanka
Page 5 of 39http://203.116.43.77/publications/research1/ACF1D9.html

Few studies on salinity in the Mahaweli area are available. According to the Mahaweli Feasibility Report in 1978, the preliminary soil survey in the Mahaweli H area prior to its diversion indicates low or medium salinity of soil and water in the region. Only certain locations have shown high salinity levels (Wijesekera 1981).
A study by Handawala (1983) showed that the major irrigation schemes eliminated the forest cover in the well drained land. Further, supplying additional water to the whole landscape over many years has interrupted the established equilibrium for both salt and water in the region. It was shown that much of the field salinity observed in the newly opened lands in the Mahaweli H area can be attributed to the emergence from underground reserves. Handawala (1983) also showed that after development, the drainage capacity of the natural stream canals was badly reduced, and that there were cases when farmers blocked drainage canals in trying to obtain more water for their fields. Because of these drainage blockages, the released salt stay in circulation for longer than necessary without being flushed out, thus causing salinity hazards.
Sikurajapathy et al. (1983) estimated that about 4.96% of the paddy fields were affected due to salinity in the H area. Researchers indicated that more lands are likely to become salt-affected if improved drainage facilities are not provided in the future. Dhruwasangary in 1983 assessed the effects of drainage on salinity level and the cost involved in the Mahaweli H area. He showed that subsurface drainage will improve crop yield significantly. Gangodawila (1988) in his study indicated the gradual emergence of salinity problems in the Mahaweli H system. However, it is difficult to predict the significance of long-term salinity from his data. Much database would be needed to establish a statistically sound relationship between soil salinity and crop yield and to assess the effect of salinity on agricultural production and farmers’ income. Due to the negligence of drainage practices in the irrigation schemes, the potentially saline area may be much higher.
Practicing sharing of lands during the dry period (Bethma ) in the Mahaweli region also leads to enormous inefficiency of water use which causes salinity problem in the depressed areas (Sumanaratne and Abegunarwardena 1994). Although careful irrigation design and water management practices can prevent these conditions in some areas, land lost due to waterlogging and salinity is increasing (Amarasekera 1992). Due to the inadequacy of studies, the actual extent of the salinization problem and its effects on production and environment in Sri Lanka is unknown.
2
According to Amerasekera (1992) approximately 13% of the irrigated areas in Sri Lanka is affected by salinity. The drainage problem in systems B and C, in particular, was more severe compared to system H (Gunarwardena 1990). It was presumed that the salinity problem would decrease as irrigation progresses. However, isolated patches of saline soils are still reported to be fluctuating in the Mahaweli H system. A survey done by Kendragama and Joseph (1989) on the water quality of the tanks fed by the Mahaweli scheme in the H area showed that the EC of the water tank tends to increase during the dry weather (November to March). Another observation was that the EC of the water tank varies from the longitudinal slope of the valley, i.e. from Kalawewa to Rajangana. This is due to the drainage water from the command area of the upper tank entering the lower tank as storage water tank. These findings confirm the study by Handawela (1983). Gunarwardena (1992) reported a gradual increase of sodium adsorption rate (SAR) of irrigation water from 1978 to 1986 and a gradual build-up of SAR in the soil solution of the system H. The SAR values of the irrigation waters in system H are generally higher than the irrigation water in system C. The gradual increase of SAR in irrigation water could be attributed to large-scale deforestation.
A few studies are available on the economic aspects of salinity in Sri Lanka. Sumanaratne and Abegunarwardena (1993) applied cost benefit analysis to control the salinity problem in the Inginimitiya irrigation project and found that improving conventional drainage is the most economically acceptable solution. Herath (1985) confirms that improving surface drainage is a viable approach to control soil salinity in the Mahaweli H area.
A recent preliminary investigation by the authors on the salinity situation in the system H indicated that out of nine management units of the H irrigation system, Madatugama and Nochchiyagama had significant salinity damage to
5/15/03 12:21 PMAn Economic Analysis of Salinity Problems in the Mahaweli River System H Irrigation Scheme in Sri Lanka
Page 6 of 39http://203.116.43.77/publications/research1/ACF1D9.html

crops and lands of about 10% and 25%, respectively. Since Madatugama is close to the major water source (Kandalama, Dambuluoya and Kalawewa, upper basin), farmers tend to over-use the irrigation water while practicing poor maintenance of drainage which leads to waterlogging and salinity not only in the same area but also in the downstream units (lower basin). Nochchiyagama being at the end of the irrigation scheme (Figure 2), had very high salinity effects compared to upstream Madatugama area. This is due to the dry climate, poor drainage practices, use of drainage water for irrigation and inefficient irrigation management in the area. In the management units of both up and downstream areas, farmers and the officers reported that salinity problems are increasing. Due to the salinity problem in the H irrigation scheme, large numbers of farmers in the affected areas cannot cultivate their land fully. A significant number of other farmers faced problems of low productivity. Without knowing the economic and environmental cost and nature of the soil salinity problem, it is difficult to decide the management strategy and investment level of correcting this problem.
1.4 Significance of the Study
Diverse statistics on the extent of saline soils (3-13%) in the major irrigation schemes in Sri Lanka show that a small percentage of lands have high and severe salinity problems. But there are more medium salinity-affected areas which may become highly saline with inadequate attention. The available estimates of the extent of salt-affected soils are largely tentative. Hence, the government must address the need to save and prevent further degradation of a larger proportion of moderately saline areas. Studying the salinity problem of the Mahaweli system H irrigation project is important in generating information that will be useful in formulating policies and instruments to prevent salinization.
Previous studies on salinity did not venture to establish any relationship between soil salinity and lower rice productivity. These also did not provide any clear indications of the threats posed by soil salinity to the sustainability of natural resources and agricultural growth in years to come. In view of these observations, this study investigated how salinity affects rice production and the environment. Mahaweli H area contributes 25%, 30% and 20% of the national production of paddy rice, chilli, and big onion, respectively. Nearly 28,000 families are dependent on agriculture in the 53,221 ha of old and 37,247 ha of newly developed irrigated areas. The growing salinity problem is likely to have a significant impact on the production and income of the people in these areas. However, the impact of salinity on production and environment has not been fully examined. A number of schemes in the developing countries failed to recover even their operating and maintenance costs, much more the capital costs. Cost recovery was around 7% of the total cost of supply (Sharma & RaO 1997). The growing salinity problem may lead to further management problems of the irrigation scheme and loss of production unless appropriate measures are taken at an early stage. Given the highly dynamic nature of the problem, it is imperative to thoroughly investigate salinization and to formulate strategies to counteract it as well as to reclaim and manage salt-affected areas. The study examined the possible causes of soil salinity in the H area to formulate possible early remedies to the problem in a big project like Mahaweli.
1.5 Research Objectives and Hypothesis
1.5.1 General objective
This study aimed to identify the nature of the soil salinity problem, to investigate its impact on rice production and on environment, and to assess the feasibility of reducing soil salinity for better water management and environmental protection in the Mahaweli system H Irrigation Project in Sri Lanka.
:Specific objectives
1. To assess the soil salinity and its distribution in the two study areas.2. To measure the salinity impacts on rice productivity, resource use, and profitability under different
soil salinity levels.
5/15/03 12:21 PMAn Economic Analysis of Salinity Problems in the Mahaweli River System H Irrigation Scheme in Sri Lanka
Page 7 of 39http://203.116.43.77/publications/research1/ACF1D9.html
3. To identify the socio-economic and physical factors that influence the salinity control efforts taken by individual farmers.
4. To compare the cost of control such as the improvement in drainage and water management; and the benefits of salinity control measures in terms of production loss avoided.
5. To assess farmers’ perception on the effect of salinization on the quality of drinking water, health and vegetation in the two study areas.
1.5.2 Overall hypothesis
The overall null hypothesis of the study is that salinity has not been responsible for loss in rice production and environmental degradation in the Mahaweli H irrigation system.
Subsidiary hypotheses
1. There is no significant difference in soil salinity problem in the areas located at varying distances away from the major reservoir.
2. There are no causal relationships between soil salinity and loss in rice production, resource use and income.
3. The salinity control efforts taken by farmers are not related to their socio-economic conditions and on the physical conditions of the land.
4. The soil salinity problem can not be reduced by improvement in drainage and water management.5. There is no environmental degradation in the Mahaweli Irrigation Scheme with respect to drinking
water quality, health and vegetation over the past years
2.0 METHODOLOGY
2.1 Soil Sampling and Assessment of Soil Salinity and its Distribution
Salinity in the soil varies with time depending on irrigation, rainfall, etc. but it is constant when there is no rain or irrigation and field operations. Thus, measuring salinity after harvest will give a good indication of the level of accumulated salt in the soil. The soil salinity level after the major cultivation season indicates a permanent nature of salinity problem compared to measurements taken after a minor season. Measurement of salinity level after harvest is also convenient and can be easily related to the yield of the crop cultivated. Thus soil salinity tests were done immediately after the harvest season in April 1998.
3
Using a soil auger, soil samples at 30cm depth were collected randomly from the cultivated lands of selected farmers. In selecting the fields, the distance from the distributory canal and drainage channel locations was considered. To capture the real representation of the soil problem, a composite soil sampling technique was employed. If the variation in soils was higher, more soil samples were taken from different parts of the fields. In the laboratory, the soil samples were air-dried and saturated extracts were prepared. The EC and pH values were measured using conductivity and pH meters, respectively. Based on the values obtained, farmers growingrice were classified into low, medium, high and severe salinity-affected areas. This helped to calculate the soil salinity levels and its distribution in the study areas. In addition, field investigations on landscape, groundwaterhydrology, water quality and drainage conditions were made in order to understand the development of salinity in the study areas.
2.2 Soil Salinity and Rice Production
5/15/03 12:21 PMAn Economic Analysis of Salinity Problems in the Mahaweli River System H Irrigation Scheme in Sri Lanka
Page 8 of 39http://203.116.43.77/publications/research1/ACF1D9.html

2.2.1 Literature linking salinity to yield loss
Effects of soil salinity have to be clearly isolated from the other causes of production loss. Several analytical approaches have been used to discern the pure impact of soil salinity from other factors of production. Pincock (1969) utilized whole farm budget to analyze the impact of salinity on net farm income. Moore et. al. (1974) used linear programming to estimate economic damage on multi-crop farms. Boster and Martin (1978) and Oyarzabad and Young (1978) have also applied variants of this approach. To analyze the long-term implications of leaching of salts, Yaron and Olian (1973) and Yaron (1985) have used dynamic programming models with irrigation of annual and perennial crops. Hussain and Young (1985), Joshi (1987) and Joshi et. al. (1994) have estimated the crop losses due to soil salinity using the production function approach. While the former used electrical conductivity as one of the explanatory variables, the latter estimated the impact on crop yield using a dummy variable for soil salinity level. Joshi and Dayanantha Jha (1992) used different production functions for normal and saline soils and decomposed the pure effect of change in output due to soil salinity and resource use. Sharma et. al. (1990) detected the threshold values of the salinity on different crops by establishing the relationship between crop yields and soil salinity.
2.2.2 Production function with salinity variable (EC)
Rice is the main crop in the northeast monsoon major (wet) season; half of the major season area is cultivated to rice. Cash crops such as chilli, red onion and big onion and other field crops such as maize, sorghum and gingilly (sesame) are grown during the minor (dry) season. Since rice is the main crop and is largely affected by salinity, it was chosen for the analysis. The approach assumes that salinity build-up directly influences the crop yields. To establish the relationship, a Cobb-Douglas form of production function was employed. Several explanatory variables, defined in different ways, were included to estimate the production function. The following functional form and variables were selected for further analysis:
Q = a L S F K Ec e ................................. (1)b c d g h u
Where, Q is yield of rice (kg/ha); L is cost of labour (Rs/ha); S is cost of seed (Rs/ha); F is cost of fertilizer (Rs/ha); and K is cost of capital (includes cost of chemicals and machinery use, Rs/ha). Since fertilizer application has a direct effect on salinity, it was considered separately and not added into capital. a, b, c, d, g, and h are the regression coefficients to the respective variables and u is the error term. EC is the electrical conductivity (dS/m) that gives the measure of soil salinity after harvesting rice. Rice production will not be affected when the salinityvalues go up to the threshold level. However, beyond the threshold level of EC (4 dS/m), salinity will have a negative effect on yield.
The above equation includes two types of explanatory variables. Seed, fertilizer, capital and labour are yield-enhancing variables whereas soil salinity is a yield-decreasing variable. The magnitude of elasticities of yield-enhancing variables and elasticity of soil salinity for the rice crop would show which variable affects rice yield more.
Correlation analysis between soil salinity and production and also with other factors contributing to EC such as pH and distance from the distributary canal, and groundwater table depth was conducted to clarify their relationships. The above coefficients were utilized to explain the salinity effects on production more clearly.
2.2.3 Salinity impacts on resource use and productivity
Production function decomposition analysis
In addition to the production function analysis, a decomposition analysis was used to discern the true impact of
5/15/03 12:21 PMAn Economic Analysis of Salinity Problems in the Mahaweli River System H Irrigation Scheme in Sri Lanka
Page 9 of 39http://203.116.43.77/publications/research1/ACF1D9.html

soil salinity on crop yield. Decomposition analysis is a mathematical technique that could disaggregate and quantify a difference in an observable quantitative variable into its components. More simply, the technique provides a method to quantify the intervening factors of a difference such as "before and after" or "with and without" situation. Production function decomposition analysis was used to decompose the difference in the changes in gross output between salinity-free soils and salinity-affected soils. Bisaliah in 1977 and Joshi et. al. (1992, 1994) used a similar technique for wheat and other crops. The change in gross output between normal and salinity-affected soils wasdecomposed into: (i) changes due to salinity effect and (ii) changes due to reallocation of inputs. The land use pattern, resource use pattern and crop productivity were also analyzed for different soil salinity levels. For production function decomposition analysis, separate production functions were estimated for different soil salinity levels. These have been specified in a log-linear form as follows:
Salinity-free soilLog Y = Log A + b Log L + c Log S + d Log F + g Log K ………….(2)n n n n n n n n n n
Salinity-affected soilLog Y = Log A + b Log L + c Log S + d Log F + g Log K ..………...(3)s s s s s
ss s s s
Where Y is gross income per hectare (Rs/ha), (L), (S), (F), (K) are cost per hectare (Rs/ha). A is a scale parameter. Others are the same as in the previous production function. Taking the difference between (1) and (2) and adding some terms and subtracting the same terms yield the following:
Log Y - LogY = (Log A - Log A ) +s n s n
(b Log L - b Log L + b Log L - b Log L ) +s s n n s n s n(c Log S - c Log S + cs Log S - c Log S ) +s s n n n s n(d Log F - d Log F + d Log F - d Log F ) +s s n n s n s n(g Log K - g Log K + g Log K - g Log K ) .....…………...(4)s s n n s n s n
Rearranging terms in equation (4) yields the following:
Log(Y /Y ) = Log (A /A )+[(b -b )Log L +(c -c ) Log S +(d -d ) Log F + (g -g )Log K ]s n s n s n n s n n s n n s n n+ [b Log (L /L ) + c Log (S /S ) + d Log (Fs/F ) + g Log(K /K )] …...(5)s s n s s n s n s s n
Equation (5) apportions approximately the differences in gross income per hectare between salinity-free and salinity-affected soils into two components. The sum of the first two bracketed components on the right hand side indicates the land degradation effect. The third bracketed term measures the contribution of changes in input levels between the two situations.
2.3 Factors Influencing Salinity Control Efforts Taken by Farmers
The salinity control practices in irrigated land have to be focused first on the farm level, where the problem of widespread salinity was noted, then on the group level and finally at a regional level. Factors affecting salinity control measures adopted by individual farmers are 1) personal factors (risk preference, education, age, experience), 2) economic factors (income from farming, cost of control), and 3) physical factors (topography, groundwater table, extent of area affected, etc.).
The amount of salinity control depends on the effectiveness of practices (such as drainage improvement, water
5/15/03 12:21 PMAn Economic Analysis of Salinity Problems in the Mahaweli River System H Irrigation Scheme in Sri Lanka
Page 10 of 39http://203.116.43.77/publications/research1/ACF1D9.html

management, and organic matter application), rather than the number of practices. However, there is little available information concerning the effectiveness of combined methods. Therefore, three conceptual models (dependent variables: cost of controlling salinity, salinity control score and the management time-family labour in man-days) were used as proxy to measure salinity control efforts taken by individual farmers. It was hypothesized that the farmers’ education level (ED), age (AG), experience in farming (EF), income from farming (IF), physical factor (PF) and attitude towards salinity control practices (AT) were positively related to efforts in controlling salinity. Salinity control efforts were examined by using the following three linear regression models.
Model 1 - Y (Cost of control of salinity/ ha) = f (ED., AG, EF, IF, PF, AT) .....(6)Model 2 - Y (Salinity control score) = f (ED., AG, EF, IF, PF, AT) .....(7)Model 3 - Y (Management time) = f (ED, AG, EF, IF, PF, AT) .....(8)
2.4 Determining the Optimal Control of Salinity
Preventive expenditure approach of salinity control
The optimal extent of salinity control depends upon the nature of the physical environment, the interaction between physical variables, price and technology. Different methods adopted by farmers in their fields to prevent salinity and their cost were collected and compared with technically appropriate methods to reduce soil salinity. Farmers adopted several methods such as flushing, use of ameliorates, cultural methods and drainage practices. The costs and benefits of controlling salinity, through the improvement of water management and drainage facilities to obtain a change from high (8 dS/m) to medium (4 dS/m) then medium to low salinity (3 dS/m) level, were estimated. Previous studies showed that up to about 3.3 dS/m of EC rice yields are not affected while salinity effects become increasingly evident beyond this level.
The yield loss avoided by changing from high to moderate and from medium to low was valued using the market price of rice, calculated to be Rs10 per kg based on latest information.
The installation of a drainage system facilitates drainage where the soluble salts are leached out. Approximately 8 plot drains (tertiary), 4 field drains (secondary) and 2 field drainage channels are required for a hectare of land. The information collected for the calculation were man-days used, cost of materials, the total drainage area, length of canal, the quantity of earth work involved in establishing such canal, improvements of present canal, and maintenance of canal system. Incremental benefits in terms of crop losses avoided were compared to the incremental cost incurred for salinity control such as implementing water management and drainage improvement at the farm level. Due to the deeper drainage canal, the initial cost is one third higher in Nochchiyagama than in Madatugama. The investment cost of drainage improvement was mainly labour. The stream of benefits and costs obtained and benefit-cost ratio was computed at 15% discount rate.
2.5 Salinity Effects on Environment
Interviews with farmers and key personnel were carried out to assess the effects of the salinity problem on drinking water, human health and other vegetation. Salinity effects on groundwater used for drinking were measured in terms of extra effort to fetch water for drinking and cooking from distant places. Increased level of infection created new areas of transmission of endemic and water-related diseases. Cost of illness related to salinity problems was also investigated using a detailed questionnaire. Change in vegetation enjoyed by the local people and foregone production from damages to vegetation due to salinity were also estimated. These environmental impacts were analyzed descriptively in this paper due to the difficulty of quantifying these information.
2.6 Study Area
5/15/03 12:21 PMAn Economic Analysis of Salinity Problems in the Mahaweli River System H Irrigation Scheme in Sri Lanka
Page 11 of 39http://203.116.43.77/publications/research1/ACF1D9.html

The Mahaweli system H is located in the North Central part of Sri Lanka (Figure 4). It is the first project developed under the Mahaweli Development Programme. The total irrigable rice lands in the system H is 31,303 ha and about 31,000 farm families are settled in this system. The regional altitude is 300 m above sea level. The landscape is undulating with slopes ranging from 0 to 4% with minor watersheds. The upper part of the slope consists of well-drained reddish brown earth (RBE) while the mid-slope area is imperfectly drained. The lower areas are ill drained with low humic gley soils (LHG). RBE is found to occupy around 60% of the land area. The Mahaweli H Regional Project Manager’s (RPM) area is divided into nine administrative blocks, managed by Block Managers (BM). The management of the block is done on the basis of "units" managed by Unit Managers (UM). Further, for the purpose of irrigation water management, the system H is divided into 12 sub-areas numbering from H1 to H12 (TAMS 1980).
Mahaweli H area receives an annual rainfall of less than 1,500 mm. Except for October, November, and December, ETo exceeds effective rainfall. Therefore, there is a high possibility of salt accumulation due to capillary flow in waterlogged or shallow water table areas during the first nine months. According to Panabokke (1958), the climate here can be considered as semi-arid during the dry period (agro-ecological zone DL2).
Based on the probable inflow of Mahaweli water to major reservoirs, a seasonal plan is prepared during the months of September to February and from March to August.
The study was conducted in the paddy lands of Nochchiyagama (H-5) and Madatugama (H-7) blocks (Figures 5 and 6). The former is located at the far end, while the latter is located near the main reservoir, Kalawewa tank. These two blocks are about 57 km apart and reported to have significant increasing salinity problems, which affected their rice production. Nochchiyagama receives an annual rainfall of about 1,000 mm and experience drier condition than Madatugama which receives an annual rainfall of 1,200 mm. There are 8,836 ha of irrigable land in Madatugama and 3,876 ha of irrigable land in Nochchiyagama blocks and these are distributed among 7,365 and 3,197 farmers, respectively. Each farmer in the Mahaweli area was given 1 ha of irrigable allotments and 1/4 ha of high land for homestead.
2.7 Data
The database utilized in this study includes a combination of secondary and primary data. Primary data regarding rice production (input, output, prices) relevant to the study were collected through personal surveys during the 1998 major season. In addition, many informal interviews with project managers, irrigation engineers, agricultural officers, and key farmer representatives were conducted to get their experience, views, policy issues and factors influencing salinity problems in the study area.
Three tier-sampling programmes were undertaken in order to capture the real representation of the problem. First, Nochchiyagama and Madatugama blocks were selected purposively based on a preliminary study because of the reported salinity problem in these areas. Among the irrigation allotment in each block, farm samples were selected using stratified random sampling based on their distance from the distributary canal. A total of 110 and 90 farm households were selected in Nochchiyagama and Madatugama, respectively. In each block, 30 salinity-free allotments were purposely selected and the rest were selected from areas suspected to have salinity problems, based on previous salinity reports and information gathered from farmers. The locations and sample size of selected irrigation management units are given in Table 1. The distribution of sample land allotments in the different management units is shown in Figures 5 and 6.
Information on water table depths and quality of drinking water, effects of salinity on production and environment aspects were collected to assess the actual and potential damage caused by salinity.
5/15/03 12:21 PMAn Economic Analysis of Salinity Problems in the Mahaweli River System H Irrigation Scheme in Sri Lanka
Page 12 of 39http://203.116.43.77/publications/research1/ACF1D9.html
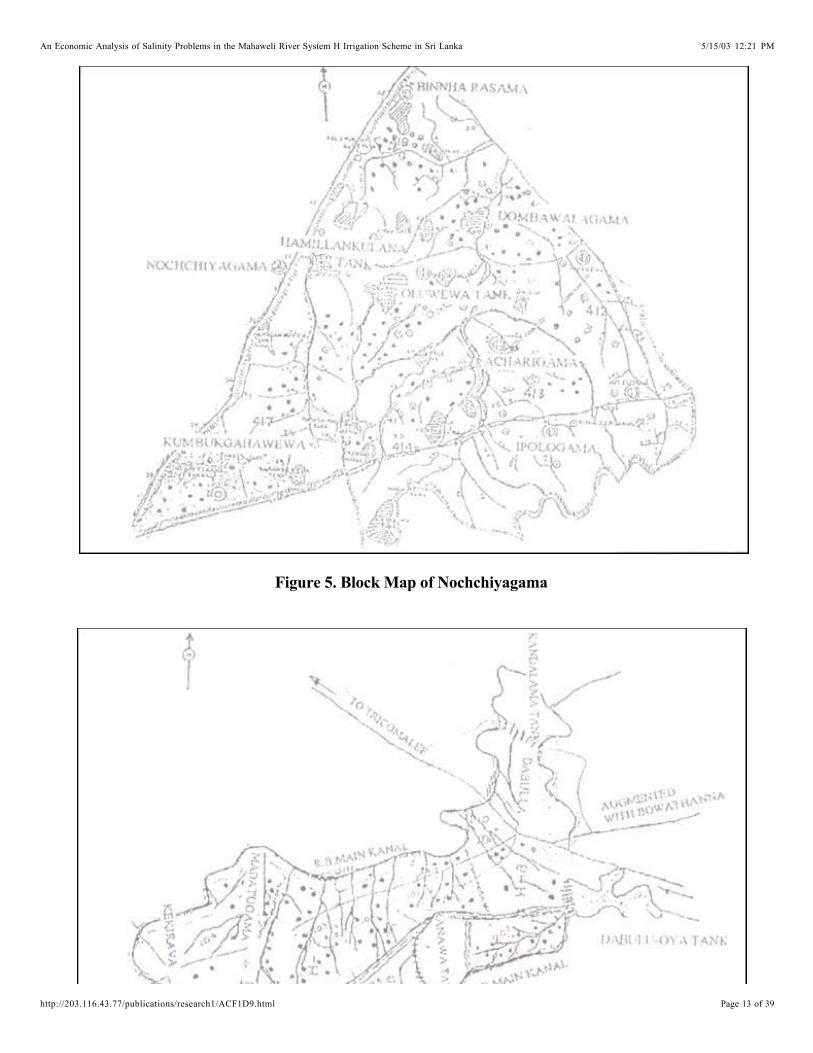
Figure 5. Block Map of Nochchiyagama
5/15/03 12:21 PMAn Economic Analysis of Salinity Problems in the Mahaweli River System H Irrigation Scheme in Sri Lanka
Page 13 of 39http://203.116.43.77/publications/research1/ACF1D9.html

Figure 6. Block Map of Madatugama
Table 1. Management unit sampling
Mgt. Unit. Irri. Blocks
Total Irrigable
Allotment (ha)Total No. of
Farmers
Selected No.
of Farmers
Sample Extent
(ha)
Nochchiyagama Block
412 725 604 30 36
413 & 414 1,249 1,049 20 24
415 & 4 18 954 795 30 36
417 898 749 30 36
Total 3,876 3,197 110 132
Madatugama Block
Kandalama 1,855 1,546 10 12
101 1,212 1,010 10 12
102 1,060 884 10 12
103 1,208 1,007 20 24
104 672 560 10 12
201 662 552 10 12
203 & 204 2,167 1,806 20 24
Total 8,836 7,365 90 108
5/15/03 12:21 PMAn Economic Analysis of Salinity Problems in the Mahaweli River System H Irrigation Scheme in Sri Lanka
Page 14 of 39http://203.116.43.77/publications/research1/ACF1D9.html

3.0 RESULTS AND DISCUSSION
3.1 The Extent and Distribution of Soil Salinity Problem
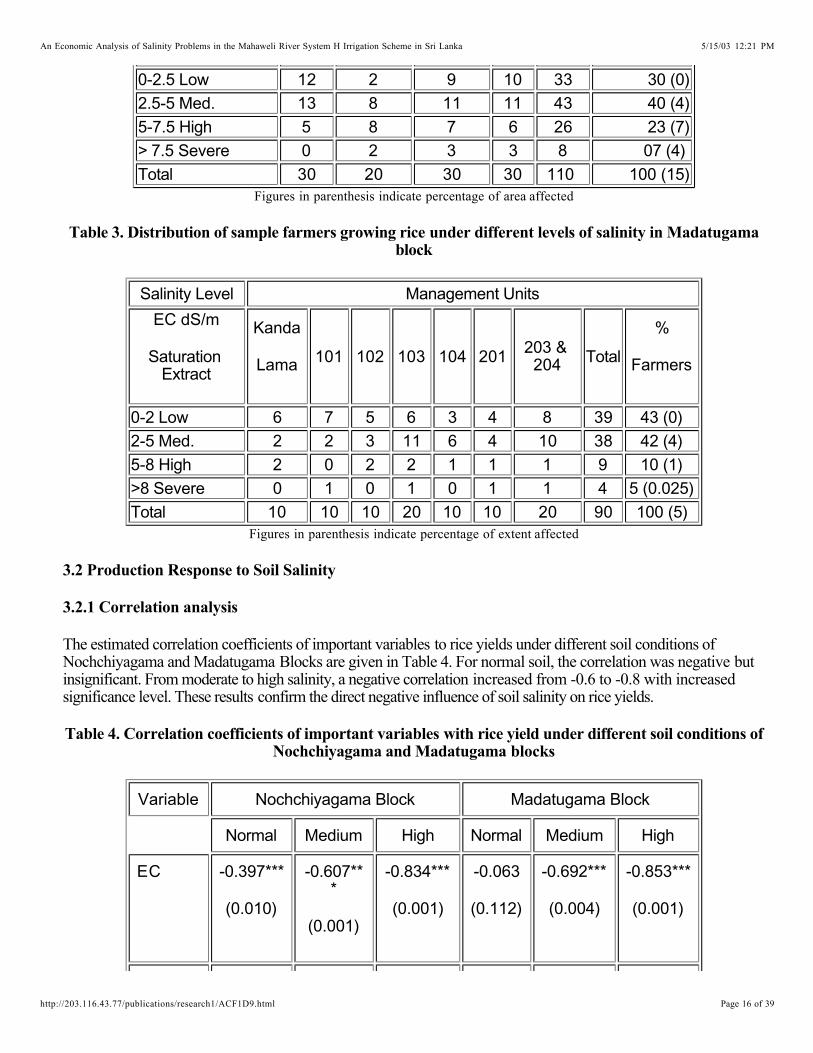
The soil EC and pH of the soil samples tested in the Nochchiyagama and Madatugama study areas are summarized in Tables 2 and 3, respectively. Details are given in Appendix Tables 1 and 2. Of the farmers interviewed, about 30% in Nochchiyagama and 43% in Madatugama were found to be operating under free salinity conditions (<2.5 dS/m). About 40% of the farmers were operating under medium level of salinity (EC ave. 5 dS/m) in both locations. This indicates that 70% of the Nochchiyagama farmers and 85% of the Madatugama farmers were operating within the safe salinity limits.
On the other hand, about 23% of the farmers were operating under the high salinity level (EC between 5 dS/m & 7.5 dS/m) with an area covering 7% (275 ha) of the total cultivated area in Nochchiyagama. Meanwhile, 10% of the farmers were operating under high salinity conditions, with an area covering 1% (88 ha) of the total cultivated area in Madatugama. In the far-irrigated areas in Nochchiyagama, all the management units had an even distribution of high and severe salinity problems. These problems were mainly due to the natural landscape particularly in the units of 102, 103 and 104.
Severe salinity conditions were found in about 4% (155 ha) of the sampled fields in Nochchiyagama and in 0.025% (22 ha) of the sampled fields in Madatugama. The severity of salinity varied from irrigation allotment to allotment and within plots to plots. This indicates that the extent affected in Nochchiyagama is about four times that of Madatugama. The difference is because of the downstream externality in the irrigation project. It was observed that waterlogging and salinity occurred in the low-lying areas where low humic gley (LHG) soil is present. High EC was observed in the waterlogging area. The above measures indicate a secondary salinity problem which is related to the development of modern irrigation systems. Secondary salinity was found to be due to poor drainage, higher water table and use of poor quality water for irrigation. If these practices are not corrected, the medium salinity areas are in danger of becoming more saline in the future.
In both study areas, about 80% of the farmers observed that the trend of the soil salinity problem was fluctuating or remained constant for the last decade. Their cultivation practices suggest that no particular attention has been paid to prevent secondary salinization. Therefore, the problem may continue and it will not take too long to manifest itself. The pH values of soil in the Nochchiyagama fluctuated between 7 and 9, which showed no significant alkalinity and sodic in nature (Table 2). High values of pH were recorded in the more waterloggedareas of 417 and 418 units. Madatugama’s pH varied from 6 to 8.7 (Table 3). Previous studies in the major irrigation tanks of Sri Lanka which are located in the dry zone, showed pH values to be around 8 (Amarasiri 1973). It has been reported that surface waterlogging in Nochchiyagama could have been caused by the gradual increase in the water table since the inception of the Mahaweli project in 1978, hence, the high salinity in the Nochchiyagama block.
4
Table 2. Distribution of sample farmers growing rice under different levels of salinity in Nochchiyagama block
Salinity Level Management Units
EC dS/m
Saturation Extract412 413 &
414415 &
418417 Total % Farmers
5/15/03 12:21 PMAn Economic Analysis of Salinity Problems in the Mahaweli River System H Irrigation Scheme in Sri Lanka
Page 15 of 39http://203.116.43.77/publications/research1/ACF1D9.html
0-2.5 Low 12 2 9 10 33 30 (0)
2.5-5 Med. 13 8 11 11 43 40 (4)
5-7.5 High 5 8 7 6 26 23 (7)
> 7.5 Severe 0 2 3 3 8 07 (4)
Total 30 20 30 30 110 100 (15)Figures in parenthesis indicate percentage of area affected
Table 3. Distribution of sample farmers growing rice under different levels of salinity in Madatugama block
Salinity Level Management Units
EC dS/m
Saturation Extract
Kanda
Lama 101 102 103 104 201203 &
204 Total
%
Farmers
0-2 Low 6 7 5 6 3 4 8 39 43 (0)
2-5 Med. 2 2 3 11 6 4 10 38 42 (4)
5-8 High 2 0 2 2 1 1 1 9 10 (1)
>8 Severe 0 1 0 1 0 1 1 4 5 (0.025)
Total 10 10 10 20 10 10 20 90 100 (5)Figures in parenthesis indicate percentage of extent affected
3.2 Production Response to Soil Salinity
3.2.1 Correlation analysis
The estimated correlation coefficients of important variables to rice yields under different soil conditions of Nochchiyagama and Madatugama Blocks are given in Table 4. For normal soil, the correlation was negative but insignificant. From moderate to high salinity, a negative correlation increased from -0.6 to -0.8 with increased significance level. These results confirm the direct negative influence of soil salinity on rice yields.
Table 4. Correlation coefficients of important variables with rice yield under different soil conditions of Nochchiyagama and Madatugama blocks
Variable Nochchiyagama Block Madatugama Block
Normal Medium High Normal Medium High
EC -0.397***
(0.010)
-0.607** *
(0.001)
-0.834***
(0.001)
-0.063
(0.112)
-0.692***
(0.004)
-0.853***
(0.001)
5/15/03 12:21 PMAn Economic Analysis of Salinity Problems in the Mahaweli River System H Irrigation Scheme in Sri Lanka
Page 16 of 39http://203.116.43.77/publications/research1/ACF1D9.html

PH -0.183
(0.253)
-0.339
(0.878)
-0.391***
(0.011)
0.063
(0.717)
-0.108
(0.526)
-0.247
(0.375)
DDC -0.155
(0.333)
-0.483**
(0.191)
-0.285***
(0.068)
0.062
(0.718)
-0.082
(0.063)
-0.177
(0.528)
Water Table
-0.028
(0.862)
-0.033
(0.838)
-0.266*
(0.150)
0.063
(0.122)
-0.154
(0.362)
-0.299
(0.279)
DC = distance from distributory canal* Significant at 10% level, ** significant at 5% level and *** significant at 1% level
A significant higher negative correlation (-0.5) between rice yield and distance from the distributary canal to the field, and high positive correlation (0.65) between EC values and the distance from the distributory canal confirm
that increasing distance decreases water availability. This has led to the use of drainage water for cultivation.Madatugama, being a water-rich area did not experience this.
e
Groundwater table was found to be a problem only in Nochchiyagama. Water table of less than one-meter level has affected rice yield as shown by the significant and negative correlation (-0.3) between these two variables.However, more technically correct database would be needed to establish statistically sound relationship between soil salinity, water table and yield.
Rice yield was not statistically related with all pH levels except with high salinity soil in Nochchiyagama. This indicates that pH values are normal for rice growth, which range from 6 to 9. The EC values and pH, however, are significantly and positively correlated.
3.2.2 Production function analysis with salinity variable (EC )e
The results of the regression analysis to determine the factors responsible for rice yield are presented in Table 5. This estimation did not include severe salinity-affected areas as the data highly deviated from the normal production data. The estimated R of the production function for Nochchiyagama (61%) and Madatugama (72%) explained that variation in yield was determined by fertilizer, labour, capital and soil salinity. The yield-influencing factors, included in the production function of rice, were significant and displayed the expected signs. The expected negative production elasticities of soil salinity indicated the decline in rice yield as the electrical conductivity of soil increased in both study areas. It was the most important determinant of yield compared to fertilizers, capital and labour inputs. This indicates that, a 1% increase in the electrical conductivity of soil at mean level (4dS/m) decreased rice yield by 0.8% and 0.4% in Nochchiyagama and Madatugama, respectively.
2
Table 5. Estimated productions functions with salinity variable for rice crop in Nochchiyagama and Madatugama blocks
Intercept Seed Labour Fertilizer Capital E.C R2 F
5/15/03 12:21 PMAn Economic Analysis of Salinity Problems in the Mahaweli River System H Irrigation Scheme in Sri Lanka
Page 17 of 39http://203.116.43.77/publications/research1/ACF1D9.html

Nochchiyagama Block
3.564***
(0.178)
0.069*
(0.044)
0.121***
(0.028)
0.049*
(0.033)
-0.010
(0.040)
-0.810***
(0.081)
0.612 29.667
Madatugama Block
1.795***
(0.584)
0.166
(0.137)
0.194*
(0.105)
0.121**
(0.074)
0.232**
(0.124)
-0.403***
(0.014)
0.721 14.374
Figures in parenthesis are standard errors
Marginal value product and damage
Marginal value product of yield-enhancing factors and marginal value of damage due to soil salinity were derived from the estimated production function for rice. Taking the first derivative of the production function with respect to the relevant factor yielded marginal value product or marginal value damage. The marginal damages were calculated at the average levels of soil salinity at the time of rice harvest. In physical terms, one unit increase in the electrical conductivity for the average level of salinity would adversely affect rice yield by nearly 757kg/ha and 505 kg/ha in Nochchiyagama and Madatugama, respectively. The response of the yield-enhancing factors in influencing rice yield was not as powerful as that of salinity in both blocks. The positive response of yield-increasing variables on yield was completely neutralized by soil salinity. Among the yield-increasing factors, only the coefficient of capital in Nochchiyagama and the coefficient of seed in Madatugama were not significant. The production elasticities of fertilizer were nearly twice in the case of Madatugama as compared to Nochchiyagama.Fertilizer was mainly more responsive in the well irrigated conditions (0.121) of Madatugama. Due to the more saline and waterlogged conditions of Nochchiyagama, fertilizer particularly nitrogenous fertilizer, had an inhibitory effect on rice yield. Therefore, fertilizer use on saline soils should be reduced accordingly. It was revealed that higher amounts of fertilizer was used in the moderate-saline areas compared to the low salinity areas, and very low level of fertilizer was applied in highly saline areas in both Nochchiyagama and Madatugama. The seed cost that reflects the change of varieties and the seeding rate because of changing soil environment was significant in Nochchiyagama. The higher significance of elasticity coefficients for capital and labour in Madatugama and Nochchiyagama, respectively indicated that rice yield would increase by using additional capital (machinery use) and labour in these areas.
These results clearly demonstrate that soil salinity was a major determinant in influencing the rice yield in Nochiyagama than in Madatugama. According to different salinity levels, appropriate measures should be taken to sustain the yield in these areas. In moderately saline soil areas, using corrective fertilizer application and other inputs can compensate the salinity effect. However, in the high saline areas where salinity overpowered the positive response of all yield-enhancing factors, it seems that not much can be done to neutralize the effect of soil salinity by raising the quantities of these factors. Curtailment of resource use further lowered the yield in these areas.
3.2.3 Soil salinity impact on resource use, productivity and profitability
Resource use
Deterioration in the physical environment leads to changes in resource use. Land use changes and cropping
5/15/03 12:21 PMAn Economic Analysis of Salinity Problems in the Mahaweli River System H Irrigation Scheme in Sri Lanka
Page 18 of 39http://203.116.43.77/publications/research1/ACF1D9.html

patterns in Nochchiyagama and Madatugama under different soil salinity levels are presented in Table 6. The short-term adjustments that farmers make as soil degradation problems emerge are described.
There was a significant decrease in the cropping intensity of Nochchiyagama compared to Madatugama. As expected, cropping intensity of salinity-free lands in Nochchiyagama and Madatugama were 136% and 159%, respectively. In moderate- and high salinity-affected areas, cropping intensity declined in both areas. In Yala, cropping intensity on salinity-affected soils was limited, thus, a large area was kept fallow during the dry season.
Rice claimed the largest share in the total cropped area in all kinds of soils. Under severely affected situation, 100% of the cropped area was planted to rice. In moderately saline areas, other field crops were also cultivated along with rice. Findings also revealed that with the increase in extent of salinity, area allocated to rice increased because of its greater tolerance to salinity. Late maturing (41⁄2 months) improved varieties were used in areas with more available water whereas early maturing (3 months) varieties were used in water-scarce areas. It seems that with increasing salinity, the share of the early maturing varieties increases to cope with the salinity problem in both blocks. However, it is interesting to note that salinity-tolerant varieties were not used in both blocks areas.This may be due to their non-availability and poor performance.
Other important cash crops such as chilli, big onion etc. were cultivated in about 2% and 7% of the total cultivated area in Nochchiyagama and Madatugama, respectively. Their relative share declined in moderate saline areas and they were not grown in high saline areas. Crop production possibilities are severely restricted under salinity-affected soils.
Table 6. Land use and crop-mix under different levels of salinity in Nochchiyagama and Madatugama blocks
ParticularsSalinity
Free Lands
Moderately Saline Lands
Highly Saline Lands
Nochchiyagama Block
Maha (wet season) fallow % 0 0 2
Yala (dry season) fallow % 64 76 100
Cropping intensity (%) 136 124 98
Area under imp. crops (%)*
Rice (HYV -4 m: BG:400, 11 11, 450, 339)
42.0 38.5 16.0
Rice (HYV-3m: BG: 300, 911/2, LD355 )
56.0 61.0 84.0
Big onion 0.6 0.2 Nil
Chillie 0.4 0.3 Nil
Pulses & Vegetables 0.7 Nil Nil
5/15/03 12:21 PMAn Economic Analysis of Salinity Problems in the Mahaweli River System H Irrigation Scheme in Sri Lanka
Page 19 of 39http://203.116.43.77/publications/research1/ACF1D9.html

Banana 0.3 Nil Nil
Madatugama Block
Maha fallow % 0 0 0.5
Yala fallow % 41.0 60.0 100.0
Cropping intensity (%) 159.0 140.0 95.5
Area under imp.crops (%) *
Rice(HYV: 4m: BG-400, 11 11, 450, 339)
73.0 66.0 27.0
Rice (HYV: 3m:BG 300, 1/2, LD 355) 20.0 33.0 73.0
Big onion 1.6 0.6 Nil
Chilli 2.4 0.2 Nil
Pulses & Vegetables 2.2 0.2 Nil
Banana 0.8 Nil Nil
* Expressed as percentage to gross cropped area
The incidence of the salinity problem has its impact on land resources in two ways: in extreme situation, it leads to abandonment of cultivation. About 4% of the total cultivable area in Nochchiyagama were affected by severe soil salinity conditions and may be abandoned if no remedial measures are taken. This phenomenon is of relatively recent origin, particularly after the Mahaweli Development Project.
Secondly, even on cultivated land, the intensity of land use declines substantially as the problem intensifies. Under this situation, the intensification effects of irrigation are lost. Thus in both quantitative and qualitative sense, land degradation due to soil salinity aggravates land scarcity. The following section discusses the second problem of salinity effect on land use intensity and cropping pattern changes.
Productivity and profitability
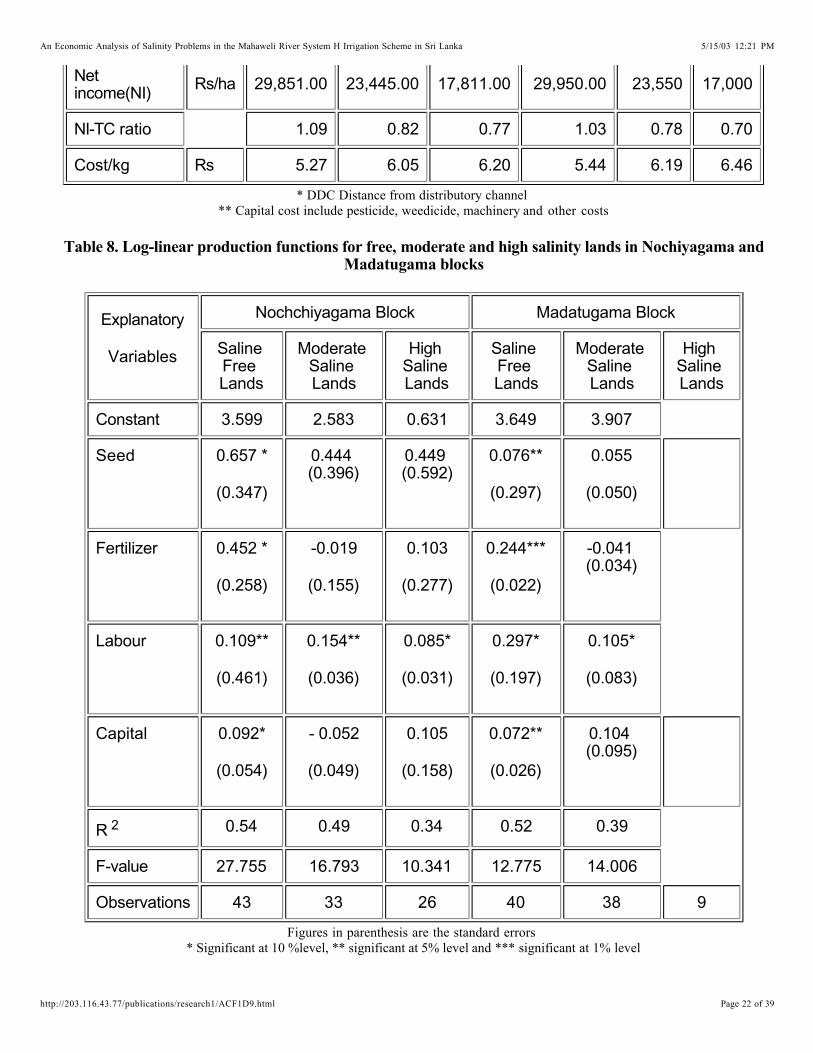
The results of productivity and profitability of rice production are presented in Table 8. There was a higher loss in productivity and profitability in Nochiyagama than in Madatugama. According to farmers’ perception inNochiyagama, rice yield was reduced by one third during the last decade due to increasing soil degradation. Current data indicate that rice yield went down by 9% and 30%, respectively in moderate and high salinity-affected areas in both blocks. Farmers reported two harmful effects of soil salinity such as lower yield and increased cost of controlling salinity. In medium salinity- affected areas, farmers showed higher concern for increasing the yield and for the cost of controlling salinity in their lands. In the high and severe salinity-affected areas, farmers viewed the decline in their yield as due to adverse effects of soil.
Net income from rice fell by about 22% and 43% in moderate and high saline areas respectively for both blocks. These results indicate that the high saline areas are becoming economically non-viable to cultivate. The effect on net income on severe salinity areas was more dramatic. The losses due to soil salinity can be illustrated by the
5/15/03 12:21 PMAn Economic Analysis of Salinity Problems in the Mahaweli River System H Irrigation Scheme in Sri Lanka
Page 20 of 39http://203.116.43.77/publications/research1/ACF1D9.html

increased cost of production. The study showed that the unit cost of production rose by about 25% and 32% in the moderate and high salinity-affected areas of both blocks, respectively. There was not much difference in profitability between moderate and high saline areas. This was because the return to the fertilizer cost in moderately saline area was not sufficient, while the usage of inputs in the high salinity areas was comparatively low. Thus on moderate saline areas, practices have to be changed to get higher returns; motivation is necessary to improve practices in high saline areas to stop further deterioration of the lands.
3.2.4 Production function decomposition analysis
The estimated regression results (equation nos. 2 & 3) for free, moderate and high salinity areas in Nochiyagama and Madatugama are presented in Table 7. All four variables, namely seed, fertilizer, labour and capital were statistically significant in the equation for salinity free soils. In the affected areas, labour was the only significant variable. This indicates that the response behaviour of farmers with respect to inputs changed significantly as soil salinity increased in both study areas. The value of adjusted R ranged from 26% to 46% but the F values were high. The results of the decomposition exercise using the results from Table 7 are reported in Table 9.
2
Table 7. Mean values of important variables used in rice production under different salinity levels inNochchiyagama and Madatugama blocks
Item Unit Nochchiyagama Block Madatugama Block
Normal
Medium
Salinity
High
SalinityNormal
Medium
Salinity
High
Salinity
E.C DS/m 1.30 3.90 7.90 1.10 3.80 8.80
PH 6.94 7.65 8.27 6.89 8.12 7.98
DDC* M 510.05 575.61 644.78 681.53 713.78 717.33
Seed cost Rs/ha 2,200.00 2,350.00 1,960.00 2,350.00 2,180 1,980
Labour cost Rs/ha 10,930.00 11,320.00 9,230.00 11,205.00 12,025 9,540
Fertilizer cost kg/ha 5,110.00 5,490.00 3,780.00 5,980.00 5,620 3,970
Capital cost** Rs/ha 9,230.00 8,840.00 7,650.00 9,750.00 9,780 8,310
SalinityControl
Rs/ha - 640.00 390.00 - 690 340
Total Cost (TC)
Rs/ha 27,470.00 28,640.00 23,010.00 29,285.00 30,295 24,140
Yield kg/ha 5,211.00 4,735.00 3,711.00 5,385.00 4,895 3,740
Gross income Rs/ha 57,321.00 52,085.00 40,821.00 59,235.00 53,845 41,140
5/15/03 12:21 PMAn Economic Analysis of Salinity Problems in the Mahaweli River System H Irrigation Scheme in Sri Lanka
Page 21 of 39http://203.116.43.77/publications/research1/ACF1D9.html
Netincome(NI)
Rs/ha 29,851.00 23,445.00 17,811.00 29,950.00 23,550 17,000
NI-TC ratio 1.09 0.82 0.77 1.03 0.78 0.70
Cost/kg Rs 5.27 6.05 6.20 5.44 6.19 6.46
* DDC Distance from distributory channel** Capital cost include pesticide, weedicide, machinery and other costs
Table 8. Log-linear production functions for free, moderate and high salinity lands in Nochiyagama and Madatugama blocks
Explanatory
Variables
Nochchiyagama Block Madatugama Block
Saline Free Lands
Moderate Saline Lands
High Saline Lands
Saline Free Lands
Moderate Saline Lands
High Saline Lands
Constant 3.599 2.583 0.631 3.649 3.907
Seed 0.657 *
(0.347)
0.444 (0.396)
0.449 (0.592)
0.076**
(0.297)
0.055
(0.050)
Fertilizer 0.452 *
(0.258)
-0.019
(0.155)
0.103
(0.277)
0.244***
(0.022)
-0.041 (0.034)
Labour 0.109**
(0.461)
0.154**
(0.036)
0.085*
(0.031)
0.297*
(0.197)
0.105*
(0.083)
Capital 0.092*
(0.054)
- 0.052
(0.049)
0.105
(0.158)
0.072**
(0.026)
0.104 (0.095)
R 2 0.54 0.49 0.34 0.52 0.39
F-value 27.755 16.793 10.341 12.775 14.006
Observations 43 33 26 40 38 9
Figures in parenthesis are the standard errors* Significant at 10 %level, ** significant at 5% level and *** significant at 1% level
5/15/03 12:21 PMAn Economic Analysis of Salinity Problems in the Mahaweli River System H Irrigation Scheme in Sri Lanka
Page 22 of 39http://203.116.43.77/publications/research1/ACF1D9.html

Table 9. Decomposition of output differences into soil salinity and input changes in Nochchiyagama and Madatugama blocks
Item
Percentage attributable
Moderately Saline Areas vs.
Salinity Free Areas
High Saline Areas vs.
Salinity Free Areas
Source of change Nochchiyagama Madatugama Nochchiyagama
1. Salinity -56.61 -54.30 -59.23
2. Changes in input -14.33 -10.40 -20.50
(i) Seed 01.67 03.10 02.30
(ii) Fertilizers -06.41 -03.30 -20.63
(iii) Labour -08.56 -07.70 -10.84
(iv) Capital -01.03 -02.50 -01.36
Total difference explained
-70.94 -64.70 -79.73
The estimated model accounts for more than 65% of the difference in mean income between salinity free and salinity affected areas. The tables indicate that the problem of salinity accounted for 55% in moderate saline areas. In Nochchiyagama, the corresponding figure for high saline areas was 59%. These values indicate that with the same level of resources use, compared to salinity free areas, gross output would decline by 55% in moderate and 59% in the high saline areas of Nochchiyagama. Due to the less number of observations in the high salinity areas of the Madatugama, regression was not possible. Only about 10-14% of the output difference could be attributed to change of input use in moderate saline areas. The figure for high saline areas of Nochchiyagama was 21%. This shows that curtailment of input use (labour and fertilizer) in high saline areas was high. It is important to note that seed input was positively related with high yielding varieties in both affected soils. Though fertilizer use was high in moderate saline areas than in salinity free areas, its effect on yield was negative due to inefficient use.
3.3 Farmers’ Management Strategies in Controlling Soil Salinity
3.3.1 Socio-economic characteristics of Mahaweli rice farmers
Farmers’ socio-economic characteristics are crucial factors since these can be significantly related to salinity control behaviour (Table 10). The average age of the farmers in both areas ranged from 48 to 50 years. They have experience in rice farming for more than 16 years. The average farm household size is 5 to 6 with low dependency ratio (0.6 -0.8). Education level significantly differed between the two study areas: farmers in Nochiyagama are mostly educated up to the primary level while Madatugama farmers are educated up to the secondary level. Majority of the farmers in Nochchiyagama (80%) and Madatugama (70%) are full-time farmers.
5/15/03 12:21 PMAn Economic Analysis of Salinity Problems in the Mahaweli River System H Irrigation Scheme in Sri Lanka
Page 23 of 39http://203.116.43.77/publications/research1/ACF1D9.html
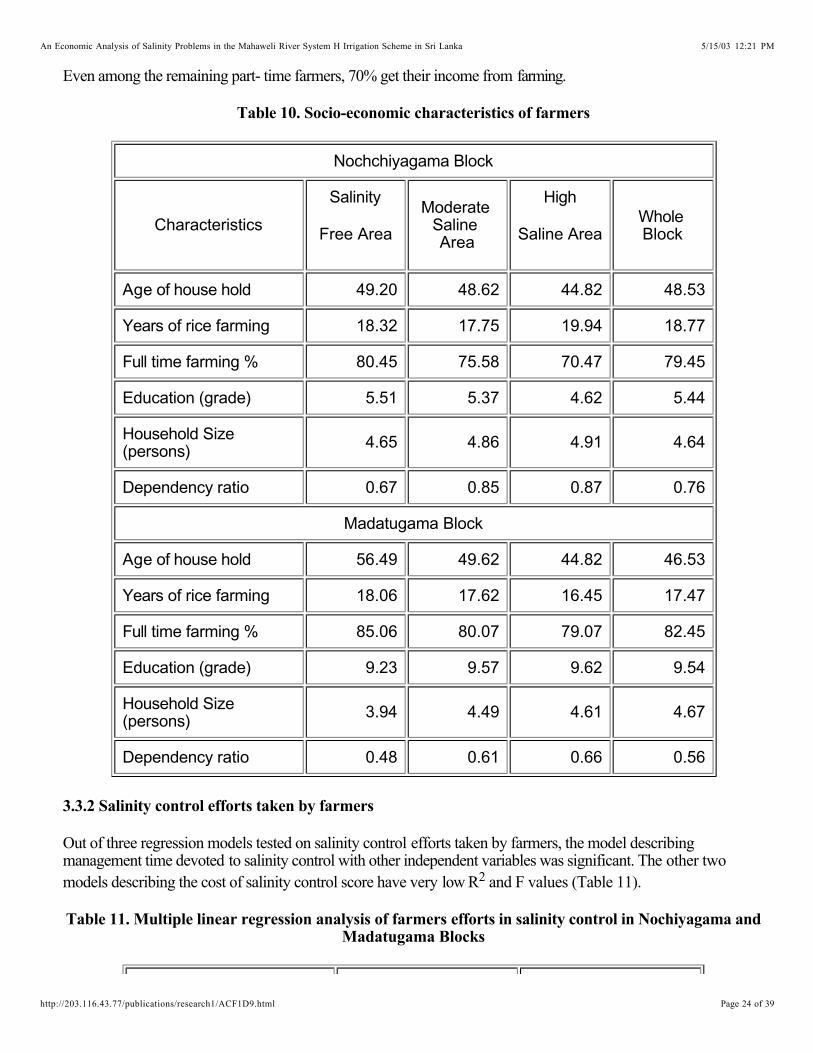
Even among the remaining part- time farmers, 70% get their income from farming.
Table 10. Socio-economic characteristics of farmers
Nochchiyagama Block
Characteristics
Salinity
Free Area
Moderate Saline Area
High
Saline AreaWhole Block
Age of house hold 49.20 48.62 44.82 48.53
Years of rice farming 18.32 17.75 19.94 18.77
Full time farming % 80.45 75.58 70.47 79.45
Education (grade) 5.51 5.37 4.62 5.44
Household Size (persons)
4.65 4.86 4.91 4.64
Dependency ratio 0.67 0.85 0.87 0.76
BlockMadatugama
Age of house hold 56.49 49.62 44.82 46.53
Years of rice farming 18.06 17.62 16.45 17.47
Full time farming % 85.06 80.07 79.07 82.45
Education (grade) 9.23 9.57 9.62 9.54
Household Size (persons)
3.94 4.49 4.61 4.67
Dependency ratio 0.48 0.61 0.66 0.56
3.3.2 Salinity control efforts taken by farmers
Out of three regression models tested on salinity control efforts taken by farmers, the model describing management time devoted to salinity control with other independent variables was significant. The other two models describing the cost of salinity control score have very low R and F values (Table 11).2
Table 11. Multiple linear regression analysis of farmers efforts in salinity control in Nochiyagama and Madatugama Blocks
5/15/03 12:21 PMAn Economic Analysis of Salinity Problems in the Mahaweli River System H Irrigation Scheme in Sri Lanka
Page 24 of 39http://203.116.43.77/publications/research1/ACF1D9.html

Dependent variable
Management time
Nochchiyagama Block
Observations 110
Madatugama Block
Observations 90
Constant -3.651** (0.637) 5.355*** (1.070)
Education 0.217 (0.467) - 0.052 (0.192)
Attitude 0.030* (0.014) 0.011** (0.008)
Age - 0.011 (0.007) 0.011* (0.008)
Experience in farming - 0.052 (0.049) 0.022 (0.011)
% Farm Income 0.012 (0.004) 0.012** (0.005)
Land physical factor 0.041** (0.027) 0.181** (0.052)
R squared 0.338 0.341
F-value 12.655** 13.763**
* significant at 10% and ** significant at 5% level
The family labour management time model indicating the farmers’ attitude towards using family labour on salinity control was positive but had a weak relationship. Experience in farming, percentage of income from farming and physical factors, were positive and significantly influenced man-days spent on salinity control efforts by farmers. This model indicates that when the percentage of income from farming is higher, the efforts on control methods using family labour use is also higher. Further, farming experience is important in family labour efforts to control salinity. Education and age had no influence on their efforts and the null hypothesis was rejected.
The salinity control efforts by farmers are also significantly affected by the physical characteristics of the land and by income from farming. Along with training and education, subsidy for controlling measures for poorer farmers, is also very important. The poor farmers are mostly affected by soil salinity but they can not and do not invest on controlling measures. The abandonment of any piece of land due to salinity will have serious impact on their living.
3.4 Control of Salinity - Preventive Expenditure Approach
3.4.1 Measures adopted by farmers
Based on the estimation of the study, about 7% and 4% of the total cultivated area in Nochchiyagama were affected by high and severe soil salinity problems, respectively. However, high soil salinity affected only 1% of the total cultivated land and severe salinity problem was insignificant in Madatugama. Four important strategies were employed by the farmers in the study areas to prevent salinization of rice fields. These are:
1. Organic matter application - farmers mainly use straw, and some amount of farmyard manure and green manure
2. On-farm water management - deep and more ploughing, land leveling and flushing, mainly practiced by Madatugama farmers
3. Drainage practices - cleaning and deepening of drainage canal
5/15/03 12:21 PMAn Economic Analysis of Salinity Problems in the Mahaweli River System H Irrigation Scheme in Sri Lanka
Page 25 of 39http://203.116.43.77/publications/research1/ACF1D9.html

4. Use of chemical ameliorates - mainly gypsum in highly affected farms
Table 12 shows that more than half of the affected farmers adopted at least two practices. Only a few farmers practiced drainage improvement. Low average cost incurred on drainage improvement indicates that they werenot adequately performed due to inadequate capital and lack of cooperation among the farmers. As most of the farmers did not use direct salinity control methods on their lands, it was therefore difficult to calculate the cost.From the discussions with irrigation engineers and irrigation officials in Mahaweli, it was found that a drainage canal had been laid out originally between every two fields. The drainage network, which was originally plannedwith the natural drainage (Kalaoya and Yodala) for the whole system, is sufficient to drain the excess water. However, the farmers clear only the irrigation field canal, but not the drainage canal. Further, in some places they even turned the field drainage canals into cultivated lands. These have resulted in waterlogging and salinization in the area. Also, the major concern of the Mahaweli authority was the operation and maintenance (O & M) of the main and branch irrigation canals rather than drainage. Thus, in practice drainage seems to be grossly neglected and the salinity problems continue to increase.
Table 12. Salinity control measures adopted by farmers in Nochchiyagama and Madatugama blocks
Practices
Nochchiyagama Block Madatugama Block
No. of farmers
Average Cost Rs/ha
No. of farmers
Average Cost Rs/ha
Drainage Practice 15 (14%)
500 (02%) 06 (7%) 600 (2.5%)
Land Leveling & Leaching
20 (18%)
700 (03%) 18 (20%)
560 (2.3%)
Organic Manure 40 (36%)
100 (0.4%) 30 (33%)
150 (0.6%)
Ameliorates 45 (41%)
300 (1.3%) 27 (30%)
340 (1.4%)
Multiple responsesFigures in parenthesis are % to total farmers and cost of production in high salinity area, respectively
On the moderately saline areas in both study areas, the soil salinity level was within 5 dS/m. It can be considered as a temporary phenomenon, and it can be leached out by improving on-farm water management practices such as in drainage. As the salinity is not high, drainage may free the soil from salinity after a few seasons. If water management is not improved, a large proportion (40%) of the medium salinity affected area may turn into high salinity area over time. The annual maintenance of a drainage canal cost about Rs1,200/ha and the benefit from this practice reduces the excess input cost by 2-4% and increases the yield between 5-10% (Table 7). Educating and training of farmers on these benefits are important.
The area that needs drainage differs according to the water table level and the degree of soil salinity. Therefore, the benefit of salinity control varies from place to place. The benefit from drainage was higher than its cost. The drainage in Madatugama is fairly medium-sized and drainage canals do not need to be deepened as in Nochiyagama. For effective drainage practice, turn out level farmer (10 ha) organization is a prerequisite. The actual cost spent by farmers in controlling salinity ranged from Rs300 to Rs700 per hectare in both study areas. However, these were not lasting solutions. The investment pattern on salinity management strategies by farmers
5/15/03 12:21 PMAn Economic Analysis of Salinity Problems in the Mahaweli River System H Irrigation Scheme in Sri Lanka
Page 26 of 39http://203.116.43.77/publications/research1/ACF1D9.html

varied according to their attitudes and the degree of the problem. Comparatively higher investment made by farmers in the moderately saline areas indicates their concern for the problem.
Findings showed that majority (80%) of the farmers in severe salinity affected areas did not believe that salinity control activities were profitable hence, they did not practice any. For the severe salinity areas covering 155 ha in Nochchiyagama and 88 ha in Madatugama, reclamation or introduction of new crops are needed. Reclamation needs more investment and time and hence, is ver popular. Shifting to alternative crops is often preferred.
It was observed that the farmers have applied ameliorates without proper technical information. Basically, salinity requires regular leaching and drainage. Application of chemicals might in fact aggravate the situation in the long run. But applying lesser amount of ameliorates (10% of the recommendation) can prevent this. Improving the general drainage conditions and soil permeability by adding organic matter and deep ploughing are also essential.
3.4.2 Benefit cost analysis - drainage improvement
The results of benefit-cost analysis for improving the drainage system for one hectare of land to reduce salinity from high to medium and from medium to low are given in Table 13.
Table 13. Benefit-cost analysis: surface drainage improvement in Nochchiyagama and Madatugama areas, Sri Lanka
Year High to Moderate Salinity
8 ds/m - 4 ds/m
Moderate to low Salinity
4 ds/m - 3 ds/m
Nochchiyagama
Block
Madatugama
Block
Nochchiyagama
Block
Madatugama
Block
Cost
Rs
Benefit Rs
Cost Rs
Benefit Rs
Cost Rs
Benefit Rs
Cost Rs
Benefit Rs
1 4,200 9,221 2,700 10,192 1,800 4,047 1,200 3,499
2 1,200 9,221 1,000 10,192 1,200 4,047 1,000 3,499
3 1,200 9,221 1,000 10,192 1,200 4,047 1,000 3,499
4 1,200 9,221 1,000 10,192 1,200 4,047 1,000 3,499
5 1,200 9,221 1,000 10,192 1,200 4,047 1,000 3,499
15% dis. Rate
NPV
Rs
BCR NPV Rs
BCR NPV
Rs
BCR NPV Rs
BCR
5/15/03 12:21 PMAn Economic Analysis of Salinity Problems in the Mahaweli River System H Irrigation Scheme in Sri Lanka
Page 27 of 39http://203.116.43.77/publications/research1/ACF1D9.html

27,921 4.66 33,735 7.07 11,355 3.17 9,434 3.33
50% effect. 10,149 2.33 12,590 2.79 2,577 1.49 3,748 1.92
The benefit-cost ratios for improvement in drainage were above 2 in both areas even at 50% effectiveness. The benefit was higher (7.07) in Madatugama than in Nochchiyagama (4.66). But the percentage of extent affected in Nochchiyagama was also higher (7%) than in Madatugama (1%). The benefit-cost ratios were 3 in both study areas for improving drainage to reduce salinity from moderate to low. Extent wise, 4% of the land are in this category in both areas. These results indicate that drainage improvement gives a reasonably high benefit-cost ration, hence, drainage improvement should be encouraged as a preventive measure for the salinity problem in the Mahaweli H irrigation scheme.
Although the cost of control measures are relatively low, they were not adopted by farmers because of poor return from rice farming and lack of knowledge of this long-term problem. The opportunity cost of not investing in appropriate control measures is considerable in this group of farmers. Therefore, incentives and subsidies along with training of farmers on appropriate salinity control measures are important. Drainage system of the entire area should also be planned as a single unit rather than for a particular field. The remedy to this situation is mainly in the hands of the agency rather than in individual farmers. The agency could motivate the farmers to act collectively to improve the drainage of the area irrespective of the salinity of individual fields.
3.4.3 Agencies’ programmes on irrigation rehabilitation
The Mahaweli Authority initiated two programmes with the aid of the World Bank (WB) in 1998 and with the Asian Development Bank (ADB) in 1997 to improve the efficiency of irrigation networks in the Mahaweli H system. The Mahaweli Restructure Rehabilitation Project (MRRP) funded by the World Bank was started in June 1998. This is a five-year project costing 2,050 Mil Rs to rehabilitate small tanks, irrigation and drainage canals.
The rehabilitation contracts are mainly labour oriented tasks to be given to farmer organizations in that area and will be handed over to them for operation and maintenance. This is in line with the National Irrigation Rehabilitation Project (NIRP) which is mandated to organize farmer participation in different stages of irrigation schemes with the ultimate objective of handing over the system to the user groups. A maximum of Rs 500,000 for one field canal (for 10 ha) will be granted at the rate of Rs 50,000/ha. To get the contract, the viability of the farmer organization will be considered and 10% of the cost has to borne by them.
Madatugama Nochiyagama
Distributary canal length 141 km 73 km
Structure 1,434 nos. 963 nos.
Field canal earthening 429 km 240 km
Structure 10,500 nos. 8,800 nos.
Drainage canal 6 nos. 15 nos.
5/15/03 12:21 PMAn Economic Analysis of Salinity Problems in the Mahaweli River System H Irrigation Scheme in Sri Lanka
Page 28 of 39http://203.116.43.77/publications/research1/ACF1D9.html

ADB started the rehabilitation of selected 50 small tanks in system H in 1997. Under this project the Hinguruwlpitiya and Unagollawa tanks in Madatugama and the Phalahalmullewa and Palugama tanks in Nochchiyagama are being rehabilitated and handed over to farmer organizations in that area. The above two projects also help in combating the irrigation-induced salinity in the Mahaweli system H. These programmes, to a large extent, will contribute to improving the irrigation water use efficiency at farm and system level and will prevent soil salinity. The impact of these projects on the farmers’ soil problem and yield need to be studied.
3.5 Environmental Cost of Salinity
Farmers’ identification of their critical environmental problems experienced in terms of drinking water quality, human health and vegetation were qualitatively investigated in the two study sites and are summarized in Table 14.
3.5.1 Effect on drinking water quality
The qualitative information indicates that about 50% of the farmers in Nochchiyagama believed that water quality was not fit for drinking and had changed their water source. About 30% of the households walked more than 1 km to fetch safe drinking water mainly during dry months. It was found that the quality of drinking water tended to decrease towards the tailend of the system. Fetching is a task mainly performed by women. About 20% of the women reported that 25% of their productive time was lost in fetching water.
Table 14. Farmers’ identification of the environmental problems
Particulars % of farmers response
Nochchiyagama
Block
Madatugama
Block
1. Drinking water quality
Deterioration 53 04
Change of water source 45
Distant traveled >1km 30
Loss of productivity by women 20
2. Human health
Malaria 64 40
Dysentery & amoebiosis 20 05
Increased health cost 15 10
Productive work loss 08 03
3. Vegetation
5/15/03 12:21 PMAn Economic Analysis of Salinity Problems in the Mahaweli River System H Irrigation Scheme in Sri Lanka
Page 29 of 39http://203.116.43.77/publications/research1/ACF1D9.html

Appearance of halophytes
Grasses: Cyperus rotandus
Cynodon dactylon
Shrubs: . Phoenix spp
Firewood depletion
20
10
5
55
0
0
0
25
Multiple responses
Madatugama, being a water-rich area, had no problem in drinking water quality. Rising water table and drainage water stagnation were the reasons for the deterioration of drinking water quality in the downstream. The poor and the tail enders of the Nochchiyagama block were the hardest hit compared to Madatugama. More than half (50%) of the Nochchiyagama farmers perceived that their drinking water quality deterioration over the years. They draw their drinking water directly from polluted surface water and unsanitary wells. Most of the wells in Nochchiyagama are affected by rising groundwater table, which is crucial for the future locations of drinking water wells. Hence, a safe, reliable and convenient supply of drinking water for Nochchiyagama residents is needed.
3.5.2 Effect on human health
Relating health problems directly with salinity and waterlogging as causes is difficult. Malaria was found to be the most widespread in the waterlogged area. Nearly / and / of the respondents in Nochchiyagama and
Madatugama, respectively were reported to be suffering from the vector borne diseases, indicating that the morestagnant the water, the higher the prevalence of the diseases.
23
13
Diseases associated with poor water quality such as dysentery and amoebiosis were the other common ill health problems in Nochchiyagama. These indicate the adverse downstream effect due to contamination of groundwaterand salinity water. In-depth studies are needed to investigate agricultural pollution effect on human health. The cost of reduced productivity and of treatment must be added to the time taken to fetch water for drinking and domestic use. These were insignificant in both study areas, due to low opportunity cost of labour and free government medical services.
3.5.3 Effect on vegetation
Identifying the direct impact of salinity on vegetation is difficult. However, the qualitative information gathered from the farmers during field visits showed that salinity and waterlogging caused the natural vegetation to form into non-productive types and for the forest and natural vegetation to recover slowly.
In the salinity-affected rice fields, grass tolerant to salinity such as , and (Bermuda grass) were becoming predominant weeds. In the more saline areas, saline tolerant shrubs like
. and . were reported to be appearing over the years in Nochchiyagama. Loss ofshrubs and forest was felt through depleted fuelwood supply in both areas.
Cyperus rotondus Cyandon dactylon
Phoenix spp Pandanusspp
4.0 CONCLUSIONS AND POLICY IMPLICATIONS
5/15/03 12:21 PMAn Economic Analysis of Salinity Problems in the Mahaweli River System H Irrigation Scheme in Sri Lanka
Page 30 of 39http://203.116.43.77/publications/research1/ACF1D9.html
With reference to the objectives and the analysis of the study, the following broad policy conclusions can be derived:
1. Soil salinity problems are significantly high in the areas far from the reservoir than in closer areas. The salinity problem exists in the lowest part of the field. Major causes of soil salinity development in these areas are poor drainage, waterlogging and dry conditions. Crop management under these conditions basically involves control of water table and maintaining favorable salt balance over the root zone. Overall, the Mahaweli H area has less than 10% of the total irrigable area with significantsoil salinity problems. Since 40% of the farmers’ fields are affected by moderate salinity, it is important to prevent their lands from turning into high salinity areas. At the same time, improvement of high salinity areas also needs more attention.
2. In salinity affected areas, the soil salinity is the principal factor that determines rice production. In moderately saline areas, the yield loss ranged from 10%-15%; in high and severe soil salinity areas,yield was reduced by about one third. Therefore, it is important to identify such areas in the irrigation projects and reclaim the soil from permanent damage.
3. Farmers change input use as soil salinity increases. The incidence of salinity will result in an increase in cost and reduced production. It will also not be economically viable to cultivate rice in the high andsevere saline areas. Therefore, soil salinity should be controlled to realize the benefit from any increase in crop production.
4. Salinity control efforts taken by farmers such as drainage, water management, organic manure application, and ameliorates are mainly affected by income from farming, experience in farming and management of physical factors.
Soil and water management will overcome the salinity problem in more than 80% of the affected cultivable lands. The general drainage condition of the field rather than soil and water management has a decisive role in controlling soil salinity and in ensuring reasonable rice yield in the heavily affected areas. For severe soil salinity areas which account for 5% of the total cultivable extent in the two study sites, adaptive research is required to reclaim these soils.
5. Effect of salinity on drinking water quality, human health and vegetation was felt in the salinity affected area, but not up to dangerous levels. However, adverse downstream effects of irrigation on environment were evident in Nochchiyagama. This is not substantiated by analytical data. Thus an in-depth study is needed to investigate this problem.
5.0 RECOMMENDATIONS
Based on the study findings and conclusions, the following recommendations are made for sustainable water management and environmental protection.
1. Irrigation Water Management
a. Drainage improvement
Preventive measures for soil salinity problem, appropriate to the soil condition, will help in minimizing the loss caused by soil salinity. Estimating damages will be useful in deciding appropriate technological or management options in view of their technical and financial feasibility. The benefit-cost ratio showed that drainage improvement is the desirable permanent solution to the problem. It may take several decades and injection of enormous capital to achieve this. Therefore, as a short-term measure, farmers could practice drainage improvement - cleaning, deepening and prevention of
5/15/03 12:21 PMAn Economic Analysis of Salinity Problems in the Mahaweli River System H Irrigation Scheme in Sri Lanka
Page 31 of 39http://203.116.43.77/publications/research1/ACF1D9.html

blockage of drainage canals at the farm level.
b. Prevent excessive irrigation
Excessive irrigation in the upstream should be controlled to prevent the water table from rising downstream. This can be achieved through institutional changes with close cooperation between the management agency and the farmer organization.
c. Agronomic practices improvement
Application of organic matter is necessary to prevent the capillary rise in the area. During the off-season, fields should be kept under salt and drought tolerant crops such as sunflower, minor milletsetc. as plant cover retards salinization.
d. Farmer participation
Drainage is to be managed up to the outlet. Hence, it is important to get cooperation among farmers to manage it. Decisions on drainage canal development should be done with full consultation and cooperation of the farmers. Farmers should agree with land losses, and share in the construction labor and the operations and management. Local practices used by farmers to reduce the adverse effect of salt in established irrigated areas should be considered. In this regard, farmer organizations would be useful instruments to achieve this common goal. Participation in salinity control activities could be encouraged through subsidies, and farmer education and training.
2. Monitoring
Continuous monitoring of soil and water salinity in the field and drainage area is important to prevent the build-up of salinity in the long run. This will require strengthening of statistical reporting and soil testing by the authorities.
Limitations and Future Research Needs
The role of institutions in soil salinity control activity was not investigated. Research regarding the role of institutions in salinity control is needed.
More technically sound data are needed to establish statistically sound relationships among soil salinity, water table depth and rice yield. A continuous monitoring of data on the changes in hydro-physical, chemical, and fertility status of the soil is needed for the said analysis.
Further efforts are needed to improve this study on the effect of salinity on rice production along with investigations on N, P, K availability and SAR (Sodium Adsorption Rate). This knowledge is important to recommend fertilizer applications and the appropriate method to control soil salinity.
Forestation of canals and reserve lands:
There is considerable scope for growing trees and shrubs to deplete the groundwater table and
5/15/03 12:21 PMAn Economic Analysis of Salinity Problems in the Mahaweli River System H Irrigation Scheme in Sri Lanka
Page 32 of 39http://203.116.43.77/publications/research1/ACF1D9.html

reduce the salt problem under irrigated conditions. Biological drainage using salt tolerant and fast growing tree species is less expensive and people-centered than a capital-intensive technological solution.
Farmers may justify tree planting on economic grounds. Therefore, income-generating trees such as banana, mango and fast growing fuelwood species like and could be planted in tank bunds, canal areas and in other vacant irrigated areas. Research is needed to select the suitable plant species which will lower the water table.
Eucalyptis, Ipil Ipil, Casuarina
* The authors acknowledge the research grant provided by EEPSEA and appreciate the suggestions and advice provided by Dr. Herminia Francisco and Dr. David Glover of EEPSEA. The authors would also like to thank Dr. Mohan Munasinghe, Prof.T. Jogaratnam, Mr. K. Pathmanathan, and Mr.Neil Bandara of the Mahaweli Authority of Sri Lanka. The authors take full responsibility for the material contained in this paper. Salinization can occur naturally due to capillary action which is referred to as primary salinity and as result of human activities
such as use of drainage water for irrigation which is referred as secondary salinization.
1
Back Bethma cultivation is a traditional way of sharing irrigable lands among the settlers during the dry period. Under this system
two or three farmers share one farmer’s land in the head end and irrigate only 1⁄2 or 1/3 of the total command area during the Yala (dry) season.
2
Back The major rainy (wet) season (Oct. - Jan.) referred as Maha and the minor which receives less rainfall (dry) season (Apr. -
Aug.) referred as Yala
3
Back Alkali soil: a soil with a pH value of > 7.0; Sodic soils: a non-saline soil that has a deteriorated structure due to the absorption
of Na ions rather than Ca ions.
4
Back
REFERENCES
Amerasekera, N. 1992. Environmental Consequences of Major Irrigation Development in Sri Lanka; A Preliminary Assessment. In Water International.
Bisaliah, S. 1977. Decomposition of Output Change Under New Production Technology in Wheat Farming, Some Implications to Return on Research Investment. Indian Journal of Agricultural Economics. 32(3).
Dhuruvasangary, S. 1983. Assessment of Drainage Effects in the Mahaweli Area. M.Phil Thesis. PGIA, University of Peradeniya, Sri Lanka.
FAO/UNESCO. 1992. Irrigation, Drainage and Salinity. Rome: FAO.
Gangodawila, C. D. 1988. Environmental Degradation and Socio- Economic Impact Under Major Irrigation Development Programmes in Sri Lanka - A Review Proc. of 5 ISCO Vol. I, Bangkok, Thailand.th
Gunawardena, E. R. N., A. Jeyabalasinkham and C. S. Atputhanathan. 1990. The Use of Interceptor Drainage Technique in Alleviating Waterlogging in Irrigation System. Irrigation and Water Resources. Proceedings of a Symposium, Faculty of Agriculture, University of Peradeniya, Sri Lanka, pp. 123-138.
In
Gunarwardena, H. Desarathna. 1992. Use of Chemical Analysis in the Detection of Problem in Large Scale Irrigation. Journal of National Science. Council of Sri Lanka.
5/15/03 12:21 PMAn Economic Analysis of Salinity Problems in the Mahaweli River System H Irrigation Scheme in Sri Lanka
Page 33 of 39http://203.116.43.77/publications/research1/ACF1D9.html

Handawala, J. 1983. Occurrence of Saline and Alkaline Soils in Dry Zone of Sri Lanka, Department of Agriculture Report.
Herath, H.M.G. 1985. Economics of Salinity Control in Sri Lanka: Some Exploratory Results. Paper submitted for publication in Agricultural Administration.
Hussain, R. Z. and R. A. Young. 1985. Estimates of the Economic Value of Productivity of Irrigation Water in Pakistan from Farm Survey. Water Resources Bulletin. 21(6).
Joshi, P. K. and Dayanantha Jha. 1992. An Economic Inquiry Into the Impact of Soil Alkalinity and Waterlogging. Indian Journal of Agricultural Economics. 47(2).
Joshi, P. K. 1987. Effect of Surface Irrigation on Land Degradation- Problems and Strategies. Indian Journal of Agricultural Economics. 42 (3).
Joshi, P. K., T. N. K. Yogi, and M. Svendsen. 1994. Measuring Crop Damage Due to Salinity. Research Study of an ICAR-IFPRI Collaborative Project.
Kandaragama, K. M. A and K. D. S. Joseph. 1994. Land Degradation: A Threat to Agricultural Production in the Dry Zone - Part II. Chemical Degradation. Workshop on Soil Quality Assessment of Degradation and Restoration, Sri Lanka Foundation Institute, Colombo, 23-25 March 1994.
Maas, E. V. and G. J. Hoffman. 1977. Crop Salt Tolerance: Current Assessment. Proceedings of the International Conference on Management of Saline Water for Irrigation, Lubbock, Texas, Texas Tech. University.
Mahaweli Gaga Development Project. 1973. Feasibility Study, Stage II. Vol. III, Land Classification.
Moore, C. V., J. H. Snyder and P. C. Sun. 1974. Effects of Colorado River Water Quality and Supply on Irrigated Agriculture. Water Resource Research. No.10, pp. 137-144.
Moormann, F. R and N. Van Breedman. 1978. Soils and Land Properties that Affect the Growth of Rice. Los Baños, Philippines: IRRI. pp. 121-121.
Oyarzabad, F. and R. P. Young. 1978. International External Diseconomics: The Colorado River Salinity Problem in Mexico. Natural Resource Journal. No.18, pp. 77-78.
Panabokke, C.R.A 1958. A Pdiological Study of Dry Zone Soils. Tropical Agriculturist. Vol. CXIV, pp. 151-174.
Pearce, D.W., J. Warford. 1994. World Without End, Economics Environment and Sustainable Development. USA: Oxford University Press.
Pearson, G.A. and A. D. Ayres. 1960. Rice as a Crop of Salt Affected. Soil in Process and Reclamation. USDA Prod. Research Report.
Pincock, M.G. 1969. Assessing Impact of Declining Water Quality on Gross Value of Agriculture: A Case Study. Water Resource Research. 5(1): 1-12.
Ponnamperuma, F. N. and H. K. Bandyopodhya. 1980. Soil Salinity as a Constraint on Food Production in the Humid Tropics. In Priorities for Alleviating Soil Related Constraints to Food Production in the Tropics. Los
5/15/03 12:21 PMAn Economic Analysis of Salinity Problems in the Mahaweli River System H Irrigation Scheme in Sri Lanka
Page 34 of 39http://203.116.43.77/publications/research1/ACF1D9.html

Baños: IRRI, pp.203-16.
Reeve, R.C. and M. Fireman. 1967. Salt Problems in Relation to Agriculture. pp. 988-1008. In Irrigation of Agricultural Lands. R. M. Hagan, H. R. Haise and T. W. Edminster (Eds.) Madison: Am. Soc. Agron.
Sharma. P. B. S. and V.V. Rao. 1997. Evaluation of an Irrigation Water management Scheme: A Case Study. Agricultural Water Management.
Sikurajapathy, K. S.N.Jayawardena and M.A.Roonge. 1983. Survey of Suspected Salt Affected Soil in Paddy Lands in System H. A Report, Mahaweli Authority.
Sumanaratne, N. and P. Abegunawardena. 1993. An Economic Evaluation of the Salinity Problem in Inginimitiya Irrigation Project. In Maintenance and Operation of Irrigation/Drainage Schemes for Improved Performance, Paper presented to the Asian Regional Symposium, Beijing, Peoples Rep. of China, 24-27 May 1993.
TAMS/USAID. 1980. Environmental Assessment of Accelerated Mahaweli Development Programme. Vol.1. New York, USA.
United Nations. 1997. Guideline on Water and Sustainable Development: Principles and Policy Options. Water Resources Services, No 77.
Wijesekeras, R. 1981. The Determination of Salinity in Mahaweli Area. B.Sc. Dissertation, Faculty of Agriculture, University of Peradeniya, Sri Lanka.
Yaron, D. 1985. Economic Aspects of Irrigation with Saline Water. In Irrigation Water Management Countries Current Issues and Approaches. R. K. Sampath and K. C. Nobe (Eds.). Boulder, Colorado: Washington Press.
Yaron, D. and A. Olian. 1973. Economic Evaluation of Water Quality in Irrigation. American Journal of Agricultural Economics. 55(3):467-476.
APPENDICES
Appendix Table 1. Electrical conductivity (saturated mixture E.C dS/m) of tested soil samples in the Nochchiyagama Block
Identification No.
E.C dS/m
(Saturated Extract)
Interpretation pH Interpretation
Unit 418-415
T6 B.49, 59 2.92 Moderate 7.39 Normal
T5 B.61,64 4.68 Moderate 6.57 Normal
5/15/03 12:21 PMAn Economic Analysis of Salinity Problems in the Mahaweli River System H Irrigation Scheme in Sri Lanka
Page 35 of 39http://203.116.43.77/publications/research1/ACF1D9.html

T5 B.l77 3.38 Moderate 8.91 Sodic
T11.B 91 1.89 Low 7.90 Normal
T12. B.l1,12 7.56 High 8.06 Saline
T13. B.96, 97, 107 2.07 Moderately 7.32 Normal
T14. B.134, 135, 136 3.07 Moderate 8.73 Sodic
T.15 B.14, 146 0.51 Low 7.38 Normal
T.19 B.169 1.26 Low 7.41 Normal
T.20 B.180, 181 4.49 Moderate 7.50 Saline
T.23 B.183, 202 13.5 High 8.50 Sodic
T31B 285, 296 13.0 High 8.01 Saline
T42 B379, 380, 383 3.66 Moderate 7.50 Normal
T49 B451, 448, 450 5.12 Moderate 8.34 Saline
T.50.B 469, 446, 468 13.9 High 7.92 Saline
T67 4.03 Moderate 8.42 Saline
Unit 413-414
T11 B105 , T25 B 240 3.62 Moderate 8.42 Saline
T 41.B.501, 57, 45, T48, B503 3.14 Moderate 8.42 Saline
Unit412
T1. B.7 11,12,14,52
T2. B.21,28
T3. B 30
T4. B.45,52
T5. B 60,61
T11. B.140
T12. B.16,145
T14. B. 121,191
2.29
1.93
4.50
0.72
2.79
3.64
2.50
3.23
0.62
1.24
Moderate
Moderate Moderate
Moderate
Moderate
Moderate
Moderate
Moderate
Low
Low
6.82
6.40
6.70
6.72
6.52
6.92
7.20
7.40
6.62
6.66
Normal
Acidic
Normal
Normal
Normal
Normal
Normal
Normal
Normal
Normal
5/15/03 12:21 PMAn Economic Analysis of Salinity Problems in the Mahaweli River System H Irrigation Scheme in Sri Lanka
Page 36 of 39http://203.116.43.77/publications/research1/ACF1D9.html

T15 B116,183,187,191,
T16. B.117,148,157
T27. B324
T34. B.394,400
T51.,B.564,
T67.727,728,732
T70.B766,762
1.34
1.34
8.37
5.10
0.71
Low
Low
High
Moderate
Low
7.02
7.02
9.53
6.50
6.55
Normal
Normal
Highly Sodic
Normal
Normal
Unit 417
T3,B,27
T6 B,73,91
T8 B91, 65
T9 B100,107,108
T15,B,159,163
T16,B170,172,175
T21,B,192
T22, B194,201
T25,B218,217
T36 B.338,349,350,352,353,364,371
T39 B104,394,401,402
T59, B644
T10, B256
4.21
1.24
3.95
4.09
3.04
3.20
7.59
1.59
5.91
4.43
10.6
1.54
7.42
Moderate
Low
Moderate Moderate Moderate Moderate
Moderate
Low
Moderate
Moderate
Highly Saline
Low
8.93
7.10
8.03
8.48
7.00
7.80
7.13
6.89
8.88
8.27
7.26
6.85
8.81
Sodic
Normal
Saline
Highly Saline
Normal
Saline
Normal
Normal
Sodic
Saline
Normal
Normal
Sodic
Appendix Table 2. Electrical conductivity (saturated mixture EC dS/m) of tested soil samples in the Madatugama block
E.C dS/cm
5/15/03 12:21 PMAn Economic Analysis of Salinity Problems in the Mahaweli River System H Irrigation Scheme in Sri Lanka
Page 37 of 39http://203.116.43.77/publications/research1/ACF1D9.html

Identification (Saturated Extract)
Interpretation PH Interpretation
RB: Unit Kandalama
Track No.15. Block 740, 742,
743, 746
1.93 Low 7.04 Normal
RB unit 102
T.14 B,144,148,149,150A
T.15.B,!50,160
0.85
2.41
Low
Moderate
6.12
7.01
Acidic
Normal
RB. Unit 103
T.1.B.2,4,5,6,10
T. 9 B. 48, 83, 89,91
T.14. B.204,208
T.31.B.390,391,392
T.33.B.418,420,421
T.38.B.470,474,478
T.37.B.460,469
T.40. B. 500,501, 505, 507
T.62.B.769,771,772,776,791
T.65.B.800,801
T.T.B.T
3.49
3.75
3.07
7.32
2.29
1.02
2.65
6.89
4.73
10.37
0.52
Moderate
Moderate
Moderate
High
Low
Low
Moderate
Moderate
Moderate
High
Low
7.14
7.30
6.50
8.68
8.33
8.20
8.33
7.24
8.68
9.06
6.11
Normal
Normal
Normal
Sodic
Sodic
Sodic
Sodic
Normal
Sodic
Highly Sodic
Acidic
RB Unit 104
T.12.B.143,146
T.17.B.94
T.19.B.214,215
2.00
2.10
2.15
2.90
Low
Moderate
Moderate
Moderate
7.49
7.40
7.66
8.40
Saline
Normal
Saline
5/15/03 12:21 PMAn Economic Analysis of Salinity Problems in the Mahaweli River System H Irrigation Scheme in Sri Lanka
Page 38 of 39http://203.116.43.77/publications/research1/ACF1D9.html

T.45.B.563,566,567
LB Unit 201
T.1.B.1,2,4,5
T.14.B.202204
T.32.B.446,447,448,449
5.70
2.47
5.45
Moderate
Moderate
Moderate
7.18
7.11
7.99
Normal
Normal
Highly Saline
LB Unit 204
T.1.B.1,7
T.3.B.42
T.7.B.101,108,109
T.23.B.293,298,375,378
B.310
T.25.B.348,360
T.29.B.374.376,377
T.40.B.221,319,332
1.10
3.58
4.12
0.33
4.86
2.73
3.72
7.16
Low
Moderate
Moderate
Low
Moderate
Low
Moderate
High
7.82
7.33
4.30
6.83
7.33
7.50
7.90
7.70
Saline
Normal
Highly Acidic
Normal
Normal
Saline
Highly Saline
Highly Saline
Copyright 1997 © International Development Research Centre, Ottawa, Canada | 11 July [email protected]
5/15/03 12:21 PMAn Economic Analysis of Salinity Problems in the Mahaweli River System H Irrigation Scheme in Sri Lanka
Page 39 of 39http://203.116.43.77/publications/research1/ACF1D9.html