an economic analysis of alternative milk packaging
TRANSCRIPT

File Co n '' ' V
An Economic Analysis of Alternative Milk Packaging Containers in Washington, Oregon, and California
Circular of Information 663 June, 1977
Agricultural Experiment Station Oregon State University, Corvallis

AUTHORS
Carl W. O'Connor is an assistant professor in the Department of Agricultural and Resource Economics, Oregon State University, Corvallis. D. Kenneth Ford was a research assistant at the time of this study.
This research was supported, in part, by a grant from the Paperboard Packaging Council, and from the Oregon Agricultural Experiment Station. The authors wish to thank Manning Becker and Grant Blanch for comments on earlier drafts of the paper.

CONTENTS
SUMMARY AND CONCLUSIONS 1
INTRODUCTION 3
Scope of the Study 4
Market Structure and the Relative Importance of Alternative Milk Packaging Containers 4
Sample Size and Stratification 7
A DESCRIPTION OF COSTS 10
Raw Product, Processing, General Plant, and Delivery Expense 10
Raw Product Cost 11
Processing Expense 11
General Plant Expense 12
Delivery Expense 13
ANALYTICAL RESULTS 15
Estimates of Average Unit Costs 15
Processing and Packaging Expense 15
Average Total Processing and Packaging Expense 15
Average Total Dock Costs 18
Summary of Survey Findings 19
BIBLIOGRAPHY 22
APPENDIX A 23
APPENDIX B 24

SUMMARY AND CONCLUSIONS
The fluid milk processing industry faces a problem arising from demands
of consumers and environmentalists. Consumers want an inexpensive, high
quality milk product in a convenient package, based on varying family
needs. Environmental groups are concerned about the best container for
packaging milk when the capacity of solid waste disposal systems, environ-
mental quality, and natural resource utilization are considered. For
industry and government policymakers, the problem is to evaluate the
current technological efficiencies of each system, the relative economic
costs of each system, and the consumers' preference for convenience, with-
out reducing the overall welfare of consumers.
The purpose of this study is to provide information to industry and
government policymakers facing the problem outlined above by delineating,
estimating, and comparing the relative cost of processing, packaging, and
delivering Class I fluid milk in five packaging systems. The five systems
are: (1) paper, (2) returnable rigid plastic, (3) disposable blow-mold
plastic, (4) plastic pouch, and (5) glass.
The study is based on a non-random stratified sample of 28 firms in
Washington, Oregon, and California. The industry structure characteristics
of the number and size of firms, based on volume of Class I milk processed,
and the relative importance of each type of container were used in strati-
fying the sample.
In this study, the specific cost categories analyzed are: (1) raw
product, (2) processing, (3) direct packaging expense, which includes direct
packaging labor and the cost of the container, (4) general plant expenses,
and (5) total unit dock costs, which are simply the summation of the costs
listed above. In addition, the cost of delivery was estimated for each firm.
However, delivery costs varied to such a degree because of the size of the
marketing area, density of the population in the marketing area, and the
system of distribution, that an average would become more misleading than
-1-

helpful in a comparative analysis. Therefore, the delivery data for plants
in this sample could not be analyzed to identify differences from type and
size of containers delivered. Relative delivery costs by type and size of
container are presented for plants in California, based on supplemental
data from the California Department of Agriculture.
A cost accounting technique was employed to weight the costs of
processing and packaging the fluid milk products. Costs were identified
by departments or functions to reflect the various production or handling
stages. Then the appropriate categories were combined for each type of
fluid milk container to ascertain average unit costs.
The analytical results of the study show that the average total dock
cost for whole milk in all sizes of paper containers and gallon in-plant
blow-mold plastic containers declines as the volume of fluid milk processed
by a firm increases. These economies of size arise from the consistent
decline in total processing and packaging costs and general plant expenses
as the firms become larger.
In addition, the effects of container type and container size are
analyzed relative to each cost component. Even with large variation in
some cost categories by container type, there appears to be little difference
in the average total dock cost among the returnable rigid plastic, paper,
in-plant blow-mold plastic, and plastic pouch containers. Half gallon
glass containers have a higher total dock cost than paper, for a comparable
plant size.
Paper is the only type of container with multiple container size in
this study. The half gallon container has the lowest total dock costs,
and gallons, quarts, and half pints have a higher cost.
-2-

INTRODUCTION
The fluid milk processing industry has undergone rapid technological
change during the last 20 years with respect to fluid milk packaging.
The once dominant glass bottle has been replaced by several alternative
packages: paper containers, returnable rigid plastic containers, disposable
blow-mold plastic containers, and the plastic pouch. These container
systems were initially developed to fulfill several needs of the milk
processing industry: consumer preference for convenience, product differ-
entiation (a marketing tool often times used in a highly competitive
market), and potentially lower unit costs of packaging and distribution.
Today, the milk processing industry is being confronted with new
demands. The consumer is still demanding a relatively inexpensive, con-
venient product of high quality which meets state and federal health and
safety regulations. At the same time, individuals and private and public
institutions are voicing growing concern about solid waste management and
environmental and natural resource utilization with respect to alternative
raw materials used for packaging milk. However, before public policymakers,
health officials, and industry representatives can adequately address these
problems, basic data are required concerning the safety, toxicology, and/or
contamination potential for all milk containers. In addition, the relative
processing, packaging, and delivery cost structure of representative firms
using various containers must be recognized. Given adequate and necessary
data, a socio-economic study evaluating the comparative economic and
environmental impacts of alternative packaging containers can be made.
The purpose of this study is to delineate, estimate, and compare
typical costs of milk processors to process, package, and deliver milk to
the point of the final sale through five containers: (1) refillable glass
bottle, (2) returnable rigid plastic bottle, (3) paper carton, (4) disposable
blow-mold plastic bottle, and (5) plastic pouch. The research procedure
involved identifying and surveying fluid milk processing plants utilizing
these various packaging systems, and then analyzing the data obtained to
-3-

provide comparable budget summaries for each system, given its size,
measured in volume of Class I fluid milk processed.
Scope of the Study
This study pertains to milk processing plants in Washington, Oregon,
and California. In particular, the costs of processing, packaging, and
delivering Class I milk are identified. Class I milk is comprised basically
of fluid whole milk, fluid low fat, half and half, and fluid skim. The
study concentrates on the relative costs of processing, packaging, and
distributing Class I milk for the five identified milk packaging containers.
Since the costs associated with each Class I product are constant relative
to each other, only the costs of whole milk are presented in the study.
i
Market Structure and the Relative Importance of Alternative Milk Packaging Containers
The market structure of processor-distribution fluid bottling plants
in the three western states and the United States can best be characterized
as changing to fewer but larger bottling plants. The total number of fluid
milk plants in the United States and in Oregon and California has decreased
steadily since 1950 (Table 1). This long-time trend has accelerated since
1965 with the number of fluid milk bottling plants in the United States
decreasing more than 58 percent.
A USDA report shows that from 1964 to 1971, the number of plants
operated by local proprietary firms, cooperatives, and national and regional
firms decreased [7]. The only category showing an increase was integrated
supermarket plants, which increased 36 percent during this time. In 1970,
integrated supermarkets accounted for 8.2 percent of sales of fluid milk
products in the United States.
However, the importance of integrated supermarket plants varies sub-
stantially among regions. In 1970, the greatest concentration was in
California, where 22 percent of the State's total milk sales was from
integrated supermarket plants [7]. That percentage grew to 29 percent by
-4-

Table 1. Number of Processor-Distributor Fluid Milk Bottling Plants in the United States, Oregon, and California, December 1950 to 1975
a/ hi c/ United States— Oregon— California—
% decrease % decrease % decrease from the from the from the previous previous previous
December Number period Number period Number period
1950 8,195 - 131 - 693 1955 6,726 17.9 95 27.5 616 11.1 1960 5,328 20.8 65 31.6 581 5.7 1965 3,743 29.8 63 3.1 561 3.4 1970 2,216 40.8 53 15.9 394 29.8 1975 1,552 30.0 36 32.1 177 55.1
— Alden C. Manchester. Market Structure, Institutions, and Per- formance in the Fluid Milk Industry, Agricultural Economics Report No. 248, Economic Research Service, USDA, January 1974, 40 pp.; and telephone interview, October 20, 1976.
— Oregon Department of Agriculture. c/ — California Crop and Livestock Reporting Service.
1973 [1]. In Oregon and Washington, integrated supermarket plants accounted
for 18 percent of the states' total fluid milk sales in 1975.
In general, the decline in the total number of processor-distributor
fluid milk plants resulted from the closures of smaller plants. For a
group of comparable federal order and state markets, the total number of
plants decreased 36 percent between 1965 and 1970 (Table 2). The number
of plants selling less than 4 million pounds of fluid milk per month
decreased, while plants handling more than 4 million pounds per month
increased in number.
The size distribution of fluid milk plants for the three states in
this study is also presented in Table 2. A comparison of the size distri-
bution in 1975 with previous years is not possible. However, industry
sources believe that changes similar to those described for the U.S. —
an increase in the number of large size plants and a decrease in the smaller
plants — apply in general to the West Coast.
-5-

Table 2. Size Distribution of Fluid Milk Plants, Comparable Federal Order a/ and State Markets, United States, 1965 and 1970, and West Coast,—'
1975
Monthly plant volume of Class I fluid milk U.S. plants^
1965 1970 Percent change 1965 to 1970
c/ West Coastr-
plants 1975 Group Million pounds
I II
III IV
less than 2 2 to 4 4 to 9
more than 9
kL
1,916 230 168 52
1,052 190 203 68
-45.09 -17.39 +20.83 +30.77
160 33 12 17
TOTi ... 2,366 1,513 >-36.05 222
a/ — West Coast states are Washington, Oregon, and California. SOURCE:
— Alden C. Manchester. Market Structure, Institutions, and Performance in the Fluid Milk Industry, Agricultural Economic Report No. 248, Economic Research Service, USDA, January 1974, 40 pp.
c/ — Milk Market Administrators, Oregon, Washington, and California.
Other changes in the structure of the fluid milk processing industry
can be identified. The most important of these are in the product, service,
or container. The introduction and high acceptance of low-fat milk have
changed the plants' product mix. Some integrated plants process and package
only four or five fluid products in a limited number and size of containers.
Processing plants, in general, have decreased the reliance on retail home
delivery, moving increasingly to limited wholesale delivery to institutions
and stores, and even to dock sales to independent sub-distributors. The
result has been an expansion of a plant's market boundaries. Prior to
1950, few plants distributed milk more than 50 miles. Now, distribution
of 100 to 200 miles is common, and in some areas of the West, milk moves
up to 500 miles. The number of milk plants located in any given market
area has declined sharply; the number of competitors in a market area has
declined much less.
A consideration associated with changes in the structure of the fluid
milk processing industry is the cost effect. Prior studies have shown that
-6-

processing raw milk into a packaged fluid milk product is subject to economies
of size [4,7]. There were large economies to be gained by processing at
least 2 million pounds per month. Economies continued to occur beyond this
volume, but at a rapidly diminishing rate.
The percentage of total fluid milk processed during one month of 1975
by size and type of container in Oregon and Washington is shown in Table 3.
Paper is shown to be the predominant container, with 86.5 percent of the
fluid milk being packaged in various sizes of that container. Two different
plastic packages are summarized under the plastic category: milk packaged
in returnable rigid plastic gallon and half-gallon containers which account
for the majority of the 7.6 percent of sales, and milk packaged in gallon
disposable plastic pouches. Institutional sales in plastic dispensing
containers (bag-in-box) account for 3.4 percent of fluid milk sales. Glass,
the least important container category, accounted for only 1.7 percent of
fluid milk sold in November 1975.
The distribution of fluid milk by container type and size for California
plants is presented in Table 4. Several differences are apparent when the
California data are compared with data for Oregon and Washington (Tables 3
and 4). Less fluid milk is packaged in paper containers in California than
in Oregon and Washington. Secondly, a relatively larger proportion of fluid
milk is sold in disposable blow-mold plastic gallon containers in California,
amounting to 20 percent of the fluid milk sales. Milk plants in California
package a larger percent of their fluid milk in half-gallon paper containers
than plants in Oregon and Washington, 54.2 and 31.8 percent, respectively.
Sample Size and Stratification
Given the structural characteristics of the fluid milk processing
industry in the three western states, and the relative importance of each
size and type of packaging container, a stratified sample based on the
size of the processing plant and type of packaging container was used in
this study. A non-random stratified sample of 28 firms was established,
with some firms using two types of containers. For example, a processing
-7-

Table 3. Percent of Fluid Milk by Container Type and Size in Washington and Oregon, November 1975
Type of container , Plastic
a/ Container size Paper Plastic— lined box Glass Total percent of fluid milk sales
Larger than gallons - - 3.4 - 3.4 Gallons 38.9 5.0 - .2 44.1 Half-gallons 31.8 1.8 - 1.3 34.9 Quarts 6.4 .3 - .1 6.8 Less than quarts 9.4 .5^ - .1 10.0
TOTAL-/ 86.5 7.6 3.4 1.7 99.2
— This group is primarily composed of rigid returnable plastic containers, however, some disposable plastic pouch containers are included.
—0.8 percent of total fluid milk sales was in other containers, (i.e., 10-gallon cans).
SOURCE: Detail Summary of Size and Type of Containers and Method of Distri- bution, Oregon-Washington, Inland Empire, and Puget Sound, Market Area, Federal Milk Market Administrator, Portland, Oregon, November 1975.
Table 4. Percent of Fluid Milk by Container Type and Size in California, October 1975
Type of container Blow mold Plastic
Container size Paper plastic lined box Glass Total percent of fluid milk salesr
Larger than gallon - - 3.8 - 3.8 Gallons 0.4 20.0 - a/ 20.4 Half-gallons 54.2 3.1 - 2.3 59.6 Quarts 5.8 0.1 - 0.4 6.3 Less than quarts 9.9 - - - 9.9
TOTAL 70.3 23.2 3.8 2.7 100.0
— Less than 0.05 percent.
SOURCE: Dairy Information, California Crop and Livestock Reporting Service, Sacramento, California, February 11, 1976, 11 pp.
-8-

plant may use the disposable blow-mold plastic container for gallon fluid
milk, and paper containers for all other packaged milk.
The number of plants used in computing average unit costs for each
relevant category in the sample, by size and type of container, is pre-
sented in Table 5. Firms were grouped into each category so relative
cost comparisons could be made. Some plants included in Group II were
not assigned to other size classes to avoid disclosure of confidentiality.
Table 5. Number of Class I Milk Processing Plants in the Non-Random Stratified Sample, by Size and Type of Container
Monti ily plant volume of Class I fluid milk
Type of container
Returnable Disposable Plastic rigid blow mold gallon
Group Million pounds Paper plastic plastic pouch Glass
I less than 2 2 W : W '£■' II 2-4 3 III 4-9 7 - 3 - - IV more than 9
TOTAL
12 11 -
.. 24 4 14 2 2
a/ — Plants range from 1 to 5 million pounds per month.
-9-

A DESCRIPTION OF COSTS
The data associated with the costs of processing, packaging, and
delivering Class I milk were obtained by collecting accounting records
from the sample firms for one quarter of the year. The time ranged from
the first quarter of 1973 to the first quarter of 1976. Therefore, the
data used for comparative analysis were summarized, weighted, standardized,
and averaged to permit comparisons among different accounting periods and
different accounting procedures. The California §tate Department of Food
and Agriculture's manual of auditing and costing procedures was used as a
guide to standardize each plant's costs [2]. In addition, this allowed
the use of relevant segments of a number of plant audits compiled by the
California State Department of Food and Agriculture, which had been reviewed
by each plant and published in the "Total Reasonable Necessary Unit Costs
for Fluid Milk, Low Fat, and Non Fat" reports for various marketing areas
in California.—
Raw Product, Processing, General Plant, and Delivery Expense
Raw product, processing, and packaging expenses are defined as all
expenses incurred from the time the raw milk enters the processor's holding
tank until the processed product is ready for sale at the processor's
loading dock. These cost components, which will be presented and discussed
separately for each type of container, are: (1) raw product cost, (2) pro-
cessing expense, (3) packaging labor expense, (4) container cost, and (5)
general plant expense. The importance and the problems associated with
estimating and using delivery expense for comparative analysis are discussed.
— Three reports presented at public hearings were used: (1) Southern Metropolitan Marketing Area - Zone 1, November 1974; (2) Central Coast Counties Marketing Area, August 1974; and (3) North Central Valley Marketing Area - Zone 1, November 1973.
-10-

Raw Product Cost
Raw product cost for processing plants in the three states is computed
on current raw product component costs, which take into consideration the
amount of butterfat, solids-not-fat, and fluid required for each processed
unit. The component costs vary according to the location of the plant
and the minimum price established by the stabilization and marketing plan
in effect for that particular market. In addition, the established price
is for milk delivered to the plant with a one percent allowance for plant
loss for all components.
The cost of raw product used in this study is a representative price
of Class I milk in the various marketing areas in the three western states,
which was in effect during December 1975. This price is simply used for
expository purposes. That is, the raw product cost of $10 per hundredweight
(3.5 percent test milk) is used for all the sample plants, even though the
raw product cost for Class I milk in the plants surveyed ranged from $9.35
to $10.55 per hundredweight during December 1975. This procedure allows
the study to focus on the relative costs associated with the various packaging
systems, by size of plants rather than the specific locality of a plant.
Processing Expense
The sample processor's records were analyzed and only those expenses
that were applicable to the processing of fluid milk were included. The
firm's payroll was analyzed, and with the assistance of supervisory per-
sonnel and some time studies, costs were allocated to various functions
based on the amount of time required to perform or supervise each function.
The functions, allocated on a time basis, are: receiving and tanker washing,
pasteurizing and standardizing, separating, case and carton handling, and
cold room labor.
Building and equipment expenses associated with processing were allo-
cated to various types and sizes of containers on a quart equivalency basis.
These costs include depreciation of the building and equipment used in
pasteurizing, standardizing, and separating.
-11-

Two specific processing expense categories are isolated for analysis
in this report: packaging labor expense and container cost. Packaging
labor expense is the direct labor wages and fringe benefits associated with
filling and casing fluid milk. For example, if an employee spends his
entire time filling half-gallon paper containers, his entire salary is
allocated directly to the filling schedule for half-gallon paper. Sani-
tation and cold room labor is not included in this category. The labor
expense used in this study was $8.19 per hour, which was representative of
the wage rate and fringe benefits of plants in the three western states
in 1975.
The second specific processing expense — container cost — was deter-
mined on the basis of unit costs obtained from the latest available price
quotation of the principal supplier. It included the handle or cap in the
case of plastic or glass. A one percent loss allowance was used for all
types of containers. In addition, the royalties paid for the use of auto-
matic filling machines were included in the container cost. The container
cost for returnable rigid plastic and glass containers includes the labor
necessary for washing and visually inspecting each unit. It was estimated
that, on the average, each rigid plastic container was reused 50 times,
and each glass container was reused 30 times before being replaced.
For in-plant blow-molding, the container cost includes all costs associated
with the blow-molding operation: resin, scrap loss, direct labor, utilities,
label and cap, depreciation, property taxes, interest on investment, and
maintenance. The average in-plant blow-mold gallon cost at plants where
these costs were obtained was approximately eight cents per unit.
General Plant Expense
This expense category refers to all other expenses associated with
processing Class I fluid milk in the plant. These costs include: occupancy
expense, based on a square footage basis, maintenance; professional services;
dues; real estate taxes; office expense, labor, and supplies; and general
and administrative expenses incurred in the direction and administration of
the company. All these expenses, with the exception of occupancy, are based
on a quart equivalency.
-12-

Delivery Expense
All expenses associated with the actual delivery process, once the
product left the dock of the processing plant, were allocated to the delivery
function for each plant in the sample. There was a large variation in the
delivery expense between plants and in the ratio of delivery expense to the
total cost of processing. This variation was not highly correlated with
different types of containers.
Two previous studies of delivery costs helped identify the problem
of analyzing delivery costs relative to size and type of container. Delivery
expenses are affected by characteristics of the container. However, total
delivery costs also vary substantially' by: the quantity of milk delivered
per customer stop, the size and density of the market area, the degree of
vertical integration, and the size of truck used for delivery [3,5].
The plants in this sample encompass the extremes of each of the variables
listed above: a market size and density representative of Los Angeles and
San Francisco to rather remote rural areas in Oregon and Washington, for
example. In addition, the sample was too small to stratify to account for
each combination of variables. Therefore, the delivery data for plants in
this sample could not be analyzed to identify differences caused by the
type and size of container delivered.
The California State Department of Food and Agriculture has developed
two types of modifiers to allocate distribution costs in the audits of milk
processing plants in California [2]. The labor modifier is used to deter-
mine the unit cost of delivery labor, including supervision. A case modifier
is used to determine the unit cost for all other delivery expenses, except
labor, such as truck depreciation and gas and oil expense. These two
modifiers show the relative costs of labor and other expenses in delivering 2/ different sizes and types of containers in California.— The relative
delivery costs of each size and type of container, as a percent of the
2/ — A partial listing of the wholesale and retail modifiers for various packages
is contained in Appendix A.
-13-
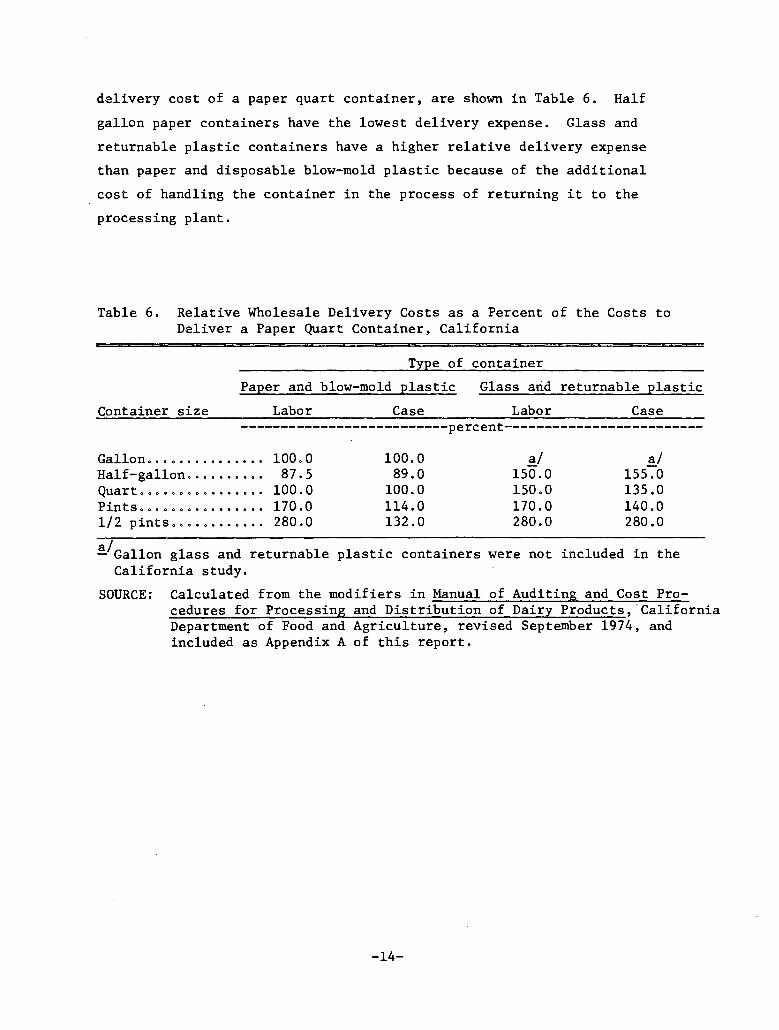
delivery cost of a paper quart container, are shown in Table 6. Half
gallon paper containers have the lowest delivery expense. Glass and
returnable plastic containers have a higher relative delivery expense
than paper and disposable blow-mold plastic because of the additional
cost of handling the container in the process of returning it to the
processing plant.
Table 6. Relative Wholesale Delivery Costs as a Percent of the Costs to Deliver a Paper Quart Container, California
Type of container
Paper and blow-mold plastic Glass and returnable plastic
Container size Labor Case Labor Case percent
Gallon 100.0 100.0 a/ a/ Half-gallon 87.5 89.0 150.0 155.0 Quart...... 100.0 100.0 150.0 135.0 Pints..... 170.0 114.0 170.0 140.0 1/2 pints 280.0 132.0 280.0 280.0
— Gallon glass and returnable plastic containers were not included in the California study.
SOURCE: Calculated from the modifiers in Manual of Auditing and Cost Pro- cedures for Processing and Distribution of Dairy Products, California Department of Food and Agriculture, revised September 1974, and included as Appendix A of this report.
-14-

ANALYTICAL RESULTS
Estimates of Average Unit Costs
This analysis of costs utilizes a cost accounting technique which
defines each cost category in the same manner as described in the previous
chapter. The volume of each product handled during the corresponding time
the costs of each plant were obtained also was recorded. Using a "quart
equivalent" as a standard unit or common denominator, the costs were allo-
cated by departments or functions to reflect the relative importance of
each product by size and type of container to total volume of product
handled and cost of operation. Then the appropriate categories were com-
bined for each packaged product to represent an average weighted unit cost
at the final production stage (total dock costs). These average unit costs,
by type and size of container and plant size, are presented in Appendix B.
Processing and Packaging Expense
The unit costs,, by container type and size, serve as the basis for
analysis. However, the use of unit costs requires constant conversion
between container sizes. This problem can be alleviated by converting the
unit costs to a standard of 100 pounds of 3.5 percent milk. This procedure
is utilized in the following analysis.
Average Total Processing and Packaging Expense
Three factors can be isolated to identify differences with respect to
average total processing and packaging costs: plant size, type of container,
and size of container. From Table 7, it is apparent that economies of
plant size, with respect to average total processing and packaging expenses,
are prevalent for both paper and in-plant blow-mold plastic containers.
For example, for paper half-gallon containers, the average total processing
and packaging costs for plants processing more than 9 million pounds of
Class I fluid milk per month are 22.07 percent less than plants processing
less than 2 million pounds per month. For firms with in-plant blow-mold
-15-
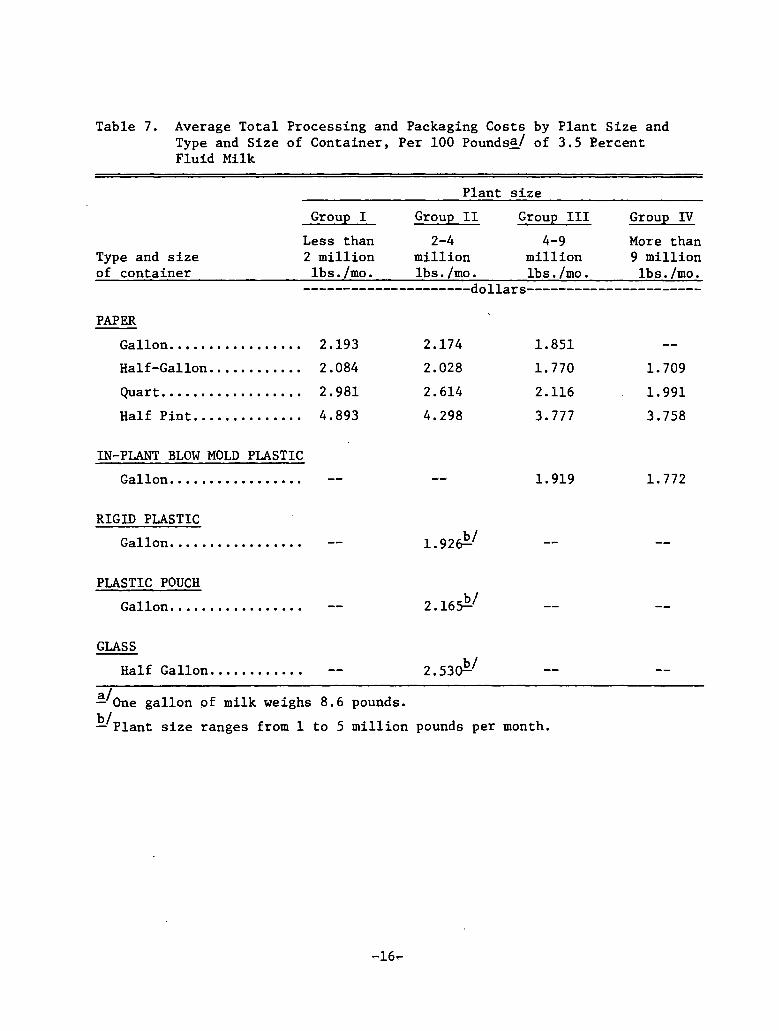
Table 7. Average Total Processing and Packaging Costs by Plant Size and Type and Size of Container, Per 100 Pounds^/ of 3.5 Percent Fluid Milk
Plant size
Group I Group II Group III Group IV
Less than 2-4 4-9 More than Type and size 2 million million million 9 million of container lbs./mo. lbs. /mo. lbs./mo. lbs./mo. dollars
PAPER
Gallon 2.193 2.174 1.851
Half-Gallon 2.084 2.028 1.770 1.709
Quart 2.981 2.614 2.116 1.991
Half Pint 4.893 4.298 3.777 3.758
IN-PLANT BLOW MOLD PLASTIC
Gallon — — 1.919 1.772
RIGID PLASTIC
Gallon — 1.926^
PLASTIC POUCH
Gallon -- 2.165^
GLASS
Half Gallon — 2.53(£/
— One gallon of milk weighs 8.6 pounds.
— Plant size ranges from 1 to 5 million pounds per month.
-16-

containers, the average total processing and packaging costs decreased by
7.66 percent for plants processing more than 9 million pounds per month,
relative to plants processing 4 to 9 million pounds per month.
Because of the effect of plant and container size on costs, differences
in the total processing and packaging expense (due to the type of container)
can be analyzed only for identical containers within each given size of
plant. For example, if the gallon paper container is used as a standard
of comparison, the relative average costs of returnable rigid plastic and
plastic pouch containers can be compared for plants processing 2 to 4 million
pounds of Class I milk per month. The average total processing and packaging
costs of rigid plastic containers are 11 percent less than paper, the same
costs for the plastic pouch containers are practically identical to paper.
The cost of packaging 100 pounds of milk in half-gallon glass containers
is 25 percent more than packaging the same quantity of milk in half-gallon
paper.
The packaging expense results for the returnable rigid plastic and
glass containers are based on the average number of trips for returnable
plastic and glass of 50 and 30 times, respectively. However, it was observed
that the number of trips for the returnable rigid plastic container ranged
from a low of 35 to a high of 100 trips. The extremes of this variation
in number of trips raise or lower the cost of the plastic container by
approximately one-half cent per container. On the other hand, the life
of a glass container ranges from 20 to 50 trips before being replaced, and
this variation raises or lowers the cost of the glass container by approxi-
mately one cent per container.
The average total processing and packaging costs for in-plant blow-mold
plastic containers also can be compared to the gallon paper container costs.
For plants processing 4 to 9 million pounds per month, the average costs
for in-plant blow-mold plastic containers are 3.70 percent more than paper.
The size of the container also affects the average total processing
and packaging expenses. Paper is the only type of container with multiple
sizes. The half-gallon container has the lowest average cost for all plant
-17-

sizes. Using plants processing 2 to 4 million pounds per month as an
example, the effects of container size can be shown. Total processing
and packaging expenses for gallon containers are 6.72 percent more than
half gallons, and quarts and half pints are 22.42 and 52.81 percent more
than half gallons, respectively.
Total packaging costs — packaging labor plus the cost of the con-
tainer — also vary by plant size, type of container, and size of container.
These costs are shown in Appendix B, Table 1, and on a per hundred pound
basis, the average total packaging costs for half gallon paper containers
decrease by 3.7 percent for the largest plant size relative to the smallest.
There is a larger variation in the average total packaging costs by
type of container. Again, for plants processing 2 to 4 million pounds of
Class I milk per month, and using the gallon paper container as a standard,
the average total packaging costs for rigid plastic containers are 11.7
percent less than paper. The plastic pouch containers are practically the
same as paper; the packaging cost of half-gallon glass containers are 24.7
percent more than half-gallon paper. For firms processing 4 to 9 million
pounds per month, the total packaging costs for in-plant blow-mold gallon
containers are 3.6 percent more than paper.
There is also a large variation in the relative total cost of packaging
by size of container. For paper, the total cost of packaging the half
gallon is less than the gallon for all plant sizes except firms processing
4 to 9 million pounds per month, in which case, the gallon is 2 percent
less than the half gallon. For both gallons and quarts, the total cost of
packaging is approximately 10 to 12 percent more than the half gallon
container. The total cost of packaging half pint containers is substantially
higher, 135 percent more than half gallons.
Average Total Dock Cost
An analysis of average total dock costs yields results similar to those
found for average total processing and packaging. This could be expected,
given the fact that the raw product cost is constant, and general plant
expenses are a relatively small percent of total dock costs.
-18-

The total dock costs, on a 100-pound basis, are presented in Table 8,
and vary by plant size, type of container, and size of container. There
are economies of plant size throughout, for paper and in-plant blow-mold
containers. Again, using the half gallon paper as an example, the average
total dock cost for the largest size plants is 9 percent less than the
costs for the smallest size plants. Total dock costs for plants using
the blow-mold container declined 2 percent when the largest plant was com-
pared to the.smallest.
The total dock costs also vary by type of container. For plants
processing 2 to 4 million pounds per month, and once again using the paper
gallon as a standard, the average dock costs for the rigid plastic container
are 1.9 percent less than paper. Costs for the plastic pouch containers
are practically the same as paper. But half-gallon glass containers are
6.4 percent more than half-gallon paper containers.
For plants processing 4 to 9 million pounds of Class I milk per month,
the total dock costs of the in-plant blow-mold container are .97 percent
higher than paper.
Container size also affects total dock costs. For example, for plants
that process 2 to 4 million pounds of Class I milk per month, the total
dock cost for gallon paper containers is 1.09 percent higher than half
gallons, and quarts and half pints are 4.58 and 22.08 percent more than
half gallons, respectively.
Summary of Survey Findings
Three factors are isolated to identify differences in the average
costs of processing and packaging, and total dock costs: plant size, type
of container, and size of container. For plants using the paper and in-
plant blow-mold container, there are economies of plant size throughout
for all cost categories. Because of a small sample size, it was not possible
to isolate the effect of plant size for rigid plastic, plastic pouch, and
glass containers.
-19-

Table 8. Average Total Dock Expense by Plant Size and Type and Size of Container, Per 100 Pounds^./ of 3.5 Percent Fluid MilkW
Type and size of container
Group I
Less than 2 million lbs./mo.
Plant size
Group II
2-4 million lbs./mo.
Group III
4-9 million lbs.mo.
Group IV
More than 9 million lbs./mo.
-dollars-
PAPER
Gallon 13.621
Half Gallon 13.512
Quart 14.414
Half Pint 16.428
IN-PLANT BLOW MOLD PLASTIC
Gallon
RIGID PLASTIC
Gallon
PLASTIC POUCH
Gallon
GLASS
Half Gallon
13.034
12.893
13.484
15.740
12.792 c/
13. Ol^
13.723£/
12.401
12.316
12.656
15.088
12.521
12.230
12.502
15.051
12.242
a/ — One gallon of milk weighs 8.6 pounds.
— A raw product cost of $10 per hundredweight (Class I milk) is used for all the sample plants.
— Plant size ranges from 1 to 5 million pounds per month.
-20-

Since the cost of the raw product is a constant in this study, and
general plant expenses are a relatively small percent of total dock cost,
the variation in total dock cost is primarily explained by the relative
changes in average total processing and packaging expenses. Even though
total processing expenses for rigid plastic and plastic pouch gallon con-
tainers are higher than for paper gallon containers, lower packaging expenses
more than offset these cost disadvantages, and the gallon rigid plastic and
plastic pouch containers have a slightly lower average total dock cost than
paper. On the other hand, in-plant blow-mold plastic and glass containers
are higher than paper in all cost categories for a comparable container
and plant size.
Container size is the third effect on costs. Pap.er is the only type
of container with multiple container sizes in this study. The half gallon
container has the lowest total dock cost, with gallons, quarts, and half
pints having higher costs.
The results of this study are pertinent for fluid milk processors
on the West Coast. The sampling and analytical procedures deem using
averages, thus any given plant may have higher or lower costs than those
presented here. In addition, cost comparisons are computed up to, and
including, total dock costs. Implications of these cost comparisons should
not be extrapolated to the store or consumer level. For example, what
appears to be a cost advantage for rigid plastic or plastic pouch containers
at the processor's dock may be reduced or even eliminated if total delivery
and store handling expenses are considered. Likewise, the costs and their
analysis are based on the product mix of plants surveyed at the time of the
study. If that product mix were to change, the average costs and comparative
results also could change.
-21-

BIBLIOGRAPHY
[1] California Department of Food and Agriculture. The California Milk Marketing Program, A Special Report to the Senate Committee on Agriculture and Water Resources, May 7, 1974, 143 pp.
[2] California Department of Food and Agriculture. Manual of Auditing and Cost Procedures and Distribution of Dairy Products, revised September 1974.
[3] Christensen, Rondo A., et. al. The Cost of Wholesale Milk Distri- butors in Urban Utah, Research Report 23, Agricultural Experiment Station, Utah State University, Logan, July 1975, 37 pp.
[4] Cobia, D. W., and E. M. Babb. Determining the Optimum Size Fluid Milk Processing Plant and Sales Area, Research Bulletin No. 778, Agricultural Experiment Station, Purdue University, Lafayette, Indiana, May 1964.
[5] Courtney, Richard H., and Elton Brooks. An Analysis of Wholesale Milk Delivery Costs and Volume-Pricing Procedures in California, Research Report No. 317, Giannini Foundation, Agricultural Experi- ment Station, University of California, Berkeley, June 1972, 65 pp.
[6] Devins, Gary, et. al. Economies of Size in Large Fluid Milk Processing Plants, Research Report MP62. Agricultural Experiment Station, University of Vermont, Burlington, May 1970.
[7] Manchester, Alden C. Market Structure, Institutions, and Performance in the Fluid Milk Industry, Agricultural Economic Report No. 248, Economic Research Service, USDA, January 1974, 40 pp.
-22-

Appendix A
WHOLESALE AND RETAIL MODIFIERS FOR VARIOUS PACKAGES HANDLED BY DISTRIBUTORS WHEN 1 QUART OF MILK IN A FIBRE CONTAINER EQUALS 1 UNIT
Wholesale and retail
Units Wholesale Retail per labor labor case units units
Case modifiers General and
16 quart 20 quart 24 quart administrative case case case units
FIBRE OR PLASTIC CONTAINERS:
1 gallon (16 qt. case) 4
1 gallon (20 qt. case) 4
1 gallon (24 qt. case) 6
1/2 gallon (16 qt. case) 9
1/2 gallon (20 qt. case) 12
1/2 gallon (24 qt. case) 12
Quarts 16
Quarts 20
Quarts 24
Pints 20
Pints 25
Pints i 35
1/2 pints 24
1/2 pints 25
1/2 pints 30
1/2 pints 56
1/2 pints 70
4.00 3.40 4.00 — — 3.60
5.00 3.40 — 5.00 — 3.60
4.00 3.40 — — 4.00 3.60
1.75 1.70 1.78 — — 1.90
1.65 1.70 — 1.67 — 1.90
1.95 1.70 — — 2.00 1.90
1.00 1.00 1.00 — — 1.00
1.00 1.00 — 1.00 ~ 1.00
1.00 1.00 — — . 1.00 1.00
.85 1.50 .80 1.00 — .75
.85 1.50 .64 ~ .96 .75
.85 1.50 ~ .57 .69 .75
.70 1.40 — .83 .50
.70 1.40 — — .80 .50
.70 1.40 — — .80 .50
..70 1.40 — .36 .43 .50
.70 1.40 — .29 .34 .50
Wholesale and retail
Units per case
GLASS OR RETURNABLE PLASTIC:
1/2 gallon 6
48 ounce decanter 6
Quart 12
Pint 20
1/2 pint 20
Wholesale Retail General and labor labor Case administrative
modifiers modifiers modifiers modifiers
3.00 1.70 3.10 1.90
3.00 1.70 3.10 1.50
1.50 1.00 1.35 1.00
.85 1.50 .70 .75
.70 1.40 .70 .50
SOURCE: Manual of Auditing and Cost Procedures for Processing and Distribution of Dairy Products, California Department of Agriculture, revised September 1974.
-23-

APPENDIX B
-24-

Table 1. Paper ConLalncrs: Average Unit Expenses by Cost Category, and 1'lant and Container Size for Selected Washlntston, OreEon, and California Plants; Class I Whole Vluld Milk, 1975
Plant size
Croup I
Less than 2 million lbs./mo.
X of Cost Category Dollars Dock Cost
GALLON
Raw product 8630 73.67
Processing & Packaging Expense:
Processing expense 0896 7.65
Packaging expense:
Labor 0171 1.46
Container 0819 6.99
TOTAL PROCESSING 4 PACKAGING EXPENSE 1886 16.10
General plant expense 1198 10.23
TOTAL DOCK COST 1.1714 100.00
HALF-GALLON
Raw product 4315 74.27
Processing & Packaging Expense:
Processing expense 0449 7.73
Packaging expense:
Labor 0024 0.41
Container 0423 7.28
TOTAL PROCESSING & PACKAGING EXPENSE 0896 15.42
General plant expense 0599 10.31
TOTAL DOCK COST ■ .5810 100.00
QUARTS
Raw product 2158 69.64
Processing & Packaging Expense:
Processing expense 0389 12.55
Packaging expense:
Labor 0010 0.32
Container 0242 7.81
TOTAL PROCESSING & PACKAGING EXPENSE 0641 20.68
General plant expense 0300 9.68
TOTAL DOCK COST 3099 100.00
0 N E - H A L F PINTS
Raw product 0540 61.16
Processing & Packaging Expense:
Processing expense 0126 14.27
Packaging expense:
Labor 0010 1.13
Container 0127 14.38
TOTAL PROCESSING I, PACKAGING EXPENSE 0263 29.78
General plant expense 0080 9.06
TOTAL DOCK COST 0883 100.00
Croup II Group III Croop IV
2-4 million lbs./mo.
4-9 million lbs./mo.
More than 9 million lbs./no.
X Dollars Dock
of Cost Doll
X ars Dock
of Cost Doll
% of ars Dock Cost
.8630
.0889
.4315
.0435
.2158
.0316
.0540
.0102
76.92
7.92
.8630
.0736
80.92
6.90
.0171 1.53 .0045 0.42
.0815 7.26 .0811 7.60
.1875 16.71 .1592 14.93
.0714 6.37 .0443 4.15
1.1219 100.00 1.0665 100.00
77.83
7.85
74.44
10.90
63.83
12.06
.4315
.0326
81.48
6.16
.2158
.0210
79.31
7.72
.0540
.0076
66.58
9.37
N.A.
.4315
.0304
.2158
.0185
.0540
.0076
N.A.
82.05
5.78
0018 0.32 .0018 .0.34 .0018 0.34
0419 7.56 .0417 7.87 .0413 7.86
0872 15.73 .0761 14.37 .0735 13.98
0357 6.44 .0220 4.15 .0209 3.97
5544 100.00 .5296 100.00 .5259 100.00
80.28
6.88
0005 0.17 .0005 0.18 .0005 0.19
0241 8.31 .0240 8.82 .0238 8.85
0562 19.38 .0455 16.72 .0428 15.92
0179 6.18 .0108 3.97 .0102 1 3.80
2899 100.00 .2721 100.00 .2688 100.00
66.75
9.39
0005 0.59 .0005 0.62 .0005 0.62
0124 14.66 .0122 15.04 .0121 14.96
0231 27.31 .0203 25.03 .0202 24.97
0075 8.86 .0068 8.39 .0067 8.28
0846 100.00 .0811 100.00 .0809 100.00
-25-

Table 2. In-Plant Blow Molded Plastic Container: Average Unit Expenses by Cost Category and Plant Size for Selected California Plants; Class I Whole Fluid Milk, 1975
. Plant size
Group III Group IV
4-9 More than GALLON million 9 million
lbs. /mo. lbs./mo.
2 of % of Cost Category Dollars Dock Cost Dollars Dock Cost
Raw product 8630 80.15 .8630 81.97
Processing & Packaging Expense:
Processing expense 0749 6.95 .0638 6.06
Packaging expense:
Labor 0069 0.64 .0069 0.66
Container 0832 7.73 .0817 7.76
TOTAL PROC. & PKG. EXPENSE 1650 15.32 .1524 14.48
General Plant expense 0488 4.53 .0374 3.55
TOTAL DOCK COST 1.0768 100.00 1.0528 100.00
Table 3. Rigid Plastic Container: Average Unit Expenses by Cost Category and Plant Size for Selected Washington and Oregon Plants; Class I Whole Fluid Milk, 1975
Plant size
GALLON 1-5
■lllion lbs./mo.
Cost Category Dollars
Raw product 8630
Processing & Packaging Expense:
Processing expense.' .1119
Packaging expense:
Labor .0145
Container .0392
TOTAL PROCESSING & PACKAGING EXPENSE .1656
General plant expense 0715
TOTAL DOCK COST , 1.1001
% Of Dock Cost
78.45
10.17
1.32
3.56
15.05
6.50
100.00
-26-

Table 4. Plastic Pouch Container: Average Unit Expenses by Cost Category and Plant Size for Selected Washington and Oregon Plants; Class I Whole Fluid Milk, 1975
Plant size
GALLON 1-5
million lbs. /mo.
Cost Category Dollars
Raw product 8630
Processing & Packaging Expense:
Processing expense 0934
Packaging expense:
Labor 0092
Container 0836
TOTAL PROCESSING & PACKAGING EXPENSE .1862
General plant expense 0697
TOTAL DOCK COST 1.1189
X of Dock Cost
77.13
8.35
0.82
7.47
16.64
6.23
100.00
Table 5. Glass Container: Average Unit Expenses by Cost Category and Plant Size for Selected Oregon and California Plants; Class I Whole Fluid Milk, 1975
Plant size
HALF-GALLO 1-5
million lbs./mo.
Cost Category Dollars
Raw product 4315
Processing & Packaging Expense:
Processing expense 0595
Packaging expense:
Labor 0082
Container 0411
TOTAL PROCESSING & PACKAGING EXPENSE 1088
General plant expense 0498
TOTAL DOCK COST 5901
X of Dock Cost
73.12
10.08
1.39
6.97
18.44
8.44
100.00