an econometric study of an oil-exporting country: the case of iran · 2017-04-30 · portland state...
TRANSCRIPT
Portland State UniversityPDXScholar
Dissertations and Theses Dissertations and Theses
1-1-1986
An econometric study of an oil-exporting country: the case of IranAbbas HeiatPortland State University
Let us know how access to this document benefits you.Follow this and additional works at: http://pdxscholar.library.pdx.edu/open_access_etds
This Dissertation is brought to you for free and open access. It has been accepted for inclusion in Dissertations and Theses by an authorizedadministrator of PDXScholar. For more information, please contact [email protected].
Recommended CitationHeiat, Abbas, "An econometric study of an oil-exporting country: the case of Iran" (1986). Dissertations and Theses. Paper 564.
10.15760/etd.564
AN ECONOMETRIC STUDY OF AN OIL-EXPORTING COUNTRY:
THE CASE OF IRAN
by
ABBAS HEIAT
A dissertation sUbmitted in partial fulfillment of the requirements for the degree of
DOCTOR OF PHILOSOPHY in
SYSTEMS SCIENCE
Portland State University
1986
-- ~---------~-~--.--~-- .. - --~- --~
TO THE OFFICE OF GRADUATE STUDIES AND RESEARCH:
The members of the Committee approve the dissertation
of Abbas Heiat presented August 16, 1986.
Kuan-Pin Lln
APPROVED:
Martin Zwick, Director, Systems Science
Bernard Ross, Acting Dean, Graduate Studies and Research
-------~~-----.-- ._--- ---. __ .
AN ABSTRACT OF THE DISSERTATION OF Abbas Heiat for the
Doctor of Philosophy in Systems Science presented August
16, 1986.
Title: An Econometric Study of an Oil-Exporting Country:
The Case of Iran
APPROVED BY MEMBERS OF THE DISSERTATION COMMITTEE:
Abdul Qay6m, Chairman
Thomas A. McLean
Kuan-Pin Lin
The main objective of this study is to contribute to
ward an analytical and empirical work on the oil-based
developing economy of Iran. It focuses on the aggregate
behavior of the Iranian economy through a simple linear
econometric model.
2
After a survey of the literature on the theoretical
framework of macroeconomic models for the developing coun
tries in general, and for the oil exporting developing coun
tries in particular, a linear econometric model for the
Iranian economy is formulated and its logical and economi
cal aspects are 8xp~ained. The proposed model consists of
basic consumption, pruduction, foreign trade, and employ
ment relationships.
Estimation of the behavioral equations are carried out
by Ordinary Least Square and Two Stage Least Square esti
mators. The model is estimated over the period of 1959-76.
Data published by the Plan and Budget Organization of Iran
in the 1978 edition of the HEconomic Trends of Iran" are
used for the estimation of the parameters of the model.
Historical simulation of the model has been performed to
test the validity and the fitness of the model as a whole.
The results obtained from the estimation of the con
sumption functions seem to indicate that the aggregate
Iranian consumption behavior can be best explained by
Friedman's Permanent Income Hypothesis. An attempt has
been made to estimate the aggregate production function of
-------------------- - ----- -----

3
the urban sector according to various Cobb-Douglas produc
tion functions and linear production function with constant
returns to scale. All of these specifications gave implau
sible results.
In general, the results of this study demonstrate that
the links between different sectors of the Iranian economy
are very weak and the import substitution strategy of the
government during the period of study failed to establish a
genuine domestic industrial base and to reduce its depen
dence on foreign resources.
------------~-----. - ._- '---"

In the Name of God - Most Merciful, Most Compassionate
ACKNOWLEDGMENTS·
The responsibility for material presented in this dis
sertation rests with the author. But, intellectually lowe
so much to so many that it is impossible to acknowledge
them individually.
M7 first introduction into the application of regres
sion analysis to the economic studies came as a result of
taking econometric and economic planning courses taught by
Dr. Abdul Qayum. His remarks and discussions on the many
related issues were lucid and thought provoking. Later as
my advisor and dissertation committee chairman I profited
enormously from his suggestions and guidance on the subject
matter in the course of preparation of this study. For all
this I remain deeply grateful.
I wish also to express my profound gratitude to the
other members of my dissertation committee, Dr. Halley, Dr.
McLean, Dr. Lin and the Graduate Office Representative, Dr.
Rodich for their support, guidance, constructive critical
--- ----- ----.---~-----. -.- --- -

iv
remarks, objectivity in approach, open-mindedness, and for
sharing their vast intel~ectual capacity.
I would also like to express my gratitude to the
Mostczafan Foundation of New York for giving me financial
aid towards part of my dissertation research.
My special thanks are due to Mrs. Mary Dozark for her
sympathy and efficient typing of the first and final draft
of this dissertation.

TABLE OF CONTENTS
PAGE
ACKNOWLEDGMENTS...................................... iii
LIST OF TABLES 'oJ •••••••••••••• "J • •• & • • • • • • • • • • • • • • • • • • • viii
LIST OF FIGURES......................... . . . . . . . . . . . . . x
CHAPTER
I INTRODUCTION. • • • • • • • • • • • • • • • • • • • • • • • • • • • • • . 1
Purpose. . . . . . . . . . . . . . . . . . . . . . . . . . . . . . . . . 4
The Model and its Structure............. 6
Research Methodology.................... 7
Progress and Plans of the Study •. o...... 8
NOTES. . • • • • • • • • • . • • • • . • . • • • • • • . . . • . . . . . • • • . 10
II ECONOMIC MODELS FOR DEVELOPING COUNTRIES:
A THEORETICAL FRAMEWORK.................... 11
The Keynesian Model..................... 12
Growth Models........................... 15
Balanced vs. Unbalanced Growth.......... 18
Dualistic Models........................ 20
The Oil-Exporting Dual Economy.......... 23
NOTES. • • • • • • • • • • • • • • • • • • • • • • • • • • • • • • • . • • • • • 27
III MACROECONOMETRIC MODELS OF DEVELOPING
COUNTRIES WITH SPECIAL REFERENCE TO MODELS
OF I RAN. • • . . • . • • . . . . • • • • • • . • • • . • . . • • . • • • • • • 30
------_._--_ ....••. ~.-. -.-._.

CHAPTER vi
Survey of Models for Iran............... 30
Desired Characteristics of a Macroeconometric Model for an Oil-Exporting Dual Econon1y............................ 33
NOTES •••••••••• " ••••••••••.•••••••••••••••• 46
IV STRUCTURAL CHARACTERISTICS OF THE
V
I RAN I AN ECONO[-1Y............................ 47
Characteristics of the Econo~y.......... 48
Specification of the Model.............. 51
Consumption Expenditures Foreign Trade Relations Production Functions Employment
List of Variables....................... 54
Endogenous Variables Predetermined Variables Lagged Endogenous
Consumption Expenditures................ 55
Foreign Trade Relations................. 62
Production Functions.................... 64
Elnployment. . . • . . . . . . . . . . . . . . . . . . . . . . . . . . 66
Indirect Taxes.......................... 66
NOTES. • • • • • • . . • • • . • • . • • • . • • • • • • . • • • . • • • • . • • 68
ESTIM,ATION AND EVALUATION OF THE MODEL .•••• 70
Basic Aspects of Data Limitation........ 70
Estimation Procedures................... 73
Private Consumption Equations........... 75
Short-run and Long-run Marginal Propensity to Consume............... 79
Government Consumption Expenditures..... 81
-----------_ .. _,,_ .. - .----.

CHAPTER
VI
Foreign Trade Relations ................ .
vii
PAGE
81
Production Equations.................... 83
Employment and Indirect Taxes........... 86
Historical Simulation of the Model...... 88
The Reduced Form of the Model.......... 107
NOTES •.••••. '" '" If, " • '" .............................................. ..
CONCLUSIONS AND REC0I-1MENDATIONS ••••••••••••
114
116
Sumnlarx· .. if ...... u • • .. .. • .. .. .. .. .. .. .. .. .. .. .. .. .. .. .. .. .. .. .. .. .. 117
Conclusions. ........................................................ 119
Recommendations......................... 122
BIBLIOGRAPHY .............. " ~ .. . .. .. .. . .. .. .. .. .. .. .. .. .. .. .. .. .. .. .. .. .. .. .. .. .. .. .. .. .. .. 126
APPENDIX A ................... "' .. '" '" '" '" ........ '" "' .. '" .... '" '" "' .. "' ........ '" '" "' .... '" "'.. 133
APPENDIX B. "' .. "' .... '" .. "' .. "' .. '" '" oJ .... '" '" .. '" '" .. '" .... "' .... "' ...... '" '" "' ...... '" "' .. '" 143

TABLE
I
II
III
L;:ST OF TABLES
PAGE
Summary of Main Characteristics of the
UNCTAD, 1968 Hodel for Iran.............. 38
Summary of Main Characteristics of the
VAKIL, 1974 Model for Iran .............. . 40
Summary of Main Characteristics of the
SHANSHAHNI, 1976 Model for Iran ......... . 42
IV Summary of ~lain Characteristics of the
HEIAT, 1986 Model for Iran............... 44
V Results of Historical Simulation of the
r~ode 1 • • • • • • • • • • • • • • • • • • • • • • • • • • • • • • • • • • • • 91
VI The Model and its Estimated Struct~ral
VII
VIII
Equations................................ 92
Reduced Form Equations...................... 108
Dynamic Multipliers for Value Added
in Urban Sector .......................... 110
IX Dynamic Multipliers for Value Added
in Urban Sector. 110
X Dynamic Multip~ie~ ~or Urban Consumption ... 111
XI Dynamic Multipliers for rtural Consumption ... 111
XII Dynamic ~'lultipliers for Government
Consumption............................. 112
----------------------------
TABLE
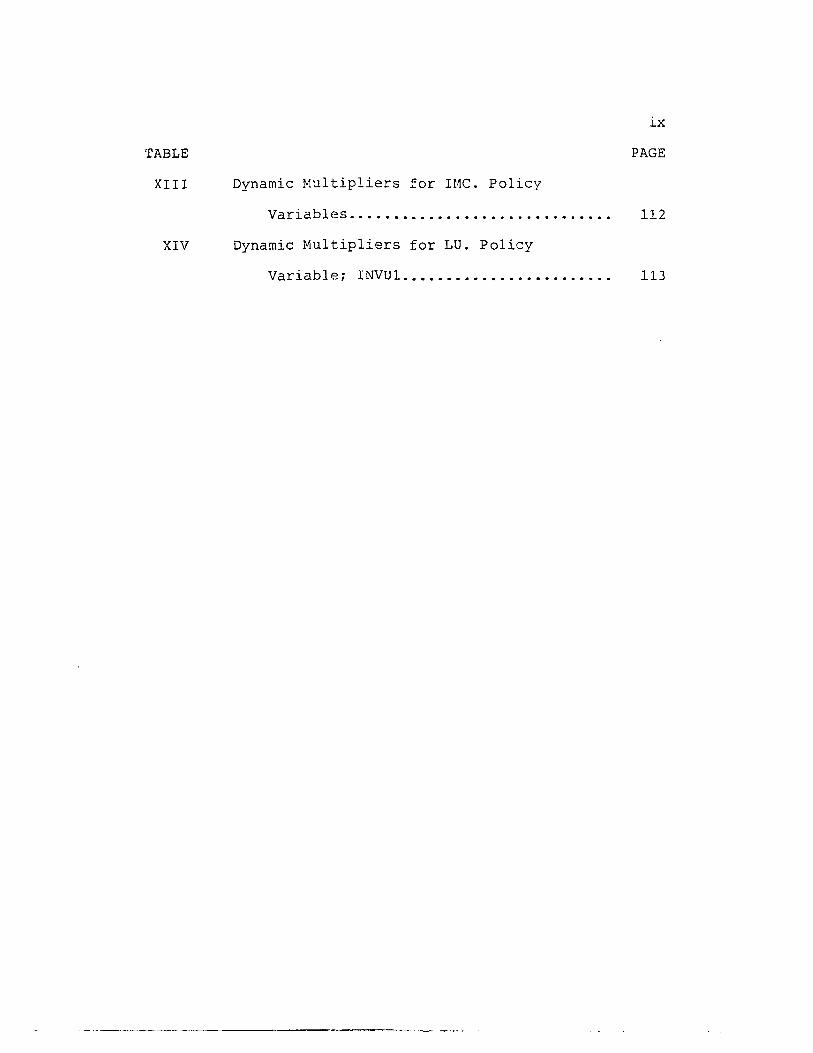
XIII
ix
PAGE
Dynamic Multipliers for IMC. Policy
Variables. • • . • • . • . . . . . • • • . . . . . . . . • . • . . . 112
XIV Dynamic Multipliers for LU. Policy
Variable; INVU1........................ 113
---.------~----- .. -- ._ .....

FIGURE
1.
LIST OF FIGURES
PAGE
Historical Simulation of Value-Added in
Agriculture.............................. 95
2. Historical Simulation of Value-Added in
Urban Sector............................. 96
3. Historical Simulation of Private
Consumption in Agriculture
Sector. . . . . . . . . . . . . . . . . . . . . . . . . . . . . . . . . . . 97
4. Historical Simulation of Private
Consumption in Urban Sector.............. 98
5. Historical Simulation of Government
Consumption Expenditures................. 99
6. Historical Simulation of Imports of
Consumer Goods........................... 100
7. Historical Simulation of Imports of
8.
9.
Capital Goods and Intermediate
Goods ...••••.••.•. ~ •......•....•.•..•..••
Historical Simulation of Non-Oil Exports ....
Historical Simulation of Labor Employed
101
102
in Agriculture........................... 103
10. Historical Simulation of Labor Employed
in Urban Sector.......................... 104

FIGURE
11.
xi
PAGE
Historical Simulation of Value-Added in
Oil Sector.............. ......•.•....•.. 105
12. Histo~icai Simulation of Net Indirect
Taxes. . . . . • . . . . . . . . . . . . . • . . . . • . • . • • • . . • . • 106
CHAPTER I
INTRODUCTION
Since the end of World War II the oil sector has been
playing a very significant role in the economic and social
development of oil exporting developing countries. Quad
rupling of oil prices in the 1970's and the ensuing oil
euphoria gave the impression that the oil exporting develop
ing count~ies were in a short-cut to the economic prosper
ity and industrial advancp.ment. Oil revenues have proved,
however, to be much more than a costless source of financ
ing development projects in the oil-based developing
nations.
The role natural resources play in economic develop
ment is indeed very difficult to determine. However, count
ries richly endowed with resources appear to have some ini
tial advantage in achieving economic growth over other
developing countries that are less fortunate. This does
not necessarily imply that natural resources per se provide
tne only prerequisites for economic development. The inter
nalization of the growth process and a genuine economic
development requires, among other things, a strong national
commitment and a dedicated leadership with broad-based
----------~- .... -. ~- --.-

popular support, technical ~nowledge, and skill as well as
organizational ability in resource allo~ation.
2
Essentially, we can characterize an oil exporting
developing economy by an enclave tnodern oil sector, a grow
ing industrial urban sector, and a stagnating agriculture
sector. The most significant feature of the oil sector is
its almost complete independence from the rest of the econ
omy. Little contribution is being made by domestic sectors
to the production of crude oil. In narticular, the partici
pation of domestic labor force in the oil sector is neglig
ible. Oil income, ho .. iever, makes up a large share of na
tional income, and almost the whole of foreign exchange re
ceipts. Furthermore. oil sector generates sufficient sav
ings and foreign exchanges to compensate for inadequate in
ternal savings and export earnings. In contrast to the
classical dualistic models suggested by Lewis, Fei-Ranis
and Jorgensan, in an oil-~ased developing economy financial
resources flow from the oil sector to the rest of the econ
omy, rather than from agriculture sector to the other in
digenous sectors. Furthermore, surplus resource in an oil
exporting country in contrast to labor surplus economy is
e:{haustible and the supply of trained labor force and
skilled managers is very limited.
The analysis of sectoral interdependencies as an
approach to the study of economic development has long
occupied the attention of economists. However, the
------------------ - --" ----.
3
relationship between indigenous sectors of a jeveloping
country and its revenue generating enclave sector has sel
dom been subjected to the kind of analytical vigor that has
characterized the more conventional cases of intersectoral
relationships, where export oriented enclaves have been
nonexistent. 1
In this study an attempt has been made to fill the
foregoing vacuum in the literature by providin~ a theoreti
cal framework within which the growth dynamism of an oil
based developing economy could be systematically analyzed.
The experience of Iran during 1959-1978 presents a classic
case for the study of economic growth of an oil exporting
developing economy. Iran is better placed than most other
developing countries to carry out a successful industrial
ization policy and avoid its negative side effects. She
has an extraordinary range of natural resources which make
ner independent of foreign supplies of critical materials.
The variety of climate and of soils make I~an potentially
self-sufficient in food-stuffs and agricultural raw mate
rials. Nevertheless, after almost three decades of develop
ment planning in tne wake of the Islamic Revolution, Iran's
industrial base remained fragile and the country had lost
its earlier self-sufficiency in agriculture.
-------_._------- - ----- -----
Purpose
The main objective of this study 1S to contribute to
ward an analytical and empirical work on the economy of
Iran.
4
The disillusioning experience of four development
decades has demonstrated the weakness of simplistic ap
proaches to the highly complex phenomenort of economic
development. It is now a widely accepted notion that a
standard model of development is not likely to work for all
developing countries. 2 The past history of these coun
tries with respect to economic performance has been quite
diverse. Much of this diversity is through resource en
dowments. Social and cultural differences have also con
tributed a great de~l to the diversity of economic per
formance among developing countries. It is not surprising,
therefore, that the development economics has so far failed
to yield a convincing fundamental and coherent analysis or
theory of development.
An increasing number of economists and planners are be
coming sceptical about the whole approach of contem~orary
development economics. There are others who argue that the
generalizations of economic theory are based on the parti
cular circumstances of the advanced countries and are,
therefore not universally valid. Finally, there are
critics who are questioning the relevance of economic
---------------_. __ ._.- .. --_ ..
5
theory and basic tools of economic theory to the developing
countries. 3
We agree with H. Myint that
There can be no serious quarrel with those critics who stress the need to increase the realism uf economic theory by taking into account the various social, historical, and institutional differences between the advanced and underdeveloped countries. If anything our analysis has suggested the need also to take into account the differences between the underdeveloped countries themselves with respect to the degree of population pressure, the over-all size of the eC0nomy, ..• 4
The argument of those economists who question the
relevance of conventional economic theory is more debat-
able. We believe that the body of knowledge and tools
developed and structured in the form of economic theory is
important and useful. The acceptance or rejectiou of the
relevance of conventional economic theories to the develop-
ing economies should be based on the results of the empir-
ical studies rather than conjecture. Indeed, our proposed
research has two specific main objectives. The first ob-
jective is to apply the conventional consumption, produc-
tion and foreign trade theories to the Iranian data and
report the findings. The second objective is concerned
with the construction of an econometric model for the
Iranian economy and testing its relevance and power in
explaining the macroeconomic behavior of an oil-based
developing country.
------------ .. ~ .. --- --- ._.

6
The Model and Its Structure
The study presented here is the result of an effort to
increase our knowledge of the structure ~f the oil-based
Iranian economy. This constitutes a ~inear econometric
model, plus its theoretical and policy implications for
Iran. It focuses on the behavior of the economy in an ag
gregate fashion. The proposed econometric model consists
of twelve stochastic equations with five identities. There
are thirty-two variables in all, fifteen of which are pre
determined, consisting of seven lagged endogenous variables
and eight exogenous variables.
Several interesting hypotheses for the Iranian economy
are suggested within the structure of the model. Indeed,
the twice dualistic nature of the economy is reflected in
the consumption, supply, foreign trade and employment equa
tions. There is, on the one hand, the conventional dualism
which distinguishes between traditional agriculture and in
dustrial sectors, and on the other hand, the private sector
and public sector duality reflecting the importance of the
oil exports. There are, however, concerns which are not
adequately treated. Considerable compromises have been
made between constructing an ideal model of an oil-export
ing dualistic economy and the available data. These com
promises have been most significant with respect to in
stitutional factors, infrastructure, capital stock and
underutilized production capacity, income distribution and
rural-urban migration.
Two main limitations of the model are: the linearity
of the behavioral equations and the highly aggregative
character of the variables used in it.
Research Methodology
The estimation of behavioral equations are estimated
by ordinary least square and two stage least square esti
mators. To overcome the problem of autocorrelation and to
obtain efficient estimates first order serial correlation
(AR1) procedure proposed by Beach and McKinon are used to
estimate equations whose disturbances display first order
serial correlation. Variables are measured in 1959 con
stant prices in billion rials and in thousands of persons.
Giver. a model whose parameters have been estimated,
given initial values for the endogenous variables, and
given time series for the exogenous variables, the model
can be solved over some range of time to yield 30lutions
7
for each of the endogenous variables. In a historical simu
lation, actual values in the base year are given as initial
condition for the endogenous variables. Actual time series
beginning in ~he base year and ending in the last year of
the observation are used for the exogenous variables.
Value: for the endogenous variables after the base year are
determined by the simulation solution. A comparison of the

8
original data with the simulated series for each endogenous
variable then can provide a useful test of the validity of
the model. In this study the historical simulation of the
model has been ?erformed to evaluate the fitness of the
model as a whole and to see whether equations will repro
duce the results which are close to the historical data.
Progress and Plans of the Study
This study is primarily concerned with a quantitative
analysis of the economy of Iran. The method of study can
be described as a quantitative economic research in which
the tools of economic theory and statistical inference are
applied to the study of the Iranian economy during the
1959-1976 period for which data have been collected.
Therefore, first a critical survey of the literature
on the theoretical framework of macroeconomic model build
ing for less developed countries in general and for oil-ex
porting developing countries in particular is made in
Chapter II. Then a theoretical framework of macroecono
metric models for developing oil-exporting is outlined in
Chapter III. In this chapter two-gap and Harrod-Domar ap
proaches to model building in development economies are
considered. Special reference is made to the oil-based
economy of Iran.
In Chapter IV, after drawing a brief sketch of the
structural characteristics of the Iranian economy, an

econometric model is formulated and its economic and logi
cal aspects are explained. The model consists of basic
consumption expenditure relationships, production, foreign
trade, and employment sectors.
9
Estimated structural equations are presented in
Chapter V. To study the dynamic behavior of the model,
structural equations are transformed into the reduced form
where each current endogenous variable is solely defined in
terms of predetermined variables. Given the reduced form
of the model, the fluctuations of the major endogenous
variables over time are then explored.

NOTES
lAo M. Fekrat, "Growth of OPEC-Type Economies: A Preliminary Theoretical Inquiry". Economica Internationale, February 1979.
2M• P. Todaro, Economic Development in the Third World. New York: Longman Inc., 1981, pp. 12-16.
3H• Myint, Economic Theory and the Underdeveloped Countries. New York: Oxford University Press, 1967, pp. 3-26.
4H. Myint, p. 15.
CHAPTER II
ECONOMIC MODELS FOR DEVELOPING COUNTRIES: A THEORETICAL FRAMEWORK
Construction of macroeconometric models for developing
countries has become an increasingly popular endeavor in
the last few decades. Both national planning organizations
and international agencies like the United Nations Com-
mittee on Trade and Development (UNCTAD), Economic Commis-
sion for Latin America (ECLA), Economic Commission for Asia
and the Pacific (ESCAP), International Monetary Fund (IMF) ,
and World Bank are interested in quantitative analysis of
aggregate economic relationships for the purpose of fore-
casting as well as policy prescriptions.
Clearly, the less developed countries might draw on
some of the relationships used in models for economically
advanced industrialized economies, but the problems faced
by such economies are of a different nature. Therefore,
the structure of equations and definitions of variables
should explain very different local institutions and be
havioral characteristics. 1 While there have been numer-
ous attempts to build such models, it will be some time be-
fore truly satisfactory models can be developed. In the
absence of a general theoretical framework within which the
problems of the developing countries can be studied, much
----------------------------~---- --------- - -- --------
12
of the debate has taken place in a theoretical vacuum.
Moreover, lack of adequate data has served as an additional
obstacle in developing and in estimating satisfactory
models. In spite of these limitations, it can be argued
that the construction and estimation of econometric models
for developing countries may be of substantial interest and
necessity. Econometric models, by tracing the historical
records of major economic variables, provide useful inform
ation about the general behavior of the developing econo
mies in a systematic and highly organized fashion.
In this chapter we are going to take a brief look at
some of the economic theories and their application to the
developip-g economies and submit some simple thoughts on
macroeconomic model building for less developed countries
in general and for oil-exporting developing economies in
particular.
The Keynesian Mode~
The Keynes contribution to economic theory, which re
stored macroeconomic to its classical leading role, paved
the way for constructing econometric models based on the
Keynesian Theory of effective demand and income determina
tion. Keynes' central argument was that the employment is
governed by the level of national output, and that in turn
is controlled by the volume of demand for consumers' goods,
private investment and public expenditure. The proportion
------------------.~ --- ----
13
of income that is not consumed constitutes savings; the pro
portion of output that is not consumed constitutes invest
ment. But desired savings by consumers and desired invest
ment or planned investment by producers can only coinci
dently be in balance, because they are determined by quite
unrelated considerations. Savings depend on the marginal
propensity to consume, that is on how much people wish to
spend of each additional dollar received. The willingness
to invest, on the other hand, depends on the return on in
vestment as well as the cost of borrowing money, i.e., the
rate of interest. Given that marginal propensity to con
sume is relatively stable, the most variable element in the
system is desired investment. It is the manner in which
savings and investment are brought into balance that is the
core of Keynes' theoretical system.
If there is a shortfall in investment, the national
income is reduced through multiplier process until a new
equilibrium state is reached. In the process savings are
reduced and are brought into balance with desired invest
ment. But there is no reason at all why the equilibrium
should be at a level of full employment. It can correspond
with any level of employment. The same process operates in
reverse if desired investment exceeds desired savings.
Keynes' major contribution was to demonstrate that the eco
nomy might not self-adjust as classical economists believed
it does. The principal implication of the Keynesian
------------ - ------------- ---

message is ~hat public policy must be used to alter the
rate of aggregate demand.
14
The Keynesian system has certain limitations. In the
last two decades it has not not been able to help govern
ments deal with the problem of stag-flation, a combination
of inflation with high unemployment. But more serious
limitations arise when the logic is applied to developing
economies. In developing countries the problems of poverty
and unemployment cannot be solved by Keynesian policies,
since it is not effective demand that is lacking but the
infrastructure and resources on the supply side. If there
is insufficient productive capacity to meet increased de
mand, a rise in income will stimulate inflation more than
consumption. Where incomes are very unequally distributed,
an increase in investment will not necessarily generate sav
ings of the form and quantity desired. Where the necessary
structure of an integrated economy and financi~l system
does not exist, Keynesian theoretical system cannot be ap
plied without substantial adjustments. The "general
theory" is in fact specific to the time and place of its
formulation, i.e., a period of persistent under-utilization
of resources in the economically advanced countries. But
the case for government intervention is more general and
the value of economic management has been demonstrated in
practice.
---------.--~-- .. -... -.- -'-"

15
Growth Models
It was not long before attempts were made to translate
Keynesian equilibrium theory into a theory of growth, and
to find in it prescriptions for economic development in the
developing economies. If the fundamental engine of increas
ing employment, national output, and income is investment,
then the net growth is a necessary accompaniment of progres
sive capitalization of pLuJucLion th~ough time. The model
proposed by R. F. Harrod and E. Domar was an early mathe
matical attempt to show that growth is directly related to
savings and indirectly related to the capital/output ratio.
The model has two basic assumptions. It assumes that there
is a fixed ratio between a unit of capital injected into
the system and the resulting value of output produced in a
year. It further assumes that the level of savings is also
a fixed proportion of income. 2 Given these astiumptions,
an investment made at time t will generate additional in
come through capital/output ratio and the multiplier (recip
rocal of the marginal propensity to save) at time t + 1 and
the resultant increased savings from the larger income will
be invested to generate further growth at time t + 2 and so
on. However, an initial error in the right level of invest
ment is also enlarged through the multiplier. So the ex
pected level of demand at t + 1 on which investment deci
sions at t are based, may differ substantially from the
-------------_. __ .. -.-- ----
16
actual growth of demand. The neoclassical economists, how
ever, tried to cope with this problem by additions and re
finements of the Harrod-Domar model.
The neoclassical model begins with an aggregate produc-
tion function that includes technical progress:
Y = f(A, K, L) where
Y = national output
A = technical change factor
K = capital stock
L = labor
Technical progress is usually assumed to be neutral,
allowing for increased productivity of both labor and capi
tal and leaving the rate of substitutions between them un
affected. Moreover, like the Harrod-Domar model, the sim
ple neoclassical model assumes a constant returns to scale,
so that an equal increase in the amount of labor and capi
tal used in the production process would result in the in
crease of output by the same proportion. 3 While the neo
classical model may seem to contain more realism, addi
tional assumptions like perfect competition in all markets
reduce its applicability. There has been, however, impor
tant spin-off from this thinking, in such areas as the con
tribution of capital, labor and technological change to
economic growth. The importance of savings was specially
emphasized, and since developing countries are unable to
raise enough savings to finance sufficiently high growth
-------- ----------_. __ ._-- ---- -

17
rates, the international development assistance was recom
mended as an important suDstitution.
To achieve economic growth, developing countries must
choose a strategy for growth. Neoclassical growth theories
started from a base of an already dynamic and developed
economy, but they did not have much to say about an under
developed country seeking to initiate growth mainly from
its own resources. Among other problems, this was one ques
tion to which economists turned their attention.
Kindelberger saw the small size of the market as one
of the major causes of underdevelopment and suggested that
large sums of capital are needed to build up the infrastruc
ture before economic development can take place. 4 Invest
ment in roads, ports, transportation as well as dams, elec
tr3.city and communication networks ties countries together
and creates large markets which allow economies of scale
and greater specialization in the production process. Lack
of adequate funds, however may frustrate the development of
the desired infrastructure. In the absence of lump-sum cap
ital, exports can also increase the size of the domestic
market. According to classical theory increased export de
mand, or "vent for surplus," results in the utilization of
otherwise idle resources, permits greater specialization
and leads to increased productivity. However, as Hla Myint
points out, increased demand for exports in many less
developed countries has led to growth but not development.
------- ---------------- - ---- ---
18
Specialization in export production in most cases merely in
volves the expansion of old techniques to new areas and no
qualitative change in production takes place. Furthermore,
specialization frequently hurts local producers. When de
mand in international market falls off, they have nothing
to fall back on and end up in debt to foreigners or the
domestic money lenders. 5
Balanced vs. Unbalanced Growth
Growth strategies proposed in the 1950s can be classi
fied into two broad categories: "balanced" and "unbal
anced" •
Proponents of the balanced growth strategy advocate a
comprehensive simultaneous investment In all sectors.
Ragnar Nurkse was among those who argued for spreading in
vestment across the economy and enlarging the size and
volume of the market. He was also concerned with the prub
lem of generating savings and had some doubts about the
value of external aid. He emphasized very strongly the
role of state in controlling trade movements, enforcing sav
ings through taxation. He points out that a country import
ing capital goods rather than consumption goods is saving
insofar as some of the domestic income is not used for con
sumption. But to translate such savings into domestic sav
ings is another matter, for it is likely that the unsatis
fied demand for foreign goods will be in part transferred
___________________________ --0 __
19
to consumption of goods produced domestically.6
Rosenstein-Rodon, another chief proponent of balanced
growth, states that a big-push policy is necessary to in
crease income and demand. Coordination of investment pro
vides externalities inasmuch as new industries increase the
demand for each other's products and lower the cost of
their inputs. Integration of investment also facilitates
the training of a larger pool of labor from which all indus
tries benefit. 7 The arguments put forward by balanced
growth theorists seem plausible but nonetheless rest on as
sumptions that are unlikely to be fulfilled in developing
countries. They assume highly elastic supplies of factors
of production. But we know that capital is generally in
low supply if not totally scarce in rr.ost develop}ng coun
tries. Unskilled labor is abundant in supply, but develop
ing countries suffer enormously from scarcity of skilled
workers, technicians and managers. Thus any "big-push" pro
gram puts a tremendous strain on such resources. Further
more, the scarcity of entrepreneurs and the imperfections
in the market require government intervention at least as a
corrective measure and coordinator. The critics of
balanced growth strategy maintain that if a country had the
resources to launch massive investment programs, it would
not be underdeveloped in the first place. Scistovsky and
Hirschman advocate a selective approach to development. It
does not in any way imply the development of one sector of
20
the economy to the apparent neglect of other sectors. The
interdependence among various sectors is not ignored. What
is argued here is simply concentration of scarce capital
and manpower resources in a few key industries to take ad
vantage of economies of scale. Insufficient domestic demand
for these industries' output could then be supplemented by
demand for exports. The complementarities among sectors
will also lead to the development of forward as well as
backward linkages. 8 Hirschman, in particular, emphasizes
the role of entrepreneur in development. By cutting costs
and improving quality, entrepreneurs prevent waste, free
resources for use in productive areas of the economy and
create a favorable atmosphere for further investments. 9
It may appear that unbalanced growth offers a more at
tractive approach to growth. But the matter is really not
all that simple. The unbalanced growth policy requires
that economy carefully choose among investment alternatives
which is not an easy task. In the first place, potential
leading sectors that could possibly serve as engine of
growth must be available. Secondly, the leading sectors
should be able to provide direct and indirect linkages with
the rest of the economy.
Dualistic Models
Dualistic models have been developed to conceptualize
the process of economic development of a less developed

21
country. A typical dual economy is described in the works
of W. A. Lewis, R. S. Eckaus, J. C. H. Fei, G. Ranis, and
D. W. Jorgenson. In the classic situation, there are two
main sectors. First, there is an agriculture sector which
is assumed to be economically backward, using traditional
methods of production, and exhibiting disguised unemploy
ment. Second, there is an industrial modern sector. The
traditional sector provides the dynamics for growth, by re
leasing its surplus labor for industry, as well as produc
ing a food surplus for urban markets. By assuming zero mar
ginal productivity of labor in the agriculture sector,
Lewis believes that a large volume of labor may be trans
ferred into the industrial production without loss of agri
culture output. Under these conditions,the wage rate re
quired to attract labor into the industrial sector need be
only slightly above the productivity per hour in the agri
cultural sector. All the surplus product above the wages
of labor in the modern sector accrues to the entrepreneurs.
Profit expansion then stimulates new investments and higher
levels of investment in turn enhances the economic
growth. 10 The Lewis model has been criticized for the as
sumption of an unlimited surplus of labor in the agricul
ture sector. Some economists argue that although many
agricultural workers in less developed countries are under
employed they cannot be considered as surplus labor because
their contribution to total production is far from zero.
-------------_ .. - . --~ ---_.

22
The model developed by R. S. Eckaus assumes that in the in
dustrial sector development is capital in~ensive and factor
proportions are relatively fixed. Thus an increase in em
ployment can only be achieved by a proportionate increase
in capital investment. In the agricultural sector, by con
trast, technical coefficients are variable, implying that a
wide range of methods and factor combinations can be em
ployed to yield the same amount of output. The proportions
actually used depend on the relative price and availability
of labor and capital. Under these conditions, absorptive
capacity of the industrial sector is limited, and given a
population explosion, the increasing supply of labor should
be channeled into the agricultural sector where it can be
absorbed by the use of more labor-intensive techniques of
production. Thus there is no incentive for modernization
of the agricultural sector, and the structural gap between
the two sectors widens as the economy grows. 11
The model of Fei and Ranis explores not only the labor
interrelation of the two sectors, but also the production
of consumption and investment goods and services in both
sectors. In contrast to Eckaus' model factor proportions
are assumed to be variable in the industrial sector. Con
sequently, the economic growth may be achieved by accumu
lation of either or both capital and labor. But all techn
ical innovation is assumed to take place in the industrial
sector. Given these assumptions, economic development then
23
requires a shift of resources from the agricultural sector
to the industrial sector at a rate faster than the growth
rate of the economy as a whole. 12 Jorgenson criticizes
many of the assumptions made by Fei and Ranis particularly
the freedom of the industrial sector to absorb labor with
out a proportionate increase in capital. In Jorgenson's
model the marginal productivity of labor in the agricul
tural sector is always positive and transfer of labor from
the agriculture to the industrial sector causes loss to
agricultural output, and the real wage rises continuously
with economic growth.13
The Oil Exporting Dual Economy
The foregoing description of a dual economy differs
distinctly from a dual economy in which there is an enclave
modern sector of oil production. Basically we can charact
erize an oil exporting developing economy by an enclave
modern oil sector, a growing industrial urban sector, and a
stagnating agriculture sector. The most significant fea
ture of the oil sector is its almost complete independence
from the rest of the economy. Little contribution is being
made by domestic sectors to the production of crude oil, in
particular the participation of domestic labor force in the
oil sector is negligible. Hence, oil revenues may be con
sidered as collective economic rent. 14 Oil income, how
ever, makes up a large share of national income, and almost

24
the whole of foreign exchange receipts. Oil revenues,
therefore, can help to eliminate two major constraints of
capital formation in developing countries. It generates
sufficient savings and foreign exchanges to compensate for
inadequate internal savings and export earnings. Petroleum
also provides a source of energy. Inadequate supply of
energy could hamper industrialization and put a great deal
of pressure on the Itmited available foreign exchanges in a
developing country.
Oil revenues are directly received by the government
and the state has a great deal of flexibility in its dis-
bursements. Once oil revenues make up ten percent or more
of the national income, they create a relative political
and economic independence from the indigenous social and
economic forces for the state. In contrast to the classi-
cal case, the growth of an oil-exporting developing country
depends on the public expenditures. Boma Katouzian be-
lieves that in the case of an oil exporting dual economy
the most clear line of demarcation between different social
and economic classes is not so much their relations with
means of production, but their relations with the main sup-
plier of the means of consumption, i.e., the state.
Furthermore, he observes that:
The state's consumption expenditure will rapidly expand its own military-bureaucratic network, both in the size of its membership and its earnings; and bureaucratic earnings set the floor for earnings in other alternatives. These ..• lead to a high rate of consumption expenditures .•. in the
expansion of, in particular, bureaucratic and modern services, and also of construction and modern durable consumer goods ...
State investment expenditures places great emphasis on the urban sectorj it emphasises construction, modern service activities ..• and heavy industries (steel, machine tools, and so on) j and it employs the latest capital-intensive as well as skill-intensive-modern technology.15
The lopsided allocation of oil revenues creates an imbal-
25
ance in the economy. The agriculture sector is not capable
of meeting the rapid rise in demand for food. This inabil-
ity is partly due to technical and institutional con-
straints, and partly due to the intentional neglect in the
development strategy. The urban food shortage can be met
by increased imports which are possible thanks to the oil
revenue. Nevertheless, the prices continue to rise because
of inadequate supply of ports, storage and transport facil-
itie~. Given the scarcity of skilled labor, technicians,
and managers, the desired production level cannot be real-
ized through increasing investments in the urban sector.
Hence, the rise in demand for durable consumer goods should
be partially met by direct import. The rectification of
this imbalanced economic situation may require d process of
diversification of domestic output in order to reduce the
country's dependence on imports of consumers' goods, inter-
mediate goods and machinery. Small countries with rela-
tively high oil reserves may afford to pursue a strategy of
resource-based capital-intensive industrialization.
26
Oil-exporting countries with moderate capital endowment,
and larger populations, however, need to develop agricul
ture and small-scale industries along with resource-based
industrialization in order to solve food as well as employ
ment problems. The larger domestic market also allows more
scope for development of basic heavy industries. To reduce
the economy's dependence on oil, the creation of an alter
native export sector should also be seriously considered.
In this context, government plays a crucial role by channel
ing oil revenues into productive and appropriate invest
ments. The private sector-public sector dichotomy, there
fore reflects the importance of the oil sector in the
development process.
Oil duality like classical duality should represent a
transitional stage in the process of the economic develop
ment. As the sectoral integration of the economy in
creases, and indigenous technical and productive capacity
improves, the oil sector gradually loses its dominant posi
tion in favor of the industrial sector and high oil-based
growth should be replaced by a moderate self-sustained
growth.
------------------------ -- ----- ---
NOTES
lLawrence R. Klein, "What Kind of Macroeconometric Model for Developing Economies?" In Readings in Economic Statistics and Econometrics, ed. Arnold Zellner, (Boston: Little, Brown and Company, 1968), pp. 559-570.
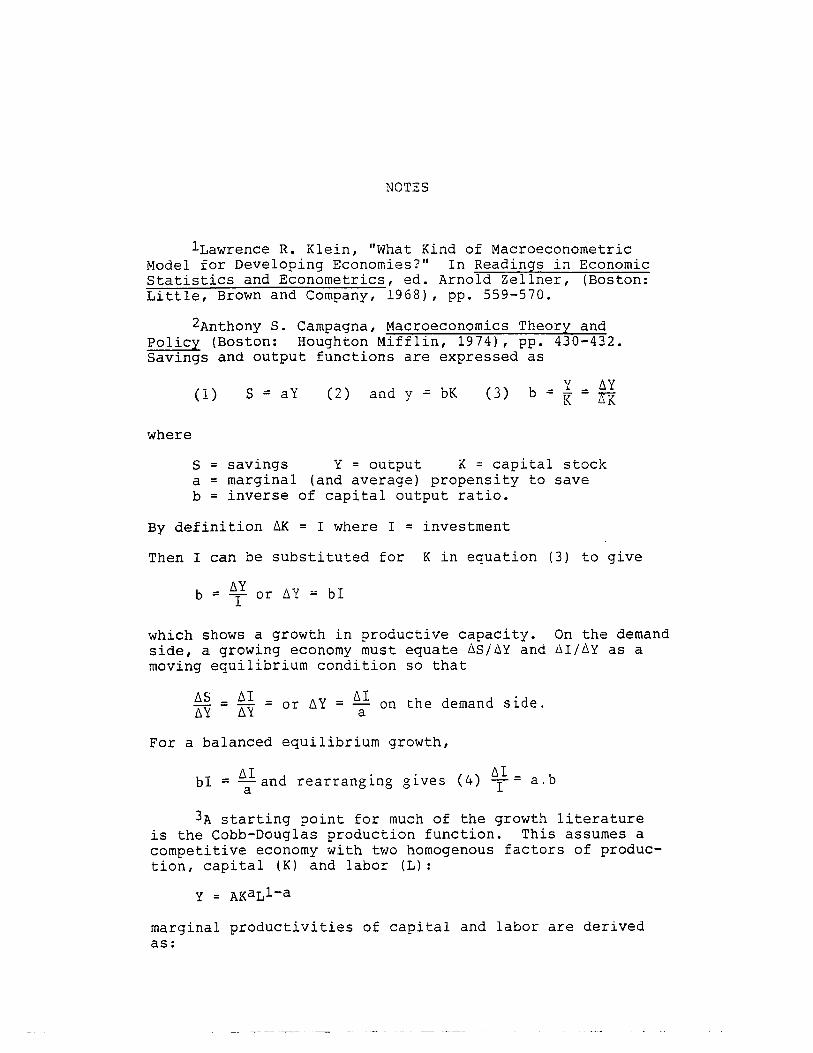
2Anthony S. Campagna, Macroeconomics Theory and Policy (Boston: Houghton Mifflin, 1974), pp. 430-432. Savings and output functions are expressed as
where
(1) S = aY (2) and y = bK (3) y
b .: K
S = savings Y = output K = capital stock a = marginal (and average) propensity to save b = inverse of capital output ratio.
By definition ~K = I where I = investment
Then I can be substituted for K in equation (3) to give
b = ~y or ~Y ~ bI I
which shows a growth in productive capacity. On the demand side, a growing economy must equate ~S/6Y and 8I/6y as a moving equilibrium condition so that
~s - ~I - or ~y = ~I on the demand side. ~y - ~y - a
For a balanced equilibrium growth,
~I d ., (4) ~II = a. b bI = -. an rearranging gives a
3A starting point for much of the growth literature is the Cobb-Douglas production function. This assumes a competitive economy with two homogenous factors of production, capital (K) and labor (L):
Y = AKaL1-a
marginal productivities of capital and labor are derived as:

aY Y aY Y aK = a K and 1L .: (l-a)I
28
Let the price of output be P, the wage rate Wand the price of capital I. Then profits, NR = P.Y-WL-IK will be maximized subject to the constraints imposed by the production function when
3NR P(1-a) Y Y W aL
;:;;
L - \.j - 0 or O-a)- = p L
aNR Y I Y I
aK = Pa- - = 0 or a- .: P K K
These simply state that the marginal productivity of labor is equal to the real wage and that the marginal productivity of capital is equal to the price per unit of capital divided by the price of output. Capital output ratio and capital labor ratio are determined as
~ .: ~, L _ (l-a)I Y I K - a(W)-
Thus we see the basic economic fact that the ratio of labor to capital depends on the ratio of actor prices. Similarly the capital output ratio depends only on the ratio of the price of output to the price of capital.
Note that a + (i-a) = 1. Thus it is required that there be constant returns to scale in the production function. This statement can be checked by multiplying the amount of capital and the amount of labor by a constant like c:
Thus if we multiply all inputs by 2, we shall increase output by multiplying two fold.
Technolcgical change can be introduced by inserting a time trend as follows:
where
e = 2.71828 rt = time rate of technological change.
Technological change is said to be labor saving if it raises the marginal product of capital relative to marginal product of labor. It is said to be capital-saving if it raises the marginal product of labor relative to the marginal product of capital. Finally, it is said to be neutral if it raises the marginal products of labor and capital in
---. ----~~------.--.-.-------------~-- -.
29
the same proportion. For more details see Warren L. Smith, Macroeconomics (Homewood, Illinois: Richard D. Irwin, Inc., 1970), pp. 401-422.
4Charles C. Kindleberger, Economic Development, Second Edition, (New York: McGraw-Hill Book Co., 1965).
5Hla Myint, "The Classical Theory of International Trade and the Underdeveloped Countries" in Economic Theory and th~ Underdeveloped Countries, ed. Hla Myint, (New York: Oxford University Press, 1971), pp. 118-146.
6Ragnar Nurske, Problems of Capital Formation in Underdeveloped Countries, (New York: University Press, 1953).
7p. N. Rosenst.ein-'Rodan, "Notes on the Theory of the Big Push", in Economic Development for Latin America, (New York: St. Martin's Press, 1961).
8T. Scitovsky, "Two Concepts of External Economies" in The Economics of Underdevelopment, ed. A. N. Agarwala and S. P. Singh, (New York, 1963) pp. 295-308.
9A. O. Hirschman, The Strategy of Economic Developmen~, (New Haven: Yale University Press, 1971).
lOw. A. Lewis, "Economic Development with Unlimited Supplies of Labour", Manchester School of Economics and Social Sciences, May 1954, pp. 139-91.
11R. S. Eckaus, "The Factor Proportions Problem in Underdeveloped Areas", American Economic Review, 45 (1955), 539-65. -.----.
12J. C. H. Fei and G. A. Ranis, "A Theory of Economic Development", American Economic Review, 51 (1961), 533-64.
130. W. Jorgenson, "The Development of a Dual Economy", Economic Journal, 71 (1961),309-34.
14M• A. Katozian, "Oil Versus Agriculture: A Case of Dual Resource Depletion in Iran", Journal of Peasant Studies, 5 (1978), 347-69.
15Homa Katouzian, The Political Economy of Modern Iran, (New York: New York University Press, 1981), pp. 245-247.
CHAPTER III
MACRO ECONOMETRIC MODELS OF DEVELOPING COUNTRIES WITH SPECIAL
REFERENCE TO MODELS OF IRAN
A great number of published models for developing econ-
omies have been constructed within the two-gap framework.
The basic assumption of the two-gap approach is that most
developing countries are faced with a shortage of domestic
savings (saving gap) to meet the required investment expend-
itures or a shortage of foreign exchange (trade gap) to pay
for needed imports. Foreign aid then can play an important
role in supplementing domestic savings and assuring the im-
port of required capital and intermediate goods and ser-
vices from abroad.
Survey of Models for Iran
Some of the two-gap models for developing countries
were undertaken by UNCTADI and ECAFE2 and projections
were made of external resource requirements of individual
developing countries.
The main emphasis of these models are on the determina-
tion of the dominant gap and the estimates for the two
gaps. While a two-gap model is conceptually useful and it
is a frame of reference for the development aid, the preoc-
cupation of model builders with the two-gap emphasis has

31
led to the construction of mechanistic equations rather
than descriptions of the economies under study. In UNCTAD,
1968, the model of Iran, given the rate of growth of GDP,
and agricultural sector, is mainly concerned with the esti
mation of the compatible rate of growth of the oil sector,
as well as rates of growth of imports and exports. 3 The
UNCTAD model consists of thirty-two behavioral equations,
and ten exogenous variables. The behavioral equations are
represented by the seven consumption functions, two growth
equations, two equations relating non-agricultural portion
of GDP to oil sector, four oil exports functions, two other
commodity and service functions, three productlon func
tions, seven import functions, two equations relating in
vestment to exports of crude oil and products, and finally
three equations illustrating relationship between oil sec
tor and indirect taxes, net factor income from abroad, and
the rest of the economy. Estimation of the model is per
formed by ordinary least squares (OLS) regression method.
Annual data is used in the estimation for the period of
1956-63. Consequently the number of observations are
limited to only eight observations. Linear and log equa
tions are used in the model with lags up to one year.
Harrod-Domar type production functions are used for repre
senting the supply side of the model. Import and export
functions are fairly disaggregated, but there is no func
tion for treatment of supply or demand of the labor force.

Some behavioral equations are estimated using constant
values whi:e others run in current terms. Of a total of
thirty-two regression equations twenty-nine have only one
regressor and the rest have two regressors.
32
The model constructed by F. Vakil is based on Keynes
ian aggregate demand approach. The model consists of four
teen behavioral equations with ten exogenous variables.
The model is estimated by OLS over the period 1959-1971. 4
Limited numbers of observations in Vakil's model as well as
in UNCTAD, 1968 precluded the application of consistent re
gressors such as two-stage least squares (TSLS), ?_nd as a
result some of the estimated coefficients may suffer from a
simultaneity bias, due to the correlation between the error
term and independent variables. Furthermore, the coeffi
cients of these models as indicated by t-statistics have a
very limited significance and thus should be used with
great caution. In Vakil's model all variables are measured
in current prices. Thus any projection based on the esti
mated structural equations will include a price inflation
factor. The aggregate demand includes three equations for
consumption, three investment equations, two export func
tions, and two equations for imports. The model also in
cludes equations for net factor income from abroad, private
sector credit, tariff revenues and taxes. There is however
no equation to represent the supply side of the economy.
-- --------. --._----_.-._-- -- .
33
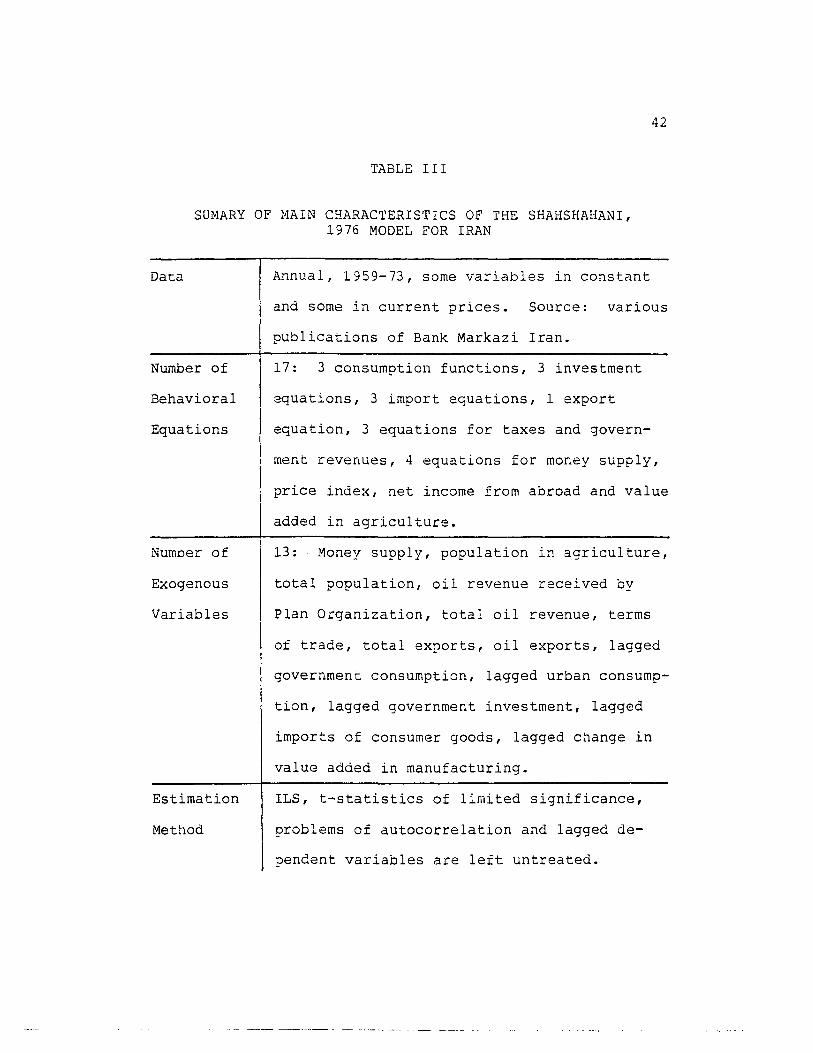
The A. Shahshahani and J. M. Dowling model is basi-
cally a demand oriented system of equations. However an at-
tempt has been made to incorporate some of the features of
an oil-exporting dual economy as well as capital and credit
markeLs through special equations. The monetary side of
the economy is represented by a money supply function and a
price equation. On the supply side there is only one equa-
tion which reflects the relationship between the value
added in the agricultural sector and the total population.
Annual data is used in all cases and the model is fitted
for the period of 1959-73. Variables are measured in con
stant as well as current prices. 6 Because of the limited
number of sample observations and a large number of pre-
determined variables, a variant of TSLS is used to estimate
the coefficients. In addition, the problem of autocorrela-
tion and autoregression, namely the presence of lagged de-
pendent variables on the right side of the equations, are
left untreated. All these problems reduce further the re-
liability of the estimated coefficients.
For a more systematical comparison, see the tabular
survey of models for Iran at the end of this chapter.
Desired Characteristics of a Macroeconometric Model for an Oil-Exporting Dual Economy
Econometric models of developing countries have at-
tracted great attention as tools for planning projections
and policy formulation, but the quality of the models

34
constructed have not been very satisfactory, very often
necessarily so in view of the general lack of data, low
quality statistics and the lack of an appropriate and gener
ally accepted theory of development. 6 H. C. Bos advo-
cates construction of the small models which capture the
essential features of the economy.7 He believes that:
Big models get out of hand. They cannot be explained or documented. They cost a fortune to run. They require data that cannot be found. They are black boxes full of undetectable errors. 8
Bos states that the factors of production and supply
constraints including skills of various types are the main
determinants of economic growth of developing countries.
Thus the standard short run Keynesian model of effective de-
mand must be reconsidered to place more emphasis on supply
equations. Klein, on the other hand, suggests extending de-
tail on the supply side through the use of input-output
data in conjunction with final demand·9 An objection to
such an approach ~s the fact that precisely in the case of
developing countries, interindustry flows are simply too
weak to be of any importance. Furthermore, this type of
model will have to become v8ry large if they are to present
any advantage over smaller and more simple models.
Models for the developing countries in general and
those of the oil-exporting countries in particular, must re-
flect dual nature of those economies. Agriculture plays an
important role, and it is very desirable then to underline
35
this sector through the appropriate supply, demand, and
employment equations. Thus both supply and demand are
brought into play while their specifications will vary from
country to country. In a Keynesian model, the role of a
production funct.ion is to determine the level of labor that
is required to produce output that is demanded. In most
developing countries labor is plentiful, though skilled
labor is lacking. Thus it is of great importance to find
out the level of output that could be proQuced through the
combination of the scarce resource which is capital and
abundant unskilled labor.
The foreign sector plays a large and significant role
in developing economies in general and oil-exporting coun
tries in particular, and should therefore figure prominent
ly in econometric models of these nations. In view of the
import substitution strategies of many developing coun
tries, and demand forming function of imports, it is desir
able to subdivide imports into two distinct categories of
consumer goods imports, and capital and intermediate goods
imports. In the case of oil-exporting countries the export
sector must be also appropriately divided into oil and non
oil exports.
In most developing countries financial sources consist
of entirely a few commercial banks. Commercial banks, how
ever, are more suited to provide short term rather than
long term loans which fit perfectly the needs of the

36
service sector. Other financial intermediaries and capital
markets are simply nonexistent or are in the embryonic
stage. In the case of developed countries the most logical
way of linking monetary sector with the real part in a
model seems to be through the investment function. In the
Keynesian model, the link between the real and the monetary
sector is provided by the interest rate which appeaJ:"s in
the investment specifications. In the developing econo
mies, as we have already mentioned, there are no capital
markets to speak of and interest rates do not represent the
cost of borrowing funds since these funds are basically
rationed rather than auctioned. In the case of oil-export
ing countries, a large part of investments are carried out
by the public sector and private sector investments are
guided almost exclusively by government economic develop
ment policies. In addition, government has been the sup
plier of foreign exchange and low-interest credit. There
fore, for all practical purposes, investment expenditures
can be assumed independent from the market interest rates
and may be incorporated into the model as exogenous vari
able.
Oil revenues make up a large share of national income
and virtually the whole of foreign exchange receipts in the
oil-exporting countries. Government receives and disburses
the oil revenue. As a result the growth of an oil export
ing country to a large extent depends on the public

expenditures. Therefore it is quite necessary to include
the government consumption expenditures as a separate and
distinct equation in the model.
37
38
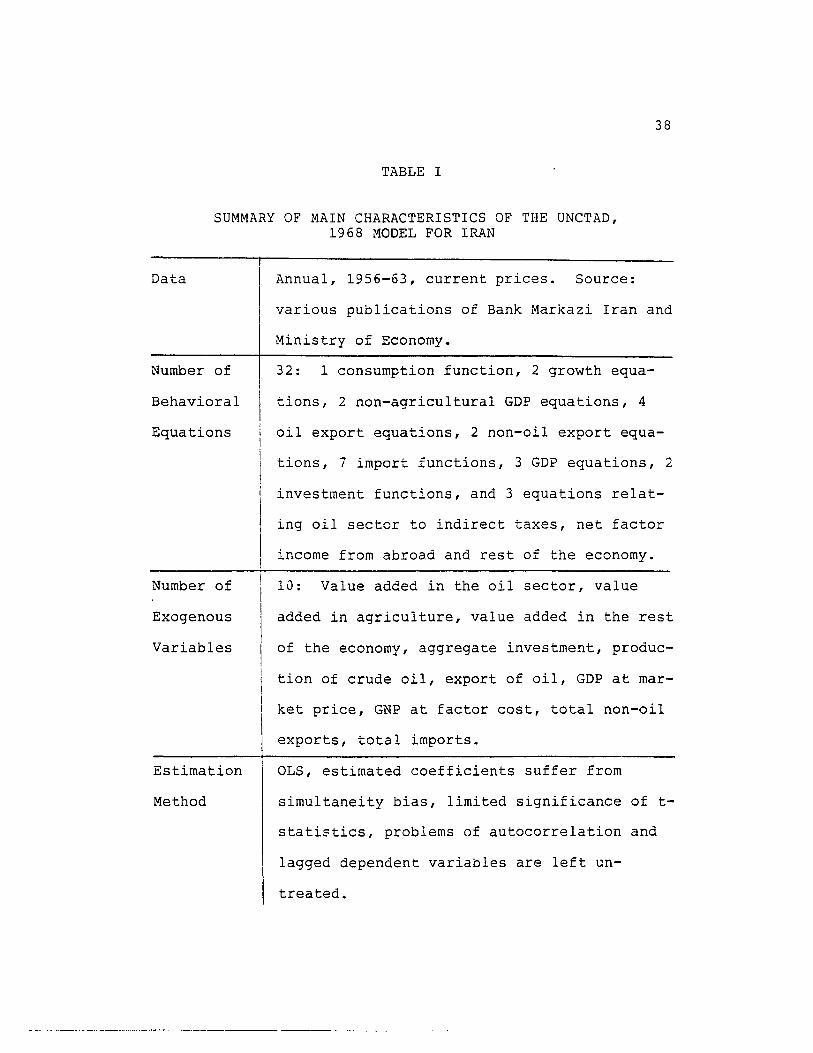
TABLE I
SUMMARY OF MAIN CHARACTERISTICS OF THE UNCTAD, 1968 MODEL FOR IRAN
Data Annual, 1956-63, current prices. Source:
various publications of Bank Markazi Iran and
Ministry of Economy.
Number of 32: 1 consumption function, 2 growth equa-
Behavioral tions, 2 non-agricultural GDP equations, 4
Equations oil export equations, 2 non-oil export equa-
tions, 7 import functions, 3 GDP equations, 2
investment functions, and 3 equations relat-
ing oil sector to indirect taxes, net factor
income from abroad and rest of the economy.
Number of 10: Value added in the oil sector, value
Exogenous added in agriculture, value added in the rest
Variables of the economy, aggregate investment, produc-
tion of crude oil, export of oil, GDP at mar-
ket price, GNP at factor cost, total non-oil
exports, total imports.
Estimation OLS, estimated coefficients suffer from
Method simultaneity bias, limited significance of t-
statistics, problems of autocorrelation and
lagged dependent variables are left un-
treated.
------- --------.-
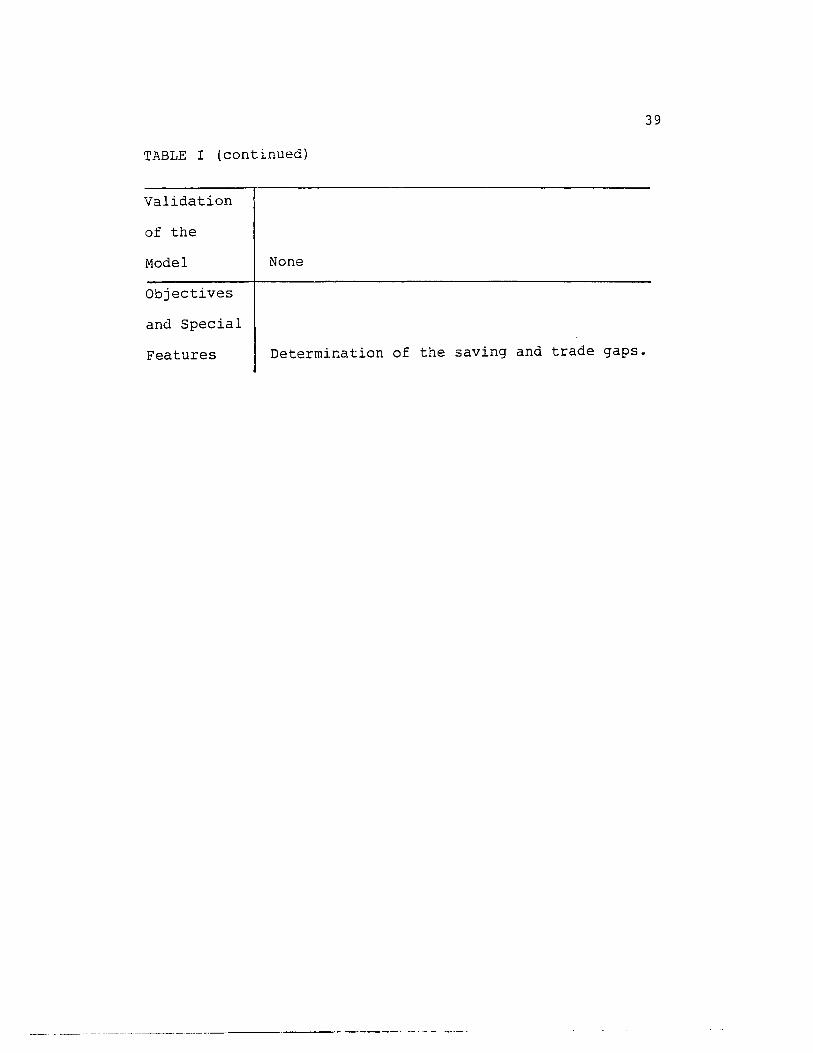
TABLE I (continued)
Validation
of the
Model
Objectives
and Special
Features
None
Determination of the saving and trade gaps.
----------------.- - -,-- -.---,-
39

40
TABLE II
SUMMARY OF MAIN CHARACTERISTICS OF THE VAKIL, 1974 MODEL FOR IRAN
Data Annual, 1959-71, current prices. Source:
Publications by Bank Markazi Iran.
Number of 14: 3 consumption functions, 3 investment
Behavioral equations, 2 export equations, 2 import
Equations equations, 2 equations for taxes, an equation
for private sector and one for net income
from abroad.
Number of 10: Value added in agriculture, rural popu-
Exogenous lation, value added in oil, lagged GNP,
Variables lagged capital imports, wholesale price in-
dex, lagged oil exports, lagged value added
in manufacturing, value added in manufactur-
ing, lagged money supply.
Estimation OLS, estimated coefficients suffer from
Method simultaneity bias, limited significance of t-
-statistics, problems of autocorrelation and
lagged dependent variables are left
untreated.
Validation
of Model None

41
TABLE II (continued)
Objectives
and Special
Features
Forecasting future trends of main macroecon
omic variables for policy analysis.
42
TABLE III
SUMARY OF MAIN CHARACTERISTICS OF THE SHAHSHAHANI, 1976 MODEL FOR IRAN
Data Annual, 1959-73, some variables in constant
and some in current prices. Source: various
publications of Bank Markazi Iran.
Number of 17: 3 consumption functions, 3 investment
Behavioral equations, 3 import equations, 1 export
Equations equation, 3 equations for taxes and govern-
ment revenues, 4 equations for money supply,
price index, net income from abroad and value
added in agriculture.
Number of 13: Money supply, population in agriculture,
Exogenous total population, oil revenue received by
Variables Plan Organization, total oil revenue, terms
of trade, total exports, oil exports, lagged
government consumption, lagged urban consump-
tion, lagged government investment, lagged
imports of consumer goods, lagged change in
value added in manufacturing.
Estimation ILS, t-statistics of limited significance,
Method problems of autocorrelation and lagged de-
?endent variables are left untreated.
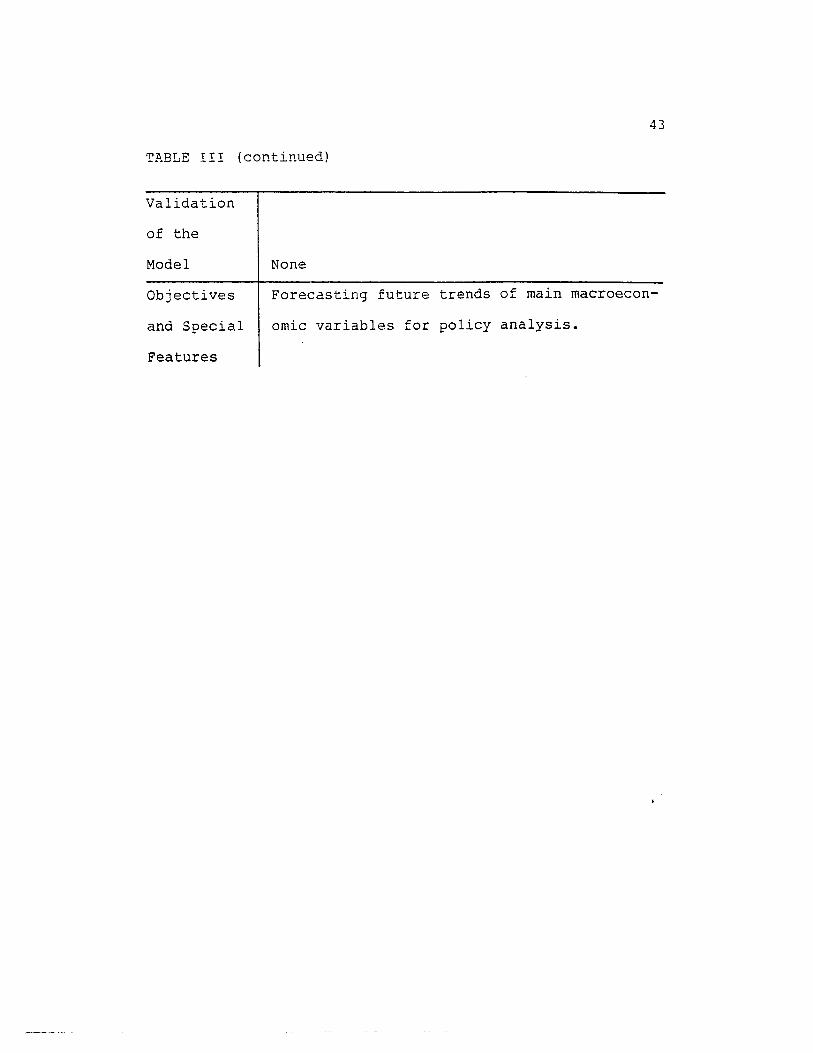
43
TABLE III (continued)
Validation
of the
Model
Objectives
and Special
Features
None
Forecasting future trends of main macroecon
omic variables for policy analysis.
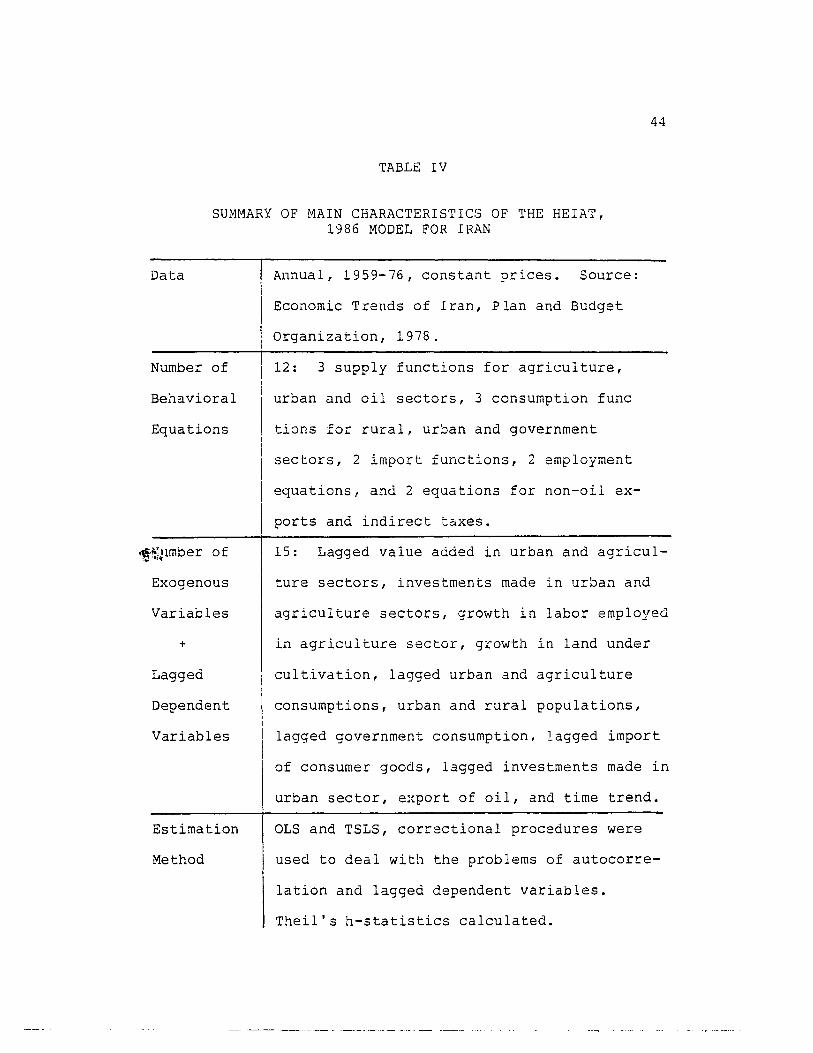
44
TABLE IV
SUMMARY OF MAIN CHARACTERISTICS OF THE HEIAT, 1986 MODEL FOR IRAN
Data Annual, 1959-76, constant prices. Source:
Economic Trends of Iran, Plan and Budget
Organization, 1978.
Number of 12: 3 supply functions for agriculture,
Behavioral urban and oil sectors, 3 consumption func
Equations tions for rural, urban and government
sectors, 2 import functions, 2 employment
equations, and 2 equations for non-oil ex-
ports and indirect taxes.
15: Lagged value added in urban and agricul-
Exogenous ture sectors, investments made in urban and
Variables agriculture sectors, growth in labor employed
+ in agriculture sector, growth in land under
Lagged cultivation, lagged urban and agriculture
Dependent consumptions, urban and rural populations,
Variables lagged government consumption, lagged import
of consumer goods, lagged investments made in
urban sector, export of oil, and time trend.
Estimation OLS and TSLS, correctional procedures were
Method used to deal with the problems of autocorre-
lation and lagged dependent variables.
Theil's h-statistics calculated.
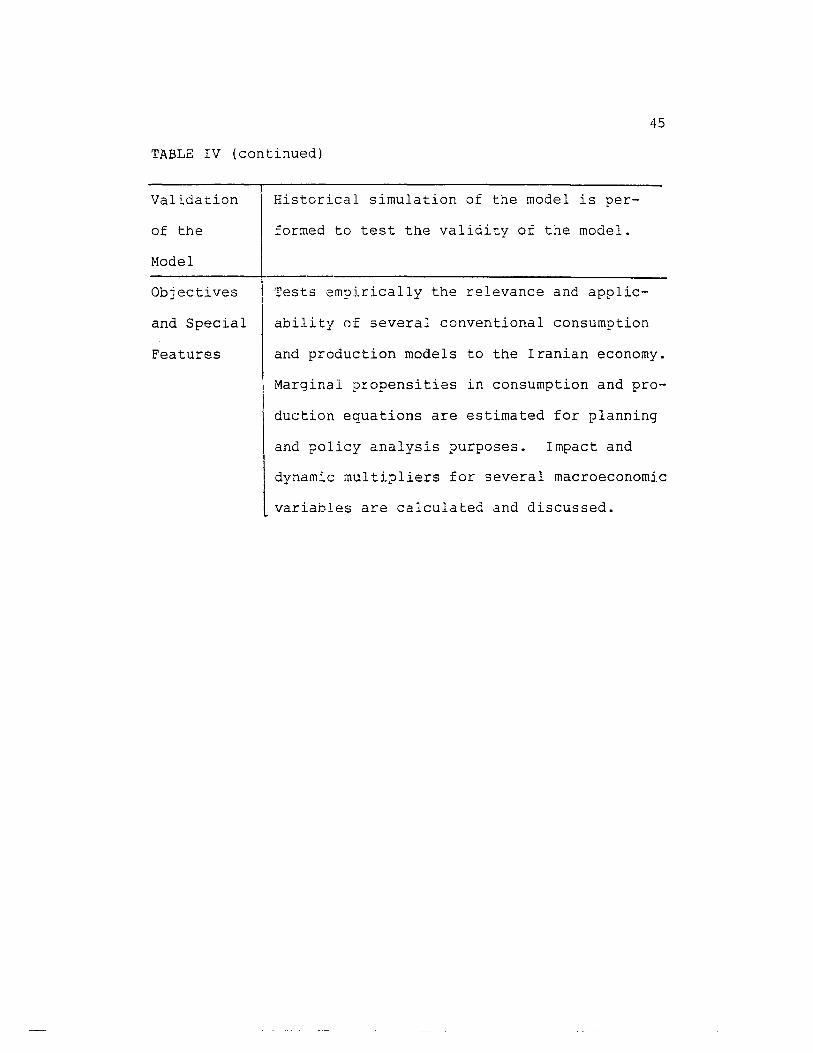
45
TABLE IV (continued)
Validation
of the
Model
Objectives
and Special
Features
Historical simulation of the model is per
formed to test the validity of the model.
Tests empirically the relevance and applic
ability of several conventional consumption
and production models to the Iranian economy.
Marginal propensities in consumption and pro
duction equations are estimated for planning
and policy analysis purposes. Impact and
dynamic multipliers for several macroeconomic
variables are calculated and discussed.

NOTES
lUnited Nations, Trade Prospects and Capital Needs of Developing Countries, (New York: UNCTAD, 1968). This study contains models for 18 developing countries.
2United Nations, Feasible Growth and Trade Gap Projections in the ECAF~ Region, (Bankog: ECAFE, 1968). This study contains models for ten countries. ECAFE also has published a study entitled, Sectoral Output and Employment Projections, (Bankog: ECAFE, 1970). This study contains nine countries including Iran.
3United Nations, 1968, pp. 322-323.
4Firouz Vakil, "An Econometric Model for Iran", Bank Markazi Iran Bulletin, 11 (1972), pp. 115-120; Firouz---Vakil, "An Econometric Model for Iran: Estimated Structural Equations", Bank Markazi Iran Bulletin, 11 (1973), pp. 633-655.
5Ahmad Shahshahani and J. Malcolm Dowling, "An Econometric Model Forecast of Iran, 1975-1985", The Journal of Energy and Development, Autumn, 1976, pp. 148-161.
6Henk C. Bos, "Some Simple Thoughts on Model Building for Developing Countries", The Pakistan Development Review, 22 (1983), pp. 63-71.
7Bos, p. 66.
SBOS, p. 60.
9Lawrence R. Klein, "What Kind of Macroeconometric Model for Developing Economies?" in Readings in Economic Statistics and Econometrics, ed. Arnold Zellner (Boston: Little, Brown and Company, 1968), pp. 559-570.

CHAPTER IV
STRUCTURAL CHARACTERISTICS OF THE IRANIAN ECONOMY
During 1959 and 1976 the Iranian economy experienced a
rapid growt~ in terms of real gross national product.
Tables presented in Appendix A give a summary of quantita
tive changes and structural shiits in the Iranian economy
over the four successive development plans. We do not feel
it is necessary to present a discussion of these plans
partly because information included in Appendix A gives a
clear picture of the pattern of structural changes of the
Iranian economy during the 1959-1976 period, but mainly be
cause they have been discussed in detail elsewhere. Inter
ested readers, therefore, may consult numerous studies
which exist in the literature. 1
This c~apter is devoted to a brief theoretical discus
sion of an aggregative econometric model of the Iranian
economy. The specification of the model and of the indivi
dual equations is determined by three main considerations:
the availability of data, the underlying theory, and con
straints of the Iranian economy. Therefore, after making
some brief remarks about the characteristics of the eco
nomy, we will concentrate on the economic and logical as
pects of the model. In the next chapter, the main concern

will be the empirical results and the statistical methods
involved in specifying and estimating the model.
Characteristics of the Economy
48
The most distinctive feature of the Iranian economy is
the dominant role played by the oil sector in financing the
public ex?enditures as well as developm8nt projects. Thus
it is reasonable to expect that government policies should
be directed toward the transformation of the dynamic oil
sector into an engine of growth. 2 However during 1959-
1976 the forward and the backward linkage effects of the
oil sector on the Iranian economy were very weak. In other
words, the oil industry remained almost independent from
the domestic means of production and the linkages between
the oil sector and the rest of the economy were only
through state consumption and investment expenditures.
The flow of resou=ces between the oil sector and agri
culture sector was the weakest, while that of the foreign
sector was the strongest of all. The direct forward and
backward linkages of the oil sector with the industrial
sector were also insignificant. out the state investment
expenditures placed great emphasis on the urban sector. It
emphasized construction, modern services, heavy industries
and modern consumer oriented light industries. It employed
the latest capital-intensive as well as skill-intensive
modern technology, but after almost two decades of
49
importing expensive machinery and foreign expertise, the
Iranian economy ended up witn "hollow" industries. These
were industries that did little or no domestic manufactur
ing, and lacked their own p~oduction base.
This being the case, an econometric model for an oil
exporting country like Iran should reflect the flow of the
financial resources from the oil sector to the rest of the
economy, rather than the opposite direction suggested by
Lewis, Pei-Ranis and Jorgenson ty?e models, where the flow
of resources are from the agriculture sector to the other
indigenous sectors. Furthermore, surplus resource in an
oil exporting country in contrast to labor surplus economy
is exhaustible and the supply of trained labor force and
skilled managers is very limited. So in general it may be
argued that in order to generate direct linkages between
the oil sector and the rest of the economy, indigenous pro
duction capacity of industry as well as of agriculture
sectors should be expanded through diversification and in
crease in the productivity of these sectors, and developing
a large pool of skilled labor. This strategy is not how
ever easy to implement; it would take too long and its plan
ning and execution would require the kind of administration
and dedication which did not exist in Iran during the per
iod under consideration.
As we discussed in Chapter II, the additional produc
tive capacity in developing countries creates its own

50
demand. But in the case of Iran and most of the oil 8xport
ing developing nations, a large ?roportion of income re
ceived by urban households, particularly those in higher in
come groups is not due to their own productive effort.
That is why the Iranian economy consumed the equivalent of
nearly all that it produced. In other words, the total out
put of agriculture, industry and services was almost equal
to consumption of goods and services. It is assumed that
as the economy develops, the oil-based growth will be re
placed by a moderate consumption-based growth which is
generally the case in the industrialized countries. 3
This orientation toward a consumption-based economy was in
accordance with the modernist approach to development which
believes that the higher living standards must be the pri
mary goal of the developing countries. 4 This consumption
based orientation toward the economy in an oil-exporting
country like Iran resulted however, in a concentration of
both private and state consumption expenditures in urban
areas in the form of growing consumption of cars, home ap
pliances, palatial housing, and entertainments offered by
restaurants and night clubs by the higher income groups in
the capital and a few large cities. In this study we can
not consider the consumption behavior of different income
groups, but the available data provide some information
about the broader aspects of private and public consumption
in Iran during 1959-1976. The private consumption can be

51
divided into rural and urban categories, and the role of
the government is reflected through a separate consumption
function which emphasizes the oil sector as a major deter
minant of government expenditures.
In view of the fact that the development process in a
developing country like Iran was not based on innovation
but on the assimilation of the existing technology through
importation of modern capital equipment, semi-finished
parts and raw materials, two different functions for im
ports of goods and services and imports of capital and
intermediate goods are included in the model. Exports may
also be dis aggregated into oil and non-oil exports which
represent the dominant role of the oil sector in the
foreign trade.
Specification of the Model
In the econometric model that follows, an attempt has
been made to elucidate the mechanisms of the Iranian econ
omy. Some of the concerns of the last two chapters are in
corporated in the model. But other concerns are not ade
quately treated. Considerable compromises have been made
between constructing an ideal model of an oil-exporting
dualistic economy and the available data. These compro
mises have been most substantial with respect to demo
graphic and institutional factors, infrastructure, capital

52
and capacity restraints in production sectors, distribution
of income and rural-urban migration.
On the other hand, the model does include a number of
important considerations of the last two chapters. The con
ventional duality which distinguishes between the tradi
tional rural and the modern urban sector as well as private
and public duality reflecting the importance of the oil
sector are represented in the consumption, supply, employ
ment and foreign trade equations.
terns:
The structural model consists broadly of five subsys-
(a) consumption expenditures
rural private
urban private
government
(b) foreign trade
imports of consumer goods
imports of capital and intermediate goods
non-oil exports
(c) production (value added)
value added in agriculture
value added in urban sector
value added in oil sector
(d) employment
labor employed in agriculture sector
labor employed in urban sector
53
(e) ~~direct taxes
net indirect taxes
The proposed model for Iran consists of two parts: de
mand and supply. On the demand side, consumption and im
ports are analyzed. Investments made in agricultur8 and
urban sector are assumed to be exogenous in respect to the
model. There are two basic reasons for making this assump
tion. First, the model is only concerned with the real
part of the Iranian economy and monetary factors such as in
terest rate, supply of money and credits are excluded from
the model. Second, in contrast to the classical case, in
an oil-based economy, investments largely depend on the oil
revenue and public expenditures and hence are independent
from output and production capacity.
The supply side of the model includes supply equations
for value added in agriculture, value added in urban sec
tor, and value added in oil sector.
Given the agriculture and urban employment functions,
and indirect taxes equation, there are a total of seventeen
endogenous variables and a total of seventeen equations
which make the model a complete system.
There are thirty-two variables in all, fifteen of
which are predetermined, consisting of seven lagged endogen
ous variables and eight exogenous variables.

List of Variables
(a) Endogenous Variables
VAA value added in agriculture
GVAU growth in value added in urban sector
VAO value added in oil sector
NIT net indirect taxes
CR private rural consumption
CU private urban consumption
CG government consumption expenditures
IMC imports of consumer goods
IMK imports of capital and intermediate goods
EXNO exports of non-oil goods
LA labor employed in agriculture
GLU growth in labor employed in urban sector
VAU value added in urban sector
GOP gross domestic product
EX total exports
1M total imports
LU labor employed in urban sector
(b) Predetermined Variables
Exogenous
INVA investment made in agriculture
GLA growth in labor employed in agriculture
GLAND growth in area under cUltivation
INVU investment made in urban sector
54
INVUl investment made in urban sector lagged one
year
POPR rural population
POPU urban population
EXO exports of oil
Lagged Endogeno~s
VAAl value added in agriculture lagged one year
VAUl
CRl
CUl
value added in urban sector lagged one year
rural consumption lagged one year
urban consumption lagged one year
55
IMCl
LUl
CGl
imports of consumer goods lagged one year
labor employed in urban sector lagged one year
government consumption lagged one year
Consumption Expenditures
The consumption function is mostly a Keynesian inven
tion though the relation was known before Keynes. Accord
ing to the "fundamental psychological law" suggested by
Keynes, people will increase their consumption as income in
crease, but not by as much as the increase in income. 5
From this and other RS3umptions the consumption function
may be 'summarized as follows:
(a) Aggregate consumption may be a fUnction cf a number of
variables, but income is the most significant one, and
hence we have:
Ct = f(Yt) where

C = real consumer expenditures
Y = real disposable income
(b) The money value of the wealth affects the short run
propensity to consume of the "Wealth owning class".
56
(c) The short run marginal propensity to consume (MPC) is
less than the long run MPC, because the consumer's
habitual standard of living is more flexible in the
long run than in the short run.
(d) Even in the long run, "as a rule a greater proportion
of income (will be) saved as real income in
creases".6
During the ~ost World War II era, the C = a + by
a > 0 0 < b < 1 function was used to predict the behavior
of consumption in industrialized countries. Y is the per
capita disposable income and b is the MPC, which is ,assumed
to be less than average propensity to consume (APC or C/Y) •
APC is also assumed to decline as income rises. This ver
sion does not distinguish between the short run and long
run MPC and does not allow for the effect of we~lth on con
sumption. It invariably underestimated the consumption dur
ing the post war period in the industrialized economies
when time series data were used to predict the consumption
behavior. Later studies by Kuzenets and others showed the
long run constancy of APC instead of its decline as income
increases. 7
57
Cross section data, on the other hand supported the
above formulation and fitted industrialized countries data
rather well. This paradox led to a great deal of research
to find a more appropriate explanation of consumption func
tion ana the reconciliation of the time series and cross
section results.
Brown hypothesized that people do not adjust their con
sumption to changes in income immediately, but the process
takes place slowly and habit is an important factor j.ll con
sumption. Therefore, Brown suggested the following formu
lation:
Ct = a + bYt + dCt-l
Where Ct-l is the consumption in the previous period used
as proxy variable for habit.
Another work attempting to provide a better understand
ing of consumption is Duessenberry's Relative Income Hypoth
esis. He argued that consumers tend to follow their habit
ual patterns of behavior. As income increases, they con
sume more but adjust slowly to their new affluence. On the
other hand, when income drops, they resist any lowering of
consumption standards to which they have become accus
tomed. 8
One of the most important studies done in terms of con
sumption function is that of Friedman's Permanent Income
Hypothesis (PIH). It brings time into consideration and
tries to explain the consumption behavior in terms of
58
expected future incomes. According to Friedman, people
determine their purchases called permanent consumption in
accordance with their permanent income and in fact propor
tional to it. Permanent income is defined as the amount
the consumer would consume which would leave his wealth
intact. Permanent consumption, on the other hand, is the
amount the consumer is intended to consume. So it is
hypothesized, by generalization, that aggregate permanent
consumption is proportional to aggregate permanent income.
The factor of proportionality itself depends on the rate of
interest, and taste:
Cp = KYp
Where K is the factor of proportionality.9 The Cp =
KYp equation cannot be used for empirical estimation by
time series. Permanent consumption does not present much
problem, since it is nearly equal to actual consumption,
and the latter may be used as a proxy for permanent consump
tion. A proxy must be found for permanent income, since it
includes future earnings that are not known in advance.
Past incomes, however, would best approximate the future
incomes and geometrically declining weights are used for
these incomes to attach less importance to the most distant
incomes. Consumption is, therefore, expressed as function
of lagged values of income. But the numbers of observa
tions, from time series required to estimate this equation
is large and cannot be used for our purposes. To overcome

59
this problem Koyck transformation is perfor~2d to get an
alternative format with less coefficients to be esti-
mated. 10 The new format is
Ct = b'Yt + d'Ct-1
If we compare this equation with the Brown's Formula-
tion of consumption function, we could see that the differ-
ence is only in the constant a, which is included in
Brown's Formulation and not in Friedman's equation:
Brown Ct = a + bY + dCt-1
Friedman Ct = e'Y + d'Ct-1
The difference is important since only Friedman's hy-
pothesis states that APC is constant in the long run and is
equal to long run MPC. Notice should be taken of the fact
that the constant long run APC contradicts the Keynes' no-
tion of APC. Both Friedman's and Brown's hypothesis distin-
guishes between short run and long run MPC's. Short run
MPC for Friedman's equation is equal to b ' and for Brown's
it is equal to b. If the consumption grows at the rate of
g per year \ignorin~ short-term fluctuations), then long
run MPC's can be found by putting
Ct = (1 + g)Ct-l
(
0 1 Ct-1 = l+g) Ct
Long Run MPC (Brown)
in both equations
= b(l+g) l+g-d
Long run MPC (Friedman) = b' ( l-t-g ) lTg-d'

60
Several other interesting theories introducing wealth,
liquid assets and distribution of income into determination
of consumption function are to be skipped largely on the
grounds of unavailability of Iranian data for their empiri
cal estimation.
We used Keynesian, Brown's and Friedman's formulations
to estimate consumption behavior in the Iranian economy.
Taking into consideration the basic characteristics of the
Iranian economy, we tried to disaggregate the consumption
function into three different equations, where the "oil"
and "urban-rural" duality are emphasized.
The urban-rural duality which is represented by co
existence of a relatively large, stagnant agriculture sec
tor with a relatively small but growing and active urban
sector is reflected by dividing the private consumption in
to rural and urban consumption functions. The oil duality
is emphasized by introducing the oil exports as a major
determinant of the government consumption expenditure equa
tion. The consumption relationships are as follows:
Rural
CR = a + bVAA
CR = a + bVAA + dCRi + ePOPR
CR = b'VAA + d'CRi + e'POPR
Urban
CU = a + bVAU + ePOPU
CU = a + bVAU+ dCU1 + ePOPU
CU = b'VAU + d'CU1 + e'pOPU
Government
CG = a + bCG1 + dNIT
61
The rural consumption function describes the con
sumer's expenditures in the rural areas in terms of value
added in agriculture (VAA), rural consumption lagged one
year (CR1) and rural population (POPR). Value added iD
agriculture is a good proxy for disposable income in the
rural sector, in which subsistence conditions and a barter
type transactions prevails.
The urban consumption function describes the consump
tion expenditure of the dynamic non-subsistence sectors of
the economy. Here again the value added in urban sector is
used as a ?roxy for urban disposable income. Its inclusion
is basically justified, since the collected direct income
taxes are not significant, and households to a large extent
relate their consurr.ption expenditures to value added in
urban sector.
The government consumption expenditure (CG) which con
sists of the government's purchases of goods and services
are not usually subject to the same type behavioral con
straints as private consumption. Little is known about the
behavior of public expenditures and they may be assumed to
be autonomous or a simple function of taxes collected. How
ever, in the case of Iran, in the absence of disaggregated

62
data on CG, and lack of consistent series on direct taxes
we consider CG to be dependent on the net indirect taxes
and immediately preceding level of CG. The underlying
theoretical justification is the idea that CG is subject to
a previously established level of expenditures, as well as
the current level of taxes. The inclusion of CG in the
model emphasizes the private-public sector duality dis
cussed before by reflecting the importance of the public
sector as a major contributor to the total expenditures.
Foreign Trade Relations
The foreign trade relations consist of imports and ex
ports of non-oil commodities.
In general imports are related to changes in national
income and the price of imported commodities relative to
domestic goods. For instance, in the model developed by
Klein, imports are a function of changes in real income,
lagged value of imports and the ratio of import prices to
domestic prices. Thinking along the same lines, exports
are related to the volume of world trade and the ratio of
export prices to domestic prices. 12
However, for a developing country like Iran who was
following a strong policy of import substitution over the
period under consideration, total imports may conveniently
be divided into consumer goods imports (IMC), and capital
and intermediate goods imports (IMK). This division

delineates those goods intended to currently increase the
level of material welfare and those intended to further
economic growth.
63
The export sector has been appropriately divided into
oil and non-oil. This division carries an important ratio
nale from the point of view of the oil-based strategy of
economic development pursued by the pre-revolutionary
government of Iran. Since the oil sector had virtually
been independent from the rest of the Iranian economy, and
the export of oil as well as its price were determined by
factors outside the system, EXO is assumed to be an exogene
ous variable.
The import and export relationships are as follows:
IMC = aO + alGOP + a2 IMCl
IMK = bO +blINVU + b2VAU1
EXNO = Co + cIVAA
Imports of consumer goods, IMC, were assumed to be a
function of gross domestic product and lagged imports of
consumer goods. GOP is serving as a proxy for aggregate
income. Since consumer goods are purchased mainly by con
sumers, the lagged import term is also relevant because it
reflects the habits in consumer behavior as well as purchas
ing patterns of businessmen.
Imports of capital and intermediate goods were assumed
to be a function of both private and public investment in
64
urban sector and value added in urban sector lagged one
year. This formulation is justified because in the case of
Iran IMK is largely a function of import substitution poli
cies aimed at a rapid industrialization process, rather
than an incremental process inherent in the supply and de
mand mechanism.
Non-oil exports are assumed to be simply a function of
value added in agriculture. The value added in agriculture
is meant to be a prexy for traditional exports such as
dried fruits, carpets and caviar, etc. The VAA also prox
ies the growth of agri-business activities and other light
consumer goods industries which are traditionally the ini
tial activities of industrialization in most developing
countries.
Production Functions
The traditional theory specifies total output as a
function of two inputs, capital stock and labor. Capital
and labor are assumed to be continuous (and twice differ
entiable) and substitutable variables in production at all
times. Problems associated with this kind of highly aggre
gated production functions are very well known and are dis
cussed extensively in the Ii .erature. However, production
could be disaggregated into sectoral functions such as man
ufacturing~ mining, construction and so forth. But unfor
tunately disaggregated capital input data are not available

65
for the Iranian economy, and the data for aggregated capi
tal stock for the whole economy are calculated based on
very simplistic assumptions and hence are not very reli
able. 13
A further possibility is to estimate the supply func
tion by breaking down the total output into sum of four com
ponents. In the case of urban sector the factors which in
fluence the cur.rent output may be broken down into value
added in the urban sector lagged one year which serves as
proxy for the production capacity of the urban sector in
the previous period, investments made in the urban sector,
increase in labor employed in urban sector and other fac
tors as represented by constant terms. In the case of agri
culture sector, in aduition to the foregoing factors
changes in the land under cultivation should also be in
cluded.
In our model the following linear supply functions are
suggested for the agriculture and urban sectors:
VAA = aO +alVAAl + a2INVA + a3GLA + a4GLAND
VAU = bO + blVAUl +b21NVUl + b3GLU
where al = bl = 1
Notice that since coefficient of VAUI is assumed to be
unity, the actual specification of the supply function for
estimation purposes can be derived as follows
VAU = bo + VAUI + b2 INVUl + b3 GLU
subtracting VAUI from the both sides
then
VAU - VAUl = bo + b2 INVUl + b3 GLU
let GVAU = VAU - VAUi
where GVAU = growth of value added in urban sector
GVAU = bo + b2 INVUi + b3 GLU
is the estimation form of our supply function.
Value added in oil sector is simply assumed to be a
function of exports of oil
VAO = Co + Cl EXO
Employment
66
The following equations are used to describe the labor
employed in both agriculture and urban sectors:
LA = a o + aiINVUl + a2INVA
LU = bo + bi LUl + b2INVUl
assuming bi = 1 then GLU = bO + b2 INVUi
Labor employed in agriculture is expressed to be a
function of investments made in agriculture (INVA) as well
as investments made in the urban sector. Growth in labor
employed in urban sector depends on the investments made in
the urban sector lagged one year.
Indirect Taxes
Since there are no sales taxes in Iran, custom taxes
comprise a great portion of indirect taxes collected by the

67
government. Net indirect taxes, therefore, may be assumed
to be a function of value of total imports:
NIT = do + dl 1M
NOTES
1For a sample of studies on the Iranian economy and its development see J. Amuzegar and M. A. Fekrat, Economic Development Under Dualistic Conditions, (Chicago: University of Chicago Press, 1971); J. Amuzegar, Iran, An American Profile, (Washington, D.C.: Middle East Institute, 1977); J. Bharier, Economic Development in Iran: 1900-1972, (New York: Oxford University Press, 1971); R. Looney, The Economic Development of Iran: A Recent Survey with Projections to 1981, (New York: Praeger Publishers, 1973); H. Katonzian, The Political Econo~y of Modern Iran 1926-1974, (New York: New York University Press, 1981). See also articles published in specialized journals, e.g., The Middle East Journal and Tahghight Eqtesadi.
2J. Amuzegar and M. A. Fekrat, pp. 147-163.
3Firouz, Vakil, "Iran's Basic Macroeconomic Problems: A Twenty-Year Horizon", Economic Development and Cultural Change, July 1977, pp. 713-727.
4H. C. Wallich, "A Theory of Derived Development", in A. N. Agarwala and S. P. Singh, eds., The Economics of Underdevelopment, (New York: Oxford University Press, 1963), p. 159.
5John M. Keynes, The General Theory of Employment, Interest and Mon~, (I,ondon: Macmillan, 1963), p. 114.
6M. K. Evans, Macro~conomic Activity: Theory, E.'0recastin.!l!-~n~Control, (New York: Harper and Row, 1969), p. 14.
7Paul Wonnacott, Macroeconomics (Homewood, Illinois: Richard D. Irwin, Inc., 1984), pp. 221-227.
8M. K. Evans, pp. 17-19.
9M. K. Evans, pp. 19-21.
10M• K. Evans, pp. 22-24.
11M• K. Evans, pp. 24-25.
12David G. Mayes, Applications of Econometrics, (Englewood Cliffs, New Jersey: Prentice Hall International, 1981), pp. 260-272.

69
13AS will be mentioned in the next chapter, this type of aggregate production function gives unsatisfactory results for developing economies such as Iran even with heroic assumptions made for constructing relevant time series.
CHAPTER V
ESTIMATION AND EVALUATION OF THE MODEL
In this chapter we will focus our attention on the
estimation and statistical properties of the model. The
model in its general form consists of twelve stochastic
equations with unknown parameters to be estimated from the
historical time series data and subject to random error
terms. In addition there are two identities. All the
stochastic equations have been specified as linear rela
tionships with a lag structure of a single period. Annual
data in constant prices were used in all cases. Further
more, historical simulation was performed to test the
validity of the model. In general the results were quite
satisfactory and indicated an overall statistical fit of
the estimated model.
Basic Aspects Of Data Limitation
In dealing with econometric models of developing coun
tries, empirical studies are severely constrained by the
unavailability of reliable, consistent, and detailed data
over a sufficiently long period of time. The available
data of most developing countries present several problems
to the econometrician. First, national income accounts
have not been adequately developed and they should be
_. -- --- ----- --- .. --.---.-- -- _.
71
revised periodically. But these revisions not only affect
the estimates but also the conclusions drawn from the
models. The basic difficulty particularly arises when all
figures do not undergo a revision of any comparable magni
tude. Second, consistent data are available for only lim
ited periods of time, while detailed data may not exist in
some areas at all. Limited number of observation creates
severe estimation barriers and makes the application of
more efficient estimators impossible. Paucity of data is
certainly a constraint, but it is precisely this situation
that poses a challenge to the econometrician. To some ex
tent, problems involved could be surmounted, depending on
the situation, by judicious use of what is available in
terms of data. Third, given the lack of adequate legiti
mate data, the developing countries may provide data of
very low quality. Some items in the national income ac
counts are estimated through some mechanistic formula in
volving other items in those accounts rather than indepen
dently estimated. In some cases price deflators used to
convert nominal values into real ones are not reliable. In
other cases, unrefined data not only have their source in
the questionable deflators, but also in multiple or fre
quently changing exchange rates. These problems may lead
to constructing models with errors in the variables. When
there are errors in measuring an independent variable, the
fourth assumption of the Classical Linear Regression (CLR)
72
model is violated, since the independent variables may not
be independent any more from the disturbance term. Thus,
the OLS estimator is biased even asymtotically and instru
ment variable method or weighted regression must be used to
deal with this problem. 1
Data on the Iranian economy entails many aforemen
tioned difficulties. Up to 1959, data was available only
for some major economic variables. But statistics pub
lished by different sources were often inconsistent with
one another. In this study the model is estimated over the
period 1959-76, for which the information division of Plan
and Budget Organization did publish during 1975-78 a set of
tables under the name of "Economic Trends of Iran" with an
nual data for a relatively large number of variables. 2
Economic Trends of Iran was a regular publication based on
a computerized data storage and retrieval system as well as
a computerized printing system containing the latest econo
mic statistics. It was basically a response to "lack of
data" problem as well as to provide a comprehensive coher
ent and consistent set of data in one volume. Annual data
in constant prices has been used in all cases.
Although, the quality and size of the data on Iranian
economy had been improved in the Economic Trends of Iran,
the reliability of the data is still far from satisfactory.
The general unreliability of data has its source mostly in
the rural sector. Several time series, such as consumption
73
and investment are constructed on the basis of small sam
ples or simplistic assumptions. Data on important items
like capital stock, food consumption, unemployment, imports
of food, wage rates simply are not available.
In spite of these problems, we have taken the chal
lenge with the hope that our study equipped with relatively
improved data and superior estimation techniques in compari
son to the previous studies may provide some useful in
sights in regard to the structure and operation of the
Iranian economy.
Estimation Procedures
The estimation and simulation of the model is carried
out by Time Series Processor (TSP) econometric package.
Equations are estimated by Ordinary Least Squares (OLS) and
Two-Stage Least Squares (TSLS). To overcome the problem of
autocorrelation and to obtain efficient estimates, first
order serial correlation (AR1) procedure proposed by Beach
and McKinnon is used to estimate equations whose distur
bances displayed first order serial correlation. 3
System estimating procedures such as 3SLS and FIML
estimate all the identified structural equations together
as a set, instead of estimating the structural parameters
of each equation separately. Their main advantage is that
because they incorporate all of the available information
into their estimates, they have a smaller asymptotic

74
variance-covariance matrix than single equation estimators.
By the same token, however, if the system is misspecified
the estimates of all the structural parameters are af
fected, rather than, the estimates of the parameters of
only one equation which may happen in the case of single
equation estimation. Furthermore, the 3SLS and FIML impose
very strong degrees of freedom requirement on a system.
Computation of system methods require that the number of
observations must be equal or greater than the number of
parameters in the model: 4 ,5
where
T > m + n
T = number of observations;
m = number of regressors in the model;
n = number of equations.
Clearly, the degrees of freedom requirement demanded
by system methods makes the application of these estimators
impossible as far as our model is concerned.
As stated earlier system methods are very sensitive to
the correct specification of the entire model. A specifica
tion error in one equation would affect the estimates of
parameters in all equations of the model. The possibility
of making specification errors is much higher in the
smaller models since there are limited number of variables
to choose from for the purpose of specification. The
chances of committing specification errors are also greater
in construction of models for developing countries where no
75
sound and well-established theories are av~ilable. Under
these conditions the application of TSLS has been highly re
commended. 6
Presentation of Estimated Equations variables used in
the estimation are measured in 1959 constant prices, and
thousands of persons. Consistent sets of data are only
available for the period of 1959-1976.
The results of the estimation of the model will be re
presented next, but generally speaking the statistical re
sults are quite satisfactory considering high values of the
adjusted coefficient of determination and the size of the
regression coefficients relative to their standard errors.
The Durbim-Watson and h statistics also indicate that most
regressions are relatively free from first order serial
correlation in disturbances.
In cases where TSLS and OLS yield almost the same re
sults, estimates of TSLS are only reported.
Private Consumption Equations
The private consumption expenditure equations reported
in this section are estimated by using functional formula
tions suggested by Friedman, Erown, and Keynes. Iran's pop
ulation had been rising rather fast at around 3.1 percent
annually over our observation period. Some of the increase
in consumption may therefore be attributed to rise in the
population in general which can be accounted for by the
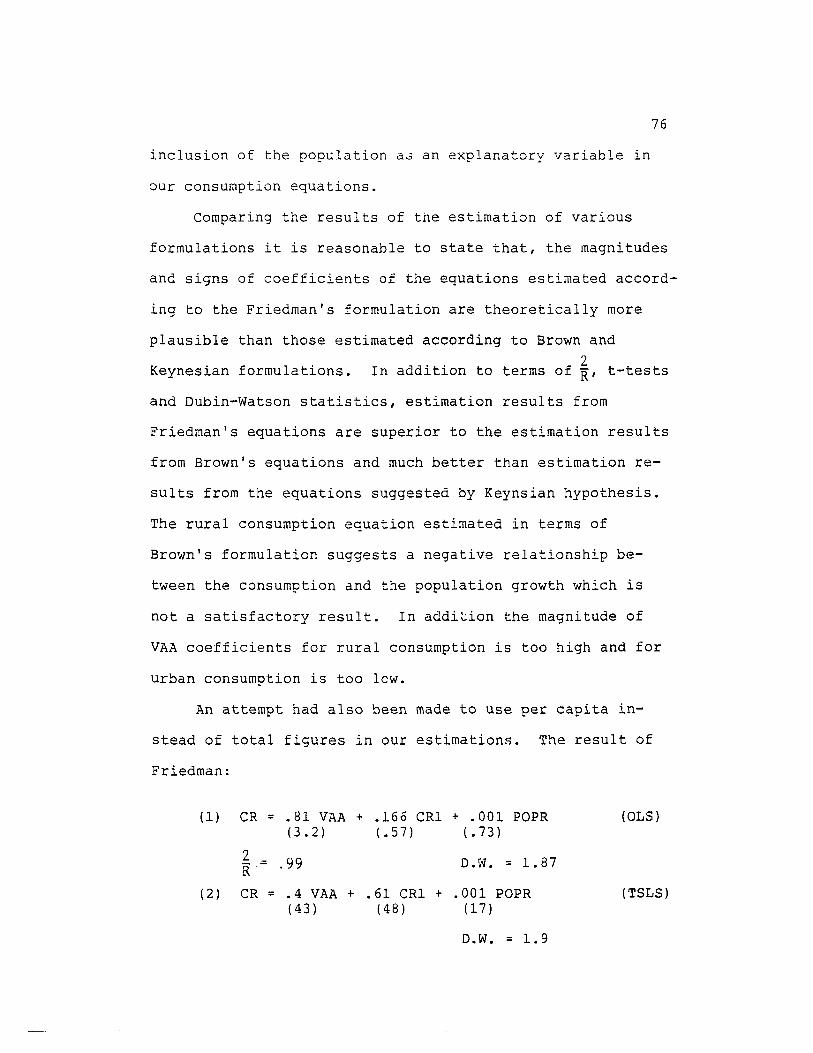
76
inclusion of the rorulation a~ an explanatory variable in
our consumption equations.
Comparing the results of the estimation of various
formulations it is reasonable to state that, the magnitudes
and signs of coefficients of the equations estimated accord-
ing to the Friedman's formulation are theoretically more
plausible than those estimated according to Brown and
Keynesian formulations. 2
In addition to terms of R' t-tests
and Dubin-Watson statistics, estimation results from
Friedman's equations are superior to the estimation results
from Brown's equations and much better than estimation re-
suIts from the equations suggested by Keynsian hypothesis.
The rural consumption equation estimated in terms of
Brown's formulation suggests a negative relationship be-
tween the consumption and the population growth which is
not a satisfactory result. In addi~ion the magnitude of
VAA coefficients for rural consumption is too high and for
urban consumrtion is too lew.
An attempt had also been made to use per capita in-
stead of total figures in our estimations. The result of
Friedman:
(1) CR = .81 VAA + .166 CR1 + .001 POPR
2 R
(3.2) (.57) (.73)
.99 D.W. = 1.87
(2) CR = .4 VAA + .61 CRI + .001 POPR (43) (48) (17)
D.W. = 1.9
(OLS)
(TSLS)
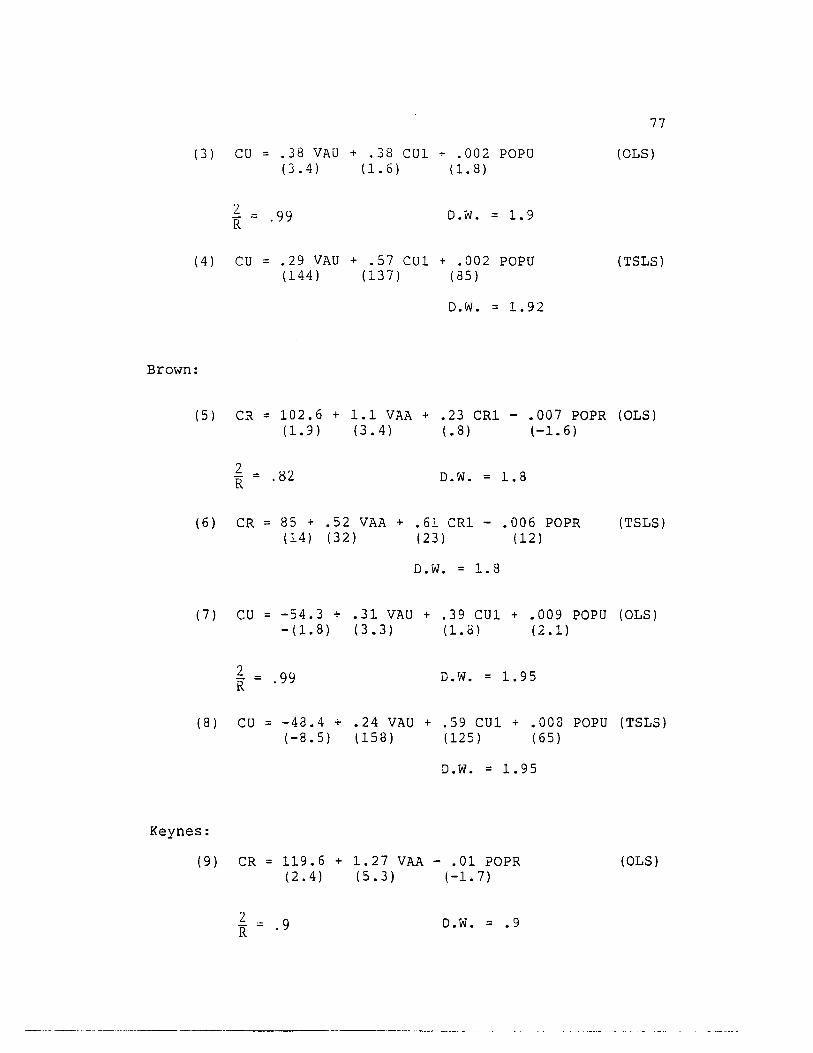
77
(3 ) CU = .38 VAU + .38 CU1 + .002 POPU (OLS) (3.4) (1. 6) (1. 8)
2 . 99 D.W • :: 1.9 R
(4 ) CU :: .29 VAU + .57 CU1 + .002 POPU (TSLS) (144) (137) (85)
D.W. = 1. 92
Brown:
(5 ) CR = 102.6 + 1.1 VAA + .23 CR1 - .007 POPR (OLS) (1. 9) (3.4) ( .8) (-1.6)
2 R = .~2 D.W. :: 1.8
(6 ) CR :: 85 + .52 VAA + .61 CR1 - .006 POPR (TSLS) (14) (32 ) (23 ) (12)
D.W. = 1.8
(7 ) CU = -54.3 + .31 VAU + .39 CU1 + .009 POPU (OLS) - (1. 8) (3.3) (1.8) (2.1 )
2 _ . 99 D.W • = 1. 95 R -
(8 ) CO = -48.4 + .24 VAO + .59 CU1 + .008 POPO (TSLS) (-8.5) (158) (125) (65)
D. W. = 1. 95
Keynes:
(9) CR = 119.6 + 1.27 VAA - .01 POPR (OLS) (2.4) (5.3) (-1. 7)
2 R - .9 D.W. = .9
- ... - -_ ... __ . __ ._-_._--- .----- --'-'---"-'- -- _ ....
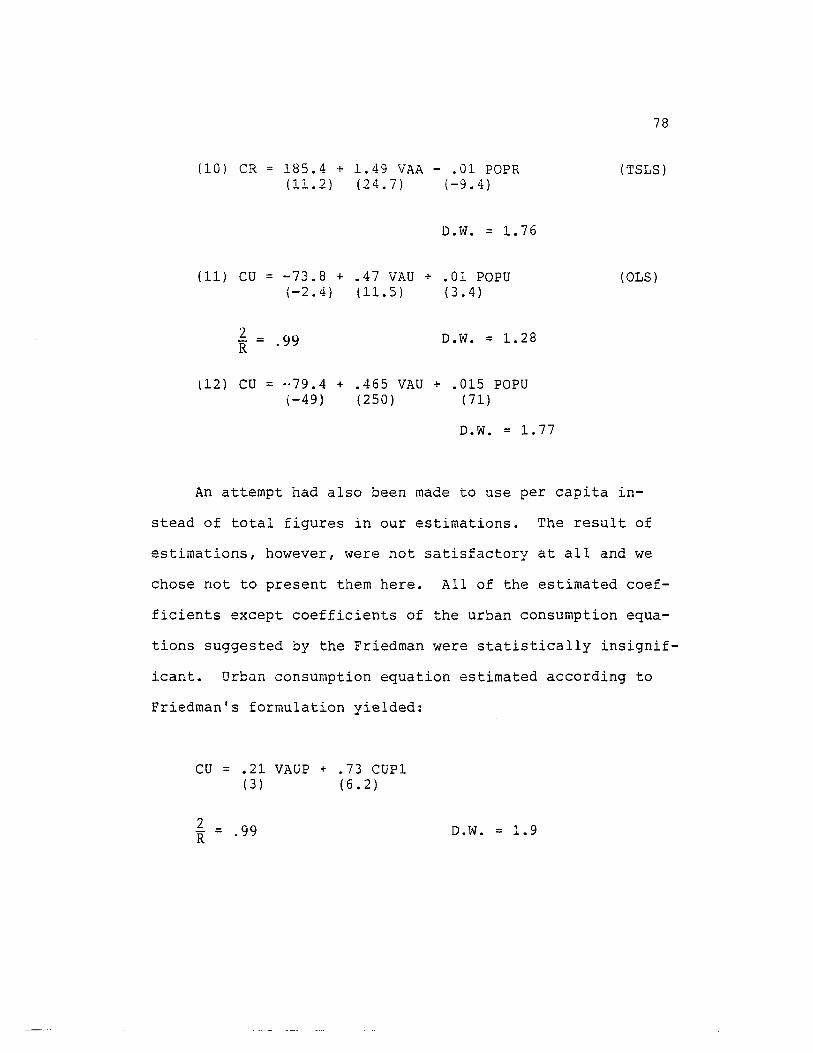
78
(10 ) CR = 185.4 + 1. 49 VAA - .01 POPR (TSLS) (11.2) (24.7) (-9.4)
D.W. = 1. 76
(11) CU = -73.8 + .47 VAU + .01 POPU (OLS) (-2. 4) (11.5) (3.4)
2 R = . 99 D.W • = 1. 28
(12 ) CU = ··79.4 + .465 VAU + .015 POPU (-49) (250) (71)
D.W. = 1. 77
An attempt had also been made to use per capita in-
stead of total figures in our estimations. The result of
estimations, however, were not satisfactory at all and we
chose not to present them here. All of the estimated coef-
ficients except coefficients of the urban consumption equa-
tions suggested by the Friedman were statistically insignif-
icant. Urban consumption equation estimated according to
Friedman's formulation yielded:
CU = .21 VAUP + .73 CUP1 (3) (6.2)
2 R = .99 D.W. = 1.9
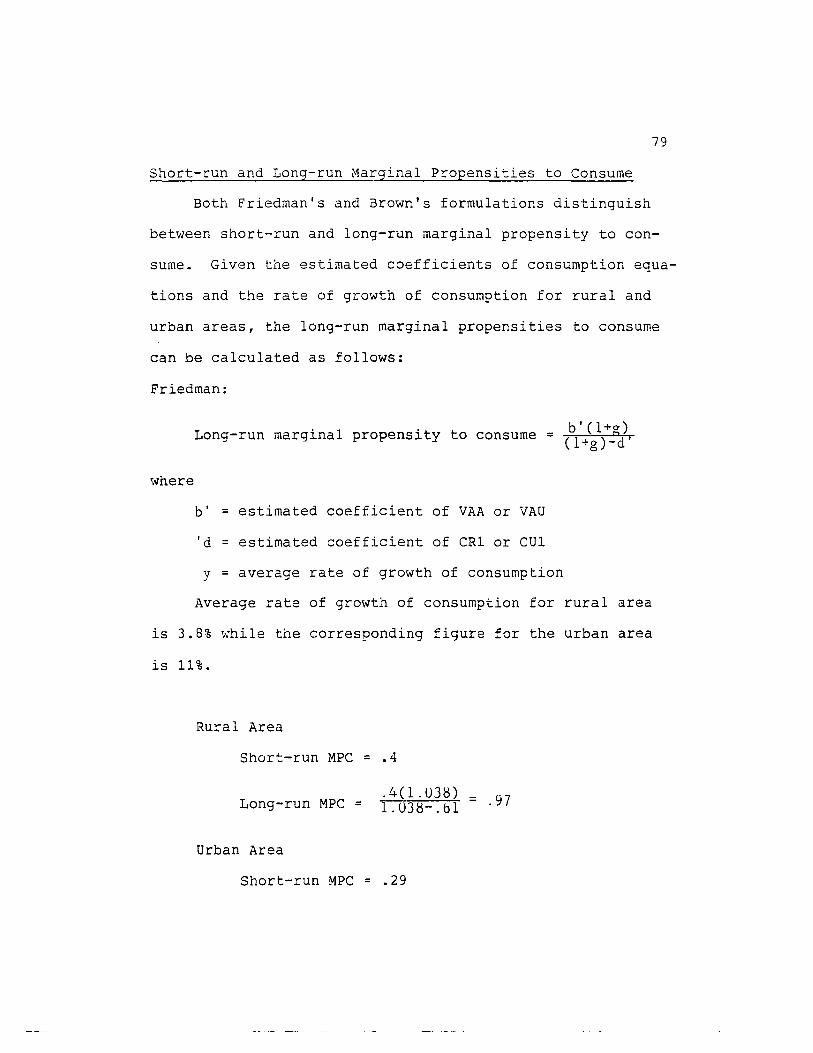
79
Short-run and Long-run Marginal Propensities to Consume
Both Friedman's and Brown's formulations distinguish
between short-run and long-run marginal propensity to con-
sume. Given the estimated coefficients of consumption equa-
tions and the rate of growth of consumption for rural and
urban areas, the long-run marginal propensities to consume
can be calculated as follows:
Friedman:
Long-run marginal propensity to consume
Tllhere
b' = estimated coefficient of VAA or VAU
'd = estimated coefficient of CR1 or CU1
= b'(l+g) (l+g)-d'
y = average rate of growth of consumption
Average rate of growth of consumption for rural area
is 3.8% ~hile the corresponding figure for the urban area
is 11%.
Rural Area
Short-run MPC = .4
Long-run MPC .4(l.U3~)
== .97 = 1. U3~-. bl
Urban Area
Short-run MPC = .29
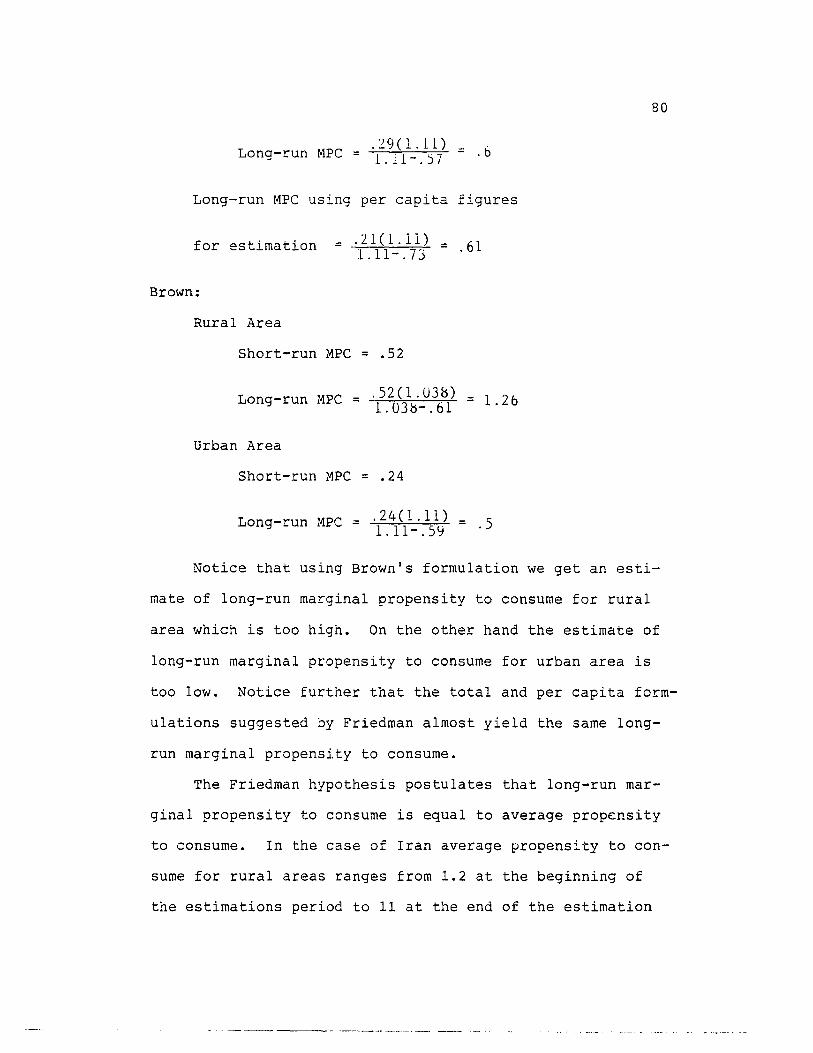
Long-run MPC = .19(1.11) 1.U-.57 - .6
Long-run MPC using per capita figures
for estimation
Brown:
Rural Area
= .2.10.11) = 1.11-.73
Short-run MPC = .52
.61
Long-run MPC = .52(1.03~) = 1.03h-.61
Urban Area
Short-run MPC = .24
1. 26
80
Notice that using Brown's formulation we get an esti-
mate of long-run marginal propensity to consume for rural
area which is too high. On the other hand the estimate of
long-run marginal propensity to consume for urban area is
too low. Notice further that the total and per capita form-
ulations suggested by Friedman almost yield the same long-
run marginal propensity to consume.
The Friedman hypothesis postulates that long-run mar-
ginal propensity to consume is equal to average propensity
to consume. In the case of Iran average propensity to con-
sume for rural areas ranges from 1.2 at the beginning of
the estimations period to 11 at the end of the estimation
________ ---____ -_0_- __ _
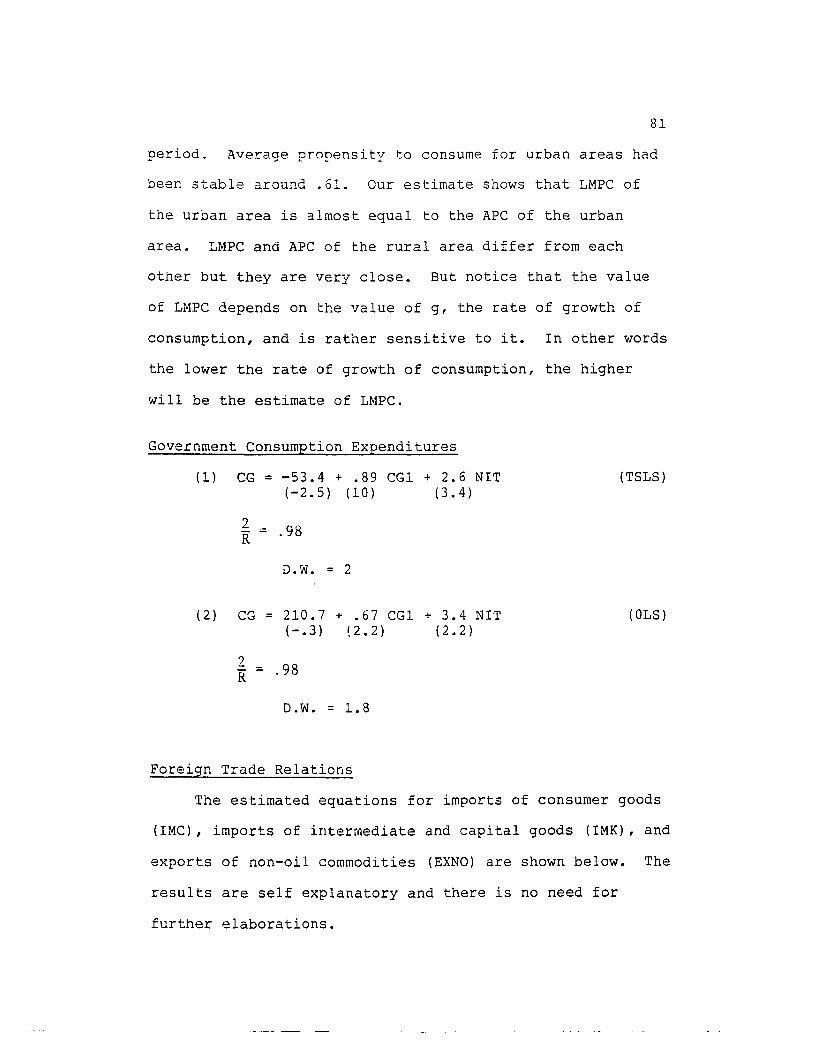
81
period. Average propensity to consume for urban areas had
been stable around .61. Our estimate shows that LMPC of
the urban area is almost equal to the APC of the urban
area. LMPC and APC of the rural area differ from each
other but they are very close. But notice that the value
of LMPC depends on the value of g, the rate of growth of
consumption, and is rather sensitive to it. In other words
the lower the rate of growth of consumption, the higher
will be the estimate of LMPC.
Government ConsumEtion EXEenditures
(1 ) CG = -53.4 + .89 CG1 + 2.6 NIT (TSLS) (-2.5) (10) (3.4)
2 .98 R -
D.W. = 2
(2) CG = 210.7 + .67 CG1 + 3.4 NIT (OLS) (-.3) (2.2) (2.2)
2 R = .98
D.W. = 1.8
Foreign Trade Relations
The estimated equations for imports of consumer goods
(IMC) , imports of intermediate and capital goods (IMK), and
exports of non-oil commodities (EXNO) are shown below. The
results are self explanatory and there is no need for
further elaborations.
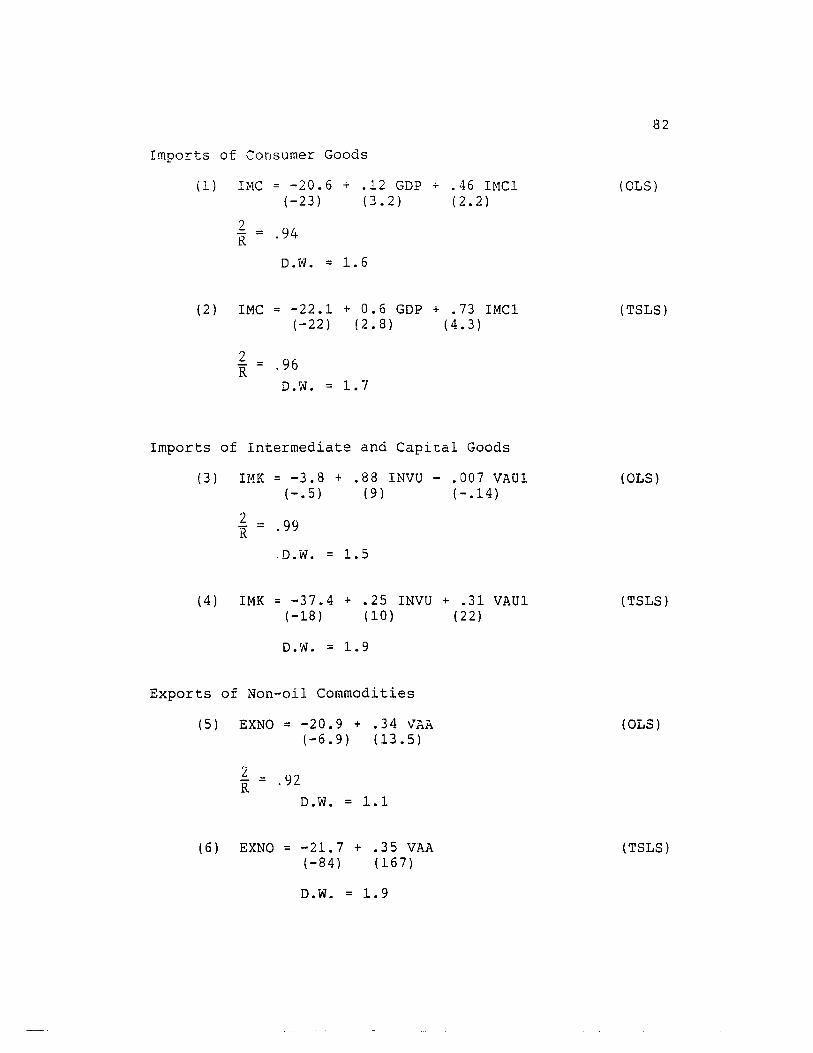
82
Imports of Consumer Goods
(1) IMC = -20.6 + .12 GOP + .46 IMCl (OLS) (-23) (3.2) (2.2)
2 R = .94
D.W. = 1.6
(2) IMC = -22.1 + 0.6 GOP + . 73 IMCi (TSLS) (-22) ! 2.8) (4.3)
2 R = .96
D.W. = 1.7
Imports of Intermediate and Capital Goods
(3 ) IMK = -3.8 + .88 INVU - .007 VAUl (OLS) (-.5) (9 ) (-.14)
2 = .99 R .D.W. = 1.5
(4) IMK = -37.4 + .25 INVU + .31 VAUl (TSLS) (-18 ) (10) (22)
D.W. = 1.9
Exports of Non-oil Commodities
(5) EXNO = -20.9 + .34 V"'~ rti\ (OLS) (-6.9) (13.5)
L = .92 R D.W. = 1.1
(6) EXNO = -21.7 + .35 VAA (TSLS) (-84) (167)
D.W. = 1.9

83
P~oducticn Equations
Supply functions in our model is subdivided into two
categories: Output in urban sector and output in agri-
culture sector.
The traditional "neo-classical" production function
concentrates on two major economic factors in production,
labor and capital. As we did mention earlier a complete
and satisfactory data of capital stock for urban and agri-
culture sectors are not available for the Iranian economy_
The values of investments made in urban and agriculture
sectors are however available for the period 1959-1976.
The values for capital stock are determined in the follow-
ing way: First a capital-output ratio equivalent to 4 was
assumed for the year 1959. 7 On the basis of capital-out-
put r~tio and data for value added in the urban and agri-
culture sectors the capital stock was estimated for 1959.
Then the value of capital stock for the later years were
obtained by adding the annual net additions to the capital
stock, i.e., investment less depreciation. S The estima-
tion of the linear, general Cobb-Douglas production func-
tions and Cobb-Douglas production function assuming con-
stant returns to scale (a1 + a2 = 1) yielded the fol-
lowing results for the urban sector:
Linear Production Function
(1) VAU = -410.4 + .66 KU1 - .06 LU (-3) (5) (-2)
2 R = .99
D.W. = 1.2
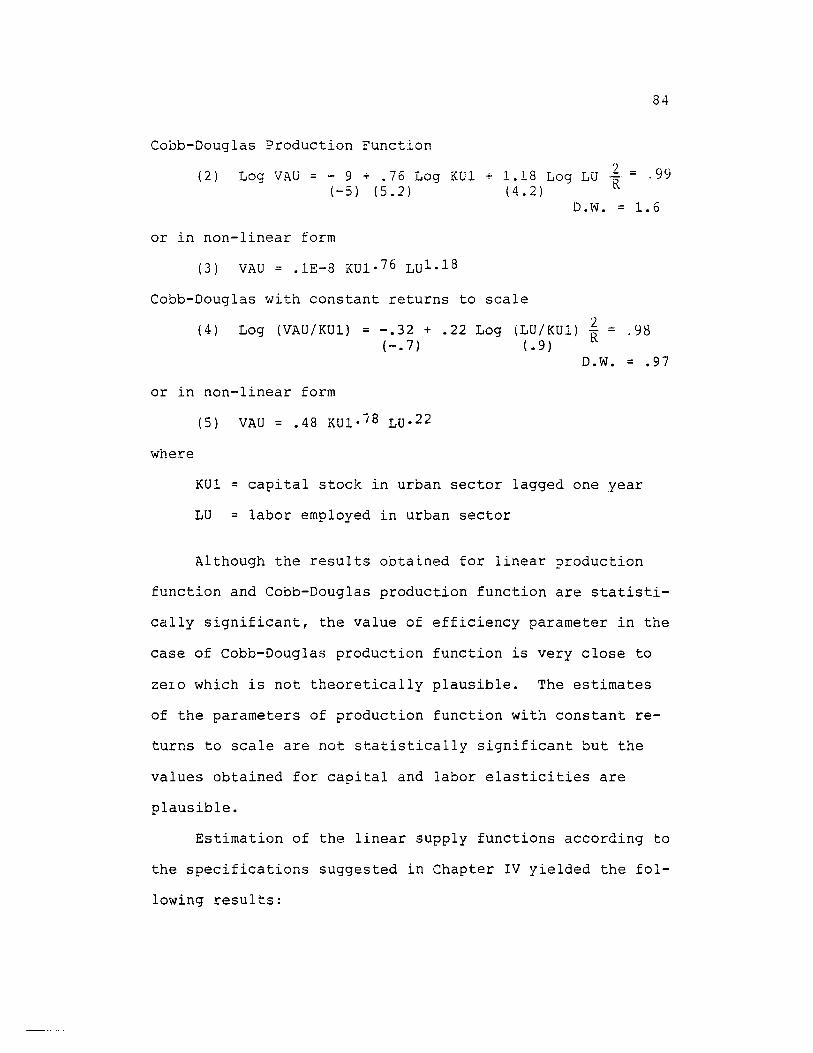
84
Cobb-Douglas Production Function
(2 ) 2 Log VAU = - 9 + .76 Log KUl + 1.18 Log LU R = .99 (-5) (5.2) (4.2)
D.W. = 1.6
or in non-linear form
(3) VAU = .lE-8 KU1·76 LU1.1S
Cobb-Douglas with constant returns to scale
(4 ) 2 _
Log (VAU/KU1) = -.32 + .22 Log (LU/KU1) R - .98 (-.7) (.9)
D.W. = .97
or in non-linear form
(5) VAU = .48 KU1·i8 LU· 22
whet'e
KUl = capital stock in urban sector lagged one year
LU = labor employed in urban sector
~lthough the results obtained for linear ?roduction
function and Cobb-Douglas production function are statisti-
cally significant, the value of efficiency parameter in the
case of Cobb-Douglas production function is very close to
zero which is not theoretically plausible. The estimates
of the parameters of production function with constant re-
turns to scale are not statistically significant but the
values obtained for capital and labor elasticities are
plausible.
Estimation of the linear supply functions according to
the specifications suggested in Chapter IV yielded the fol-
lowing results:
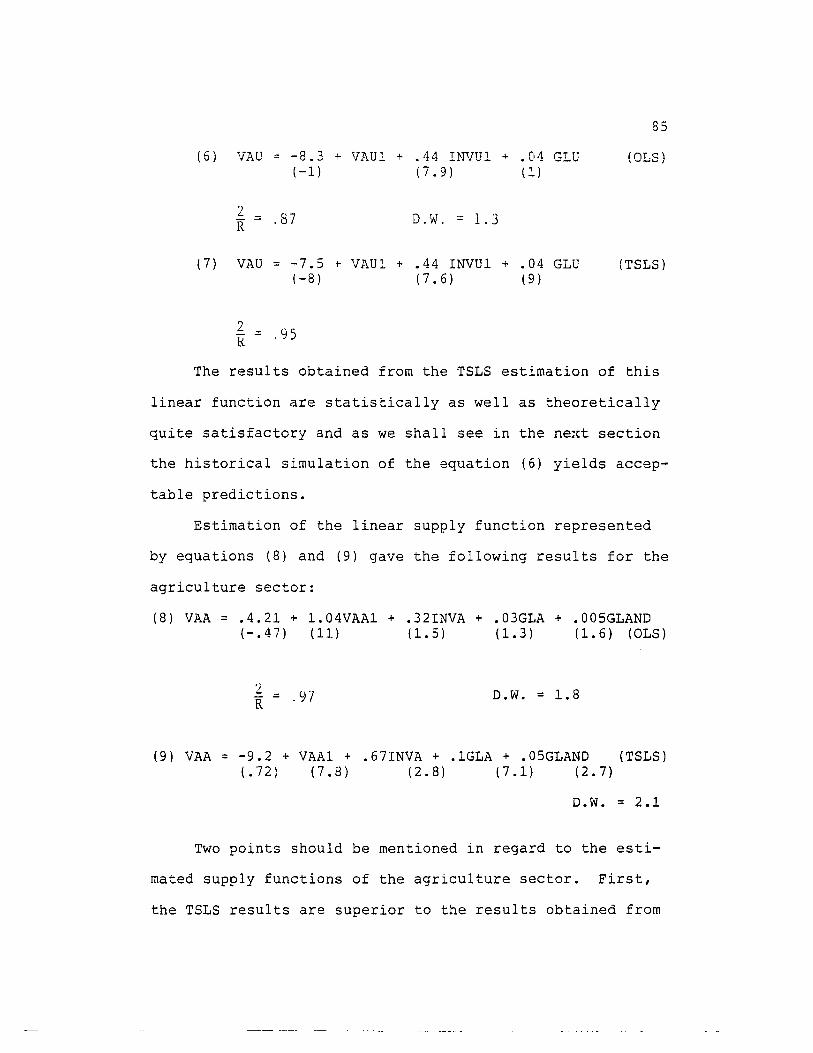
85
(6 ) VAU = -8.3 + VAU1 (-1)
+ .44 INVUl + .04 GLU (OLS) (7.9) (2..)
2 = R .87 D.W. == 1.3
(7) VAU = -7.5 + VAU1 + .44 INVU1 + .04 GLU (TSLS) (-8) (7.6) (9)
~ .::: .95
The results obtained from the TSLS estimation of this
linear function are statistically as well as theoretically
quite satisfactory and as we shall see in the next section
the historical simulation of the equation (6) yields accep-
table predictions.
Estimation of the linear supply function represented
by equations (8) and (9) gave the following results for the
agriculture sector:
(8) VAA = .4.21 + 1.04VAA1 + .32INVA + .03GLA + .005GLAND ( - • 47 ) ( 11) ( 1. 5) ( 1. 3 ) ( 1. 6 ) ( OLS )
2 .::: R D.W. = 1.8
(9) VAA = -9.2 + VAAl + .67INVA + .1GLA + .05GLAND (TSLS) (.72) (7.8) (2.8) (7.1) (2.7)
D.W. = 2.1
Two points should be mentioned in regard to the esti-
mated supply functions of the agriculture sector. First,
the TSLS results are superior to the results obtained from
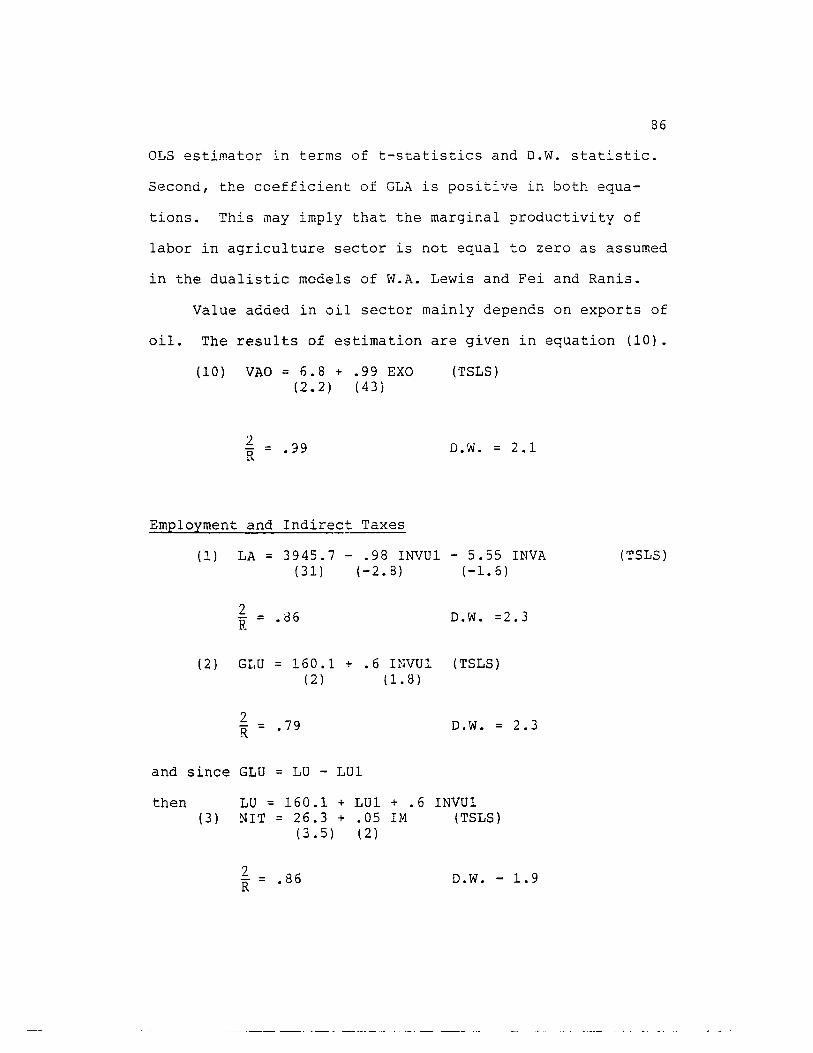
86
OLS estimator in terms of t-statistics and D.W. statistic.
Second, the coefficient of GLA is positive in both equa-
tions. This may imply that the marginal productivity of
labor in agriculture sector is not equal to zero as assumed
in the dualistic models of W.A. Lewis and Fei and Ranis.
Value added in oil sector mainly depends on exports of
oil. The results of estimation are given in equation (10).
(10) VAO = 6.8 + .99 EXO (2.2) (43i
2 R = .39
EmEloyment and Indirect
(1)
(2)
LA = 3945.7 -(31)
2 .86 R =
GLU = 160.1 (2)
2 - = .79 R
+
Taxes
.98 INVUl (-2.8)
.6 INVUl (1. 8)
and since GLU = LU - LUI
(TSLS)
D.W. = 2.1
- 5.55 INVA (-1. 6)
D.W. =2.3
(TSLS)
D.W. = 2.3
then LU = 160.1 + LUI + .6 INVUl (3) NIT = 26.3 + .05 1M (TSLS)
(3.5) (2)
2 R = .86 D.W. - 1.9
(TSLS)
87
(4) NIT = 25.9 + .05 1M (OLS) (3) (2)
2 == .85 R D.W. == l.7
The results obtained for both sectors seems to be sat-
isfactory. The negative sign of investments made in agri-
culture sector indicates the adverse effect of inappropri-
ate and sometimes disastrous agricultural policy of the
government over the estimation period. In the period 1963-
78 while traditional agriculture sector was starving for
funds, nearly all government and private credit were chan-
neled into the modern and highly capital intensive farm cor-
porations and agri-businesses. The combination of this mod-
ernist approach to the agriculture and urban industrial ex-
pans ion led to poverty and unemployment among the peasantry
and high rate of migration to towns and cities. 9
The coefficient of INVUl in (2), indicates that on the
average, one billion rials ($14.2 million) of investment
creates 660 jobs in the urban sector. This could mean that
on average $21,000 worth of investment had to be made in
order to employ one more member of the labor force. There
are two general explanations for this low labor absorption
of new investments. In the first place, government by
supplying cheap credit to the private sector encouraged the
use of the capital-intensive methods and itself did the

88
same in its own large-scale investment projects. In the
second place, the limited administrative as well as skilled
labor lead to underutilization of capacity which in turn
resulted in the employment of even fewer ordinary
workers than would other wise be possible.
Historical Simulation of the Model
In this section we discuss the simultaneous equation
simulation and its use in evaluation and validation of our
econometric model. If time series begin in T1 and end in
TN' then historical simulation begins in year T1 and
runs forward until year TN' Historical or actual values
of exogenous variables and initial actual values of endogen
ous variables as initial conditions are used to determine
the values of endogenous variables for the period T2 -
TN' A comparison of the actual values with simulated ser
ies for each endogenous variable then can provide a valu
able test of the model. In the case of a single equation
regression, there exists a set of statistics such as R2,
and t-tests which can be used to make judgment about the
goodness of fit of the equation and its estimated coeffi
cients. The same considerations also apply to a simultane
ous system of equations. Yet the fact is that the model as
a whole may have a more complicated and richer dynamic
structure than that of anyone of the individual equation
of which it is composed. Thus even if all the individual
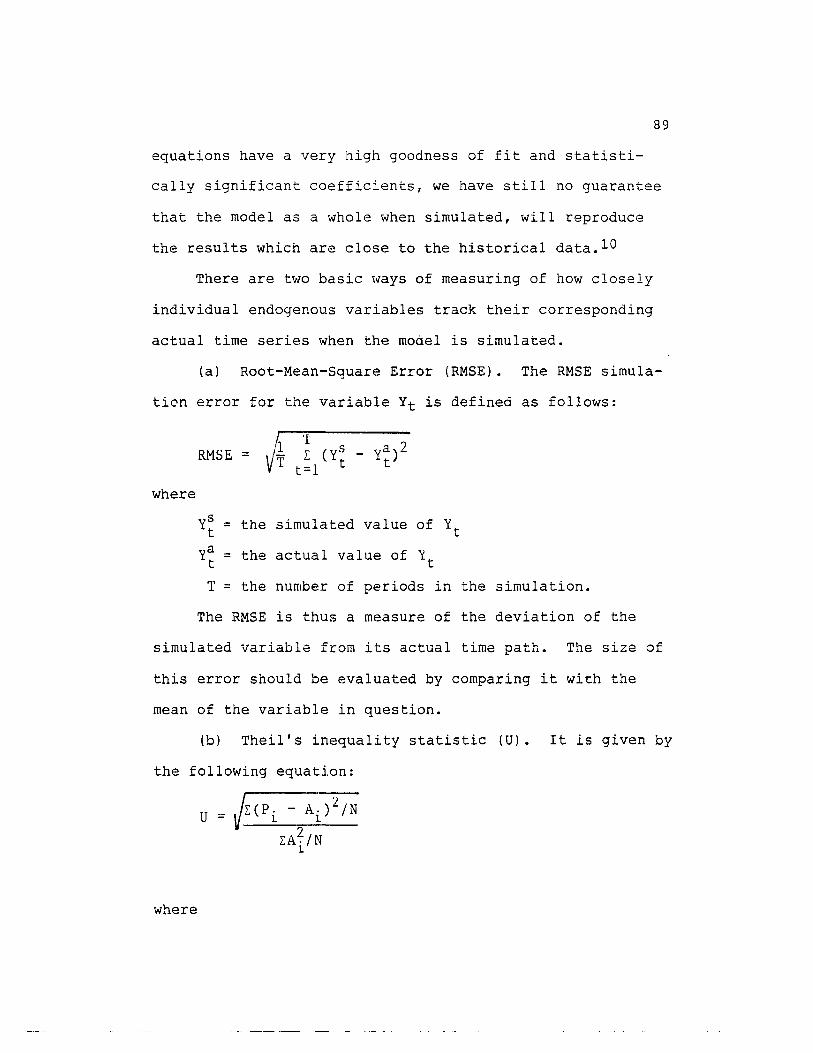
89
equations have a very high goodness of fit and statisti-
cally significant coefficients, we have still no guarantee
that the model as a whole when simulated, will reproduce
the results which are close to the historical data. 10
There are two basic ways of measuring of how closely
individual endogenous variables track their corresponding
actual time series when the mouel is simulated.
(a) Root-Mean-Square Error (RMSE). The RMSE simula-
tien error for the variable Yt is defined as follows:
A '1 ya)2 RMSE = L: (yS -
t=l t t
where
y8 = the simulated value of Yt t
ya = the actual value of Y t t
T = the number of periods in the simulation.
The RMSE is thus a measure of the deviation of the
simulated variable from its actual time path. The size of
this error should be evaluated by comparing it with the
mean of the variable in question.
(b) Theil's inequality statistic (U). It is given by
the following equation:
where
p. = predicted change in the dependent variable 1
A. = Actual change in the dependent variable 1
N = Number of periods in the simulation
The closer U is to zero the more accurate forecasts
wo~ld be obtained.
Low simulation errors are only one d2sirable measure
90
of simulation fit. It is also important to see that if the
model simulates closely the "turning points" in the actual
time series data.
The simulation result of the model are shown graph-
ically in Figures 1 to 12 in which the actual and simulated
series for each endogenous variable are plotted on the same
set of axes. The equations used in the historical simula-
tion of the model are listed in Table VI. The numerical
values of RMSE and U are shown in Table V along with the
mean value of each variable.
Despite the simplicity of the model, its simulation
performance is reasonably good, RMSE values relative to the
corresponding mean values of dependent variables are quite
small and Theil's inequality statistic is very close to
zero in all cases. Furthermore model simulates turning
points in historical time series quite well.
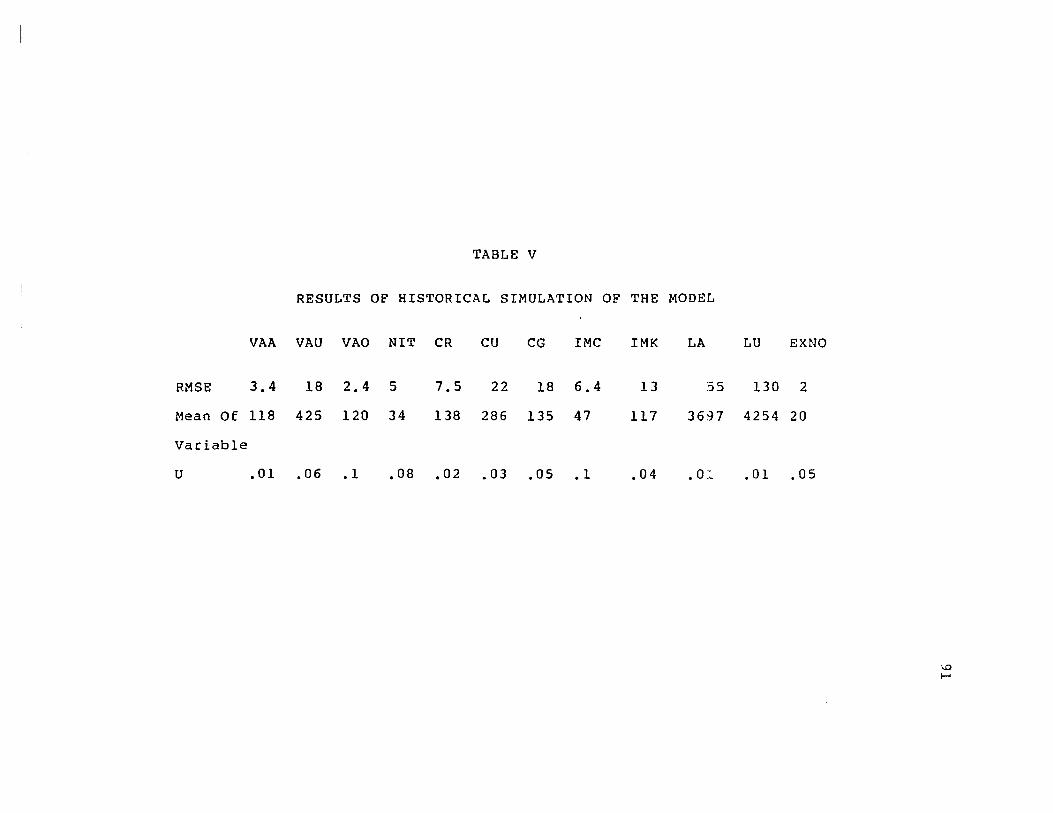
TABLE V
RESULTS OF HISTORICAL SIMULATION OF THE MODEL
VAA VAU VAO NIT CR CU CG IMC IMK LA
RMSE 3.4 18 2.4 5 7.5 22 18 6.4 13 55
Mean Of 118 425 120 34 138 286 135 47 117 36~7
variable
U .01 .06 .1 .08 .02 .03 .05 .1 .04 . o:~
LU EXNO
130 2
4254 20
.01 .05
\.0 I-'
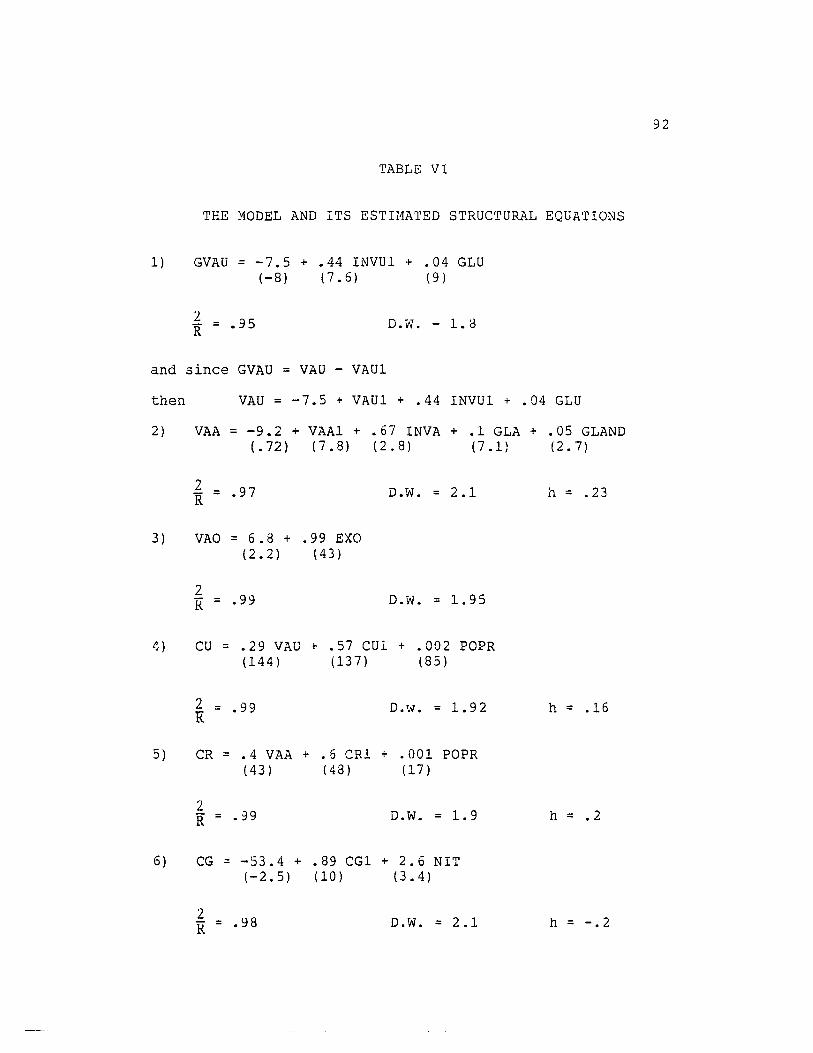
TABLE VI
THE MODEL AND ITS ESTD1ATED STRUC'rURAL EQUATIONS
1) GVAU = -7.5 + .44 INVU1 + .04 GLU
'1. R .95
(-8) (7.6) (9)
D.W. - 1.8
and since GVAU = VAU - VAU1
then VAU = -7.5 + VAUl + .44 INVU1 + .04 GLU
2) VAA = -9.2 + VAAl + .67 INVA + .1 GLA + .05 GLAND (.72) (7.8) (2.8) (7.1) (2.7)
2 R = .97
3 ) VAO = 6. 8 + • 99 EXO (2.2) (43)
2 R = .99
D.W. = 2.1
D.W. = 1.95
~) CU = .29 VAU + .57 CUi + .002 POPR (144) (137) (85)
2 = 99 R • D.Vl. = 1.92
5) CR = .4 VAA + .6 CRl + .001 POPR (43) (48) (17)
2 R = .99 D.W. = 1.9
6) CG = -53.4 + .89 CG1 + 2.6 NIT (-2.5) (10) (3.4)
2 R = .98 D.W. = 2.1
h = .23
h = .16
h = .2
h = -.2
92
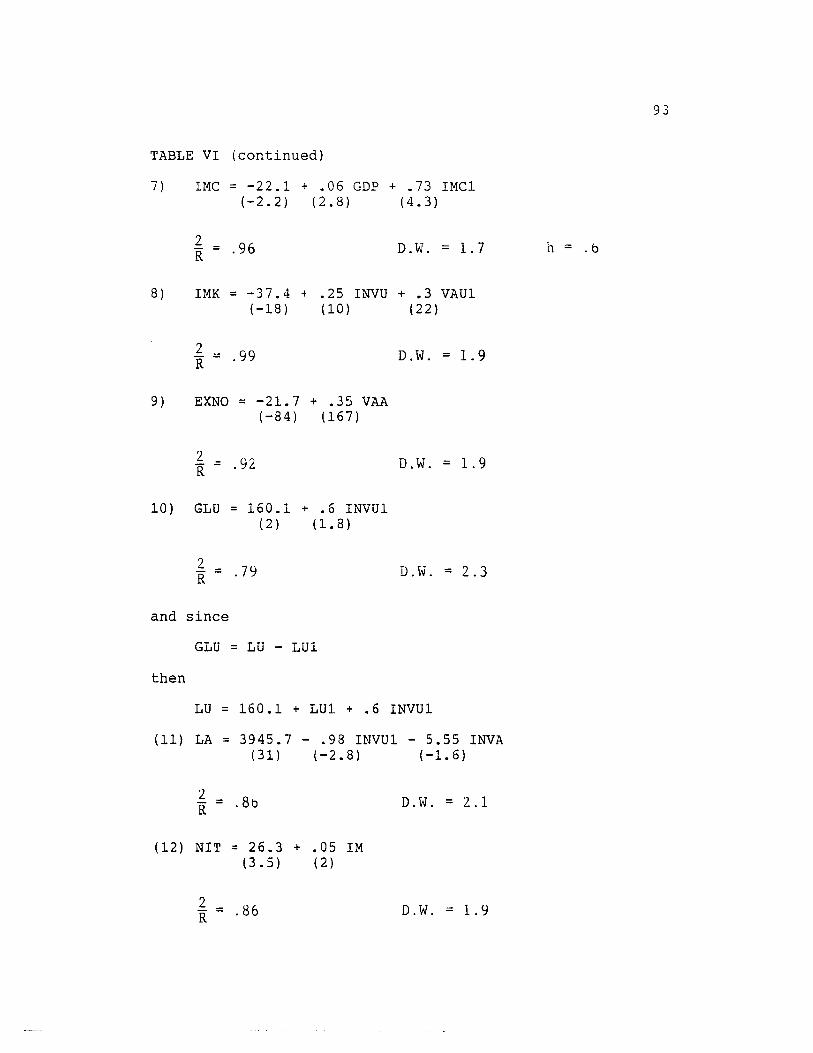
93
TABLE VI (continued)
7) IMC = -22.1 + .06 GDP + .73 IMC1 (-2.2) (2.8) (4.3)
2 R = .96 D.W. = 1.7 h = .b
8) IMK = -37.4 + .25 INVU + .3 VAU1 (-18) (10) (22 )
2 _ . 99 D.W . = 1.9 R -
9) EXNO = -21. 7 + .35 VAA (-84) (167)
2 R = .92 D.W. = 1.9
10) GLU = 160.1 + .6 INVU1 (2) (1.8)
2 R = .79 D.W. = 2.3
and since
GLU = LU - LU1
then
LU = 160.1 + LUi + .6 INVU1
(11) LA = 3945.7 - .98 INVU1 - 5.55 INVA (31) (-2.8) (-1.6)
'2 R = .8b D.W. = '2.1
(12) NIT = 26.3 + .05 1M (3.5) (2 )
2 R = .86 D.W. - 1.9

94
List of Variables and Identities
Endogenous Predetermined
(1) GVAU (1) INVU1
(2) VAA (2 ) VAU1
(3 ) VAO (3 ) VAAl
(4) CU (4) INVA
(5) CR (5) GLA
(6) CG (6 ) GLAND
(7) IMC (7 ) EXO
(8) IMK (3) CU1
(9 ) EXNO (9 ) POPU
(10) NIT (10) LU1
(11) GLU = LU - LU1 (11) CR1
(12) LA (12) POPR
(13) CG1
Identities (14) IMC1
(15) INVU
(1) VAU = GVAU + VAUl
(2 ) GOP = VAA + VAO + VAO
(3 ) EX = EXO + EXNO
(4) UI = IMC + IMK
(5 ) LU = GLU + LUl
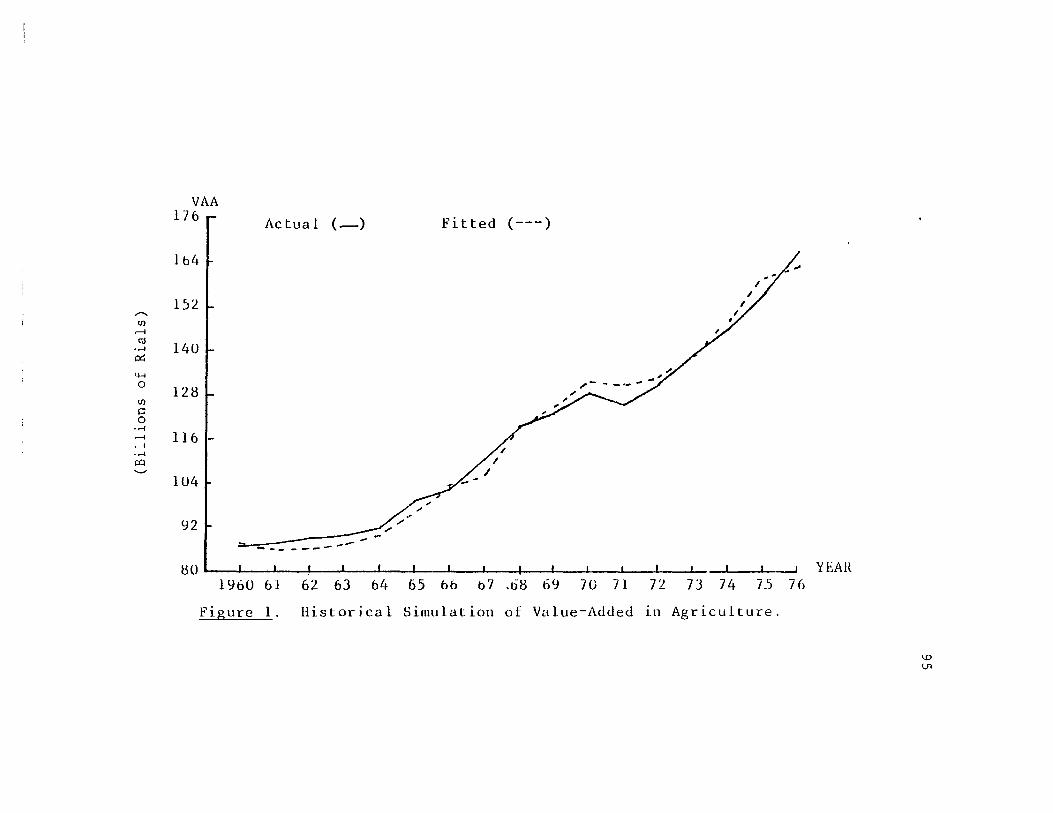
,,-... Ul
.---l
CU o.-l
0:::
4-< o Ul C o
o.-l
.---l
.---l o.-l
>:Q '-"
VAA 176
Ib4
lS'1.
140
1'1.8
116 .-
104
Y2
Actual (-) Fitted (---)
-- -----,-80 ~I __ ~ ____ L-__ ~ __ -L __ ~~ __ ~ __ ~ __ ~ ____ +-__ ~ __ ~ __ ~ ____ L-__ ~
lY60 61 62 63 64 65 b6 b7 ,tiB 6Y 7U 71 7'1. 73 74 75 7()
Figure 1. Historical Simulation of Value-Added in Agriculture.
YEAR
\0 U1

r-.. U)
~
cu .~
~
'-H 0
U)
I=! 0
• .-j
~
~ • .-j
j:Q
'-'
VAU 1U~U
Actual (-) Fitted (---)
960 ~ , I
" ~40 I I
/ I
I
720
" " ./
600 / ./
" / ./
4~0 .-,-
,-./ ....
360 .... .,.
240 --... -~ - -- - -
- 120 I ' I ,YEAH 11)60 61 62 63 64 65 66 67 6~ 6Y 70 71 72 73 74 75 76
Figure 2. llistorica1 Simulation of Value-Added in Urban Sector.
~
'"

,....... III .-l (\l
• .-1 p::<
"-\4
0
III c: 0
• .-1 .-l
.-l • .-1 >Q '-"
Cl{ 196 _
Actual f
(-) Fitted (---)
IB4
172
160
14B ;'
/
136 /
124
112 '"
100 I I I, J YEAR 1960 61 62 b3 64 65 66 67 68 69 70 71 72 73 74 75 76
Figure 3. Historical Simulation of Private Consumption in Agriculture Sector.
~
-J
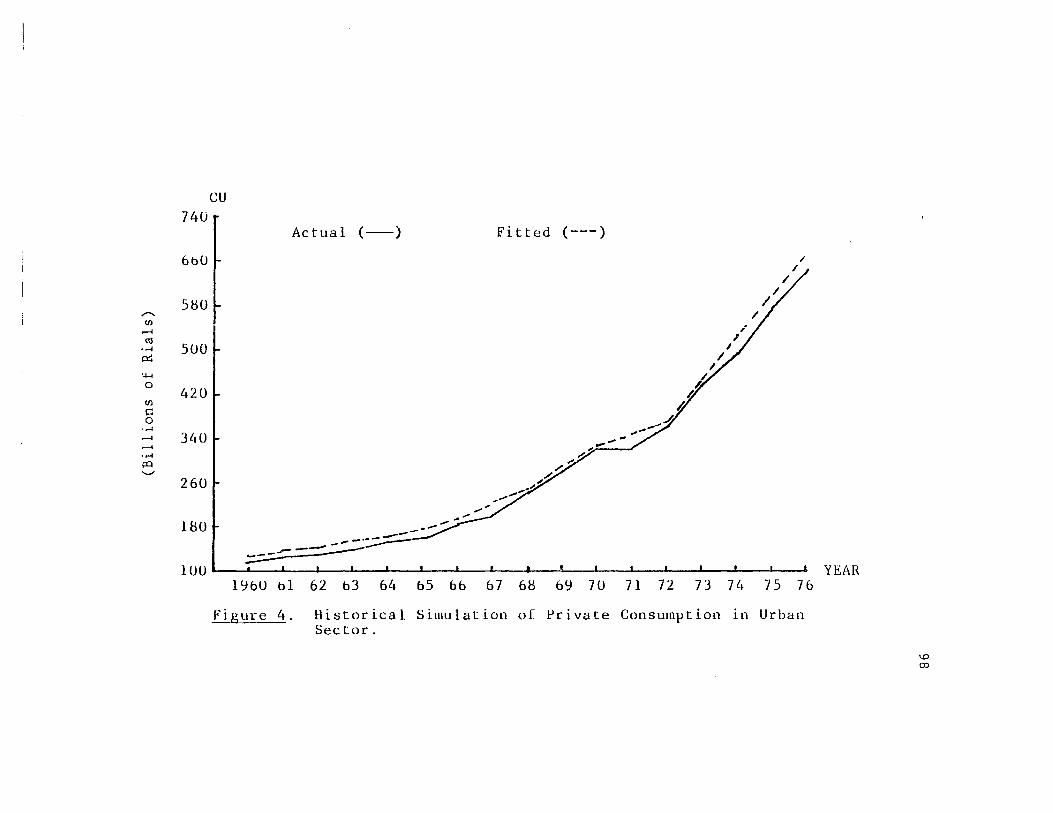
" U)
.-l
co • ..-l p::
'4-4
0
U)
t:: 0
,..-l
.-l
.-l • ..-l
P=l '-"
CU 74U _
6bO
5HO
500
420
340
260
uw
100
I Actual (-.)
-- ---- ----' - #'*
Fitted (---)
........ ..
/
;.h
/ /
/
,/
1l)60 bl 62 b3 64 65 66 67 6H 6l) 70 71 72 73 74 75 76
Figure 4. Historical Siluulation of Private Consumption in Urban Sector.
YEAR
\D ())
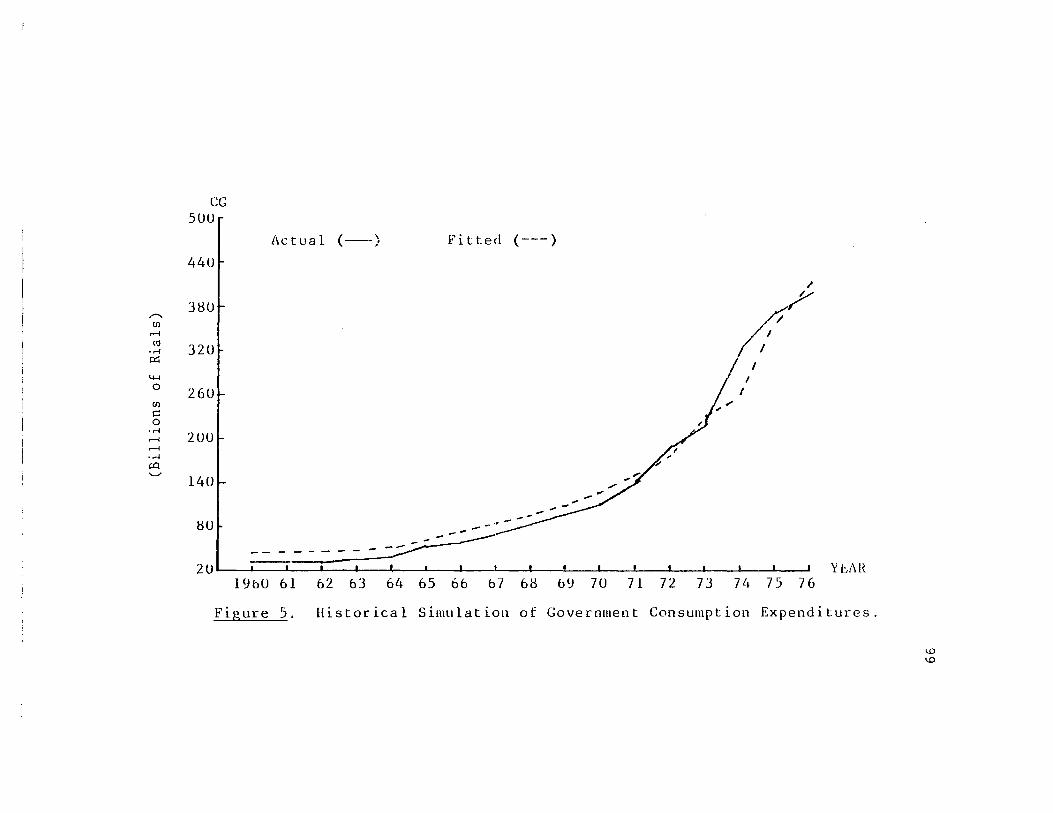
......... (J)
.--l
III • ..-1 ~
4-< 0
(J)
s:: 0
• ..-1 .--l
.--l • ..-1 I=Q '-"
CG 5UU
Actual (--) Fitted (---)
44U
3HU
32U / / I
I
26U I
2UU
14U
2U' --- ---- .. --!
tlU
Y l:.AR lY6U 61 62 63 64 65 66 67 6tl bY 70 71 72 73 74 75 76
Figure 5. Historical Simulation of Government Consumption Expenditures.
\D \D

,,-... (J)
.--I
ell • ..-l
~
~
o (J)
I:! o
• ..-l .--I .--I • ..-l ;:Q '-J
INC 2UU·
175
150
125
IUU
75
50
25
Actual (--) Fitted (---)
.... ----
---- - --- - -- --
., .~ ....
... '" "
, "
/ !"
'"
I I
,;'
;
'" .-
UI r, " I r I r ' I " , t· 1960 61 62 63 64 65 b6 67 68 69 70 71 72 73 74 75 76 YEAR
Figure 6. Historical Simulation of Imports of Consumer Goods.
f-' o o

r-. VI ~
C\l • .-4
P::
44 0
U)
~ 0
• .-4 ~
~ • .-4
i'Q '-"
INK 400
Act ua 1 (-) Fitled (---)
I 350
300
250
200
150
,/
lUU
50 _ ... O~I __ ~ ____ ~ __ ~ __ -L __ ~~ __ L-__ ~ __ -+ ____ L-__ ~ __ -L __ ~ ____ ~ __ ~ __ -L __ ~~--J
lY60 61 62 63 64 65 66 67 6H 6Y 70 71 72 73 74 75 76
Figure 7. llistorical Simulation of Imports of Capital and Intermediate Goods.
YEAH.
I-' o I-'
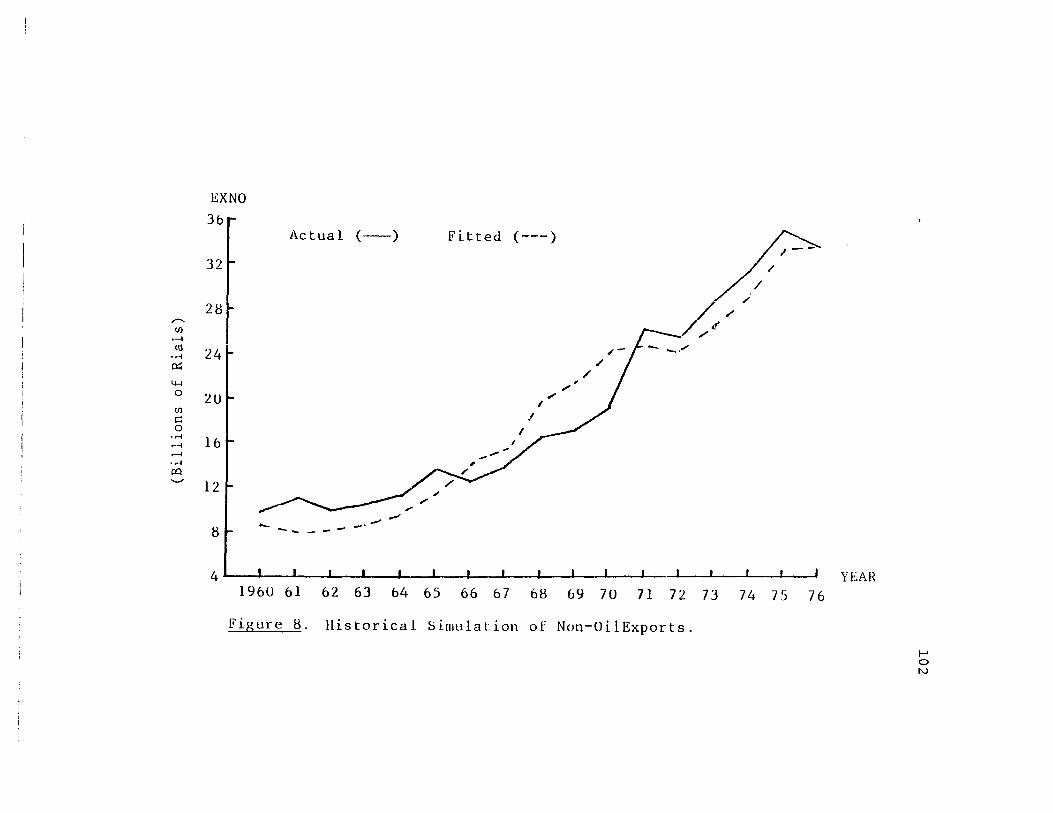
,-... rJ)
o--l
cu 'rl p::;
4-4 0
rJ)
c 0
'rl ~-l
o--l ·rl
~ '-"
EXNO 36
Actual (-) Fitted (---)
32
2H // r---/ /'1'
24
2U
16
12
J ~ --..... -' -- - --4~1--~--~---L __ -L __ -+ __ -L __ -+ __ -L __ ~ __ ~ __ -L __ ~ __ ~ __ ~ __ ~ __ ~ __ ~
196U 61 62 63 64 65 66 67 6H 69 7u 71 72 73 74 75 76
Figure H. Historical Simulation of Non-OiiExports.
YEAR
I-' o N

"......
(J)
~ QJ
..!<: ~ 0
:;: 4-l
0
(J)
'"d C CIl (J)
;:l 0
..c b-' '-"
LA
4UUUf JYUU
I
38UO
37UU
36UU
35UU
34UU
33UU
Actual (-_) L" L"ltted ( ---)
j),'- ~
ff-J--- 1
P /1 -I
/
~--~~,/
, , , ,
\
32UUL' __ -L __ ~ __ ~ __ ~ ____ ~ __ L-__ ~ __ ~ __ -L __ -L __ -L __ ~ __ ~ __ ~~~~~~~
1 Y 6 Ubi 62 63 b 4' 65 66 67 68 69 7 0 71 7 2 7 3 74 7 5 7 6 YEAl{
Figure Y. Historical Simulation of Labor Employed in Agriculture.
I-' o w
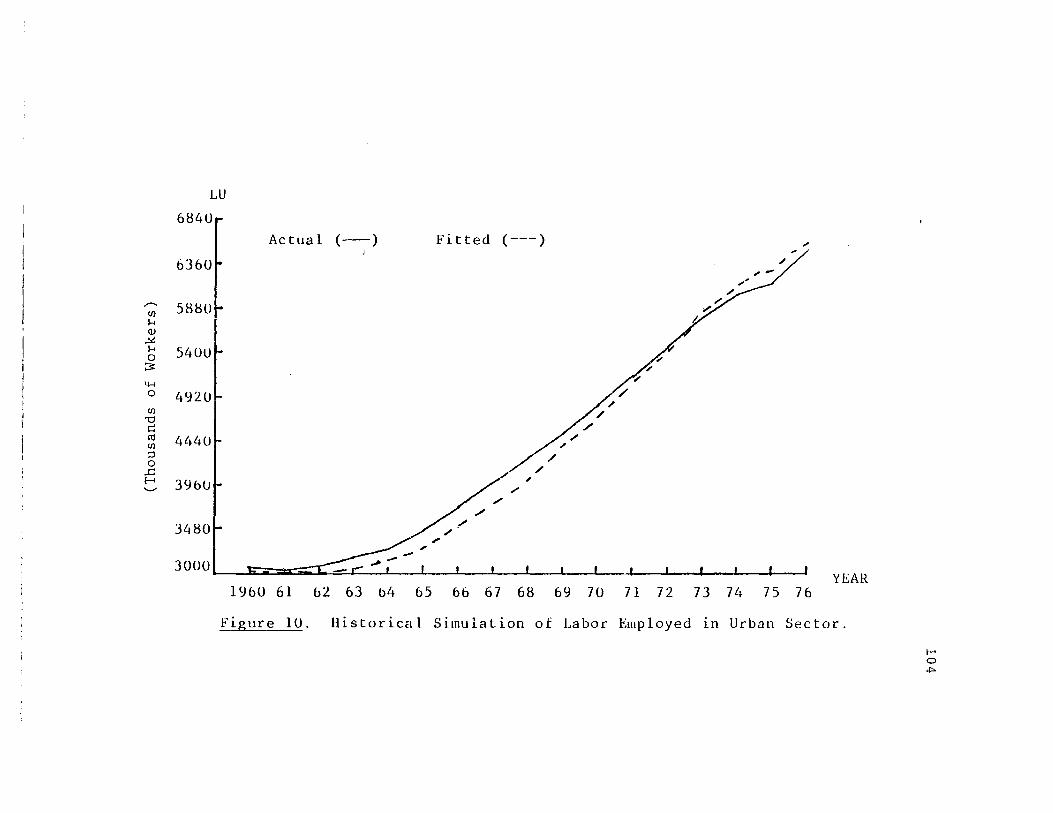
,,-... III H Q)
.!G H 0
::s: lI-< 0
III "0 C CIl III
==' 0 .c f-< '--'
LU
6B40
6360
5BBO
5400l 4<:120
444U
396U
34BO
Actual (--) Fitted (---) ~
3000, Ii _ .tr;:::::k-C-
1960 61 62 63 b4 65 66 67 6B 69 70 71 72 73 7l~ 75 76 YEAR
Figure 10. Historical Simulation of Labor Employed in Urban Sector.
f-' o .t>

U)
~
C1l • .-1
~
~
o U)
c:: o
• .-1 ~
~ • .-1
J:Q '-'
200
175
150
125
100
75
50
25
o
~~
Actual (--) Fitted (---)
lYbO 61 62 63 64 65 66 67 68 6Y 7U 71 72 73 74 75 76
Figure 11. Historical Simulation of Value-Added in Oil Sector.
YE.AI{
f-' a VI
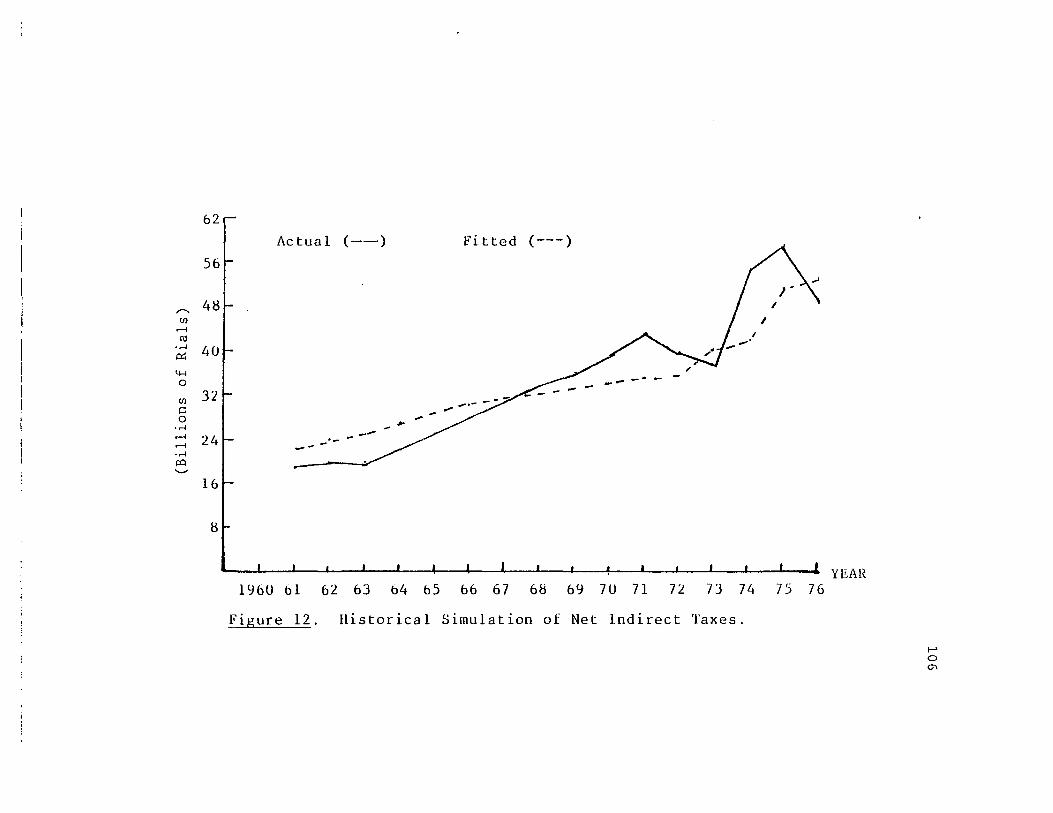
r-.. (/)
~
C'\l 'M p::
~
a (/)
c 0
'M ~
~
'M ~ '-'
62
56
48
40
32
24
16
8
Actual (--) Fitted (---)
... _. -
.... #'
.... - -'- --"...
YEAR lY60 61 62 63 b4 65 66 67 6tl 6Y 70 71 72 73 74 75 76
Figure 12. Historical Simulation of Net Indirect Taxes.
f-' o 0\
107
The Reduced Form of the Model
Equations 1 to 12 listed in Table VI represent the
structural form of the model. The structural equations may
be regarded as a theoretical explanation or hypothesis
about the structure of the economy. Structural equations
are, however, the "implicit functions" where the current
endogenous variables may dPpea~ on the right-hand side of
the equation. To find the current endogenous variables
solely as a function of predetermined variables, i.e., ex
ogenos and lagged endogenous, the structural equations are
transformed into the reduced form where each current endog
enous variable is an "explicit function" of predetermined
variables.
The equations represented in Table VII constitute the
reduced form of the model. The coefficients of the re
duced-form equations measure the impact in the current
period on each endogenous variable of a unit change in any
predetermiIled variable. Consider for example a unit in
crease in the level of INVU1. From equation (1) of the
structural form there would be a simultaneous increase of
.44 unit in value added in the urban sector. But from the
employment function of the urban sector, i.e., equation
(10), increases in INVU1 will induce increases in employ
ment which in turn will induce further increases in VAU.
The coefficients of reduced-form equations are called
-- ---------------------.--- --- ---
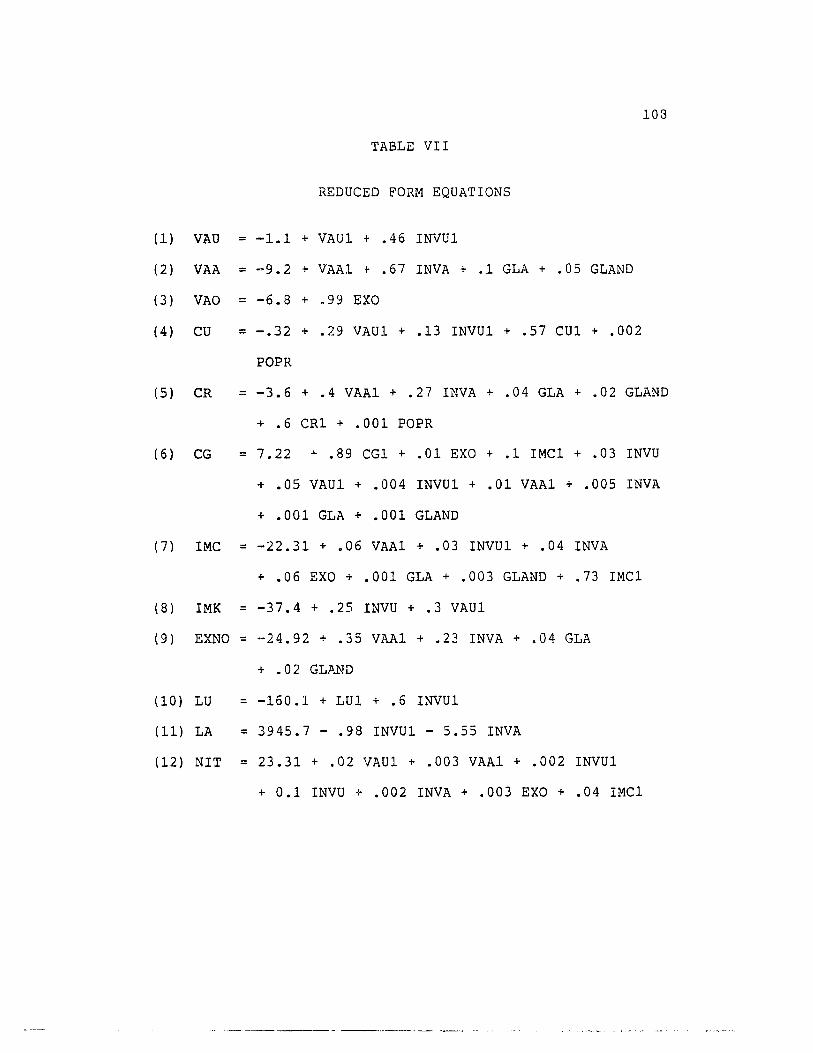
TABLE VII
REDUCED FORM EQUATIONS
(1) VAU -1.1 + VAU1 + .46 INVU1
(2) VAA = -9.2 + VAA1t .67 INVA + .1 GLA + .05 GLAND
(3) VAO = -6.8 + .99 EXO
(4) CU = -.32 + .29 VAU1 + .13 INVU1 + .57 CU1 + .002
POPR
108
(5) CR = -3.6 + .4 VAAl + .27 INVA + .04 GLA + .02 GLAND
+ .6 CR1 + .001 POPR
(6) CG = 7.22 + .89 CG1 + .01 EXO + .1 IMC1 + .03 INVU
+ .05 VAU1 + .004 INVU1 + .01 VAAl + .005 INVA
+ .001 GLA + .001 GLAND
(7) IMC = -22.31 + .06 VAAl + .03 INVU1 + .04 INVA
+ .06 EXO + .001 GLA + .003 GLAND + .73 IMC1
(8) IMK = -37.4 + .25 INVU + .3 VAU1
( 9 ) EXNO = .- 2 4. 92 + .35 VAAl + .23 INVA + .04 GLA
+ .02 GLAND
(10) LU = -160.1 + LU1 + .6 INVU1
(11) LA = 3945.7 - .98 INVU1 - 5.55 INVA
(12) NIT = 23.31 + .02 VAU1 + .003 VAAl + .002 INVU1
+ 0.1 INVU + .002 INVA + .003 EXO + .04 IMC1
109
"impact multipliers", because they show the effect in the
current period of changes in predetermined variables.
The impact effects in the current period are not the
end of the story. A one-step change in an exogenous vari
able sets off a sequence of changes in the dependent vari
able because of the lags in the system. The estimated re
duced form can be applied sequentially to trace out the
dynamic effects of a~ assumed change in any exogenous vari
able. The changes in the dependent variable are called
"dynamic multipliers" and the total long-run multiplier is
just the sum of all dynamic multipliers over time. 9 The
effects over a five year period of a unit change in INVU1,
INVA, VAU1, VAAl, EXO are given in tables VIII to XIV. In
the case of CU, CR, CG and IMC, dynamic multipliers vanish
after a period of about five years. In the case of VAU,
VAA, and LU they remain the same since the coefficients of
VAU1, VAAl and 1U1 are equal to one. This may indicate
that the value of these estimated coefficients are rather
high. But even if we assume a much lower coefficient say
for example .95, it still ~akes a long time for multipliers
of VAU, VAA and LU to level off. Note that while the total
effects of investment multiplier in the urban sector in
the first five and ten years is quite large compared with
the economically advanced industrial countries, the import
multiplier is quite small. Impact multipliers of other
policy variables except INVU1 for employment in urban
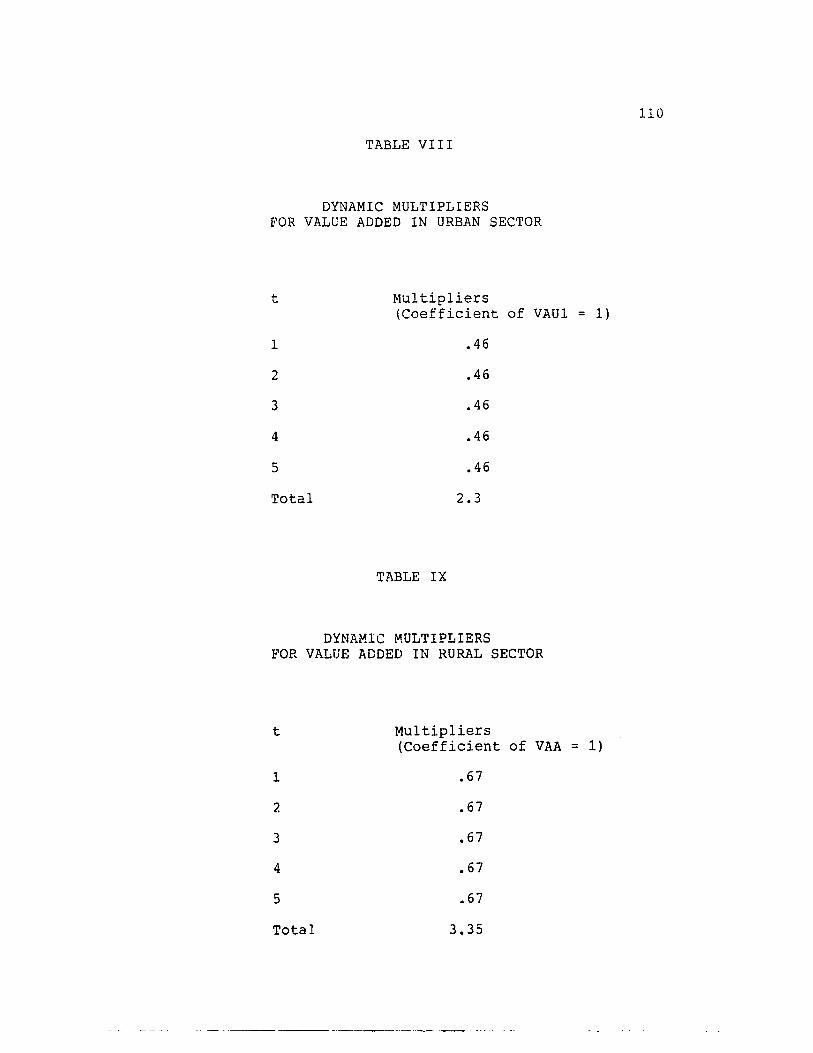
110
TABLE VIII
DYNAMIC MULTIPLIERS FOR VALUE ADDED IN URBAN SECTOR
t Multipliers (Coefficient of VAU1 = 1)
1 .46
2 .46
3 .46
4 .46
5 .46
Total 2.3
TABLE IX
DYNAMIC MULTIPLIERS FOR VALUE ADDED IN RURAL SECTOR
t Multipliers (Coefficient of VAA = 1)
1 .67
2 .67
3 .67
4 .67
5 .67
Total 3.35
- ------------------- --- _.-

t
1
2
3
4
5
Total
t
1
2
3
4
5
TABLE X
DYNAMIC MULTIPLIERS FOR URBAN CONSUMPTION
Multipliers (Coefficient
.29
.165
.094
.054
.031
.634
TABLE XI
DYNAMIC MULTIPLIERS FOR RURAL CONSUMPTION
Multipliers (Coefficient
.4
.24
.144
.0864
.0518
Total .922
111
of CU1 = .57 )
of CR1 = .6)
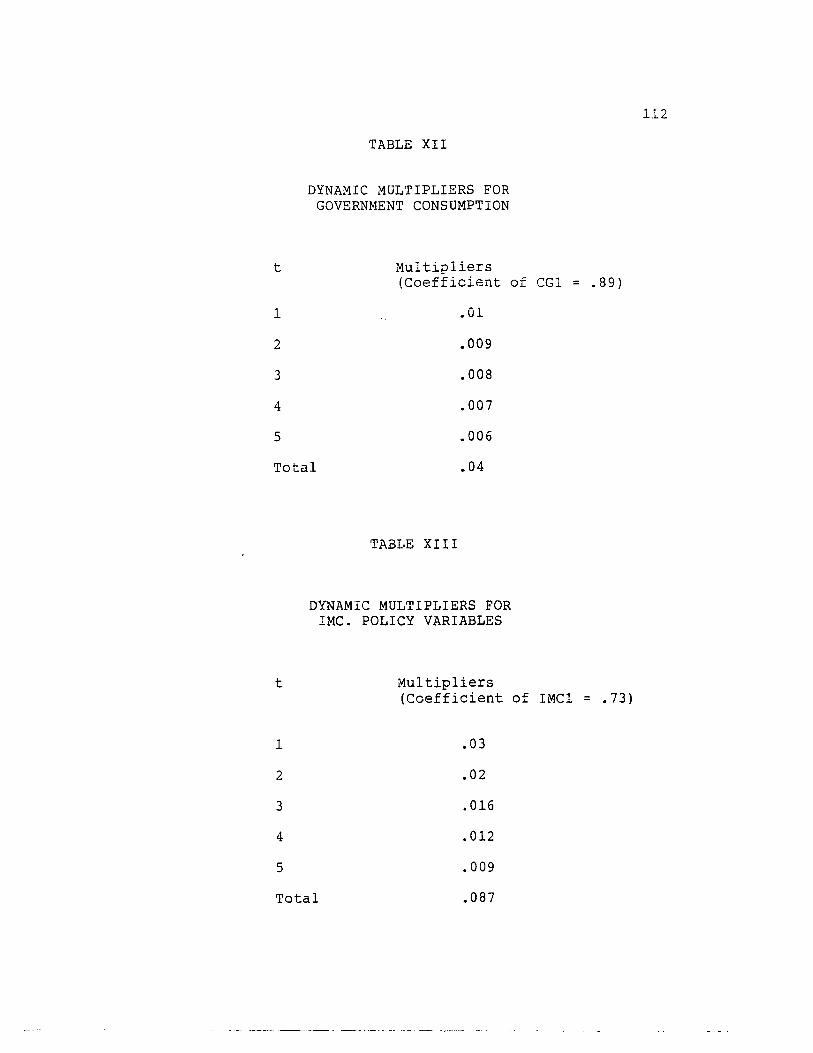
t
TABLE XII
DYNAMIC MULTIPLIERS FOR GOVERNMENT CONSUMPTION
Multipliers (Coefficient of
1 .01
2 .009
3 .008
4 .007
5 .006
Total .04
TABloE XIII
DYNAMIC MULTIPLIERS FOR IMC. POLICY VARIABLES
t Multipliers (Coefficient
1 .03
2 .02
3 .016
4 .012
5 .009
Total .087
of
112
CG1 = .89 )
IMC1 = .73)
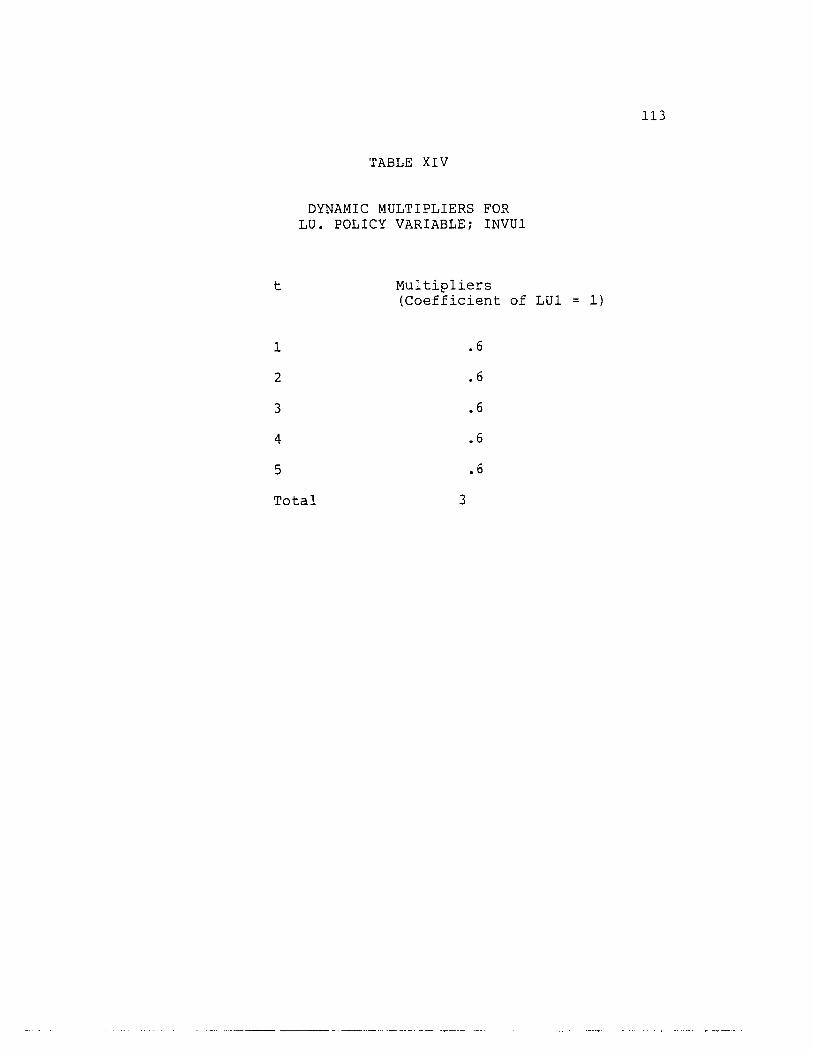
t
1
2
3
4
5
TABLE XIV
DYNAMIC MULTIPLIERS FOR LU. POLICY VARIABLE; INVUl
Multipliers (Coefficient of LUl
.6
.6
.6
.6
.6
Total 3
113
= 1)
114
sector are also very low, compared to the commonly proposed
multiplier of 2 to 2.5 for industrialized countries.
NOTES
1Arun Shourie, "The Use of Macro-Econometric Regression Models of Developing Countries for Forecasts and Policy Prescription: Some Refle~tions on Current Practice" in Oxford Economic Papers, March, 1972, pp. 1-35.
2Plan and BudgGt Organization, Economic Trends of Iran, (Tehran: Operations Research Bureau, 1978).
3B. H. Hall and R. E. Hall. User's Manual, (London, Ontario:
Time Series ProcessorThe University of western
Ontario, 1980), pp. 20-25.
4A. Kautsoyiannis, Theory of Econometrics, Second Edition, New York: Barnes & Noble Books, 1978, p. 475.
5L. R. Klein, "The Treatment of Underutilized Samples in Econometrics", In Econometric Studies of Macro and Monetary Relations, Edited by Alan A. Powell and Ross, A. Williams, New York: North-Holland Publishing Company, 1973, pp. 6-11.
6J. Johnston, Econometrics Methods, p. 485; A. Kennedy, A Guide to Econometrics, pp. 134-140; R. S. Pindyck, Econometric Models and Economic Forecasts, pp. 286; ond P. Wannacot, Econometrics, pp. 295.
7Capital-output ratios for 1959-1967 are calculated by the Central Bank of Iran and are published in Bank Markazi Iran, National Income of Iran 1962-67. (Tehran: Bank Melli Iran Press, 1969), pp. 129-135.
8The Central Bank of Iran recommended the use of a 7% annual depreciation rate of the capital stock.
9Homa Katouzian. The Political Economy of Modern Iran, (New York: New York University Press, 1981), pp. 304-307.
lOR. S. Pindyck and D. L. Rubinfeld. Models and Economic Forecasts, (New York: Company, 1976), pp. 308-320.
11Pindyck and Rubinfeld, pp. 346-349.
--_ .... _--_ .... _._-._----- ---
Econometric McGraw-Hill Book
CHAPTER VI
CONCLUSIONS AND RECOMMENDATIONS
Our purpo~e in this study has been to increase our
knowledge of the structure and behavior of an oil-based
developing economy_
The economic literature attests t6 the fact that an in
creasing number of economists are questioning the realism
as well as relevance of conventional economic theories to
the developing countries. As H. Myint has pointed out
there can be no serious quarrel with those critics who
stress the need to increase the realism of economic theory
by taking into account historical and institutional char
acteristics of developi.ng countries. However, the argument
of those economists who question the relevance of economic
theories is more debatable. In our view the acceptance or
rejection of the relevance of conventional economic theo
ries to the developing economies should be based on the re
sults of the empirical investigations rather than conjec
ture. In fact, the result of this study is a case in
point. Our research demonstrates that the proposed econo
metric model satisfactorily explains the behavior of Iran's
macroeconomic variables. Furthermore, it is found that the
application of Friedman's Permanent Income Hypothesis to
_______ - •• ___________ 00_0.,
the Iranian aggregate consumption data yields plausible
results.
summary
117
Clearly, the developing economies might draw on some
of the conventional economic theo~ies for constructing
econometric models. But, models built for the developin0
economies should reflect local insti~utions and behavioral
characteristics.
Econometric models built for oil-exporting developing
countries should reflect the two basic dualities, namely,
the traditional duality of the agriculture and industrial
modern sector anc the oil duality characterized by an
enclave modern oil sector with little direct link to the
rest of the economy. The lir.kages between the oil sector
and the rest of the economy are established through state
investment anc consumption expenditures. The mode: also
should be disaggregated so that growth of agriculture and
modern urban sector as well as consumption expenditures in
these sectors can be studied. Furthermore, the dominance
of foreign trade should be taken into account with emphasis
on consumer goods, capital and intermediate imports.
Our model includes private consumption expenditures in
rural and urban sectors, state consumption expenditures, im
port of consumer goods, imports of capital and intermediate
goods and non-oil exports. The supply functions include

118
value added equations for agriculture as well as modern
urban and oil sectors. Investments made in agriculture and
urban sector- :r-e :~~l..!~ed to b", ",~0l]""n()1l~ variables. There
are two basic reasons for making this assumption. First,
the model is only concerned with the real aspect of the
Iranian economy and monetary factors such as interest rate,
supply of money, and credits are excluded from t~e model.
Second, in contrast to the classical case, in an oil-based
economy, investments largely depend on the oil revenue and
government expenditures and hence to a large extent is inde
pendent from output and production capacity. Considerable
compromises, however, have been made between constructing
an ideal model of an oil-exporting dualistic economy such
as Iran and the available data. These compromises have
been most significant with respect to demographic and
institutional factors, infrastructure, capital and capacity
restraints in production process, rural-urban migration and
direct treatment of income distribution.
The estimation of the coefficients of the independent
variables are estimated by ordinary least squares and two
stage least squares. Furthermore, historical simulation is
performed to test the validity of the model. In general
the results of simulation are quite satisfactory and indi
cate an overall fit of the estimated model.

1.19
Conclusions
Three different formulations explaining the private
consumption functions in rural and urban sectors are esti
mated. The results seem ~o indicat~ that Iranian consump
tion behavior can best be explained by ?riedman's Permanent
Income Hypothesis. Th~ results from 3rown's and Keynesian
formulations are unsatisfa~tory. Iranian data seem, how
ever, to fit Brownls formulation better than Keynesian hy
pothesis. Gong-run marginal propensities to consume are
calculated for urban and rural areas. The marginal pro
?ensity to consume, in rural sector, as we ~xpected is very
high (.97). Our estimate shows that the numerical value of
the long run marginal propensity to consume in urban sector
is about (.6) which indicates a substantial amount of sav
ings in the urban sector compared to almost zero savings in
the rural areas.
An attempt has been made to estimate the urban's sec
tor aggregate ?(oduction function according to variouS
Cobb-Douglas production fun~tions and linear production
function with constant returns to scale. All of these spec
ifications give implausible results, such as negative labor
share, insignificant efficiency parameter. But the results
obtained from the suggested supply functions are relatively
good and indicate ~hat the marginal productivity of labor
in agriculture sector is far from zero in contrast to the
assumption made by traditional dualistic models.

120
As for the effects of investment expenditures on the
level of employment in agriculture and urban sector, the
rp-sults obtained attest to the fact that development poli
cies of the Iranian government over the estimation period
were inappropriate due to their capital intensive and moder
nist character. Clearly, investment projects which carried
out in the rural and i~ the urban sectors failed to address
the problem of unemployment. In agriculture sector such in
vestments led to poverty and unemployment among peasantry
and high rate of migration to urban areas. In urban sector
industrialization strategy of the government emphasized the
expansion of modern capital-intensive manufacturing indus
try as well as construction, both from the demand and from
the supply side of the market. The labor-absorptive capa
city of the new industries was extremely low and the share
of their workforce was also low. The state also encouraged
the use and provision of different kinds of modern services
which are highly capital intensive with a low labor-absorp
tion capacity.
The reduced form of the model demonstrates that the
links between the different sectors of the economy are very
weak. The economy as a whole, and particularly the urban
sector is found to exhibit a high reliance on imports from
abroad for capital as well as consumer goods. The import
equation for capit~l goods shows the existence of a posi
tive, instead of a negative, relationship between the
------_.- -----._._ .. -.- -'-"

121
investments made in the urban sector and the import of cap
ital and intermediate goods.
F~r~~erm0re, it indic~tes a st~ong ~ositive correla-
tion with the value added of the urban sector. These re
sults imply that the industrial policy of the state did not
succeed to increase significantly the aomestic production
of goods aild services. In other words government import
substitution strategy totally failed to reduce the Iranian
economy's dependence on foreign resources over the period
under consideration.
Non-oil exports consists of the agricultural and new
industrial goods. Nevertheless only value added in agri
culture has been found to be statistically significant in
explaining the non-oil exports and for good reasons. The
share of agricultural products amounted to more than eighty
percent of the total non-oil exports, even in the second
ha If of 1970 s •
All of the exogenous variables are found to have an
impact effect on value added in urban and rural sectors
well below the commonly proposed multiplier of 2 to 2.5,
for industrialized countries. Investments made in urban
and rural sectors have the highest impact effect upon
corresponding value added. In contrast labor has a small
impact. Dynamic multipliers of investment for value added
in urban and rural sector, however, take a long time to
level off and their magnitudes are relatively large
--------------------.- -----.

122
compared with developed countries. It could be deduced
that the time period required fer multipliers to level off
depends on rhe stxllct.urp 0f an 8cO!";~my: 8s?ecially its lag
structure and the efficiency of its stabilizers. To the
extent that less developed economies tend to have a more
simplified stabilizing system than developed economies, an
indirect link could be established between development and
time needed for the multipliers to level off. Furthermore
it is found that the impact multipliers of other policy var
iables except investment variable in the employment equa
tion are very low and dynamic multipliers for consumption
and imports of consumer goods vanish after a short period
of time.
Recommendations
The preceding discussion suggests that a basic reorien
tation of old economic policies and practices is necessary.
The failure of Iran's pattern of development clearly demon
strates that a genuine development can not be achieved
through the importation of machinery and foreign expertise
in a disorganized manner and in isolation from the domestic
production structure. Besides this kind of artificial and
hollow development leads to an extremely uneven distribu
tion of financial resources and income in the economy as a
whole and between urban and rural sectors in particular.
In general, there is a need for a strategy of development
123
as self-reliant as possible, based on a proper balance be
tween agriculture, heavy industries and light consumer in
dustries, reducing dependency on advanced industrialized
countries.
In the light of foregoing analysis, and also the re
sults obtained from this study, an attempt has been made to
illustrate a consistent set of policies which may be con
sidered in design and implementation of development poli
cies in the future. It should be noted that the following
suggestions are neither complete, nor carefully integrated
nor particularly original. They are only presented as an
invitation to further thinking and action.
(a) The redistribution of land through a comprehen
sive land reform and rural development plans. This must
include extensive nation wide activities in helping the
peasants in the field of irrigation, supply of electricity,
housing, supply of fuels, pesticides and fertilizers, build
ing of roads, provision of sanitary and therapeutic ser
vices, and provision of educational and medical services.
(b) Creation of a capital goods sector and paying
special attention to home-grown industry. In both areas,
the objective is to move in the direction of self-suffi
ciency, promotion of appropriate technology and output
mix. Industry should produce basic consumer and producer
goods required by people such as processed food, clothing,
household goods, buses, various tools and instruments as
124
well as the basic inputs to agriculture and manufacturing.
Both in industry and agriculture whenever possible an all
around employment and a more egalitarian distribution of
income should be promoted by adoption of labor-intensive
techniques.
(c) Mobilization of idle labor and creation of infra
structure especially in rural areas. Besides being employ
ment-creating, such activities can contribute towards the
acceleration of investment through the direct application
of labor. Capital stock is also often under-utilized. In
this regard special emphasis should be placed on provision
of technical and managerial training and educ~tion.
(d) Selective import substitution policies should be
pursued in the area of international trade. While machin
ery and some raw materials would continue to be imported to
the extent necessary, imports of unnecessary consumers
goods should be eliminated.
As the tex~ makes it abundantly clear the model that
has been put forward ~n this study is a simple model and
there is definitely room for substantial improvements. It
is hoped, however, that the present model will be of some
help to future formulations. If data became available the
model itself could be enlarged to include production func
tions in manufacturing, services, construction and water
and power. Consumption functions may be disaggregated to
125
represent food as well as non-food consumption equations.
It could be of some interest to include and specify the
investment functions for each sector. It could be also
possible to introduce a demographic submodel with special
attention to rural urban migration. Improved statistics
would also lead to improved employment functions, and the
model could be enlarged even further to treat direct taxa
tion, prices and monetary sector.
------------- ~~-~ ~---- -- ...
BIBLIOGRAPHY
Adelman, I. and E. Thordecke, The Theory and Design of Economic Development, Baltimore: Johns Hopkins Press, 1966.
Adelman, Irma, and Holiss B. Chenery, "Foreign Aid and Economic Development", The Review of Economics and ?tatistic~, Vol. XLIII, No.1 (Feb. 1966).
Alnasrawi, Abbas, rina~cing E~onomic Development in Iran: The role of Oil in a Middle Eastern Economy, New York: Praeger, 1967.
Amin, Samir, Imperialism and Uneqllal Development, New York~ Monthly Review, 1977.
Amuzegar, J. and M. A. Fekrat, Economic Development Under Dualistic Conditions, Chicago: University of Chicago Press, 1971.
Amuzegar, J., Iran, An Economic Profile, Washington, D.C.: Middle East-rilstitute, 1977a.
Iran, An American Profile, W~shington, D.C.: Middle East Institute, 1977b.
Baumol, W. J., Economic Dvnamics, New York: The fJfacmillan Company, 1951. ---
Banani, Amin, The Modernization of Iran, 1921-1941, Stanford: Stanford University Press, 1961.
Barisch, William, "The Industrial Labor Force of Iran: Problems of Recruitment, Training and Productivity", The Population of Iran: A Selection of Readings, edited by Jamshid Momeni, Honolulu, East-West Center, 1977 •
Bharier, Julian, Economic Development in Iran: 1900-1972, New York: Oxford University Press, 1971.
B inde r, Leona r d, ~I-=r:..:a;;.:n..:..:=--_P~o-=l~i:...:t:..:i::.;c::.;a:;:.l:::-::.D-=e~v....:;e~l::.;0:..Jp;:.;m:;.;.e~n..::t--=i;.:,n:;........:a.~C::.;h:.:.a=n~g-=i:.:.n~g Society, Berkeley: University of California Press, 1962.
Bos, Henk C., "Some Simple Thoughts on Model Building for Developing Countries", The Pakistan Development Review, 22, 1983, pp. 63-71 •
. _-----------_ .. _._- --_ ..

Campagna, Anthony 5., Macroeconomics Theor7 and Polic7, Boston: Houghton Ml£rl1n, 1974.
Brun, Thierry, and Dumont, Rene, Iran: Imoerial Pretensions and Agricultural Dependence.
Burmeister, E. and A. R. Dobell, Mathematical Theories of Economic Growth, London, 1970.
Carey, Jane and Carey, Andrew, "Iranian Agriculture and its Development: 1952-1973", International Journal of Middle East Studies, July, 1976.
Chenery, H. B.,Studies in Development Planning, Cambridge, Mass.: Harvard University Press, 1971.
Chenery, H. B" and Macewan, "Optimal Patterns \)f Growth and Aid: The Case of Pakistan", Pakistian Development News, Summer 1966.
Compagna, A. S., Macroeconomics Theory and Policy, Boston: Houghton Mifflin, 1974.
Da£tary, Farhad, "Development Planning in Iran: A Historical Survey", Iranian Studies, 6, Autumn, 1973.
Dixit, A. K., "Optimal Development in the Labor Surplus Economy", Review of Economic Studies, January 1968.
Doroudian, Reza, "Modernization of Rural Economy in Iran", Iran: Past, Present, and Future, edited by Jane Jacgz, New York: Aspen Institute for Humanistic Studies, 1976.
Eckaus~ R. S., "The Factor Proportions Problem in Underdeveloped Areas", American Economic Review, September, 1955.
Evans, M. K., Macroeconomic Activity, Theory, Forecasting and Control, New York: Harper and ROw, 1969.
Fei, J. C. H., and G. Ranis, "A Theory of Economic Development", American Economic Review, September 1961.
Development of the Labor Surplus Economy, Homewood: Richard D. Irwin, 1964.
Fekrat, A. M., "Growth of OPEC-Type Economies: A Preliminary Theoretical Inquiry". Economica Internationale, February 1979.
--------- --.,,-~ -

Fox, i:<. A., J. i<. Se~gut?ta, and E. rhorbec;~e, The Theoe! T[
Quantitative ~conomic ?olicy, C~icaqo: ~icharc
McNallgh Company, 1960.
Furtado, C., Development and Underdevelocment, Berkeley: University of California Press, 1963.
Graham, Robert~ Iran: The Illusion of Power, New York: St. Martins Press, 1979.
Holliday, Fred, Iran: Dictatorship and Development, New York: Penguin, 1979.
Hagen, E. E., Planning Economic Development, Homewood: Richard D. Irwin, 1968.
Hall, Brownyn H. and Robert E. Hall, Time Series ProcessorUser's Manual, London, Ontario, The University of Western Ontario, 1930.
Hemmasi, Mohmmad, Migration in Iran: A Quantitative Approach, Shiraz: Panlavi University, 1974.
Hirsch, EtIenne, Employment and Income Policies for Iran, Lausanne: Presses Centrales, 1973.
Hirschman, A. 0., "Economic Policy in Underdeveloped Countries", In B. Okvn and R. W. Richardson (eds.), Studies in Economic Development, New York: Holt, Rinehart and Winston, 1971.
"The Political Economy of Import-Substitution Industrialization in Latin America", The Quarterly Journal of Economics, February 1960.
1'he_s.!rat.e:.9.Y..-9_£~E_onomic Development, New Haven: Yale University Press, 19710
Hobbs, John, "Land Reform in Iran: A Revolution from Above" ORBIS, 7 (Fall, 1963).
Iran, Bank Markazi, Annual Report and Balance Sheet, Tehran, BMI, 1968-1976.
Iran, Bank Markazi, National Income of Iran 1962-67, Tehran, Iran, Bank Melli Iran Press, 1969.
Iran, Plan Organization, Fourth National Development Plan: 1968-1972 .
Iran, Plan and Budget Organization, Iranian Statistical Center Publications, 1973-78.
129
Iran, Plan and Budget Organization, Economic Trends of Iran, T2nran, Iran, Operations Research Bureau, 1978.
Issawi, Cnarles, "The Iranian Economy 1925-1975: Fifty Years of Economic Development", Iran Under the Pahlavis, Edited by George Lenczowski, Stanford, California: Hoover Institution Press, 1978.
Jacqz, Jan, ed. Iran: Past, Present and Future, New York: Aspen Institute for Humanistic Studies, 1976.
Johnston, J., Econometric Methods, New York: McGraw-Hill Boo~ Company, 1984.
Jorgenson, D. W., "Surplus Agriculture Labor and Development of a Dual Economy", Oxford Economic Papers, November 1967.
"The Development of a Dual Economy", Economic --Journal, June 1961.
Jones, H. G., An Introduction to Modern Theories of Economic Growth, New York: McGraw-Hill Book Company, 1975.
Katouzian, Homa, The Political Economy of Modern Iran, New York: New York University Press, 1981.
Katozian, M. A., "Oil Versus Agriculture: A Case of Dual Resource Depletion in Iran", Journal of Peasant Studies, 5, (August 1978), 347-69.
Kautsoyiannis, A., Theory of Econometrics, Second Edition, New York: Barnes & Nobel, 1978.
Kazemi, Farh~d, Poverty and Revolution in Iran, New York: New York University Press, 1980.
Kelly, A. C. and J. G. Williamson, and Cheethan, Dualistic Economic Development, Chicago: Universi~y of Chicago Press, 1972.
Kennedy, Peter, A Guide to Econometrics, Cambridge: The MIT Press, 1979.
Keynes, John M., The General Theory of Employment, Interest and Money, London: Macmillan, 1963.
Keynes, John M., The General Theory of Employment, Interest and Money, London: Macmillan, 1963.
Kindleberger, Charles C., Economic Development, Second Edition, New York: McGraw-Hill Book Company; 1965.
130
Klein, L. R., "What Kind of Macroeconometric Model for Developing Economies?", Readings in Economic Statistics and Econometrics, edited by Arnold Zellner, Boston: Little, Brown and Company, 1968.
Klein, L. R., and R. M. Young, An Introduction to Econometric Forecasti!!.f and Forecasting Models, Lexington: Lexington BooKs, 980.
Kuznets, S., Toward a Theory of Economic Growth, New York: W. W. Norton and Company, 1968.
Lewis, W. A., "Economic Development with Unlimited Supplies of Labour", ~anchester School, May 1954, pp. l39-9l.
Livingstone, I., Edited, Economic Policy for Development, Middlesex, England: penguin Books, Ltd., 1971.
Looney, Robert, A Developmental strateg1 for Iran Through the 1980's, New York: Praeger Pub isbers, 1977.
_____ a The Economic Development of Iran: A Recent Survey \~itfi projections to 1981, New York: Praeger Publishers, 1973.
Mayes, David G., ~~s~tions of Econometrics, Englewood Cliffs, New Jersey: Prentice Hall International, 1981.
Maddala, G. S., Econometrics, New York: McGraw-Hill Book Company, 19~
Mahalanobis, p. D., "The Approach of Operational Research to Planning in India", Sankhya, December 1955, pp. 3-130.
Morton, p., "Surplus Agricultural Labor and Development: Facts and Theories", American Economic Review, September 1965, PP. 815-834.
Myint, H1a, "The Classical Theory of International Trade and Underdeveloped Countries", Economic Theory and the Underdeveloped Countries, edited by H1a Myint, New York: Oxford university Press, 1971.
Myrda1, G., An Approach to the Asian Drama, New York: Vintage Books, 1970 •
. . ..... __ ._------------_._ .. -.- --.--- .....
131
Nurkse, R., Problems of Capital Formations in Underdeveloped Countries, New York: University Press, 1953.
Pindyck, R. S., Optimal Planning for Economic Stabilization, Amsterdam: North-Holland Publishing Company, 1973.
Pindyck, R. S. and D. L. Rubinfeld. Economic Forecasts, New York: Company, 1976.
Econometric Models and McGraw-Hill Book
Plan and Budget Organization, Economic Trends of Iran, Tehran: Operations Research Bureau, 1978.
Qayum, Abdul, Technigues of National Economic Planning, Bloomington: Indiana University Press, 1975.
Rosenstein-Rodan, P. N., "Notes on the Theory of the Big Push", Economic Development for Latin America, New York: St. Martins Press, 1961.
Rostow, W. W., The Stages of Economic Growth, New York: Cambridge University Press, 1960.
Schumpeter, J. A., The Theory of Economic Development, Cambridge: ilarvard University Press, 1934.
Scitovsky, T., "Two Concepts of External Economies", The Economics of Underdevelopment, edited by A. N. Agarwala and S. P. Singh, New York, 1963.
Shahshahani, Ahmad and J. Malcolm Dowling, "An Econometric Model Forecast of Iran, 1975-1985", The Journal of Energy and Development, Autumn, 1976.
Shourie, Arun, "The Use of Macro-Econometric Regression Models of Developing Countries for Forecasts and Policy Prescription: Some Reflections on Current Practice", Oxford Economic Papers, March 1972, pp. 1-35.
Singh, K. S., Development Economics, Lexington: Lexington Books, 1975.
Todaro, M. P., Economic Development in the Third World, London: Longman, 1977.
United Nations, Trade Prospects and Capital Needs of Developing Countries, New York: UNCTAD, 1968.
United Nations, Feasible Growth and Trade Gap Projections in the ECAFE Region, Bankog: ECAFE, 1968.
132
Vakil, Firouz, "An Econometric Model for Iran", Bank Marzi Iran Bulletin, Vol. 11, (July-August, 1972).
~An Econometric Model for Iran: Estimated structured EquationsW, Bank Markazi Iran Bulletin, Vol. 11, (September-November, 1972).
WAn Econometric Model for Iran: Estimated Structured Equations·, Bank Markazi Iran Bulletin, Vol. 11, 1973.
"Iran's Basic Macroeconomic Problems: A TwentyYear Horizon", Economic Development and Cultural Change, July 1977, pp. 713-727.
Wallich, H. C., "A Theory of Derived De~e1opment", The Economics of Underdevelopment, edited by A. N. Agruwala and S. P. Singh, New York: Oxford University Press, 1963.
Wonnacott, Paul, Macroeconomics, Homewood, Illinois: Richard D. Irwin, Inc., 1984.
Zarembka, Paul, ·Marketable Surplus and Growth in the Dual Economy·, Journal of Economic Theory, 2, 1970, pp. 107-121.
---._--------_. -_._---------------_._---.- _._-..
APPENDIX A
A SUMMARY OF QUANTITATIVE CHANGES AND STRUCTURAL SHIFTS IN THE IRANIAN ECONOMY OVER
1959-76 PERIOD
All variables are for annual time periods and in bil-
lion of rials and thousand of persons. All variables are
in terms of constant 1959 prices.
-- - -----______ .. _____ ._. ~ __ -0-._-.
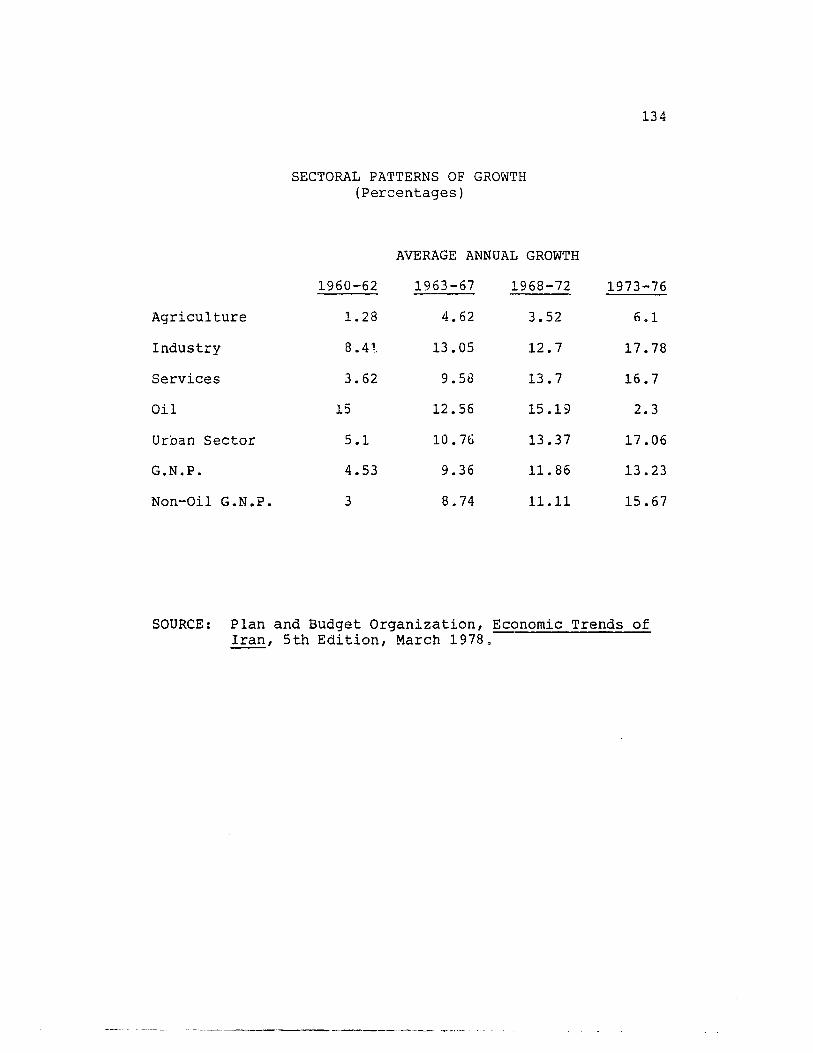
Agriculture
Industry
Services
Oil
Urban Sector
G.N.P.
Non-Oil G.N.P.
SECTORAL PATTERNS OF GROWTH (Percentages)
AVERAGE ANNUAL GROWTH
1960-62 1963 -67 1968-72
1.28 4.62 3.52
8.41, 13.05 12.7
3.62 9.58 13.7
15 12.56 15.19
5.1 10. 76 13.37
4.53 9.36 11.86
3 8.74 11.11
134
1973-76
6.1
17.78
16.7
2.3
17.06
13.23
15.67
SOURCE: Plan and Budget Organization, Economic Trends of Iran, 5th Edition, March 1978.

SECTORAL DISTRIBUTION OF GROSS NATIONAL PRODUCT 1959-76, SELECTED YEARS (Billion Rials, 1959 Constant Prices)
1. Agriculture
2. Industry
Manl.lfactur in<J and r-Hning
Construction
Waler & Power
3. Services
Public Services
4. Oil
5. G.N.p.a
196::! 1967 1972 1976 Amoullt Amount Amoun t AIIIOUII t
J % of q_. N • !l-.:J ___ ( % of G. N • P • ) (% of G. N • P:l ___ ~_~~~!':G~~L
38.73 (21.35) 111 (21.9) 131.5 (14.83)
57.71 (17.79) 106.2 (20.95) 192.84 (21.75)
41.49 (12.79
14.07
2.15
4.33)
.66)
72.51 (14.31) 140.04 (15.19)
24.92 4.92)
8.77 1. 73)
31. 99
20.81
3.61)
2.35)
119.83 (36.96) 189.64 (37.42) 360.51 (40.66)
24.65 ( 7.6 ) 50.12 (15.45)
324.35
48.66 ( 9.6 ) 90.25 (17.81)
506.8
104.4 (11. 74) 182.65 (20.6 )
886.63
166.f37 (11.45)
370.139 (24.46)
260.47 (17.88)
70.8 4.86)
39.62 2.72 )
667.87 (45.85)
171.73 (11.79) 197.33 (13.55)
1456.640
aIncludes indirect taxes and non-oil net factor income from abroad.
SOURCE: Plan and Budget Organization, Economic Trends of Iran, 5th Edition, MarcIl 1978.
t-' W Ul
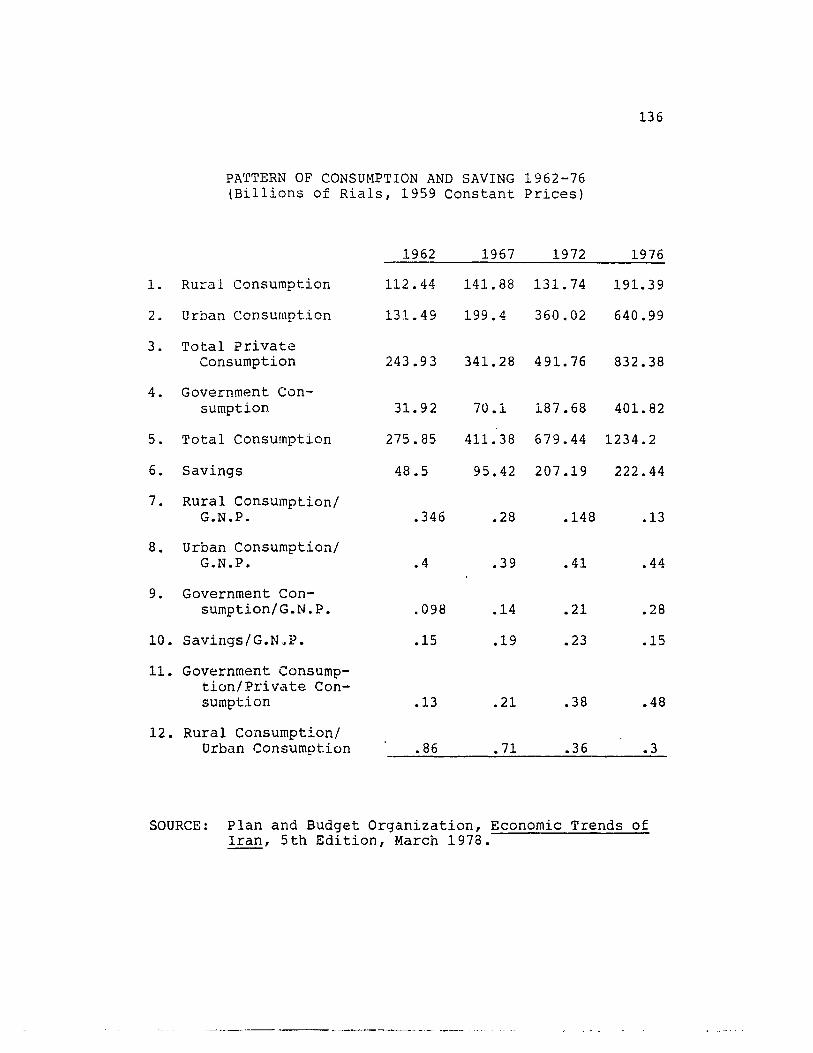
1.
2.
3.
4.
5.
6.
7.
8.
9.
10.
11.
12.
PATTERN OF CONSUMPTION AND SAVING 1962-76 (Billions of Rials, 1959 Constant Prices)
1962 1967 1972
Rural Consumption 112.44 141. 88 131.74
Urban Consumption 131.49 199.4 360.02
Total Private Consumption 243.93 341. 28 491. 76
Government Con-sumption 31. 92 70.1 187.68
Total Consumption 275.85 411. 38 679.44
Savings 48.5 95.42 207.19
Rural Consumption/ G.N.P. .346 .28 .148
Urban Consumption/ G.N.P. .4 .39 .41
Government Con-sumption/G.N.P. .098 .14 .21
Savings/G.N .. P. .15 .19 .23
Government Consump-tion/Private Con-sumption .13 .21 .38
Rural Consumption/ Urban Consum9tion .86 .71 .36
136
1976
191.39
640.99
832.38
401. 82
1234.2
222.44
.13
.44
.28
.15
.48
.3
SOURCE: Plan and Budget Organization, Economic Trends of Iran, 5th Edition, March 1978.
-------------------- ----- --
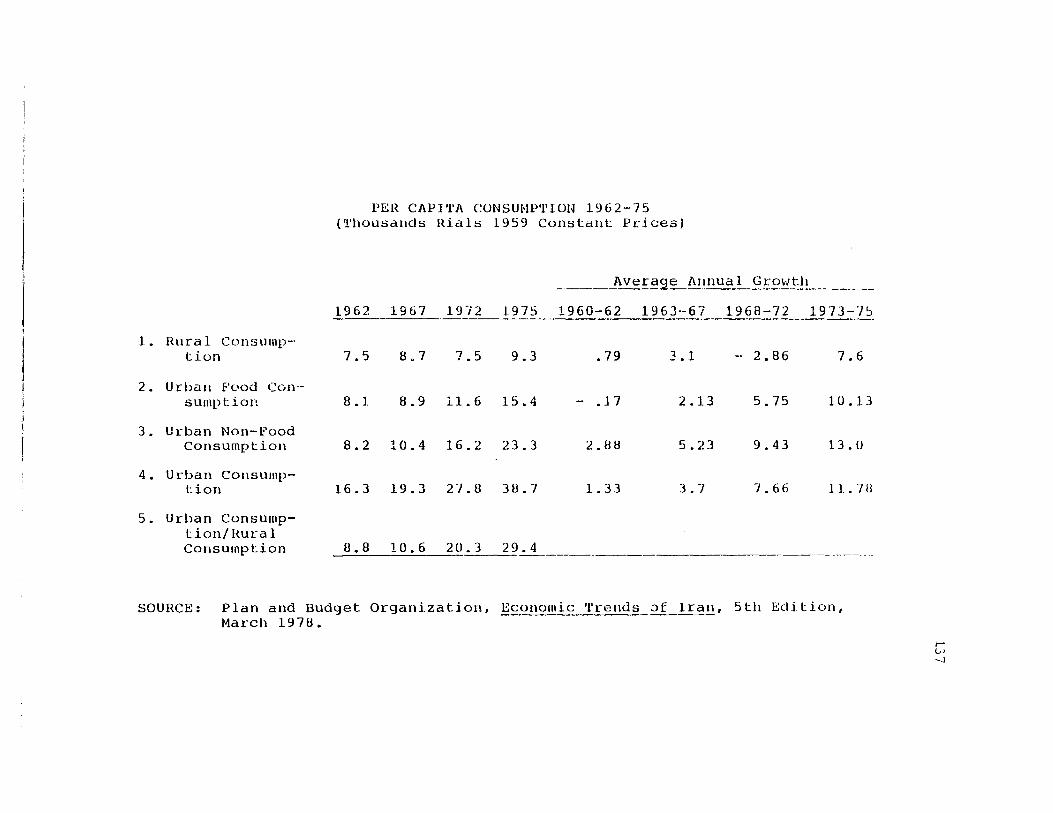
1. Rura 1 ConsulIlp-o tion
2. Urban F'c..'od Con-sumption
3. Urban Non-~'ood Consumption
4. Urban Consump-tion
5. Urban Consulllp-tion/Hural Consumption
PER CAPITA CONSUMPTION 1962-75 ('!'housands Rials 1959 Constant Prjces)
Avera~_A/lnUa 1 Growt~ ____
1962 1967 1972 1975 1960-62 196Jo-67 1968-72 1973-}:,
7.5 8.7 7.5 9.3 .79 3.1 _0 2.86 7.6
8.1 8.9 11.6 15.4 - • j 7 2.13 5.75 10.13
8.2 10.4 16.2 23.3 2.88 5.23 9.43 13.0
16.3 19.3 27.8 38.7 1. 33 3.7 7.66 11.7U
8.8 10.6 20.3 29.4
SOURCE: Plan and Budget Organiza tion, Economic 'l'rends .:>f I ran, 5 th Eeli t ion, March 1978.
f--' L.J -.j
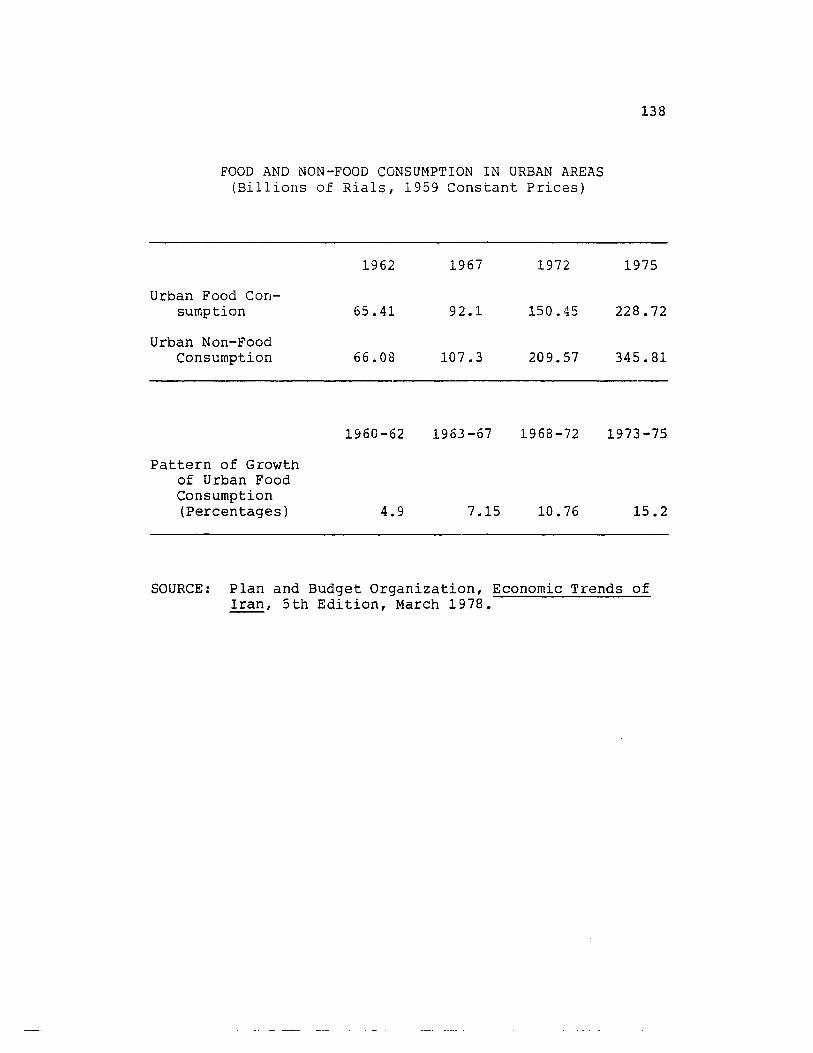
FOOD AND NON-FOOD CONSUMPTION IN URBAN AREAS (Billions of Rials, 1959 Constant Prices)
1962 1967 1972
Urban Food Con-sumption 65.41 92.1 150.45
Urban Non-Food Consumption 66.08 107.3 209.57
1960 -62 1963-67 1968-72
Pattern of Growth of Urban Food Consumption (Percentages) 4.9 7.15 10.76
138
1975
228.72
345.81
1973-75
15.2
SOURCE: Plan and Budget Organization, Economic Trends of Iran, 5th Edition, March 1978.

1'/lTTJ:;lHl UF I HI'OU'I'S AND EX I'''WI'S (UllliolltJ of RliJl,.. 1959 COllal '-hlt Prlcesl
_. ___ ~v"ra'.l~~.L Gr!2~~!! _____
I. III.pOlLS of ConSlUIlt!r Guods
2. I'''I'~JI I s of CiJpl tal Ilud [ .. l~lllll-dl).:..~ (j~HHia':'
J. 'j'(.llLli 'lUpulls
q. lIulI-ui J LXI,urls t'
~. E~IJljLI uf (~il':
6.. Tutul '~x!:orls
I"'I'U[I at cdl'llal ... ,,,1 IlIl..,lUlC!\l!al" Guu~H/ViJluc Added in lJlhdll sector
o. tluPOl t s/B.tI.(l.
9. 1'''1",,1 s/Hull-oi I G.tI.P.
10. 1·;"I,o,l5/li.H.P.
1962 1967
II.B4 16.46
34.42 '/6. ~ I
43. 26 9J.3}
9.92 13 .Il:!
H.i! ilS.:n
54.6;! 99.0
.194 .26
.13 ] .1114
.1511 .224
.1611 .19 I
1972 1976 1960-62 1963-67 19611-72 19/1-75
52.56 167.74
1J~.02 31; 1.74
lai.6 52b.:JU 3.45 .i.,. ~ij IS.0J l'i. I
25.49 J.l.i!1 2.Sa /.~4 U./tJ 11. 39
1/6.44 191.1.1 13. J I 13.H 15.16 .4~
201.93 22(;.95
.244 .HIJ
.211 .36]
.266 .42
.221 .156
11. 1I1111-oi 1 I'XI'0l·tS/ G.II.I'. _~.Q_3 __ ~Q~L. __ ~~!! ____ ...!Q~l _________________________ _
a IlIcl .. des imports of services.
1> Illcludes eXJlorts of services
c Includes exports of 'las.
SOUUCJ::: Plall and Uudget Organization. Ecolloudc 'l'!el"ls_.2L.1!.~!!, ~th Edltloll, Hdrch 1978. t-> LV lD
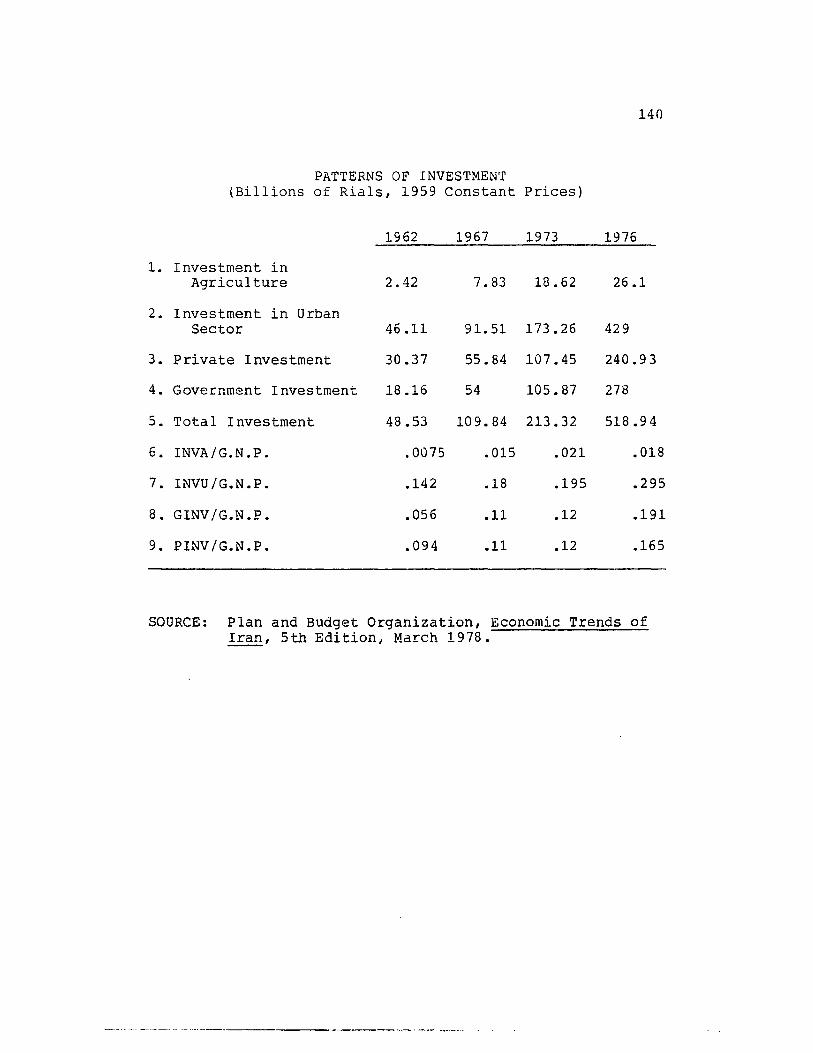
140
PATTERNS OF INVESTMENT (Billions of Rials, 1959 Constant Prices)
1962 1967 1973 1976
1. Investment in Agriculture 2.42 7.83 18.62 26.1
2. Investment in Urban Sector 46.11 91. 51 173.26 429
3. Private Investment 30.37 55.84 107.45 240.93
4. Government Investment 18.16 54 105.87 278
5. Total Investment 48.53 109.84 2l3.32 518.94
6. INVA/G.N.P. .0075 .015 .021 .018
7. INVU/G.N.P. .142 .18 .195 .295
8. GINV /G.N.P. .056 .11 .12 .191
9. PINV/G.N.P. .094 .11 .12 .165
SOURCE: Plan and Budget Organization, Economic Trends of Iran, 5th Edition, March 1978.

SECTORAL DISTRIBUTION OF TOTAL LABOR FORCE (Thou~ands) 1959-76
1962 1967 1972 No. No. No.
1976 No.
1-~_C~ .. L!?-La.!_) __ J% of 'l'otal) (% of 'l'ota !_) _i!.._ of _!~!:~.!).
Agr leu 1 tur-e 3616 (53.65) 3900 (49.03) 3693 (40.08) 3418 (34.2~)
Illdustry 1443 (21.41) .19613 (24.-/4) 2700 \29.37) 3300 (33.(U)
Services 1646 (24.42) 2040 (25.6~) 2765 (30.01) 3048 (30.54 )
COlilmerce, Banks, Transportation and COIlIIIlUIl 1 ca t ion 711 (10.55) 836 (10.51) 1241 (13.47) 1524 (1':>.2'1)
Other Services 935 (13.87) 1204 (15.14) 1524 (16.54) 1675 ( 16 . -, u )
Oil 35 .52 ) 46 .5llJ 50 • 541 62 ·§ll..
'l'O'I'AL 6740 7954 9214 9979
SOURCE: Plan and Budget Or9ani~aLion, Econolllic 'l'n:!ndti of Iran, 5Lh Ediliull, Man;h 1970. ---------------------
f-'
"'" f-'

Agr i cu I t.u."
Induslry
5tnv ices
Nun-Ojl Urban
'rota I Non-Oi 1
OU'l'PU'l' PEl! WOHKEH IN HAlIl ECONOH I C SEC'l'OHS Hlill10ns of Hials. 1959 constant Pticcs/'fhulisands of WOl'ket's)
Uulplll l'(:~~.Work-=r
24.~4
40
72.B4
51.49
39.72
1962 1912 1976 U .. ldtivt! OUlput outl,lIt U,ddllve output output Helalive UlIll'lIt
__ ye £_~~_!;h~ __ l'!!£.. ~~!~.!:!' ___ .!'~.L~~!~ ___ E.~,L~or k~;-___ ?.£L_.!!'~!E!':~! __
.62 35.61 .411 48.8) . ."
1 71. 26 • 95 112.39 • 92
LID 1]0.38 1.74 219.12 1..11
1. 45 101.14 1. 36 163.63 1..34
1 74.73 121.57
---------
Souuel::: Plan and lJudge!; Organization, Ecol~~!~'!'E~~~_..£L!E..e!~. 5th Edit.ion, Batch 1~70.
~ .t> N
APPENDIX B
BASIC TIME SERIES DATA OF THE IRANIAN ECONOMY
All variables are for annual time periods, in billion
of rials and thousand of persons. All variables are in
terms of constant 1959 prices.
---.-----.-~----. -.-- --.-.

ous _y'!,!A VAll VAO _____ ~_H __ __..£!l. CG
1~) 59 U5.40000 153.JOOO Jj.OOOUO 104.·jQOO 109.1000 30.300UO
1960 U·7.00000 162.3000 36.90000 105.7000 117.8000 32.100()0
l~61 87_80000 167.0000 44.60000 108.6000 1n.00OO 31. 2000(j
i962 as.70000 177.6000 50.10000 112.4000 131.5000 31 .90000
1:363 90.10000 lH.7000 53.50000 11 1. 7000 135.9(jOO 34.50000
1964 !l2.JOOOO 210.UOOO 51l.80000 122.2000 147.7000 41.9£1000
1965 99.40000 2·!O.3000 71i.40COO DO.6UOO 155.2000 54.S0000
1966 102.llOOO 264.1000 79.80000 132. UOOO 1116.6000 61.70000
1967 111.0000 295.8000 90.30000 14l.9000 199.4000 70.10000
1968 119.5000 331.3000 104.7000 143.3000 239.9000 Sl.!:IOOGO
1969 123.2000 367.1000 125.8000 13U.I000 2U1. 7000 ~6.40Ullll
1970 129.0000 412.1000 144.9000 142.4000 321.4000 111.)000
1971 125.9000 467.9000 160.0000 140.7000 32).7000 142.7000
1972 131.4000 553.4000 102.7000 1)I.UOOO 360.0000 11l7.700U
1973 1311.7000 6511.6000 198.7000 15u.JOOO 4J4.1l000 220.7000
1974 146.7000 773.3000 197.5001J 167.5000 40·'.0000 323.UOOO
1975 156:4000 904.7000 173.2000 1"12.5000 574.5000 312.4000
1976 166.9000 1038.800 197.3000 l!d.4(J00 641.0000 401.8000 .-. ~
.r--
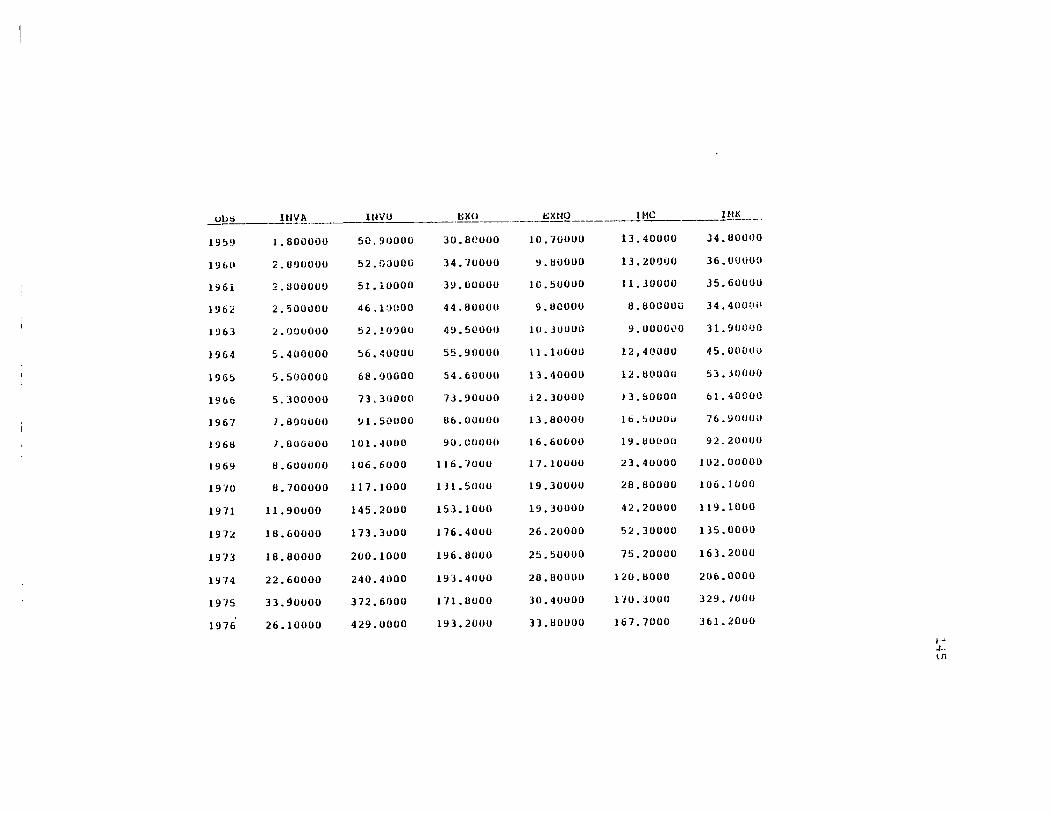
~Uti ___ l~y~_ llNIJ a;xo ___ ~xtlQ _____ .....!.I1L-___ l!l.~_
19~1) 1.800000 50.90000 30.80000 10.70000 13.40000 J4.60UOO
191>0 2.01)0000 52.GGUOO 34.700UO ~. IWOOO 13.20000 36.0UliUU
1961 :<.l!UOOOO 51.10000 39.00000 10.5UOOO 11.JOOOO ]5.6UUOU
196;; 2.'500000 46.1~)OOO 44.800UU 9.110000 6.60000U 34.40000
1963 2.000000 52.1/)'.)00 4!l.50000 IO.JUlIUa 9.000GLI O 31.901)'.)0
1964 5.400000 56.40000 55.90000 \1.1UOOO 12,41.HJOO 45.000110
1965 5.500000 68.00000 54.6000U 13.40000 12.t:lOOOIl 53.JOnOO
1966 5. ~WOOOO 73.30000 73.900UO i2.JOOOO J).flDoon til.4000tJ
1967 1.800000 !Jl.50000 116.0UOOO 13.80000 lli.SUUOi} 76.90000
1961l 7.000000 101. 4000 !lO.CUUUO 16.6UOOO lY.UU!!UU 92.20UUU
1969 1I.6UUOOO 106.6000 116. ·/UOU 17.10000 23.40000 102.0UOUU
1970 U.700000 117.1000 131.5000 19.30000 26.UOOOO 106.1000
1971 11.90UOO 145.2000 153.1000 19.30000 42.20000 119.1000
1972 11l.60000 173.3UOO 176.40UO 26.20000 ':>2.30000 135.0000
1973 18.80000 200.1000 196.1l000 25.5UOOO 75.20000 163.2000
1!l74 22.60000 240.4000 193.4000 20.1l0000 120.1l00O 206.0000
1975 33.!J0000 372.6000 1"11. UOOO 30.40000 nU.300U 329.7000
1976 26.10000 429.0000 193.20UO 33.UOOOO 167.7000 361.2000
~ .t. V1
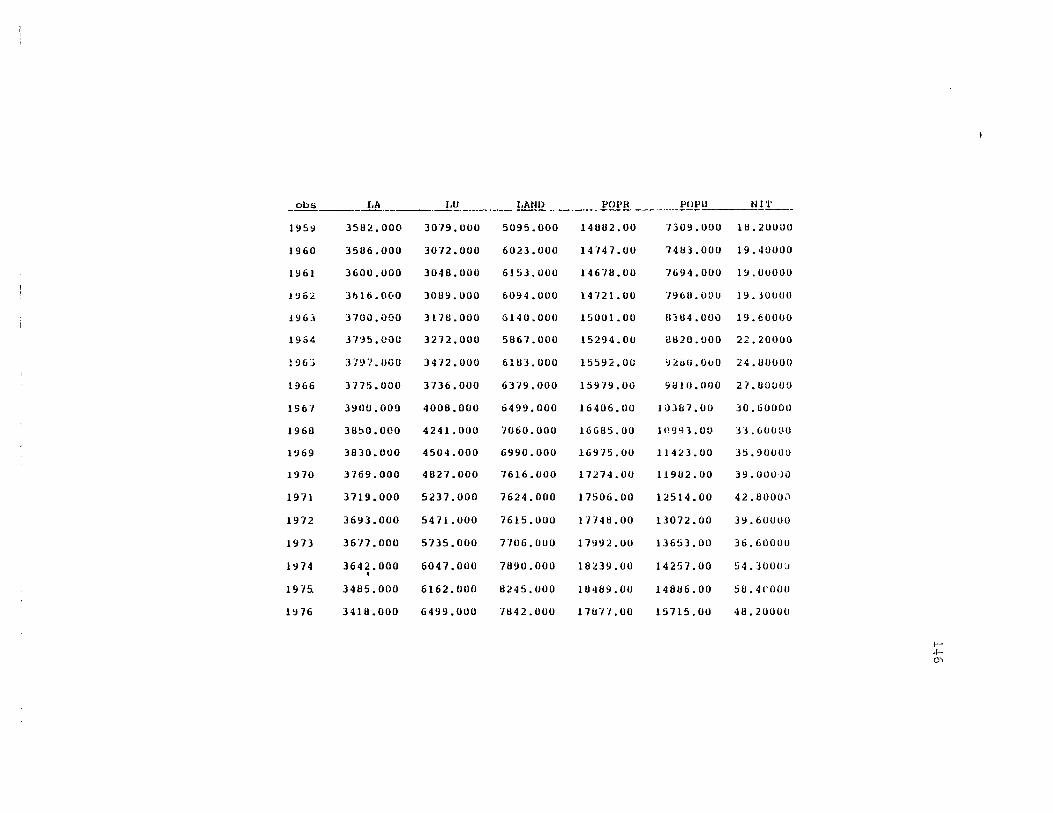
_obs ____ LA._ I.U I.ANI} POl'R pUPU NI ')'
195~ 358:!.00O 30"19.000 5095.000 14HH2.00 7309.000 IH.200UO
1960 3586.000 3072.000 6023.000 14747.00 748].000 19.40000
1961 3600.000 3048.000 6153.000 146 ·/8.00 "/694.000 19.0UOOO
1962 )b16.(WO 30119.UOO 6094.000 14721.00 796U.OLIU 19.30UUU
196.i 3700.000 H78.000 G140.0011 15001.00 8~tl4.()O\l 19.€00OO
1954 JH5.0()(; 3272.000 51167.000 15294.00 «l820.UOO 22.20000
: 96"j :l797.000 3472.000 6183.000 15592.01; 'Ji!i>il.OuO 24.00000
1966 3775.000 3736.000 6379.000 15979.00 9010.01)0 27.00000
1967 3900.000 40011.000 6499.000 16406.00 10)07.00 30.60000
1960 38t>0.oao 4241.000 7060.000 16685.00 In~~LO() :n.600110
1969 3830.000 4504.000 6990.000 169"/5.00 11423.00 J5.90000
1970 3769.000 4827.000 7616.000 17274.00 119U2.00 39.000Jil
1971 3719.000 5237.000 7624.000 17506.00 12514.00 42.0000Cl
1972 3693.000 5471.000 7615.000 IF140.00 13072.00 39.60000
1973 36"17.000 5735.000 n06.000 17992.00 13653.00 36.60000
1~74 3642.000 6047.000 7890.000 U1239.00 14257.00 54.3000J •
19"1s' 3485.000 6162.000 0245.000 10'189.00 14886.00 58.4('000
1976 3418.000 6499.000 7842.000 17un.OO 15715.00 48.20000
I-' .Ie. 0'\