an asymmetrical model of the airways of the dog lung
TRANSCRIPT
An asymmetrical model of the airways of the dog lung
KEITH HORSFIELD, WENDY KEMP, AND SALLY PHILLIPS The Midhurst Medical Research Institute, Midhurst, West Sussex, England M.J.29 OBL
HORSFIELD, KEITH, WENDY KEMP, AND SALLY PHILLIPS. An asymmetrical model of the airways of the dog lung. J. Appl. Phvsiol.: Respirat. Environ. Exercise Phvsiol. X2( 1): 21-26, 1982.-A resin cast of the bronchial tree of a dog was studied down to branches of O.&mm diameter. The branches were ordered, and the number of branches, mean diameter, and mean length of branches in each order were determined. The model was developed from these dat.a with the property that delta, the difference in order between the two daughter branches at a bifurcation, is identical for all parent branches of a given order. This property facilitates the use of the model for the calculation of physiological variables such as input impedance (Fredberg and Hoenig, ASME J. Biomech. Eng. 100: 57-66, 1978), and the comparison of such results with those obtained from svmmetrical models (Side11 and Fredberg, ASME J. Rio- mech. .Eng. 100: 131438, 1978).
bronchial tree morphology; orders of sions
branching; airway dimen- c
IT HAS BEEN KNOWN FOR MANY YEARS that the mam- malian bronchial tree branches asymmetrically, but the first study describing the distribution of this asymmetry in the dog lung was by Ross (9). The symmetrical human bronchial tree model A of Weibel (14) is well known, but his asvmmetrical model B has been little used. Another . investigation of the human bronchial tree, with emphasis on asymmetry, was made by Horsfield and Cumming (5). However, in none of these studies of asymmetrical lungs are the data easy to use for physiological calculations because the “connectivity,” i.e., the pattern in which the branches join each other, is undefined. The first asym- metrical model of the bronchial tree to include connec- tivity was described by Horsfield et al. (7), and this paved the way for some more detailed analyses of the effects of asymmetry in the human lung (1, 10, 16). Detailed data from six mammalian lungs of four species, including dimensions and connectivity, were given by Raabe et al. (8); these data are in a form suitable for computer anal- ysis. The purpose of the present paper is to develop a model of the airways of the dog lung after the style of Fredberg and Hoenig (l), an approach that facilitates computer analysis.
METHODS
The data on which the model is based were obtained from a resin cast of the bronchial tree of a %-kg dog. The method of making such casts has been described
previously (6). The lungs were fixed at an inflation pres- sure of 25 cmH?O, and the polyester resin (AP 101 PA, Trylon, Wellingborough, Northants, England) was then injected at a pressure of 30 cm resin. To facilitate study the cast was divided into two zones, a proximal zone down to branches of 2.0-mm diameter, and a distal zone from 2.0- to O.&mm diameter. Seven distal zone samples, one from each lobe, were broken off the cast at bronchi about 2.0 mm in diameter. They were studied under a binocular dissecting microscope at a magnification of x 10 or x20. Dimensions were measured with a scale in one eyepiece, to the nearest 0.025 mm, equivalent to half a division on the scale at x20. Diameters were measured at the midpoint of a branch between two bifurcations, and lengths from the carina or apex of one branching angle to the next along a line parallel with the center line of the branch. Each sample was drawn, and the drawing was colored to indicate orders, an order 1 branch being defined as the first branch up any pathwav equal to or greater than 0.5-mm diameter; subsequent -orders follow automatically once the order 1 branches have been de- fined. The method of ordering used was that described previously as “divisions up” (5), a method by which order increases by one at each bifurcation up from the periph- ery towards the trachea (Fig. 1). It was chosen in pref- erence to Strahler’s method (12, 13) because it was nec- essary to model the branching segments between all the points of bifurcation, which Strahler’s method does not do. A comparison between these two methods of ordering has been published previously (2).
Study of the samples showed that the cutoff at 0.5-mm diameter was at about the level of the terminal bron- chioles. This was judged by the appearance of alveolar markings on the respiratory bronchioles distal to them. An exact definition of a terminal bronchiole in anatomical terms is in fact remarkably difficult, and the diameter of 0.5 mm for this structure must be regarded as only approximate.
After the peripheral zone samples had been broken off, the main cast was pruned to branches of 2.0-mm diameter or slightly less, and all of the proximal zone branches were counted and measured. An order 1 branch in the proximal zone was defined as the first branch up any pathway equal to or greater than 2.0-mm diameter. Each branch on the cast was painted according to a color code to indicate its order. -Dimensions were measured with pointed calipers on a millimeter scale, judged by eye to the nearest 0.25 mm.
OlSl-~SSC;/82/oooO-oooO$O1.25 Copyright 0 1982 the American Physiological Society 21
22 HORSFIELD, KEMY, AND PHILLIYS
When the ordering and measuring of branches in each zone were completed, the number in each order was counted, and their mean diameter and length calculated. The order of a broken branch was determined by attrib- uting to it the average order of intact branches of similar diameter. Numbers of branches missing distal to a broken branch were calculated by a new iterative procedure. When the number of branches in each order is plotted on a logarithmic scale against order, a linear relation is found. Thus the number of branches in successive orders increases by a constant factor called the branching ratio (&-,). For the corrections & was set at an initial value of 1.3, and for each broken order 2 branch 1.3 order 1 branches were allowed. Similarly, for each broken order 3 branch, 1.3 order 2 branches and 1.3 x 1.3 order 1 branches were allowed. The same procedure was followed for higher order broken branches. Next, the branching ratio was calculated from the antilog of the line of least- squares best fit to the corrected data, and the new value of Rh was used to recalculate the corrections. This pro- cedure was repeated until Rb converged to a constant value, which occurred after only two iterations. Finally the corrected numbers were rounded to the nearest in- tegers.
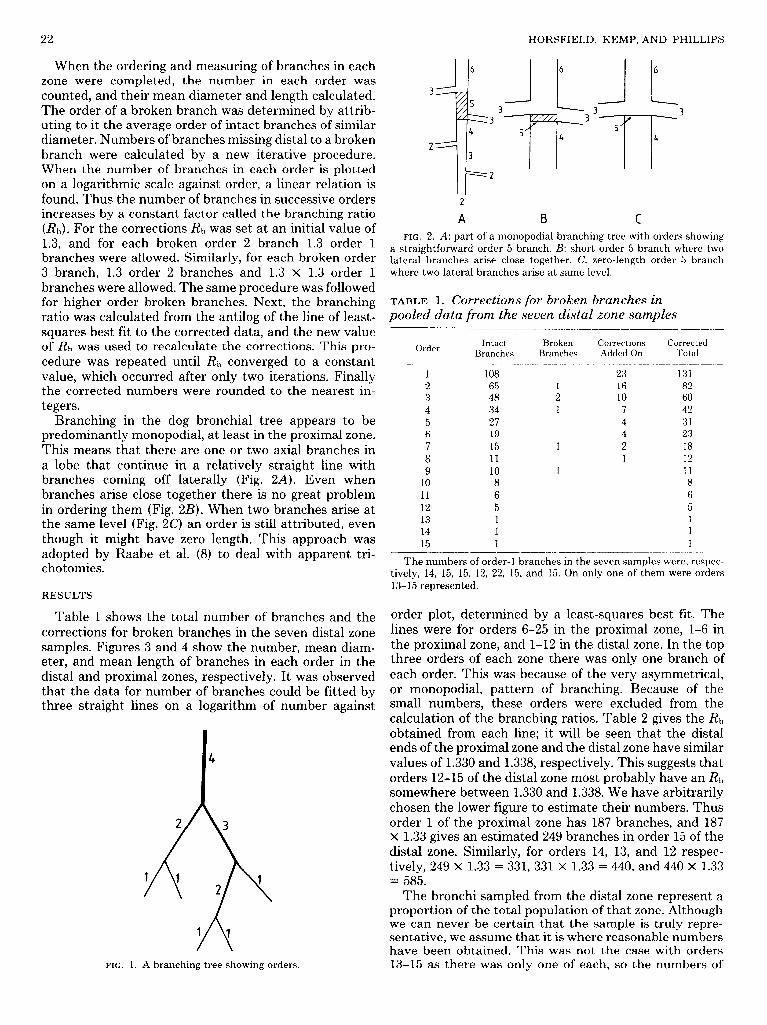
Branching in the dog bronchial tree appears to be predominantly monopodial, at least. in the proximal zone. This means that there are one or two axial branches in a lobe that continue in a relatively straight line with branches coming off laterally (Fig. 2A). Even when branches arise close together there is no great problem in ordering them (Fig. ZB). When two branches arise at the same level (Fig. 2C) an order is still attributed, even though it might have zero length. This approach was adopted by Raabe et al. (8) to deal with apparent tri- chotomies.
RESULTS
Table 1 shows the total number of branches and the corrections for broken branches in the seven distal zone samples. Figures 3 and 4 show the number, mean diam- eter, and mean length of branches in each order in the distal and proximal zones, respectively. It was observed that the data for number of branches could be fitted by three straight lines on a logarithm of number against
4
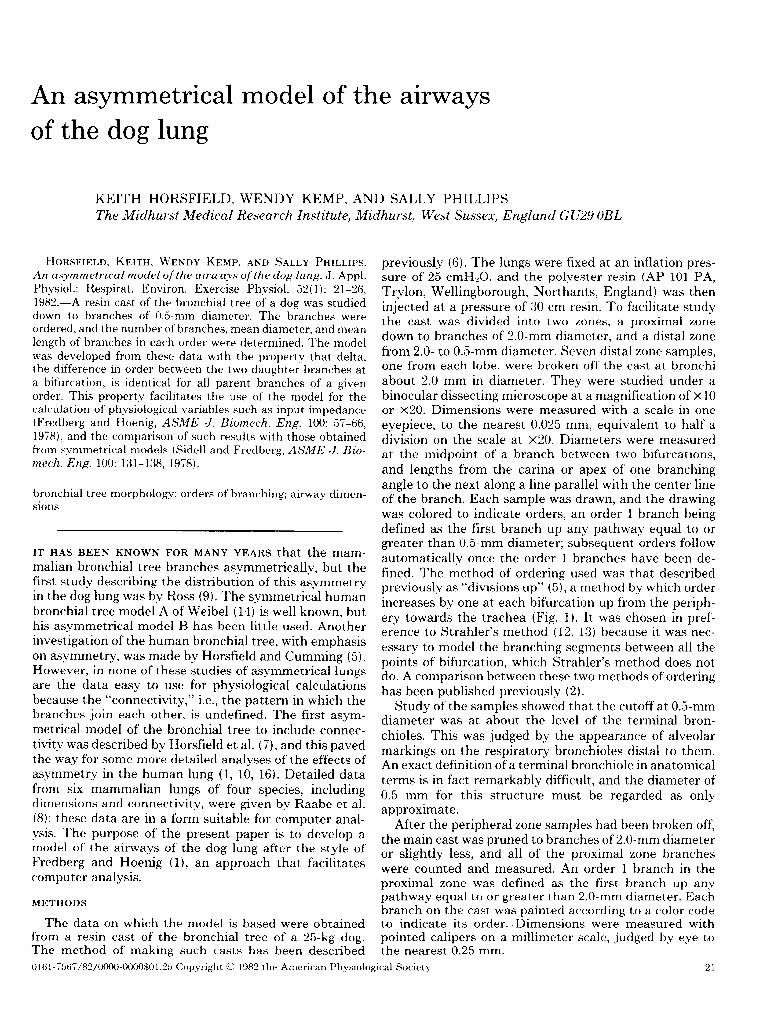
FIG. 1. A branching tree showing orders.
2
A B C FIG. 2. A: part of a monopodial branching tree with oraers snowing
a straightforward order 5 branch. B: short order 5 branch where two lateral branches arise close together. C: zero-length order 5 branch where two lateral branches arise at same level.
TABLE 1. Corrections for broken branches in pooled data from the seven dista .I zone samples
Intact Branches
Broken Branches
Correct ions Added On
Corrected ‘1‘0 t,al
~-~ _____ __~ -__-.- _______--- 1 108 23 131 2 65 1 16 82 3 48 2 10 60 4 34 1 7 42 5 27 4 31 6 19 4 23 7 8
15 11
1 2 1
18 12
9 10 1 11 10 8 8 11 6 6 12 5 5 13 1 1 14 1 1 15 1 1 ___________~ -_..~_-_- ______-_-__---. - ---- --- -
The numbers of order-l branches in the seven samples were, respec- tively, 14, 15, 15, 12, 22, 15, and 15. On only one of them were orders 13-15 represented.
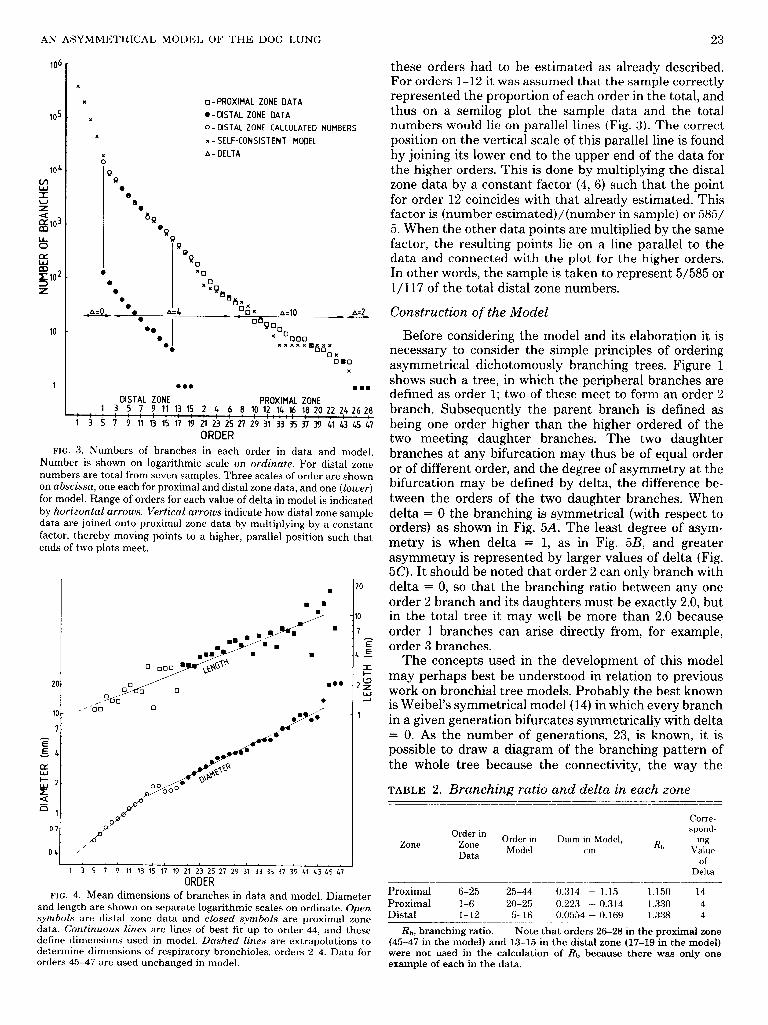
order plot, determined by a least-squares best fit. The lines were for orders 6-25 in the proximal zone, l-6 in the proximal zone, and 1-12 in the distal zone. In the top three orders of each zone there was only one branch of each order. This was because of the very asymmetrical, or monopodial, pattern of branching. Because of the small numbers, these orders were excluded from the calculation of the branching ratios. Table 2 gives the Rh obtained from each line; it will be seen that the distal ends of the proximal zone and the distal zone have similar values of 1.330 and 1.338, respectively. This suggests that orders 12-15 of the distal zone most probably have an Rt, somewhere between 1.330 and 1.338. We have arbitrarily chosen the lower figure to estimate their numbers. Thus order 1 of the proximal zone has 187 branches, and 187 x 1.33 gives an estimated 249 branches in order 15 of the distal zone. Similarly, for orders 14, 13, and 12 respec- tively, 249 X 1.33 = 331,331 x 1.33 = 440, and 440 x 1.33 = 585.
The bronchi sampled from the distal zone represent a proportion of the total population of that zone. Although we can never be certain that the sample is truly repre- sentative, we assume that it is where reasonable numbers have been obtained. This was not the case with orders 13-15 as there was only one of each, so the numbers of
AN ASYMMETRICAL MODEL OF THE DOG LUNG 23
106
105
104
ii! I
s
3103
% tY
% 3102
z
10
1
X
X o-PROXIMAL ZONE DATA
X .-DISTAL ZONE DATA
o-DISTAL ZONE CALCULATED NUMBERS X x-SELF-CONSISTENT MODEL
: A-DELTA
0. 0
0 0
a 0
-Ad,
*Qo xo
X0 0 "Q
0 0
Ba6X
a A=d C O;IX - 0
l o
- A=10
0 x00 000
0.0 8rnE
DISTAL ZONE PROXIMAL ZONE 1 3 5 7 9 11 13 15 2 4 6 8 10 12 14 l6 18 20 24 26 28 I I . r 2,2 I I . I 1 1 , 1 , , ,.,.. ,
1 3 5 7 , :
9 , I
11 13 15 ,
17 19 21 23 25 27 29 31 33 35 37 39 41 43 45 47 ORDER
FIG. 3. Numbers of branches in each order in data and model. Number is shown on logarithmic scale on ordinate. For distal zone numbers are total from seven samples. Three scales of order are shown on abscissa, one each for proximal and distal zone data, and one (lower) for model. Range of orders for each value of delta in model is indicated by horizontaZ arrows. Vertical arrows indicate how distal zone sample data are joined onto proximal zone data by multiplying by a constant factor, thereby moving points to a higher, parallel position such that ends of two plots meet.
20
10
7
-iE 54
5
L2
5
=1
0.7
0.4 1 I L 1 I I 1, I , 1 ,
1 3 S 7 9 11 13 15 17 17 21 23 25 27 29 31 33 35 37 39 41 43 45 47
ORDER
20
IO
7
-iE 4E
E
2:
Y
1
FIG. 4. Mean dimensions of branches in data and model. Diameter and length are shown on separate logarithmic scales on ordinate. Open symboZs are distal zone data and cZosed symbok are proximal zone data. Continuous lines are lines of best fit up to order 44, and these define dimensions used in model. Dashed Lines are extrapolations to determine dimensions of respiratory bronchioles, orders 2-4. Data for orders 45-47 are used unchanged in model.
these orders had to be estimated as already described. For orders 1-12 it was assumed that the sample correctly represented the proportion of each order in the total, and thus on a semilog plot the sample data and the total numbers would lie on parallel lines (Fig. 3). The correct position on the vertical scale of this parallel line is found by joining its lower end to the upper end of the data for the higher orders. This is done by multiplying the distal zone data by a constant factor (4, 6) such that the point for order 12 coincides with that already estimated. This factor is (number estimated)/(number in sample) or 585/ 5. When the other data points are multiplied by the same factor, the resulting points lie on a line parallel to the data and connected with the plot for the higher orders. In other words, the sample is taken to represent 5/585 or l/l17 of the total distal zone numbers.
Construction of the Model
Before considering the model and its elaboration it is necessary to consider the simple principles of ordering asymmetrical dichotomously branching trees. Figure 1 shows such a tree, in which the peripheral branches are defined as order 1; two of these meet to form an order 2 branch. Subsequently the parent branch is defined as being one order higher than the higher ordered of the two meeting daughter branches. The two daughter branches at any bifurcation may thus be of equal order or of different order, and the degree of asymmetry at the bifurcation may be defined by delta, the difference be- tween the orders of the two daughter branches. When delta = 0 the branching is symmetrical (with respect to orders) as shown in Fig. 5A. The least degree of asym- metry is when delta = 1, as in Fig. 5B, and greater asymmetry is represented by larger values of delta (Fig. 5C). It should be noted that order 2 can only branch with delta = 0, so that the branching ratio between any one order 2 branch and its daughters must be exactly 2.0, but in the total tree it may well be more than 2.0 because order 1 branches can arise directly from, for example, order 3 branches.
The concepts used in the development of this model may perhaps best be understood in relation to previous work on bronchial tree models. Probably the best known is Weibel’s symmetrical model (14) in which every branch in a given generation bifurcates symmetrically with delta = 0. As the number of generations, 23, is known, it is possible to draw a diagram of the branching pattern of the whole tree because the connectivity, the way the
TABLE 2. Branching ratio and delta in each zone ---___---
Corre-
Zone Order in
Zone Order in
Model Diam in Model,
cm RI,
spond- ing
Value Uata of Delta
_--___---___-_ Proximal 6-25 25-44 0.314 - 1.15 1.150 14 Proximal l-6 20-25 0.223 - 0.314 1.330 4 Distal 1-12 5-16 0.0554 - 0.169 1.338 4 ---- --_____-_-____
Rb, branching ratio. Note that orders 26-28 in the proximal zone (45-47 in the model) and 13-15 in the distal zone (17-19 in the model) were not used in the calculation of Rb because there was only one example of each in the data.

24
6 6 6
DELTA = 0 DELTA = 1 DELTA= 4
A B C FIG. 5. Different values of delta (difference between orders of two
daughter branches) at a dichotomous branching. A: Symmetrical branching. B: Least degree of asymmetrical branching. C: More mark- edly asymmetrical branching.
branches join together, is defined. Thus for example, a generation 8 branch has a generation 7 parent and two generation 9 daughter branches. Furthermore, because the dimensions of the branches in any given generation are all the same, it is possible to perform calculations, eg9 of volume or resistance, based on just one branch and then apply them to all the other branches of that generation. It is this property, namely that all branches in any given generation are identical, that is the main reason why Weibel’s model has found such wide accept- ance. Similarly, in our asymmetrical model, all the branches of any one generation or order have identical dimensions and divide with the same single value of delta. In the descriptions of the asymmetrical bronchial tree of the dog by Ross (9) and of humans by Horsfield and Cumming (5) delta was not defined, and so this property is lacking. This is the reason why these data have proved to be so difficult to use for physiological calculations, although both papers contain detailed in- formation pertaining to the asymmetry of the bronchial tree. Horsfield et al. (7) attempted to improve this by describing two asymmetrical models of the human bron- chial tree based on the use of delta wi thin lo bes, or within bronchopulmonary segments. and Hoenig (1) developed the of the whole bronchial tree.
More recently, Fredberg lobar model into a model
While Weibel’s symmetrical model is easy to under- stand, the mode of branching in asymmetrical trees, in which branches have been classified by order defined by delta, requires further explanation. Broadly speaking, there are two main types, one in which the value of delta is constant throughout, and the other in which it differs from order to order. The simplest example of the first type is when delta = 1 throughout, which gives rise to the tree shown in Fig. 6. Similar trees, with delta = 2 or more at each bifurcation, can easily be drawn in principle, although in practice there are difficulties in ending the tree at the lower orders (see dashed lines in Fig. 6). An example of the second type, with delta alternating be- tween 0 and 1 in successive orders, is shown in Fig. 7A. It may be seen that the branches of order 3, for example, each give rise to identical patterns of branching, and that therefore an abbreviated diagram can be used to repre- sent the tree as shown in Fig. 7B. Once this concept has been grasped it is easy to see that the list of the values of
HOHSFIELD, KEMP, AND YHILLIYS
delta at each order (inset Fig. 7) conveys the same information: given the list, the whole tree can be drawn without difficulty. This is the way in which the model of the dog’s bronchial tree, developed below, will be pre- sented in Table 3.
In making such a model the problem is to represent the range of asymmetry found at a given order in the data by an average asymmetry defined by a single value of delta. Elaboration of the model then falls into two stages: first, the definition from the data of the number of orders, number of branches, and their dimensions; and second, the determination of a pattern of branching that gives numbers of branches similar to the data. In the previously published lung model based on lobes (7) this method gave a distribution of the number of orders down every pathway in the model similar to that found in the data.
Number of orders. The 28 orders in the proximal zone data and 15 orders in the distal zone data were joined together to give 43 orders of conducting airways. To these were added three orders of respiratory bronchioles and one order to represent the alveolar duct system,
5 ORDER
5
4
3
DELTA
FIG. 6. Asymmetrical branching tree defined by delta = 1 through- out. Branches are numbered by order. There is some difficulty in bringing this pattern to termination, as indicated by dnshed lines.
ORDER DELTA S
5 1 5
4 0
3 1
2 0
A B FIG. 7. A: asymmetrical branching tree numbered by order. Branch-
ing pattern is defined by values of delta alternating between 1 and 0. B: because patterns of branching subtended by all branches of any one order are identical, tree can be drawn in abbreviated form in which only one example of a bifurcation of each order is shown. Same information is conveyed by list of values of delta at each order.

AN ASYMMETRICAL MODEL OF THE DOG LUNG 25
giving a total of 47 orders. Because of the lack of data in the literature on detailed dimensions of dog alveolar ducts and the highly irregular branching pattern they have (ll), it was considered impossible to model them adequately at the present time. They were therefore left as one order, which can be utilized or not as required by anyone using the model. For many purposes a lumped parameter might suffice to represent the alveolar ducts.
Dimensions. The length and diameter data are shown plotted against order in Fig. 4. Lengths in the model were determined from the regression equation of the line of best fit for orders 5-44. Diameters in the model were determined from the regression equations of two lines of best fit, one for orders 5-14, and one for orders 14-44. Diameters of orders 45-47 and lengths of orders 45 and 46 were taken directly from the data. The length of the trachea (order 47) was taken to be 20 cm. Dimensions of the respiratory bronchioles were determined by extrap- olation (Fig. 4). A check was made on the peripheral samples to confirm that the values thus obtained were similar to those for the respiratory bronchioles on the cast.
practice because too many orders (about 23) are required for the theoretical value of Rb to become established. It was found by trial and error that a value of 10 gave the best fit to the data as judged by eye, so this was used instead. At the top end of the model delta is inconsistent in the data, but an average value of 2 was similarly found to give the best fit. Finally, at the distal end, branching of respiratory bronchioles is more nearly asymmetrical. From the data the number of terminal bronchioles was estimated to be 15,327, compared with the estimate of 20,600 by Ross (9), and 25,736 from a Strahler ordered model of the dog lung (6). The present model was de- signed to have about 20,000 terminal bronchioles (order 5), an average value from these three estimates, and approximately eight times as many third-order respira- tory bronchioles (order 2). By attributing delta = 0 for orders 2-6 these criteria were met reasonably well. The numbers obtained are plotted in Fig. 3 and the entire model is given in Table 3.
DISCUSSION
Pattern of branching. In a branching tree with a defined constant value of delta, the branching ratio may be calculated (4, 7). Thus if delta = 0, Rb = 2.0; if delta = 1, Rb = 1.618; if delta = 3, Rt, = 1.466, and so on. Conversely, if Rb is known a value of delta can be found that most nearly gives that branching ratio. For the model, values of &, of 1.33 and 1.338 are best represented by delta = 4, which is therefore used for orders 7-25. For orders 26-44 I&, = 1.15, which is best represented by de\ta = 14. However, this value proved to be unsatisfactory in
TABLE 3. Asymmetrical model of airways of the dog based on delta
The model that has been developed is designed to represent the average asymmetry of the real bronchial tree. Judging by the similarities of the numbers of branches in the data and the model (Fig. 3) it probably does this reasonably well. Orders 32-34 show the least good correspondence, due to the rather artificial way in which the branching tree develops with order when delta is high. Because every pathway in the model is defined, it would be possible to calculate the distribution of path lengths, though this has not been attempted. The short- est path from carina to respiratory zone is 4 cm and the longest 20 cm, compared with the data of Ross (9) in which the range is from 2-14 cm. Probably he used smaller lungs because the diameters he gives are also smaller. Ross expressed the asymmetry of the lung in terms of path length, but it is difficult to tell from his paper how many orders of branching were found, so that direct comparison is difficult.
Order Delta Diam,
cm Length,
cm Order Delta Diam, Length,
cm cm
47 > 2.10 20.00 23 4 0.274 0.328 46 2 2.10 0.75 22 4 0.255 0.311 45 2 2.03 1.80 21 4 0.238 0.294 44 10 1.15 1.01 20 4 0.223 0.279 43 10 1.08 0.961 19 4 0.208 0.264
42 10 1.01 0.911 18 4 0.194 0.251 41 10 0.939 0.863 17 4 0.181 0.237 40 10 0.876 0.818 16 4 0.169 0.225 39 10 0.818 0.775 15 4 0.158 0.213 38 10 0.764 0.734 14 4 0.148 0.202 37 10 0.714 0.696 13 4 0.139 0.191 36 10 0.666 0.660 12 4 0.124 0.181 35 10 0.622 0.625 11 4 0.110 0.172 34 10 0.581 0.592 10 4 0.0983 0.163 33 10 0.543 0.561 9 4 0.0876 0.154 32 10 0.507 0.532 8 4 0.078 1 0.146 31 10 0.473 0.504 7 4 0.0697 0.139 30 10 0.442 0.478 6 0 0.062 1 0.131 29 10 0.413 0.453 5 0 0.0554 0.125 28 10 0.385 0.429 0 0.0494 0.118 27 10 0.360 0.407 0 0.0440 0.112 26 10 0.336 0.385 0 0.0393 0.106 25 4 0.314 0.365 24 0.293 0.346
Order 47, trachea; order 5, termLa1 bronchioles; orders 2-4, respi- ratory bronchioles; order 1, alveolar ducts system. Delta is the differ- ence in order between two daughter branches. The branching pattern of the model can be reconstructed from the values of delta, as shown in Fig. 7.
-
7
This model emphasizes one of the important differ- ences between Horsfield (6, 7) and Strahler (12, 13) ordering systems, i.e., that the number of Strahler orders is always less. A dog lung was found to have 10 Strahler orders of conducting airways (6) compared with 43 Hors- field orders in the data given here. The lesser degree of asymmetry found in human lungs compared with the dog lungs is also demonstrated by the human lung having only 28 orders of conducting airways (7) but a similar number of terminal bronchioles (between 2 x lo4 and 3 x 10⁴).
The data from only one pair of lungs, obtained from a dog weighing 25 kg, were used in constructing this model. Probably the best way to scale dimensions for dogs of different weights is in proportion to cube root of body weight, as has been shown in dogs at different stages of growth (3). However, in a series of adult dog lung casts (15) dimension/weight”” showed considerable variation for the larger airways, although less than dimension alone.
The value of the model lies in the fact that not only are all branches of a given order identical, but the seg-

26 HORSFIELD, KEMP, AND PHILLIPS
ments of tree that they subtend are also identical. This already calculated for its daughter branches, namely property greatly facilitates calculation of physiological orders n - 1 and n - (1 + delta). Thus the calculation variables such as, for example, input impedance (1). For need be done only once for each order. By comparison, any branch the input impedance is a function of the if the same calculations were done on the raw data of input impedances of its daughter branches. By starting Raabe et al. (8) or Horsfield and Cumming (5)) they at the lowest orders and working up, storing the calcu- would have to be done separately for every branch. lated value for each order in turn, when a branch of order n is reached reference may easily be made to the values Received 10 November 1980; accepted in final form 24 July 1981.
REFERENCES
1. FREDBERG, J. J., AND A. HOENIG. Mechanical response of the lungs at high frequencies. ASME J. Biomech. Eng. 100: 57-66, 1978.
2. HORSFIELD, K. Some mathematical properties of branching trees with application to the respiratory system. BuZZ. Math. BioZ. 38: 305-315, 1976.
3. HORSFIELD, K. Postnatal growth of the dog’s bronchial tree. Respir. Physiol. 29: 185-191, 1977.
4. HORSFIELD, K. Morphometry of the small pulmonary arteries in man. Circ. Res. 42: 593-597, 1978.
5. HORSFIELD, K., AND G. CUMMING. Morphology of the bronchial tree in man. J. AppZ. Physiol.: Respirat. Environ. Exercise PhysioZ. 24: 373-383, 1968.
6. HORSFIELD, K., AND G. CUMMING. Morphology of the bronchial tree in the dog. Respir. Physiol. 26: 173-182, 1976.
7. HORSFIELD, K., G. DART, D. E. OLSON, G. F. FILLEY, AND G. CUMMING. Models of the human bronchial tree. J. AppZ. Physiol.: Respirat. Environ. Exercise PhysioZ. 31: 207-217, 1971.
8. RAABE, 0. G., H. C. YEH, G. M. SCHUM, AND R. F. PHALEN. TracheobronchiaZ Geometry: Human, Dog, Rat, Hamster. Albu- querque, NM: Lovelace Foundation, LF-53, 1976.
9. Ross, B. B. Influence of bronchial tree structure on ventilation of the dog’s lung as inferred from measurements of a plastic cast. J. AppZ. Physiol.: Respirat. Environ. Exercise PhysioZ. 10: 1-14, 1957.
10. SIDELL, R. S., AND J. J. FREDBERG. Noninvasive inference of airway network geometry from broadband lung reflection data. ASME J. Biomech. Eng. 100: 131-138, 1978.
11. STELTER, G. P., J. E. HANSEN, AND D. G. FAIRCHILD. A three- dimensional reconstruction of lung parenchyma. Am. Rev. Respir. Dis. 94: 79-85, 1966.
12. STRAHLER, A. N. Revision of Horton’s quantitative factors in erosional terrain. Trans. Am. Geophys. Union 34: 345, 1953.
13. STRAHLER, A. N. Quantitative analysis of watershed geomorphol- ogy. Trans. Am. Geophys. Union 38: 913-920, 1957.
14. WEIBEL, E. R. Morphometry of the Human Lung. Berlin: Springer, 1963.
15. WOLDEHIWOT, Z., AND K. HORSFIELD. Diameter, length and branching angles of the upper airways in the dog lung. Respir. PhysioZ. 33: 213-218, 1978.
16. YEATES, D. B., AND N. ASPIN. A mathematical description of the airways of the human lung. Respir. Physiol. 32: 91-104, 1978.