an assessment of where oecd countries stand · measuring distance to the sdg targets an assessment...
TRANSCRIPT

MEASURING DISTANCE TO THE SDG TARGETS
An assessment of where OECD countries standJune 2017
PE
OP
LE
PLANET
PR
OS
PE
RIT
Y
PEACE
PARTNERSHIP
Desirable levels of achievement by 2030
1: Poverty
2: Food
3: Health
4: Education
5: Gender Equality
6: Water
7: Energy
8: Economy
9: Infrastructure
10: Inequality
11: Cities
12: Sustainable Production
13: Climate
14: Oceans
15: Biodiversity
16: Institutions
17: Implementation
Goals

1
EXECUTIVE SUMMARY
1. The 2030 Agenda for Sustainable Development, adopted by world leaders at the UnitedNations on 25 September 2015, sets out an ambitious plan of action for people, planet and prosperity, with the overarching objective of leaving no one behind. At its core are 17 Sustainable Development Goals (SDGs) comprising 169 targets.
2. This Study of the distances from the SDGs of selected OECD countries is designed to helpgovernments as they consider developing national action plans, as well as to contribute to SDG mainstreaming across different OECD Directorates. It leverages the wealth of statistical data collected by OECD members and harmonised through OECD tools and processes. This booklet updates the Pilot Study, published by OECD in July 2016, by offering a wider set of indicators and more complete coverage of the Agenda 2030 targets, as well as a refined methodology for assessing distance to those targets.
3. This Study uses the latest information on various indicators available in OECD databases toestablish countries’ distances from individual targets, and presents results for a number of countries. These starting positions are measured in terms of the distance to be travelled by 2030. This requires setting end-values for the targets to be achieved by 2030. The Study uses a flexible approach to target setting, with appropriate consideration being given to values specified either in the 2030 Agenda or in other international commitments, but also using the current range of OECD performance as a rating scale where no such benchmarks have been enunciated.
4. Taking as a reference the global indicator set endorsed by the UN Statistical Commission atits 47th session, OECD indicators have been selected based on criteria of relevance, ability to differentiate countries’ performance, availability and statistical quality. Applying these criteria, this document identifies 131 indicators covering 98 targets spanning all 17 Goals. It is, however, clear that many SDG targets cannot be currently measured adequately through data routinely collected by the OECD, and that significant statistical work is needed to fill some of these gaps. The OECD is well positioned to advance this agenda, given its expertise in developing policy indicators and in assessing interconnectedness and policy coherence.
5. In order to help interested countries explore the trans-boundary effects or contributions oftheir policies and development patterns, this Study also proposes an initial assessment of countries’ ‘global contributions’ (e.g. aid flows to less developed countries or consumption-based carbon dioxide emissions) to meeting some of the targets in the 2030 Agenda.
6. While the assessment of starting positions has been undertaken at target level, the results canalso be considered by Goal as well as through a global contribution lens. On average, OECD countries are currently closest to reaching targets related to water, climate, biodiversity, cities, poverty and oceans. They have the greatest distance to travel in relation to gender equality, education, the economy and jobs, and institutions. Indicators can also be aggregated by the ‘5 Ps’ in the 2030 Agenda: People, Planet, Prosperity, Peace and Partnership. Based on this breakdown, OECD average scores are best on Planet, and Partnership, to a lesser extent on Prosperity, with People and Peace lagging behind.

2
7. It is nonetheless important to underscore that this assessment is based only on what can bemeasured today. The selected indicators enable only 57% of all the SDG targets to be evaluated, and coverage is unequal across goals and the 5Ps. For example, while health and education have at least one indicator per target, oceans are covered in a very limited way. Similarly, while over 80% of the targets in the People category are covered by at least one indicator, this is true for fewer than 40% of the targets in the Planet category. Given the limitations of current data, assessments of relative performance across the goals and 5Ps should be regarded as preliminary, and may change as more indicators become available in the future.
8. The variation in countries’ distance to travel across both goals and targets, as well as thevariation in data coverage, suggest that national priorities for implementing the SDG agenda should be set at target level, rather than at the goal or 5P level.
9. Finally, this Study shows that, to implement the 2030 Agenda, countries may need todevelop additional indicators and evidence to identify and track progress on policies that drive outcomes at the country level and that have significant trans-boundary impacts.

3
TABLE OF CONTENTS
Executive Summary ....................................................................................................................... 1
1. Introduction ............................................................................................................. 4 2. Nature and purpose of the Study ............................................................................. 9 3. Study methodology ................................................................................................. 9 4. Study findings ....................................................................................................... 16 5. How participating countries have been using the Study ....................................... 20 6. Conclusion ............................................................................................................ 21 Annex I: OECD indicators used in this Study ..................................................................... 23 Annex II: Selected country profiles ...................................................................................... 31
References .................................................................................................................................... 58
Tables
Table 1. Comparison of the OECD well-being framework and the 2030 Agenda .............. 7 Table 2. Types of SDG indicators and their 2030 end-values............................................ 13 Table 3. Pros and cons of different normalisation procedures ........................................... 15
Figures
Figure 1. Summary of the Sustainable Development Goals .................................................. 4 Figure 2. Share of targets covered by at least one indicator ................................................ 11 Figure 3. Percentage of targets measured by at least one indicator ..................................... 12 Figure 4. Illustrating current and former normalisation procedures .................................... 14 Figure 5. OECD average results by Goal ............................................................................ 16 Figure 6. How OECD countries vary in their distance to targets, by SDG Goal ................ 17 Figure 7. How OECD countries vary in their distance to targets, by 5Ps ........................... 17 Figure 8. How OECD countries vary in their distance to targets in Goal 7- Energy .......... 18 Figure 9. Average performance of OECD countries on some SDG targets pertaining ....... to
global contributions.............................................................................................. 19 Figure 10. Observed and predicted fatal traffic accidents - Slovenia .................................... 19
Boxes
Box 1. The OECD Action Plan on SDGs .......................................................................... 5 Box 2. The OECD well-being framework and the 2030 Agenda ...................................... 6

4
1. Introduction
10. On 25 September 2015, world leaders meeting in New York adopted United Nations Resolution 70/1, “Transforming our World: the 2030 Agenda for Sustainable Development”. The Agenda is “a plan of action for people, planet and prosperity”, and “also seeks to strengthen universal peace in larger freedom”.
11. The core of the Agenda is a set of 17 Sustainable Development Goals comprising 169 targets that draw on a large number of previous international agreements, especially concerning development, the environment and human rights (Figure 1). The Goals are presented as “integrated and indivisible, global in nature and universally applicable”. The Agenda presents them as addressing the 5Ps: People (broadly corresponding to Goals 1-5), Planet (6, 12, 13, 14 and 15), Prosperity (7-11), Peace (16) and Partnership (17).
12. Still, this does not mean that every target applies to every country. Rather: “Targets are defined as aspirational and global, with each Government setting its own national targets guided by the global level of ambition but taking into account national circumstances. Each Government will also decide how these aspirational and global targets should be incorporated into national planning processes, policies and strategies.”1
Figure 1. The 17 Sustainable Development Goals
Source: United Nations.
13. Once countries have decided their national targets, and how they will be integrated into national processes, they will need to decide on how to implement policy strategies to achieve those goals, and how to track progress in their implementation plans. The 2030 Agenda “encourage[s] member states to conduct regular and inclusive reviews of progress at the national and sub-national levels”, but leaves the modalities of this national review process to their discretion. The Agenda provides much detail, however, concerning SDG follow-up and review at global level. This will include an annual report by the UN Secretary-General, and a four-yearly review by a High Level
1. “Transforming our world: the 2030 Agenda for Sustainable Development”,
https://sustainabledevelopment.un.org/post2015/transformingourworld.

5
Political Forum, both of which will be supported by a set of global indicators. There will also be reviews at regional and thematic levels.2
Box 1. The OECD Action Plan on SDGs
The OECD Action Plan on SDGs [C/MIN(2016)6] aims to:
Apply an SDG lens to the OECD’s strategies and policy tools: OECD Committees are encouraged to identify opportunities to contribute to SDG implementation in their programmes of work. Mainstreaming the SDGs may also involve revisiting thematic strategies (e.g. on innovation, skills, or green growth).
Leverage OECD data to track progress in the implementation of the SDGs: The OECD will, inter alia, provide data for the UN-led Global Indicator Framework for the SDGs; help developing countries address data gaps (in collaboration with PARIS21); broaden its Programme for International Student Assessment (PISA) for developing countries; modernise its development finance statistics; develop and expand its Revenue Statistics; and measure policy and institutional coherence for migration and development.
Upgrade OECD support for integrated planning and policy-making at country level, and provide a space for governments to share their experiences on governing for the SDGs: The OECD will leverage the expertise gained through Multidimensional Country Reviews, Policy Coherence for Development work and other tools to help its members address multidimensional issues and connect policies across the board.
Reflect on the implications of the SDGs for OECD external relations: This will include engaging with UN entities, fora and processes on the 2030 Agenda to maximize synergies.
14. OECD expertise that can be mobilised in support of the 2030 Agenda is described in theOECD Action Plan on SDGs (Box 1) and includes3:
• Assessing economic, social and environmental progress through measures going beyondGDP (e.g. the work on multidimensional well-being, Box 2), and facilitating comparisonacross and within countries.
• Generating solid evidence and recommendations on global public goods and “bads”,including, for example, analysis of climate policies, development finance, foreign bribery,human trafficking, responsible business conduct and fiscal transparency.
• Measuring and improving development finance by helping governments mobilise the broadsuite of financial resources (taxes, foreign and domestic investments, remittances, aid andphilanthropy) that will be necessary to achieve the SDGs in many countries.
• Enhancing policy and institutional coherence by identifying policy interactions, trade-offsand synergies across economic, social and environmental areas; and considering trans-boundary and intergenerational effects.
• Dismantling intellectual and policy silos, facilitating the exchange of knowledge acrosscountries, and supporting sector-specific initiatives and partnerships.
2 See for example United Nations, High level policy forum, “Progress towards the Sustainable Development Goals: Report of the Secretary General”, July 2016, www.un.org/ga/search/view_doc.asp?symbol=E/2016/75&Lang=E and https://sustainabledevelopment.un.org/ for more resources.
3 To learn more, see: The Sustainable Development Goals: An overview of relevant OECD analysis, tools and approaches, OECD Expertise Relevant to the Implementation of the Sustainable Development Goals (SDGS)

6
Box 2. The OECD well-being framework and the 2030 Agenda
The OECD has long recognised the multidimensionality of people’s lives and of the resources sustaining people’s well-being over time. In its 2011 How’s Life? report, it launched the Better Life Initiative which featured a scoreboard of headline indicators to monitor progress across 11 dimensions of current well-being in OECD countries. These dimensions drew on the framework put forward by the report of the Commission on the Measurement of Economic Performance and Social Progress (Stiglitz et al., 2009), and were assessed as relevant to societies across the world, irrespective of their level of socio-economic and human development (Boarini et al., 2014).
The OECD well-being framework focuses on people rather than the economic system; it includes both objective aspects observable by third parties and subjective states known only to individuals, and it concentrates on outcomes (e.g. health status) rather than inputs (e.g. health-care spending) or outputs (e.g. the quality and quantity of surgery). The framework also takes account of inequalities within each dimension, reflecting the idea that community and societal welfare reflects both average outcomes and how they are distributed across people with different characteristics. Finally, the framework recognizes the importance for well-being outcomes to be sustainable over time. This requires preserving different types of capital whose benefits will accrue over time but that are affected by decisions taken today. The focus on these resources is in line with the recommendations of Stiglitz et al. (2009) and other measurement initiatives that distinguish between well-being “here and now” and the stocks of resources that affect the well-being of generations coming “later” (UN, 2014).
How do these elements align with the key features of the 2030 Agenda? There are both similarities and differences, and the two approaches are complementary even though they differ in nature. The OECD well-being framework is an analytic and diagnostic tool to assess the conditions of a community, whereas the 2030 Agenda is a list of policy commitments agreed by world leaders. The two therefore differ as the results of a full medical check-up would differ from the list of treatments a doctor might then prescribe. Yet, just as we would expect the treatments to address the problems identified, in practice the policy commitments in the 2030 Agenda touch on practically all of the dimensions considered in the OECD well-being framework. As shown by Table 1 below:
• 8 of the 17 SDGs map to 9 of the 11 dimensions of the OECD framework for current well-being. In most cases, the mapping is one-to-one – e.g. SDG 3 on health maps to the OECD dimensions of “health status”. Sometimes, however, more than one SDG is relevant for a single OECD well-being dimension – e.g. various aspects of SDGs 1 and 2, on poverty and food respectively, map to the OECD dimension of “income and wealth”. In other cases a single SDG maps to several OECD dimensions – e.g. the decent work aspects of SDG 8 map to two OECD dimensions, “jobs and earnings” and “work-life balance”. Only two OECD dimensions do not map to any SDGs: “social connections” and “subjective well-being” (although “promoting well-being for all” is part of SDG 3 on health).
• 3 of the 17 SDGs relate strongly to the cross-cutting “inequality” aspect of the OECD well-being framework. The relation is direct in the case of SDG 10 on reducing inequalities. However, SDG 1 on poverty also addresses inequality and SDG 5 on gender equality concerns the inequalities experienced by a specific population group. More generally, the SDGs’ emphasis on “leaving no one behind” underscores the importance of looking at outcomes across a range of population characteristics, such as age, gender, disability and socio-economic status.
• The four types of “capital” that sustain future well-being in the OECD framework are clearly reflected in 11 of the 17 SDGs. Natural capital is dealt with in SDGs 12 on sustainable production, 13 on climate, 14 on oceans, and 15 on biodiversity. Economic capital is recognized in SDGs 7 on energy, 8 on decent work and the economy, and 9 on infrastructure. Human capital is the focus of SDGs 3 on health and 4 on education, while social capital is addressed by SDG 16 on institutions. In some cases, the same SDG may be relevant for both current well-being and sustainability: for example SDG 3 on health aims at lowering mortality and morbidity now, while supporting vaccine development for the future.
Conversely, two aspects of the 2030 Agenda do not feature in the OECD well-being framework. The first is SDG 17 (means of implementation); this reflects the choice in How’s Life? to focus on universally-valued outcomes, rather than the country-specific policies needed to attain them. The second is the 2030 Agenda’s focus on the “shared responsibility” of all countries in delivering global public goods and avoiding negative global impacts. This element does not feature in the OECD framework because of its focus on the conditions prevailing in each community, rather than on drivers (some of them external) shaping both current well-being and its sustainability. The focus on global public goods in 2030 Agenda and on domestic policies and consumption patterns that can affect them is a genuine innovation, giving expression to the “elsewhere” dimension stressed in the Conference of European Statisticians recommendations on measuring sustainable development (UN, 2014).

7
Table 1. Comparison of the OECD well-being framework and the 2030 Agenda
OECD Well-being Framework Sustainable Development Goals
Individual well-being
Well-being dimensions
Income & wealth SDG 1 (poverty); SDG 2 (food)
Jobs and earnings SDG 8 (decent work & economy)
Housing SDG 11 (cities)
Health status SDG 3 (health)
Work-life balance SDG 8 (decent work & economy)
Education & skills SDG 4 (education)
Civic engagement & governance SDG 16 (institutions)
Environmental quality SDG 6 (water); SDG 11 (cities)
Personal security SDG 16 (institutions)
Differences
across groups
SDG 1 (poverty); SDG 5 (women);
SDG 10 (inequality)

8
OECD Well-being Framework Sustainable Development Goals
Sustainability of well-being over
time
Natural capital SDG 13 (climate); SDG 14 (oceans);
SDG 15 (biodiversity); SDG 12 (sustainable production);
Economic capital SDG 7 (energy); SDG 8 (decent work
& economy); SDG 9 (infrastructure); SDG 12 (sustainable production);
Human capital SDG 3 (health); SDG 4 (education)
Social capital SDG 16 (institutions)
OECD dimensions of individual well-being not
covered by SDGs
Subjective well-being
Social connections
Elements of SDGs not covered by the OECD well-being
framework
SDG 17 (implementation)
“Global contributions, trans-boundary effects, international efforts”
15. The analytical framework of the present Study takes as its point of departure the 17 goalsand 169 targets of the 2030 Agenda. The indicators included in the Study are also closely aligned with the 230 indicators of the UN global indicator framework developed by the UN Inter-Agency Expert Group on SDG indicators (IAEG) and recently endorsed by the UN Statistical Commission.
16. The Study is not intended to support or supplant UN reporting. Its main objective is rather toprovide an innovative analytical tool that may help OECD member and possibly other countries to plan SDG implementation, identify policy priorities, and develop their own reporting tools. Separately, the OECD is also significantly contributing to UN Statistics Division efforts.4
17. This report is organised as follows. Section 2 discusses the nature and purpose of the Study.Section 3 deals with the Study’s methodology, selection of indicators and how these indicators measure countries’ “distance to travel” to meet the ambitions set for 2030. Section 4 summarises the Study’s findings. Section 5 indicates some of the uses countries have made of the Study, and Section
4. The OECD is supporting the UN reporting process first through its active participation in the work of the UN Inter-Agency Expert Group on SDG Indicators. It is responsible for providing a number of indicators for the UN Global monitoring framework either directly (e.g. ODA data) or in collaboration with other international organisations (e.g. education-related indicators with UNESCO). The OECD is also helping to fill indicator gaps, leading or providing assistance in conceptual and developmental work in key areas (e.g. Total Official Support for Sustainable Development – TOSSD, governance statistics). Finally, it will assist SDG reporting in developing countries by building capacity through joint work with PARIS21.

9
6 concludes. Annex I reviews the metadata used in the Study5, and Annex II presents the country profiles with Study results for participating countries.
2. Nature and purpose of the Study
18. The Study aims to support the ongoing OECD reflection on how to apply an SDG lens to itswork and processes. It is based on a set of indicators that can be used to assess where countries currently stand in relation to the goals and targets of the 2030 Agenda.
19. The Study also aims to help countries working to define national action plans by:
• Identifying available comparative indicators that Members could use to set strategicpriorities within the SDG agenda and to track progress towards them.
• Offering an approach to assessing the international contribution, or potential global impactof policies.
• Highlighting SDG areas where statistical development will be particularly important, eitherto track progress or to advance understanding of the policy drivers of SDG outcomes.
20. In order to fulfil these aims, this Study has been kept as simple as possible. For a start, it hasbeen limited to Member countries’ distances to travel to reach the SDG targets; no attempt has been made to assess past or likely future rates of progress. A second important simplification is that all OECD countries have been treated equally on all indicators. This may seem uncontroversial but is, in some ways, unfair. For example, some OECD members have not subscribed to United Nations development aid targets, which were designed to apply to economically advanced countries; yet where data are available, these members have been assessed on the same scale as others. This would need further consideration before a full-fledged assessment could be produced.
21. Some other, mostly technical, simplifications are explained later in the course of presentingthe analysis. These have not been introduced lightly, but have been designed to keep this Study focused on its key objectives of helping and informing interested member countries about their distance from the target level to be achieved by 2030. However, the need for simplifications reinforces the point made earlier that the results of this Study should not be taken as a definitive assessment, but rather as a means of advancing thought and action on how members could identify the SDGs areas where more urgent attention is needed at both national and global levels.
3. Study methodology
i) A brief history
22. A pilot of the OECD Study was first presented to OECD Ambassadors in July 2016, as anexample of a possible deliverable for the OECD Action Plan on SDGs. Participation in the pilot was voluntary, and included Denmark, Finland, Netherlands, Norway, Slovenia and Sweden. Belgium, the Czech Republic, Italy, Korea, Luxembourg, Latvia and Slovakia subsequently decided to join the Study. The Action Plan was discussed at the 2016 Ministerial Council Meeting and approved in December 2016 [C(2016)166/REV2].
23. Between September 2016 and January 2017, national seminars were organised in severalcountries participating in the Study, and a second seminar for OECD Ambassadors took place in
5 For the complete metadata, see www.oecd.org/std/OECD-Measuring-Distance-to-SDGs-Targets-Metada.pdf

10
December 2016, followed by a technical workshop with national officials working on SDG implementation. Feedback from these events, and directly from countries, has led to refinements in the Study methodology, relative to the pilot. The indicator set has been considerably extended, and the normalisation method for comparing distance to targets has been adjusted. These refinements are detailed in the two following sections.
ii) From targets to indicators
24. The United Nations Statistical Commission, meeting in March 2016, adopted a “globalindicator framework” comprising 230 indicators, a few of them used against more than one target. However, in a separate document the UNSC acknowledged “obvious theoretical and methodological constraints”, which meant that “refinements and improvements to several indicators will be needed over the years” and that the proposed indicators were “intended for global reviews and… not necessarily applicable to all national contexts and country reviews”.
25. In fact, many of the indicators on the global list do not yet exist, and some still need to befully defined. A number of countries have examined the list and found that they could only report on about 25% of them. At the same time, various indicator lists have been put forward by other institutions.6 In several cases, however, the indicators included in these lists refer only to the Goals and bear limited relevance to some of the specific targets in the 2030 Agenda.
26. This assessment builds on the UN global indicator framework and relies on a dataset thatmeasures OECD countries’ relative distances from those targets where sufficiently good and comparable information could be found. The selected indicators have:
• Face validity, i.e. they are related to the main thrust and intention of the relevant target;
• Discriminatory power, i.e. they show a range of performance among OECD countries whilespeaking to the country’s reality;
• Broad availability, covering at least 20 OECD countries for a relatively recent year;
• High statistical quality, i.e. they are computed according to internationally acceptedstandards, guidelines or good practices;
27. Against this background, and bearing in mind countries’ requests that indicators be closelyaligned with the IAEG Global List, the following indicator selection rules were followed:
• First, the Study includes 65 OECD indicators directly comparable with those in the UNGlobal Indicators Database. Using OECD indicators ensures that data have beenstandardised to facilitate country comparison within the OECD. An example is productivitygrowth (growth of GDP per hour worked), for which OECD data is of high quality andmeets demanding international statistical standards.
• Second, where data did not yet exist in the UN Global Indicator Database, the Study hasused a total of 14 proxies from OECD sources. As an example, the share of students above aminimum proficiency level in environmental science, sourced from the OECD PISA Study,
6 The UN Sustainable Development Solutions Network originally proposed 100 global monitoring indicators but emphasised that producing them on a recurrent basis would require a “data revolution” (page 3 of the linked document). More recently, UNSDSN has focused on actual data availability; in three recent publications (the first one with the Bertelsmann Stiftung) it proposed four different SDG indicator sets, each comprising between 34 and 39 indicators. Both exercises rely heavily on OECD datasets.

11
was used as a proxy of the IAEG indicator “extent to which education for sustainable development is mainstreamed at all levels”.
• Third, where no OECD sources exist, the Study has used 37 indicators for which data areavailable on the UN Global Indicators Database. One example is the prevalence of moderateor severe food insecurity in the adult population.
• Fourth, the Study has used 15 OECD indicators that are not on the IEAG Global List, butwhich are nonetheless relevant to capture the challenges that SDG targets raise. As anexample, an OECD indicator of social assistance adequacy was used to complement themeasure of social assistance coverage. In these cases indicators were only selected if theyi) reflected the main drive and intention of the relevant target; ii) were available for at least20 OECD countries for a recent year; and iii) were measured and compiled according tointernational standards, guidelines or good practices.
28. As a result of these rules, suitable indicators were identified for 98 out of 169 targets, ascompared with 73 in the pilot version. For a few targets – those that are multifaceted, phrased in general terms, or open to different statistical interpretations – more than one indicator was identified. Overall, 131 indicators (128 unique indicators, since two indicators are used to assess more than one target) were included in the dataset of the Study, up from 86 in the pilot version.
29. Even so, the selected indicators still only enable 57% of all the SDG targets to be assessed.The coverage is uneven across goals, with health and education having at least one indicator per target, while oceans are only covered in a very limited way (Figure 2, Panel A). Coverage of the Agenda’s 5Ps - People (Goals 1, 2, 3, 4 and 5), Planet (Goals 6, 12, 13, 14 and 15), Prosperity (Goals 6, 12, 13, 14, 15), Peace (Goal 16) and Partnerships (Goal 17) – is somewhat less uneven, as shown by Figure 2, Panel B.
Figure 2. Share of targets covered by at least one indicator
Percentage of targets covered by Goal (Panel A, left) and the 5Ps (Panel B, right), all OECD countries
30. At the country level, data are generally available for the bulk of the indicators used in theStudy: of the 35 OECD countries, 26 have data for 90% or more of the selected indicators. However, for a few countries – often those that have joined the OECD in recent years – data are missing for around 30% of the Study’s indicators (see Figure 3 for the range of country coverages of the 169 targets).
0102030405060708090
100
0102030405060708090
100
People Planet Prosperity Peace Partnership

12
31. The information gaps should be borne in mind, especially when evaluating performance onthe less well covered goals. They point to the need to further build statistical capacity to measure the targets not currently covered by OECD or UN indicators. Another possibility would be to depart more significantly from the IAEG Global List and use the best available proxies as placeholders, as several OECD countries have done to establish their national set of reporting indicators (see also next section).
Figure 3. Percentage of targets measured by at least one indicator
Panel A. Goals Panel B. 5Ps
Note: The chart shows the percentage of targets covered for OECD countries on the 17 Goals (Panel A) and 5Ps (Panel B). Black dots: OECD median country score. Box boundaries: first and third quartiles of the country distribution. Whiskers: 10th and 90th percentiles of this distribution.
32. The future statistical agenda on SDGs will have to increasingly concentrate on policy leversand global contributions. For the latter in particular, it will be important to identify spill-overs from domestic policies contemplated in the Agenda 2030 (e.g. attracting high-skilled immigrants may mean brain drain and human capital reduction in poorer countries).
33. Given its expertise on policy indicators (e.g. macro-economic and sectoral policies) and inmeasuring the interconnectedness among countries (e.g. ODA, trade access, Trade in Value Added, climate), the OECD is well placed to play a prominent role in moving this measurement agenda forward.
iii) From indicators to measuring distance to targets
34. The Study evaluates countries’ performance by examining the distance to travel in order toreach each target level. Here, the heterogeneous nature of SDG targets means that setting desirable levels of achievement by 2030 on each indicator requires a variety of approaches. The task is easy if the level is explicitly specified in the 2030 Agenda itself, either as a fixed value, or as a relative improvement on a country’s starting position. In other cases, a fixed value or a relative improvement can be deduced from other international agreements on the relevant topic. However, in a third category, where no guidance is available in international agreements, the Study has set the desirable value at the “90th percentile” – the level which only 10% of OECD countries now attain. This approach has not changed since the pilot version of the Study, but the numbers of indicators in each category has risen to the values shown in Table 2.
0102030405060708090
100
0102030405060708090
100

13
Table 2. Types of SDG indicators and their 2030 end-values
Type of indicator Means of setting 2030 end-value Number of indicators
A1. SDG-based, absolute in the future End-value referred to in SDGs, e.g. infant mortality at 12 per 1000 lives 46
A2. SDG-based, relative to starting position End-value referred to in SDGs, e.g. reduce by half the proportion of people living in poverty
6
B1. Other international agreement or shared aspirations, absolute in the future
End-value set by International Agreements, Good Practices or other Established Frameworks, e.g. reduce PM 2.5 pollution to less than 10 micrograms per cubic meter (WHO)
40
B2. Other international agreement or shared aspirations, relative to starting position
End-value set by International Agreements, Good Practices or other Established Frameworks, e.g. double the share of renewables in consumption (IRENA)
3
C. No explicit value; best historical performance considered
End-value set at the 90th Percentile of OECD countries in 2010 36
35. In order to compare scores across different targets, indicators must be normalised. Initially,in the OECD pilot study (2016), indicator scores were placed on a common scale running from 0 to 100, with 100 being the end-value and 0 being the baseline level – the value that only 10% of OECD countries failed to reach in a defined base year (see Figure 4, Panel A). Setting such a baseline had the advantage of excluding “outliers” – unusually low scores that would otherwise unduly extend the scale. It also generated a good spread of results against possible target values, and could be applied to all targets, irrespective of their nature or complexity.
36. However, as the results are bounded between 0 and 100, this normalization does not(by construction) enable one to monitor the performance of countries performing below the baseline. This limitation would also inhibit the application of the methodology to countries outside the OECD, many of which would fall short of the baseline on a large number of indicators. The zero bound might also be misinterpreted as the country’s starting point, whereas in fact it represents the 10th percentile of OECD country performance in the base year.
37. To overcome these problems, in response to comments received by countries, distances arenow calculated as the “standardised difference” between the country’s current position and the target end-value. For each indicator, the standardised measurement units are defined as the standard deviation across OECD countries at the beginning of the period considered. To express a country’s starting position for a given indicator in standardised units, we first calculate the country’s distance to the target, and then divide this by the standard deviation of the indicator, for the distribution of OECD countries7. Based on this approach, a score of zero implies that the target has been reached, while a positive (non-zero) score implies that a country has not yet achieved its target (see Figure 4, Panel B). Negative scores, which mean that a country has already exceeded the target, are reported as zero, i.e. as meeting the target. So the higher the score, the further is the distance that the country will need to travel to achieve its target. The units of measurement should be read as the number of standard deviations by which a country needs to improve in order to reach the target.
7. Example: target 5.5 on women’s full and effective participation in leadership is measured through the shareof seats in national parliaments held by women. The level to be achieved by 2030 is 50%, as the target isfull gender equality. The standard deviation of the shares currently observed among OECD country scoresis ~10 percentage points. Denmark’s share of seats held by women is 37%. So its standardised score on thisindicator is the difference between its current share (37%) and the target (50%), divided by the standarddeviation (10%) = 13/10 = 1.3 units.

14
Figure 4. Illustrating current and former normalisation procedures
Panel A – the ratio scale
Panel B – the “standardised difference”
Note: The panels show the original and latest normalisation procedures for the same notional set of country scores on an indicator. Blue dot: score of assessed country. Grey dots: other country scores. Green line: target level to be achieved by 2030. Red line in Panel A: the “baseline level”, i.e. the value that only 10% of OECD countries currently fail to reach. Panel A shows the country as 20% of the way from the baseline to the target level. Panel B shows it is four standard deviations short of the target, this unit taking account of the position of all dots on the line.
38. This standardisation technique is a modified version of the standard “z-score” normalisation,which is one of the most common techniques used in statistics for comparing scores on different tests or constructing composites combining variables expressed in different measurement units. This standardisation method was tested against alternatives and preferred due to its statistical properties. Table 2 summarises conclusions from this testing, which included both the original method (“Ratio scale”) and the “time-distance” method. Time-distance simply estimates the number of years it will take to reach the target level on an indicator, given recent observed progress. Such progress can be assumed to be following a linear trend, or some other pattern, such as an annual percentage change (which yields an exponential trend). Overall, the modified z-score was preferred, especially because it enables measurement of progress by countries below the previous OECD baseline level while at the same time being relatively unaffected by the inclusion of additional countries in the sample. More information on the robustness tests carried out on various standardisation techniques, as well as the distributional effects on the distance results is provided in Boarini et al. (2017), forthcoming.
80%20%
Unit

15
Table 3. Pros and cons of different normalisation procedures
Ratio scale Modified z-score Time-distance method Interpretation Country X travelled Y% of the way
from the current baseline score (10th percentile of actual performance) to the target
Country X is Y standard deviations short of the target
Under a business as usual (BAU) scenario, country X would need Y years to reach the target
Formula 𝐦𝐦𝐦𝐦𝐦𝐦�𝐦𝐦𝐦𝐦𝐦𝐦 �
𝒙𝒙 − 𝑷𝑷𝟏𝟏𝟏𝟏𝑻𝑻 − 𝑷𝑷𝟏𝟏𝟏𝟏 ,𝟏𝟏� ,𝟏𝟏� 𝐦𝐦𝐦𝐦𝐦𝐦�
𝑻𝑻 − 𝒙𝒙𝝈𝝈 ,𝟏𝟏� Formula depends on assumed
shape of BAU progress curve Data conditioning the measure
Minimum values of current performances; target level
Current distribution of country scores (dispersion); target level
Linear, exponential or other assumed rate of improvement; target level
Sensitivity to inclusion of new countries
Where a country whose score is below the baseline is added it will: • if included in the normalisation
procedure, change the boundsso that other countries seetheir performances boosted
• if not included in thenormalisation procedure, beassigned a null score, so thatits full distance to target is notregistered
Adding new countries can affect the standard deviation – and thus the standardisedmeasurement unit – if included in the normalisation procedure. This in turn would affect the estimated number of standardised units that a country will need to travel to reach the target. However the magnitude of the impact cannot be assessed ex ante (see Boarini et al. for a more formal discussion)
New countries will have no impact on normalisation since trends are country-specific
Advantages • Widely used• Easy to compute
• Countries at the bottomof the league can still beassessed in terms ofdistance to travel
• Lowers the scores incases where all countriesare far from the targetand perform similarlybadly
• Easy to understand• Easy to compare projected
achievement date with 2030deadline
Disadvantages • True distance to target not shown for countries that score below the lower bound. Extreme values can distort the normalised distribution
• Ratio scale normalisationcould widen the range ofindicators lying within a smallinterval (the impact is greaterthan with z-score, OECD,2008)
• Since unit size dependson the standard deviationof country scores in thebase year,standardisation couldunduly distort the resultsif countries are clusteredaround the mean (theimpact is howeversmaller than ratio-scale,OECD, 2008)
• Results depend heavily onassumptions made aboutshape of trends (linear,exponential etc.)
• Results expressed in years totarget cannot be averagedamong indicators unless acountry is projected toprogress on all of them, sinceif it is projected to regress, itwill take an infinite number ofyears to meet that target
39. To assess performance by target, goal and “P”, results are summed by weighting eachindicator equally within targets, weighting each target equally within goals, and weighting each goal equally within each “P”. This reflects the equal emphasis given to each of the Goals and 5Ps in the 2030 Agenda, but note that where goals have few indicators, it increases the weight of those indicators. The alternative of weighting each indicator equally would conversely reduce the weight of goals with few indicators.

16
4. Study findings
40. The Study finds that on average OECD countries have some distance to travel to reach theSDGs targets, particularly on the goals related to gender equality, education, the economy and jobs, and institutions. This partly reflects the more ambitious thresholds set on these targets (e.g. “achieving gender parity” vs. targets phrased only in terms of “substantially improve”). OECD countries are closer to meeting targets on water, biodiversity, cities, poverty and oceans. Figure 5 shows OECD average results by goal.
Figure 5. OECD average results by Goal
Note: This figure shows OECD’s distance to travel towards each of the 17 Goals of the 2030 Agenda. Bars show OECD’s performance. The y-axis indicates the distance from reaching the target in standardised units. 0 indicates that the level for 2030 has already been attained, and the axis starts at 3 as most OECD countries have already attained this level. Distances to target are aggregated at the goal level (all targets weighted equally).
41. Distances to targets vary significantly across the Goals (Figure 6), and when the goals aregrouped into the 5Ps (Figure 7). OECD countries perform consistently well on water, biodiversity and infrastructure. There is more variation on poverty, women, sustainable production, climate and implementation, with some countries much nearer the 2030 levels than others. Of the 5Ps, Partnership shows the largest spread of country performance.

17
Figure 6. How OECD countries vary in their distance to targets, by SDG Goal
Note: The distribution of OECD countries’ distances on the 17 Goals in standard deviation units. Central black bars: OECD median country score. Box boundaries: first and third quartiles of the country distribution. Whiskers: 10th and 90th percentiles of this distribution.
Figure 7. How OECD countries vary in their distance to targets, by 5Ps
Note: The distribution of OECD countries’ distances on the 5 Ps in standard deviation units. Central black bars: OECD median country score. Box boundaries: first and third quartiles of the country distribution. Whiskers: 10th and 90th percentiles of this distribution.
42. The Study shows that while individual countries’ performances tend to be fairly consistentacross Goals, their performance within each Goal is often unbalanced. This suggests that, from the perspective of identifying strategic priorities for implementing the SDGs, countries should look at targets individually rather than just focusing on Goals. For instance, while all countries have already met the target of universal access to energy, many are lagging behind on renewable energy and even more so on energy efficiency (Figure 8).
0.00
0.50
1.00
1.50
2.00
2.50
3.00
3.50
0.00
0.50
1.00
1.50
2.00
2.50
3.00
3.50People Planet Prosperity Peace Partnership

18
Figure 8. How OECD countries vary in their distance to targets in Goal 7- Energy
Note: The distribution of OECD countries’ distances on the four targets of Goal 7 for which indicators are available. Central black bars: OECD median country score. Box boundaries: first and third quartiles of the country distribution. Whiskers: 10th and 90th percentiles of this distribution.
43. For illustrative purposes, the OECD Study also makes a first attempt at distinguishingdomestic targets from those with trans-boundary effects, i.e. positive or negative impacts of countries’ actions on the rest of the world. Such effects include help to other countries in meeting the targets, including through official development assistance (ODA). However, there may also be negative spillovers, such as when countries subsidise their own farmers in ways that reduce world prices or market access for developing countries. Demand for products consumed in OECD countries also entails carbon dioxide emissions in other parts of the world, which raises global greenhouse gas levels.
44. Figure 9 shows average OECD country performance against three types of targets withtrans-boundary impacts. Countries are furthest from the 2030 targets on raising their demand-based CO2 productivity (the goods consumed per unit of embodied emissions), whereas they are somewhat more advanced in reducing agricultural subsidies and increasing ODA. However, further work will be necessary to expand and deepen the analysis of trans-boundary aspects of OECD countries’ performance. The ways in which OECD countries aim to meet their domestic SDG targets may also have cross-border impacts, e.g. if health or education outcomes are improved partly with skilled personnel coming from developing countries.
0.00
0.50
1.00
1.50
2.00
2.50
3.00
3.50
4.00
4.50
5.007.1 - Access to energy 7.2 - Renewable energy 7.3 - Energy efficiency 7.a - ODA to clean energy

19
Figure 9. Average performance of OECD countries on some SDG targets pertaining to global contributions
45. The Study so far has been ‘static’, focusing on distances to travel rather than on rates of improvement. However, using past trends to project possible future performance could provide a key complement to assessing the starting positions, and also inform priority setting. For instance, if a country is very close to reaching a given target today, but has been slowing down or even reversing earlier progress, then in a few years it may lose its relative strength in that target and need to take action to achieve it. Dynamic assessments can also suggest the degree of effort required to meet a target, and how this varies across targets: where there is a long distance to travel, but recent progress has been rapid, it may be easier to close the gap than where the initial distance is short but recent progress has been slow or negative. The Study has therefore also been exploring Monte Carlo simulations for a selection of indicators where sufficient data on past performance is available. By way of example, Figure 10 shows observed and predicted fatal traffic accidents in Slovenia. The target is to reduce such deaths by half by 2020. The Monte Carlo simulations indicate that, based on past trends, there is only about a 30% chance of this being achieved by the deadline, though it is much more likely to be achieved by 2030 (right panel).
Figure 10. Observed and predicted fatal traffic accidents - Slovenia
Note: Left panel: Slovenian traffic accidents in standard deviation units, with zero representing the 2030 target level. Black line shows actual data to 2010. Blue lines show projected values to 2030, the solid line representing the most likely path based on past performance, and the dotted lines the 95% confidence interval, based on Monte-Carlo simulations. Right panel: The probability of achieving the 2030 targeted reduction of Slovenian traffic accidents in each year from 2015 to 2030, based on the Monte Carlo simulations, from zero (impossibility) to 1 (certainty).
0.00
0.50
1.00
1.50
2.00
2.50
3.00Average ODA Score Demand-based CO2 productivity Unsubsidised agricultural production
0.00
0.10
0.20
0.30
0.40
0.50
0.60
0.70
0.80
0.90
1.00
2015 2017 2019 2021 2023 2025 2027 2029
Likelihood of achievement
0.00
0.50
1.00
1.50
2.00
2.50
3.00
3.50
4.00
2000 2005 2010 2015 2020 2025 2030
Expected2 sd from the expected valueObserved

20
46. A final consideration is that, as the Agenda asserts, the SDGs are indivisible and integrated.This means that achieving one Goal may require action on others. For instance, poverty reduction is the objective of Goal 1 but attaining it may also require progress e.g. under Goal 9, on the economy and decent work and Goal 10 on inequalities. In other cases, mutual dependence is observed: improving education (Goal 4) will bring benefits in terms of health status (Goal 3), income and employment (Goals 1, 2, 8 and 10), and institutions (Goal 16), but improvements in these factors could also improve educational resources and outcomes. In principle this calls for an integrated assessment of countries’ starting positions, in line with the conceptual approach suggested by the OECD Policy Coherence for Sustainable Development framework (http://dx.doi.org/10.1787/9789264256996-en). In practice, however, an integrated assessment is very complex to carry out, as the identification of synergies and trade-offs for many of the SDG targets is an empirical question that has been little researched so far. The Secretariat has conducted exploratory work to Study the correlations across targets and goals, using the dataset of the Study as well as SDG indicator sets developed by other institutions (e.g. the UN, the World Bank, etc.). Further work in this direction will be pursued in the future.
5. How participating countries have been using the Study
47. As explained by the UN’s Synthesis of Voluntary National Reviews at the 2016 High LevelPolitical Forum, countries’ responses to SDGs vary widely and many national implementation plans are still in their infancy. Tasks include: i) translating SDGs into the national context; ii) developing monitoring and reporting frameworks; iii) building institutional frameworks to support a whole-of-the-government SDG implementation effort; iv) raising awareness and stakeholder involvement; and v) securing sufficient means of implementation.
48. The Study aimed especially to help countries with i) and ii) above, and has proven usefulboth in these respects and in others. Several countries are using the results of the Study to inform the national policy debate, especially in determining priorities for action in new or updated National Development Strategies or implementation plans or policy mechanisms. Slovenia for instance is building its National Development Strategy around several of the priorities highlighted by the Study such as the need to increase trust in institutions and the quality of governance more generally. In the Netherlands, the Council of Ministers published a letter to Parliament proposing to develop an action plan on SDGs for the coming years; the letter referred to the results of the OECD Study to indicate possible areas for improvement (see Annex II for detailed country results from the Study). The Czech Republic plans to refer to the Study results when preparing the implementation plan for the 2030 strategic framework that will be prepared by the end of November 2017.
49. Participating countries are also using the Study to guide their monitoring and reportingprocesses, and in particular to: i) select national indicators; ii) establish starting positions and finishing lines; and iii) developing dynamic baselines. Slovenia, Italy, Belgium and the Czech Republic, for instance, have used the Study methodology in their work to test the robustness of indicators and normalisation choices, or to study static versus dynamic baselines. The Czech Republic also envisages using the Study methodology as a tool for identifying policy gaps and highlighting changes needed to meet the 2030 Goals. In building its national reporting framework, Luxembourg is considering the indicator set used by the Study alongside other national and international indicator sets.
50. Some countries have also expressed an interest in referring to some of the results of theOECD Study in their National Voluntary Reviews at the annual High Level Policy Forum held in New York in July. So far, these countries include Slovenia, Latvia and the Czech Republic.
51. Finally, many countries valued participation in the Study as an opportunity to shareexperiences on design and communication of SDG plans. These experiences are particularly valuable to help build new institutional frameworks for a whole-of-the-government effort on SDGs, and to facilitate stakeholder involvement. In Slovenia, for instance, the elaboration of the National

21
Development Strategy used a participatory process with many governmental and non-governmental stakeholders, and the Study proved valuable in presenting the country’s SDG starting positions in a comparative perspective.
52. The uses of the Study vary partly in response to the different roles that national statisticaloffices (NSOs) play in SDG implementation in different countries, which in turn depend to some extent on the structure and nature of approaches to SDG implementation by the government system as a whole. Useful information on these approaches is available in an OECD Survey on Planning and Co-ordinating the Implementation of the SDGs conducted by a team of Swedish researchers in 2016. It found that most of the 33 countries surveyed were involving their NSOs in developing indicators to monitor implementation of SDGs, but that only some had done stocktaking or gap analysis of their country’s starting positions in addressing SDG-relevant issues.
53. The OECD/Swedish Study also showed that lead responsibility for SDG implementationamong the surveyed countries was split evenly among three main models: leadership by the Centre of Government (CoG, i.e. Prime Minister’s office or department); co-leadership between the CoG and another ministry (most often the foreign ministry); and leadership or co-leadership without the centre of government (usually involving the foreign ministry). The CSSP meeting provides NSOs with an opportunity to share and compare their experiences under these different approaches to SDG implementation.
6. Conclusion
54. This Study on Measuring Distance to the SDG targets has been undertaken to assist membercountries with their national implementation of the 2030 Agenda for Sustainable Development. Drawing on the IAEG Global List of indicators, its methodology evaluates the distance countries need to travel to meet each target. It can thus provide a high-level overview of strengths and weaknesses across the SDGs and the 5Ps, as well as a more granular analysis. While major data gaps remain – which the OECD is working with UN and other partners to fill – the pilot version of the Study has proven useful to several members in identifying areas that require attention in order to reach the 2030 targets. Work will continue to enable a more in-depth analysis of the targets to be achieved and the trajectories implied in specific country contexts.
55. Based on 131 indicators covering 98 targets, the Study shows that the OECD area as awhole still has significant distance to travel to meet the 2030 targets. On average, OECD countries are closest to reaching the 2030 targets on health, water and energy, and furthest away on gender equality. There is considerable heterogeneity in starting positions across both goals and targets, which suggests that national priorities for implementing SDG agendas should be set at target level.


ANNEX I: OECD INDICATORS USED IN THIS STUDY
For detailed metadata information, visit: www.oecd.org/std/OECD-Measuring-Distance-to-SDGs-Targets-Metada.pdf

Target Code Indicator for global monitoring OECD indicator Source
1.1.1Proportion of population below the international poverty line of US$1.90 per day
Absolute poverty rate USD 1.90 0.00OECD based on LIS and EU-SILC
1.1.2 - Absolute poverty rate USD 10.00 0.00OECD based on LIS and EU-SILC
1.2.1Proportion of population below national poverty line
Relative income poverty rate 0.05 (**) OECD IDD
1.3.1Proportion of the population covered by social assistance programs
Share of the population living below the poverty threshold receiving minimum income benefits
100.00OECD Social Expenditures Database
1.3.2 - Social assistance adequacy 100.00OECD Tax-Benefit Models
1.3.3 - Pension adequacy 100.00OECD Pensions Statistics
1.5.3National and local disaster risk reduction strategies
UN-STAT 1.00 UN-STAT
1.a.2 -Proportion of total government spending on education health and social protection
68.20 (*)OECD National Accounts
2.1.2Estimated prevalence of moderate or severe food insecurity in the adult population
UN-STAT 0.00 UN-STAT
2.2.3 - Obesity rate 0.00 OECD Health Data
2.4.1 - Nutrient balance (nitrogen) 0.00OECD Agriculture Statistics Database
2.4.2 - Nutrient balance (phosphorous) 0.00OECD Agriculture Statistics Database
2.4.3 -Share of agricultural land area under certified organic farm management
11.90 (*)OECD Agriculture Statistics Database
2.5.2Proportion of local breeds classified as being at risk of extinction
UN-STAT 0.00 UN-STAT
2.a.1The agriculture orientation index for government expenditures
UN-STAT 1.00 UN-STAT
2.a.2Total official flows disbursements for agriculture, by recipient
Official Development Assistance (Official Development Assistance) and Other Official Flows (OOF) to agriculture fishing and rural development
0.03OECD/DAC Creditor Reporting System (CRS) database
2.b.1 Producer Support Estimate Producer support estimates (Percentage) 1.96 (*)OECD Agriculture Statistics Database
3.1.1 Maternal mortality ratio Maternal mortality 70.00 OECD Health Data
3.2.1 Under-five mortality rate UN-STAT 25.00 UN-STAT
3.2.2 Neonatal mortality rate Neonatal mortality 12.00 OECD Health Data
3.2.3 - Low birthweight 4.33 (**) OECD Health Data
3.2 By 2030, end preventable deaths of newborns and children under 5 years of age, with all countries aiming to reduce neonatal mortality to at least as low as 12 per 1,000 live births and under-5 mortality to at least as low as 25 per 1,000 live births
2.4 By 2030, ensure sustainable food production systems and implement resilient agricultural practices that increase productivity and production, that help maintain ecosystems, that strengthen capacity for adaptation to climate change, extreme weather, drought, flooding and other disasters and that progressively improve land and soil quality
2.5 By 2020, maintain the genetic diversity of seeds, cultivated plants and farmed and domesticated animals and their related wild species, including through soundly managed and diversified seed and plant banks at the national, regional and international levels, and promote access to and fair and equitable sharing of benefits arising from the utilization of genetic resources and associated traditional knowledge, as internationally agreed
2.a Increase investment, including through enhanced international cooperation, in rural infrastructure, agricultural research and extension services, technology development and plant and livestock gene banks in order to enhance agricultural productive capacity in developing countries, in particular least developed countries
2.b Correct and prevent trade restrictions and distortions in world agricultural markets, including through the parallel elimination of all forms of agricultural export subsidies and all export measures with equivalent effect, in accordance with the mandate of the Doha Development Round
3.1 By 2030, reduce the global maternal mortality ratio to less than 70 per 100,000 live births
Goal 3. Ensure healthy lives and promote well-being for all at all ages
1.5 By 2030, build the resilience of the poor and those in vulnerable situations and reduce their exposure and vulnerability to climate-related extreme events and other economic, social and environmental shocks and disasters
1.a Ensure significant mobilization of resources from a variety of sources, including through enhanced development cooperation, in order to provide adequate and predictable means for developing countries, in particular least developed countries, to implement programmes and policies to end poverty in all its dimensions
2.1 By 2030, end hunger and ensure access by all people, in particular the poor and people in vulnerable situations, including infants, to safe, nutritious and sufficient food all year round
2.2 By 2030, end all forms of malnutrition, including achieving, by 2025, the internationally agreed targets on stunting and wasting in children under 5 years of age, and address the nutritional needs of adolescent girls, pregnant and lactating women and older persons
Goal 2. End hunger, achieve food security and improved nutrition and promote sustainable agriculture
1.2 By 2030, reduce at least by half the proportion of men, women and children of all ages living in poverty in all its dimensions according to national definitions
1.3 Implement nationally appropriate social protection systems and measures for all, including floors, and by 2030 achieve substantial coverage of the poor and the vulnerable
Goal 1. End poverty in all its forms everywhere
Target
1.1 By 2030, eradicate extreme poverty for all people everywhere, currently measured as people living on less than $1.25 a day
24

Target Code Indicator for global monitoring OECD indicator SourceTarget
3.3.1 Estimated HIV incidence rate AIDS incidence 0.00 OECD Health Data
3.3.2Tuberculosis incidence per 100,000 population
UN-STAT 0.00 UN-STAT
3.3.4 - Hepatitis B incidence 0.00 OECD Health Data
3.3.5Number of people requiring interventions against neglected tropical diseases
UN-STAT 0 UN-STAT
3.4.1Mortality rate attributed to cardiovascular disease, cancer, diabetes or chronic respiratory disease
Premature mortality 2004.40 (**) OECD Health Data
3.4.2 Suicide mortality rate Death due to intentional self-harm 0.00 OECD Health Data
3.4.3 -Deprivation in life satisfaction (share of the population reporting a life satisfaction at 3 or below)
0.00OECD based on Gallup World Poll
3.5.2Alcohol per capita consumption (aged 15 years and older) within a calendar year in litres of pure alcohol
Alcohol consumption 6.20 (*) OECD Health Database
3.6 By 2020, halve the number of global deaths and injuries from road traffic accidents
3.6.1 Death rate due to road traffic injuries Mortality from transport accidents 3.25 (**) OECD Health Data
3.7.2Adolescent birth rate per 1,000 adolescent women aged 15-19
Adolescent fertility rate 0.00 OECD Family Database
3.8.2 - Coverage for health care 100.00 OECD Health Data
3.9.1Mortality rate attributed to household and ambient air pollution
UN-STAT 0.00 UN-STAT
3.9.2Mortality rate attributed to unsafe water, unsafe sanitation and lack of hygiene
UN-STAT 0.00 UN-STAT
3.9.3Mortality rate attributed to unintentional poisonings
Mortality from accidental poisonning 0.00 (**) OECD Health
3.a Strengthen the implementation of the World Health Organization Framework Convention on Tobacco Control in all countries, as appropriate
3.a.1 - Prevalence of current tobacco use 0.00 OECD Health
3.b.2Total official flows for medical research and basic heath sectors, by recipient
Official Development Assistance and Other Official Flows to the medical research and basic health sectors
0.02OECD/DAC Creditor Reporting System (CRS) database
3.c Substantially increase health financing and the recruitment, development, training and retention of the health workforce in developing countries, especially in least developed countries and small island developing States
3.c.1 Health worker density and distribution Health and social employment density 75.55 (*) OECD Health Database
3.d Strengthen the capacity of all countries, in particular developing countries, for early warning, risk reduction and management of national and global health risks
3.d.1International Health Regulations (IHR) core capacity index
UN-STAT 100.00 UN-STAT
4.1 By 2030, ensure that all girls and boys complete free, equitable and quality primary and secondary education leading to relevant and effective learning outcomes
4.1.1Proportion of children at the end of lower secondary achieving at least a minimum proficiency level in mathematics
Share of students above level 2 in reading and mathematics in OECD's PISA study
100.00 OECD PISA
4.2.2Participation rate in organized learning (one year before the official primary entry age)
Gross enrolment rate in pre-primary education
100.00OECD Education Statistics
4.3 By 2030, ensure equal access for all women and men to affordable and quality technical, vocational and tertiary education, including university
4.3.1Participation rate of youth and adults in formal and non-formal education and training in the previous 12 months
Participation in formal and/or non-formal education
100.00 OECD PIAAC
4.4 By 2030, substantially increase the number of youth and adults who have relevant skills, including technical and vocational skills, for employment, decent jobs and entrepreneurship
4.4.1
Proportion of youth and adults with information and communications technology (ICT) skill, connecting and installing new devices
UN-STAT 66.00 (*) UN-STAT
4.5 By 2030, eliminate gender disparities in education and ensure equal access to all levels of education and vocational training for the vulnerable, including persons with disabilities, indigenous peoples and children in vulnerable situations
4.5.1Gender parity index for achievement in mathematics by the end of lower secondary
Gender differences in mathematics in OECD's PISA study
0.00 OECD PISA
4.6 By 2030, ensure that all youth and a substantial proportion of adults, both men and women, achieve literacy and numeracy
4.6.1Percentage of population in a given age group achieving at least a fixed level of proficiency in functional literacy skills
Share of adults above level 2 in literacy and numeracy OECD's PIAAC study
100.00 OECD PIAAC
3.8 Achieve universal health coverage, including financial risk protection, access to quality essential health-care services and access to safe, effective, quality and affordable essential medicines and vaccines for all
3.9 By 2030, substantially reduce the number of deaths and illnesses from hazardous chemicals and air, water and soil pollution and contamination
3.b Support the research and development of vaccines and medicines for the communicable and non‑communicable diseases that primarily affect
4.2 By 2030, ensure that all girls and boys have access to quality early childhood development, care and pre-primary education so that they are ready for primary
Goal 4. Ensure inclusive and equitable quality education and promote lifelong learning opportunities for all
3.3 By 2030, end the epidemics of AIDS, tuberculosis, malaria and neglected tropical diseases and combat hepatitis, water-borne diseases and other communicable diseases
3.4 By 2030, reduce by one third premature mortality from non-communicable diseases through prevention and treatment and promote mental health and well-being
3.5 Strengthen the prevention and treatment of substance abuse, including narcotic drug abuse and harmful use of alcohol
3.7 By 2030, ensure universal access to sexual and reproductive health-care services, including for family planning, information and education, and the integration of reproductive health into national strategies and programmes
25

Target Code Indicator for global monitoring OECD indicator SourceTarget
4.7 By 2030, ensure that all learners acquire the knowledge and skills needed to promote sustainable development, including, among others, through education for sustainable development and sustainable lifestyles, human rights, gender equality, promotion of a culture of peace and non-violence, global citizenship and appreciation of cultural diversity and of culture’s contribution to sustainable development
4.7.1 -Share of students above basic proficiency (level C) in the environmental science performance index in OECD's PISA study
100.00 OECD PISA
4.a Build and upgrade education facilities that are child, disability and gender sensitive and provide safe, non-violent, inclusive and effective learning environments for all
4.a.1Proportion of schools with access to computers for pedagogical purposes, primary and secondary level
Percentage of 15-year-old students with access to computer connected to the internet available for students for educational purposes
100.00 OECD PISA
4.b By 2020, substantially expand globally the number of scholarships available to developing countries, in particular least developed countries, small island developing States and African countries, for enrolment in higher education, including vocational training and information and communications technology, technical, engineering and scientific programmes, in developed countries and other developing countries
4.b.1Total official flows for scholarships, by recipient
Official Development Assistance for scholarships trainings
0.01OECD/DAC Creditor Reporting System (CRS) database
4.c By 2030, substantially increase the supply of qualified teachers, including through international cooperation for teacher training in developing countries, especially least developed countries and small island developing States
4.c.1
Proportion of teachers in pre-primary education who have received at least the minimum organized teacher training (e.g. pedagogical training) pre-service or in-service required for teaching at the relevant level in a given country
Share of teachers who undertook professional development in the last 12 months
100.00 OECD TALIS
5.1.1 -Existence of a legal frameworks governing gender equality
100.00OECD Gender Institutions and Development Database
5.1.2 - Gender wage gap 0.00OECD Employment database
5.2.1 -Physical and/or sexual violence by a partner in the 12 months prior to the interview
0.00FRA gender-based violence against women survey dataset
5.2.2 -Sexual violence by a non-partner in the 12 months prior to the interview
0.00FRA gender-based violence against women survey dataset
5.4 Recognize and value unpaid care and domestic work through the provision of public services, infrastructure and social protection policies and the promotion of shared responsibility within the household and the family as nationally appropriate
5.4.1Time spent on unpaid domestic and care work
Gender difference in time spent on unpaid work
0.00OECD based on National Time Use Surveys
5.5.1Proportion of seats held by women in national parliaments
Share of seats in national parliaments held by women
50.00OECD based on Inter-Parliamentary Union’s PARLINE database
5.5.2 Proportion of women in managerial positionsShare of seats on boards of the largest publicly listed companies held by women
50.00OECD based on European Commission and Catalyst Census
5.a.1 - Share of female agricultural holders 50.00 FAO
6.1 By 2030, achieve universal and equitable access to safe and affordable drinking water for all
6.1.1Proportion of population using improved drinking water sources
UN-STAT 100.00 UN-STAT
6.2 By 2030, achieve access to adequate and equitable sanitation and hygiene for all and end open defecation, paying special attention to the needs of women and girls and those in vulnerable situations
6.2.1Proportion of population using improved sanitation facilities
UN-STAT 100.00 UN-STAT
6.3.1 -Share of the population not connected to wastewater treatment
6.95 (**)OECD Environment Statistics
Goal 6. Ensure availability and sustainable management of water and sanitation for all
6.3 By 2030, improve water quality by reducing pollution, eliminating dumping and minimizing release of hazardous chemicals and materials, halving the proportion of untreated wastewater and substantially increasing recycling and safe reuse globally
5.2 Eliminate all forms of violence against all women and girls in the public and private spheres, including trafficking and sexual and other types of exploitation
5.5 Ensure women’s full and effective participation and equal opportunities for leadership at all levels of decision-making in political, economic and public life
5.a Undertake reforms to give women equal rights to economic resources, as well as access to ownership and control over land and other forms of property, financial services, inheritance and natural resources, in accordance with national laws
5.1 End all forms of discrimination against all women and girls everywhere
Goal 5. Achieve gender equality and empower all women and girls
26

Target Code Indicator for global monitoring OECD indicator SourceTarget
6.4.2Level of water stress: freshwater withdrawal as a proportion of available freshwater resources
Water stress 10.00OECD Environment Statistics
6.a By 2030, expand international cooperation and capacity-building support to developing countries in water- and sanitation-related activities and programmes, including water harvesting, desalination, water efficiency, wastewater treatment, recycling and reuse technologies
6.a.1Total official flows for water supply and sanitation, by recipient
Official Development Assistance to water supply
0.02OECD/DAC Creditor Reporting System (CRS) database
7.1.1Proportion of population with access to electricity
UN-STAT 100.00 UN-STAT
7.1.2Proportion of population with primary reliance on clean fuels and technology
UN-STAT 97.50 (*) UN-STAT
7.2.1Renewable energy share in the total final energy consumption
UN-STAT 25.18 (**) UN-STAT
7.2.2 -Renewable electricity share in total electricity generation
38.65 (**)IEA World Energy Statistics
7.3 By 2030, double the global rate of improvement in energy efficiency
7.3.1 Energy intensity level of primary energy Energy productivity 18949.33 (**)IEA World Energy Statistics
7.a By 2030, enhance international cooperation to facilitate access to clean energy research and technology, including renewable energy, energy efficiency and advanced and cleaner fossil-fuel technology, and promote investment in energy infrastructure and clean energy technology
7.a.1 -Official Development Assistance to clean energy
0.04OECD/DAC Creditor Reporting System (CRS) database
8.1 Sustain per capita economic growth in accordance with national circumstances and, in particular, at least 7 per cent gross domestic product growth per annum in the least developed countries
8.1.1 Growth rate of real GDP per capita Growth in GDP per capita= 3.86 (*)OECD National Accounts Statistics
8.2 Achieve higher levels of economic productivity through diversification, technological upgrading and innovation, including through a focus on high-value added and labour-intensive sectors
8.2.1Growth rate of real GDP per employed person
Growth in GDP per hour worked 3.78 (*)OECD Productivity statistics
8.4.1 Material footprint per unit of GDP UN-STAT 12.93 (*) UN-STAT
8.4.2Domestic material consumption per unit of GDP
UN-STAT 0.31 (*) UN-STAT
8.4.3 - Demand based CO2 productivity 5.08 (*)OECD Carbon Dioxide Emissions Embodied in International Trade
8.5.1 - Earnings quality 27.85 (*)OECD Job Quality database
8.5.2 Unemployment rate Unemployment rate 4.56 (*)OECD Employment database
8.6 By 2020, substantially reduce the proportion of youth not in employment, education or training
8.6.1Proportion of youth not in education, employment or training
Share of youth not in education employment or training
0.00OECD based on Labour Force Surveys
8.8.2 - Job strain 0.00OECD Job Quality database
8.10.2
Proportion of adults (15 years and older) with an account at a bank or other financial institution or with a mobile-money-service provider
UN-STAT 99.46 (*) UN-STAT
8.a Increase Aid for Trade support for developing countries, in particular least developed countries, including through the Enhanced Integrated Framework for Trade-related Technical Assistance to Least Developed Countries
8.a.1Total official flows disbursed for Aid for Trade, by donor
Official Development Assistance to trade 0.00OECD/DAC Creditor Reporting System (CRS) database
9.2.1Manufacturing value added share in GDP at constant 2010 United States dollars
UN-STAT 20.44 (*) UN-STAT
9.2.2Manufacturing employment as a proportion of total employment
UN-STAT 17.20 (*) UN-STAT
Goal 7. Ensure access to affordable, reliable, sustainable and modern energy for all
Goal 8. Promote sustained, inclusive and sustainable economic growth, full and productive employment and decent work for all
Goal 9. Build resilient infrastructure, promote inclusive and sustainable industrialization and foster innovation
9.2 Promote inclusive and sustainable industrialization and, by 2030, significantly raise industry’s share of employment and gross domestic product, in line with national circumstances, and double its share in least developed countries
6.4 By 2030, substantially increase water-use efficiency across all sectors and ensure sustainable withdrawals and supply of freshwater to address water scarcity and substantially reduce the number of people suffering from water scarcity
7.1 By 2030, ensure universal access to affordable, reliable and modern energy services
7.2 By 2030, increase substantially the share of renewable energy in the global energy mix
8.4 Improve progressively, through 2030, global resource efficiency in consumption and production and endeavour to decouple economic growth from environmental degradation, in accordance with the 10‑Year Framework of Programmes on Sustainable Consumption and Production, with developed countries taking the lead
8.8 Protect labour rights and promote safe and secure working environments for all workers, including migrant workers, in particular women migrants, and those in precarious employment
8.10 Strengthen the capacity of domestic financial institutions to encourage and expand access to banking, insurance and financial services for all
8.5 By 2030, achieve full and productive employment and decent work for all women and men, including for young people and persons with disabilities, and equal pay for work of equal value
27

Target Code Indicator for global monitoring OECD indicator SourceTarget
9.4 By 2030, upgrade infrastructure and retrofit industries to make them sustainable, with increased resource-use efficiency and greater adoption of clean and environmentally sound technologies and industrial processes, with all countries taking action in accordance with their respective capabilities
9.4.1Emissions of carbon dioxide per unit of GDP (PPP)
Fossil fuel productivity 21.70 (*)IEA World Energy Statistics
9.5.1Research and development (R&D) expenditure as a proportion of GDP
Gross domestic expenditure on R&D 3.34 (*)OECD Science, Technology and R&D Statistics
9.5.2Researchers (in full-time equivalent) per
million inhabitantsShare of researchers within the labour force 12.38 (*)
OECD Science, Technology and R&D Statistics
9.a Facilitate sustainable and resilient infrastructure development in developing countries through enhanced financial, technological and technical support to African countries, least developed countries, landlocked developing countries and small island developing States
9.a.1Total official flows for infrastructure, by recipient
Official Development Assistance and Other Official Flows to economic infrastructure and Services
0.08OECD/DAC Creditor Reporting System (CRS) database
9.b Support domestic technology development, research and innovation in developing countries, including by ensuring a conducive policy environment for, inter alia, industrial diversification and value addition to commodities
9.b.1Proportion of medium and high-tech industry value added in total value added
UN-STAT 0.60 (*) UN-STAT
9.c Significantly increase access to information and communications technology and strive to provide universal and affordable access to the Internet in least developed countries by 2020
9.c.1Proportion of population covered by a 3G mobile network
UN-STAT 100.00 UN-STAT
10.1 By 2030, progressively achieve and sustain income growth of the bottom 40 per cent of the population at a rate higher than the national average
10.1.1Growth rates of household expenditure or income per capita among the bottom 40 per cent of the population
Annual growth of the income share of the bottom 40%
0.22 (*)OECD Income Distribution Database
10.2.1 - Gender gap in relative poverty headcount 0.00OECD Income Distribution Database
10.2.2 - Age gap in relative poverty headcount 0.00OECD Income Distribution Database
10.4.1Labour share of GDP, comprising wages and social protection transfers
UN-STAT 30.53 (*) UN-STAT
10.4.2 -Redistribution of income through taxes and transfers
0.45 (*)OECD Income Distribution Database
10.7.1 -Difference in unemployment rates between migrants and natives
0.00OECD based on Labour Force Surveys
10.b Encourage official development assistance and financial flows, including foreign direct investment, to States where the need is greatest, in particular least developed countries, African countries, small island developing States and landlocked developing countries, in accordance with their national plans and programmes
10.b.1 Total assistance for development, by donorOfficial Development Assistance to Least Developed Countries (LDCs) and Small Island Developing States (SIDs)
0.14OECD/DAC Creditor Reporting System (CRS) database
11.1.2 - Rooms per person 2.33 (*)OECD based on EU-SILC and national surveys
11.6.1 - Municipal waste generated per capita 313.60 (*)OECD Environment Statistics
11.6.2Annual mean levels of fine particulate matter (PM2.5) in cities (population weighted)
Exposure to fine particulate matter (PM2.5) 10.00OECD Regional Well-Being Statistics
11.b.2National and local disaster risk reduction strategies
UN-STAT 1.00 UN-STAT
12.2.1 Material footprint per unit of GDP UN-STAT 12.93 (*) UN-STAT
12.2.2Domestic material consumption per unit of GDP
Non energy material productivity 2.89 (*)OECD Environment Statistics
Goal 11. Make cities and human settlements inclusive, safe, resilient and sustainable
Goal 12. Ensure sustainable consumption and production patterns
Goal 10. Reduce inequality within and among countries
9.5 Enhance scientific research, upgrade the technological capabilities of industrial sectors in all countries, in particular developing countries, including, by 2030, encouraging innovation and substantially increasing the number of research and development workers per 1 million people and public and private research and development spending
11.b By 2020, substantially increase the number of cities and human settlements adopting and implementing integrated policies and plans towards inclusion, resource efficiency, mitigation and adaptation to climate change, resilience to disasters, and develop and implement, in line with the Sendai Framework for Disaster Risk Reduction 2015-2030, holistic disaster risk management at all levels
12.2 By 2030, achieve the sustainable management and efficient use of natural resources
11.1 By 2030, ensure access for all to adequate, safe and affordable housing and basic services and upgrade slums
11.6 By 2030, reduce the adverse per capita environmental impact of cities, including by paying special attention to air quality and municipal and other waste management
10.2 By 2030, empower and promote the social, economic and political inclusion of all, irrespective of age, sex, disability, race, ethnicity, origin, religion or economic or other status
10.7 Facilitate orderly, safe, regular and responsible migration and mobility of people, including through the implementation of planned and well-managed migration policies
10.4 Adopt policies, especially fiscal, wage and social protection policies, and progressively achieve greater equality
28

Target Code Indicator for global monitoring OECD indicator SourceTarget
12.5 By 2030, substantially reduce waste generation through prevention, reduction, recycling and reuse
12.5.1 - Recycling rate of municipal waste 56.19 (*)OECD Environment Statistics
12.c Rationalize inefficient fossil-fuel subsidies that encourage wasteful consumption by removing market distortions, in accordance with national circumstances, including by restructuring taxation and phasing out those harmful subsidies, where they exist, to reflect their environmental impacts, taking fully into account the specific needs and conditions of developing countries and minimizing the possible adverse impacts on their development in a manner that protects the poor and the affected communities
12.c.1 -Total consumer support expressed as a share of the energy component of environmentally related tax revenues
0.00OECD Agriculture Statistics Database
13.1.1National and local disaster risk reduction strategies
UN-STAT 1.00 UN-STAT
13.2 Integrate climate change measures into national policies, strategies and planning
13.2.1 - Production based CO2 productivity 7.66 (*)IEA CO2 emissions from fuel combustion statistics
13.a Implement the commitment undertaken by developed-country parties to the United Nations Framework Convention on Climate Change to a goal of mobilizing jointly $100 billion annually by 2020 from all sources to address the needs of developing countries in the context of meaningful mitigation actions and transparency on implementation and fully operationalize the Green Climate Fund through its capitalization as soon as possible
13.a.1 -Bilateral climate-related Official Development Assistance
0.12OECD/DAC Creditor Reporting System (CRS) database
14.5 By 2020, conserve at least 10 per cent of coastal and marine areas, consistent with national and international law and based on the best available scientific information
14.5.1Coverage of protected areas in relation to marine areas
UN-STAT 10.00 UN-STAT
15.1.1Forest area as a proportion of total land area
UN-STAT 17.00 UN-STAT
15.1.2Proportion of important sites for terrestrial biodiversity that are covered by protected areas
UN-STAT 45.16 (*) UN-STAT
15.2 By 2020, promote the implementation of sustainablemanagement of all types of forests, halt deforestation, restore degraded forests and substantially increase afforestation and reforestation globally
15.2.1 - Intensity of use of forest resources 100.00OECD Environment Statistics
15.4.1Coverage by protected areas of important sites for mountain biodiversity
UN-STAT 58.82 (*) UN-STAT
15.5 Take urgent and significant action to reduce the degradation of natural habitats, halt the loss of biodiversity and, by 2020, protect and prevent the extinction of threatened species
15.5.1 Red List Index UN-STAT 1.00 UN-STAT
15.a Mobilize and significantly increase financial resources from all sources to conserve and sustainably use biodiversity and ecosystems
15.a.1Total official development assistance for biodiversity, by donor
Official Development Assistance to biodiversity
0.04OECD/DAC Creditor Reporting System (CRS) database
15.b Mobilize significant resources from all sources and at all levels to finance sustainable forest management and provide adequate incentives to developing countries to advance such management, including for conservation and reforestation
15.b.1Total official development assistance for biodiversity, by donor
Official Development Assistance and Other Official Flows to support to forestry
0.00OECD/DAC Creditor Reporting System (CRS) database
16.1.1Number of victims of intentional homicide per 100,000 population
Deaths from assault 0.00 OECD Health Data
16.1.4 -Share of population that feel safe walking alone at night where they live
100.00 Gallup
16.3.2Unsentenced detainees as a proportion of overall prison population
UN-STAT 11.52 (*) UN-STAT
16.5.1 -Share of the population perceiving corruption to be widespread throughout the government
0.00OECD based on Gallup World Poll
Goal 13. Take urgent action to combat climate change and its impacts
Goal 14. Conserve and sustainably use the oceans, seas and marine resources for sustainable development
Goal 15. Protect, restore and promote sustainable use of terrestrial ecosystems, sustainably manage forests, combat desertification, and halt and reverse land degradation and halt
16.5 Substantially reduce corruption and bribery in all their forms
15.1 By 2020, ensure the conservation, restoration and sustainable use of terrestrial and inland freshwater ecosystems and their services, in particular forests, wetlands, mountains and drylands, in line with obligations under international agreements
15.4 By 2030, ensure the conservation of mountain ecosystems, including their biodiversity, in order to enhance their capacity to provide benefits that are essential for sustainable development
16.1 Significantly reduce all forms of violence and related death rates everywhere
16.3 Promote the rule of law at the national and international levels and ensure equal access to justice for all
Goal 16. Promote peaceful and inclusive societies for sustainable development, provide access to justice for all and build effective, accountable and inclusive institutions at all levels
13.1 Strengthen resilience and adaptive capacity to climate-related hazards and natural disasters in all countries
29

Target Code Indicator for global monitoring OECD indicator SourceTarget
16.6.1 - Confidence in national institutions index 100.00OECD based on Gallup World Poll
16.6.2 -Index of use of regulatory impact analysis in government decisions
4.00OECD Regulatory Indicators Survey
16.6.3 -Index of use of ex-post evaluation in government decisions
4.00OECD Regulatory Indicators Survey
16.7.1 -Index of use of stakeholder engagement in government decisions
4.00OECD Regulatory Indicators Survey
16.9 By 2030, provide legal identity for all, including birth registration
16.9.1Proportion of births registered with a civil authority
UN-STAT 100.00 UN-STAT
16.10.1
Number of cases of killing, kidnapping, enforced disappearance, arbitrary detention and torture of journalists, associated media personnel, trade unionists and human rights advocates in last 12 months
UN-STAT 0.00 UN-STAT
16.a Strengthen relevant national institutions, including through international cooperation, for building capacity at all levels, in particular in developing countries, to prevent violence and combat terrorism and crime
16.a.1 -Official Development Assistance and Other Official Flows to conflict peace security
0.01OECD/DAC Creditor Reporting System (CRS) database
17.1.1 -Total general government revenue as a percentage of GDP
52.02 (*)OECD National Accounts Statistics
17.2 Developed countries to implement fully their official development assistance commitments, including the commitment by many developed countries to achieve the target of 0.7 per cent of gross national income for official development assistance (Official Development Assistance/GNI) to developing countries and 0.15 to 0.20 per cent of Official Development Assistance/GNI to least developed countries; Official Development Assistance providers are encouraged to consider setting a target to provide at least 0.20 per cent of Official Development Assistance/GNI to least developed countries
17.2.1Net official development assistance (Official Development Assistance) as a Percentage of OECD-DAC donors' GNI, by donor
Net Official Development Assistance as a percentage of GNI
0.70OECD/DAC Creditor Reporting System (CRS) database
17.3.2Volume of remittances (in United States dollars) as a proportion of total GDP
UN-STAT 2.13 (*) UN-STAT
17.6.2Fixed Internet broadband Subscriptions per 100 inhabitants
UN-STAT 38.08 (*) UN-STAT
17.8 Fully operationalize the technology bank and science, technology and innovation capacity-building mechanism for least developed countries by 2017 and enhance the use of enabling technology, in particular information and communications technology
17.8.1 Proportion of individuals using the Internet Share of the population using internet 100.00
OECD ICT Access and Usage by Households and Individuals database
17.9 Enhance international support for implementing effective and targeted capacity-building in developing countries to support national plans to implement all the Sustainable Development Goals, including through NorthSouth, South-South and triangular cooperation
17.9.1
Dollar value of financial and technical assistance (including through North-South, South-South and triangular cooperation) disbursed to developing countries
Official Development Assistance and Other Official Flows focused on capacity building and national planning
0.06OECD/DAC Creditor Reporting System (CRS) database
17.19.1Dollar value of all resources made available to strengthen statistical capacity in developing countries
Official Development Assistance commitments to statistical capacity building
0.00 PARIS21
Note: These inidcators were selected after consideration of the UN Global indicator framework and according to the criteria disscussed in section 4.(*): the target is set as the level prevailing in the top 10% of OECD countries with the best performance.(**): the target is set as a fraction or multiple of the score of the OECD median country in the reference year.UN-STAT - refers to indicators coming from the SDG Indicators Global Database (https://unstats.un.org/sdgs/indicators/database)
Goal 17. Strengthen the means of implementation and revitalize the Global Partnership for Sustainable Development
16.6 Develop effective, accountable and transparent institutions at all levels
16.7 Ensure responsive, inclusive, participatory and representative decision-making at all levels
16.10 Ensure public access to information and protect fundamental freedoms, in accordance with national legislation and international agreements
17.1 Strengthen domestic resource mobilization, including through international support to developing countries, to improve domestic capacity for tax and other revenue collection
17.3 Mobilize additional financial resources for developing countries from multiple sources
17.6 Enhance North-South, South-South and triangular regional and international cooperation on and access to science, technology and innovation and enhance knowledge-sharing on mutually agreed terms, including through improved coordination among existing mechanisms, in particular at the United Nations level, and through a global technology facilitation mechanism
17.19 By 2030, build on existing initiatives to develop measurements of progress on sustainable development that complement gross domestic product, and support statistical capacity-building in developing countries
30

ANNEX II: SELECTED COUNTRY PROFILES

32
MEASURING DISTANCE TO THE SDGs TARGETS – BELGIUM
Based on the 126 available indicators allowing coverage of 93 of the 169 SDG targets, Belgium has currently achieved 11 of the 2030 targets. The remaining distances to achieve the targets are small in several areas, but challenges remain (Figure 1).
Figure 1. Belgium’s current distance from achieving SDGs’ 2030 targets
Note: The chart shows how far Belgium has already progressed towards each available target. The longer the bars the shorter the distance is to be travelled by 2030. Targets are clustered by goal, and goals are clustered by the “5Ps” of the 2030 Agenda (outer circle).
These results rely on the best comparative indicators currently available in various OECD and UN databases, in line with the UN global indicator framework. However, a number of important data gaps need to be addressed to enable a more complete assessment. For Belgium, health and education are the only goals with full target coverage while sustainable production, oceans and cities have less than 30% of their targets covered (Figure 2).
Figure 2. The statistical agenda ahead: Belgium’s data coverage Percentage of targets for which there is at least one indicator by goals and the 5Ps of the 2030 Agenda,
compared with the OECD total
Note: The global indicator framework developed by the UN Inter-Agency and Expert Group on SDG Indicators and adopted by the UN Statistical Commission in March 2017 agreed upon 232 indicators to measure the 169 targets. Reflecting data availability, this study considers 131 indicators covering 98 targets.
0
25
50
75
100
0
25
50
75
100OECD total

33
Belgium is on average closest to reaching goals on water and oceans (Goals 6 and 14). It also has very good outcomes in some of the Prosperity goals as well as on Partnerships (Figure 3).
Relative to the OECD average, Belgium outperforms on goals such as gender equality and implementation (Goals 4 and 17), and is either ahead of, or fairly close to, the OECD average distance on many other goals (Figure 3). The main exception to this are sustainable production and climate (Goals 12 and 13), and to a lesser extent on most Planet goals, where performance is below the OECD average.
Figure 3. Belgium’s current distance from reaching the goals and the 5Ps of the 2030 Agenda, compared with the OECD average
Note: This figure shows Belgium’s distance to travel towards each of the 17 goals of the 2030 Agenda. Bars show Belgium’s performance, while diamonds show the OECD average. White bars indicate missing data. The y-axis indicates the distance from reaching the target in standardised units. 0 indicates that the level for 2030 has already been attained, and the axis starts at 3 as most OECD countries have already attained this level. Distances to target are aggregated at the goal level (all targets weighted equally). To make the level of achievement within the country more distinct, in this figure, data on Official Development Assistance (ODA) are excluded in Goals 1 to 16. Nonetheless, total ODA, ODA focusing on capacity building and national planning as well as ODA commitments to statistical capacity building are included in Goal 17 “implementation” and under Partnership.
GLOBAL CONTRIBUTION TO THE 2030 AGENDA
Belgium’s performance on some SDG targets pertaining to global contributions
Note: This figure shows Belgium’s distance to travel towards some SDG targets pertaining to global contributions. Bars show Belgium’s performance while diamonds show the OECD average. White bars indicate missing data.
Indicators can also be grouped to examine OECD countries’ global contribution to the 2030 Agenda. This may help countries consider how they influence – positively or negatively, intentionally or unintentionally – the ability of other countries to achieve their goals.
As a starting point, this study considers Official Development Assistance (ODA), support to national agricultural producers, and demand-based CO2 productivity. Future work will aim to develop a fuller assessment, considering a wider range of “transboundary” impacts
Belgium performs around the OECD average in terms of ODA flows but is further away from meeting target on demand-based CO2 productivity. Data on producer support (i.e. subsidies to agricultural producers) are not available.
0.00
0.50
1.00
1.50
2.00
2.50
3.00
Pove
rty
Food
Healt
h
Educ
ation
Gend
er E
quali
ty
Wate
r
Susta
inable
Pro
ducti
on
Clim
ate
Ocea
ns
Biod
iversi
ty
Ener
gy
Econ
omy
Infra
struc
ture
Inequ
ality
Citie
s
Institu
tions
Imple
menta
tion .
People Planet Prosperity Peace Partnership
0.00
0.50
1.00
1.50
2.00
2.50
3.00Average ODA Score Demand-based CO2
productivityUnsubsidised
agricultural production
BEL OECD

34
MEASURING DISTANCE TO THE SDGs TARGETS – THE CZECH REPUBLIC
Based on the 128 available indicators allowing coverage of 95 of the 169 SDG targets, the Czech Republic has currently achieved 15 of the 2030 targets. The remaining distances to achieve the targets are small in several areas, but challenges remain (Figure 1).
Figure 1. The Czech Republic’s current distance from achieving SDGs’ 2030 targets
Note: The chart shows how far the Czech Republic has already progressed towards each available target. The longer the bars the shorter the distance is to be travelled by 2030. Targets are clustered by goal, and goals are clustered by the “5Ps” of the 2030 Agenda (outer circle). These results rely on the best comparative indicators currently available in various OECD and UN databases, in line with the UN global indicator framework. However, a number of important data gaps need to be addressed to enable a more complete assessment. For the Czech Republic, health and education are the only goals with full target coverage while sustainable production, oceans and cities have less than 30% of their targets covered (Figure 2).
Figure 2. The statistical agenda ahead: the Czech Republic’s data coverage
Percentage of targets for which there is at least one indicator by goals and the 5Ps of the 2030 Agenda, compared with the OECD total
Note: The global indicator framework developed by the UN Inter-Agency and Expert Group on SDG Indicators and adopted by the UN Statistical Commission in March 2017 agreed upon 232 indicators to measure the 169 targets. Reflecting data availability, this study considers 131 indicators covering 98 targets.
0
25
50
75
100
0
25
50
75
100OECD total

35
The Czech Republic is on average closest to reaching all goals in the Planet category (Figure 3). It also has very good outcomes in some of the Prosperity goals as well as on poverty. However, it is further away from reaching other goals, most notably on gender equality, food and education (Goals 5, 2 and 4, respectively). Relative to the OECD average, the Czech Republic outperforms on goals such as biodiversity and poverty (Goals 15 and 1), and is either ahead of, or fairly close to, the OECD average distance on several other goals (Figure 3). The main exceptions to this are gender equality and energy, and to a lesser extent food, health, climate and the means of implementation (Goals 5, 7, 2, 3, 13 17 respectively), where performance is below the OECD average.
Figure 3. The Czech Republic’s current distance from reaching the goals and the 5Ps of the 2030 Agenda, compared with the OECD average
Note: This figure shows The Czech Republic’s distance to travel towards each of the 17 goals of the 2030 Agenda. Bars show The Czech Republic’s performance, while diamonds show the OECD average. White bars indicate missing data. The y-axis indicates the distance from reaching the target in standardised units. 0 indicates that the level for 2030 has already been attained, and the axis starts at 3 as most OECD countries have already attained this level. Distances to target are aggregated at the goal level (all targets weighted equally). To make the level of achievement within the country more distinct, in this figure, data on Official Development Assistance (ODA) are excluded in Goals 1 to 16. Nonetheless, total ODA, ODA focusing on capacity building and national planning as well as ODA commitments to statistical capacity building are included in Goal 17 “implementation” and under Partnership.
GLOBAL CONTRIBUTION TO THE 2030 AGENDA
The Czech Republic’s performance on some SDG targets pertaining to global contributions
Note: This figure shows the Czech Republic’s distance to travel towards some SDG targets pertaining to global contributions. Bars show the Czech Republic’s performance while diamonds show the OECD average. White bars indicate missing data.
Indicators can also be grouped to examine OECD countries’ global contribution to the 2030 Agenda. This may help countries consider how they influence – positively or negatively, intentionally or unintentionally – the ability of other countries to achieve their goals.
As a starting point, this study considers Official Development Assistance (ODA), support to national agricultural producers, and demand-based CO2 productivity. Future work will aim to develop a fuller assessment, considering a wider range of “transboundary” impacts
The Czech Republic performs significantly below the OECD average in terms of ODA flows and demand-based CO2 productivity. Data on producer support (i.e. subsidies to agricultural producers) are not available.
0.00
0.50
1.00
1.50
2.00
2.50
3.00
Pove
rty
Food
Healt
h
Educ
ation
Gend
er E
quali
ty
Wate
r
Susta
inable
Pro
ducti
on
Clim
ate
Ocea
ns
Biod
iversi
ty
Ener
gy
Econ
omy
Infra
struc
ture
Inequ
ality
Citie
s
Institu
tions
Imple
menta
tion .
People Planet Prosperity Peace Partnership
0.00
0.50
1.00
1.50
2.00
2.50
3.00Average ODA Score Demand-based CO2
productivityUnsubsidised
agricultural production
CZE OECD

36
MEASURING DISTANCE TO THE SDGs TARGETS – DENMARK
Based on the 127 available indicators allowing coverage of 94 of the 169 SDG targets, Denmark has currently achieved 26 of the 2030 targets. The remaining distances to achieve the targets are small in most areas, but some challenges remain (Figure 1).
Figure 1. Denmark’s current distance from achieving SDGs’ 2030 targets
Note: The chart shows how far Denmark has already progressed towards each available target. The longer the bars the shorter the distance is to be travelled by 2030. Targets are clustered by goal, and goals are clustered by the “5Ps” of the 2030 Agenda (outer circle). These results rely on the best comparative indicators currently available in various OECD and UN databases, in line with the UN global indicator framework. However, a number of important data gaps need to be addressed to enable a more complete assessment. For Denmark, health and education are the only goals with full target coverage while sustainable production, oceans and cities have less than 30% of their targets covered (Figure 2).
Figure 2. The statistical agenda ahead: Denmark’s data coverage
Percentage of targets for which there is at least one indicator by goals and the 5Ps of the 2030 Agenda, compared with the OECD total
Note: The global indicator framework developed by the UN Inter-Agency and Expert Group on SDG Indicators and adopted by the UN Statistical Commission in March 2017 agreed upon 232 indicators to measure the 169 targets. Reflecting data availability, this study considers 131 indicators covering 98 targets.
0
25
50
75
100
0
25
50
75
100OECD total

37
Denmark is on average closest to reaching all goals in the Planet category (Figure 3). It also has very good outcomes in most of the Prosperity goals as well as on Partnership. However, it is further away from reaching other goals, most notably on gender equality (Goal 5). Relative to the OECD average, Denmark outperforms on most goals such as poverty, energy and implementation (Goals 1, 7 and 17), and is around the OECD average distance on a few other goals (Figure 3).
Figure 3. Denmark’s current distance from reaching the goals and the 5Ps of the 2030 Agenda, compared with the OECD average
Note: This figure shows Denmark’s distance to travel towards each of the 17 goals of the 2030 Agenda. Bars show Denmark’s performance, while diamonds show the OECD average. White bars indicate missing data. The y-axis indicates the distance from reaching the target in standardised units. 0 indicates that the level for 2030 has already been attained, and the axis starts at 3 as most OECD countries have already attained this level. Distances to target are aggregated at the goal level (all targets weighted equally). To make the level of achievement within the country more distinct, in this figure, data on Official Development Assistance (ODA) are excluded in Goals 1 to 16. Nonetheless, total ODA, ODA focusing on capacity building and national planning as well as ODA commitments to statistical capacity building are included in Goal 17 “implementation” and under Partnership.
GLOBAL CONTRIBUTION TO THE 2030 AGENDA
Denmark’s performance on some SDG targets pertaining to global contributions
Note: This figure shows Denmark’s distance to travel towards some SDG targets pertaining to global contributions. Bars show Denmark’s performance while diamonds show the OECD average. White bars indicate missing data.
Indicators can also be grouped to examine OECD countries’ global contribution to the 2030 Agenda. This may help countries consider how they influence – positively or negatively, intentionally or unintentionally – the ability of other countries to achieve their goals.
As a starting point, this study considers Official Development Assistance (ODA), support to national agricultural producers, and demand-based CO2 productivity. Future work will aim to develop a fuller assessment, considering a wider range of “transboundary” impacts
Denmark performs above the OECD average in terms of ODA flows and demand-based CO2 productivity. Data on producer support (i.e. subsidies to agricultural producers) are not available.
0.00
0.50
1.00
1.50
2.00
2.50
3.00
Pove
rty
Food
Healt
h
Educ
ation
Gend
er E
quali
ty
Wate
r
Susta
inable
Pro
ducti
on
Clim
ate
Ocea
ns
Biod
iversi
ty
Ener
gy
Econ
omy
Infra
struc
ture
Inequ
ality
Citie
s
Institu
tions
Imple
menta
tion .
People Planet Prosperity Peace Partnership
0.00
0.50
1.00
1.50
2.00
2.50
3.00Average ODA Score Demand-based CO2
productivityUnsubsidised
agricultural production
DNK OECD
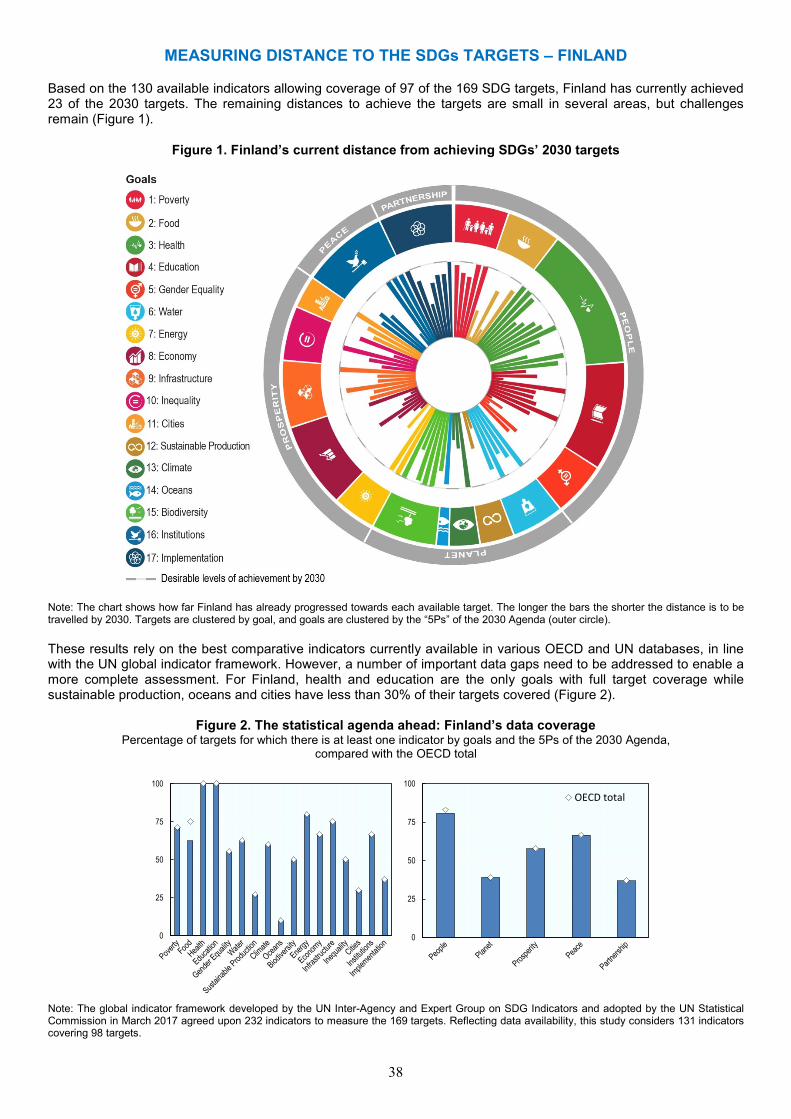
38
MEASURING DISTANCE TO THE SDGs TARGETS – FINLAND
Based on the 130 available indicators allowing coverage of 97 of the 169 SDG targets, Finland has currently achieved 23 of the 2030 targets. The remaining distances to achieve the targets are small in several areas, but challenges remain (Figure 1).
Figure 1. Finland’s current distance from achieving SDGs’ 2030 targets
Note: The chart shows how far Finland has already progressed towards each available target. The longer the bars the shorter the distance is to be travelled by 2030. Targets are clustered by goal, and goals are clustered by the “5Ps” of the 2030 Agenda (outer circle). These results rely on the best comparative indicators currently available in various OECD and UN databases, in line with the UN global indicator framework. However, a number of important data gaps need to be addressed to enable a more complete assessment. For Finland, health and education are the only goals with full target coverage while sustainable production, oceans and cities have less than 30% of their targets covered (Figure 2).
Figure 2. The statistical agenda ahead: Finland’s data coverage
Percentage of targets for which there is at least one indicator by goals and the 5Ps of the 2030 Agenda, compared with the OECD total
Note: The global indicator framework developed by the UN Inter-Agency and Expert Group on SDG Indicators and adopted by the UN Statistical Commission in March 2017 agreed upon 232 indicators to measure the 169 targets. Reflecting data availability, this study considers 131 indicators covering 98 targets.
0
25
50
75
100
0
25
50
75
100OECD total

39
Finland is on average closest to reaching some goals in the Planet category (Figure 3). It also has very good outcomes in some goals in the other categories. However, it is further away from reaching other goals, most notably on sustainable production and gender equality (Goals 12 and 5). Relative to the OECD average, Finland outperforms on goals such as poverty, education and biodiversity (Goals 1,4 and 15), and is either ahead of, or fairly close to, the OECD average distance on many other goals (Figure 3). The main exception to this is sustainable production, and to a lesser extent food and energy, where performance is below the OECD average (Goals 12, 2 and 7).
Figure 3. Finland’s current distance from reaching the goals and the 5Ps of the 2030 Agenda, compared with the OECD average
Note: This figure shows Finland’s distance to travel towards each of the 17 goals of the 2030 Agenda. Bars show Finland’s performance, while diamonds show the OECD average. White bars indicate missing data. The y-axis indicates the distance from reaching the target in standardised units. 0 indicates that the level for 2030 has already been attained, and the axis starts at 3 as most OECD countries have already attained this level. Distances to target are aggregated at the goal level (all targets weighted equally). To make the level of achievement within the country more distinct, in this figure, data on Official Development Assistance (ODA) are excluded in Goals 1 to 16. Nonetheless, total ODA, ODA focusing on capacity building and national planning as well as ODA commitments to statistical capacity building are included in Goal 17 “implementation” and under Partnership.
GLOBAL CONTRIBUTION TO THE 2030 AGENDA
Finland’s performance on some SDG targets pertaining to global contributions
Note: This figure shows Finland’s distance to travel towards some SDG targets pertaining to global contributions. Bars show Finland’s performance while diamonds show the OECD average. White bars indicate missing data.
Indicators can also be grouped to examine OECD countries’ global contribution to the 2030 Agenda. This may help countries consider how they influence – positively or negatively, intentionally or unintentionally – the ability of other countries to achieve their goals.
As a starting point, this study considers Official Development Assistance (ODA), support to national agricultural producers, and demand-based CO2 productivity. Future work will aim to develop a fuller assessment, considering a wider range of “transboundary” impacts
Finland performs around the OECD average in terms of ODA flows but is below average on demand-based CO2 productivity. Data on producer support (i.e. subsidies to agricultural producers) are not available.
0.00
0.50
1.00
1.50
2.00
2.50
3.00
Pove
rty
Food
Healt
h
Educ
ation
Gend
er E
quali
ty
Wate
r
Susta
inable
Pro
ducti
on
Clim
ate
Ocea
ns
Biod
iversi
ty
Ener
gy
Econ
omy
Infra
struc
ture
Inequ
ality
Citie
s
Institu
tions
Imple
menta
tion .
People Planet Prosperity Peace Partnership
0.00
0.50
1.00
1.50
2.00
2.50
3.00Average ODA Score Demand-based CO2
productivityUnsubsidised
agricultural production
FIN OECD

40
MEASURING DISTANCE TO THE SDGs TARGETS – ITALY
Based on the 128 available indicators allowing coverage of 96 of the 169 SDG targets, Italy has currently achieved 11 of the 2030 targets. In several areas, the remaining distances to achieve the targets are small, but challenges remain (Figure 1).
Figure 1. Italy’s current distance from achieving SDGs’ 2030 targets
Note: The chart shows how far Italy has already progressed towards each available target. The longer the bars the shorter the distance is to be travelled by 2030. Targets are clustered by goal, and goals are clustered by the “5Ps” of the 2030 Agenda (outer circle). These results rely on the best comparative indicators currently available in various OECD and UN databases, in line with the UN global indicator framework. However, a number of important data gaps need to be addressed to enable a more complete assessment. For Italy, health and education are the only goals with full target coverage while sustainable production, oceans and cities have less than 30% of their targets covered (Figure 2).
Figure 2. The statistical agenda ahead: Italy’s data coverage
Percentage of targets for which there is at least one indicator by goals and the 5Ps of the 2030 Agenda, compared with the OECD total
Note: The global indicator framework developed by the UN Inter-Agency and Expert Group on SDG Indicators and adopted by the UN Statistical Commission in March 2017 agreed upon 232 indicators to measure the 169 targets. Reflecting data availability, this study considers 131 indicators covering 98 targets.
0
25
50
75
100
0
25
50
75
100OECD total

41
Italy is on average closest to reaching all goals in the Planet category (Figure 3). It also has very good outcomes in the energy goal (Goal 7). However, it is further away from reaching other goals, most notably on education and economy (Goals 4 and 8). Relative to the OECD average, Italy outperforms on goals such as sustainable production and climate (Goals 12 and 13), and is either ahead of, or fairly close to, the OECD average distance on some other goals (Figure 3). The main exceptions to this are education, economy and institutions, and to a lesser extent poverty, water and implementation, where performance is below the OECD average (Goals 4, 8, 16, 1, 6, and 17, respectively).
Figure 3. Italy’s current distance from reaching the goals and the 5Ps of the 2030 Agenda, compared with the OECD average
Note: This figure shows Italy’s distance to travel towards each of the 17 goals of the 2030 Agenda. Bars show Italy’s performance, while diamonds show the OECD average. White bars indicate missing data. The y-axis indicates the distance from reaching the target in standardised units. 0 indicates that the level for 2030 has already been attained, and the axis starts at 3 as most OECD countries have already attained this level. Distances to target are aggregated at the goal level (all targets weighted equally). To make the level of achievement within the country more distinct, in this figure, data on Official Development Assistance (ODA) are excluded in Goals 1 to 16. Nonetheless, total ODA, ODA focusing on capacity building and national planning as well as ODA commitments to statistical capacity building are included in Goal 17 “implementation” and under Partnership.
GLOBAL CONTRIBUTION TO THE 2030 AGENDA
Italy’s performance on some SDG targets pertaining to global contributions
Note: This figure shows Italy’s distance to travel towards some SDG targets pertaining to global contributions. Bars show Italy’s performance while diamonds show the OECD average. White bars indicate missing data.
Indicators can also be grouped to examine OECD countries’ global contribution to the 2030 Agenda. This may help countries consider how they influence – positively or negatively, intentionally or unintentionally – the ability of other countries to achieve their goals.
As a starting point, this study considers Official Development Assistance (ODA), support to national agricultural producers, and demand-based CO2 productivity. Future work will aim to develop a fuller assessment, considering a wider range of “transboundary” impacts
Italy performs below the OECD average in terms of ODA flows but is slightly above the average on demand-based CO2 productivity. Data on producer support (i.e. subsidies to agricultural producers) are not available.
0.00
0.50
1.00
1.50
2.00
2.50
3.00
Pove
rty
Food
Healt
h
Educ
ation
Gend
er E
quali
ty
Wate
r
Susta
inable
Pro
ducti
on
Clim
ate
Ocea
ns
Biod
iversi
ty
Ener
gy
Econ
omy
Infra
struc
ture
Inequ
ality
Citie
s
Institu
tions
Imple
menta
tion .
People Planet Prosperity Peace Partnership
0.00
0.50
1.00
1.50
2.00
2.50
3.00Average ODA Score Demand-based CO2
productivityUnsubsidised
agricultural production
ITA OECD

42
MEASURING DISTANCE TO THE SDGs TARGETS – KOREA
Based on the 119 available indicators allowing coverage of 88 of the 169 SDG targets, Korea has currently achieved 12 of the 2030 targets. In some targets, the remaining distances to achieve are small, but a number of challenges remain (Figure 1).
Figure 1. Korea’s current distance from achieving SDGs’ 2030 targets
Note: The chart shows how far Korea has already progressed towards each available target. The longer the bars the shorter the distance is to be travelled by 2030. Targets are clustered by goal, and goals are clustered by the “5Ps” of the 2030 Agenda (outer circle). These results rely on the best comparative indicators currently available in various OECD and UN databases, in line with the UN global indicator framework. However, a number of important data gaps need to be addressed to enable a more complete assessment. For Korea, health is the only goal with full target coverage while sustainable production, oceans, inequality and cities have less than 30% of their targets covered (Figure 2).
Figure 2. The statistical agenda ahead: Korea’s data coverage
Percentage of targets for which there is at least one indicator by goals and the 5Ps of the 2030 Agenda, compared with the OECD total
Note: The global indicator framework developed by the UN Inter-Agency and Expert Group on SDG Indicators and adopted by the UN Statistical Commission in March 2017 agreed upon 232 indicators to measure the 169 targets. Reflecting data availability, this study considers 131 indicators covering 98 targets.
0
25
50
75
100
0
25
50
75
100OECD total

43
Korea is on average closest to reaching some goals in the Planet category (Figure 3). It also has very good outcomes in infrastructure and to a lesser extent, economy (Goals 9 and 8). However, it is further away from reaching other goals, most notably on poverty, gender equality, climate and inequality (Goals 1 and 8). Relative to the OECD average, Korea outperforms on goals such as education, sustainable production, economy and infrastructure (Goals 4, 12, 8 and 9). The performance is however below the OECD average in many other goals, most notably on poverty, gender equality, climate, inequality but also cities (Goals 1, 5, 13 and 11).
Figure 3. Korea’s current distance from reaching the goals and the 5Ps of the 2030 Agenda, compared with the OECD average
Note: This figure shows Korea’s distance to travel towards each of the 17 goals of the 2030 Agenda. Bars show Korea’s performance, while diamonds show the OECD average. White bars indicate missing data. The y-axis indicates the distance from reaching the target in standardised units. 0 indicates that the level for 2030 has already been attained, and the axis starts at 3 as most OECD countries have already attained this level. Distances to target are aggregated at the goal level (all targets weighted equally). To make the level of achievement within the country more distinct, in this figure, data on Official Development Assistance (ODA) are excluded in Goals 1 to 16. Nonetheless, total ODA, ODA focusing on capacity building and national planning as well as ODA commitments to statistical capacity building are included in Goal 17 “implementation” and under Partnership.
GLOBAL CONTRIBUTION TO THE 2030 AGENDA
Korea’s performance on some SDG targets pertaining to global contributions
Note: This figure shows Korea’s distance to travel towards some SDG targets pertaining to global contributions. Bars show Korea’s performance while diamonds show the OECD average. White bars indicate missing data.
Indicators can also be grouped to examine OECD countries’ global contribution to the 2030 Agenda. This may help countries consider how they influence – positively or negatively, intentionally or unintentionally – the ability of other countries to achieve their goals.
As a starting point, this study considers Official Development Assistance (ODA), support to national agricultural producers, and demand-based CO2 productivity. Future work will aim to develop a fuller assessment, considering a wider range of “transboundary” impacts
Korea’s performance in terms of ODA flows is close to the OECD average. Korea is, however, further from meeting targets on demand-based CO2 productivity and on producer support (i.e. subsidies to agricultural producers are higher than average).
0.00
0.50
1.00
1.50
2.00
2.50
3.00
Pove
rty
Food
Healt
h
Educ
ation
Gend
er E
quali
ty
Wate
r
Susta
inable
Pro
ducti
on
Clim
ate
Ocea
ns
Biod
iversi
ty
Ener
gy
Econ
omy
Infra
struc
ture
Inequ
ality
Citie
s
Institu
tions
Imple
menta
tion .
People Planet Prosperity Peace Partnership
0.00
0.50
1.00
1.50
2.00
2.50
3.00Average ODA Score Demand-based CO2
productivityUnsubsidised
agricultural production
KOR OECD

44
MEASURING DISTANCE TO THE SDGs TARGETS – LATVIA
Based on the 90 available indicators allowing coverage of 66 of the 169 SDG targets, Latvia has currently achieved 11 of the 2030 targets. The remaining distances to achieve the targets are small in some areas, but several challenges remain (Figure 1).
Figure 1. Latvia’s current distance from achieving SDGs’ 2030 targets
Note: The chart shows how far Latvia’s has already progressed towards each available target. The longer the bars the shorter the distance is to be travelled by 2030. Targets are clustered by goal, and goals are clustered by the “5Ps” of the 2030 Agenda (outer circle).
These results rely on the best comparative indicators currently available in various OECD and UN databases, in line with the UN global indicator framework. However, a number of important data gaps need to be addressed to enable a more complete assessment. For Latvia, there is no goal with full target coverage while sustainable production, climate, oceans, biodiversity, cities and implementation have less than 30% of their targets covered (Figure 2).
Figure 2. The statistical agenda ahead: Latvia’s data coverage Percentage of targets for which there is at least one indicator by goals and the 5Ps of the 2030 Agenda,
compared with the OECD total
Note: The global indicator framework developed by the UN Inter-Agency and Expert Group on SDG Indicators and adopted by the UN Statistical Commission in March 2017 agreed upon 232 indicators to measure the 169 targets. Reflecting data availability, this study considers 131 indicators covering 98 targets.
0
25
50
75
100
0
25
50
75
100OECD total

45
Latvia is on average closest to reaching some goals in the Planet category (Figure 3). It also has very good outcomes in some of the Prosperity goals. However, it is further away from reaching other goals, most notably on poverty and health (Goals 1 and 3).
Relative to the OECD average, Latvia outperforms on goals such as economy, biodiversity and cities (Goals 8, 15 and 11), and is either ahead of, or fairly close to, the OECD average distance on some other goals (Figure 3). However, on poverty, and to a lesser extent health, water and sustainable production, performance is significantly below the OECD average (Goals 1, 2, 6 and 12).
Figure 3. Latvia’s current distance from reaching the goals and the 5Ps of the 2030 Agenda, compared with the OECD average
Note: This figure shows Latvia’s distance to travel towards each of the 17 goals of the 2030 Agenda. Bars show Latvia’s performance, while diamonds show the OECD average. White bars indicate missing data. The y-axis indicates the distance from reaching the target in standardised units. 0 indicates that the level for 2030 has already been attained, and the axis starts at 3 as most OECD countries have already attained this level. Distances to target are aggregated at the goal level (all targets weighted equally). To make the level of achievement within the country more distinct, in this figure, data on Official Development Assistance (ODA) are excluded in Goals 1 to 16. Nonetheless, total ODA, ODA focusing on capacity building and national planning as well as ODA commitments to statistical capacity building are included in Goal 17 “implementation” and under Partnership.
GLOBAL CONTRIBUTION TO THE 2030 AGENDA
Latvia’s performance on some SDG targets pertaining to global contributions
Note: This figure shows Latvia’s distance to travel towards some SDG targets pertaining to global contributions. Bars show Latvia’s performance while diamonds show the OECD average. White bars indicate missing data.
Indicators can also be grouped to examine OECD countries’ global contribution to the 2030 Agenda. This may help countries consider how they influence – positively or negatively, intentionally or unintentionally – the ability of other countries to achieve their goals.
As a starting point, this study considers Official Development Assistance (ODA), support to national agricultural producers, and demand-based CO2 productivity. Future work will aim to develop a fuller assessment, considering a wider range of “transboundary” impacts
Latvia performs below the OECD average in terms of ODA flows (it should to be noted that Latvia is not part of the Development Assistance Committee). Latvia is performing around average on demand-based CO2 productivity. Data on producer support (i.e. subsidies to agricultural producers) are not available.
0.00
0.50
1.00
1.50
2.00
2.50
3.00
Pove
rty
Food
Healt
h
Educ
ation
Gend
er E
quali
ty
Wate
r
Susta
inable
Pro
ducti
on
Clim
ate
Ocea
ns
Biod
iversi
ty
Ener
gy
Econ
omy
Infra
struc
ture
Inequ
ality
Citie
s
Institu
tions
Imple
menta
tion .
People Planet Prosperity Peace Partnership
0.00
0.50
1.00
1.50
2.00
2.50
3.00Average ODA Score Demand-based CO2
productivityUnsubsidised
agricultural production
LVA OECD

46
MEASURING DISTANCE TO THE SDGs TARGETS – LUXEMBOURG
Based on the 120 available indicators allowing coverage of 87 of the 169 SDG targets, Luxembourg has currently achieved 19 of the 2030 targets. The remaining distances to achieve the targets are small in many areas, but some challenges remain (Figure 1).
Figure 1. Luxembourg’s current distance from achieving SDGs’ 2030 targets
Note: The chart shows how far Luxembourg has already progressed towards each available target. The longer the bars the shorter the distance is to be travelled by 2030. Targets are clustered by goal, and goals are clustered by the “5Ps” of the 2030 Agenda (outer circle).
These results rely on the best comparative indicators currently available in various OECD and UN databases, in line with the UN global indicator framework. However, a number of important data gaps need to be addressed to enable a more complete assessment. For Luxembourg, health is the only goal with full target coverage while sustainable production, oceans and cities have less than 30% of their targets covered (Figure 2).
Figure 2. The statistical agenda ahead: Luxembourg’s data coverage Percentage of targets for which there is at least one indicator by goals and the 5Ps of the 2030 Agenda,
compared with the OECD total
Note: The global indicator framework developed by the UN Inter-Agency and Expert Group on SDG Indicators and adopted by the UN Statistical Commission in March 2017 agreed upon 232 indicators to measure the 169 targets. Reflecting data availability, this study considers 131 indicators covering 98 targets.
0
25
50
75
100
0
25
50
75
100OECD total

47
Luxembourg is on average closest to reaching all goals in the Planet category (Figure 3). It also has very good outcomes in some of the goals in other categories, such as poverty and implementation (Goals 1 and 17). However, it is further away from reaching other goals, most notably on food and gender equality (Goals 2 and 5).
Relative to the OECD average, Luxembourg outperforms on many goals such as sustainable production and education (Goals 12 and 4), and is either ahead of, or fairly close to, the OECD average distance on many other goals (Figure 3). The main exception to this is food, and to a lesser extent gender equality, climate and cities, where performance is below the OECD average (Goals 2, 5, 13 and 11, respectively).
Figure 3. Luxembourg’s current distance from reaching the goals and the 5Ps of the 2030 Agenda, compared with the OECD average
Note: This figure shows Luxembourg distance to travel towards each of the 17 goals of the 2030 Agenda. Bars show Luxembourg performance, while diamonds show the OECD average. White bars indicate missing data. The y-axis indicates the distance from reaching the target in standardised units. 0 indicates that the level for 2030 has already been attained, and the axis starts at 3 as most OECD countries have already attained this level. Distances to target are aggregated at the goal level (all targets weighted equally). To make the level of achievement within the country more distinct, in this figure, data on Official Development Assistance (ODA) are excluded in Goals 1 to 16. Nonetheless, total ODA, ODA focusing on capacity building and national planning as well as ODA commitments to statistical capacity building are included in Goal 17 “implementation” and under Partnership.
GLOBAL CONTRIBUTION TO THE 2030 AGENDA
Luxembourg’s performance on some SDG targets pertaining to global contributions
Note: This figure shows Luxembourg’s distance to travel towards some SDG targets pertaining to global contributions. Bars show Luxembourg’s performance while diamonds show the OECD average. White bars indicate missing data.
Indicators can also be grouped to examine OECD countries’ global contribution to the 2030 Agenda. This may help countries consider how they influence – positively or negatively, intentionally or unintentionally – the ability of other countries to achieve their goals.
As a starting point, this study considers Official Development Assistance (ODA), support to national agricultural producers, and demand-based CO2 productivity. Future work will aim to develop a fuller assessment, considering a wider range of “transboundary” impacts
Luxembourg performs significantly above the OECD average in terms of ODA flows and demand-based CO2 productivity. Data on producer support (i.e. subsidies to agricultural producers) are not available.
0.00
0.50
1.00
1.50
2.00
2.50
3.00
Pove
rty
Food
Healt
h
Educ
ation
Gend
er E
quali
ty
Wate
r
Susta
inable
Pro
ducti
on
Clim
ate
Ocea
ns
Biod
iversi
ty
Ener
gy
Econ
omy
Infra
struc
ture
Inequ
ality
Citie
s
Institu
tions
Imple
menta
tion .
People Planet Prosperity Peace Partnership
0.00
0.50
1.00
1.50
2.00
2.50
3.00Average ODA Score Demand-based CO2
productivityUnsubsidised
agricultural production
LUX OECD

48
MEASURING DISTANCE TO THE SDGs TARGETS – THE NETHERLANDS
Based on the 128 available indicators, allowing coverage of 95 of the 169 SDG targets, the Netherlands has currently achieved 19 of the 2030 targets. The remaining distances to achieve the targets are small in many areas, but challenges remain (Figure 1).
Figure 1. The Netherlands’ current distance from achieving SDGs’ 2030 targets
Note: The chart shows how far the Netherlands has already progressed towards each available target. The longer the bars the shorter the distance is to be travelled by 2030. Targets are clustered by goal, and goals are clustered by the “5Ps” of the 2030 Agenda (outer circle).
These results rely on the best comparative indicators currently available in various OECD and UN databases, in line with the UN global indicator framework. However, a number of important data gaps need to be addressed to enable a more complete assessment. For the Netherlands, health and education are the only goals with full target coverage while sustainable production, oceans and cities have less than 30% of their targets covered (Figure 2).
Figure 2. The statistical agenda ahead: the Netherlands’ data coverage Percentage of targets for which there is at least one indicator by goals and the 5Ps of the 2030 Agenda,
compared with the OECD total
Note: The global indicator framework developed by the UN Inter-Agency and Expert Group on SDG Indicators and adopted by the UN Statistical Commission in March 2017 agreed upon 232 indicators to measure the 169 targets. Reflecting data availability, this Study considers 131 indicators covering 98 targets.
0
25
50
75
100
0
25
50
75
100OECD total

49
The Netherlands is on average closest to reaching all goals in the Planet category (Figure 3). It also has very good outcomes in some of the People goals as well as on Partnerships. However, it is further away from reaching other goals, most notably on gender equality.
Relative to the OECD average, the Netherlands outperforms on goals such as sustainable production and ending poverty, and is either ahead of, or fairly close to, the OECD average distance on many other goals (Figure 3). The main exception to this is gender equality, and to a lesser extent food and infrastructures (Goals 5, 2 and 9 respectively), where performance is below the OECD average.
Figure 3. The Netherlands’ current distance from reaching the goals and the 5Ps of the 2030 Agenda, compared with the OECD average
Note: Figure 3 above shows the Netherland’s distance to travel towards each of the 17 goals of the 2030 Agenda. Bars show the Netherland’s performance, while diamonds show the OECD average. White bars indicate missing data. The y-axis indicates the distance from reaching the target in standardised units. 0 indicates that the level for 2030 has already been attained, and the axis starts at 3 as most OECD countries have already attained this level. Distances to target are aggregated at the goal level (all targets weighted equally). To make the level of achievement within the country more distinct, in this figure, data on Official Development Assistance (ODA) are excluded in Goals 1 to 16. Nonetheless, total ODA, ODA focusing on capacity building and national planning as well as ODA commitments to statistical capacity building are included in Goal 17 “implementation” and under Partnership.
GLOBAL CONTRIBUTION TO THE 2030 AGENDA
The Netherlands’ performance on some SDG targets pertaining to global contributions
Note: This figure shows the Netherlands’ distance to travel towards some SDG targets pertaining to global contributions. Bars show the Netherlands’ performance while diamonds show the OECD average. White bars indicate missing data.
Indicators can also be grouped to examine OECD countries’ global contribution to the 2030 Agenda. This may help countries consider how they influence – positively or negatively, intentionally or unintentionally – the ability of other countries to achieve their goals.
As a starting point, this Study considers Official Development Assistance (ODA), support to national agricultural producers, and demand-based CO2 productivity. Future work will aim to develop a fuller assessment, considering a wider range of “transboundary” impacts
The Netherlands performs above the OECD average in terms of ODA flows and demand-based CO2 productivity. Data on producer support (i.e. subsidies to agricultural producers) are not available.
0.00
0.50
1.00
1.50
2.00
2.50
3.00
Pove
rty
Food
Healt
h
Educ
ation
Gend
er E
quali
ty
Wate
r
Susta
inable
Pro
ducti
on
Clim
ate
Ocea
ns
Biod
iversi
ty
Ener
gy
Econ
omy
Infra
struc
ture
Inequ
ality
Citie
s
Institu
tions
Imple
menta
tion .
People Planet Prosperity Peace Partnership
0.00
0.50
1.00
1.50
2.00
2.50
3.00Average ODA Score Demand-based CO2
productivityUnsubsidised
agricultural production
NLD OECD

50
MEASURING DISTANCE TO THE SDGs TARGETS – NORWAY
Based on the 130 available indicators, allowing coverage of 98 of the 169 SDG targets, Norway has currently achieved 33 of the 2030 targets. The remaining distances to achieve the targets are small in several areas, but some challenges remain (Figure 1).
Figure 1. Norway’s current distance from achieving SDGs’ 2030 targets
Note: The chart shows how far Norway has already progressed towards each available target. The longer the bars the shorter the distance is to be travelled by 2030. Targets are clustered by goal, and goals are clustered by the “5Ps” of the 2030 Agenda (outer circle). These results rely on the best comparative indicators currently available in various OECD and UN databases, in line with the UN global indicator framework. However, a number of important data gaps need to be addressed to enable a more complete assessment. For Norway, health and education are the only goals with full target coverage while sustainable production, oceans and cities have less than 30% of their targets covered (Figure 2).
Figure 2. The statistical agenda ahead: Norway’s data coverage
Percentage of targets for which there is at least one indicator by goals and the 5Ps of the 2030 Agenda, compared with the OECD total
Note: The global indicator framework developed by the UN Inter-Agency and Expert Group on SDG Indicators and adopted by the UN Statistical Commission in March 2017 agreed upon 232 indicators to measure the 169 targets. Reflecting data availability, this study considers 131 indicators covering 98 targets.
0
25
50
75
100
0
25
50
75
100OECD total

51
Norway is on average closest to reaching all goals in the Planet category (Figure 3). It also has very good outcomes in some of the People and Prosperity goals as well as on Partnerships. Relative to the OECD average, Norway outperforms on almost every goal, besides food and sustainable production (Goals 2 and 12) where performance is below the OECD average.
Figure 3. Norway’s current distance from reaching the goals and the 5Ps of the 2030 Agenda, compared with the OECD average
Note: This figure shows Norway’s distance to travel towards each of the 17 goals of the 2030 Agenda. Bars show Norway’s performance, while diamonds show the OECD average. White bars indicate missing data. The y-axis indicates the distance from reaching the target in standardised units. 0 indicates that the level for 2030 has already been attained, and the axis starts at 3 as most OECD countries have already attained this level. Distances to target are aggregated at the goal level (all targets weighted equally). To make the level of achievement within the country more distinct, in this figure, data on Official Development Assistance (ODA) are excluded in Goals 1 to 16. Nonetheless, total ODA, ODA focusing on capacity building and national planning as well as ODA commitments to statistical capacity building are included in Goal 17 “implementation” and under Partnership.
GLOBAL CONTRIBUTION TO THE 2030 AGENDA
Norway’s performance on some SDG targets pertaining to global contributions
Note: This figure shows Norway’s distance to travel towards some SDG targets pertaining to global contributions. Bars show Norway’s performance while diamonds show the OECD average. White bars indicate missing data.
Indicators can also be grouped to examine OECD countries’ global contribution to the 2030 Agenda. This may help countries consider how they influence – positively or negatively, intentionally or unintentionally – the ability of other countries to achieve their goals.
As a starting point, this study considers Official Development Assistance (ODA), support to national agricultural producers, and demand-based CO2 productivity. Future work will aim to develop a fuller assessment, considering a wider range of “transboundary” impacts
Norway performs above the OECD average in terms of ODA flows and demand-based CO2 productivity but is significantly below average on producer support (i.e. subsidies to agricultural producers are much higher than average).
0.00
0.50
1.00
1.50
2.00
2.50
3.00
Pove
rty
Food
Healt
h
Educ
ation
Gend
er E
quali
ty
Wate
r
Susta
inable
Pro
ducti
on
Clim
ate
Ocea
ns
Biod
iversi
ty
Ener
gy
Econ
omy
Infra
struc
ture
Inequ
ality
Citie
s
Institu
tions
Imple
menta
tion .
People Planet Prosperity Peace Partnership
0.00
0.50
1.00
1.50
2.00
2.50
3.00Average ODA Score Demand-based CO2
productivityUnsubsidised
agricultural production
NOR OECD

52
MEASURING DISTANCE TO THE SDGs TARGETS – THE SLOVAK REPUBLIC
Based on the 127 available indicators allowing coverage of 94 of the 169 SDG targets, the Slovak Republic has currently achieved 13 of the 2030 targets. The remaining distances to achieve the targets are small in several areas, but challenges remain (figure 1).
Figure 1. The Slovak Republic’s current distance from achieving SDGs’ 2030 targets
Note: The chart shows how far the Slovak Republic has already progressed towards each available target. The longer the bars the shorter the distance is to be travelled by 2030. Targets are clustered by goal, and goals are clustered by the “5Ps” of the 2030 Agenda (outer circle).
These results rely on the best comparative indicators currently available in various OECD and UN databases, in line with the UN global indicator framework. However, a number of important data gaps need to be addressed to enable a more complete assessment. For the Slovak Republic, health and education are the only goals with full target coverage while sustainable production, oceans and cities have less than 30% of their targets covered (figure 2).
Figure 2. The statistical agenda ahead: the Slovak Republic’s data coverage
Percentage of targets for which there is at least one indicator by Goals and the 5Ps of the 2030 Agenda, compared with the OECD total
Note: The global indicator framework developed by the UN Inter-Agency and Expert Group on SDG Indicators and adopted by the UN Statistical Commission in March 2017 agreed upon 232 indicators to measure the 169 targets. Reflecting data availability, this study considers 131 indicators covering 98 targets.
0
25
50
75
100
0
25
50
75
100OECD total

53
The Slovak Republic is on average closer to reaching most goals in the Planet category (Figure 3). It also has good outcomes in the goal on poverty (Goal 1). However, it is further away from reaching other goals, most notably on gender equality (Goal 5). Relative to the OECD average, the Slovak Republic is either ahead of, or fairly close to, the OECD average distance on several goals, including poverty, climate change, inequality and institutions (Goals 1, 13, 10 and 16). The main exception to this are gender equality and infrastructures (Goals 5 and 9 respectively), where performance is well below the OECD average (Figure 3).
Figure 3. The Slovak Republic’s current distance from reaching the goals and the 5Ps of the 2030 Agenda, compared with the OECD average
Note: This figure shows the Slovak Republic’s distance to travel towards each of the 17 goals of the 2030 Agenda. Bars show the Slovak Republic’s performance, while diamonds show the OECD average. White bars indicate missing data. The y-axis indicates the distance from reaching the target in standardised units. 0 indicates that the level for 2030 has already been attained, and the axis starts at 3 as most OECD countries have already attained this level. Distances to target are aggregated at the goal level (all targets weighted equally). To make the level of achievement within the country more distinct, in this figure, data on Official Development Assistance (ODA) are excluded in Goals 1 to 16. Nonetheless, total ODA, ODA focusing on capacity building and national planning as well as ODA commitments to statistical capacity building are included in Goal 17 “implementation” and under Partnership.
GLOBAL CONTRIBUTION TO THE 2030 AGENDA
The Slovak Republic’s performance on some SDG targets pertaining to global contributions
Note: This figure shows the Slovak Republic’s distance to travel towards some SDG targets pertaining to global contributions. Bars show the Slovak Republic’s performance while diamonds show the OECD average. White bars indicate missing data.
Indicators can also be grouped to examine OECD countries’ global contribution to the 2030 Agenda. This may help countries consider how they influence – positively or negatively, intentionally or unintentionally – the ability of other countries to achieve their goals.
As a starting point, this study considers Official Development Assistance (ODA), support to national agricultural producers, and demand-based CO2 productivity. Future work will aim to develop a fuller assessment, considering a wider range of “transboundary” impacts
The Slovak Republic performs below the OECD average in terms of ODA flows and demand-based CO2 productivity. Data on producer support (i.e. subsidies to agricultural producers) are not available.
0.00
0.50
1.00
1.50
2.00
2.50
3.00
Pove
rty
Food
Healt
h
Educ
ation
Gend
er E
quali
ty
Wate
r
Susta
inable
Pro
ducti
on
Clim
ate
Ocea
ns
Biod
iversi
ty
Ener
gy
Econ
omy
Infra
struc
ture
Inequ
ality
Citie
s
Institu
tions
Imple
menta
tion .
People Planet Prosperity Peace Partnership
0.00
0.50
1.00
1.50
2.00
2.50
3.00Average ODA Score Demand-based CO2
productivityUnsubsidised
agricultural production
SVK OECD

54
MEASURING DISTANCE TO THE SDGs TARGETS – SLOVENIA
Based on the 126 available indicators allowing coverage of 95 of the 169 SDG targets, Slovenia has currently achieved 12 of the 2030 targets. The remaining distances to achieve the targets are small in several areas, but challenges remain (Figure 1).
Figure 1. Slovenia’s current distance from achieving SDGs’ 2030 targets
Note: The chart shows how far Slovenia has already progressed towards each available target. The longer the bars the shorter the distance is to be travelled by 2030. Targets are clustered by goal, and goals are clustered by the “5Ps” of the 2030 Agenda (outer circle). These results rely on the best comparative indicators currently available in various OECD and UN databases, in line with the UN global indicator framework. However, a number of important data gaps need to be addressed to enable a more complete assessment. For Slovenia, health is the only goal with full target coverage while sustainable production, oceans and cities have less than 30% of their targets covered (Figure 2).
Figure 2. The statistical agenda ahead: Slovenia’s data coverage
Percentage of targets for which there is at least one indicator by goals and the 5Ps of the 2030 Agenda, compared with the OECD total
Note: The global indicator framework developed by the UN Inter-Agency and Expert Group on SDG Indicators and adopted by the UN Statistical Commission in March 2017 agreed upon 232 indicators to measure the 169 targets. Reflecting data availability, this study considers 131 indicators covering 98 targets.
0
25
50
75
100
0
25
50
75
100OECD total

55
Slovenia is on average closest to reaching all goals in the Planet category (Figure 3). It also has very good outcomes in goals such as poverty and cities, and does not have significant areas with very low outcomes at goal level.
Relative to the OECD average, Slovenia outperforms on goals such as gender equality and biodiversity (Goals 5 and 15), and is either ahead of, or fairly close to, the OECD average distance on many other goals (Figure 3). The main exceptions to this are food, health, water and implementation, where performance is slightly below the OECD average (Goals 2, 3, 6 and 17).
Figure 3. Slovenia’s current distance from reaching the goals and the 5Ps of the 2030 Agenda, compared with the OECD average
Note: This figure shows Slovenia’s distance to travel towards each of the 17 goals of the 2030 Agenda. Bars show Slovenia’s performance, while diamonds show the OECD average. White bars indicate missing data. The y-axis indicates the distance from reaching the target in standardised units. 0 indicates that the level for 2030 has already been attained, and the axis starts at 3 as most OECD countries have already attained this level. Distances to target are aggregated at the goal level (all targets weighted equally). To make the level of achievement within the country more distinct, in this figure, data on Official Development Assistance (ODA) are excluded in Goals 1 to 16. Nonetheless, total ODA, ODA focusing on capacity building and national planning as well as ODA commitments to statistical capacity building are included in Goal 17 “implementation” and under Partnership.
GLOBAL CONTRIBUTION TO THE 2030 AGENDA
Slovenia’s performance on some SDG targets pertaining to global contributions
Note: This figure shows Slovenia’s distance to travel towards some SDG targets pertaining to global contributions. Bars show Slovenia’s performance while diamonds show the OECD average. White bars indicate missing data.
Indicators can also be grouped to examine OECD countries’ global contribution to the 2030 Agenda. This may help countries consider how they influence – positively or negatively, intentionally or unintentionally – the ability of other countries to achieve their goals.
As a starting point, this study considers Official Development Assistance (ODA), support to national agricultural producers, and demand-based CO2 productivity. Future work will aim to develop a fuller assessment, considering a wider range of “transboundary” impacts
Slovenia performs significantly below the OECD average in terms of ODA flows and demand-based CO2 productivity. Data on producer support (i.e. subsidies to agricultural producers) are not available.
0.00
0.50
1.00
1.50
2.00
2.50
3.00
Pove
rty
Food
Healt
h
Educ
ation
Gend
er E
quali
ty
Wate
r
Susta
inable
Pro
ducti
on
Clim
ate
Ocea
ns
Biod
iversi
ty
Ener
gy
Econ
omy
Infra
struc
ture
Inequ
ality
Citie
s
Institu
tions
Imple
menta
tion .
People Planet Prosperity Peace Partnership
0.00
0.50
1.00
1.50
2.00
2.50
3.00Average ODA Score Demand-based CO2
productivityUnsubsidised
agricultural production
SVN OECD

56
MEASURING DISTANCE TO THE SDGs TARGETS – SWEDEN
Based on the 129 available indicators allowing coverage of 96 of the 169 SDG targets, Sweden has currently achieved 27 of the 2030 targets. The remaining distances to achieve the targets are small in many areas, but a few challenges remain (Figure 1).
Figure 1. Sweden’s current distance from achieving SDGs’ 2030 targets
Note: The chart shows how far Sweden has already progressed towards each available target. The longer the bars the shorter the distance is to be travelled by 2030. Targets are clustered by goal, and goals are clustered by the “5Ps” of the 2030 Agenda (outer circle). These results rely on the best comparative indicators currently available in various OECD and UN databases, in line with the UN global indicator framework. However, a number of important data gaps need to be addressed to enable a more complete assessment. For Sweden, health and education are the only goals with full target coverage while sustainable production, oceans and cities have less than 30% of their targets covered (Figure 2).
Figure 2. The statistical agenda ahead: Sweden’s data coverage
Percentage of targets for which there is at least one indicator by goals and the 5Ps of the 2030 Agenda, compared with the OECD total
Note: The global indicator framework developed by the UN Inter-Agency and Expert Group on SDG Indicators and adopted by the UN Statistical Commission in March 2017 agreed upon 232 indicators to measure the 169 targets. Reflecting data availability, this study considers 131 indicators covering 98 targets.
0
25
50
75
100
0
25
50
75
100OECD total

57
Sweden is on average closest to reaching most goals in the Planet category (Figure 3). It also has very good outcomes in some of the People goals as well as on Prosperity. However, it is further away from reaching other goals, most notably on gender equality.
Relative to the OECD average, Sweden outperforms on most goals, especially within the people and prosperity categories. On the goals of sustainable production, inequality and energy (Goals 12, 10 and 7), Sweden is fairly close to the OECD average (Figure 3).
Figure 3. Sweden’s current distance from reaching the goals and the 5Ps of the 2030 Agenda, compared with the OECD average
Note: This figure shows Sweden’s distance to travel towards each of the 17 goals of the 2030 Agenda. Bars show Sweden’s performance, while diamonds show the OECD average. White bars indicate missing data. The y-axis indicates the distance from reaching the target in standardised units. 0 indicates that the level for 2030 has already been attained, and the axis starts at 3 as most OECD countries have already attained this level. Distances to target are aggregated at the goal level (all targets weighted equally). To make the level of achievement within the country more distinct, in this figure, data on Official Development Assistance (ODA) are excluded in Goals 1 to 16. Nonetheless, total ODA, ODA focusing on capacity building and national planning as well as ODA commitments to statistical capacity building are included in Goal 17 “implementation” and under Partnership.
GLOBAL CONTRIBUTION TO THE 2030 AGENDA
Sweden’s performance on some SDG targets pertaining to global contributions
Note: This figure shows Sweden’s distance to travel towards some SDG targets pertaining to global contributions. Bars show Sweden’s performance while diamonds show the OECD average. White bars indicate missing data.
Indicators can also be grouped to examine OECD countries’ global contribution to the 2030 Agenda. This may help countries consider how they influence – positively or negatively, intentionally or unintentionally – the ability of other countries to achieve their goals.
As a starting point, this study considers Official Development Assistance (ODA), support to national agricultural producers, and demand-based CO2 productivity. Future work will aim to develop a fuller assessment, considering a wider range of “transboundary” impacts
Sweden performs significantly above the OECD average in terms of ODA flows and demand-based CO2 productivity. Data on producer support (i.e. subsidies to agricultural producers) are not available.
0.00
0.50
1.00
1.50
2.00
2.50
3.00
Pove
rty
Food
Healt
h
Educ
ation
Gend
er E
quali
ty
Wate
r
Susta
inable
Pro
ducti
on
Clim
ate
Ocea
ns
Biod
iversi
ty
Ener
gy
Econ
omy
Infra
struc
ture
Inequ
ality
Citie
s
Institu
tions
Imple
menta
tion .
People Planet Prosperity Peace Partnership
0.00
0.50
1.00
1.50
2.00
2.50
3.00Average ODA Score Demand-based CO2
productivityUnsubsidised
agricultural production
SWE OECD

58
REFERENCES
Boarini R. and G. Cohen (forthcoming), “The OECD study on measuring distance to the SDG targets: A methodological discussion”, OECD Statistics Working Papers, OECD Publishing, Paris.
Boarini, R., A. Kolev and A. McGregor (2014), “Measuring well-being and progress in countries at different stages of development: Towards a more universal conceptual framework”, OECD Development Centre Working Papers, No. 325, OECD Publishing, Paris, http://dx.doi.org/10.1787/5jxss4hv2d8n-en
European Union (2016), “Proposal for a new European consensus on development: Our world, our dignity, our future”, Communication from the Commission to the European Parliament, the Council, the European Economic and Social Committee and the Committee of the Regions COM(2016)740/final, Strasbourg, 2016, http://ec.europa.eu/transparency/regdoc/rep/1/2016/FR/COM-2016-740-F1-FR-MAIN.PDF.
Kroll, C. (2015), “Sustainable Development Goals: Are the rich countries ready?” Sustainable Governance Indicators, SDSN and Bertelsmann Stiftung, September 2015, www.bertelsmann-stiftung.de/en/publications/publication/did/sustainable-development-goals-are-the-rich-countries-ready/.
OECD (2016), Better Policies for Sustainable Development 2016: A New Framework for Policy Coherence, OECD Publishing, Paris, http://dx.doi.org/10.1787/9789264256996-en.
OECD (2016), “Better policies for 2030: An OECD action plan on the Sustainable Development Goals”, OECD Week 2016, www.oecd.org/dac/Better%20Policies%20for%202030.pdf.
OECD (2016), “Measuring distance to the SDGs targets: A pilot assessment of where OECD countries stand”, July 2016, www.oecd.org/fr/std/measuring-distance-to-the-sdgs-targets.htm.
OECD (2016), “OECD expertise relevant to the implementation of the Sustainable Development Goals (SDGS). An inventory of existing OECD tools, data and dialogue platforms”, for the Meeting of the OECD Council at Ministerial Level, June 2016, OECD Expertise Relevant to the Implementation of the Sustainable Development Goals (SDGS).
OECD Network of Senior Officials from Centres of Government (2016), “OECD survey on planning and co-ordinating the implementation of the SDGs: First results and key issues”, www.oecd.org/gov/cob-sdg-survey-overview-of-results.pdf.
OECD (2012), OECD Better Life Index, www.oecdbetterlifeindex.org.
OECD/EU/JRC (2008), Handbook on Constructing Composite Indicators: Methodology and User Guide, OECD Publishing, Paris, http://dx.doi.org/10.1787/9789264043466-en.

59
Sachs, J., G. Schmidt-Traub and D. Durand-Delacre (2016), “Preliminary Sustainable Development Goal (SDG) index and dashboard”, UN SDSN Working paper, 15 February 2016, http://unsdsn.org/wp-content/uploads/2016/02/160215-Preliminary-SDG-Index-and-SDG-Dashboard-working-paper-for-consultation.pdf.
Stiglitz, J.E., A. Sen and J.-P. Fitoussi (2009), Report by the Commission on the Measurement of Economic Performance and Social Progress, http://ec.europa.eu/eurostat/documents/118025/118123/Fitoussi+Commission+report
United Nations (2015), “Transforming our world: the 2030 Agenda for Sustainable Development”, https://sustainabledevelopment.un.org/post2015/transformingourworld.
United Nations Department of Economic and Social Affairs: Statistics Division (2015), IAEG-SDGs: Inter-agency Expert Group in SDG Indicators, https://unstats.un.org/sdgs/iaeg-sdgs.
United Nations, High level policy forum on sustainable development (2016), “Progress towards the Sustainable Development Goals: Report of the Secretary-General”, www.un.org/ga/search/view_doc.asp?symbol=E/2016/75&Lang=E.
United Nations Economic Commission for Europe (UNECE) (2014), Conference of European statisticians recommendations on measuring Sustainable Development, United Nations, New York and Geneva.
United Nations Sustainable Development Solutions Network (2015), “SDG guide: Getting started with the Sustainable Development Goals. A guide for stakeholders”, https://sdg.guide/.
United Nations Sustainable Development Solutions Network (2015), “Indicators and a monitoring framework for the Sustainable Development Goals: Launching a data revolution for the SDGs”, Report by the Leadership Council of the Sustainable Development Solutions Network, Revised working draft (Version 7), March 20, 2015, http://unsdsn.org/wp-content/uploads/2015/03/150320-SDSN-Indicator-Report.pdf.


OECD, Paris, June 2017www.oecd.org/std/measuring-distance-to-the-sdgs-targets.htm