an assessment of the performance of public sector
TRANSCRIPT

AN ASSESSMENT OF THE PERFORMANCE OF PUBLIC SECTOR
CONSTRUCTION PROJECTS: AN EMPIRICAL STUDY OF PROJECTS
FUNDED UNDER CONSTITUENCY DEVELOPMENT FUND (CDF) IN
WESTERN PROVINCE, KENYA
A THESIS SUBMITTED TO THE UNIVERSITY OF DELHI FOR AWARD OF
THE DEGREE OF DOCTOR OF PHILOSOPHY
BY
CHRISTOPHER NGACHO
UNDER THE SUPERVISION OF
DR. DEBADYUTI DAS
FACULTY OF MANAGEMENT STUDIES
UNIVERSITY OF DELHI
DELHI 110007
JULY, 2013

ii
DEDICATION
This PhD work is dedicated to my beloved family, wife Mary and children David,
Antony and Monica.
“To my wife for her continuous support and encouragement”
“To my children, I hope this will inspire them to pursue their education and lead
successful lives”

iii
DECLARATION
This is to declare that the research work embodied in this thesis titled “AN
ASSESSMENT OF THE PERFORMANCE OF PUBLIC SECTOR
CONSTRUCTION PROJECTS: AN EMPIRICAL STUDY OF PROJECTS
FUNDED UNDER CONSTITUENCY DEVELOPMENT FUND (CDF) IN
WESTERN PROVINCE, KENYA”, is original and is the result of investigation
carried out by the candidate under the supervision of Dr. Debadyuti Das at the Faculty
of Management Studies, University of Delhi. This work has not been submitted in any
part or full for any other degree or diploma of this or any other institution. The extent
of information derived from the existing literature has been indicated in the body of
the thesis at appropriate places, giving the source of information.
.................................................Date......................... CHRISTOPHER NGACHO RESEARCH SCHOLAR (PhD 10/018)
.................................................Date......................... DEBADYUTI DAS SUPERVISOR ASSOCIATE PROFESSOR FACULTY OF MANAGEMENT STUDIES UNIVERSITY OF DELHI DELHI – 110 007
.................................................Date....................... PROF. RAJ S. DHANKAR DEAN AND HEAD FACULTY OF MANAGEMENT STUDIES UNIVERSITY OF DELHI DELHI 110007

iv
ABSTRACT
The present work attempts to develop a multidimensional performance evaluation
framework of public sector construction projects by considering all relevant measures
of performance and the factors that influence success of these kinds of projects. In
order to demonstrate the workability of this framework, it has considered the case of
Constituency Development Fund (CDF) construction projects constructed between
2003 and 2011 and conducted the study at two phases: exploratory and confirmatory.
The exploratory study collected the viewpoints of 175 respondents comprising clients,
consultants and contractors involved in the implementation of CDF projects with
regard to their perception on 35 performance related variables and 30 project success
variables. Confirmatory study, on the other hand, separately collected viewpoints of
211 respondents from the same target population with regard to their perception on 27
performance related variables and 27 project success variables obtained from
exploratory study. A five-point Likert scale was used as a response format for
different variables with the assigned values ranging from 1 = Strongly Disagree to 5 =
strongly Agree.
The findings of the exploratory study reveal that the individual items constituting six
factors of performance measurement variables essentially represent six key
performance indicators (KPIs) namely time, cost, quality, safety, site disputes and
environmental impact. The relative influence of each KPI towards overall
performance of construction projects shows that time is the most important measure
followed by cost while safety comes last in order of importance in the performance
evaluation of CDF construction projects. Similarly, the six factors of project success
variables represent the six critical success factors (CSFs) namely project-related,
client-related, consultant-related, contractor-related, supply chain-related and
external environment-related factor. The relative influence of each success factor
towards project success reveals that project related factor is the most important factor
followed by client related factor while contractor related factor come last in order of
importance amongst the factors influencing the success of CDF construction projects.
Confirmatory factor analysis (CFA) results show that cost, time and quality are
significantly correlated with overall project performance while the relationship of

v
project performance with site disputes, safety and environmental impact are not
statistically significant. In terms of their importance, based on factor loadings, cost
was the most important, followed by quality, while environmental impact comes last
in order of importance. Further, all the six CSFs, project-related, client-related,
consultant-related, contractor-related, supply chain-related and external
environment-related factor were found to have significant influence on project success
with external environment related factor being the most important followed by project
related factor, consultant related factor, contractor related factor, client related factor
and supply chain related factor in that order.
The two measurement models: one for KPIs and the other for CSFs were combined
into a single performance evaluation model and Structural Equation Modelling (SEM)
was applied on 211 responses in order to examine the influence of the six CSFs on
project success, the association between project success and overall project
performance and the relationship between overall project performance and the six
KPIs. It was found that, in order of importance, project related, consultant related,
client related, contractor related, supply chain related and external environment
related factors influence the success of public sector construction projects. It was also
found that external environment related factor does not mediate the influence of CSFs
on the success of the project. Further, the results show that project success is
positively associated with the overall performance of public sector construction
project. Of the six KPIs earlier determined, four of them namely cost, time, quality
and site dispute performance were found to be significant measures of overall project
performance, whereas safety and environmental impact were found insignificant. The
findings of this study have significant bearing on other similar kind of public sector
construction projects undertaken in developing countries.

vi
ACKNOWLEDGEMENT
I wish to express my profound gratitude to my supervisor Dr. Debadyuti Das whose
guidance, constructive criticism, advice, support and encouragement enabled the
completion of this project and the work leading up to this thesis. I also appreciate the
encouragement I received from members of my advisory board, Prof. V.K. Seth and
Prof. Ajay Pandit towards completion of this work. The study leading up to this thesis
would have been next to impossible without the leadership and support of the faculty
at FMS, who taught, encouraged, and led me to reach this point in my academic
career. These include Prof M.L. Singla, Dr. Pankaj Sinha and Prof. Sunita Singh
Sengupta. The contribution and support of Mr. Hari- and my colleagues within the
PhD programme at FMS are highly commendable; especially Ms. Ruchika, Ms. Nidhi,
Mr Purushottam, Mr. Virendra, Mr. Rohella, Mr Tabash and all those others who
spared time to clarify several issues during our coursework.
I would also like to thank the editors and reviewers of the International Journal of
Project Management (IJPM) and International Journal of Project Organization and
Management (IJPOM) for their valuable comments on the papers we submitted to
their respective journals for publication. Further special thanks go to participants in
both XV and XVI Annual International Conferences of the Society of Operations
Management (SOM) in IIM Calcutta, and IIT, Delhi respectively and African
International Business and Management (AIBUMA 2012) conference in Nairobi.
Your comments and questions have enriched the contents of this thesis.
I appreciate the continued concern and support of my family, led by my elder brother
Mr. John Sebastian Wesonga and my Uncle Mr. Gabriel Kwoba Mukele, for both the
doctoral degree programme and my overall progress in the academia. I must
acknowledge the undisputable support of my caring and God fearing wife, Mary and
my children David, Antony and Monica. They provided the home logistics for the
success of the work.
Finally I wish to thank my employer, Kisii University, and especially the Vice-
Chancellor Prof. John Akama for granting me study leave to pursue this degree. To
this end, special thanks go to the Government of India, for her financial support
through the Indian Council for Cultural Relations (ICCR).

vii
DEDICATION............................................................................................................. ii
DECLARATION........................................................................................................ iii
ABSTRACT................................................................................................................ iv
ACKNOWLEDGEMENT......................................................................................... vi
TABLE OF CONTENTS.......................................................................................... vii
LIST OF TABLES.....................................................................................................xii
LIST OF FIGURES................................................................................................... xv
LIST OF MAPS........................................................................................................ xvi
LIST OF APPENDICES......................................................................................... xvii
LIST OF ABBREVIATIONS.................................................................................xviii
TABLE OF CONTENTS
CHAPTER 1: OVERVIEW OF THE STUDY......................................................... 1
1.0 Introduction.............................................................................................................. 1
1.1 Background of the Study......................................................................................... 1
1.2 Public sector construction projects: Contribution and challenges............................3
1.3 Research Problem.................................................................................................... 4
1.4 Research Objectives................................................................................................ 5
1.5 Scope of the Study.................................................................................................. 6
1.6 Significance of the Study........................................................................................ 6
1.7 Organization of Thesis............................................................................................. 7
1.8 Assumptions of the Study...................................................................................... 10
1.9 Definition of Terms………………………………………………………………10
CHAPTER 2: REVIEW OF LITERATURE ......................................................... 13
2.0 Introduction............................................................................................................ 13
2.1 Overview of public sector construction projects....................................................13
2.1.1 Definition of construction projects.................................................................. 14
2.1.2 Classification of construction projects............................................................ 14
2.1.3 Phases of construction projects....................................................................... 16
2.2 Performance measurement amongst public sector construction project................ 17
2.2.1 Key Performance Indicators (KPIs) of public sector construction
projects............................................................................................................. 19

viii
2.2.1.1 Traditional criteria, the “iron triangle”...............................................19
2.2.1.2 Performance criteria based on “five pillars”.......................................21
2.2.1.3 The contemporary measures of project performance.......................... 22
2.2.2 Critical Success Factors (CSFs) influencing the success of public
sector construction projects............................................................................. 25
2.3 Research gaps in literature..................................................................................... 29
CHAPTER 3: PUBLIC CONSTRUCTION SECTOR IN KENYA AND THE
CONSTITUENCY DEVELOPMENT FUND (CDF): AN OVERVIEW...…… 31
3.0 Introduction…………………………………………………………………..….. 31
3.1 Facts on Kenya………………………………………………………………….. 31
3.2 Construction sector in Kenya: Early government initiatives................................. 35
3.3 Constituency Development Fund (CDF) in Kenya............................................... 36
3.3.1 Identification and selection of CDF projects.................................................. 38
3.3.2 CDF Project procurement approaches............................................................. 39
3.3.3 Implementation of CDF projects..................................................................... 42
3.4 Existing practices of monitoring the performance of CDF construction
Projects.................................................................................................................. 44
CHAPTER 4: RESEARCH METHODOLOGY (PHASE I): EXPLORATORY
STUDY....................................................................................................................... 47
4.0 Introduction........................................................................................................... 47
4.1 Key issues……………………………………………………………………….. 47
4.2 Process followed in Research Methodology (Phase I).......................................... 47
4.3 Design of Survey Instrument……………………………………………………. 49
4.4 Reliability of Survey Instrument………………………………………………… 51
4.4.1 Validity and Reliability of project performance measurement variables….. 51
4.4.2 Validity and Reliability of variables influencing project success………… 54
4.5 Study site and identification of target population……………………………….. 57
4.6 Identification and training of field investigators………………………………... 57
4.7 Data collection………………………………………………………………… 58
CHAPTER 5: RESEARCH FINDINGS AND DISCUSSION (PHASE I).......... 59
5.0 Introduction……………………………………………………………………... 59

ix
5.1 Screening of collected Data................................................................................... 59
5.2 Demographic characteristics of projects and respondents’ profile........................ 62
5.2.1 Description of CDF projects and their procurement approaches.....................62
5.2.2 Status of CDF construction projects................................................................ 65
5.2.3 Respondents’ profile........................................................................................ 69
5.3 Exploratory Factor Analysis (EFA) of performance measurement variables
for Key Performance Indicators (KPIs) Scale........................................................70
5.3.1 Descriptive statistics of performance measures………………....................... 70
5.3.2 Assessing the factorability of performance measurement variables............... 73
5.3.3 Factor Analysis following Varimax Rotation.................................................. 77
5.3.4 Validation of the KPIs......................................................................................79
5.3.4.1 Reliability of KPIs scale............................................................................. 79
5.3.4.2 Content validity......................................................................................... 80
5.3.4.3 Convergent and Discriminant validity....................................................... 80
5.3.5 Theoretical Framework of the KPIs & Discussion........................................ 82
5.4 Exploratory Factor Analysis (EFA) of project success variables for Critical
Success Factors (CSFs) Scale.................................................................... 86
5.4.1 Descriptive statistics of project success variables…………………………... 86
5.4.2 Assessing the factorability of project success variables.................................. 88
5.4.3 Factor Analysis following Varimax Rotation.................................................. 90
5.4.4 Validation of the CSFs..................................................................................... 93
5.4.4.1 Reliability of CSFs scale............................................................................ 93
5.4.4.2 Content validity.......................................................................................... 93
5.4.4.3 Construct validity....................................................................................... 93
5.4.5 Theoretical Framework of CSFs..................................................................... 95
5.5 Conceptual framework of project performance evaluation.................................. 98
CHAPTER 6: RESEARCH METHODOLOGY (PHASE II):
CONFIRMATORY STUDY................................................................................. 101
6.0 Introduction.......................................................................................................... 101
6.1 Key Issues……………………….......………………………………….……….101
6.2 Theoretical framework and statement of Hypotheses for performance

x
evaluation of public sector construction projects……………..………..…....…. 102
6.3 Process followed in Research Methodology (Phase II)....................................... 112
6.4 Design of Survey Instrument………………………….……………..………… 112
6.5 Study site and identification of target population………..……………..……….113
6.6 Data Collection…….……………………………………..…………..…….….. 113
CHAPTER 7: RESEARCH FINDINGS AND DISCUSSION (PHASE II)….... 115
7.0 Introduction.......................................................................................................... 115
7.1 Screening of collected data………………………………………………….…. 115
7.2 Demographic characteristics of respondents and projects....................................115
7.2.1 Project characteristics and brief profile of the respondents............................116
7.2.2 Status of CDF construction projects...............................................................117
7.2.3 Relationship amongst project characteristics, respondents’ profile
and incidences of time overrun, cost overrun and quality defects..................119
7.2.3.1 The extent of differences in the occurrence of time overrun,
cost overrun and quality defects across different types of
construction projects………………………….……………….……..…. 119
7.2.3.2 The association between the project procurement approaches used
and the occurrence of time overrun, cost overrun and quality defects
amongst public sector construction projects………………………...……. 120
7.2.3.3 The association between respondents’ experience in
construction projects and occurrence of time overrun, cost
overrun and quality defects………………………………………………….. 122
7.3 Confirmatory factor analysis (CFA) of performance measurement
variables for KPIs Scale...................................................................................... 124
7.3.1 Validation of performance measurement variables........................................124
7.3.2 First order measurement model of KPIs........................................................ 125
7.3.3 Second order measurement model of KPIs.................................................... 132
7.3.4 Evaluation of constructs in KPIs measurement model................................. 134
7.3.4.1 Unidimensionality and face validity....................................................... 134
7.3.4.2 Construct Reliability.................................................................................134
7.3.4.3 Construct Validity.................................................................................... 136

xi
7.4 Confirmatory factor analysis (CFA) of success variables for CSFs Scale......... 137
7.4.1 Validation of project success variables........................................................ 138
7.4.2 First order measurement model of CSFs......................................................139
7.4.3 Second order measurement model of CSFs................................................... 144
7.4.4 Evaluation of constructs in CSFs measurement model................................ 145
7.4.4.1 Unidimensionality and face validity.........................................................145
7.4.4.2 Construct Reliability................................................................................ 145
7.4.4.3 Construct Validity.................................................................................... 147
7.5 Structural Equation Modelling (SEM)................................................................. 148
7.5.1 A summary of CFA results.............................................................................148
7.5.2 Evaluation of the structural model................................................................. 150
7.5.3 Tests of Hypotheses and Discussion.............................................................. 155
7.5.3.1 Tests of direct impact of re-specified model............................................ 155
7.5.3.2 Test of indirect impact of re-specified model........................................... 157
CHAPTER 8: CONCLUSION................................................................................158
8.0 Introduction.......................................................................................................... 158
8.1 A snapshot of summary findings..........................................................................158
8.1.1 Summary findings regarding the relationship between projects’
characteristics, respondents’ profile and occurrence of time overrun,
cost overrun and quality defects.................................................................. 160
8.1.2 Summary findings regarding KPIs.................................................................161
8.1.3 Summary findings regarding CSFs................................................................ 164
8.1.4 Summary findings regarding the Performance Evaluation Framework…….167
8.2 Managerial implications of the findings............................................................. 169
8.3 Recommendations............................................................................................... 170
8.4 Limitations of the study...................................................................................... 171
8.5 Directions for Future Research............................................................................ 172
REFERENCES......................................................................................................... 173
Appendices............................................................................................................... 191

xii
List of Tables
Table 2.1: Summary of the contributions to the study of KPIs....................................24
Table 2.2: Success variables and their impact on project success............................... 26
Table 4.1: Descriptive statistics of performance measurement variables obtained
through pilot survey.................................................................................... 52
Table 4.2: Item-to-total correlations among performance measurement variables
obtained through pilot survey................................................................... 53
Table 4.3: Descriptive statistics of project success variables of pilot survey............. 55
Table 4.4: Item-to-total correlations amongst project success variables obtained
through pilot survey .................................................................................... 56
Table 5.1: Distribution of respondents according to counties & Constituencies........ 59
Table 5.2: Types of CDF projects and their procurement approaches.........................63
Table 5.3: Status of CDF construction projects........................................................... 65
Table 5.4: Respondents’ Profile................................................................................... 69
Table 5.5: Descriptive statistics of performance measurement variables................... 70
Table 5.6: Original Correlation Matrix of performance measurement variables......... 74
Table 5.7 Measures of Sampling Adequacy and Partial Correlations amongst
performance measurement variables............................................................ 76
Table 5.8: Results of the Factor Analysis of performance measurement variables..... 78
Table 5.9: Correlation matrix of performance measurement variables after
grouping according to factor analysis...................................................... 81
Table 5.10: Descriptive statistics of project success variables.....................................86
Table 5.11: Original Correlation Matrix for project success variables....................... 89
Table 5.12: Results of the Factor Analysis of project success variables..................... 92
Table 5.13: Correlation matrix of project success variables after grouping
according to factor analysis....................................................................... 94
Table 7.1: Project characteristics and brief profile of the respondents.................... 116
Table 7.2: Incidences of time overrun, cost overrun and quality defects................. 118
Table 7.3: Results of ANOVA test between the types of projects and time
overrun, cost overrun and quality defects................................................ 119
Table 7.4: Results of the Chi-square test between project procurement approaches
and time overrun, cost overrun and quality defects................................ 120

xiii
Table 7.5 Post-hoc Chi-square tests between procurement approaches used and
occurrence of cost overrun....................................................................... 122
Table 7.6: Results of the Chi-square test between respondents’ experience
and time overrun, cost overrun and quality defects.................................. 123
Table 7.7: Summary of measurement results of Key Performance
Indicators (KPIs)....................................................................................... 125
Table 7.8: Discriminant validity checks: Chi-square differences............................. 125
Table 7.9: Results of Goodness of fit indices (GOF) of KPIs scale......................... 129
Table 7.10: Dimensions of performance evaluation among CDF
construction projects............................................................................. 130
Table 7.11: Loadings of First-order CFA of KPIs’ performance variables.............. 131
Table 7.12: Reliability test of performance measures among CDF
construction projects............................................................................. 135
Table 7.13: Discriminant Validity of KPIs................................................................ 136
Table 7.14: Summary of measurement results of Critical Success Factors (CSFs)... 138
Table 7.15: Discriminant validity checks: Chi-square differences............................ 138
Table 7.16: Results of Goodness of fit indices (GOF) of CSFs................................ 141
Table 7.17: Critical success factors among CDF construction projects.................... 142
Table 7.18: Loadings of First-order CFA of CSFs’ success variables...................... 143
Table 7.19: Reliability test of CSFs among CDF construction projects................... 146
Table 7.20: Discriminant Validity of CSFs............................................................... 147
Table 7.21: Summary of the results of Confirmatory Factor Analysis...................... 149
Table 7.22: Goodness of fit tests of SEM.................................................................. 153
Table 7.23: Summary of the constructs and measurement items in the
Structural Equation Model..................................................................... 154
Table 7.24 Direct impact of re-specified model based on standardised
regression weights.................................................................................. 156
Table 7.25 Indirect impact of re-specified model based on Standardised
regression weights.................................................................................. 157
Table 8.1 Summary of the dimensions of KPIs and performance measurement
variables in both survey I and survey II................................................... 162

xiv
Table 8.2 Summary of the dimensions CSFs and project success variables in
both survey I and survey II..................................................................... 165

xv
List of Figures
Figure 1.1: Flow chart of thesis organization................................................................ 8
Figure 2.1: Classification of construction projects……………,,,,………………….. 15
Figure 2.2: Phases of a construction project……………………………………….....16
Figure 2.3 Relationship between critical success factors and key
performance indicators.............................................................................. 30
Figure 3.1 Management structure of CDF construction projects................................. 37
Figure 3.2: Design/Bid/Build project procurement approach...................................... 40
Figure 3.3: Design/Build project procurement approach............................................. 41
Figure 4.1: Sequence of research followed in Study Phase I.................................... 48
Figure 5.1: Types of projects surveyed………………………...……………………. 63
Figure 5.2: Approaches used in project procurement……………………………….. 64
Figure 5.3: Time overrun amongst different types of projects.................................... 66
Figure 5.4: Cost overrun amongst different types of projects…………..………… 67
Figure 5.5: Quality defects amongst different types of projects………..………… 68
Figure 5.6: Scree Plot of performance measurement variables…............................... 77
Figure 5.7: Proposed theoretical framework of key performance indicator………… 82
Figure 5.8: Scree Plot of project success factors......................................... 90
Figure 5.9: Proposed theoretical framework of critical success factors...................... 95
Figure 5.10: Conceptualised relationship between project success and overall
project performance................................................................................ 99
Figure 6.1: Hypothesised performance assessment model for public
sector construction projects................................................................... 102
Figure 6.2: Sequence of research followed in Study Phase I..................................... 112
Figure 7.1: First order KPIs measurement model (Final)......................................... 128
Figure 7.2: Second order KPIs measurement model (Final)................................... 133
Figure 7.3: First order CSFs measurement model (Final)......................................... 140
Figure 7.4: Second order CSFs measurement model (Final)……………………..... 144
Figure 7.5: Initial Performance evaluation Model……………………………….... 151
Figure 7.6:Re-specified performance evaluation model…………………………... 152

xvi
List of Maps
Map 3.1: Map of Africa showing location of Kenya………………………….…... 32
Map 3.2: Map of Kenya showing Administrative (provinces) units………………. 33

xvii
LIST OF APPENDICES
Appendix A1: Questionnaire for Exploratory Study (Phase I)............................... 191
Appendix A2: Questionnaire for Confirmatory Study (Phase II)........................... 197

xviii
List of Abbreviations
AAK-Architectural Association of Kenya
AMOS-Analysis of Moments
BoQ-Bill of Quantities
CDFC- Constituency Development Fund Committee
CDF-Constituency Development Fund
CFA-Confirmatory Factor Analysis
CI-Construction Industry
CSF-Critical success Factor
DPC-District Project Committee
EFA-Exploratory Factor Analysis
EU- European Union
GDP-Gross Domestic Product
IEA- Institute of Economic Affairs
IGAD- Intergovernmental Authority on Development
ILO-International Labour Organization
IPAR- Institute for Policy Analysis and Research
KABCEC- Kenya Association of Building and Civil Engineering Contractors
KCA-Kenya contractors’ associations
KIPRA-Kenya Institute of Public Research and Analysis
KPI-Key Performance Indicators
MDGs-Millennium Development Goals
MPs- Members of Parliament
NCC- National Construction Company
NMB-National Management Board
PMC-Project Management Committee
PSCP-Public Sector Construction Projects
SEM-Structural Equation Modelling
SID-Society for International Development
SPSS-Statistical Package for Social Scientists
WB- World Bank
WPA-K- Women Political Alliance-Kenya

1
CHAPTER 1: OVERVIEW OF THE STUDY
1.0 Introduction
This chapter presents the background of the study emphasising upon of the
importance of performance measurement of public sector construction projects in
Kenya and other developing countries, the contribution of public construction sector
to the economy and the challenges it faces in developing countries. Subsequently, the
chapter discusses the research problem, research objectives, scope of the study and the
significance of the study. It also outlines the organization of the thesis in terms of
chapterization and the contents contained in each chapter. Further, assumptions of the
study and the specific terms used in the study have been highlighted.
1.1 Background of the Study
Assessment of performance amongst public sector construction projects has assumed
great importance in current scenario due to the sector’s ability to create economic
wealth, deliver social welfare services and at the same time its possibility to create
negative environmental impact. With reference to developing countries, performance
measurement of public sector construction projects has become even more important
due to its immense potential in addressing the problem of poverty, unemployment,
inequitable distribution of resources in different regions etc. However, as revealed in
literature, these projects have mostly been evaluated on the criteria of time, cost and
quality (Atkinson, 1999; Chan, 2001; Ahadzie, Proverbs & Olomolaiye, 2008; Salleh,
2009). This traditional approach, popularly known as the “iron triangle” (Atkinson,
1999) merely captures the economic aspects of public sector construction projects and
ignores relevant social or environmental aspects.
In view of this shortcoming of traditional criteria, Organisation for Economic Co-
operation and Development's (OECD) Development Assistance Committee (DAC)
has introduced a performance evaluation criterion of development projects based on
relevance, efficiency, effectiveness, impact and sustainability (Beck, 2006; Chianca,
2008; Ika, Diallo & Thuiller, 2012). This criterion, popularly known as the five pillars
of development projects (Beck, 2006; Ika et al., 2012), though seems to capture both
economic and social aspects of public sector construction projects, do not adequately
address the environmental aspects that are considered quite important in these kinds

2
of projects. Further the researchers have suggested hardly any objective measure upon
which the five pillars can be operationalised.
Academic researchers with a view to overcoming the limitations of the traditional
performance evaluation criteria of time, cost and quality have suggested the inclusion
of additional measures of performance. These include safety of the project site
(Ortega, 2000; Haslam et al., 2005; Billy, Cameron & Duff, 2006), site disputes
(Tabish and Jha, 2011), environmental impact (Eriksson and Westerberg, 2011) and
community/client/customer satisfaction (Chan & Chan, 2004; CURT, 2005; Ali &
Rahmat, 2010). These contributions, although widen the scope of performance
evaluation amongst public sector construction projects, are skewed towards either
societal or environmental aspects. None of the above has provided a balanced set of
Key Performance Indicators (KPIs) which would capture all essential and unique
features of a public sector construction project.
Further, these studies have not talked about the appropriate facilitating factors that can
help project managers achieve success on KPIs identified above. The identification of
these factors, also known as critical success factors (CSFs), is very important for
ensuring success of any project because it enables project managers to commit
resources on specific factors.
A survey of success factors amongst construction projects reveals that they are
numerous in number and they influence project success to varying degrees, with
certain factors being more critical to project success than others. Different researchers
have suggested a number of CSFs that influence project success on different
dimensions of construction projects. The CSFs have been classified in various ways
by the researchers (as has been revealed in Literature Review Chapter) based on the
common characteristic features of construction projects. However, there is hardly any
study which has attempted to identify CSFs of construction projects based on the
KPIs of the same specifically with reference to public sector construction projects.
With this backdrop, the present study is an attempt to identify the KPIs amongst
public sector construction projects and on the basis of these KPIs, identify appropriate
CSFs relevant for success of public sector construction projects and find out the
influence of these CSFs on project success. The relationship between project success

3
and overall project performance in terms of the KPIs is also investigated in the current
study. This has been demonstrated with the help of relevant data collected from the
Constituency Development Fund (CDF) projects constructed during the period
between 2003 and 2011 in the Western Province, Kenya.
1.2 Public sector construction projects: Contribution and challenges
Public sector construction projects play a key role in the growth of economies in
developing countries in terms of their contribution towards Gross Domestic Product
(GDP), employment generation and provision of an important market for materials
and products produced by other sectors of the economy (ILO, 2001). Khan (2008)
argues that there is a clear relationship between a construction activity, economic
growth and economic development. A recent survey reports that total world
construction spending on infrastructural projects in 2007 was $4.7 trillion, which rose
to $ 7.2 trillion in 2010 and is expected to grow to $12 trillion in 2020 (Global
construction 2020, 2010). A large proportion of this expenditure is in the public
construction sector.
In developing countries, the construction of public sector projects is undertaken by the
national governments. In most cases, because of the requirement of huge capital
which is lacking in many developing countries, the governments supplement their
development budget with aid from international agencies and other development
partners. According to Shen et al. (2010), addressing the infrastructural needs
especially in view of the current economic pressures in developing countries require
government agencies and construction industry stakeholders to find more efficient and
effective ways of delivering the capital projects while controlling the costs. However,
project implementing agencies have faced several challenges in search of appropriate
mechanism for delivering public sector construction projects.
Specific challenges that project implementing agencies face in the construction of
public sector construction projects include limited funding, scarcity of raw materials,
presence of a large unskilled labour force and the presence of several rules and
regulations that limit their independence (Datta, 2002). In addition, public
construction sector is faced with low levels of infrastructural development, poor
financial practices and a lot of political interference due to multiple funding sources

4
(Ofori, 2000). Further, political instability, a common phenomenon in developing
countries and fraudulent practices inherent in this sector hinder the growth of public
construction sector. These challenges present difficulties in implementation of public
sector construction projects such that if not properly managed, the construction of
these projects may lead to colossal financial loss instead of desired economic
outcome. This may eventually make it difficult for the project implementing agency
to realise the intended objective of public sector construction projects of delivering
services to the people.
1.3 Research Problem
As it has been mentioned, the purpose of public sector construction projects is to
provide services for public use, while charging minimal fees. In many developing
countries, these construction projects include those projects that aim at providing
basic Educational facilities, Health Care facilities, Business opportunities and
Employment opportunities etc. In order to enable the community derive the benefits
of the above projects, these projects need to be evaluated on all relevant dimensions
including economic, social and environmental ones. However, as already mentioned,
these projects have so far been evaluated mostly on the basis of traditional
performance evaluation criteria of time, cost and quality which are found to be
relevant for commercial projects. This criterion, though captures the economic
aspects, ignores other important elements of public sector construction projects and
hence makes it difficult to attain the main purpose for which the projects were
conceptualised. Although OECD/DAC has introduced the “five pillars”, the criterion
has faced problems of operationalisation.
The “iron triangle” criterion currently used to evaluate the performance of public
sector construction projects focus more on the perspectives of the project
implementing agencies and ignores the needs of the beneficiaries. These agencies are
satisfied with a project once it meets budgeted cost, adheres to stipulated time and
conforms to the technical specifications. However, merely fulfilling these criteria may
not ensure the realization of ultimate benefits of the project to the communities for
whom the same is constructed. The implementing agencies are hardly concerned with
whether the project is delivering intended services to the community, whether the

5
project has created any safety issue among the people or it has created any dispute
with surrounding community. Further, iron triangle criterion does not take into
consideration the adverse environmental impact that might be created due to the
project. Thus iron triangle criterion may satisfy the needs of implementing agency in
terms of time, cost and quality but fail to address the needs of the community thereby
defeating the very purpose for which public sector construction projects were
implemented.
Therefore, the problem facing public sector construction projects in developing
countries seems to be the lack of an appropriate performance measurement framework
that does not merely focus on the needs of the project implementing agency, but also
addresses the needs of the actual beneficiaries. Without such a framework, project
implementing agencies will not be able to assess the performance of public sector
construction projects on economic, social and environmental dimensions, which are
considered important for these kinds of projects.
1.4 Research Objectives
In view of the background of the research problem, the broad objective of this study is
to develop a multi-dimensional performance evaluation framework encompassing
economic, social and environmental dimensions of public sector construction projects.
Specific objectives of research are to
i) Identify the KPIs appropriate for measuring performance of public sector
construction projects.
ii) Identify the CSFs influencing the success of public sector construction
projects.
iii) Confirm the KPIs identified above and examine the relationship between the
confirmed KPIs and overall project performance.
iv) Confirm the CSFs identified above and examine the influence of the
confirmed CSFs on project success.
v) Find out the mediating effect of external environment in the influence of CSFs
on project success.
vi) Examine the relationship between project success and overall project
performance in terms of the KPIs.

6
vii) Examine the extent of differences in the occurrence of cost overrun, time
overrun and quality defects across different types of construction projects.
viii) Examine the association between the project procurement approaches
followed in public sector construction projects and occurrence of cost overrun,
time overrun and quality defects.
ix) Examine the association between stakeholders’ (client, consultant and
contractor) experience on construction projects and occurrence of cost
overrun, time overrun and quality defects.
1.5 Scope of Study
In pursuing this research, the focus of attention was on the public sector construction
projects. The study was based on the Constituency Development Fund (CDF)
construction projects in Western province, Kenya. The kinds of projects analysed in
this study were mainly the construction projects pertaining to Education, Health,
Agricultural Markets and Industrial Estates. These are the main projects upon which
CDF is allocated, for purposes of improving socio-economic wellbeing of the
communities. The study targeted those projects which were funded by CDF in Kenya
in the financial years between 2003/2004 to 2010/2011. This is because prior to 2003,
public sector construction projects were mainly undertaken by the central government
through various line ministries and hence obtaining relevant information proved to be
difficult.
For the purpose of analysis, the study sought perceptions of three kinds of
stakeholders namely clients, consultants and contractors involved in the construction
of the above mentioned CDF projects. This was necessary because all three kinds of
stakeholders had different roles to play on construction project but they all had an
ultimate goal of delivering a project successfully (Wang and Huang, 2006).
1.6 Significance of this study
The outcome of the current study will be of benefit to several stakeholders that
implement public sector construction projects as well as future researchers.
The project monitoring and evaluation agencies will use the developed framework to
evaluate performance of public sector construction projects. Other than merely

7
declaring a project as successful or not, they will be able to describe performance in
terms of how “good” it is on different performance indicators.
The set of KPIs and CSFs identified will enable the project implementing agencies to
assess, monitor and report the progress of the project as construction takes place.
Further, the project implementing agencies can use the performance evaluation
framework for allocation of appropriate resources to the CSFs with a view to realising
desired performance on specific KPIs.
The performance evaluation framework in the current study also provides direction to
the government and donor agencies that they should not merely focus on economic
measures of performance but also consider project outcome in terms of providing
appropriate services to the society while taking care of adverse environmental impact.
Further, on the basis of findings of the current study, the beneficiaries of the project
will have an idea of whether the intended benefits are actually being delivered by the
project as conceptualised. Therefore, the study provides a basis through which the
services delivered can be compared with the intended benefits.
Further, literature review of literature has revealed that there is hardly any empirical
research on performance evaluation of construction projects with reference to Kenya.
Given that this study could be the first of its kind to develop a multidimensional
performance evaluation framework, it advances the body of knowledge in terms of
performance evaluation amongst this kind of projects. The future researchers will also
gain insights as to how apparently intangible measures of performance are
operationalised in order to capture all relevant project objectives.
1.7 Organization of Thesis
The thesis is organised sequentially in several steps. These steps are discussed in eight
chapters as shown in Figure 1.1.
Chapter 1 discusses the overview of the study by highlighting the background of the
study, the contribution of public sector construction projects and the challenges they
face, research problem, research objectives, scope of the study and significance of the
study. The chapter further provides the assumptions of the study and definition of
terms used in the current study and outlines the organization of the thesis.

8
Figure 1.1: Flow chart of thesis organization
Background of the Study Public sector construction projects: Contribution and challenges Research problem, Research objectives, Significance of the Study, Scope of the study Organization of the thesis, Assumptions of the Study and Definition of terms
Overview of public sector construction projects Performance of construction projects Key Performance Indicators (KPIs) of public sector construction projects. Critical Success Factors (CSFs) Relationship between KPIs and CSFs
Summary of the Study, Managerial implications of the results, Recommendations of the Study, Limitations of the study, Future Research directions Conclusion
Research findings (Phase I) Screening of collected Data, Demographic characteristics of projects and respondents’ profile, Exploratory factor analysis of performance measurement variables and Exploratory Factor analysis of project success variables
Key issues in the study, Process followed, Design of the survey instrument, Reliability of the survey instrument, Study site and identification of target population and Data collection.
Facts on Kenya Early government initiatives Constituency Development Fund (CDF) in Kenya Existing practices of Monitoring of CDF projects
Research findings (Phase II) Screening of collected Data, Demographic characteristics of respondents and projects, Confirmatory factor analysis of performance variables, Confirmatory factor analysis of project success variables, Structural Equation Modelling
CHAPTER 1: OVERVIEW OF
THE STUDY
CHAPTER 2: LITERATURE
REVIEW
CHAPTER 3: PUBLIC
CONSTRUCTION SECTOR IN
KENYA AND THE
CONSTITUENCY DEV. FUND
CHAPTER 4: RESEARCH
METHODOLOGY (PHASE I)
CHAPTER 5: RESEARCH
FINDINGS AND DISCUSSION
(PHASE I)
CHAPTER 7: RESEARCH FINDINGS AND DISCUSSION (PHASE II)
CHAPTER 8: SUMMARY,
CONCLUSION AND
RECOMMENDATIONS.
CHAPTER 6: RESEARCH
METHODOLOGY (PHASE II)
Key issues in phase II, Theoretical framework and statement of hypotheses, process followed in research methodology, design of survey instrument, study site, target projects and target population, Data collection

9
Chapter 2 focuses on the literature review and provides an overview of public
construction projects in terms of their definition, classification and phases involved in
project construction. The chapter also discusses the performance of construction
projects in general and the performance of public sector construction projects in
particular. Further, the chapter reviews relevant literature on KPIs and CSFs of public
sector construction projects. Based on the review, literature gaps are identified and
highlighted in this chapter.
Chapter 3 provides a brief overview of construction sector in Kenya, early
government initiatives to develop the sector and the nature of CDF construction
projects. It highlights the process of identification and selection of CDF projects, their
implementation and the current practice in monitoring and evaluation of the same.
Chapter 4 describes the research methodology employed in carrying out exploratory
research (phase I). This chapter discusses the design of the survey instrument,
reliability of the survey instrument, study site and identification of target population
and data collection procedure. The aim of the chapter is to identify the KPIs and CSFs
of CDF construction projects in Kenya with a view to developing scales for project
performance measurement and project success.
Chapter 5 discusses the findings of exploratory study (phase I). The chapter reports
the characteristics of the projects and respondents’ demographic profile in terms of
their experience and role on the project. It further deals with factorability of
performance measurement variables and project success variables, factor analysis of
the performance measurement variables and project success variables and the
validation of the KPIs and CSFs scales. The chapter also presents theoretical
frameworks for the KPIs and CSFs scales separately and finally describes the
conceptual framework for assessment of performance of public sector construction
projects.
Chapter 6 discusses the research methodology used in carrying out confirmatory
research (phase II). The aim of this chapter is to confirm the KPIs and CSFs identified
in Phase I and show the relationships between CSFs, project success, overall project
performance and KPIs. The chapter mentions the various hypotheses proposed in the
study based on the conceptual framework developed in chapter 5. It further describes

10
the design of survey instrument, study site, target projects, target population and data
collection approach used in phase II.
Chapter 7 discusses the findings of confirmatory study (phase II). It presents the
demographic characteristics of respondents and projects and discusses the results of
confirmatory factor analysis (CFA) of both KPIs scale and CSFs scale. Further, it
presents the results of Structural Equation Modelling (SEM) that was used to
determine the influence of CSFs on project success, the association between project
success and overall project performance and the relationships between overall project
performance and the KPIs. The results of tests of hypotheses are also presented and
discussed.
The final part of the thesis, chapter 8, describes the summary of results, managerial
implications, recommendations, limitations and direction for future research.
1.8 Assumptions of the Study
There are three assumptions made in this study. First, this research assumed that the
experts were capable of accurately articulating their viewpoints regarding the
performance measurement variables and project success variables which were
administered to them for pilot survey. Secondly, this study assumed that the
stakeholders from all the three categories namely clients, consultants and contractors
are equally capable of judging performance of construction projects. It is further
assumed that all three stakeholders’ perspectives are based on identical experiences
with similar types of projects, though it is acknowledged that these stakeholders’
perception may be influenced by their previous experiences with the private projects
too. In scale development, it is assumed that the measure used is assessing what it is
presumed to assess.
1.9 Definition of Terms
Project: Any human undertaking that has a clear beginning and a clear end. In the
current study, a project is defined in terms of the various construction activities which
are undertaken within a given timeline with an objective of having constructed a
facility for the use of the community.
Project management: The process of planning, organising, executing and monitoring
of project construction activities.

11
Construction: This is the process in which an infrastructure is developed,
Construction Project: This refers to all those activities and resources necessary for
coming up with an infrastructure for occupation by the end users,
Funding: Refers to the provision of the required capital/fund for project construction.
Rework: Refers to working again i.e. the process of repeating work that had not been
done properly the first time.
Time overrun: Also known as schedule delay, time overrun is the excess time by
which actual time exceeds the scheduled time of the project.
Cost overrun: This is the amount by which the actual expenditure exceeds the
budgeted cost of the project. It can also be referred to as cost escalation.
Project Performance: This is the extent to which a project achieves the intended
objectives on prescribed metrics. In this study project performance is expressed in
terms of time, cost, quality, safety, site disputes and environmental impact.
Key performance indicators: Metrics upon which performance is measured.
Time Performance: The degree to which a project achieves its time targets and is
measured on the basis of scheduled time and the actual time taken by the project.
Construction Time: The number of days from the commencement of work on site to
the practical completion point.
Cost Performance: This is a comparison between actual expenditure and budgeted
cost.”
Quality performance: During project inception, certain technical and quality
specifications are prescribed for a project. The extent to which a project adheres to the
specifications indicates the level of its quality performance.
Safety performance: This is the extent to which a project adheres to safety standards.
It is reflected through the number of accidents and/or fatalities experienced.
Site dispute performance: Refers to work disruptions that result from disagreements
during and after project construction.
Environmental impact performance: The impact of constructed facility on the
surrounding environment.
Critical success factors: Those specific factors which are important if a project has
to achieve its mission

12
Public sector construction project: A project that is publicly funded by central
government through CDF for the benefit of surrounding community.
Endogenous variables: These are the dependent variables in SEM i.e. constructs that
are influenced by other constructs.
Exogenous variables: In SEM, they are the independent variables i.e. constructs that
exert an influence on other constructs under study and are not influenced by other
factors. They are also said to be observed, measured, indicator, and manifest
variables.
“Mwanainchi”: A Swahili name for an ordinary citizen
Financial Year: In reference to Kenya, this is an accounting period that starts on 1st
June and has twelve consecutive months (52 weeks) up to 31th May of the next year
at the end of which a budget is read out.

13
CHAPTER 2: REVIEW OF LITERATURE
2.0 Introduction
This chapter presents an overview of public sector construction projects by
highlighting the definition, classification and construction phases of these projects.
Next, the chapter discusses the performance of public construction projects in terms
of KPIs that have been identified for performance measurement amongst public sector
construction projects and the CSFs that influence the success of these projects. Since
the concept of performance measurement is rooted in operations management
literature, the researcher relied heavily on the rich literature available in this
functional domain. Using the terms ‘project performance’, ‘performance criteria’
“project success”, ‘key performance indicators’ and ‘critical success factors revealed
a rich source of research articles, mainly in the journals published by numerous
publishers, in particular Elsevier, Emerald, IEEE Engineering management, American
Society of Civil Engineering (ASCE), Inderscience publishers and Taylor and Francis
during the period 1995-2013. The specific journals included Automation in
Construction, Building and Environment, Construction Management and Economics,
IEEE Transactions on Engineering Management, International Journal of Production
Economics, International Journal of Project Management, Journal of Cleaner
Production, Journal of Construction Engineering and Management, International
journal of project organisation and Management, Journal of Construction in
Developing Countries and Total Quality Management.
The last section highlights the research gaps in the existing literature and explains the
relationship between CSFs, project success, overall project performance and the
various KPIs as derived from literature.
2.1 Overview of public sector construction projects
This section of the study provides a description of the public sector construction
projects in developing countries. It defines public sector construction projects and
discusses the classification of construction projects in general. The section also
highlights the phases of construction projects.

14
2.1.1 Definition of construction projects
According to Kerzner (2006), a construction project is a complex set of activities and
tasks with a definite start date and a definite completion date and consumes resources
such as money, human resources, outputs and equipment in order to achieve specific
objectives. Further Project Management Institute (PMI, 2008) emphasizes that a
project is temporary because it has a defined beginning and a defined end in time as
well as defined scope and resources. It is also unique because it is not a routine
operation. Construction has generally been said to be a process in which material,
equipment and machinery are assembled into a permanent facility. It is generally
defined to encompass the creation of physical infrastructure (roads, railways,
harbours), other civil-engineering work (dams, irrigation projects, power plants), all
building work (including housing), as well as the maintenance and repair of existing
structures. Construction projects have been classified in several ways in order to
distinguish amongst them.
2.1.2 Classification of construction projects
The construction projects in most developing countries can be classified into various
categories depending on their complexity, scope and use. Shenhar (2001) argues that
despite all projects having certain features such as a goal, budget and timeframe, they
differ in several ways to the extent that “one size does not fit all”. Construction
projects can, therefore, be classified based on size as small, medium, large or mega;
ownership as private or public; use as residential, commercial, industrial or utility;
and scope as building or infrastructural projects. Among these categories of
classification, project scope provides a better classification of public construction
projects.
Accordingly, based on scope, a project is categorized as a building or an
infrastructural project. Infrastructural projects include engineering industries,
highway, heavy constructions and bridges (Grace, 2010). A building project could be
residential or non residential when it is further classified based on its use. Residential
construction projects include houses, townhouses, apartments, and cottages. Because
of its use, residential building construction is perhaps the most popular type of
construction projects undertaken in developing countries especially by the private

15
sector. Non residential buildings refer to institutional and commercial buildings that
cover a great variety of project types and sizes such as hospitals and clinics, schools
and universities, sports facilities and stadiums, large shopping centres and retail chain
stores, light manufacturing plants and warehouses and skyscrapers for offices and
hotels. Figure 2.1 shows the classification of construction projects.
Figure 2.1: Classification of construction projects
Institutional construction is a major part of public construction sector and is very
important for the development of a country to satisfy the varied needs of its people.
Infrastructural projects constitute a small part of the whole construction industry
although it is a very important part of the industry. These projects are generally
owned by big, for-profit industrial corporations such as manufacturing, power
generation, medicine, petroleum, etc. Specialized Industrial Construction usually
involves very large scale projects with a high degree of technological complexity such
as nuclear power plants, chemical processing plants, steel mills and oil refineries.
Highway construction involves the construction, alteration and repair of roads,
highways, streets, alleys, runways, paths, parking areas etc. It includes all incidental
construction in conjunction with the highway construction project. Heavy
construction projects usually involve projects that are not properly classified as either
CONSTRUCTION PROJECTS
Buildings Infrastructure
Non-residential Residential Highway Heavy commercial
Institutional Commercial

16
"building" or "highway." Examples of this type of project would be: water and sewer
line projects, dams, sewage treatment plants and facilities, flood control projects,
dredging projects, and water treatment plants and facilities. Halpin and Woodhead
(2006) provided a classification under three categories: (1) building and
infrastructure, (2) non residential and residential; and (3) institutional and
commercial.
The current study only concentrates on building projects that are non-residential as shaded in Figure 2.1. Though such projects could be either institutional or commercial, public sector construction projects majorly involve construction of institutional facilities such as Schools, Hospitals, Industrial Estates and Agricultural Markets. Regardless of the classification, every project is developed through a number of stages referred to as phases of construction projects (Kerzner, 2006; PMI, 2008), that are sequentially related.
2.1.3 Phases of construction projects
The construction of building projects is undertaken in a number of phases, each of which is a designated group of activities that normally result in a milestone. A number of scholars have described the phases of projects in terms of conception, planning, procurement, construction and start-up (Kerzner, 2006). Others have explained it in fewer stages: conception, design and construction (Puspasari, 2006).
PMI (2008) stated that there are four phases to a project namely (1) conception, (2) development, (3) implementation and (4) termination. These phases capture all the activities that take place in construction projects. The four different stages could also be termed as (1) Project conception and planning, (2) Project design and tendering, (3) Project construction and (4) Project operation and maintenance. This nomenclature better reflects the activities carried out during the four phases of construction projects.
Figure 2.2 presents the project life-cycle.
Figure 2.2: Phases of a construction project
Project conception and Planning
Project design and tendering
Project construction
Project operation and maintenance

17
According to the PMI (2008) description, project conception and planning is the
recognition of the need for creation of a physical structure. The project design and
tendering phase translates the primary concept into an expression of a spatial form
which will satisfy the owner’s requirements in optimum and economic manner. The
construction phase creates the physical form which enables realization of the design.
The last phase, that is, operation and maintenance phase examines whether the
physical structure satisfies the identified need. The current study examines the
performance evaluation at the construction phase as shaded in Figure 2.2.
2.2 Performance measurement amongst public sector construction projects
By engaging in the construction sector, national governments in developing countries
aim at improving the socio-economic condition and standards of living of its people.
However, public sector construction projects are characterised by the scarcity of
resources in terms of material, equipment and funding, which makes it essential on
the part of implementing agency to exercise utmost prudence while managing
expenditure with a view to realising the goal of public sector construction projects.
Different parties involved in the construction of public sector construction projects
differ in terms of their objectives. In such circumstances, a project would be deemed
to be successful when it addresses the objectives for which it was conceptualised.
Several researchers (Bryde & Robinson, 2005; Diallo & Thuiller, 2005) have noted
that a project is said to have been successful if it addresses the needs and requirements
of project stakeholders.
The stakeholders involved in public construction projects include the government
agencies, project designers, contractors and the community for which the project is
being undertaken. In many occasions, the government is the client of public sector
construction projects whereas the community constitute the beneficiaries for which
the project is being implemented. Wang and Huang (2006) reported that the most
important stakeholders of a construction project are the client, consultant and
contractor. They summarise the role of each of these stakeholders as follows:
• Project client shall procure construction contractor through bidding/tendering
and encourage independent and professional project management services
provided by consultant.

18
• Consultant and contractor shall perform their technical, organizational and
human responsibilities for the project.
• Construction contractor shall perform the construction in accordance with
relevant technical, management and contract specifications.
According to PMI (2008) the interest of stakeholders may be same, overlapping or
conflicting in nature, but the project implementing agency should attempt to
harmonise all these interests in order to achieve project success.
Several researchers (Zhao, et al., 2010; Yu & Kwon, 2011) have indicated that
client’s criteria for measuring performance is on the basis of completing the project
on schedule and budget while ensuring that the project function as per the intended
use (satisfy users and customers). Consultant’s criteria for measuring success are:
satisfied client (obtain or develop the potential to obtain repeat work), satisfactory
quality of architectural product, receipt of design fee etc. In addition, consultants
consider professional staff fulfilment (e.g. gain experience, learn new skills) and
meeting project budget and schedule as additional criteria of success. Contractors aim
at producing marketable product/ process that is appealing to the client, consultant
and other contractors while involving minimum cost. As they pursue profit objectives,
they seek to meet or exceed quality specifications so as to satisfy project clients.
Based on the stakeholders’ criteria, it is evident that there are some unique factors
associated with each of the three groups. The consultant, for instance, is looking for a
project that will increase the level of professional development and professional
satisfaction among his employees (Aaltonen & Jaakko, 2010). Safety, that would not
normally be an issue with the other two groups of stakeholders is a high-priority issue
for the contractors because their employees are at much more risk during the
construction of a building than the employees of consultants and clients during design
or operation of a building respectively (Bryde & Robinson, 2005; Diallo & Thuiller,
2005). A client is extremely interested in knowing that the building project functions
properly for the intended use and is free from long-term defects or lingering
maintenance problems.
Previously, performance of public construction sector has been measured on the basis
of the sector’s contribution to Gross Domestic Product (GDP) and increase in labour

19
productivity (Willis & Rankin, 2011). This approach has, however, been dismissed as
being impractical because contribution to GDP is a mere economic activity whereas
labour productivity is difficult to measure (Harrison, 2007). Henricsson and Ericsson
(2005) suggested performance evaluation of a public construction sector based on its
competitiveness but this could also not be operationalised. These shortcomings have
compelled project implementing agencies in the public sector to utilize performance
metrics popular among private sector construction projects with suitable
modifications. These performance metrics are known to be based on key performance
indicators (KPIs).
2.2.1 Key Performance Indicators (KPIs) of public sector construction projects
The various KPIs that have been considered for performance evaluation in existing
literature can be broadly classified into three categories: the traditional criteria of the
iron triangle, the five pillars proposed by OECD/DAC and the contemporary
measures.
2.2.1.1 Traditional criteria, the “iron triangle”
Majority of the researchers associated with construction project management have
mostly talked about the importance of time, cost and quality (Zuo et al., 2007;
Ahadzie et al., 2008; Kaliba et al., 2009; Kamrul & Indra, 2010) while evaluating the
performance of public or private construction projects. The use of these three metrics
can be traced back to the inception of project management concept in 1950s. As early
as in 1989, Kerzner reported that project management has been traditionally described
as managing or controlling company resources on a given activity, within time, within
cost and within performance (Kerzner, 2006).
Project time can be considered as being the duration from the inception of a project to
its completion. Two aspects of time are important in project management: planned or
expected project time and actual completion time. When actual project completion
time exceeds the planned time, such a project is said to have experienced a time
overrun or schedule delay. Delays are incidences that impact on project delivery
process and usually postpone project activities. This aspect of project performance has
been reviewed by several researchers using different approaches (Frimpong, Oluwoye
& Crawford, 2003; Williams, 2003; Assaf & Al Hejji, 2004; Kamrul & Indra, 2010).

20
Time performance can be considered upon three measures: construction time, speed
of construction and time variation (Chan & Chan, 2004).
A project cost includes the overall costs that are incurred on a project from inception
to its completion. It covers the tender sum, construction costs, costs that arise from
variations and modifications during construction as well as costs that arise from legal
claims such as litigation and arbitration (Chan & Chan, 2004). When the actual
project cost exceeds the budgeted cost, the project is said to experience cost overrun,
cost increase or budget overrun. Several researchers (Chan & Chan, 2004; Kaliba et
al., 2008; Patanakul & Milosevic, 2009) have emphasized the need to consider cost
when determining project performance in project management literature. Cost
performance on a project can be measured in terms of unit cost or as a percentage of
net variation over the overall cost as suggested by Chan and Tam (2000). Ali and
Rahmat (2010) used a cost element to describe project performance and specifically
stated that cost variance is calculated by the variance between the actual cost and the
budgeted cost of a project.
Previous researches have also indicated that project quality can be used to measure
the performance of a construction project (Jha & Iyer, 2006; Palaneeswaran, 2007;
Love et al., 2010; Ogano & Pretorius, 2010; Yung & Yip, 2010). In their article, Ali
and Rahmat (2009) indicate that BS 5750 (1987) defines quality as ‘The totality of
features and characteristics of a product or service that bear on its ability to satisfy
stated or implied needs. In project management, the emphasis of quality is on the
ability of the project to adhere to the set up specifications. Poor quality in projects
results in numerous reworks which unnecessarily undermine other project
performance indicators. The measurement of quality is subjective and varies from one
entity to another.
This traditional criterion of time, cost and quality has been hailed for having provided
a basis in evaluating the extent of success across projects (Cao & Hoffman, 2011),
being simple (Toor & Ogunlana, 2010), being easy and timely to measure (Willard,
2005) and its ability to capture the tangible benefits of the projects (Litsikakis, 2009).
The use of these three dimensions is still considered a good practice for some
projects, while for others it could undermine some important project outcomes. Critics

21
of these criteria have indicated that they do not adequately cover all aspects of
performance measurement (Gardiner, 2000), they are related to each other (Shenhar,
Asher, Dov, Stanislav, & Thomas, 2002) and are rigid in their evaluation of
performance amongst public sector projects (Bassioni, Price & Hassan, 2004).
Terming the three measures of performance (time, cost and quality) as efficiency
variables, Kylindri, et al. (2012) have stated that they have been over researched and
there is need for new variables. In order to improve a project evaluation system, one
has to consider differences in project characteristics, appropriateness of project goals
and changes taking place in project environment. A project performance measurement
criterion should consider diversity and both technical and social needs of the project
(Barclay and Osei-Bryson, 2010).
2.2.1.2 Performance criteria based on “five pillars”
In pursuit of a new criterion, major development agencies internationally, have
adopted the evaluation criteria defined OECD/DAC (Beck, 2006; Chianca, 2008) in
evaluating public sector projects. The definition contains five evaluation criteria that
should be used in assessing public sector projects: relevance, efficiency, effectiveness,
impact and sustainability. The relevance of a project describes the extent to which the
aid activity is suited to the priorities and policies of the recipient, donor and the
beneficiaries. Whereas the above definitions describe "relevance" as an ex-
ante element of evaluation, it can also be applied ex-post once the project is
completed and handed over to the beneficiaries. The ex-ante relevance of public
sector project is presumably taken care of during project identification and selection
phase. Within a particular community, public sector projects are identified by the
respective communities based on their needs (Wanjiru, 2008). Such projects undergo
rigorous approval procedure before their ultimate construction. This ensures that they
are relevant to the communities where they are constructed. At the ex-post evaluation,
one should ask whether the originally intended relevance has been realized. Such a
question can only be answered by the actual beneficiaries of the project when they
start reaping its benefits because economic growth and the general wellbeing of a
community can be noted during operational phase as they take time to realize.
Efficiency is a measure of how economically resources/inputs (funds, expertise, time,
etc.) are converted to results (Beck, 2006; Chianca, 2008). It includes the cost of

22
resources as well as the construction cost of the development. Effectiveness is the
extent to which the project’s objectives were achieved, or are expected to be achieved
and seeks to determine the factors that influence achievement or non achievement of
the objectives. Further, projects’ impacts refer to the direct or indirect positive and
negative, primary and secondary long-term effects produced by a project. This pillar
assesses whether the effects achieved correspond with the needs, problems and issues
that are to be addressed by the construction projects. Sustainability refers to the
continuation of benefits from a project after major development assistance has been
completed (Beck, 2006; Chianca, 2008). This is in reference to post implementation
phase and assesses whether the project will continue to operate as intended. It further
calls for the need for appropriate mechanism of financing the operational and
maintenance cost incurred in providing the intended services to the community. This
OECD definition, therefore, hardly covers ecological sustainability which is also
important in a public sector project.
The proposed five pillars, though considered an improvement over the iron triangle,
suffer from several weaknesses. According to Chianca (2008), these pillars focus
more on the needs of funding agency than on the needs of the targeted communities.
The definitions are ambiguous and overlapping especially those of relevance,
effectiveness and impact. Further, efficiency and sustainability merely focus on
monetary aspects and ignores the intangible elements that could bring about increases
in cost. These definitions, therefore, lack an objective measure upon which the pillars
can be operationalised (Chianca, 2008). Ngacho and Das (2013a) have argued that
difficulties in the operationalisation of these pillars pose a major challenge to the
project implementing agency in capturing the economic, social and environmental
dimensions of public sector projects. Attainment of the five pillars becomes further
complicated due to the uniqueness in the environment that surrounds these projects.
2.2.1.3 The contemporary measures of project performance
A number of researchers have advocated for a wider focus of construction project
performance. Some researchers (Ortega, 2000; Haslam et al., 2005; Billy et al., 2006;
Zuo, 2011) have argued that it is important to incorporate safety aspects of the project
in performance evaluation because the construction industry is the most unsafe

23
industry due to its high rate of fatalities. In most developing countries, the
construction industry is mainly labour intensive and the majority of the workforce
working on construction sites is unskilled. The workers are, therefore, exposed to risk
and health hazards inherent in construction projects that require adequate safety
provisions (Zuo, 2011). Project safety, being a humane issue, needs to be considered
separately from time, cost and quality dimensions. Few other researchers (David,
2009; Tabish & Jha, 2011) have given emphasis on dispute resolution which might
otherwise lead to disagreements amongst project participants and derail the project
objectives. Dispute resolution is part of stakeholder management and hence should be
part of project performance evaluation criteria (David, 2009).
According to Eriksson and Westerberg, (2011), construction projects have irreversible
impact on the local environment because construction processes not only consume
huge energy but also create the most waste, use large quantity of non-energy related
resources and are responsible for the most pollution. Environmental impact, being
indirect and long term in nature, can hardly be captured for inclusion under any of the
three traditional measures, but has implications on sustainability of the project within
the community. It is, therefore, necessary to include environmental impact into the
performance metric of construction project performance (Tsoulfas & Pappis 2008;
Chen et al., 2010; Medineckiene et al., 2010; Tan et al., 2011). Currently, a number of
regulatory incentives are pushing organisations to adopt environmentally friendly
construction methods to ensure that they develop the capability of delivering
sustainable projects within acceptable cost constraints.
Shao and Müller (2011) reported that community satisfaction is the ultimate goal of
every construction project and hence it must be considered while evaluating
construction project performance. This view is supported by Ali and Rahmat (2010),
CURT (2005), Chan and Chan (2004), who found that client/user /customer
satisfaction is an important goal of every construction project and hence should be
considered when evaluating project performance. However, Miles et al. (2008)
observed that community satisfaction is a consequence of overall project performance
and hence the same cannot be used as one of the metrics of construction project
performance but as an outcome of the overall construction project performance. It is
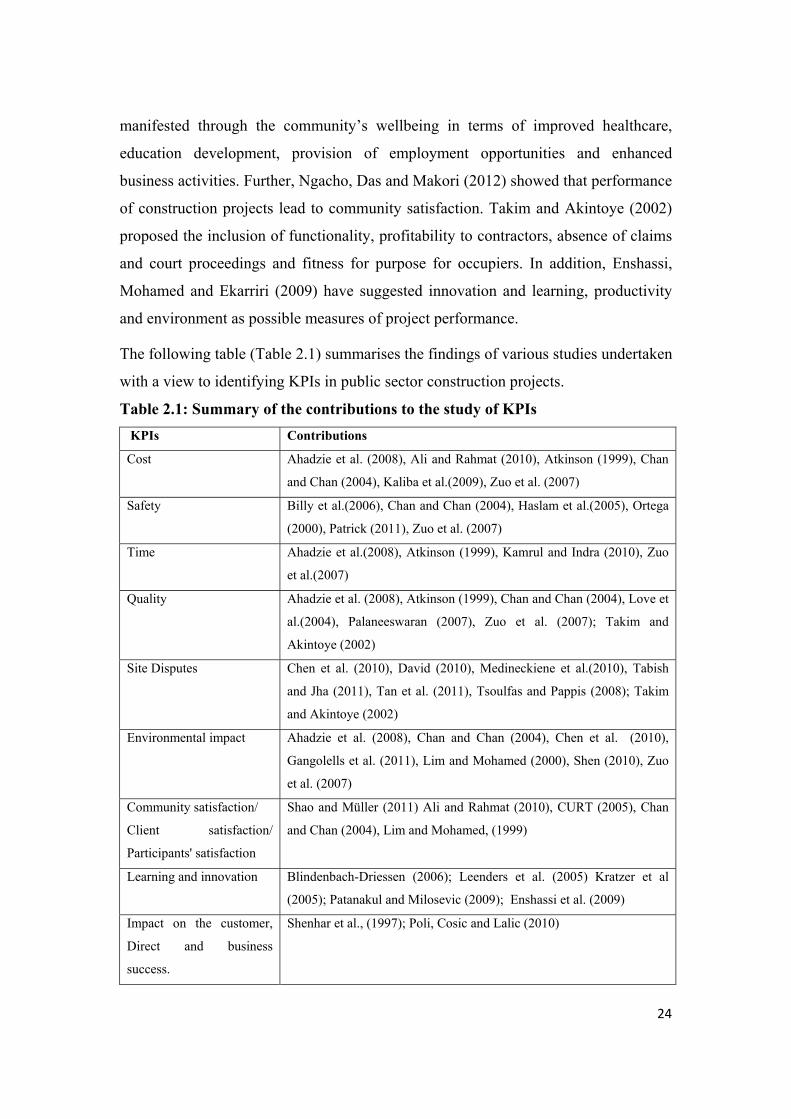
24
manifested through the community’s wellbeing in terms of improved healthcare,
education development, provision of employment opportunities and enhanced
business activities. Further, Ngacho, Das and Makori (2012) showed that performance
of construction projects lead to community satisfaction. Takim and Akintoye (2002)
proposed the inclusion of functionality, profitability to contractors, absence of claims
and court proceedings and fitness for purpose for occupiers. In addition, Enshassi,
Mohamed and Ekarriri (2009) have suggested innovation and learning, productivity
and environment as possible measures of project performance.
The following table (Table 2.1) summarises the findings of various studies undertaken
with a view to identifying KPIs in public sector construction projects.
Table 2.1: Summary of the contributions to the study of KPIs KPIs Contributions
Cost Ahadzie et al. (2008), Ali and Rahmat (2010), Atkinson (1999), Chan
and Chan (2004), Kaliba et al.(2009), Zuo et al. (2007)
Safety Billy et al.(2006), Chan and Chan (2004), Haslam et al.(2005), Ortega
(2000), Patrick (2011), Zuo et al. (2007)
Time Ahadzie et al.(2008), Atkinson (1999), Kamrul and Indra (2010), Zuo
et al.(2007)
Quality Ahadzie et al. (2008), Atkinson (1999), Chan and Chan (2004), Love et
al.(2004), Palaneeswaran (2007), Zuo et al. (2007); Takim and
Akintoye (2002)
Site Disputes Chen et al. (2010), David (2010), Medineckiene et al.(2010), Tabish
and Jha (2011), Tan et al. (2011), Tsoulfas and Pappis (2008); Takim
and Akintoye (2002)
Environmental impact Ahadzie et al. (2008), Chan and Chan (2004), Chen et al. (2010),
Gangolells et al. (2011), Lim and Mohamed (2000), Shen (2010), Zuo
et al. (2007)
Community satisfaction/
Client satisfaction/
Participants' satisfaction
Shao and Müller (2011) Ali and Rahmat (2010), CURT (2005), Chan
and Chan (2004), Lim and Mohamed, (1999)
Learning and innovation Blindenbach-Driessen (2006); Leenders et al. (2005) Kratzer et al
(2005); Patanakul and Milosevic (2009); Enshassi et al. (2009)
Impact on the customer,
Direct and business
success.
Shenhar et al., (1997); Poli, Cosic and Lalic (2010)

25
With the above measures of performance as shown in table 2.1, it is possible to
capture all the dimensions of performance of public sector construction projects.
However, these KPIs have been used mostly in isolation as they have managed to
focus on one or just a few dimensions. They have tended to be skewed towards either
economic dimension or social dimension or environmental dimension of public sector
construction projects.
Realization of the above KPIs depends on how project stakeholders have been able to
identify the success factors and accordingly allocate resources on these factors. The
success factors serve as facilitating factors for the success of a project.
2.2.2 Critical Success Factors (CSFs) influencing the success of public sector
construction projects
While identifying the performance indicators of construction projects, researchers
have come up with an innumerable number of items which have great potential to
affect different dimensions of project performance. Evaluating the performance on
this huge number of items is neither feasible, nor advisable. Koushki et al. (2005) and
more recently Ahsan and Gunawan (2010) found that project time and cost
performance get influenced by project characteristics, procurement system, project
team performance, client characteristics, contractor characteristics, design team
characteristics and external conditions. Chan and Kumaraswamy (1997) identified
eight causes of delay in a construction project. Kaliba et al. (2009) mentioned that
poor site management and supervision leads to both time and cost overrun of a
construction project.
As regards the quality of construction projects, research findings have revealed that
design changes, lack of quality systems, contractor selection, ineffective use of
information technology and inter-organizational interactions significantly influence
the quality of construction projects (Alwaer & Clements-Croome, 2010). In addition,
inadequate details in drawings and rigidity in project design (Kaliba et al., 2009;
Alwaer & Clements-Croome, 2010), lack of technical expertise (Kaliba et al., 2009),
and unavailability of right materials or right equipments in the construction site
(Kaliba et al., 2009) also affects its quality. Typically safety performance measure

26
can be evaluated through the number and the rate of fatalities and/or crashes and
incidences, emergency response times. According to Tabish and Jha, (2011), the
factors influencing site dispute performance criterion are thorough understanding and
definition of owners, regular monitoring and feedback by top management, adequate
communication amongst all project participants and the affected parties, availability
of adequate resources and timely decisions by top management. The main factors that
have been identified as impacting negatively on the environment include excessive
use of energy (Saparauskas & Turskis 2006), emissions into the air (Medineckiene et
al., 2010), releases to water, incineration and recycling process and inability to use
renewable materials in construction (Medineckiene et al., 2010) and poor construction
methods (Chen et al., 2010) amongst others.
Based on extensive literature review, Ngacho and Das (2011, 2013b) identified a large
number of variables that influence performance indicators. An extract of a summary
of these variables are presented in table 2.2, where citations are shown in the right
column of the table.
Table 2.2: Success variables and their impact on project success Success Variables KPI/s affected References Project location and Site conditions.
• Time • Cost • Environmenta
l impact • Safety
Abdullah et al. (2009); Blake (2006); Frimpong et al. (2003); Ibnu (2006); Le-Hoai et al. (2008); Long et al. (2004); Omoregie and Radford (2006); Murali and Yau (2007).
Project size and Design Complexity of project (Type, nature and number of floors).
• Cost • Time • Environmenta
l impact • Quality
Alwaer and Clements-Croome (2010); Jha and Iyer (2006); Kaming, et al. (1997); Othman, et al. (2006).
Project managerial actions (planning and control of project activities)
• Cost • Time • Quality • Site disputes
Abdullah et al. (2009); Alwi (2002); Assaf et al. (2006); Ibnu (2006); Long et al. (2004); Murali and Yau, (2007); Yung and Yip (2010).
Communication system among project participants
• Cost • Site disputes • Safety • Time
Abdullah et al. (2009); Abudayyeh et al. (2006); Aksorn and Hadikusumo (2008); Ibnu (2006); Long et al. (2004); Murali and Yau (2007).
Collaboration of project participants
• Quality • Safety • Site disputes • Time
Abudayyeh et al. (2006); Aksorn and Hadikusumo (2008); Al Haadiri and Panuwatwanich (2011); Jha and Iyer (2006); Marosszeky et al. (2002).
Contract modifications. • Site disputes • Cost • Time
Blake (2006); Koushki et al. (2005); Syed et al. (2003).

27
• Safety Quality, health and safety program on the site (Necessary variations)
• Time • Quality • Safety • Cost
Aksorn and Hadikusumo (2008); Al Haadiri and Panuwatwanich (2011).
Budget progress monitoring
• Cost Frimpong et al. (2003); Koushki et al. (2005); Le-Hoai et al. (2008).
Formal organization structure for dispute resolution
• Site disputes • Time.
Assaf et al. (2006); Essam (2006).
Financial capability and payment schedule of the Client.
• Time • Cost • Site disputes
Abudayyeh et al. (2006); Aksorn and Hadikusumo (2008); Frimpong et al. (2003); Koushki et al. (2005); Sweis et al. (2007).
The process of project approvals.
• Time Blake (2006); Marosszeky et al. (2002); Sweis et al. (2007); Syed et al. (2003).
Client’s experience on similar projects.
• Cost • Time • Quality
Abdullah et al. (2009); Ibnu (2006); Koushki et al. (2005); Long et al. (2004); Murali and Yau (2007).
Frequent and erratic changes by the client.
• Time • Site disputes.
Ameh et al. (2010); Azhar et al. (2008); Enshassi et al. (2009); Essam (2006); Ibnu (2006); Le-Hoai et al. (2008); Omoregie and Radford (2006).
Client’s ability to make timely and objective decisions.
• Time • Quality • Site disputes
Abdullah et al. (2009); Enshassi et al. (2009); Frimpong et al. (2003); Ibnu (2006); Long et al. (2004);Syed et al. (2003).
Client's emphasis on quick construction instead of quality
• Quality • Safety • Site disputes
Frimpong et al. (2003); Syed et al. (2003); Yung and Yip (2010).
Client's emphasis on low construction cost
• Quality • Safety • Site disputes
Abdullah et al. (2009); Azhar et al. (2008); Enshassi et al. (2009); Frimpong et al. (2003); Jha and Iyer (2006).
Consultant’s commitment to ensure compliance of construction work according to specification.
• Quality • Site disputes .
Alwi (2002);Syed et al. (2003).
Adequacy of design, specifications and documentations.
• Quality • Site disputes
Abudayyeh et al. (2006); Aksorn and Hadikusumo (2008); Al Haadiri and Panuwatwanich (2011); Alwi (2002); Blake (2006).
Design team experience and technical skills.
• Quality • Time
Abdullah et al. (2009); Blake (2006); Ibnu (2006); Long et al. (2008); Long et al. (2004).
Delay in production of design documents
• Time. Blake (2006); Sweis et al. (2007).
Variations to Original design during construction.
• Time • Cost • Site disputes
Koushki et al. (2005); Syed et al. (2003).
Management skill of Site Managers (in controlling workers and sub-contractors)
• Time • Cost • Quality • Minimum site
disputes
Abdullah et al. (2009); Ameh et al. (2010); Azhar et al. (2008); Enshassi et. al. (2009); Frimpong et al. (2003); Ibnu (2006); Le-Hoai et al. (2008); Long et al. (2004); Murali and Yau (2007); Sweis et al., (2007); Omoregie and Radford (2006).
Contractor’s technical skills and Experience.
• Cost • Time • Quality.
Abdullah et al. (2009); Ameh et al. (2010); Enshassi et al. (2009); Frimpong, et al. (2003); Ibnu, (2006); Long et al. (2004); Murali and Yau, (2007).

28
Size and skills of the labour force
• Cost • Time • Quality
Abdullah et al. (2009); Azhar et al. (2008); Ibnu (2006); Le-Hoai et al. (2008); Murali and Yau (2007); Sweis et al. (2007).
Construction method adopted
• Cost • Site disputes • Safety • Environmenta
l impact.
Abdullah et al. (2009); Alwi (2002); Long, et al. (2004).
Cash flow of the contractor (payments to sub-contractors and workers)
• Time • Cost • Site disputes
Abdullah et al. (2009); Essam (2006); Frimpong et al. (2003); Ibnu, (2006); Le-Hoai et al. (2008); Long et al. (2004); Murali and Yau (2007).
Availability of skilled and experienced workers.
• Time • Cost • Quality.
Abdullah et al. (2009); Azhar et al. (2008); Kaliba et al. (2009); Le-Hoai et al. (2008), Sweis et al. (2007).
Availability of the right material
• Cost • Time • Quality
Azhar et al. (2008); Blake (2006); Frimpong et al. (2003); Ibnu (2006); Kaliba et al. (2009); Le-Hoai et al. (2008); Long et al. (2004); Murali and Yau (2007); Sweis et al. (2007); Omoregie and Radford (2006); Yung and Yip (2010).
Adequacy of working capital
• Time • Cost.
Abdullah et al. (2009); Azhar et al. (2008); Ibnu (2006); Le-Hoai et al. (2008); Long et al. (2004); Murali and Yau (2007).
Availability of suitable equipment.
• Cost • Time • Quality • Safety
Aksorn and Hadikusumo (2008); Al Haadiri and Panuwatwanich, (2011); Frimpong et al. (2003); Ibnu (2006); Kaliba et al. (2009); Long et al. (2008); Murali and Yau, (2007).
Internal procurement challenges
• Time • Cost
Abdullah et al. (2009);Enshassi et al. (2009); Frimpong et al. (2003); Murali and Yau, (2007).
Social and cultural issues of the community.
• Environmental impact
• Time • Site disputes
Ameh et al. (2010); Koushki et al. (2005); Long et al. (2004).
Climatic conditions and ecological environment.
• Cost • Time • Quality • Environmenta
l impact
Jha and Iyer (2006); Koushki et al. (2005); Le-Hoai (2008).
Economic conditions prevailing at the moment (Boom or Meltdown)
• Cost • Time • Quality • Economic
Environment.
Abdullah et al. (2009); Ameh et al. (2010); Azhar et al. (2008); Enshassi et al. (2009); Frimpong et al. (2003); Ibnu (2006); Le-Hoai et al. (2008).
Political conditions and industrial relations.
• Cost • Site disputes. • Safety. • Environment
impact
Blake (2006); Gangolells (2011); Jha and Iyer (2006); Marosszeky et al. (2002); Syed et al. (2003).
Technological sophistication.
• Quality • Cost • Environment
impact
Alwaer and Clements-Croome (2010); Frimpong et al. (2003); Love et al., 2010; Long et al. (2004).
Adapted from Ngacho and Das (2013b)

29
Researchers have attempted to identify the common characteristic features of
construction projects and classified these features into CSFs. While doing so, there
has been, however, no general agreement regarding one uniform grouping of
characteristic features into CSFs (Ameh et al., 2010). The classification has been
based on which factor/s is/are important to its success depending on the type and
nature of projects. Koushki et al. (2005) categorized the CSFs into four groups, viz.
(1) industry and environment related, (2) contractor related, (3) material related and
(4) client’s finance related factors. According to Chan and Tam (2000), there are five
major groups of factors namely (1) project related factors, (2) project procedures, (3)
project management actions, (4) human-related factors and (5) the external
environment. Odeh and Battaineh (2002) classified projects into (1) client related, (2)
procurement related, (3) environment related, (4) consultant related and (5) client
related factors.
The above review reveals that the success factors amongst construction projects are
based on the project itself, the construction stakeholders and the political, social and
economic environment prevailing at the moment as stated by Tiong (1992 cited in
Long et al., 2004). Out of the various CSFs, some are relatively new especially those
revolving around material and equipment supply and also the factor relating to the
environment. These factors point to the need for sustainable construction and is
considered to have significant influence on the success of construction projects
(Ngacho and Das, 2012). There is, however, no consensus on the classification of
factors influencing the success of construction projects. Further, the studies indicate
that these CSFs have not been identified on the basis of specific KPIs of public sector
construction projects.
2.3 Research gaps in literature
The foregoing discussion suggests that the project management literature is replete
with studies pertaining to both KPIs of projects as well as CSFs influencing the
success of the same. However, the following gaps are clearly identifiable from the
literature.
• The identification of KPIs based on economic, social and environmental
dimensions

30
• The identification of CSFs on the basis of KPIs
The influence of CSFs on project success
The association between project success and overall project performance.
The association between overall project performance and performance on
individual KPIs.
The current study is an attempt to fill this gap by conceptualising the relationship as
shown in Figure 2.3
Influences Predicted by
In terms of
Figure 2.3 Relationship between critical success factors and key performance
indicators
In Figure 2.3 several set of CSFs, namely human factors, supply chain related factors,
industry and environmental factors, financial or contractual obligations, project
characteristics as well as management practices and procedures influence the success
of public sector construction projects. Project success is then predicted through
overall project performance which, in turn, is expressed in terms of time, cost, quality,
site disputes, safety, environmental impact, community satisfaction, project
productivity, learning and innovation.
Critical success factors 1. Human Factor
Client related Consultant related Contractor related
2. Supply Chain related Factor
Material Supply factors
Equipment Supply factors
Labour availability 3. Industry and Environmental factor
Social Economic Ecological
4. Financial/Contractual obligation 5. Project characteristics 6. Project management and procedures
Key Performance indicators • Time • Cost • Quality • Site disputes • Safety • Environmental
impact • Community
satisfaction • Project
productivity • Learning and
Innovation
Overall Project Performance
Project success

31
CHAPTER 3: PUBLIC CONSTRUCTION SECTOR IN KENYA AND THE
CONSTITUENCY DEVELOPMENT FUND (CDF): AN OVERVIEW
3.0: Introduction
This chapter provides an overview of Kenya including its geographical location and
important demographic, political and economic features that distinguish Kenya from
other countries. This is followed by a review of public construction sector
emphasizing the previous efforts of the government directed towards the improvement
of this sector. The third section describes the background of Constituency
Development Fund (CDF), the nature of CDF projects and its implementation. The
last section focuses on the performance monitoring practices of CDF construction
projects, in Kenya.
3.1 Facts on Kenya
Kenya is situated in the Eastern part of the African continent between 5 degrees north
and 5 degrees south latitude and between 24 degrees west and 31 degrees east
longitude. It is almost bisected by the equator. The country exercises a significant
socio-economic and political influence in African continent through African Union
(AU), Intergovernmental Authority on Development (IGAD) and East African
Community (EAC). Ethiopia and Sudan border it to the North; Uganda to the West;
Tanzania to the South; Somalia to the northeast; and Indian Ocean to the southeast.
Map 3.1 shows the location of Kenya in Africa and also reveals its neighbouring
countries.
The coastline is about 536 kilometres. The total land area is about 582,650 square km
of which 569,250 square km constitutes dry land while water takes the rest of about
13,400 square km. Approximately, 80% of the land area is arid or semi-arid and the
remaining 20% is arable consisting of high to medium potential agricultural land. The
country has diverse physical features, which are a major source of tourist attraction.
These include vast plains which are home to world famous game parks and reserves;
the Great Rift Valley, which runs north to south and whose floor has provided
potential for geothermal power generation; Mount Kenya, the second highest
mountain in Africa at about 5,199m above sea level; Lake Victoria, the largest
freshwater lake on the continent supporting a major fishing industry in the East Africa

32
region; Lake Nakuru, a major tourist attraction because of its flamingos; Lake
Magadi, famous for its soda ash; and a number of major rivers, including Sondu-
Miriu, Tana and Athi, which generate the hydropower resources of the country
Map 3.1: Map of Africa showing location of Kenya.
Currently, according to the 2009 housing and population census (KNBS, 2010), the
country’s population is about 40 million people, 75-80% of whom live in the rural
areas. The population distribution varies from 240 persons per square km in high
potential areas to 4 persons per square km in arid areas. 20% of arable land supports
80% of the population. The remaining 20% of the population lives in 80% of arid and
semi-arid land. Kenya is faced with a high dependency burden, with over 50% of the

33
population below 15 years of age. This has resulted in high dependence ratios placing
excessive demands on social services such as primary education and health care.
However, the inter-censual population growth rate declined from 3.9% per annum
during 1969-79 to 2.9% during 1989-99. The country’s population is characterized by
high infant mortality and death rates, low and declining life expectancy, slightly
increased fertility rates (from 4.7 children per woman in 1995-1998 to 4.8 in 2000-
2003, then 4.9 in 2007-2010), and declining population growth rates (which could be
attributed to the HIV/AIDS pandemic). All these reflect the enormous challenges
faced by Kenyan government in achieving some level of Development. The
population remaining in absolute poverty was estimated to be 44.7% in 1992, 52% in
1997, 56% by 2002 and 58% in 2009. The National Revenue is mainly derived from
tourism and taxation and supplemented by donations and grants by Kenya’s
Development partners. Kenya, specifically Nairobi, still functions as the hub of East
Africa.
.
Map 3.2: Map of Kenya showing Administrative (provinces) units
Western Province

34
For administration purposes, the country is divided into eight provinces, namely
Central (1 ), Coast (2), Eastern (5), Nairobi (4), North Eastern (3), Nyanza (6), Rift
Valley (7) and Western (8) (as shown in Map 3.2). The numbers mentioned in
brackets adjacent to each province indicate the location of the said province as
indicated in the map.
Map 3.2 shows these 8 administrative units, referred to as provinces. Rift valley (7) is
the largest in size, followed North Eastern (3), Eastern (5), Coast (2), Nyanza (6),
Western (8), Central (1) and Nairobi (4) is the smallest in size as shown.
Map 3.2 further shows that the Western province is situated in the western part of
Kenya. It has a total area of 8361square km and a population of 5.4 million (according
to 2009 Housing and population census). The new constitution has split the country
into a total of 47 counties each to be headed by a governor at the county level and
represented by a senator at the national level. Western province has 4 counties namely
Kakamega, Vihiga, Bungoma and Busia as revealed in the left side of map 3.2.
Further, these counties are divided into a total of 24 constituencies. The country has
two legislative houses: a national assembly with 290 elected and 12 nominated
Members of Parliament (MPs) as well as 47 county women representatives and senate
with 47 elected senators and 6 nominated senators.
The Gross Domestic Product (GDP) in Kenya was worth 33.62 billion US dollars in
2011. The GDP value of Kenya is about 0.05 percent of the world economy.
Historically, from 1960 until 2011, Kenya GDP averaged 9.49 USD Billion reaching
an all time high of 33.62 USD Billion in December of 2011 and a record low of 0.90
USD Billion in December of 1962. According to Economic outlook (2012), the
economy experienced moderate growth of 4.4% in 2011 and 4.2% in 2012 and is
expected to reach 4.5% in 2013 and 5.2% in 2014.The main sectors that drive the
economy of Kenya include agriculture, manufacturing, tourism, building and
construction, transport and financial intermediation. In 2011, the Kenya’s economy
was majorly driven by financial intermediation, tourism, agriculture and building and
construction (African Economic Outlook, 2012). The building and construction sector
has, however, played a key role in the economic growth in Kenya over the past five
years. The African Economic Outlook (2012) attributes this to the increased bank

35
credit to the private sector for real estate development and the intense investment in
infrastructure projects being undertaken by the government all over the country.
3.2 Construction sector in Kenya: Early government initiatives
The construction sector in Kenya is very important for the Kenyan economy because
it contributes close to 5 per cent of the country’s gross domestic product (GDP) and
employing more than one million people. According to report by Kenya National
Bureau of Statistics (KNBS), the economy of Kenya grew by 4.9 per cent in the first
quarter of 2011 due to the improved productivity in the construction industry. This
can be attributed to higher public investment in infrastructure by the Government of
Kenya (African Economic Outlook, 2012).
Kenya has engaged in deliberate effort to improve the construction sector since
attaining her independence in 1963. In 1967, through an Act of Parliament, the
Kenyan government set up a National Construction Corporation (NCC) to train
African contractors in construction business management. The main function of NCC
was to “promote, assist, and develop the construction industry” (Republic of Kenya,
NCC Act 1972). It also operated as an architectural and engineering firm and it can
own and manage either a management institute or a technical college, operate
manufacturing business and own construction equipment for commercial use.
Furthermore, the NCC Act permitted the corporation to have a say in the design of the
syllabi at institutions that train personnel for the construction industry. This
corporation, however, lasted for only 25 years as it was disbanded in 1992 mainly for
having failed to indigenize the construction industry.
Currently, the government’s policy guidelines for various sectors in the economy are
contained in the development plans published by the Ministry of Economic Planning
every five years. Those on the construction industry can be divided into two direct
and indirect interventions. Under indirect intervention, the government imposed a
training levy and set up a craft training centre for training of employees in the
construction industry. The direct intervention policy involves setting aside some
categories of work for African-owned businesses.The construction industry in Kenya
is expected to see tremendous growth as a result of government spending on major
infrastructure projects around the country.

36
Public sector construction projects in Kenya, prior to 2003 were identified, planned
and implemented by the government line ministries or their implementing agencies in
state corporations. In most cases these projects were influenced by partisan politics
thus falling short of expectations. It is due to this that the government thought of
decentralizing public sector construction projects in an effort to realize equitable
development in all regions. Among the decentralization programmes formulated were
District Development Grant Program (1966), the Special Rural Development Program
(1969/1970), District Development Planning (1971), the District Focus for Rural
Development (1983 -84) and the Rural Trade and Production Centre (1988-89).
Though these programmes’ aim was to attain development in all parts of the country,
they failed due to the problem of funding. It is against this background that in 2003
the Constituency Development Fund (CDF) was created through an act of parliament
with the aim of ensuring balanced regional development by providing funds to
parliamentary jurisdictions (constituencies) to fight poverty.
3.3 Constituency Development Fund (CDF) in Kenya
The Constituency Development Fund (CDF) was established through an act of
parliament, CDF Act (2003), for the purpose of devolving national resources to
achieve rapid socio-economic development at constituency level through financing of
locally prioritized projects and enhanced community participation (Mapesa &Kibua,
2006). According to the CDF Act (2003) the Government should allocate at least
2.5% of the ordinary revenue collected to CDF (Wanjiru, 2008). However, this
amount has been increasing consistently and currently stands at around 4%,
translating to an average of Ksh. 50 million (1 USD=Ksh.85), for each of the 210
constituencies in Kenya per year (Baskin, 2010). According to the CDF Act (2003),
the stakeholders included in the management of the fund include the public and
community groups, CDF management agencies, existing government institutions, and
Member of Parliament for each constituency.
Under CDF Act (2003), funding is usually done for a completely new project or for
renovation of an existing facility and could also include acquisition of land. Further
the project must be development oriented and not recurrent, community based and
must suitably be defined and auditable (Mapesa & Kibua, 2006). CDF projects like

37
other community development projects (Ika et al., 2012), are based on five main
pillars: relevance, efficiency, effectiveness, impact and sustainability. This implies
that the projects must be suitable for the needs of the community and should use less
costly resources within the community. At their completion, they should meet the
desired objectives so as to lead to a change within the community. Further, the
benefits of the project to the community should be sustained even after the funding is
discontinued. The target projects include Educational facilities (32%), Health Care
facilities (26%), Water and Physical Infrastructure including Light Industries (27%)
and Agriculture, Security, Social Services and Wildlife (15%), (Baskin, 2010).
Figure 3.1: Management structure of CDF construction projects (Adapted from
Barasa, 2010)
The Educational projects aim at upgrading several primary schools, secondary schools
and youth polytechnics as a way of infrastructural improvement to facilitate proper
learning in these institutions. The public health and sanitation projects focus on
setting up of new primary Healthcare units, upgrading of the existing facilities and
proper management of these units. In the Agricultural sector, the aim is to support the
commercialization of agricultural produce by providing the farmers access to
Constituencies Development Fund Board – Responsible for national administration and coordination of CDF
Constituencies Development Fund Committee (CDFC) – Manage CDF in the constituency
Project Management Committee (PMC) – Manage and oversee an individual CDF
District Projects Committee (DPC) – Responsible for coordination and harmonization at district level
Constituencies Fund Committee (CFC) – Parliamentary Committee which gives policy direction on implementation of CDF

38
wholesale and fresh produce markets and increasing efficiency in marketing and trade
of agricultural produce. Through industrialization, the government aims at
constructing and equipping “jua kali” shades (light industries) to facilitate
participation of youth as artisans and entrepreneurs.
Recently the Government has embarked on the projects aimed at meeting the
Millennium Development Goals (MDGs). More precisely, in the year 2007-2008,
budgetary allocations of more than Ksh 58 Billion went to devolved structures. One of
the devolved funds earmarked under this period was Constituency Development
Fund.
The CDF projects involve the participation of different stakeholders at different stages
starting from project identification to eventual implementation and monitoring
(Wanjiru, 2008).
3.3.1 Identification and selection of CDF projects
The representatives of the community identify a set of candidate projects depending
on the level of development of their locations and their preference for particular kind
of projects. These projects are then scrutinized to find out their feasibility and
suitability and are forwarded to the district level for the purpose of harmonization
with other projects selected from other locations.
As stated earlier, CDF is directed towards those projects thought to be beneficial to
the community at large. These projects include those that are Educational in nature,
address health needs of the community, provide a market for agricultural produce,
ensure adequate provision of water, provision of employment through
industrialization and also those projects that build roads and bridges. From the
communities’ perspective, these projects can be broadly classified into four main
categories: the Educational, Health, Agricultural and Industrial Estates.
a) Educational: In Educational Sector, the construction activities that are funded
by CDF include construction of classrooms, laboratories, workshops, teachers’
houses and dormitories. The expansion / renovation of schools and
construction of new ones has led to ease of congestion especially in primary

39
schools brought by the introduction of free primary and secondary education
by the government of Kenya.
b) Health Care: In the Health sector, CDF funds expansion / construction of
physical facilities like hospitals, health centres, dispensaries and maternities.
This has promoted the quality and accessibility of health care services to all
beneficiaries.
c) Agricultural Markets: There has been very little construction in Agriculture
sector but in recent times, CDF is funding construction of fresh produce
markets to enable small scale horticultural farmers to market their produce.
Part of the fund has been spent in areas like the improvement of livestock
sector through rehabilitation / construction of cattle dips.
d) Industrial Estates: CDF does not fund major facilities but during 2009/2010
financial year, in conjunction with ministry of industrialization, CDF started
putting up Industrial Estates to boost the informal sector, popularly referred to
as jua kali (hot sun).
Other construction works undertaken by CDF include opening up of feeder roads,
improvement of existing roads and construction of culverts and minor bridges,
provision of safe water and provision of bursary to the needy students. All these,
however, support the above four categories of projects. After the 2007 Amendments,
the Constituency Development Fund Committee (CDFC) can now acquire land and
buildings, although all assets remain the property of the CDF Board. CDF does not
fund private enterprises, merry-go-rounds, religious and political organisations and
activities, and recurrent costs.
3.3.2 CDF project procurement approaches
Project procurement has been described as an organized method or process and
procedure for clients to obtain or acquire construction products (Rashid et al., 2006).
The kind of procurement method used in securing a project is vital to the success of a
given construction project. In considering the procurement method to adopt, the
organization ought to have a clear understanding of project objectives and constraints,
define the roles of the various contracting parties and consider the fair allocation of

40
risks and obligations between the contracting parties. Specifically, while deciding
upon a project delivery approach, Tyson Building Corporation (2005) recommends
that one should consider:
• length of time you have to build your facility;
• the complexity of what you are building;
• does it comply with state procurement statutes
• available time and expertise of your in-house staff;
• the budget constraints;
• how much risk you are willing to assume in the building process
Rashid et al. (2006) discussed about different project procurement systems and the
effect of the different procurement systems on project performance. The common
project procurement methods are discussed below.
Design/Bid/Build: In this procurement approach, the client divides the award of
contract between two entities namely consultant and the contractor. The consultant
undertakes the design of the project while the contractor is responsible for
construction of the same. The consultant and contractor in turn, respectively engage
engineers and sub-contractors for execution of their work. Figure 3.2 shows this
procurement approach.
Figure 3.2: Design/Bid/Build project procurement approach
In this arrangement, it is the responsibility of the selected contractor to build the
facility according to the specification. In such an arrangement, the client exercises
Client
Consultant (Architect)
Engineer
Contractor (Builder)
Sub-contractor

41
more control over the project because of his authority to select the consultant and
contractor. This approach clearly outlines the responsibility of each party on the
project and hence makes it a fairly popular approach among CDF funded projects.
Design/Build: This is a project procurement method in which the client awards
contract to a single entity for both design and construction process. On the basis of
specific requirements of the client, the selected contractor undertakes the preparation
of blue print of the project including its design documents and actual construction of
the same. Diagrammatically, this can be shown as in Figure 3.3.
Figure 3.3: Design/Build project procurement approach
This approach has been favoured on the basis of ensuring early contractor
involvement in the project that is thought to improve constructability (Tyson Building
Corporation, 2005).
Competitive bid: In this project procurement method, different entities are hired for
the design and construction process. The unique feature of this procurement approach
is that the consultant is given the task to assist the client and represent the client’s best
interest, from design through occupancy by providing unbiased service to the client.
The consultant is involved in the day to day construction process of the project in
order to ensure that the project is constructed according to the specifications.
Whenever any dispute arises between the owner and the contractor, the architect
(consultant) operates as a third party to offer professional advice (Hill, 1986). This
approach has gained popularity with CDF funded projects because it is relatively easy
Client
Contractor-Designer and Builder
Sub- Contractors

42
to implement and also provides cushion to clients who are otherwise not professionals
in project construction.
Negotiated General Contract: Under this approach, a single prime contractor is
entrusted with the responsibility of undertaking the entire work. The contractor is
accountable for the activities taking place on the project. This approach creates
common project goals and objectives and acts as a single point of responsibility that
enhances project communications. The approach relies heavily on trust, experience
and quality. This delivery method significantly reduces construction problems and
poor workmanship. To protect the owner, it also provides quality services with checks
and balances.
Build–Own–Operate–Transfer (BOOT): This project procurement approach is not
very common amongst CDF funded projects because it is relatively new. In this
method, developers use their own resources to construct a public facility, operate it
for an agreed upon period while charging a fee and eventually transfer it to the
government or its agencies. This approach is used for relatively large Public sector
construction projects that can only be constructed through consortium. The
government or the relevant agencies, however, have to bear some financial and
viability risk.
Turnkey contract: Rashid et al. (2006) explain that in this procurement approach, the
contractor is commissioned to undertake the responsibilities for everything necessary
for construction, completion, commissioning and hand over of the project. Turnkey
implies that on project completion, the contractor hands over the key to the client for
successful operationalisation of the project.
3.3.3 Implementation of CDF projects
Once funds for a project are approved, tendering has been done and the
contractors/consultants have been identified, the next stage includes the
implementation of the project including making purchases, giving out payments,
keeping records, overseeing the construction work to ensure that it is done according
to specification, and eventually handing over the completed project to the community
or to the relevant government department. All CDF funded projects are managed by
project management committees (PMCs), consisting of members who manage the

43
projects on behalf of the community. These PMCs are recognised as public entities
and are subjected to various government financial regulations. CDF funded projects
are implemented by four parties.
• Clients (PMCs)
• Consultants (Architect/Designer)
• Contractor
• Community
Clients (PMCs): A client could be an individual or a group of individuals or an
organization that owns the project. They define project requirements, functions and
services the project is expected to deliver and are responsible for provision of project
funds. A client can also participate in day to day construction project by actively
employing a construction manager. In the present study, clients are the various project
management committees (PMCs) who represent the community during construction
process.
Consultants (Architect/Designer): These are firms or individuals licensed by the
state to practice architecture. They may also possess a background on structural
engineering and may be hired by the client to design the project. They sometimes
monitor the construction of the project in order to assure that construction is being
undertaken according to plans and specifications prepared by the architect and
approved by owner and contractor. With regard to CDF projects, the consultants
include an official of the Ministry of Public Works and the line ministry responsible
for implementation of all government projects.
Contractor: This is the entity that directly interfaces with the client in order to
execute certain projects according to the prescribed specifications. They create the
facility based on project plans, specifications and contract documents and manage
different resources during the entire period of project construction.
Community: Community is said to be a social group of any size whose members
reside in a specific location, share public facilities and often have common cultural
and historical heritage. This is a group comprising every “mwanainchi” (a common
person) within the locality in which the projects are constructed. In the context of
public sector construction projects, a community refers to individuals or groups of

44
project beneficiaries residing in a particular area where the project has been
constructed.
3.4 Existing practices of monitoring the performance of CDF construction
projects
Once project construction is complete, they are transferred to the respective line
ministries which manage the projects on behalf of the government. The line ministries
provide necessary staff and ensure maintenance of the facilities through a cost sharing
policy in which the costs are borne by government and the community. Monitoring
and evaluation of completed projects is undertaken by the CDF monitoring Unit, the
National management Board, District Development Officer (DDO), relevant
government line ministries, and other national agencies like the National Taxpayers
Association (NTA). Wanjiru (2008) reports that at present, the monitoring systems
instituted under the CDF Act (2003) are not thorough enough to evaluate performance
of the projects as it only entails “visits to the project site and a verbal report on the
project, which gives a very superficial picture.”
In fact, the Social Audit Guide booklet (Wanjiru, 2008) noted that CDF
implementation has encountered a number of operational and policy challenges which
include:
• Low utilization of completed facilities especially Educational and health
institutions due to lack of collaboration with line ministries especially on staff
requirement.
• Poor community participation and contribution to projects.
• Weak capacity to identify viable projects.
• Low technical capacity to implement public sector projects.
• Non-adherence to laid down government procedures, rules and regulations,
such as those governing public procurement.
• Poor management of transition during elections.
• Low utilization of technical officers in the implementation of projects.
• Too many small projects thinly spread with little impact.

45
Performance of public sector construction projects implemented by CDF is a matter of
public interest and the government of Kenya as it requires huge capital investment
such that poor management of the process lead to huge financial loss (Kimenyi,
2005). Different stakeholders have criticised the manner in which CDF projects are
conceptualised, managed and implemented. This has necessitated various studies at
both national and international levels mainly focusing on composition of CDF
committees, the role of CDF in poverty reduction (through provision of employment
and wealth creation), participation of women in CDF activities, distribution of CDF
projects in the constituency and the overall manner in which CDF funds are
distributed, managed and accounted for. The local organizations in Kenya that have
undertaken studies in this area include; Women Political Alliance-Kenya (WPA-K),
Institute for Policy Analysis and Research (IPAR), Kenya Institute of Public Research
and Analysis (KIPRA), Institute of Economic Affairs (IEA), University of Nairobi
(UoN), Parliamentary Select Committee on CDF and the mainstream media group.
The international community has also shown interest through organizations such as
Society for International Development (SID), European Union (EU), World Bank
(WB) and Abantu for Development.
Based on these studies, relevant watchdog organizations including the National
Taxpayers Association (NTA) and the CDF monitoring unit have been able to classify
constituencies as either good performers or poor performers as far as implementation
of CDF funded projects is concerned. Good performing constituencies have witnessed
significant improvement in people’s lives whereas in poor performers, the
constituents have suffered despite the availability of fund. This has led to the freezing
of fund accounts by the National Management Committee on CDF.
A few other researchers have raised concern on the way fund is run and the projects
implemented. Kimani, Nekesa and Ndung’u (2009) examined CDF processes and
structures as well as community participation in administration and monitoring of
CDF construction projects in order to determine why some constituencies have been
termed as good constituencies while others have been termed as bad. They found that
there are some practices that good constituencies undertake but the same are not
visible in the bad constituencies. The best practices include proper targeting of

46
projects to marginalised communities, transparency in the project tendering process
and involving the communities in identification and prioritization of projects.
Similarly, Romero (2009) reported that there have been concerns that participation of
residents in decision making has been limited and that the fund lacks transparency.
They proposed that voters should use information about the quality of the services
they receive from the facilities constructed in their areas when making voting
decisions. This would ensure that decentralization efforts have a positive impact on
poverty and make members of parliament (MPs) accountable to the people. Further,
Awiti (2008) sought to find out whether CDF has contributed to the efficiency in
resources use or has been hijacked by the politicians for their selfish gains. The
findings show that the lack of strong institutionalisation of CDF has facilitated the
process of wealth accumulation by the MPs through corruption and creation of a
platform for the fund patronage.
These studies reveal the need for further studies on the performance of CDF projects,
especially now that it is ten years since CDF was initiated. These studies will show
the impact that CDF has had on the communities whose projects have been
constructed in the past. The current study is likely to come up with recommendations
that can be implemented in order to strengthen the management of the fund and the
projects undertaken. This will ensure that the very objectives of decentralisation are
achieved.

47
CHAPTER 4: RESEARCH METHODOLOGY (PHASE I): EXPLORATORY
STUDY
4.0 Introduction
This chapter discusses the research methodology followed in phase I which involves
the identification of KPIs and CSFs through exploratory studies. It first enumerates
the key issues of Phase I study and describes the process followed in Research
Methodology. This encompasses the research instrument, reliability of the survey
instrument, study site, and identification of target population, selection of field
investigators and data collection.
4.1 Key Issues
The exploratory phase of the study seeks to address the following issues
Examine the characteristics of the projects surveyed in the current study in
terms of their types and procurement approaches used.
Examine the profile of respondents (client, consultant and contractor) involved
in the construction of CDF projects in terms of their experience on similar
projects and the value of the projects they had worked on in the past.
Examine the status of the projects surveyed in terms of the occurrence of cost
overrun, time overrun and quality defects.
Identify the appropriate KPIs for performance measurement of public sector
construction projects.
Identify the CSFs based on KPIs that influence the success of public sector
construction projects.
4.2 Process followed in Research Methodology (Phase I)
The study commenced with an extensive literature review in order to gain an
understanding of the domain of project performance and project success. This formed
a basis of developing performance measurement variables and project success
variables. The insights from experts comprising academicians and practitioners were
then sought through in order to conceptualise performance measurement of public
sector construction projects. This was followed by the design of a preliminary

48
questionnaire. The questionnaire was presented to the same experts and a pilot survey
amongst a few representative respondents was conducted. The questionnaire was
refined based on the feedback of the pilot survey and finally administered to clients,
consultants and contractors involved in the construction of CDF projects in order to
collect relevant data for the study. Gain an understanding of the
meaning and domain of project performance and project success.
Discuss the concept of project performance and project success with experts and academicians in order to conceptualise the project performance measurement.
Design a preliminary questionnaire based on literature review and viewpoints of experts. Present the questionnaire to the same experts for their comments and revise it appropriately.
Conduct a pilot survey on a few selected respondents and make appropriate adjustments to the scale.
Select field investigators and administer the revised questionnaire to a larger group of project stakeholders (Survey I)
Conduct Exploratory Factor Analysis to come up with a scale of multiple items for assessing performance of construction projects.
Figure 4.1: Sequence of research followed in Study Phase I.
The data collected pertains to demographic characteristics of the projects and
respondent’s profile, performance measurement variables and project success
variables. Data analysis was undertaken using descriptive statistics at the preliminary
PHASE I:
EXPLORATORY
STUDY
Literature Review
Insights from Experts
Design of survey instrument
Pilot survey
Data Collection I
Refinement of the survey instrument
Expected Outcome
A multiple-item measurement scale for - Performance measurement variables of
construction projects
-Variables influencing project success

49
stage to provide insights and more detailed analysis was done using Exploratory
Factor Analysis (EFA). Both SPSS and AMOS software were employed to aid the
analysis. The result of EFA forms the basis of identifying performance measurement
variables and project success variables amongst public sector construction projects.
Figure 4.1 depicts the overall research sequence adopted by this study.
4.3 Design of Survey Instrument
The information gathered through literature review provided background information
on evaluation of public sector construction projects. A list of performance
measurement variables and success variables relevant to CDF construction projects
was derived from literature and shown to 5 experts comprising 2 professors in the area
of project planning, 2 practitioners and 1 consultant in order to secure their viewpoints
regarding the suitability of the same in performance measurement of Public sector
construction projects in developing countries. Both the professors possess more than
10 years of teaching and consulting experience for many government projects. Due to
their rich experience, they were thought to be familiar with economic, socio-cultural
and political environment surrounding various projects earmarked for this study. The
two practitioners were chairmen of Kenya association of contractors, Busia and
Kakamega counties, Western Kenya. The choice of these practicing managers was
based on their rich experience with construction projects in their respective regions.
The fifth expert, a regional public works officer in charge of the Busia County since
2003, is responsible for all CDF construction projects funded by the Government in
Busia County. The experts confirmed that the measurement items identified were
relevant to CDF construction projects in Kenya.
The literature review coupled with the feedback received from the experts on the
performance measurement items enabled the researcher to design a structured
questionnaire for the purpose of assessing the performance of CDF construction
projects. Questionnaire was divided into three sections, each section addressing
covering a different aspect of performance evaluation among CDF construction
projects. The first section covers the demographic characteristics while the second and
third section deal with the variables relating to project performance and project
success respectively.

50
Section A: Demographic characteristics of projects and respondents’ profile
This section of the questionnaire contains questions relating to the demographic
profile of the respondents (i.e. whether they acted as clients, consultants or
contractors), their experience associated with construction projects in general and
CDF construction projects in particular and the type of CDF projects they are
currently involved in. Further this section seeks information on the procurement
approaches followed in the current projects, the budgeted and actual construction cost
of the project, the scheduled and actual duration of the project and the variations
introduced on the project during construction.
Section B: Variables relating to project performance measurement
The second section contains questions pertaining to the perception of the respondents
on their level of agreement on various statements representing different aspects of
project performance. A total of 35 performance indicator variables were identified. A
five-point Likert scale was used as a response format for different variables with the
assigned values ranging from 1 = Strongly Disagree to 5 = strongly Agree.
Section C: Variables relating to project success
This section contains questions relating to those facilitating factors that lead to project
success. A total of 30 success variables were identified. To obtain responses on these
30 variables, a five-point Likert scale was used as a response format for different
variables with the values ranging from 1 = Strongly Disagree to 5 = strongly Agree.
The respondents were required to indicate their perception on the success variables.
The purpose of sections B and C of the questionnaire was to secure opinions of the
respondents on 35 performance measurement variables and 30 success variables
respectively with reference to a specific project they had been involved in. The
questionnaire was presented to the same experts once again with a view to seeking
their expert opinion on the adequate and appropriate coverage of all the items
affecting the performance of construction projects and also the user-friendliness and
overall workability of the questionnaire. They stated that some of the questions need
to be rephrased for ease of understanding, given the varying level of education of the
prospective respondents. The entire exercise ultimately helped the researcher in
achieving the content validity of the questionnaire. With the help of language experts,

51
the questionnaire was also translated into local (Swahili) language for those
respondents, who cannot properly understand English language.
4.4 Reliability of the Survey Instrument
In order to find out the reliability of the survey instrument, a pilot survey was carried
out amongst 5 contractors (including 2 sub-contractors), 4 consultants and 21 clients,
who were working on ongoing construction projects. The sample used in this survey
was drawn primarily from a database of contractors, consultants and clients
maintained by the CDF regional office in Western Province. These respondents were
found to have over 7 years of experience in the construction industry and had been
involved in the construction of CDF projects for at least 3 years. Further, they had
handled over 4 CDF projects per year in various constituencies previously. This bears
testimony to the fact that these respondents were quite experienced in providing
relevant information requested in the questionnaire.
4.4.1 Validity and Reliability of project performance measurement variables
In the first stage, the distribution of responses of each measurement item amongst 30
respondents was checked through minimum score, maximum score, mean and
standard deviation of scores. Table 4.1 summarises these scores.
The minimum and maximum values of the above variables were found to be 1 and 5
respectively for 33 out of 35 variables, which indicates that in general, the
respondents used the entire 5 point survey scale. The mean score ranged between 2.25
(Fatalities did occur –PV22) and 4.03 (Proper medical facilities provided –PV35).
The standard deviations were all found to be greater than 1 except in two variables
namely “All stakeholders supervised project quality” and “Proper medical facilities
provided”. Despite their low standard deviations, these variables were not deleted
because of their theoretical significance in the measurement of construction project
performance.

52
Table 4.1: Descriptive statistics of performance measurement variables obtained through pilot survey
Performance Indicator variables (PV) Mini mum
Maxi mum
Mean Std. Dev.
PV1: No increase in materials cost 1 5 2.93 1.461 PV2: Labour costs remained stable 1 5 2.97 1.217 PV3: Minimum variations in cost. 1 5 2.73 1.258 PV4: Equipments purchased at pre budgeted rates. 1 5 2.93 1.285 PV5: Resources matched budget. 1 5 3.40 1.329 PV6: No incidences of frauds 1 5 3.23 1.431 PV7: No incidences of trade union agitation 1 5 2.90 1.348 PV8: No serious dispute due to specifications 1 5 2.93 1.258 PV9: Disputes due to frequent changes 1 5 2.77 1.165 PV10: Dispute resolution meetings were held regularly 1 5 3.07 1.285 PV11: No financial claims at completion 1 5 3.17 1.392 PV12: Adverse effect on quality of groundwater level 1 5 3.33 1.213 PV13: Timely delivery of resources 1 5 3.07 1.363 PV14: A clear plan was formulated 1 5 3.07 1.258 PV15: No design changes 1 5 3.00 1.114 PV16: Harmonious relationship on site 1 5 3.00 1.259 PV17: Project has led to air pollution 1 5 2.77 1.331 PV18: Project has led to depletion natural resources 1 5 3.00 1.313 PV19: Project has led to increased solid waste 1 5 3.10 1.094 PV20: Accidents were reported 1 5 2.57 1.194 PV21: Near misses occurred 1 5 3.13 1.306 PV22: Fatalities did occur 1 5 2.30 1.489 PV23: Utilised environmentally friendly technology. 1 5 2.40 1.133 PV24: Led to the increased release of toxic materials 1 5 2.93 1.461 PV25: No delays in securing funds. 1 5 3.43 1.165 PV26: At handover there were no apparent defects 1 5 3.33 1.269 PV27: Contractors were often called back to repair defects. 1 5 3.27 1.143 PV28: No effect of weather and climatic conditions. 1 5 3.43 1.165 PV29: Utilised reusable and recyclable materials. 1 5 3.30 1.343 PV30: Right material was used for the construction work. 1 5 3.40 1.453 PV31: Employees possessed requisite skills. 1 5 2.87 1.279 PV32: A sound QMS was adhered to. 1 5 3.10 1.242 PV33: Workers were trained on positive attitudes 1 5 3.47 1.196 PV34: All stakeholders supervised project quality. 2 5 3.97 .964 PV35: Proper medical facilities were provided 2 5 4.03 .964

53
In the next stage, scale reliability (internal consistency) was inspected using
Cronbach’s coefficient alpha as shown in table 4.2.
Table 4.2: Item-to-total correlations of performance measurement variables obtained through pilot survey Performance Indicator variables (PV) Corrected
Item-to-total correlation
Cronbach's Alpha if item deleted
PV1: No increase in materials cost .469 .732 PV2: Labour costs remained stable .361 .739 PV3: Minimum variations in cost. .469 .734 PV4: Equipments purchased at pre budgeted rates. .455 .734 PV5: Resources matched budget. .275 .744 PV6: No incidences of frauds .473 .732 PV7: No incidences of trade union agitation .224 .746 PV8: No serious dispute due to specifications .090 .753 PV9: Disputes due to frequent changes -.107 .761 PV10: Dispute resolution meetings were held regularly .168 .749 PV11: No financial claims at completion .386 .737 PV12: Adverse effect on quality of groundwater level .245 .745 PV13: Timely delivery of resources .402 .736 PV14: A clear plan was formulated .399 .737 PV15: No design changes .363 .740 PV16: Harmonious relationship on site .184 .748 PV17: Project has led to air pollution .176 .749 PV18: Project has led to depletion natural resources .074 .754 PV19: Project has led to increased solid waste -.039 .757 PV20: Accidents were reported .092 .752 PV21: Near misses occurred .054 .755 PV22: Fatalities did occur .319 .741 PV23: Utilised environmentally friendly technology. .311 .742 PV24: Led to the increased release of toxic materials .157 .750 PV25: No delays in securing funds. .201 .747 PV26: At handover there were no apparent defects .252 .745 PV27: Contractors were often called back to repair defects. .183 .748 PV28: No effect of weather and climatic conditions. .248 .745 PV29: Utilised reusable and recyclable materials. .329 .741 PV30: Right material was used for the construction work. .160 .750 PV31: Employees possessed requisite skills. .382 .738 PV32: A sound QMS was adhered to. .346 .740

54
PV33: Workers were trained on positive attitudes .482 .734 PV34: All stakeholders supervised project quality. .056 .753 PV35: Proper medical facilities were provided -.279 .765
A scale is said to be reliable, if Cronbach’s coefficient alpha of the scale is well above
the threshold value of 0.700 and the acceptable minimum of 0.600 (Hair et al., 2006).
In this study, the Cronbach’s coefficient alpha for the entire scale consisting of 35
measurement variables was 0.751 with relatively high corrected item-to-total
correlations indicating the presence of high internal consistency in the measurement
scale.
Investigation of individual variables shows that deletion of 8 variables, PV8 (0.753),
PV9 (0.761), PV18 (0.754), PV19 (0.757), PV20 (0.752), PV21 (0.755), PV34
(0.753) and PV35 (0.765) would slightly improve the value of Cronbach’s alpha as
indicated in the brackets of the above variables. Firstly, the improvement achieved
through the deletion of the above variables as mentioned in the brackets was marginal.
Secondly, the inclusion of the above three variables does maintain the Cronbach’s
alpha coefficient at 0.751, which is well above 0.7 threshold value. Finally, this being
a pilot study and the variables being important in theoretical sense, the same might
improve the measurement of construction project performance at a later stage.
4.4.2 Validity and Reliability of variables influencing project success
Validity of the 30 variables that influence project success was assessed through
minimum and maximum scores of each item and also the scores for means and
standard deviations. Table 4.3 shows the summary of these scores.
Table 4.3 shows that the means of 27 out of the 30 variables had minimum and
maximum scores ranging from 1 to 5. This implies that these items utilised the entire
scale. As regards standard deviations of two variables (SV16 and SV30) secured
scores less than 1. However, these two items were still included in the scale because
of their theoretical importance in determining success of construction projects. All
mean scores were found to be above 2.50 the mid value, which indicate that the
variables are important.

55
Table 4.3: Descriptive statistics of project success variables obtained through
pilot survey
Variables of factors influencing project success Min Max Mean Std. Dev
SV1: Effect of location and Site conditions 1 5 3.30 1.418 SV2: Influence of Design Complexity 1 5 2.80 1.215 SV3: Adequate Project planning and, Scheduling 1 5 3.27 1.202 SV4: Project funds secured on time 1 5 2.80 1.424 SV5: Design documents approved on time 1 5 3.10 1.423 SV6: Adequate experience on similar projects 1 5 2.73 1.437 SV7: Adequate Information sharing and collaboration 1 5 2.70 1.442 SV8: Adherence to the requisite Quality standards 1 5 2.60 1.429 SV9: Continuous monitoring of actual expenditures 1 5 3.30 1.236 SV10: Formal dispute resolution structures 1 5 2.83 1.315 SV11: Site Managers possessed requisite skills 1 5 3.07 1.437 SV12: Contractor had adequate technical skills 1 5 3.17 1.262 SV13: Contractor used latest construction methods 1 5 3.03 1.520 SV14: Community had no issues against the project 1 5 3.50 1.280 SV15: Adversely affected by the surrounding weather 2 5 3.40 1.003 SV16: Effect of Macro- economic conditions 2 5 3.43 .858 SV17: Effect of the Governance policy 1 5 3.17 1.315 SV18: Adequate commitment of the consultant to project 1 5 2.87 1.224 SV19: Adequate designs/specifications and documentations 1 5 3.17 1.234 SV20: Client’s emphasis on time rather than quality 1 5 3.10 1.470 SV21: Cheap materials were used 1 5 2.80 1.518 SV22: No variations were incorporated 1 5 3.07 1.202 SV23: Satisfactory technological sophistication 1 5 3.37 1.377 SV24: No incidences of industrial unrests 1 5 3.43 1.104 SV25: Favourable physical and ecological conditions 1 5 3.30 1.055 SV26: Few internal procurement challenges 1 5 2.77 1.278 SV27: Client decisions were timely and objective 1 5 2.83 1.315 SV28: Right equipments were available 1 5 3.27 1.388 SV29: Effect of stringent insurance/warranty rules 1 5 3.17 1.206 SV30: Working capital was adequate 3 5 4.27 .785
Reliability was checked through the Cronbach’s alpha value of the entire scale
consisting of 30 success variables which turned out to be 0.881. This is well above the
threshold value of 0.7 (Hair et al., 2006). The variables also exhibited a high item-to-
total correlation as shown in Table 4.4.

56
Table: 4.4 Item-to-total correlations among project success variables obtained
through pilot survey
Variables of factors influencing project success Corrected Item-Total Correlation
Cronbach's Alpha if Item Deleted
SV1: Effect of location and Site conditions .485 .876
SV2: Influence of Design Complexity .392 .878
SV3: Adequate Project planning and, Scheduling .444 .877
SV4: Project funds secured on time .421 .877
SV5: Design documents approved on time .387 .878
SV6: Adequate experience on similar projects .609 .873
SV7: Adequate Information sharing and collaboration .691 .870
SV8: Adherence to the requisite Quality standards .675 .871
SV9: Continuous monitoring of actual expenditures .560 .874
SV10: Formal dispute resolution structures .298 .880
SV11: Site Managers possessed requisite skills .386 .878
SV12: Contractor had adequate technical skills -.060 .887
SV13: Contractor used latest construction methods .632 .872
SV14: Community had no issues against the project .142 .883
SV15: Adversely affected by the surrounding weather .076 .883
SV16: Effect of Macro- economic conditions .431 .878
SV17: Effect of the Governance policy .277 .881
SV18: Adequate commitment of the consultant to project .502 .876
SV19: Adequate designs/specifications and documentations .435 .877
SV20: Client’s emphasis on time rather than quality .440 .877
SV21: Cheap materials were used .669 .871
SV22: No variations were incorporated .448 .877
SV23: Satisfactory technological sophistication .250 .881
SV24: No incidences of industrial unrests .453 .877
SV25: Favourable physical and ecological conditions .333 .879
SV26: Few internal procurement challenges .376 .878
SV27: Client decisions were timely and objective .298 .880
SV28: Right equipments were available .569 .874
SV29: Effect of stringent insurance/warranty rules .410 .878
SV30: Working capital was adequate .440 .878
The results in table 4.4 show that deletion of any of the three variables (SV12, SV14
and SV15) would slightly improve the Cronbach’s alpha. However, the improvement

57
to be achieved is too insignificant to warrant their deletion. Therefore, all the success
variables were retained in the questionnaire.
4.5 Study site and identification of target population
The present study has been carried out in 24 constituencies located in the western
province of Kenya. Different types of CDF projects are undertaken in these
constituencies. Inspection of the list of projects in each constituency revealed that
there were over 4000 projects undertaken between 2003 and 2011. Out of 4000
projects undertaken between 2003 and 2011, those projects have been considered as
target projects which are involved in the construction of Educational facilities, Health
Care facilities, Light industries and Agricultural Markets. It was found that only 586
projects were involved in the construction of the above facilities. Thus these 586
projects qualified as target projects in the present study.
The 586 projects identified above allowed the researcher to define the target
population (i.e. target respondents) of the current study. The researcher identified
three categories of target respondents, namely clients, consultants and contractors.
There were 586 clients for 586 projects. In addition, there were 124 consultants and
212 contractors registered by Architectural Association of Kenya (AAK) and Kenya
contractors’ associations (KCA) county offices in Western province respectively.
Therefore, the size of the target population became 922 consisting of 586 clients, 124
consultants and 212 contractors.
Given the small size of the target population, a decision was made to consider all the
respondents in the survey. This was, therefore, a census survey encompassing all
clients, consultants and contractors involved in the construction of CDF projects
between 2003 and 2011.
4.6 Identification and training of field investigators
The researcher selected 24 field investigators, one each for each of the 24
constituencies that constitute Western province, for the purpose of enabling them to
administer questionnaires to the respondents, namely clients, consultants, and
contractors. These are the students in the Faculty of Commerce at the Kisii University
College. One day training programme was organized for the field investigators in
order to make them clearly understand the purpose of the study, various technical

58
terms used in the questionnaire both in English and the local language (Swahili) and
the data collection methodology. They were also imparted training on the art of
extracting information from the respondents depending on a particular situation and
the mood of the respondents. Further they were also made aware of the varying
response patterns that might occur during interview process. In all circumstances, the
field investigators were asked to ensure that they carried copies of both version of the
questionnaire, English and Swahili while visiting a particular constituency for
fieldwork.
4.7 Data collection
Based on the population size of individual stratum determined in section 4.5, all three
categories of respondents, i.e. clients, consultants and contractors spread over 24
constituencies were, first of all, identified. The contact number, e-mail address, postal
addresses of the respondents were collected from the database maintained by CDF
regional office, Western Kenya. They were then contacted through telephone calls
and e-mails for explaining them the whole issue, purpose and the importance of
undertaking the survey. Subsequently each one of them was sent a brief note and a
copy of the questionnaire through e-mail in order to enable them to have an idea about
the kind of inputs required by the researcher. In the next stage, an appointment along
with the date, time and venue was sought from the respondents. Based on the
appointment, the field investigators visited the designated place in person with a hard
copy of the questionnaire with a view to eliciting responses from them through face-
to-face interview. This process was necessary in order to motivate the respondents to
participate in the interview process and also to minimize their unwillingness to share
their experience in CDF construction projects. Further face-to-face interview allowed
the field investigators to explain the respondents the issues relating to the variables
affecting construction project success and also gave them the opportunity to seek
clarifications on related aspects.
The survey was undertaken from December 2011 to the end of February 2012. The
response rate turned out to be quite good, which is contrary to survey research. Such a
response rate can be attributed to the prior interaction between the researcher and the
respondents in seeking their willingness to be interviewed for the study.

59
CHAPTER 5: RESEARCH FINDINGS AND DISCUSSION (PHASE I)
5.0 Introduction
In this chapter, the findings of exploratory factor analysis (EFA) are discussed. The
chapter presents a brief overview of the responses received and describes the process
of data screening employed. It is followed by a description of projects’ characteristics,
respondents’ profile and status of the CDF projects. The descriptive statistics of the
scale items are then obtained and discussed. The next section reports on the EFA of
performance measurement variables starting with the factorability of the scale items
through the examination of the correlation matrix, Bartlet’s test, Kaiser-Meyer-
Olkin (KMO) measure of sampling adequacy and anti-image correlation matrix.
Eventually Principal Component Analysis (PCA) using Varimax rotation is applied as
a data reduction technique and to explore interrelationships amongst performance
measurement variables. A similar process is followed to explore the project success
variables. At the end of the chapter, a relationship between project success factors,
project success, overall project performance and the various performance indicators is
conceptualised.
5.1 Screening of collected Data
At the end of twelve weeks, the field investigators were able to submit 196 completed
questionnaires, representing a response rate of 21.25%. Western province, as it has
already been explained in chapter 3 (section 3.1) is divided into four counties spread
over 24 constituencies. Table 5.1 summarises the distribution of responses on four
different categories of projects across different constituencies before the responses
were screened.
Table 5.1: Distribution of responses according to counties and constituencies Project Classification Total
COUNTY CONSTITUENCY Educational Health Care Industrial Estate
Agricultural Market
KAKAMEG
A COUNTY Malava 4 44.4% 3 33.3% 2 22.2% 0 0.0% 9
Lugari 3 30.0% 3 30.0% 1 10.0% 3 30.0% 10
Mumias 1 20.0% 2 40.0% 1 20.0% 1 20.0% 5
Matungu 4 66.7% 0 0.0% 1 16.7% 1 16.7% 6
Lurambi 5 45.5% 3 27.3% 2 18.2% 1 9.1% 11

60
Shinyalu 5 45.5% 5 45.5% 0 0.0% 1 9.1% 11
Ikolomani 0 0.0% 2 33.3% 2 33.3% 2 33.3% 6
Butere 4 50.0% 1 12.5% 2 25.0% 1 12.5% 8
Khwisero 2 40.0% 0 0.0% 2 40.0% 1 20.0% 5
SUB-TOTAL 28(39.4%) 19(26.8%) 13(18.3%) 11(15.5%) 71(36.2%)
VIHIGA
COUNTY Emukhaya 4 40.0% 5 50.0% 0 0.0% 1 10.0% 10
Sabatia 0 0.0% 6 54.5% 3 27.3% 2 18.2% 11
Vihiga 4 57.1% 2 28.6% 0 0.0% 1 14.3% 7
Hamisi 3 37.5% 1 12.5% 3 37.5% 1 12.5% 8
SUB-TOTAL 11(30.5%) 14(38.9%) 6 (16.7%) 5 (13.9) 36(18.4%)
BUNGOMA
COUNTY Mt. Elgon 4 66.7% 0 0.0% 1 16.7% 1 16.7% 6
Kimilili 2 33.3% 0 0.0% 2 33.3% 2 33.3% 6
Webuye 3 42.9% 1 14.3% 1 14.3% 2 28.6% 7
Sirisia 3 37.5% 1 12.5% 2 25.0% 2 25.0% 8
Kanduyi 4 44.4% 1 11.1% 3 33.4% 1 11.1% 9
Bumula 3 37.5% 1 12.5% 2 25.0% 2 25.0% 8
SUB-TOTAL 19(43.2%) 4 (9.1%) 11(25.0%) 10(22.7%) 44(22.4%)
BUSIA
COUNTY Amagoro 3 30.0% 1 10.0% 3 30.0% 3 30.0% 10
Nambale 4 36.4% 5 45.5% 1 9.1% 1 9.1% 11
Butula 3 37.5% 2 25.0% 0 0.0% 3 37.5% 8
Funyula 2 25.0% 2 25.0% 1 12.5% 3 37.5% 8
Budalang'i 3 37.5% 1 12.5% 3 37.5% 1 12.5% 8
SUB-TOTAL 15(33.3%) 11(24.4%) 8(17.8%) 11(24.4%) 45(23.0%)
GRAND TOTAL 73 (37.2%) 48 (24.5%) 38 (19.4%) 37 (18.9%) 196
Table 5.1 shows that out of all the projects surveyed, 71 (36.2%) were based in
Kakamega County, 36 (18.4%) were undertaken in Vihiga County, 44 (22.4%) were
carried out in from Bungoma County whereas 45 (23%) were based in Busia County.
Kakamega County had the maximum number of projects surveyed because it is the
largest in terms of size and has the highest number of constituencies in the Western
Province, Kenya.

61
Distribution of the four types of projects across all counties considered together
reveals that majority were Educational projects followed by Health care facilities,
Industrial Estates and finally Agricultural Markets.. Further, all types of projects were
undertaken in each of the counties with Educational projects dominating in
Kakamega, Bungoma and Busia Counties while in Vihiga, majority of the projects
were Health Care projects. The distribution of different types of projects depends on
the socio-economic conditions and preferences of residents.
Following initial observation of data, the negatively framed questions were suitably
reversed and all the scores were fed into SPSS software (version 20) for doing the
analysis. However, before actual analysis was carried out, it was important to
• Check if data had been entered correctly and whether it contained out-of-range
values.
• Check for missing values, and deciding how to deal with the missing values.
• Check for outliers, and deciding how to deal with outliers.
• Check for normality, and deciding how to deal with non-normality.
While inputting the data it was observed that a few sections of the questionnaire were
not fully completed. Such sections were left blank for purposes of proper analysis.
The SPSS Missing Data Analysis option was used to analyse the noted patterns in the
data. The Replace Missing Values option was used to replace the missing values that
were not significant with mean of all valid responses as is the norm with similar
studies (Hair et al., 2006). Those respondents with a significant number of missing
values were eliminated. It was found that 9 responses to section B of the questionnaire
had significant missing values and 12 respondents did not indicate their perceptions
on over 50% of the statements in the section C of the questionnaire. These 21
responses were, therefore, eliminated from the study.

62
While checking for outliers, it was found that the extreme values were either strongly
agree (5) or strongly disagree (1) in response to the interval Likert scaled statements.
Since this study sought to secure respondents’ perceptions towards the key
performance measurement variables and project success variables, it was seen to be
normal for a respondent to have such extreme feelings towards certain variables and
be moderate on others. According to Hair et al. (2006), deleting them would,
therefore, affect the generalisability to the entire population, and hence, they were all
retained. “...if they do represent a segment of the population, they should be retained
to ensure generalisability to the entire population (Hair et al., 2006).
Given that univariate outliers were allowed in the data, it was not possible to test
multivariate outliers since no significant decision could be taken. Hair et al. (2006)
hold that a situation in which all variables exhibit univariate normality will help gain,
although not guarantee multivariate normality among the variables. They further
argue that in most cases, assessing and achieving univariate normality in variables is
sufficient and multivariate normality is addressed when it is very critical. Observation
of the distribution of data in reference to skewness and kurtosis revealed that the data
was approximately normal.
At the end of item screening, 175 respondents remained for the purposes of data
analysis indicating an effective response rate of 19%.
5.2 Demographic characteristics of projects and respondents’ profile
This section reports on project characteristics in terms of the procurement approaches
and the status of projects regarding occurrence of cost overrun, time overrun and
quality defects.
5.2.1 Description of CDF construction projects and their procurement
approaches
Table 5.2 presents relevant data pertaining to the type of the projects surveyed and
their procurement approaches.

63
Table 5.2: Types of CDF projects and their procurement approaches Project classification
Total Educational Health Care Industrial
Estate
Agricultural
Market
Procurement approach
used
2. Design/Build 8 (4.6%) 2 (25.0%) 4 (50.0%) 1 (12.5%) 1 (12.5%)
3. Competitive bid 70 (40.0%) 32 (45.7%) 5 (7.1%) 17 (24.3%) 16 (22.9%)
4. Negotiated general
contract 97 (55.4%) 31 (31.9%) 35 (36.1%) 15 (15.5%) 16 (16.5%)
TOTAL 175 (100%) 65 (37.1%) 44 (25.1%) 33 (18.9%) 33 (18.9%)
The projects surveyed in this study consist of 65 Educational projects (37.1%), 44
Health Care facilities (25.1%), 33 Industrial Estates (18.9%) and 33 Agricultural
Markets (18.9%) as shown in Figure 5.1.
Figure 5.1: Types of projects surveyed

64
The dominance of the Educational and Health Care projects can be attributed to the
fact that the majority of the people residing in rural areas of Kenya are mainly women
and children as men usually migrate to urban centres in search of employment. Owing
to this, the projects that focus on children and women, namely Educational and Health
Care projects have multiplier effect on the quality of life in rural areas.
Table 5.2 also shows that three procurement approaches are used in securing
construction of CDF projects in Western province, Kenya. These are (i) Design/ build,
(ii) Competitive bid and (iii) Negotiated general contract. As shown in Figure 5.2,
majority of these projects were procured through Negotiated general contracts
(55.4%), followed by Competitive bidding (40%) and Design/Build (4.6%).
Figure 5.2: Approaches used in project procurement
The results indicate that the negotiated general contract is the most popular
procurement method used amongst CDF construction projects in Kenya. Under this
approach, a single prime contractor is entrusted with the responsibility of undertaking
the entire work. The contractor is accountable for the activities taking place on the

65
project. This approach creates common project goals and objectives and acts as a
single point of responsibility that enhances project communications.
5.2.2 Status of CDF construction projects
Three major problems facing CDF construction projects are said to be time overrun,
cost overrun and quality defects. Together, they provide a picture of the existing
status of CDF construction projects surveyed. The occurrence of time overrun, cost
overrun and quality defects across different types of projects is presented in Table 5.3.
Table 5.3: Status of CDF construction projects Project classification
Total Educational Health Care Industrial Estate
Agricultural Market
Time overrun
None 22 (12.6%) 10 (45.5%) 5 (22.7%) 1 (4.5%) 6 (27.3%)
Less than 6 months 95 (54.3%) 36 (37.9%) 21 (22.1%) 17 (17.9%) 21 (22.1%)
6-12 months 41 (23.4%) 12 (29.3%) 14 (34.1%) 11 (26.8%) 4 (9.8%)
over 12 months 17 (9.7%) 7 (41.2%) 4 (23.5%) 4 23.5%) 2 (11.8%)
Cost overrun
None 91 (52.0%) 37 (40.6%) 21 (23.1%) 20 (22.0%) 13 (14.3%)
Less than ksh.100,000 54 (30.8%) 18 (33.3%) 18 (33.3%) 6 (11.2%) 12 (22.2%)
Ksh.100,001-ksh.300,000 25 (14.3%) 9 (36.0%) 5 (20.0%) 5 (20.0%) 6 (24.0%)
Ksh.300, 001-ksh. 500,000 5 (2.9%) 1 (20.0%) 0 (0.0%) 2 (40.0%) 2 (40.0%)
Quality defects (Variations)
None
Less than 20%
20% and more
116 (66.3%)
55 (31.4%)
4 (2.3%)
46 (39.7%)
17 (30.9%)
2 (50.0%)
26 (22.4%)
17 (30.9%)
1 (25.0%)
25 (21.6%)
7 (12.7%)
1 (25.0%)
19 (16.3%)
14 (25.5%)
0 (0%)
TOTAL 175 (100%) 65 (37.1%) 44 (25.1%) 33 (18.9%) 33 (18.9%)
The findings in Table 5.3 indicate that 153 amongst 175 projects surveyed (87%) in
this study experienced time overrun ranging from less than six months to more than
12 months. However, much of the delay was for less than 6 months (54%). The table
shows the magnitude of time overrun across all four kinds of projects and reveals that
the proportion of time overrun was maximum amongst Industrial Estates (approx.
97%) and minimum amongst Agricultural Markets (81.8%).

66
Figure 5.3: Time overrun amongst different types of projects
The current findings show that the projects that were widely implemented
(Educational, Health and Agriculture) in the Western Province, Kenya experienced
relatively low time overrun. Figure 5.3 shows that of those projects that did not
experience any time overrun, about 45.5% were Educational, 22.7% were Health Care
and 27.3% were Agricultural Markets. This can be attributed to their significant
relevance to the needs of the community
Table 5.3 also demonstrates that 84 out of 175 projects surveyed (48%) incurred cost
overrun during their implementation in the range of less than Ksh. 100,000 to

67
Ksh.500, 000. While considering cost over-run across the types of projects, the table
further indicates that the same was maximum (60.6%) in case of agricultural projects
and minimum (39.4%) in case of Industrial Estates. In addition, 52.3% of Health Care
projects and 43% of Educational projects experienced cost over-run. Figure 5.4 shows
the occurrence of cost overrun across different types of projects.
Figure 5.4: Cost overrun amongst different types of projects
Of the projects that did not experience any cost overrun, 40.7% were Educational,
23.1% were Health Care, 22.0% were Industrial Estates and about 14.2% were
Agricultural Markets. Further there was no Health Care project that experienced very
high cost overrun (Ksh. 300,001-Ksh. 500,000). This is also attributed to the
importance of these projects to the intended beneficiaries.

68
Quality defects of a construction project are measured by how the constructed quality
deviates from the prescribed technical specifications of the project. In the current
study, 116 projects (66.3%) were found to have been free from apparent defects with
only 4 projects (2.3%) recording quality defects of 20% or more. Of those projects
that suffered from quality defects, majority were Educational (19) followed by Health
Care projects (18), Agricultural Markets (14) and finally Industrial Estates (8). The
distribution of quality defects amongst different types of projects is shown in Figure
5.5.
Figure 5.5: Quality defects amongst different types of projects
However, when occurrence of quality defects is considered across different types of
projects, it was found that 39.7% were Educational, 22.4% were Health Care, 21.6%
were Industrial Estates and 16.4% were Agricultural Markets. Further, Educational
projects were found to constitute about 50% of those projects that experience the

69
highest percentage of quality defects (more than 20%). This is because of their
importance amongst communities in Western province and the variations in design
specifications.
5.2.3: Respondents’ profile
Table 5.4 attempts to capture the respondents’ profile in terms of their position on the
project, their experience in the construction industry and how long they have been
involved in CDF construction projects.
Table 5.4: Respondents’ Profile.
Total Respondent’s Position on the construction project
Client Consultant Contractor Experience in Construction of
projects
<3 Years 32 14 (43.8%) 11 (34.4%) 7 (21.9%)
3-6 Years 87 60 (69.0%) 4 (4.6%) 23 (26.4%)
>6 Years 56 18 (32.1%) 14 (25.0%) 24 (42.9%)
Respondent involvement in CDF
Projects
<3 Years 52 14 (26.9%) 11 (21.2%) 27 (51.9%)
3-6 Years 97 70 (72.2%) 13 (13.4%) 14 (14.4%)
>6 Years 26 8 (30.8%) 5 (19.2%) 13 (50.0%)
Value of CDF projects worked on
in the last 3 years
Over ksh. 15,000,000 35 15 (42.9%) 7 (20.0%) 13 (37.1%)
Ksh. 10,000,000-15,000,000 56 32 (57.1%) 2 (3.6%) 22 (39.3%)
Upto ksh. 10,000,000 84 45 (53.6%) 20 (23.8%) 19 (22.6%)
TOTAL 175 92 (52.6%) 29 (16.6%) 54 (30.0%)
The respondents comprised 92 clients (52.6%), 29 consultants (16.6%) and 54
contractors (30.9%).
Almost half of the respondents (49.7%) have been in the project construction industry
for 3-6 years followed by those with over six years experience (32.0%) and only 32
respondents (18.3%) had experience of less than 3 years.
Further, most of the respondents (70.3%) have specifically been involved in the
construction of CDF projects for a period exceeding 3 years. This adds credence to

70
the study in the sense that the views expressed by the respondents are based on their
actual experience associated with the construction industry in general and CDF
construction projects in particular.
An analysis of the average value of projects respondents had handled in the past
revealed that majority had dealt with relatively small projects. Of the projects
surveyed, 84 projects (48.0%) had a value of less than Ksh. 10,000,000, 56 projects
(32.0%) had a value of Ksh. 10,000,000 to Ksh. 15,000,000 whereas 35 projects
(20.0%) were large with values above Ksh. 15,000,000.
This information indicates that apart from having adequate experience in terms of
years the respondents have been involved in construction projects, respondents had
handled projects of different sizes.
5.3 Exploratory Factor Analysis (EFA) of performance measurement variables
for Key Performance Indicators (KPIs) scale
In this section, data in Phase I of the study comprising 175 responses was used to
carry out EFA on performance measurement variables in order to identify the KPIs of
public sector construction projects. First, the descriptive statistics of the performance
measurement variables are presented and subsequently the factorability of the
variables is assessed before the variables are subjected to EFA.
5.3.1 Descriptive statistics of performance measures
The responses on 35 variables relating to project performance provided by the
respondents were included in the present study. The findings regarding the minimum
score, maximum score, mean and standard deviations of the scores on responses to
performance measurement variables are presented in table 5.5.
Table 5.5: Descriptive statistics of performance measurement variables Performance measurement variables (PV) Min
Score Max Score
Mean Score
Std. Dev
PV1: There has not been any increase in the cost of raw
materials during construction of this project. 1 5 3.24 1.422
PV2: Labour costs more or less remained stable over the
period of construction of the current project. 1 5 3.18 1.145
PV3: The project experienced minimum variations and
hence hardly any additional cost attributable to variations 1 5 3.27 1.252

71
was incurred.
PV4: The required equipments were available at pre
budgeted rates. 1 5 3.21 1.371
PV5: The amount/quantity of different type of resources
required during the implementation phase matched with
those estimated during planning stage.
1 5 3.22 1.269
PV6: There were no incidences of fraudulent practices
and kickbacks during project execution. 1 5 2.92 1.362
PV7: There were no incidences of agitation by the trade
unions in the current project. 1 5 2.86 1.275
PV8: There were no serious dispute between the client
and contractor due to non adherence to the specifications. 1 5 2.81 1.285
PV9: Disputes were observed due to the frequent
changes in the design of the current project. 1 5 2.84 1.183
PV10: Dispute resolution meetings were often held
during project execution. 1 5 2.70 1.234
PV11: At the time of project completion, there were no
financial claims that remained unsettled from this
project.
1 5 2.54 1.363
PV12: This construction project has adversely affected
the quality of groundwater level. 1 5 2.25 1.052
PV13: All required resources for the project were
delivered on time during execution of this project. 1 5 2.90 1.298
PV14: A clear plan was formulated and an efficient
planning and control system was designed to keep the
current project up-to-date.
1 5 3.12 1.146
PV15: No changes were introduced in the designs of the
current during project execution. 1 5 3.09 .896
PV16: Harmonious relationship between labour and
management existed in the project site and hence no
work disruptions were reported during project execution.
1 5 3.18 1.204
PV17: This project has led to air pollution in the
adjoining areas. 1 5 2.59 1.100
PV18: This project has led to depletion of the precious
natural and mineral resources in the surrounding areas. 1 5 2.96 1.126
PV19: There has been an increase in solid waste due to
the construction of the current project. 1 5 2.93 1.145

72
PV20: Accidents were often reported during project
construction. 1 5 3.23 1.316
PV21: Near misses occurred quite often during
construction. 2 5 3.86 .889
PV22: Fatalities did occur on this project during
construction. 1 5 3.38 1.043
PV23: The construction work utilised environmentally
friendly technology. 1 5 2.54 1.010
PV24: This project has led to the increased release of
toxic material. 1 5 3.10 1.316
PV25: No delays were experienced in securing funds
during project implementation. 1 5 3.31 1.263
PV26: At the time of handover, the current project was
free from apparent defects 1 5 3.32 1.291
PV27: The project contractors were often called back
during the Defects Liability Period to repair defects. 1 5 2.70 1.247
PV28: Weather and climatic conditions did not have
much impact on delaying the project. 1 5 3.30 1.110
PV29: The current project has utilised reusable and
recyclable materials in construction work. 1 5 2.70 1.370
PV30: The right material was used for the construction
work. 1 5 2.46 1.138
PV31: Employees working in the current project
possessed requisite skills and most of them had worked
on similar kinds of projects in the past.
1 5 2.58 1.261
PV32: A sound quality management system was strictly
adhered to during project execution phase of the current
project.
1 5 2.49 1.066
PV33: Training was imparted to the workers in order to
develop a positive attitude and also to enable them to
apply the right method of work.
1 5 2.54 1.123
PV34: All stakeholders associated with the current
project supervised the quality of the project in all its
phases.
1 5 3.03 1.397
PV35: Proper medical facilities were available for
people working on the project. 2 5 3.79 .961
Responses collected on a five point Likert scale (1-Strongly Disagree .................. 5- Strongly Agree).Scores on negatively framed statements were reversed.

73
The minimum and maximum values were 1 and 5 respectively for 34 out of 35
variables, indicating that, in general, respondents used the entire 5 point survey scale.
The mean score ranged between 2.25 (This construction project has adversely
affected the quality of groundwater level-PV12) and 3.86 (Near misses occurred quite
often during construction-PV21). Standard deviations were found to be above 1
except in three variables; “no changes were introduced in the design of the current
project during project execution - PV15” (0.896), “near misses occurred quite often
during construction - PV21” (0.889) and “proper medical facilities were available for
people working on the project - PV35” (0.961). This shows that the means represent a
good measure of the distribution of scores in the survey data. However, the standard
deviation values of these three variables being close to 1 indicate that the responses to
these three questions varied considerably amongst the respondents.
5.3.2 Assessing the factorability of performance measurement variables
For assessing the factorability of 35 performance measurement variables, the
researcher found out the correlation for each pair of 35 variables which is
demonstrated with the help of a correlation matrix. This shows the strength of
relationship between every pair of items and is summarised below (table 5.6).
The correlation matrix in the above table suggests that the sample is characterised by
high degree of related variables which could be grouped together. With the exception
of a few variables, a large number of significant correlations are found amongst
different pair of variables in this matrix: 193 correlations significant at 5% level and
160 correlations significant at 1% level. This gives the researcher an indication that
exploratory factor analysis (EFA) could be carried out in the whole dataset.
The values in the correlation matrix suggest that the sample is characterised by high
degree of related variables which could be grouped together. This provides evidence
of factorability of the performance measurement variables.

74
Table 5.6: Original Correlation Matrix of performance measurement variables
PV1 PV
2 PV 3
PV 4
PV 5
PV 6
PV 7
PV 8
PV 9
PV 10
PV 11
PV 12
PV 13
PV 14
PV 15
PV 16
PV 17
PV 18
PV 19
PV 20
PV 21
PV 22
PV 23
PV 24
PV 25
PV 26
PV 27
PV 28
PV 29
PV 30
PV 31
PV 32
PV 33
PV 34
PV 35
PV1 1 PV2 .74 1 PV3 .70 .68 1 PV4 .81 .75 .87 1 PV5 -.01 -.06 .07 .04 1 PV6 .07 .01 .07 .09 .52 1 PV7 .25 .05 .11 .13 -.03 .01 1 PV8 -.05 -.27 -.15 -.15 -.01 -.04 .75 1 PV9 .01 -.25 -.08 -.08 .03 -.04 .72 .92 1 PV10 .16 .06 .09 .07 -.04 .02 .57 .77 .69 1 PV11 .45 .26 .33 .42 .00 .07 .65 .34 .31 .19 1 PV12 .30 .40 .28 .35 -.05 .05 .25 .24 .17 .25 .52 1 PV13 .24 .18 .14 .23 -.01 -.00 -.11 -.19 -.17 -.07 .10 -.23 1 PV14 .09 .04 .07 .13 .06 -.00 .00 .00 .04 -.02 .15 -.16 .73 1 PV15 -.04 -.07 -.11 -.03 .04 -.04 -.03 -.08 -.04 -.13 .13 -.08 .41 .43 1 PV16 .20 .01 .01 .19 .05 -.01 .03 -.06 -.01 -.15 .22 -.18 .62 .66 .52 1 PV17 -.04 .03 -.11 -.07 .04 -.06 .21 .20 .15 .11 .09 .05 -.14 .02 -.17 -.12 1 PV18 .02 .18 .02 .04 -.07 .02 .24 .23 .18 .12 .13 .16 -.17 .06 -.30 -.10 .57 1 PV19 -.05 .13 -.03 -.05 -.04 -.06 .20 .21 .16 .12 .04 .13 -.25 .00 -.24 -.12 .62 .79 1 PV20 .00 -.09 -.01 .02 .50 .34 .04 .01 .07 -.09 .09 -.03 .08 .08 .12 .12 -.01 -.06 -.07 1 PV21 .01 -.03 -.03 -.01 .01 .12 -.02 .05 .08 -.01 .04 .08 .05 .01 .01 .04 .03 -.03 .05 .45 1 PV22 -.05 -.08 -.07 -.07 .03 -.07 .02 .00 -.01 -.09 .08 .00 -.01 -.02 .06 .02 -.06 -.09 -.04 .52 .34 1 PV23 .00 -.00 -.11 -.06 .07 -.02 .20 .18 .12 .11 .05 .01 -.07 .04 -.04 -.03 .86 .44 .54 .04 .07 -.05 1 PV24 -.01 .05 -.02 .00 -.09 .02 .08 .04 -.02 .08 .03 -.00 .06 .02 .12 .01 -.03 -.03 .00 -.19 -.41 .02 -.03 1 PV25 .34 .21 .16 .21 -.04 -.08 .10 .02 .03 .03 .18 -.09 .77 .45 .44 .57 -.00 -.05 -.12 .10 .05 .02 .07 .10 1 PV26 .04 -.16 -.05 .01 -.02 -.02 .28 .32 .36 .18 .12 -.11 .40 .43 .10 .32 .05 .16 .12 .17 .21 .08 .10 -.01 .30 1 PV27 .21 .27 .30 .32 .09 -.03 .03 -.14 -.08 .01 .07 -.13 .34 .29 -.07 .17 -.19 -.04 -.10 -.09 -.15 -.11 -.18 .06 .23 .12 1 PV28 .29 -.04 .17 .28 .10 .07 .22 .13 .21 -.01 .21 -.26 .56 .53 .19 .57 -.05 -.06 -.15 .15 .07 -.02 -.03 -.05 .47 .64 .29 1 PV29 .06 -.02 .10 .06 -.04 .03 .06 .08 .07 .13 .00 -.02 -.18 -.18 -.22 -.13 .03 .08 .10 -.04 .02 -.05 -.02 -.07 -.15 -.03 -.02 -.03 1* PV30 .33 .37 .44 .46 .15 .11 .11 -.08 -.04 .02 .27 .08 .19 .26 -.11 .04 .05 .07 -.04 .00 -.09 -.06 -.02 -.03 .12 -.05 .40 .27 .02 1 PV31 .18 .20 .22 .18 -.06 .06 -.01 -.09 -.12 -.07 .08 .04 .09 .11 -.18 .04 -.03 .14 .08 .00 .02 .04 -.07 -.00 .02 .03 .19 .02 -.03 .28 1 PV32 .30 .33 .39 .40 .16 .11 .22 .02 .04 .11 .36 .10 .18 .29 -.12 .05 .07 .12 .02 -.03 -.11 -.06 .02 -.06 .08 -.01 .37 .23 .01 .92 .30 1 PV33 .34 .39 .46 .49 .12 .09 .15 -.06 -.02 .06 .29 .07 .23 .28 -.06 .06 -.02 .00 -.12 .04 -.11 -.05 -.08 -.04 .16 -.03 .37 .29 -.03 .92 .28 .88 1 * PV34 -.10 -.06 -.06 -.10 -.28 -.22 .07 .06 .07 .02 -.04 -.12 .07 .04 -.01 -.02 .01 -.07 .01 .00 .01 .35 -.03 .22 .11 .07 -.09 -.02 -.01 -.00 -.04 -.02 -.01 1 PV35 -.07 .01 -.07 -.06 -.24 -.21 .05 .05 .10 .02 -.02 -.02 -.03 -.07 -.03 -.04 .03 -.07 .02 -.18 .10 -.12 -.03 .24 -.07 .11 -.05 .01 -.03 -.03 -.03 -.07 -.04 .15 1
Correlation coefficient and p values are as follows: ρ > 0.15 denotes p-value <0.05 or significant at the 5% level; ρ > 0.20 denotes p-value <0.01; or significant at the 1% level Overall measure of sampling adequacy: 0.656 Bartlett test of sphericity: 4657.286, degrees of freedom=595, Significance: 000

75
However, before carrying out EFA, the overall significance of the correlation matrix
and its factorability needed to be tested with the help of Bartlett’s test of sphericity
and Kaiser-Meyer-Olkin (KMO) measure of sampling adequacy respectively.
Bartlett's test statistics was found significant at 0.000 levels, which indicates the
presence of non-zero correlations in the correlation matrix. Further the KMO measure
of the sampling adequacy turns out to be 0.656. Although both tests met the minimum
criteria for carrying out factor analysis in the dataset, observation of the correlations
along the diagonal of the anti image correlation matrix in table 5.7 revealed that 7
variables had their KMO values less than 0.5, which indicates that the dataset, in its
current form, is still not suitable for factor analysis (Hair et al., 2006). These variables
were iteratively removed one after another starting with the one whose correlation
along the diagonal of the anti image matrix was the lowest (Jahmane et al., 2011).
After the removal of five variables, it is found that all variables had individual KMO
values greater than 0.5. This resulted in the improvement of overall KMO measure of
sampling adequacy to 0.687. Further Bartlett's test statistics was found significant at
0.000 levels. These measures indicate that the reduced set of variables is appropriate
for factor analysis.

76
Table 5.7: Measures of Sampling Adequacy and Partial Correlations amongst performance measurement variables PV
1 PV 2
PV 3
PV 4
PV 5
PV 6
PV 7
PV 8
PV 9
PV 10
PV 11
PV 12
PV 13
PV 14
PV 15
PV 16
PV 17
PV 18
PV 19
PV 20
PV 21
PV 22
PV 23
PV 24
PV 25
PV 26
PV 27
PV 28
PV 29
PV 30
PV 31
PV 32
PV 33
PV 34
PV 35
PV1 .70a PV2 -.5 .70a PV3 .04 -.08 .79a PV4 -.2 -.18 -.68 .79a PV5 .00 -.0 -.16 .08 .49a PV6 -.01 .07 .07 -.04 -.41 .46a PV7 -.04 -.25 -.06 .18 .13 -.13 .75a PV8 .23 .06 .03 .14 -.09 .09 -.26 .64a PV9 -.21 .19 -.01 -.12 -.03 .06 -.10 -.64 .75a PV10 -.21 -.05 -.04 -.11 .08 -.12 -.05 -.62 .07 .61a PV11 -.31 .33 -.07 -.13 .04 .01 -.55 -.22 .19 .39 .56a PV12 .18 -.36 .14 -.18 .04 -.07 .31 -.16 .02 -.06 -.54 .59a PV13 .19 -.24 .02 .14 .03 -.07 .15 .25 .09 -.37 -.33 .19 .60a PV14 -.13 .13 -.13 .05 .02 .03 .12 -.19 -.07 .16 .16 -.11 -.67 .60a PV15 .30 -.20 .03 .05 -.02 .03 -.06 .26 -.17 -.12 -.25 .07 .27 -.40 .55a PV16 .01 -.01 .29 -.23 -.06 .03 .00 .02 .06 .00 -.16 .14 .18 -.46 -.09 .74a PV17 .16 -.11 .13 -.02 -.14 .14 .05 .11 -.06 -.11 -.21 .05 .13 -.19 .20 .20 .59a PV18 .17 -.22 .08 -.06 .25 -.21 .02 -.01 -.07 .07 -.11 .11 .15 -.18 .26 .05 -.21 .63a PV19 .09 -.16 -.11 .09 -.14 .11 -.04 .01 .02 -.01 .03 -.00 .16 -.10 .02 -.08 -.03 -.57 .75a PV20 .06 .00 .08 -.06 -.48 -.14 -.07 .13 -.16 .02 -.05 .03 -.02 -.02 .02 .01 .04 -.07 .07 .58a PV21 .05 -.08 .00 -.01 .27 -.28 .13 -.04 -.04 -.02 -.07 .00 -.01 .00 .03 .02 .02 .20 -.16 -.27 .45a PV22 -.05 .01 .02 .02 .06 .28 .01 -.07 .13 .02 -.04 .01 .03 .04 -.03 -.02 -.01 .01 .01 -.48 -.24 .48a PV23 -.20 .17 -.03 -.05 .05 -.05 -.13 -.11 .15 .07 .20 -.00 -.10 .11 -.18 -.09 -.81 .15 -.17 -.06 -.06 .07 .57a PV24 .04 -.02 .08 -.09 .04 -.28 -.00 -.06 .09 -.07 -.05 .04 .01 -.03 -.09 .06 .03 .07 -.09 .08 .50 -.25 -.03 .37a PV25 -.24 .13 .01 -.12 .00 .12 -.05 -.31 .02 .30 .27 -.09 -.79 .57 -.41 -.29 -.15 -.18 -.04 -.05 -.06 .06 .07 -.08 .55a PV26 .03 .10 .05 -.05 -.01 .10 -.12 .01 -.03 -.03 .12 -.18 -.15 -.09 .01 .18 .21 -.18 -.08 -.07 -.11 -.04 -.15 -.05 .06 .72a PV27 .28 -.19 .06 -.09 -.16 .16 -.16 .22 -.12 -.14 -.09 .16 .04 -.17 .29 .06 .17 .07 .00 .11 .01 -.01 -.04 -.06 -.14 -.03 .68a PV28 -.26 .24 -.03 -.15 .03 -.12 -.10 -.17 -.01 .30 .13 .17 -.26 .11 -.01 -.30 -.22 .06 .02 .04 .04 .01 .19 .07 .16 -.52 -.08 .70a PV29 -.07 .11 -.06 -.03 .09 -.02 .02 -.01 .05 -.11 -.04 .10 .00 .08 .04 -.04 -.05 .01 -.09 -.05 -.01 .06 .10 .03 .05 -.02 .00 .01 .65a PV30 -.10 .04 -.02 .00 -.02 -.04 .15 -.10 .09 .13 .12 -.12 .16 -.05 -.04 .09 -.04 -.06 .04 .00 -.11 .01 -.01 -.11 -.13 .13 -.20 -.20 -.10 .74a PV31 -.18 .08 -.17 .11 .16 -.09 .02 -.15 .13 .16 .10 -.02 -.04 .01 .09 -.11 -.06 -.04 -.04 -.07 -.03 -.03 .10 -.05 .03 -.08 -.11 .17 .07 .06 .64a PV32 .09 -.02 .07 025 -.16 -.01 -.08 .18 -.16 -.16 -.25 .09 -.13 -.01 .11 -.06 .08 .00 -.07 .22 .06 -.09 -.09 .14 .13 -.07 .09 .14 .00 -.63 -.15 .77a PV33 .17 -.13 -.01 -.11 .12 .05 -.12 .00 .05 -.07 -.01 .11 .03 -.11 .02 .10 -.00 .09 .09 -.20 .11 .07 .06 .06 -.04 .03 .14 -.05 .11 -.56 -.06 -.17 .83a PV34 .13 -.06 -.08 .04 .24 -.03 -.09 .09 -.14 .01 .01 .10 .02 -.11 .19 .03 -.07 .19 -.09 .01 .08 -.32 .07 -.11 -.14 -.04 .17 .08 -.00 -.11 .09 .03 .08 .48a PV35 .10 -.14 .03 .01 .04 .18 -.03 .07 -.19 .07 -.02 .05 -.11 .15 .03 -.10 -.14 .14 -.04 .05 -.29 .24 .12 -.36 .18 -.14 .09 .03 .04 -.10 -.02 .07 -.01 -.04 .35a
Note: Measures of Sampling Adequacy (MCA) are on the diagonal, partial correlations in the off-diagonal.

77
5.3.3 Factor Analysis following Varimax Rotation
Principal components analysis (PCA) was used with varimax rotation given that the
primary purpose was to identify the underlying factors. Initially all 30 variables were
allowed to load freely on various factors so long as they had eigenvalue greater than
one. This approach, together with the scree plot generated (figure 5.6) enabled the
researcher to fix the number of factors to be extracted at six. Therefore, while
identifying the final factors underlying the Key Performance Indicators (KPIs), the
process was subjected to four conditions: (i) the number of factors fixed at six, (ii)
deletion of items with loadings of less than 0.5 or cross loadings of greater than 0.5,
(iii) retention of only those factors with at least two items and (iv) the number of
factors extracted should account for at least 60% of the variance (Field, 2005; Hair et
al. 2006; Malhotra and Dash, 2011).
Figure
5.6: Scree Plot of performance measurement variables
Based on these conditions, Factor analysis was iteratively repeated and items deleted
sequentially resulting in a final instrument of 27 items. The 27- item 6-factor instrument
accounted for 73.023% of the variance in the dataset.

78
Table 5.8: Results of the Factor Analysis of performance measurement variables
Components
1 2 3 4 5 6 Cronbach’s alpha ( α ) 0.867 0.869 0.918 0.875 0.966 0.699 TVP1: Timely delivery of resources .862 TVP2: Harmonious relationship on site. .832 TVP3: A clear plan was formulated. .800 TVP4: No delays in securing funds. .772 TVP5: No effect of weather and climatic conditions. .734 TVP6: No design changes. .586 TVP7: At handover there were no apparent defects .572 CVP1: Equipments at pre budgeted rates. .875 CVP2: Stable labour costs .863 CVP3: No increase materials cost .854 CVP4: Minimum variations cost. .806 CVP5: Adverse effect on quality of groundwater level. .586 CVP6: No financial claims at completion. .508 DVP1: No serious dispute due to specifications. .951 DVP2: Disputes due to the frequent changes .922 DVP3: No incidences of trade union agitation .845 DVP4: Dispute resolution meetings .788 EVP1: Project has led to air pollution. .884 EVP2: Increased solid waste. .855 EVP3: Utilised environmentally friendly technology. .826 EVP4: Project has led to depletion natural resources. .810 QVP1: Right material was used for the construction work.
.933
QVP2: A sound QMS adhered to. .919 QVP3: Workers were trained on positive attitudes .911 SVP1: Accidents were reported. .835 SVP2: Fatalities did occur. .783 SVP3: Near misses occurred. .726
Eigenvalue 4.128 3.854 3.705 3.045 3.031 1.953
Percentage of variance explained 15.289 14.275 13.721 11.279 11.225 7.234
Cumulative percentage 15.289 29.564 43.285 54.564 65.789 73.023 Extraction Method: Principal Component Analysis. Rotation Method: Varimax with Kaiser Normalization. Rotation converged in 6 iterations.
Kaiser-Meyer-Olkin Measure of Sampling Adequacy=0.69, Bartlett’s Test of Sphericity=4137.533, Significance =0.000

79
From the analysis, it is evident that seven variables loaded under factor 1 seem to be
associated with project time performance. The second factor comprises six variables
which reflect the cost dimension of project performance. The four variables under
factor 3 represent construction project performance relating to site disputes whereas
the three variables under factor 4 attempt to capture environmental impact dimension
of project performance. The three variables under factor 5 are associated with project
quality and the remaining three variables that load on factor 6 reflect safety of a
project.
The above table reveals that ‘Time performance factor’ is the most important measure
of construction project performance, having the highest eigenvalue of 4.128 and
accounting for 15.289% of the variance in the dataset. This is followed by the measure
‘Cost performance factor’ with an eigenvalue of 3.854 which explains 14.275% of the
total variance. The third most important performance measure was found to be ‘site
disputes factor’ with an eigenvalue of 3.705 and explaining 13.721% of the variance
while the fourth important measure turns out to be ‘Environmental impact factor’ with
an eigenvalue of 3.045 and contributing to 11.279% of the total variance. The last
two performance measures in order of importance were ‘Quality performance factor’
and ‘Safety performance factor’ with an eigenvalue of 3.031 and 1.953 respectively.
The variance explained by these two factors is 11.225% and 7.234% respectively.
These six constructs of performance constitute the KPIs of CDF construction projects.
5.3.4 Validation of the KPIs
5.3.4.1 Reliability of KPIs scale: Reliability of the scale comprising KPIs was
established through Cronbach’s alpha coefficient which tested internal consistency of
the items. The 27- item scale had a reliability of 0.817 (standardised value of 0.808)
which is well above 0.70 recommended for similar studies (Hair et.al. 2006; Malhotra
and Dash, 2011). The Cronbach’s alpha coefficient for each factor was as follows:
Time performance measure: 0.867; Cost performance measure: 0.869; Site Disputes
measure: 0.917; Quality performance measure: 0.916; Safety performance measure:
0.699; and Environmental Impact measure: 0.875. This demonstrates that the factors
extracted from the analysis are considered adequate in the performance measurement
of CDF construction projects.

80
5.3.4.2 Content validity: The content validity of the instrument measuring KPIs was
achieved while designing the survey instrument. This was carried out through
extensive literature review followed by securing opinions from the experts comprising
academics and practitioners through in-depth interviews. This is discussed in detail in
section 4.3.
5.3.4.3 Convergent and Discriminant validity: In order to assess the convergent and
discriminant validity of the 27-item scale, the researcher made use of the correlation
matrix provided in table 5.9. The inter-item correlation of the scale had a mean of
0.100, while the smallest inter-item correlation within each performance measure are
as follows: Time performance factor: 0.100, Cost performance factor: 0.280, Site
Disputes factor: 0.573, Environmental Impact factor: 0.438, Quality performance
factor:0.875 and Safety performance factor: 0.338. These correlations are significantly
greater than zero (p<0.000), providing evidence for convergent validity.
To assess discriminant validity, the correlates under each factor in the correlation
matrix were counted to find out the number of times they had higher correlations with
items of other factors than items of its own factor in the correlation matrix. For
discriminant validity to be present, the count should be less than one half of the
potential comparisons (Wang et al., 2007). Examination of the correlation matrix in
table 5.9 reveals that there are 88 violations of discriminant validity out of 378
possible comparisons. Further, promax rotation of factors resulted in low correlations
amongst the factors, an indication of the presence of discriminant validity. The
statistical results show that the variables that loaded under each of the factors
adequately explained the same, i.e. had high convergence. Similarly, each factor was
distinct as evidenced by the correlations.

81
Table 5.9: Correlation matrix of performance measurement variables after grouping according to factor analysis TPV
1 TPV2
TPV3
TPV4
TPV5
TPV6
TPV7
CPV1
CPV2
CPV3
CPV4
CPV5
CPV6
DPV1
DPV2
DPV3
DPV4
EPV1
EPV2
EPV3
EPV4
QPV1
QPV2
QPV3
SPV1
SPV2
SPV3
TVP1 1 TVP2 .62 1 TVP3 .73 .66 1 TVP4 .77 .57 .45 1 TVP5 .56 .57 .53 .47 1 TVP6 .41 .52 .43 .44 .19 1 TVP7 .40 .32 .43 .30 .64 .10 1 CVP1 .23 .19 .13 .30 .28 -.03 .01 1 CVP2 .18 .01 .04 .21 -.04 -.07 -.16 .75 1 CVP3 .24 .20 .09 .34 .29 -.04 .04 .81 .74 1 CVP4 .14 .01 .07 .16 .17 -.11 -.05 .87 .68 .70 1 CVP5 -.23 -.18 -.16 -.09 -.26 -.08 -.11 .35 .40 .30 .28 1 CVP6 .10 .22 .15 .18 .21 .13 .12 .42 .26 .45 .33 .52 1 DVP1 -.19 -.06 .00 .02 .13 -.08 .32 -.15 -.27 -.05 -.15 .24 .34 1 DVP2 -.17 -.01 .04 .03 .21 -.04 .36 -.08 -.25 .01 -.08 .17 .31 .92 1 DVP3 -.11 .03 .00 .10 .22 -.03 .28 .13 .05 .25 .11 .25 .65 .75 .72 1 DVP4 -.07 -.15 -.02 .03 -.01 -.13 .18 .07 .06 .16 .09 .25 .19 .77 .69 .57 1 EVP1 -.14 -.12 .02 -.00 -.05 -.17 .05 -.07 .03 -.04 -.11 .05 .09 .20 .15 .21 .11 1 EVP2 -.25 -.12 .00 -.12 -.15 -.24 .12 -.05 .13 -.05 -.03 .13 .04 .21 .16 .20 .12 .62 1 EVP3 -.07 -.03 .04 .07 -.03 -.04 .10 -.06 -.00 .00 -.11 .01 .05 .18 .12 .20 .11 .86 .54 1 EVP4 -.17 -.10 .06 -.05 -.06 -.30 .16 .04 .18 .02 .02 .16 .13 .23 .18 .24 .12 .57 .79 .44 1
QVP1 .08 .12 .08 .10 .15 .12 .17 .02 -.09 .00 -.01 -.03 .09 .01 .07 .03 -.09 -.01 -.07 .04 -.06 1 QVP2 -.01 .02 -.02 .02 -.02 .06 .08 -.07 -.08 -.05 -.07 .00 .08 .00 -.01 .02 -.09 -.06 -.04 -.05 -.09 .52 1 QVP3 .05 .04 .01 .05 .07 .01 .21 -.01 -.03 .01 -.03 .08 .04 .05 .08 -.02 -.01 .03 .05 .07 -.03 .45 .34 1 SVP1 .19 .04 .26 .12 .27 -.11 -.05 .46 .37 .33 .44 .08 .27* -.08 -.04 .11 .02 .05 -.04 -.02 .07 .01 -.06 -.09 1 SVP2 .18 .05 .29 .08 .23 -.12 -.01 .40 .33 .30 .39 .10 .36 .02 .04 .22 .11 .07 .02 .02 .12 -.03 -.06 -.11 .92 1 SVP3 .24 .06 .28 .16 .29 -.06 -.03 .49 .39 .34 .46 .07 .29 -.06 -.02 .15 .06 -.02 -.12 -.08 .00 .04 -.05 -.11 .92 .88 1
Correlation coefficient and p values are as follows: ρ > 0.15 denotes p-value <0.05 or significant at 5% level; ρ > 0.20 denotes p-value <0.01; or significant at 1% level. KMO= 0.692, Bartlett test of sphericity: 4137, Significance: 000 Note; Shaded areas represent variables grouped together by factor analysis

82
5.3.5 Theoretical Framework of KPIs
KPIs determined through factor analysis of performance variables and validated
through appropriate tests enabled the researcher to develop a theoretical framework of
construction project performance linking the performance metrics and overall project
performance. This is shown in figure 5.7.
Figure 5.7: Proposed theoretical framework of key performance indicators
(KPIs)
This framework (figure 5.7) demonstrates that the project performance can be
described in terms of Time variables (TY1 ...TY6), Cost variables (CY1…CY6),
Quality variables (QY1….QY5), Safety variables (SY1...SY3), variables relating to
Site disputes (DY1 ...DY6) and Environmental impact (EY1…EY4). A brief
description of the factors constituting the above variables is given below.
Factor 1 represents Time performance measure
Time performance measure, as shown in table 5.8, is considered to be the most
important factor amongst all six constructs. In this construct, the highest loading is

83
observed in “timely delivery of project resources” (0.862) while the lowest one is
found in “at handover there were no apparent defects (0.572). Theoretically, the
variable “at handover there were no apparent defects” should have been loaded under
Quality performance measure but results of factor analysis reveal that it loaded under
Time performance measure. A closer look at the survey instrument indicates that the
respondents perceived defects in project to be a quality-related attribute but this
ultimately leads to delay in project handover and consequently its use. This might be
the possible reason why the above variable loaded under Time performance measure.
Similarly, the item “Harmonious relationship on site” is widely thought to be
associated with disputes during construction. In the current study, this item loaded on
time. The respondents perceive disharmony at workplace giving rise to disruptions of
work that eventually lead to delay in certain activities of the project. Lim and
Mohamed (2000) considered project completion time to be the first criterion for
project success. Other researchers (Kamrul and Indra, 2010; Khosravi and Afshari,
2011) have termed time to be the most important factor in the performance
measurement of construction projects. CDF projects, being community based, utmost
importance is given to time dimension because the funding of these projects is always
done annually based on its progressive performance.
Factor 2 represents Cost performance measure
As mentioned earlier, this factor is considered the second most important performance
measure of CDF projects. The highest loading is observed in “Equipment at budgeted
rates” (0.875) as revealed in Table 5.8. The table, further, shows that the variable
“adversely affected the quality of groundwater level”, loaded on this factor with a
loading of 0.586 despite it being reflective of environmental impact measure. This
implies that the project stakeholders would require more resources to minimise the
negative impact of the project on groundwater level thereby leading to an escalation
in project cost. Another variable “no financial claims at completion” loaded on cost
performance measure with a loading of 0.508, which theoretically should have loaded
under ‘Site Disputes’. However, this variable seems to have financial implications on
the project in terms of penalties and interests that would accrue to the project
implementing body. Construction cost has been identified as an important measure of

84
performance in almost all studies relating to the performance of construction projects
(Chan and Chan, 2004; Zou et al., 2007; Kaliba et al., 2008). In their study, Khosravi
and Afshari (2011) ranked cost as the second most important measure of project
performance. The current study puts much emphasis on regular monitoring of CDF
projects with a view to finding out how the funds allocated to a construction project
are spent.
Factor 3 represents Site Disputes measure
This factor comes third in order of explaining the variance in the dataset. The variable
‘no serious disputes on the project’ had the highest loading of 0.951 on this factor
while the variable ‘dispute resolution meetings’ was found to have the least loading
(0.788). Project stakeholders have the responsibility to minimise disputes amongst
themselves and formulate strategies to govern their relationships during project
construction. David (2009) and Tabish and Jha (2011) have observed that project
performance measurement should also consider the level of work related disputes
encountered during construction and after. According to Abidin (2007), construction
disputes are common and could have serious implications on performance of
construction projects. CDF construction projects are characterized by many
stakeholders whose relationships are likely to create disputes. These disputes, if not
checked, could derail project construction and hinder attainment of project objectives.
Factor 4 represents Environmental Impact measure
This factor comes fourth in order of the total amount of variance explained by the
same. The variable “the project has led to air pollution in the adjoining areas” had the
highest loading (0.884) on this factor while the variable “the project has led to the
depletion of natural resources” had the least loading (0.810). Chan and Chan (2004)
reported that environmental issues in construction have become a global concern and
therefore, should be considered an integral part of construction. A few other
researchers (Gangolells et al., 2009; Medineckiene et al., 2010; Shen et al., 2010;
Chen et al., 2010; Tan et al., 2011) have also acknowledged the importance of
environmental impact in the performance of construction projects. All construction
projects should address environmental issues for the purpose of achieving sustainable
development.

85
Factor 5 represents Quality performance measure
Though this factor was ranked the second least amongst six performance measures, it
is indispensable in the performance evaluation of CDF projects. The highest loading
for this factor was found on “right material was used for the construction work”
(0.933) while the item “workers were trained on positive attitude and methods” had
the lowest loading (0.911). The inclusion of quality in the performance measurement
of construction projects has been reported by several researchers including Jha & Iyer
(2006), Palaneeswaran et al. (2007), Ogano and Pretrius (2010), Love et al. (2010)
and Yung and Yip (2010). This measure of project performance was, however, ranked
third by Khosravi and Afshari (2011) in their study of success measurement amongst
power plant, utility and cogeneration construction projects. Chan and Chan (2004)
observed that quality is an important measure of project performance because it
constitutes the guarantee that the project will serve its purpose. Poor quality in
projects results in numerous reworks which unnecessarily undermine other project
performance indicators. Supervision of project quality is, therefore, the most
important activity which needs to be undertaken by all project stakeholders.
Factor 6 represents Safety performance measure
This factor comes last in order of its explanatory power of explaining the total
variance. The highest loading of this factor is observed on “accidents were often
reported” (0.835) and the least one is associated with “near misses occurred” (0.726).
Chan and Chan (2004) acknowledged the role of safety in construction and stated that
it is important for all project stakeholders to ensure that there are no accidents during
the entire construction period. Haslam et al. (2005), Billy et al. (2006) and Zuo (2011)
indicated that project safety should always be considered due to the risky nature of
construction activities when evaluating the performance of construction facilities. It is
important for every project organisation to focus on safety during construction
because if accidents occur, both contractors and clients may be subject to legal claims,
financial loss and delay in the overall completion of construction project.

86
5.4 Exploratory Factor Analysis (EFA) of project success variables for Critical
Success Factors (CSFs) Scale
In this section, the same dataset containing 175 responses was utilized to carry out
EFA on the success variables in order to identify the CSFs influencing the success of
public sector construction projects. The process followed is described below.
5.4.1 Descriptive statistics of project success variables
The maximum score, minimum score, mean and standard deviation of each of the 30
project success variables was computed in order to find out their importance in
influencing the success of public sector construction projects. Table 5.10 summarises
the descriptive of the above variables.
Table 5.10: Descriptive statistics of project success variables SUCCESS VARIABLES (SV) Mini-
mum Score
Maxi mum Score
Mean Score
Std. Dev
SV1: The location and site conditions did not affect the construction of this project.
1 5 2.98 1.408
SV2: Design complexity of project (type, size, nature and number of floors) has influenced the project cost and time.
1 5 2.90 1.307
SV3: Project planning, Scheduling and control were adequately done on this project
1 5 3.34 1.337
SV4: The client secured necessary funds for the project and hence there were no delays in material acquisition and payments to contractor.
1 5 2.53 1.461
SV5: The client got the design documents approved on time for this project.
1 5 2.82 1.356
SV6: The client had adequate experience on similar kind of projects.
1 5 2.27 1.452
SV7: Information sharing and collaboration among project participants were adequate in the current project.
1 5 2.90 1.123
SV8: The construction work adhered to the requisite Quality standards.
1 5 2.90 1.298
SV9: Continuous monitoring of actual expenditures and project time and their comparison with the budget and schedules was done regularly.
1 5 3.00 1.208
SV10: There was a formal organization structure for dispute resolution within the project organization.
1 5 3.02 1.259
SV11: Site Managers possessed requisite skills necessary for the kind of projects executed.
1 5 3.18 1.232
SV12: The contractor had adequate technical skills and experience on similar type of projects.
1 5 3.33 1.214
SV13: The contractor used latest construction methods in the project.
1 5 3.51 1.372
SV14: The community did not raise any social, political or cultural 1 5 3.02 1.293

87
issues against construction of the current project.
SV15: The project execution was adversely affected by the surrounding weather and climatic conditions.
1 5 3.26 1.114
SV16: Macro- economic conditions (such as interest rates, inflation) did not significantly affect the execution of this project.
1 5 3.38 1.226
SV17: The project was affected by the Governance policy of the relevant government agencies which affects project success.
1 5 3.24 1.213
SV18: The consultant was highly committed to ensuring construction work according to design specifications.
1 5 2.78 1.343
SV19: There were adequate drawings, design specifications and documentations for the use of contractor.
1 5 2.81 1.284
SV20: The client emphasized on completing the current project very fast without any reference to quality.
1 5 2.38 1.367
SV21: The client tended to purchase construction materials at cheaper rate which led to the dilution of other project objectives.
1 5 2.28 1.449
SV22: No variations in original design took place in the current project during construction phase.
1 5 2.49 1.245
SV23: The level of technological sophistication considered in the project was satisfactory.
1 5 3.32 1.250
SV24: There were no incidences of disagreements resulting from industrial relations prevailing at the time of project implementation.
1 5 3.34 1.038
SV25: The physical and ecological conditions surrounding the project were favourable to project execution.
1 5 3.31 1.082
SV26:There were very few internal procurement challenges 1 5 3.37 .985 SV27: The client’s decisions were timely and objective. 1 5 3.45 1.148 SV28: Right equipments were available in the construction site of this project.
1 5 3.47 .921
SV29: The project faced stringent insurance and warranty contractual requirements.
1 5 3.33 1.215
SV30: Working capital was adequate. 2 5 4.10 .736
From Table 5.10 it can be observed that the minimum score among the variables was
1 whereas the maximum was 5. Only one project success variable “working capital
was adequate” had a minimum score above 1. However, the highest score on all the
project success variables was 5. These scores indicate that the respondents used the
entire 5 point survey scale, implying adequate variability amongst the responses. The
highest mean score was 4.10 (Working capital was adequate) while the lowest was
2.27 (adequate experience on similar projects). This indicates that all the project
success variables were important as evidenced by high mean scores (above 2.25) for
majority of the project success variables. All the values of standard deviations were
found to be above 1 except in two variables; “few internal procurement challenges”
(0.985) and “working capital was adequate” (0.736). These values are relatively
close to 1 and hence they varied considerably amongst the respondents.

88
5.4.2 Assessing the factorability of project success variables
Assessment of factorability of project success variables was done based on correlation
matrix shown in Table 5.11. It was observed that the correlation matrix had a chi-
square value of 5466.934 and significant level of .000 based on Bartlett’s sphericity
test. This suggested that inter-correlation matrix contained sufficient common
variance to allow for factor analysis. Similarly, the KMO value for the entire matrix
was found to be above the suggested threshold of 0.500 (Hair et al., 2006).
However, observation of the anti image correlation matrix revealed that three success
variables had individual KMO values below 0.5, which indicated that the dataset, in
its current form, was still not suitable for factor analysis (Hair et al., 2006). These
values were sequentially eliminated one after another, starting with the one whose
KMO value was lowest, until 27-item scale with an overall KMO value of 0.802 and
individual KMO value of at least 0.5 was obtained for each item.

89
Table 5.11: Original Correlation Matrix of project success variables SV
1 SV 2
SV 3
SV 4
SV 5
SV 6
SV 7
SV 8
SV 9
SV 10
SV 11
SV 12
SV 13
SV 14
SV 15
SV 16
SV 17
SV 18
SV 19
SV 20
SV 21
SV 22
SV 23
SV 24
SV 25
SV 26
SV 27
SV 28
SV 29
SV 30
SV1 1 SV2 .72 1 SV3 .61 .62 1 SV4 .30 .44 .17 1 SV5 .16 .24 .11 .79 1 SV6 .32 .44 .25 .88 .67 1 SV7 .69 .69 .51 .31 .17 .29 1 SV8 .72 .99 .63 .45 .25 .45 .69 1 SV9 .69 .88 .56 .37 .21 .39 .63 .87 1 SV10 .70 .89 .55 .40 .26 .40 .65 .88 .82 1 SV11 .32 .21 .08 .10 .06 .10 .15 .20 .22 .16 1 SV12 .01 .02 -.12 .04 -.01 .02 -.08 .02 .00 -.07 .71 1 SV13 .46 .41 .35 -.04 -.08 .01 .27 .41 .39 .39 .63 .31 1 SV14 -.24 -.25 -.09 .06 .05 .10 -.13 -.25 -.27 -.25 .06 .22 -.15 1 SV15 -.07 -.15 -.01 .22 .09 .25 .00 -.14 -.16 -.19 -.01 .08 -.11 .73 1 SV16 -.12 -.13 -.03 .03 .00 .09 -.04 -.14 -.17 -.15 .06 .18 -.11 .74 .53 1 SV17 -.14 -.15 .03 -.02 -.08 -.03 .06 -.15 -.15 -.16 -.07 .06 -.23 .62 .68 .45 1 SV18 .21 .28 -.04 .29 .26 .24 .34 .27 .28 .33 .38 .17 .20 -.00 -.15 .03 -.14 1 SV19 .15 .22 .06 .34 .33 .40 .23 .21 .22 .28 .20 .07 .00 .07 -.05 .07 -.15 .51 1 SV20 .31 .44 .25 .77 .62 .90 .32 .44 .38 .41 .08 -.01 .04 .09 .22 .07 -.00 .25 .38 1 SV21 .33 .48 .25 .87 .66 .99 .32 .48 .41 .44 .12 .04 .03 .10 .24 .09 -.02 .26 .42 .91 1 SV22 .25 .31 .12 .44 .37 .50 .33 .29 .25 .37 .13 -.03 -.08 .17 .02 .15 -.06 .56 .78 .48 .52 1 SV23 -.10 -.19 -.12 .04 .05 .04 .03 -.18 -.19 -.17 -.36 -.31 -.15 .38 .48 .25 .30 -.20 -.09 .09 .04 .00 1 SV24 -.15 -.12 -.06 .28 .28 .28 -.05 -.11 -.11 -.12 -.11 -.03 -.23 .47 .39 .29 .34 .04 .06 .26 .27 .15 .72 1 SV25 -.26 -.30 .03 -.12 -.07 -.13 .07 -.30 -.27 -.30 -.32 -.17 -.24 .54 .53 .37 .57 -.19 -.11 -.07 -.12 -.16 .64 .53 1 SV26 .14 .22 .26 -.13 -.10 -.06 .16 .21 .21 .23 .03 -.14 .31 -.13 -.13 -.16 -.17 .26 .12 -.03 -.06 -.01 -.11 -.13 .07 1 SV27 -.06 -.04 -.16 -.09 -.03 -.12 -.10 -.05 -.05 -.02 .02 -.03 .04 -.05 -.05 -.05 -.04 .05 .01 -.10 -.11 -.00 -.02 -.01 -.06 .03 1 SV28 .18 .20 .16 -.12 -.10 -.07 .16 .19 .19 .20 .07 -.09 .28 -.14 -.19 -.15 -.21 .27 .14 -.05 -.06 .01 -.13 -.17 -.01 .85 .04 1 SV29 .15 .21 .33 -.23 -.22 -.19 .26 .20 .22 .23 .01 -.18 .38 -.08 -.06 -.04 -.05 .24 -.01 -.15 -.18 -.11 -.06 -.11 .22 .72 .05 .57 1 SV30 .01 .01 .00 .05 .03 .01 -.00 .01 -.01 .04 .00 .00 .03 -.04 -.03 -.03 -.00 .07 .04 -.06 -.01 .05 -.02 -.02 -.06 -.05 .19 .01 -.05 1 Correlation coefficient and p values are as follows: ρ > 0.15 denotes p-value <0.05 or significant at 5% level; ρ > 0.20 denotes p-value <0.01; or significant at 1% level Overall measure of sampling adequacy: 0.771, Bartlett test of sphericity: 5466.934, Significance: 000

90
5.4.3 Factor Analysis following Varimax Rotation
Having established that factor analysis could be applied on the 27 project success
variables, principal component analysis (PCA) was employed with varimax rotation
in order to identify the underlying structure of relationships. Due to lack of a priori
basis on the number of factors to be extracted, initially all 27 variables were allowed
to load freely on various factors so long as they had eigenvalue greater than one.
Further a scree plot for different components was obtained (as shown in figure 5.8) in
order to have an idea about the amount of variance explained by each factor.
Figure 5.8: Scree Plot of project success factors

91
Observation of the shape of the scree plot generated (Figure 5.8) revealed that six
factors could adequately capture variance amongst the success variables. While
conducting factor analysis, the process was subjected to the four conditions as
discussed in section 5.3.3 beforehand (page 78)
During factor analysis, all success variables loaded appropriately based on the four
conditions (already mentioned in section 5.3.3) which yielded a 6-factor 27-item
instrument, accounting for 78.510% of the variance in the dataset. In this study,
factors were named as Project related, Client related, Environment related, Supply
chain related, Consultant related and Contractor related factor. Table 5.12
summarizes the factor loadings for the 27-item instrument and the labelling of those
items, i.e project success variables.
The factor analysis results shown in table 5.12 reveal that ‘Project Related Factor’ is
the most important construct of project success having the highest eigenvalue of 5.606
and accounting for 20.763% of the variance in the data set. This is followed by `Client
Related Factor’ with an eigenvalue of 4.490, which explains 16.630% of the total
variance. The third most important critical success factor is found to be ‘External
environment Related Factor’ with an eigenvalue of 3.775 and explaining 13.983%`of
the variance while the fourth important factor turns out to be ‘Supply Chain Related
Factor’ with an eigenvalue of 2.673 and contributing to 9.900% of the total variance.
The last two CSFs in order of importance are ‘Consultant Related Factor’ and
‘Contractor Related Factor’ with an eigenvalue 2.335 and 2.298 respectively and the
variance explained of 8.722% and 8.511% respectively. The six factors extracted
indicate different dimensions of success amongst CDF construction projects. The
significant loadings of all the items on a single factor indicate unidimensionality while
the absence of cross loading items supports discriminant validity of the instrument.

92
Table 5.12: Results of the Factor Analysis of project success variables Component
1 2 3 4 5 6 Cronbach’s alpha (α) 0.945 0.954 0.868 0.869 0.826 0.780
PSV1: Influence of design complexity. .895 PSV2: Adhered to the requisite Quality standards. .893 PSV3: Continuous monitoring of actual expenditures. .844 PSV4: Formal dispute resolution structures. .842 PSV5: Effect of location and Site conditions. .818 PSV6: Adequate information sharing and collaboration.
.797
PSV7: Adequate project planning and, scheduling. .749 CSV1: Adequate experience on similar projects. .911 CSV2: Cheap materials were used. .896 CSV3: Project funds secured on time. .882 CSV4: Client’s emphasis on time rather than quality. .855 CSV5: Design documents approved on time. .797 ESV1: Community had no issues against the project. .873 ESV2: Adversely affected by the surrounding weather. .828 ESV3: Effect of the Governance policy. .815 ESV4: Favourable physical and ecological conditions. .759 ESV5: Effect of macro- economic conditions. .736 ESV6: No incidences industrial unrests. .552 LSV1: Few internal procurement challenges .932 LSV2: Right equipments were available. .858 LSV3: Effect of stringent insurance/warranty rules .806 SSV1: No variations were incorporated. .841 SSV2: Adequate designs/specifications and documentations.
.829
SSV3: Adequate commitment of consultant to the project.
.728
RSV1: Site Managers possessed requisite skills. .914 RSV2: Contractor had adequate technical skills. .857 RSV3: Contractor used latest construction methods. .647
Eigenvalue 5.606 4.490 3.775 2.673 2.335 2.298
Percentage of variance explained 20.763 16.630 13.983 9.900 8.722 8.8511
Cumulative percentage 20.763 37.394 51.376 61.277 69.999 78.510 Extraction Method: Principal Component Analysis. Rotation Method: Varimax with Kaiser Normalization. Rotation converged in 6 iterations. Kaiser-Meyer-Olkin Measure of Sampling Adequacy=0.802. Bartlett's Test of Sphericity=5117.857 Significance =0.000

93
5.4.4 Validation of the CSFs
5.4.4.1 Reliability of CSFs scale: The 27- item CSFs scale had a reliability coefficient
of 0.846 which is above the recommended value of 0.70 (Hair et.al. 2006; Malhotra &
Dash 2011). The Cronbach’s alpha coefficient for each factor was as follows: Project
related factor=0.945; Client related factor= 0.954; Consultant related factor=0.826;
Contractor related factor=0.780; Supply chain related factor=0.826; and
Environmental related factor=0.868. This demonstrates that the factors extracted from
the analysis are considered adequate in the successful implementation of CDF
construction projects.
5.4.4.2 Content validity: The content validity of the instrument measuring CSFs was
achieved while designing the survey instrument. This was carried out through
extensive literature review followed by securing opinions from the experts comprising
academics and practitioners through in-depth interviews and the pilot survey amongst
30 representative respondents. This is discussed in detail in the Research
Methodology section (Chapter 4, section 4.3), page 50.
5.4.4.3 Construct validity: In order to assess construct validity, it was important to
examine convergent and discriminant validity of the 27-item scale, based on the
correlation matrix provided in Table 5.13. The inter-item correlation of the scale had a
mean of 0.176, while the smallest inter-item correlations within each success factor
are as follows: Project related factor=0.51, Client related factor= 0.62, Consultant
related factor=0.51, Contractor related factor=0.31, Supply chain related factor=0.57
and Environmental factor=0.29. These correlations are significantly greater than zero
(p<0.000) providing evidence for convergent validity and large enough to warrant
discriminant validity.
Further, the correlates under each factor in the correlation matrix in table 5.13 were
counted to assess the discriminant validity as described in section 5.3.4.3 (page 81).
It was found that there were 12 violations of discriminant validity out of 378 possible
comparisons. This indicates the presence of adequate discriminant validity.

94
Table 5.13: Correlation matrix of project success variables after grouping according to factor analysis PS
V1 PS V2
PS V3
PS V4
PS V5
PS V6
PS V7
CS V1
CS V2
CS V3
CS V4
CS V5
ES V1
ES V2
ES V3
ES V4
ES V5
ES V6
LS V1
LS V2
LS V3
SS V1
SS V2
SS V3
RS V1
RS V2
RS V3
PSV1 1 PSV2 .99 1 PSV3 .88 .87 1 PSV4 .89 .88 .82 1 PSV5 .72 .72 .69 .70 1 PSV6 .69 .69 .63 .65 .69 1 PSV7 .62 .63 .56 .55 .61 .51 1 CSV1 .44 .45 .39 .41 .32 .29 .25 1 CSV2 .48 .48 .41 .44 .33 .32 .25 .99 1 CSV3 .44 .45 .37 .40 .30 .31 .17 .88 .87 1 CSV4 .44 .44 .38 .41 .31 .32 .25 .90 .91 .77 1 CSV5 .24 .25 .21 .26 .16 .17 .11 .67 .66 .79 .62 1 ESV1 -.25 -.25 -.27 -.25 -.24 -.13 -.09 .10 .10 .06 .09 .05 1 ESV2 -.15 -.14 -.16 -.19 -.07 .00 -.01 .25 .24 .22 .22 .09 .73 1 ESV3 -.15 -.15 -.15 -.16 -.14 .06 .03 -.03 -.02 -.02 -.00 -.08 .62 .68 1 ESV4 -.30 -.30 -.27 -.30 -.26 .07 .03 -.13 -.12 -.12 -.07 -.07 .54 .53 .57 1 ESV5 -.13 -.14 -.17 -.15 -.12 -.04 -.03 .09 .09 .03 .07 .00 .74 .53 .45 .37 1 ESV6 -.12 -.11 -.11 -.12 -.15 -.04 -.06 .28 .27 .28 .26 .28 .47 .39 .34 .53 .29 1 LSV1 .22 .21 .21 .23 .14 .16 .26 -.06 -.06 -.13 -.03 -.10 -.13 -.13 -.17 .07 -.16 -.13 1 LSV2 .20 .19 .19 .20 .18 .16 .17 -.07 -.06 -.12 -.05 -.10 -.14 -.19 -.21 -.01 -.15 -.17 .85 1 LSV3 .21 .20 .22 .23 .15 .26 .33 -.19 -.18 -.23 -.15 -.22 -.08 -.06 -.05 .22 -.04 -.11 .72 .57 1 SSV1 .31 .29 .25 .37 .24 .33 .12 .50 .52 .44 .48 .37 .17 .02 -.06 -.16 .15 .15 -.01 .01 -.11 1 SSV2 .22 .21 .22 .28 .15 .22 .06 .40 .42 .34 .38 .33 .07 -.05 -.15 -.11 .07 .06 .12 .14 -.01 .78 1 SSV3 .28 .27 .28 .33 .21 .34 -.04 .24 .26 .29 .25 .26 -.00 -.15 -.14 -.19 .03 .04 .26 .27 .24 .57 .51 1 RSV1 .21 .20 .22 .16 .32 .15 .08 .10 .12 .10 .08 .06 .06 -.01 -.07 -.32 .06 -.11 .03 .07 .01 .13 .20 .38 1 RSV2 .02 .02 .00 -.07 .01 -.08 -.12 .02 .04 .04 -.01 -.01 .22 .08 .06 -.17 .18 -.03 -.14 -.09 -.18 -.03 .06 .17 .71 1 RSV3 .41 .41 .39 .39 .46 .27 .35 .01 .03 -.04 .04 -.08 -.15 -.11 -.23 -.24 -.11 -.23 .31 .28 .38 -.08 .00 .20 .63 .31 1
Correlation coefficient and p values are as follows: ρ > 0.15 denotes p-value <0.05 or significant at 5% level; ρ > 0.20 denotes p-value <0.01; or significant at 1% level Kaiser-Meyer-Olkin Measure of Sampling Adequacy=0.802. Bartlett's Test of Sphericity=5117.857, Significance =0.000

95
5.4.5 Theoretical Framework of CSFs
CSFs determined through factor analysis of success variables of Public sector
construction projects and validated through appropriate tests facilitated development
of a theoretical framework linking the CSFs to project success. This is demonstrated
in Figure 5.9.
Figure 5.9: Proposed theoretical framework of critical success factors (CSFs)
This framework (Figure 5.9) demonstrates the CSFs namely project related factor
(PSV1………..PSV7), Client related factor (CSV1.....CSV5), Consultant related factor
(SSV1……..SSV3), Contractor related factor (RSV1……….RSV3), Supply chain
related factor (LSV1.......LSV3) and External environment related factor
(ESV1………..ESV6) influence the success of public sector construction projects.
The findings so obtained and the validation process followed provide evidence to the
fact that the six CSFs influence success of public sector construction projects and that
the project success scale is appropriate for determination of successful completion of

96
construction projects. Identifying CSFs is important as it allows firms to focus their
efforts on building their capabilities to meet the CSFs. A brief description of the CSFs
extracted is given below.
Factor 1: Project related factor
Project related factor as shown in Table 5.12 is the most important factor than the
other five CSFs amongst CDF construction projects in Western province, Kenya. This
shows that all stakeholders involved in the construction of CDF projects consider
characteristics of the project itself to be significant in the successful implementation
of construction projects. The findings reveal that this particular factor captures the
unique characteristic features of the project not covered by any other factors. Seven
project characteristics were found to load on this factor as indicated in the factor
analysis results. The results reveal that the highest loading is found in “Influence of
Design Complexity” (0.895), while the lowest one is observed in “Adequate Project
planning and scheduling” (0.749). This emphasises the importance of project design
in determining the success of construction projects.
Factor 2: Client related factor
This factor is ranked second amongst six factors. The highest factor loading is
observed in “Client had adequate experience on similar projects” (0.911) whereas the
least is found in “Design documents were approved on time” (0.797). Owner
interference in terms of change or variation in orders and imposition of unrealistic
contract conditions affect project success (Murali, 2007; Sweis et.al, 2007). The
construction process starts with the client realizing the need for a construction product
(a constructed facility) which could be in the form of a new building or refurbishment
of an existing facility. Therefore, the client will give the direction that the project will
follow in terms of its construction.
Factor 3: External environment related factor
External environment related factor is the third ranking factor. “Community did not
raise issues against the project” had the highest loading of 0.873 while the lowest
loading was found in “No incidences of disagreements resulting from industrial
relations” (0.552). Litsikakis (2009) argues that external environment is said to be
the combination of ecological, political, economic, socio-cultural and technological

97
(EPEST) context in which the project is executed. Long et al. (2004) recommended
that as an immediate check, project stakeholders could simply examine the project
environment and make a subjective assessment of the potential success of their
projects. According to the provisions in the CDF act (2003), CDF construction
projects in a particular constituency are identified by the community based on their
needs after considering economic, social and ecological environment prevailing in the
same region.
Factor 4: Supply chain related factor
Three variables loaded on the fourth component namely supply chain related factor:
few internal procurement challenges (0.932), right equipments were available (0.858)
and effect of stringent insurance/warranty rules (0.806). According to Vrijheof and
Koskela, (2000), the concept of Supply Chain Management (SCM) is used to analyze,
reengineer, coordinate, and constantly improve construction supply chain. This leads
to efficiency in construction through reduction of lead-time and inventory held by an
organization. Koushiki et al. (2005) and Ahsan and Gunawan (2000) emphasised the
need for an effective procurement system in project construction in order to improve
performance. Similarly, shortage of skilled manpower, delay in material delivery and
modifications in material specifications (Sweis et.al, 2007), labour supply and labour
productivity (Murali and Yau, 2007) affect project success. Therefore, the flow of
materials, labour and equipment in the site has a significant bearing on the pace and
quality of the construction work.
Factor 5: Consultant related factor
This factor, regarded as consultant related factor, ranked fifth amongst the success
factors. Of all the variables, “no variations were incorporated” had the highest
loading (0.841) while “the consultant was highly committed to project construction”
had the lowest loading (0.729). Consultants are responsible for advising the client and
contractor at various stages of the construction project especially on necessary
changes and variations. Accordingly the client and contractor take a pragmatic
decision on incorporating necessary modifications into the construction projects (Al-
Tmeemy et.al, 2011; Ahadzie et.al, 2008; Chan and Kumaraswamy, 1997). All

98
construction work take place based on the designs provided by the consultants. Hence
it is important to consider consultant related factor.
Factor 6: Contractor related factor
Though this component is ranked least amongst the six components, it is
indispensable in contributing success to construction projects. The highest loading is
observed on the “Site Managers possessed requisite skills” (0.914) and the least
loading is found on the “Contractor used latest construction methods” (0.647).
Murali and Yau (2007) found that contractor related factor significantly contributes to
time overrun in an organisation. Al-Kharashi and Skitmore (2008) found that
contractor performance is important when determining overall project performance.
Construction contractors undertake construction work in accordance with the
prescribed technical, managerial and contract specifications as stipulated by the CDF
act (2003). It is, therefore, important to consider their technical and managerial
capabilities in project construction.
5.5 Conceptual framework of project performance evaluation
Project success and overall project performance constructs were assessed for
nomological validity in order to develop a conceptual framework of project
performance evaluation. Nomological validity of a construct is the degree to which a
construct behaves as it should within a system of related constructs called a
nomological net (Hair et al., 2006). In reference to performance evaluation of
construction projects, literature reveals that the two concepts, project success and
project performance have been used interchangeably. However, a few researchers
have been able to differentiate them on the basis of their focus within a performance
evaluation framework. Barclay and Osei-Bryson (2010) reported that because of
stakeholders’ vested interests in the activities and outcome of the project, project
success would be viewed differently by different stakeholders, but project
performance is based on how well the outcome of the project are attained. Similarly,
Shenhar (2001) affirms that different stakeholder interests lead to different
perceptions of success and how the project performed. Further, Cooke-Davies (2002)
argue that CSFs are the necessary factors that influence project success whereas
overall project performance reflects the extent to which the project has been

99
successful. According to Takim and Akintoye (2002), project success is affected by
CSFs based on various managerial activities, whereas project performance refers to
the extent to which the various project outputs have been attained. The focus of
project success is, therefore, on construction management whereas project
performance relates to the measurement of project outcomes in terms of various
performance indicators.
Because the previous analyses indicate that there are relationships between CSFs and
project success and relationships between overall project performance and the KPIs,
the researcher predicted positive relations between project success and overall project
performance. Theoretically, there exists an association between overall project
performance and project success. This pattern of relations is one part of the
nomological net permitting the researcher to test an objective measure of overall
project performance and the factors that influence project success. Thus a
performance evaluation framework is conceptualised for public sector construction
projects as shown in figure 5.10.
Influence Predicted through
Influences In terms of
Mediated through
Figure 5.10: Conceptualised relationship between project success and overall project performance
In the performance evaluation framework (figure 5.10), six CSFs namely project
related, client related, consultant related, contractor related and supply chain related
factors influence project success both directly and through external environment.
Critical Success factors ( ) Project related Client related Consultant related Contractor related Supply chain related
Key Performance indicators Project cost Project time Project quality Project safety Site disputes Environmental
impact
External Environment
Social Economic Ecological
Overall Project performance
Project success

100
Besides the mediation role, external environment related factor also influences project
success. Further, the framework shows that project success is predicted through overall
project performance in terms of six KPIs namely project cost, project time, project
quality, project safety, site disputes and environmental impact.

101
CHAPTER 6: RESEARCH METHODOLOGY (PHASE II):
CONFIRMATORY STUDY
6.0 Introduction
Data collected in the first phase was examined, tabulated and analysed through EFA.
The outcome of phase I of the study provided two different measurement scales: one
consisting of 27- performance measurement variables for KPIs scale and the other
with 27-project success variables for CSFs scale. The measurement scales of both
KPIs and CSFs were further examined and confirmed by administering the scale to a
different set of respondents. This necessitated a confirmatory study.
6.1 Key Issues
This confirmatory phase of the study aims at
Examine the extent of differences in the occurrence of cost overrun, time
overrun and quality defects across different types of construction projects
(Educational, Healthcare, Industrial Estates and Agricultural Markets).
Examine the association between the project procurement approaches followed
in public sector construction projects and occurrence of cost overrun, time
overrun and quality defects.
Examine the association between stakeholders’ (client, consultant and
contractor) experience in construction projects and occurrence of cost overrun,
time overrun and quality defects.
To confirm the KPIs identified in the exploratory study and examine the
association between the confirmed KPIs and overall project performance.
To confirm the CSFs identified in the exploratory study and examine the
influence of the confirmed CSFs on project success.
To examine the association between overall project performance and project
success.

102
6.2 Theoretical framework and Statement of Hypotheses for performance
evaluation of public sector construction projects
Based on the key issues mentioned in section 6.1 as well as the conceptual framework
developed in Chapter 5 (Figure 5.10), the following relationships are hypothesized for
performance assessment of public sector construction projects (Figure 6.1).
Figure 6.1: Hypothesized performance assessment model for public sector
construction projects
It is hypothesized that CSFs have positive influence on project success. Accordingly,
six CSFs proposed were project-related, client-related, consultant-related,
contractor-related, supply chain-related and external environment-related factors.
Besides having a direct influence on project success, it has been hypothesized that
external environment related factor mediates the influence of the remaining five CSFs

103
on project success. Further, there is an association between project success and overall
project performance which is related to six KPIs namely time, cost, quality, safety,
site disputes and environmental impact.
Project construction is a complex activity that requires proper coordination of efforts
by various participants in a systematic manner (Chan, Scott & Chan, 2004; Long,
Ogunlana, Quang & Lam, 2004; Murali & Yau, 2007). One must identify the factors
that are crucial to the success of a project and put in efforts in building capabilities to
meet the success factors. The project related factor reflects the characteristics of a
project which include project design, site conditions and project management
procedures. Favourable project conditions will lead to its success. Public sector
construction projects are unique in terms of their sizes (Kerzner, 2006; Pheng &
Chuan, 2006), complexity (Kerzner, 2006) and type (Chan & Chan, 2004; Fortune &
White, 2006) which present a big challenge to many contractors. Therefore, project
related factor provide a basis upon which other decisions relevant to the project can be
made regarding construction activities. These activities eventually influence project
success.
Hypothesis 1a: Project related factor has a positive influence on the success of
public sector construction projects.
The construction process starts with the client realising the need for a construction
product which could be in the form of a new building or refurbishment of an existing
facility. Client related factor refers to the client related activities which includes
giving direction to the project implementing agencies in terms of construction related
activities. These include client’s experience and how the client executes his/her role
on the project during construction, e.g. material procurement and approval of designs.
The client is central to project implementation because he involves himself in
selecting a suitable contractor/s and constantly supervises the progress of the
construction work. The nature and type of the client (whether belonging to public or
private sector), the clarity of the project mission, the competency of the client in terms
of his ability to brief, make decisions, and define roles have been found to
significantly affect the performance of the client. Project financing is vital in the
performance of construction projects (Koushki et al., 2005; Kaliba et al., 2009), which

104
is arranged by the client. Client’s financial position and experience would most likely
determine the kind of materials, labour and equipment to be used for construction.
According to Walker (1995), the influence of the client or client’s representative
contribute significantly to the performance of construction projects. This viewpoint is
supported by Pheng and Chuan (2006), who argued that poor project performance
cannot be attributed to any other party to construction but the client itself. They
emphasized that “clients’ actions before, during and after the project can affect the
performance of a project.” Given the various advantages of active client participation
in construction, lack of client involvement can lead to poor performance of
construction projects on many metrics including cost, time, quality and conflicts
(Fortune & White, 2006; Toor & Ogunlana, 2006). Therefore, for successful project
performance, the clients must play an active role at all phases of project construction
(Blyth & Worthington, 2001; Pheng & Chuan, 2006). Client’s knowledge, confidence
and experience with different types of projects exert significant influence on the
success of public sector construction projects.
Hypothesis 1b: Client related factor has a positive influence on the success of public
sector construction projects.
Consultants are responsible for advising the client and contractor at various stages of
the construction project especially on necessary changes and variations. Therefore,
consultant related factor such as the experience and commitment of consultants
significantly affect project performance. In many occasions, the consultant (architect
or engineer) acts as the project coordinator. His or her role is to design the works,
prepare the specifications, produce construction drawings, administer the contract,
tender the works, and manage the works from inception to completion
(Ratnasabapathy, 2008). The detailed drawings also include the specifications of
construction materials on the basis of which materials are procured from vendors. In
addition, the consultant also prepares detailed documents of project design and
provides the same to the contractor which serves as guidelines in construction work
(Saqib et al, 2008; Kaliba et al, 2009; Alwaer & Clements-Croome, 2010). In project
performance literature, issues such as complexity of designs and the accompanying

105
documents have been cited to influence the success of a project (Long et al., 2004;
Alwaer & Clements-Croome, 2010).
Hypothesis 1c: Consultant related factor has a positive influence on the success of
public sector construction projects.
In many developing countries, contractors are usually private firms or individuals who
undertake construction of a project under certain terms and conditions as prescribed
by the client while agreeing to comply with the design and specifications provided by
the consultant. Construction contractors undertake the construction work in
accordance with the prescribed technical, managerial and contract specifications
(Wang & Huang, 2006), which essentially influence the success of construction
projects. According to Alzahrani and Emsley (2013), contractors play an important
role in the realisation of quality of a construction project through their workmanship
and conformance to specifications. Respondents surveyed in their study reported that
contractors had a great impact on achieving success in their project. Chua et al. (1999)
while focusing on contractor related factor, identified capability of contractor key
personnel, competency of contractor proposed team, contractor team turnover rate,
contractor top management support and contractor track record as having a significant
effect on overall project success. Inadequate contractor experience, improper planning
and poor site management by contractor, problems with subcontractors affect success
of public sector construction projects.
Hypothesis 1d: Contractor related factor has a positive influence on the success of
public sector construction projects.
Acquiring the necessary labour force, tools, material and equipment is important in
project construction. This ensures that workers are always engaged, thereby,
enhancing worker productivity and construction efficiency (Pheng & Chuan, 2006),
because materials and supplies of a project have an important impact on the
productivity and the success of a project
In relation to project construction, supply chain related factor consists of all the
construction business processes, from the demands placed by the client, regarding
conception, design and construction to maintenance, replacement and eventual
decommission of building, and organizations (Xue, Wang, Shen, & Yu, 2007). They

106
include procurement challenges in respect of material, equipment and labour. Many
construction organizations have adopted supply chain management (SCM) practices
to facilitate movement of materials, labour and equipment within the organization.
SCM play major roles in construction by ensuring availability of construction
resources at the right cost, right time and the right quality, thereby, coordinating and
integrating the construction processes. According to Vrijhoef and Koskela, (2000)
SCM also seeks to minimise logistics costs and decrease lead-time and inventory
across the supply chain. Azhar et al. (2002) in their study concluded that “supply
chain management (SCM) has a great potential in the construction industry in
reducing cost and time thereby improving its profitability. Specifically, a construction
supply chain (CSC) leads to efficient coordination that addresses problems of high
fragmentation, low productivity, cost and time overrun and conflicts, and eventually
leads to attainment of project success. However, supply chain process in the
construction industry is extremely dynamic due to frequent changes in the design and
plans of construction projects (Tae-Hong, Sangyoon, Su-Won & Soon-Wook, 2011).
Therefore, despite great potential SCM in construction projects, Segersted and
Olofsson, (2010) argue that organizations are still unable to realise all project
objectives. Unless project resources arrive at the right time and right place, achieving
success of a construction project becomes very difficult.
Hypothesis 1e: Supply chain related factor has a positive influence on the success of
public sector construction projects.
The construction industry is considered to be the backbone of many economies. Its
uniqueness throughout the world is determined by the external environment in which
it operates. By nature, construction projects are exposed to various factors arising out
of their external environment. This requires that decisions and risks associated with
various projects should, therefore, incorporate the effect of environment factor in a
project. Enshassi, Mohamed and Ekarriri (2009) emphasize that contractors should
consider political and business environment risks while estimating project costs and
schedule because improper planning for these risks could lead to delays and cost
escalation because of closures due to materials shortages. Pheng and Chuan (2006)
categorised project environment into two groups: immediate environment and

107
external environment. The immediate environment refers to the investors, customers,
suppliers, consultants and contractors. This environment is more or less specific to a
project. The external environment of a project includes social, political, technological,
legal and economic factors and their implications on the project. Litsikakis (2009) and
Saqib et al. (2008) argue that external environment can be said to be the combination
of ecological, political, economic, socio-cultural and technological (EPEST) context
in which the project is executed. Long et al. (2004) recommended that as an
immediate check, project stakeholders could simply examine the project environment
and make a subjective assessment of the effect of environment on project success.
Whereas these environments are dynamic, their impact will certainly influence project
success.
Hypothesis 1f: External Environment related factor has a positive influence on the
success of public sector construction projects.
The operating environment of projects is characterised by high degree of uncertainty
and complexity, when compared to the operating environment of general business
operations. Same types of projects in different environments are likely to differ in
their performance due to varying economic, political, social and ecological
environments. Environmental effects are sometimes said to be indirect since they
have to combine with some other characteristics in the project environment.
Therefore, external environment interferes with project related factor and is assumed
to play a significant role in mediating the influence of project related factor on project
success.
Hypothesis 2a: External environment mediates the influence of project related factor
on the success of public sector construction projects.
Every government has certain environmental regulations for construction projects
which every client must adhere to while undertaking construction. While designing a
construction project for a particular location, the consultant has to keep in mind the
ecological and political environments of that location and accordingly has to comply
with the statutory guidelines for designing the project. He should design such projects
which will minimize environmental degradation, avoid depletion of raw materials and
encourage the use of environmentally friendly methods (Ding, 2005; Tsoulfas &

108
Pappis, 2008; Ortiz, Castells, & Sonnemann, 2009; Tan et al., 2011) within statutory
government regulations. In every country, government provides environmental codes
to guide construction of new projects (Ngowi, 2001; Tsoulfas & Pappis, 2008; Ortiz
et al., 2009; Tan et al., 2011) which the contractors are expected to comply with. Thus
it is observed that although the activities of client, consultant and contractor have
direct influence on project success, these three broad stakeholders have to operate in a
specific environment in which the project is undertaken. These stakeholders are
required to comply with the environmental codes and regulations. Environmental
factor combines with client related, consultant related and contractor related factors
and is considered to mediate the influence of these factors on project success.
Hypothesis 2b: External environment mediates the influence of client related factor
on the success of public sector construction projects.
Hypothesis 2c: External environment mediates the influence of consultant related
factor on the success of public sector construction projects.
Hypothesis 2d: External environment mediates the influence of contractor related
factor on the success of public sector construction projects.
Further, the materials, labour and equipment used in construction come from the
environment. Similarly the funding agencies involved in provision of resources in the
construction projects are political institutions whose interests are part of the political
environment. Because of this, the environment plays an important role in the
construction process in terms of uninterrupted supply of inputs (Shen et al., 2010).
According to Briscoe and Dainty (2005), the interplay between the external
environment and supply chains affect the overall project success.
Hypothesis 2e: External environment mediates the influence of supply chain related
factor on the success of public sector construction projects.
Project success and overall project performance are two concepts in project
management literature that have been used interchangeably. Whereas project success
is assessed on the basis of management effort to complete the project, performance is
a comparison of project outcomes against the objectives of the project. According to
Cooke-Davies (2002), a project performance criterion provides a benchmark upon
which success or failure of a project is measured whereas success factors are

109
management inputs and systems that would lead to project success. Therefore, project
success is reflected through overall project performance on KPIs. Previously,
Westerveld (2002) attempted to link success criteria (overall projects performance)
and success factors. He explained that such a link was necessary as it would enable
project implementing agencies to manage project progress towards attaining success
and monitor overall project performance. It can, therefore, be hypothesised that;
Hypothesis 3 Overall project performance is positively associated with the success of
public sector construction projects.
The cost construct the cost of project resources and the extra cost incurred due to the
project construction. A project will be considered to have performed well if it is
completed within the budgeted cost (Chan et al., 2004; Long et al., 2004). According
to Azhar et al. (2008), cost is amongst the major considerations throughout project life
cycle and can be regarded as one of the most important parameters of a project and
driving force to overall project performance. Further, Memon et al. (2012) report that
cost is one of the fundamental dimension upon which project performance is assessed
during construction. Failure to address project cost during construction has been
reported to lead to negative effect on the project (Ali & Kamaruzzaman 2010). It is on
this basis that many organizations have attempted to develop approaches that could
help in control of project costs. However, Olawale and Sun (2010) have argued that
despite the availability of control techniques and project control software, many
project organizations are still unable to achieve cost objectives. This is reflected
through poor performance of construction projects. Therefore, a project is considered
to have performed well in terms of cost when overall performance is satisfactory.
Hypothesis 4a: Cost performance is positively associated with the overall
performance of public sector construction projects.
Every project is planned to take a specified time based on its characteristics and the
number of activities involved. All these activities must be undertaken within the time
frame if the project objectives are to be realised. It is the desire of project stakeholders
to complete the project within the scheduled time (Kamrul & Indra, 2010; Williams,
2003).The time construct focuses on resource delivery schedules, timely availability
of funds, ability to monitor actual progress of activities against the planned ones in

110
view of conflict and ever changing weather conditions. Although most of these
processes have been automated, projects still experience time overrun (Oluwale &
Sun 2010). Time overrun affects delivery of intended services to the beneficiaries and,
therefore, has a bearing on overall project performance (Memon et al., 2012, Bon-
Gang, Xianbo, & Si Yi, 2013). Alternatively, a project achieves a satisfactory
progress on time performance when overall project performance turns out to be
adequate.
Hypothesis 4b: Time performance is positively associated with the overall
performance of public sector construction projects.
The quality construct measures the extent to which the final project matches the
specifications set out at its inception. It is mainly concerned with the adherence of the
project to the prescribed quality standards and is measured in terms of reworks that
are necessary in order to meet requisite quality standards (Jha & Iyer, 2006; Ogano &
Pretorius, 2010). Palaneeswaran, Ramanathan and Tam (2007) emphasized the
importance of quality in construction projects when they concluded that uncontrolled
rework occurrence in construction projects have serious impact on overall project
performance. According to Hamad and Sangwon (2013), because of multiplicity of
causes, defects can have significant effect on performance of a construction project.
Further, Love et al. (2010) stated that compliance with quality specifications is an
important performance measure of any construction project.
Hypothesis 4c: Quality performance is positively associated with the overall
performance of public sector construction projects.
Borvorn (2011) reports that occurrence of disputes on construction project sites have
been found to proliferate in the construction industry resulting in drawbacks and
disharmonization in the completion of construction projects. Therefore, while
considering overall project performance, it is important to consider the site disputes
construct in order to establish whether there were work disruptions during project
construction due to the issues affecting the interest of community. The project site
should remain free from disputes (David, 2009; Tabish & Jha, 2011). According to
the American Bar Association, if construction disputes are not resolved in time, they
become very expensive in terms of finances, personnel, time, and opportunity costs.

111
Because of this, there is need to avoid and resolve such disputes if the project
objectives are to be realised (Skene & Shaban, 2002). Al-Momani (2000) suggested
that there is need for special attention to the main causes of project delay in order to
avoid contract disputes. However, Cheung et al. (2000) argues that since resolving
disputes has become part of routine management functions in an organisation, dispute
resolution satisfaction should be considered as a significant measure of overall project
performance since it impacts on the attainment of project objectives.
Hypothesis 4d: Occurrence of Site disputes is negatively associated with the overall
performance of public sector construction projects.
The safety construct evaluates the incidences of fatalities and accidents at the
construction site. Some of the factors that contribute to poor safety performance in the
construction industry in developing countries are a largely unskilled labour force,
harsh operative environments due to lack of necessary equipment and strenuous
physical tasks necessary within the construction sector. Yakubu and Bakri (2013)
reported that a construction process is risky with frequent occurrences of injuries and
illness due to poor safety. They attribute the increase in the rate of accidents to
increased allocation to the construction sector owing to the importance of the sector in
national development. Accidents in the construction sites may lead to stoppage of
work thereby lowering staff morale and eventually lead to a negative impact on the
productivity. The contemporary findings (Ortega, 2000; Haslam et al., 2005; Billy et
al., 2006) suggest that safety should be accorded high priority. Further, safety is
considered a priority for contractors because their employees are exposed to great risk
during the construction phase of the project (Saqib et al., 2008). It is, therefore,
important to consider safety of the project while assessing performance of public
sector construction projects.
Hypothesis 4e: Safety performance is positively associated with the overall
performance of public sector construction projects.
The environmental impact construct evaluates the extent to which the project
construction affects the environment surrounding it and the future sustainability of the
constructed facility. According to Gangolells et al. (2009), a project organization
should incorporate environmental analysis in the entire project construction process.

112
The emphasis is on the impact of the project on the surrounding physical and
ecological environment (Ding, 2005; Shen et al., 2005). Alba et al. (2013) report that
though considerable effort has been made towards reducing the negative
environmental impact of construction processes, construction sites are still a major
source of pollution. These problems undermine the realisation of the benefits of
public sector construction projects.
Hypothesis 4f: Environmental impact of a project is negatively associated with the
overall performance of public sector construction projects.
6.3 Process followed in Research Methodology (Phase II)
The process followed in carrying out research in phase II is depicted in Figure 6.2.
Administer the questionnaire to different set of respondents (Survey Phase II)
Assess Measurement models Assess Structural Model (Hypotheses testing) - using SEM: Confirmatory Factor Analysis & Path Analysis
Figure 6.2: Sequence of research followed in Study Phase II
6.4 Design of Survey Instrument
Based on the findings of exploratory study (phase I), the researcher conceptualized
construction project performance evaluation framework as encompassing six different
Scale Purification and Model Testing
PHASE II:
CONFIRMATORY
PHASE
Data Collection II
Outcome of Study in Phase I-27-performance measurement variables for KPIs scale
-27-project success variables for CSFs scale
Expected Outcome: -Measurement Model for KPIs scale
-Measurement model for CSFs scale
-Structural Equation model (SEM) exhibiting the relationship between
CSFs, project success, overall project performance and KPIs.

113
dimensions of KPIs namely time, cost, quality, site disputes, safety and environmental
impact as well as six CSFs, project related, client related, consultant related,
contractor related, supply chain related and external environment related factors.
Each KPI and CSF had a number of items that loaded on it as shown in the
exploratory phase (Phase I).
The Questionnaire had three sections. The first section of the questionnaire contained
questions relating to the demographic information of the respondents and
characteristics of the project. Section B contained questions pertaining to 27
performance measurement variables of the KPIs scale, whereas section C had
questions pertaining to 27 project success variables of the CSFs scale. In the last two
sections (section B and C) a five-point Likert scale was used as a response format for
different variables with the assigned values ranging from 1 = Strongly Disagree to 5 =
strongly Agree. These two sections were intended to secure respondent perceptions
regarding performance measurement variables and project success variables
respectively on the basis of a specific project they had been involved in. The
questionnaire containing revised items was further checked for inconsistencies and
clarity in the way they were framed.
6.5 Study site and identification of target Population
The study site for the confirmatory study (phase II) is the same as discussed in section
4.5 of chapter 4. This site had 922 original respondents out of which 196 respondents
had already been covered in the exploratory study (Phase I). These 196 respondents
were excluded from 922 thereby reducing the target population to 726. This
population contained all the three strata of respondents required for this study. Given
that this population was relatively small, a decision was made to consider all the 726
respondents in the Study. This was, therefore, a census study. The researcher put in
maximum efforts to collect data from all the three strata in the population.
6.6 Data Collection
The purpose of data collection in the study in phase II was to facilitate analysis so as
to confirm the identified performance variables for the KPIs scale and the identified
success variables for the CSFs scale. The 24 research assistants who had been
involved in data collection in phase I of the study were again requested to collect data

114
in the phase II, directly from clients, consultants and contractors. Given that they had
already been trained, the researcher felt that they were familiar with the data
collection instrument and its administration. Based on prior arrangement, the field
investigators conducted face to face interviews with respondents.
This survey was undertaken from the first week of August, 2012 through the end of
October, 2012. At the end of the period lasting 12 weeks, data was summarised, ready
for analysis.

115
CHAPTER 7: RESEARCH FINDINGS AND DISCUSSION (PHASE II-
CONFIRMATORY STUDY)
7.0 Introduction
This chapter discusses the results of confirmatory factor analysis (CFA) and tests of
hypotheses. It presents a brief overview of the responses received and describes the
process of data screening employed. It is followed by a description of projects’
characteristics, status of the CDF projects and respondents’ profile. The chapter also
presents the results of both ANOVA and Chi-Square tests conducted to examine the
associations of project characteristics and respondents’ demographic profiles with the
occurrence of time overrun, cost overrun and quality defects among public sector
construction projects. The next section reports on the CFA of KPIs and CSFs. The last
sub section reports the results of Structural Equation Modelling (SEM) and the tests
of hypotheses.
7.1 Screening of collected data
At the end of eleven weeks, the field investigators were able to submit 227 completed
questionnaires, out of which 16 questionnaires were found either incomplete or
improperly filled. Thus the total number of effective response came out to be 211,
indicating a valid response rate of 22.9%. Once the data was received, it was checked
for missing values, inconsistency and negatively framed responses. The scores on
negatively framed questions were suitably reversed and all the scores were fed into
SPSS software (version 20). Given below is an overview of the demographic profile
of the projects and respondents and the related descriptive statistics. Finally the results
of CFA carried out through AMOS software (version 20.0) are presented. Maximum
Likelihood estimation (MLE) method was employed for carrying out CFA.
7.2 Demographic characteristics of respondents and projects
This section gives an overview of project characteristics and respondents’
demographic profile. It also reports on the status of CDF projects surveyed in terms of
the cost overrun, time overrun and quality defects. Further it tests the relationships
between project types as well as project procurement approaches used and the
occurrence of cost overrun, time overrun and quality defects amongst CDF
construction projects. The objectives of this sub-section are

116
• To examine the extent of differences in the occurrence of cost overrun, time
overrun, and quality defects across different types of construction projects.
• To examine the association between the project procurement approaches
followed in public sector construction projects and the occurrence of cost
overrun, time overrun and quality defects.
• To examine the association between stakeholders’ (client, consultant and
contractor) experience in construction projects and the occurrence of cost
overrun, time overrun and quality defects.
7.2.1 Project characteristics and brief profile of the respondents
Projects are described in terms of the type of projects, procurement approaches
followed in projects and the value of the projects. Further, the respondents are
classified on the basis of years of experience in construction projects and value of
projects they have worked on in the last 3 years. Table 7.1 summarises the project
characteristics and respondents’ demographic profile.
Table 7.1 Project characteristics and brief profile of the respondents Responses
Variable Educational
facilities
Health
Care
Industrial
Estate
Agricultural
Market
Total
Respondent group
Clients 46 (44.2%) 31(29.8%) 12 (11.5%) 15 (14.4%) 104
Consultants 16 (32.7%) 11(22.4%) 8 (16.3%) 14 (28.6%) 49
Contractors 16 (27.6%) 22(37.9%) 7 (12.1%) 13 (22.4%) 58
Respondents’ Experience in Construction projects
Below 3 years 9 (24.3%) 15(40.8%) 4 (10.8%) 9 (24.3%) 37
3-6 years 39 (38.2%) 33 (324%) 15 (14.7%) 15 (14.7%) 102
7and above 30 (41.7%) 16(22.2%) 8 (11.1%) 18 (25.0%) 72
Procurement approaches followed in respondents’ project
Design/Bid/Build 0 (0.0%) 1(100.0%) 0 (0.0%) 0 (0.0%) 1
Design/Build 3 (15.0%) 9 (45.0%) 1 (5.0%) 7 (35.0%) 20
Competitive bid 33 (42.9%) 15(19.5%) 10 (13.0%) 19 (24.7%) 77
Negotiated gen.
Contract 42 (37.2%) 39(34.5%) 16 (14.2%) 16 (14.2%) 113
Value of CDF projects worked on in the last 3 years in Ksh.
> 15,000,000 24 (44.4%) 14(25.9%) 4 (7.4%) 12 (22.2%) 54
10,000,000-
15,000,000 19 (37.3%) 13(25.5%) 9 (17.6%) 10 (19.6%) 51
< 10,000,000 35 (33.0%) 37(34.9%) 14 (13.2%) 20 (18.9%) 106
TOTAL 78 64 27 42 211

117
A preliminary analysis of the data revealed that the sample was fairly balanced in
terms of the type of the projects and provided a fair representation of cross sectoral
distribution of CDF construction projects. A total of 78 projects (37.0%) in the sample
were Educational whereas 64 (30.3%) projects were related to Health Care, 27
(12.8%) related to Agricultural Markets, and 42 (19.9%) fell under Industrial Estates.
However, majority of these projects were small with an average value of less than
ksh. 10,000,000.
The most common project procurement method among CDF construction projects
was negotiated general contracts (53.55%), followed by competitive bid (36.49%).
This was again followed by design/build 20, (9.48%). Only one project (0.5%) was
procured through design/bid/build method.
With regard to the respondents, 104 (49.3%) were clients whereas 49 (23.2%) were
consultants and 58 (27.5%) were contractors. On average, respondents had experience
of 3-6 years in construction industry and majority had been involved in the
construction of CDF projects for over 3 years. This information indicates that apart
from having adequate experience in terms of years the respondents have been
involved in construction projects, respondents had handled projects of different sizes.
7.2.2 Status of CDF construction projects
This section describes the incidences of occurrence of cost overrun, time overrun and
quality defects amongst CDF construction projects surveyed in this study. The status
of different types of projects is presented in Table 7.2.
The findings in the table indicate that 184 amongst 211 projects surveyed (87.2%) in
this study experienced time overrun ranging from less than six months to more than
12 months. However, much of the delay was for less than 6 months (62.1%). The
table shows the magnitude of time overrun across all four kinds of projects and
reveals that the proportion of time overrun was maximum amongst Agricultural
Markets (approx. 90.5%) and minimum amongst Educational projects (84.6%).

118
Table 7.2: Incidences of time overrun, cost overrun and quality defects Project classification
Incidences Variable Educational Health
Care
Industrial
Estate
Agricultural
Market
Total
Time
overrun on
respond-
ents’
project
None 13 (48.1%) 7 (25.9%) 3 (11.1%) 4 (14.8%) 27
< 6 months 51 (38.9%) 39 (29.8%) 15 (11.5%) 26 (19.8%) 131
6-12 months
> 12 months
10 (25.6%)
4 (28.6%)
12 (30.8%)
6 (42.9%)
8 (20.5%)
1 (7.1%)
9 (23.1%)
3 (21.4%)
39
14
Cost overrun
on
respondents’
project in
Ksh
None 44 (38.6%) 30 (26.3%) 14 (12.3%) 26 (22.8%) 114
< .100,000 19 (30.2%) 26 (41.3%) 8 (12.7%) 10 (15.9%) 63
100,001-
300,000 13 (48.1%) 4 (14.8%) 5 (18.5%) 5 (18.5%)
27
> 300,000 2 (28.6%) 4 (57.1%) 0 (0.0%) 1 (14.3%) 7
Percentage
of Quality
defects on
project
None 53 (39.8%) 38 (28.6%) 20 (15.0%) 22 (16.6%) 133
Less than 20% 21 (30.9%) 23 (33.8%) 6 (8.8%) 18 (26.5%) 68
20% and more 4 (40.0%) 3 (30.0%) 1 (10.0%) 2 (20.0%) 10
TOTAL 78 64 27 42 211
In this table, 97 out of 211 projects surveyed (46%) incurred cost overrun during their
implementation in the range of less than Ksh. 100,000 to Ksh.300, 000. While
considering cost over-run across the types of projects, the table further indicates that
the same was maximum (53.1%) in case of Health Care Facilities and minimum
(38.1%) in case of Agricultural Markets. In addition, 43.6% of Educational projects
and 48.1% of Industrial Estates experienced cost over-run.
In the current study, 133 projects (63.0%) were found to have been free from apparent
defects with only 10 projects (4.7%) recording quality defects of 20% or more. Of
those projects that suffered from quality defects, majority were Health Care projects
(26) followed by Educational (25), Agricultural Markets (20) and finally Industrial
Estates (7).

119
7.2.3 Relationships amongst project characteristics, respondents’ profile and
incidences of time overrun, cost overrun and quality defects
This section reports on the comparisons of groups of responses for differences in their
means regarding project characteristics, respondents’ profile and incidences of time
overrun, cost overrun and quality defects.
7.2.3.1 The extent of differences in the occurrence of time overrun, cost overrun
and quality defects across different types of construction projects
In order to examine any significant differences in respect of time overrun, cost
overrun and quality defects across different types of projects namely Educational,
Healthcare facilities, Industrial Estates and Agricultural Markets, a one way Analysis
of Variance (ANOVA) was carried out. The results are presented in the following
tables.
Table 7.3: Results of ANOVA test between the types of projects and time
overrun, cost overrun and quality defects
Project status Source of variation
Sum of Squares
Df Mean Square
F Sig.
Time overrun Between Groups 1.949 3 .650 1.196 .312
Within Groups 112.468 207 .543
Total 114.417 210
Cost overrun Between Groups .748 3 .249 .361 .781
Within Groups 142.996 207 .691
Total 143.744 210
Quality defects Between Groups .176 3 .059 .191 .903
Within Groups 63.493 207 .307
Total 63.668 210
With regard to the differences in time overrun across different types of projects, the
ANOVA results indicate that the significance level is 0.312 (p=.312). Since this value
is above 0.05, there is no statistically significant difference in the occurrence of time
overrun among different types of CDF construction projects. This implies that the
occurrence of time overrun was similar amongst all types of construction projects.

120
ANOVA results on the occurrence of cost overrun across different types of
construction projects revealed a significance level of 0.781 (p=.781) which indicates
that there is no statistically significant difference in the occurrence of cost overrun
across four types of projects surveyed.
Further, quality defects were examined to find out whether it differed significantly
across different types of construction projects. It was found that the significance level
is 0.903 (p = .903), which again indicates that there is no statistically significant
difference in the occurrence of quality defects across the four types of projects
constructed.
7.2.3.2 The association between the project procurement approaches used and the
occurrence of time overrun, cost overrun and quality defects amongst public sector
construction projects
To identify the association between project procurement approaches used and the chi-
square test of independence (also known as Pearson’s chi-square test or chi-square
test of association) was employed. The results are presented in the Table 7.4.
Table 7.4: Results of the Chi-square test between project procurement
approaches and time overrun, cost overrun and quality defects
Project status Test statistic Value df Asymp. Sig. (2-sided)
Time overrun Pearson Chi-Square 7.545 9 .581
Likelihood Ratio 8.961 9 .441
Linear-by-Linear Association .029 1 .864
N of Valid Cases 211
Cost overrun Pearson Chi-Square 20.161 9 .017
Likelihood Ratio 23.130 9 .006
Linear-by-Linear Association .449 1 .503
N of Valid Cases 211
Quality defects Pearson Chi-Square 8.744 6 .188
Likelihood Ratio 9.201 6 .163
Linear-by-Linear Association .008 1 .927
N of Valid Cases 211

121
The association between procurement approach and time overrun show that the
probability (p) of the chi-square test statistic (chi-square value of 7.545) at 9 degrees
of freedom turned out to be 0.581. This being greater than the alpha level of
significance of 0.05, implies that the occurrence of time overrun on CDF construction
projects has no statistically significant association with the procurement method used.
This implies that the occurrence of time overrun on CDF construction projects does
not depend on the kind of method employed in procuring the project.
Similarly, a Chi square test to examine the association between procurement approach
and the occurrence of cost overrun revealed that the probability (p) of the chi square
statistic (chi-square=20.161) at 9 degrees of freedom came out to be 0.017 (p=.0.017).
This being less than the alpha level significance of 0.05 indicates that the occurrence
of cost overrun on CDF construction projects has a statistically significant association
with the procurement method used. Therefore, cost overrun would depend on the
project procurement method used.
The Chi-square test of the relationship between project procurement approaches and
occurrence of quality defects show that the probability (p) of the chi square statistic
(chi-square=8.744) at 6 degrees of freedom is 0.188. This being more than the alpha
level significance of 0.05 indicates that the occurrence of quality defects on CDF
construction projects has no statistically significant association with the procurement
method used. Therefore, the occurrence of quality defects does not depend on the
project procurement method used in securing project contractors and consultants.
Given that the result of Chi-square test between procurements approaches and cost
overrun was significant, a post hoc procedure was conducted to determine which
frequencies differed. The results are represented in Table 7.5.

122
Table 7.5: Post hoc Chi Square tests between procurement approach used and
occurrence of cost overrun
Cost overrun
PROCUREMENT APPROACHES
None Less than Ksh.100,000
Ksh.100,001-Ksh.300,000
Ksh.300,001-Ksh. 500,000
Total
Design/Bid/Build Count 0 1 0 0 1 Residual -.5 .7 -.1 .0 Std. Residual -.7 1.3 -.4 -.2
Design/Build Count 12 8 0 0 20 Residual 1.2 2.0 -2.6 -.7 Std. Residual .4 .8 -1.6 -.8
Competitive bid Count 38 29 5 5 77 Residual -3.6 6.0 -4.9 2.4 Std. Residual -.6 1.3 -1.5 1.5
Negotiated general contract
Count 64 25 22 2 113 Residual 2.9 -8.7 7.5 -1.7 Std. Residual .4 -1.5 2.0 -.9
TOTAL 114 63 27 7 211
Table 7.5 shows that for the Design/Bid/Build approach, three cells were under-
represented while one cell was over-represented. Similarly two cells, were under-
represented and two others over- represented for the remaining approaches namely
Design/Build, Competitive bid and Negotiated general contracts. However, all the
cells were significant except the one representing Negotiated general contract and
Ksh. 100,000-Ksh. 300,000. This is because the value of standardised residuals was
less than 1.96, the critical z-value corresponding to 0.05, alpha level of significance.
Therefore, the occurrence of cost overrun depended on the project procurement
method.
7.2.3.3 The association between respondents’ experience in construction projects
and occurrence of time overrun, cost overrun and quality defects
To examine the association between respondents’ experience and the occurrence of
time overrun, cost overrun and quality defects, a chi square test of association was
used. The results are presented in the Table 7.6.

123
Table 7.6: Results of the Chi-square test between respondents’ experience and time overrun, cost overrun and quality defects
Project status Test statistic Value Df Asymp. Sig. (2-sided)
Time overrun Pearson Chi-Square 6.781 6 .342
Likelihood Ratio 9.539 6 .145
Linear-by-Linear
Association .002 1 .961
N of Valid Cases 211
Cost overrun Pearson Chi-Square 7.690 6 .262
Likelihood Ratio 9.323 6 .156
Linear-by-Linear
Association .063 1 .802
N of Valid Cases 211
Quality defects Pearson Chi-Square 2.412 4 .661
Likelihood Ratio 2.364 4 .669
Linear-by-Linear
Association .888 1 .346
N of Valid Cases 211
For time overrun, the probability (p) of the chi-square test statistic (chi-square value
of 6.781) at 6 degrees of freedom represented was 0.342. This indicates that there is
no statistically significant association between respondents’ experience and time
overrun. Therefore, the number of years that a stakeholder has been involved in the
project construction sector does not have influence on the extent of time overrun
amongst construction projects.
A test of whether cost overrun is associated with the respondents’ experience revealed
that the probability (p) of the chi-square test statistic (chi-square value of 7.690) at 6
degrees of freedom was 0.262. This implies that there is no association between the
extent of cost overrun and respondents’ experience among public sector construction
projects.
Further, the probability (p) of the chi-square test statistic (chi-square value of 2.412)
at 4 degrees of freedom was 0.661. This again being greater than alpha level of
significance of 0.05, indicates that there is no statistically significant association
between respondents’ experience and occurrence of quality defects.

124
7.3 Confirmatory factor analysis (CFA) of performance measurement variables
for KPIs Scale
The study employed a two step CFA approach to confirm and validate the
measurement scale (Wang et al., 2007) with the help of AMOS software (version
20.0). First the performance evaluation model was assessed using the first order CFA.
In the next stage, construction project performance measurement was operationalised
as a second order model (structural model); wherein it is demonstrated that the six
constructs are governed by a higher order construct, namely overall project
performance. Subsequently, the relationship between the higher order construct and
the first order constructs is investigated. The purpose of this analysis is to confirm the
KPIs identified and examine the relationship between the confirmed KPIs and overall
project performance.
7.3.1 Validation of performance measurement variables
In phase II of the study, CFA was used to assess how well the observed variables
reflect unobserved or latent constructs in the hypothesized structure. The results of the
study in Phase I have provided a strong priori basis for the need of carrying out CFA
in evaluating the performance of CDF construction projects. The measurement
properties of the performance evaluation framework were first tested using reliability
and item-to-total correlation analysis followed by CFA (Wang et al., 2007). The
lowest item-to-total correlation was 0.334 while the highest was 0.951. Though the
lowest item-total correlation is slightly below the 0.35 proposed by Saxe and Weitz
(1982 cited in Coursaris et al., 2008), the rest of the total correlations were relatively
high suggesting a reasonable fit of the latent factors to the data collected. The
reliability test and item-to-total correlation analysis results provided in table 7.7
suggest a reasonable fit of the latent factors to the data collected. Cronbach α value
for five of the six factors of performance evaluation are greater than 0.85 with only
one factor, safety, falling below the recommended 0.7, which was, however, just
below 0.6 considered acceptable in exploratory studies (Hair et al., 2006). This
construct was, thus, retained because of its perceived importance in construction
projects. The details are shown in Table 7.7.

125
Table 7.7: Summary of measurement results of Key Performance Indicators
(KPIs) Factors Number
of itemsMean S.D α Range of item-to-
total correlationTime performance (TPV) 7 3.188 1.228 0.882 0.461-0.791
Cost performance (CPV) 6 2.970 1.197 0.855 0.369-0.835
Quality performance (QPV) 3 3.573 1.119 0.959 0.899-0.951
Site Disputes (DPV) 4 2.831 1.255 0.906 0.703-0.906
Safety performance (SPV) 3 3.540 1.128 0.574 0.334-0.462
Environmental Impact (EPV) 4 2.942 1.173 0.869 0.663-0.680
A series of CFA was conducted between each pair of the six factors to assess the
discriminant validity of the factors using the chi-square difference tests (Zhu, Sarkis
& Lai, 2008) as shown in Table 7.8. This process requires that the measurement items
of each pair of factors are forced into a single underlying factor. Discriminant validity
is said to be present if there is a significant drop in the chi-square value of two-factor
model from the same one-factor model. The drop in chi-square values in ten pairs is
very high compared to the same in the remaining five pairs. However, the differences
in these five pairs are also significant and hence discriminant validity is evident. All
the above five pairs are linked to safety construct. Table 7.8 further reveals that this
construct seems to be closer to site disputes. However, the literature suggests that it
should be treated separately (Patrick, 2011).
Table 7.8: Discriminant validity checks: Chi-square differences Factors 1 2 3 4 5
1. Time performance (TPV)
2. Cost performance (CPV) 694.5
3. Quality performance (QPV) 731.3 634.8
4. Site Disputes (DPV) 612.6 596.6 719.1
5. Environmental Impact (EPV) 406.8 418.6 741.1 361.6
6. Safety performance (SPV) 59.2 58.5 60.3 34.0 56.5
7.3.2 First order measurement model of KPIs
In the first order model, the constructs including cost, time, quality, safety, site
disputes and environmental impact are all shown to be correlated forming a project
performance measurement scale. This measurement scale was assessed through CFA

126
utilizing the MLE method. The initial 27 observable items of project performance
were incorporated into the model for testing purposes. These items were evaluated on
the basis of various criteria, including items standardised regression weights, squared
multiple correlations, standardised residual covariances and the modification indices
as well as the reliability of the items and that of the construct as a whole.
Additionally, the researcher also considered the logic and consistency of the sampled
data with the theoretical underpinnings in construction project management.
The initial model proposed for the measurement of construction project performance
indicated poor model fit on all recommended goodness of fit (GOF) indices as
provided in Table 7.9. This necessitated item purification through CFA, thereby
eliminating items based on theoretical reasons and empirical examination (Wang et
al., 2007). To ensure that the data consistently conform to theory, items were deleted
one at a time. The deletion of items are based on whether they differ from existing
theory of project performance evaluation literature, whether there exists strong
conceptual linkages as evidenced by modification indices and standardised multiple
correlations and finally whether they are conflicting in their interpretation. For
instance,
• Variables CPV5: Adverse effect on quality of groundwater level, CPV6: No
financial claims at completion and SPV3: Near misses occurred were
eliminated on the basis of their low regression weights and their squared
multiple correlations values were also the lowest among the 27 variables. The
standardised regression weights (and squared multiple correlations) for these
variables were; CPV5- 0.287 (0.082), CPV6-0.383 (0.147) and SPV3-0.412
(0.170)
• Further, standardized residual covariances were used to eliminate three more
variables TPV5: No effect of weather and climatic conditions, TPV7: At
handover there were no apparent defects and CPV3: No increase in materials
cost. In eliminating these variables, the researcher also considered its
regression weights, squared multiple correlations and estimated error
variances.

127
• Modification indices (M.I) were also instrumental in the pruning EPV4:
Project has led to depletion natural resources, DPV4: Dispute resolution
meetings, TPV4: No delays in securing funds and TPV6: No design changes.
The high modification index between e19 and e21 indicated that there was a
strong relationship between variables EPV2 and EPV4. When these two
variables were compared, it was found that the removal of EPV4 results in a
higher improvement on the model fit hence it was deleted. Similarly, e9 was
found to have high M.I with quality performance, cost performance, e12 and
e10. Further e17 had high M.I with cost performance and so was e10 with cost
performance. This implies that variables TPV6, DPV4 and TPV4 were cross
loading to other constructs. Based on the suggestion by Kohli et al. (1993) to
avoid cross loading, items TPV6, DPV4 and TPV4 were deleted.
At the end of item purification, a total of 10 performance measurement variables had
been removed from the construct, leaving 17 items for analysis of performance of
public sector construction projects. The final first order performance measurement
model is represented in Figure 7.1.
The final first order measurement model reveals that the constructs of cost, time,
quality, site disputes, safety and environmental impact are correlated. Some constructs
are found to be positively correlated while others are negatively correlated among
themselves. The measurement items used to measure each construct are shown using
the arrows from each of the constructs. Further, the loadings are shown on the arrows
emanating from each construct. For instance, three performance items, CPV1, CPV2
and CPV4 measure the cost performance construct and their standardised regression
weights were 1.00, 0.70 and 0.93 respectively.

128
Χ2=223.504, DF=105, Χ2/df=2.13, RMSEA=0.073, GFI=0.894, NFI Value=0.920, IFI=0.956, CFI=0.955, PNFI=0.710 and PCFI=0.738.
Figure 7.1: First order KPIs measurement model (Final)
The regression weights show the change that will occur in the individual items as a
result of a unit change in the construct on which they load in terms of standard
deviations. For instance, when cost performance changes by 1 standard deviation,
CPV2 changes by 0.70 standard deviations. Table 7.9 displays the recommended
levels of the GOF, the relevant values for initial first order model and those of the
final first order model.

129
Table 7.9: Results of Goodness of fit indices (GOF) of the KPIs scale Evaluation
index
Goodness of Fit
(GOF) measure
Recommended Level of
GOF measure
Initial first
order
measurement
model
Final first
order
measurement
model
Absolute fit
index
Χ2/ Degrees of
freedom
<3 4.80 2.13
P Value <0.05 0.000 0.000
RMR Value <0.05 0.170 0.091
RMSEA Value <0.10 0.135 0.073
GFI Value 0 (no fit)-1 (perfect fit) 0.707 0.894
Relative fit
index
NFI Value 0 (no fit)-1 (perfect fit) 0.699 0.920
IFI Value 0 (no fit)-1 (perfect fit) 0.746 0.956
CFI Value 0 (no fit)-1 (perfect fit) 0.743 0.955
Parsimonious
fit index
PNFI Value >0.5 0.617 0.710
PCFI Value >0.5 0.657 0.738
Hoelter CN Value >=200 53 134
Cross
validation
Akaike AIC The least 1625.498 319.504
ECVI The least 7.740 1.521
The above results show that the re-specified first order model fits better than the
initial first order model in terms of χ2/degrees of freedom, RMSEA value, and GFI.
The three indices indicate an acceptable fit to the data and hence the first order model
is supported for the performance measurement construct. Furthermore, all other
essential indices namely CFI, NFI and IFI had values greater than 0.90, providing
evidence of acceptable fit between the measurement model and data (Jin, Doloi &
Gao, 2007). It further reveals that the performance of CDF construction projects in
Western province in Kenya consists of six constructs and may be measured by 17
items using a five point Likert scale. A snapshot of the items is provided in Table 7.10

130
Table 7.10: Dimensions of performance evaluation among CDF construction projects
Key Performance Indicators
Performance Variables
Time performance TPV1: Timely delivery of resources
TPV2: Harmonious relationship exists on site
TPV4: No delays in securing funds
Cost Performance CPV1: Equipments available at pre budgeted rates
CPV2: Stable labour costs
CPV3: No increase in materials cost
Site Disputes DPV1: No serious protests by the community due to the
nature of the project
DPV2: Disputes due to frequent changes in designs
DPV3: No incidences of trade union agitation
Environmental Impact EPV1: Project has led to air pollution
EPV2: Project has given rise to increase in solid waste
EPV3: Utilised environmentally friendly technology
Quality Performance QPV1: Right material was used for the construction work
QPV2: A sound QMS was adhered to
QPV3: Workers were trained on positive attitudes
Safety Performance SPV1: Accidents were reported.
SPV2: Fatalities did occur.
Time performance is measured through three items: timely delivery of resources,
harmonious relationships on site and no delays in securing project funds. Cost
performance is measured through three statements: availability of equipment at pre
budgeted rates, labour costs and materials cost. The site disputes factor is considered
on the basis of three site disputes related issues. This factor attempts to capture the
issues raised by the community due to the nature of the project, conflict of interest
between the management and union and also the conflicts occurring among project
stakeholders. Environmental impact captures the issues relating to the physical and
ecological environment. The fifth dimension of project performance reflects
performance on quality. Safety performance was measured using the occurrence of
accidents and fatalities on the project. The summary of the measurement outputs of
the final first order model are presented in table 7.11.

131
Table 7.11: Loadings of First-order CFA of KPIs’ performance variables Variable R2 Standard first order loadings a
Cost Performance
Time Performance
Site disputes Performance
Environmental imp-act perfo-rmance
Quality Performance
Safety perform
CPV1 0.994 .997*** CPV2 0.484 .696 (13.27) CPV4 0.860 .927 (26.91) Cost Performance
0.435b -0.282b -0.063b 0.671b -0.006b
TPV1 0.678 .824*** TPV2 0.645 .803(12.93) TPV3 0.812 .901(14.03) Time Performance
-0.041b -0.130b 0.228b 0.047b
DPV1 0.989 .994*** DPV2 0.765 .875(20.27) DPV3 0.590 .768(15.30) Site Dis. Perf.
0.519b -0.096b 0.102b
EPV1 0.952 .976*** EPV2 0.440 .663(10.54) EPV3 0.651 .807(13.39) Environ impact perf.
0.159b 0.146b
QPV1 0.984 .992*** QPV2 0.835 .914 (29.1) QPV3 0.851 .923(30.52) Quality Perform
0.008b
SPV1 0.302 .549*** SPV2 0.493 .702*** Safety perf. Notes: a Standard first-order loading is the standardized regression weight of the individual variables’ loading on to one of the component factors. Figures in parentheses are critical ratios from the unstandardised solutions. b Standard first-order loading for component factors (i.e. time performance, cost performance, quality performance, site disputes performance, safety performance and environmental impact performance) is the covariance between any two of these component factors; *** The critical ratio is not available, because the regression weight of the first variable of each component factor is fixed at 1; Χ2=223.504, Df=105, Χ2/df=2.12, RMSEA=0.073, GFI=0.894, NFI Value=0.920, IFI=0.956, CFI=0.955, PNFI=0.710 and PCFI=0.738

132
In table 7.11, the standardised regression weights for various variables range from
0.549 to 0.997 while the squared multiple correlations (R2) are 0.302 to 0.994. Both
standardised regression weights and squared multiple correlations exceed the
threshold values of 0.5 and 0.25 respectively (Hair et al., 2006). Squared multiple
correlations show the proportion of variance that can be attributed to the construct.
For instance, the squared multiple correlation of CPV1 is 0.994 which implies that up
to 99.4% of the variance in CPV1 can be explained by the cost performance construct
Similarly, the critical ratios (t values in brackets) of the variables are all above 1.96
implying that all standardised regressions weights of the measurement items are
statistically significant at 5% significance level. Covariances show the level and
nature of shared variation among different constructs. For instance, the covariance of
0.435 relating cost performance with time performance shows that an increase in cost
performance is accompanied by an increase in time performance and vice versa.
7.3.3 Second order measurement model of KPIs
The structural equation modelling was conducted at the second stage of the model to
test the relationships between the first order constructs and the second order construct
namely overall project performance. The test of the second order model illustrated in
Figure 7.2 implies that project performance, a higher order latent factor governs the
correlations amongst first order constructs: cost, time, quality, site disputes, safety and
environmental impact. The second order model yielded the following results of test
statistics: χ2 statistics = 255.737, Degrees of freedom = 114, χ2/degrees of freedom =
2.243, RMSEA Value = 0.077, GFI Value = 0.880, NFI Value = 0.908, IFI Value =
0.947, CFI Value = 0.947, PNFI Value = 0.761 and PCFI = 0.794.
These estimated model fit indexes were adequate. The second order loadings on
overall project performance are 0.967 for cost, -0.10 for safety, and 0.317 for time, -
0.488 for quality, -0.041 for environmental impact and -0.176 for site disputes. This
indicates that when overall project performance increases by 1 standard deviation
(SD), cost performance and time performance increase by 0.967 and 0.317 SDs
respectively, whereas safety performance, quality performance, environmental impact
performance and site dispute performance decreases by 0.10, 0.488, 0.041 and 0.176
SDs respectively. These findings are consistent with those of Nidumolu (1996) and

133
Nurul and Ng (2011) who argued that tightly controlled processes adhering to strict
time and cost may sometimes compromise on quality. Furthermore, the actual
beneficiaries (i.e. the surrounding community) of CDF construction projects do not
contribute anything towards construction costs of the project.
Χ2=255.737, DF=114, Χ2/df=2.243, RMSEA=0.077, GFI=0.880, NFI Value=0.908, IFI=0.947, CFI=0.947 PNFI=0.761 and PCFI=0.794
Figure 7.2: Second order KPIs measurement model (Final)
The ratio of Chi-square to the degrees of freedom (DF) differs slightly from the first
order model due to the additional number of DF brought about by the incorporation of
the second order model. The target coefficient compares the Chi-square of the first
order model to the Chi-square of the second order model (Wang et al., 2007). This
coefficient was 0.95 indicating that the second order construct explains 95% of the
variation in the first-order constructs, which demonstrates that overall project
performance is a satisfactory second order construct.

134
These results show that cost, time and quality are strongly correlated with overall
project performance, whereas site disputes, safety and environmental impact do not
significantly correlate with the same. However, due to the adequacy of the model fit,
overall project performance can be conceptualised as a second order construct
consisting of all six first order constructs.
7.3.4 Evaluation of constructs in KPIs measurement model
To validate the performance measurement construct, the final model was
systematically evaluated for dimensionality, reliability and validity.
7.3.4.1 Unidimensionality and face validity: At the beginning of the study, literature
was extensively reviewed in order to identify the performance related variables. These
variables were then discussed with experts in the field of construction management
who also provided valuable insights to the performance measurement among public
sector construction projects. This was followed by a questionnaire design whose
responses were analysed using exploratory factor analysis. The development of the
first order performance constructs was based on the findings of an exploratory study.
Further related literature was reviewed and views of experts were also sought when
developing the constructs. All the items generated were checked for their
appropriateness. Subsequently, through CFA, items were purified based on their
empirical findings and theoretical underpinnings so as to maximise the face and
content validity. The items retained through purification loaded on single constructs
supporting the existence of unidimensionality.
7.3.4.2 Construct Reliability: Reliability measures the internal consistency of the
observed variables. Table 7.12 reveals that the values for construct reliability range
from 0.57 to 0.96. According to Hair et al. (2006) and Lim and Mohamed (2000), the
rule of thumb for reliability estimate is 0.7 or higher. It further suggests a reliability
estimate of 0.6 as acceptable. In this study, five out of the six constructs had reliability
estimates above 0.7 while only one construct had a reliability estimate of just below
0.6. This demonstrates that the five constructs are highly reliable with the sixth one
being reasonably reliable. The table further reveals that the items constituting quality
construct exhibit the highest reliability followed by the constructs of cost and site
disputes.

135
Factor loadings are similar to standardised regression weights whereas item
reliabilities are the same as squared multiple correlations, R2. The delta values, also
known as the standardised error variances, describe the proportion of the indicator
variable that cannot be attributed to the specific construct. The eigenvalue of the
constructs shown in Table 7.12 indicate the variance extracted by each construct in
absolute terms. These values are then used to compute average variance extracted
(AVE) by the constructs, which demonstrates the average variance that a construct is
able to extract from each measurement item that loads on it. In other words, this
indicates the explanatory power of the constructs.
Table 7.12: Reliability test of performance measures among CDF construction
projects Variable Cost Time Site
Disputes.
Environmental impact.
Quality Safety Item reliabilities
Eigen Value
Delta
CPV1 .997 0.994 0.006 CPV2 .696 0.484 0.516 CPV4 .927 0.860 2.338 0.140 TPV1 .824 0.678 0.322 TPV2 .803 0.645 0.355 TPV3 .901 0.812 2.135 0.188 DPV1 .994 0.989 0.011 DPV2 .875 0.765 0.235 DPV3 .768 0.590 2.344 0.410 EPV1 .976 0.952 0.048 EPV2 .663 0.440 0.560 EPV3 .807 0.651 2.043 0.349 QPV1 .992 0.984 0.016 QPV2 .914 0.835 0.165 QPV3 .923 0.851 2.670 0.149 SPV1 .549 0.302 0.698 SPV2 .702 0.493 0.795 0.507 Average Variance Extracted
77.9% 71.2% 78.1% 68.1% 89.0% 40.0%
Construct Reliability
0.91 0.88 0.91 0.86 0.96 0.57
Factor Loadings
Squared factor loadings (communalities)
2.338/3
Delta (standardised error variance) =1-item reliability e.g 1-.994= .006.
(.997+.696+.927)2/[(.997+.696+.927)2+(.006+.516+.140)]=0.91

136
Table 7.12 indicates that quality construct possesses the highest explanatory power as
evidenced by AVE (89%), followed by site disputes (78%), cost (78%), time (71%),
environmental impact (68%) and safety (40%).
An AVE of 0.89 in quality construct indicates that up to 89% of the variation in the
measurement items relating to quality can be explained by the quality construct.
7.3.4.3 Construct Validity: This seeks to determine the extent to which the measures
capture the essence of the construct being measured in the study. It addresses two
types of validity:
(i) Convergent validity: This validity requires that the indicator variables of a
given construct should share a high proportion of variance in common. The six
constructs in the KPIs scale mentioned above have AVE ranging from 0.40 to
0.89. This shows that the variables of every construct share high proportion of
variance among them except in one construct, safety whose AVE is, however,
just below 0.5 (Hair et al., 2006; Ng, Wong & Wong, 2010). Therefore,
convergent validity may be considered reasonably good based on the AVE as
shown in the Table 7.12.
(ii) Discriminant validity: This is a measure of how a construct is distinct from
other constructs in the same model.
Table 7.13: Discriminant Validity of KPIs Construct Cost Time Site
Disputes Environmental impact
Quality Safety
Cost 0.883 Time 0.306 0.843 Site Disputes -0.170 -0.056 0.883 Environmental impact -0.040 -0.013 0.007 0.823 Quality -0.472 -0.155 0.086 0.020 0.943 Safety -0.009 -0.003 0.002 0.000 0.005 0.632 Av. Variance Extracted 0.78 0.71 0.78 0.68 0.89 .40 Diagonal elements are the square root of average variance extracted (AVE) and the other matrix
entries represent correlations between constructs.
Items associated with a construct correlate more with each other than with the items
of other constructs in the model. The square root of AVE of each construct is
compared to the correlation between each construct and other constructs. For
discriminant validity to exist, the values representing the square root of AVE (the

137
diagonals in Table 7.13) for all the constructs should be greater than the correlations
between the constructs (off-diagonals).
All the values of AVE estimates in Table 7.13 are larger than the corresponding
correlations between the constructs. This implies that the indicators have more in
common with the construct they are associated with than they do with other
constructs. Therefore, the six construct CFA model demonstrates discriminant
validity.
(iii) Nomological validity: Nomological validity seeks to determine whether there is
evidence that the structural relationships among the constructs is consistent with
other studies that have been measured with validated instruments and tested
against a variety of other settings, times and methods. Its main focus is on the
correlations among the constructs with a view to establishing whether the
correlations are consistent with the existing theories and whether they are
significant. The estimates for correlations among the constructs should be
consistent with construct formulation and significant. Based on KPI theory, the
constructs can be either positively or negatively related to demonstrate
nomological validity. However, not all the covariances among the six constructs
were found to be significant.
7.4 Confirmatory Factor Analysis (CFA) of project success variables for CSFs
Scale
Based on the responses on all the 27 items identified as observable project success
variables for public sector construction projects were incorporated into the
measurement model and tested with help of AMOS software (version 20.0). The
fitness of this measurement model was assessed based on standardised regression
weights, squared multiple correlations, standardised residual covariances and the
modification indices. The reliability of the items and that of the construct as a whole
was also assessed and the model was accordingly re-specified. The re-specified
measurement model was again assessed for its fitness and consequently
operationalised as a second order model based on re-specified model construct.

138
7.4.1 Validation of project success variables
Confirmatory Factor Analysis (CFA) was used to assess how well the observed
variables, i.e. success items reflect unobserved or latent variables in the hypothesized
structure. Before commencing CFA, the measurement properties of the CSFs were
tested using reliability and items to total correlation analysis followed by CFA (Zhu et
al., 2008). The reliability test and item-to-total correlation analysis results provided in
table 7.14 suggest a reasonable fit of the latent factors to the data collected. Cronbach
α values for all six factors of project success are greater than 0.82. Further item
loadings on all the factors are acceptable because they are greater than 0.518. The
details are shown in Table 7.14.
Table 7.14: Summary of measurement results of Critical Success Factors (CSFs) Factors Number
of items Mean S.D α Range of
item-to-total Project related factor (PSV) 7 2.982 1.209 0.931 0.601-0.912
Client related factor (CSV) 5 2.830 1.514 0.954 0.797-0.925
Contractor related factor (RSV) 3 3.313 1.275 0.829 0.603-0.824
Environment related factor (ESV) 6 3.349 1.173 0.876 0.518-0.857
Consultant related factor (CSV) 3 2.817 1.247 0.825 0.542-0.824
Supply chain related factor (LSV) 3 3.367 0.972 0.882 0.723-0.868
To assess discriminant validity, CFA was conducted among the pairs of the six factors
as described in section 7.3.1 (page 123). The results in Table 7.15 show that all the 15
pairs of factors recorded a significant drop in chi-square values, hence discriminant
validity is present.
Table 7.15: Discriminant validity checks: Chi-square differences Factors 1 2 3 4 5
1.Project related factor (PSV)
2.Client related factor (CSV) 1022.4
3.Contractor related factor (RSV) 221.3 262.8
4.Environmental related factor (ESV) 576.2 578.1 262.8
5.Consultant related factor (CSV) 279.0 254.1 248.8 286.5
6.Supply chain related factor (LSV) 393.3 392.3 245.7 396.1 291.3

139
7.4.2 First order measurement model of CSFs
The first order model reveals that project related, client related, consultant related,
contractor related, supply chain related and external environment related are all
correlated factors that constitute a scale for CSFs for construction projects. This
critical success factor scale was assessed through CFA utilizing MLE method. In
refining the model, the researcher also considered the logic and consistency of the
data with theoretical underpinnings in construction project management.
The initial model proposed for the success of construction projects indicated poor
model fit on all recommended goodness of fit indices as provided in Table 7.16. This
necessitated item purification through CFA, thereby eliminating items, one at a time,
based on theoretical reasons and empirical examination as stated above (Wang et al.,
2007). The deletion of items are based on whether they differ from existing theory of
project management literature, whether there exists strong conceptual linkages as
evidenced by modification indices and standardised multiple correlations and finally
whether they were confusing in their interpretation.
At the end of item purification, a total of 10 measuring items were removed from the
construct, leaving 17 items for construction project success construct. The final first
order CSFs model is represented in Figure 7.3.
Figure 7.3 shows that project related, client related, consultant related, contractor
related, supply chain related and environment related factors are correlated. Table
7.16 displays the recommended level of the Goodness of fit indices (GOF), the
relevant values for initial first order model and those of the final first order model.
The results show that the re-specified first order model fits better than the original
first order model in terms of χ2/degrees of freedom, RMSEA value and GFI value.
The three indices indicate an acceptable fit to the data, and hence the first order model
is supported for CSFs influencing the performance of construction projects.

140
Χ2=261.549, DF=107, Χ2/df=2.444, RMSEA=0.083, GFI=0.877, NFI Value=0.913, IFI=0.947, CFI=0.946, PNFI=0.719 and PCFI=0.745 Figure 7.3: First order CSFs measurement Model (Final)
Furthermore, all other essential indices namely CFI, NFI and IFI had values greater
than 0.90, providing evidence of acceptable fit between the measurement model and
data (Jin et al., 2007).
The GOF indices for both first order measurement model and second order
measurement model are summarised in table 7.16.

141
Table 7.16: Results of Goodness of fit indices (GOF) of CSFs scale Evaluation index
Goodness of Fit (GOF) measure
Recommended Level of GOF measure
Initial first order measurement model
Final first order measurement model
Absolute fit
index
Χ2/ Degrees of
freedom
<3 4.465 2.444
P Value <0.05 0.000 0.000
RMR Value <0.05 0.755 0.084
RMSEA Value <0.10 0.128 0.083
GFI Value 0 (no fit)-1 (perfect
fit)
0.697 0.877
Relative fit
index
NFI Value 0 (no fit)-1 (perfect
fit)
0.747 0.913
IFI Value 0 (no fit)-1 (perfect
fit)
0.792 0.947
CFI Value 0 (no fit)-1 (perfect
fit)
0.790 0.946
Parsimonious
fit index
PNFI Value >0.5 0.662 0.719
PCFI Value >0.5 0.700 0.745
Hoelter CN Value >=200 57 116
Cross
validation
Akaike AIC The least 1522.632 353.549
ECVI The least 7.251 1.684
Results of the analysis then suggest that the success of CDF construction projects in
Western province, Kenya depend on six factors and may be measured by 17 items
using a five point Likert scale. The six factors are project related, client related,
consultant related, contractor related, supply chain related and external environment
related factors.
A snapshot of the items is provided in Table 7.17.

142
Table 7.17: Critical success factors among CDF construction projects Critical Success Factors Success Variables ( SV)
Project Related Factor PSV1: Influence of Design Complexity
PSV2: Adherence to the requisite Quality standards
PSV3: Continuous monitoring of actual expenditures
PSV4: Formal dispute resolution structures
Client Related Factor CSV2: Cheap materials were used
CSV4: Client’s emphasis on time rather than quality
CSV5: Design documents approved on time
Environmental Related
Factor
ESV1: Community had no issues against the project
ESV2: Adversely affected by the surrounding weather
ESV3: Effect of the Governance policy
Supply Chain Related
factor
LSV1: Few internal procurement challenges
LV2: Right equipments were available
LSV3: Effect of stringent insurance/warranty rules
Consultant Related
factor
SSV1: No variations were incorporated
SSV2: Adequate designs/specifications and documentation
Contractor Related
factor
RSV1: Site Managers possessed requisite skills
RSV2: Contractor had adequate technical skills.
Project related factor captures the uniqueness of a project in terms of its size, value
and activities as well as the urgency of a project outcome. Client related factor,
consultant related factor and contractor related factor focus on the role of clients,
consultants and contractors respectively on the construction project. Supply chain
related factor is concerned with the availability of project resources and their
acquisition whereas the environmental factor reflects the ecological, economic and
community issues surrounding the construction projects. The summary of the outputs
of the final first order model is presented in Table 7.18.
In table 7.18, the standardised regression weights for various variables range from
0.730 to 0.996 with the squared multiple correlations (R2) being 0.532 to 0.962. This
shows that all the variables retained are important given that the standardised
regression weights exceed the threshold recommended value of 0.7 and the squared
multiple correlations exceed the threshold value of 0.5 (Hair et al., 2006).

143
Table 7.18: Loadings of First-order CFA of CSFs’ success variables Variable R2 Standard first order loadings a
Project related factor
Client related Factor
Environm- ent related Factor
Supply Chain related Factor
Consultant related Factor
Contrac-tor related Factor
PSV1 .992 .996*** PSV2 .897 .947*** PSV3 .753 .868(24.5) PSV4 .729 .854(23.1) Project related factor
0.509b -0.400 0.046 0.311 0.078
CSV2 0.985 .992(13.4) CSV4 0.827 .909(13.7) CSV5 0.532 .730*** Client related Factor
0.212 -0.090 0.566 0.067
ESV1 0.777 .881*** ESV2 0.724 .851(13.9) ESV3 0.579 .761(12.4) Environment related factor
0.067 0.204 -0.020
LSV1 0.986 .993(14.2) LSV2 0.647 .804(12.9) LSV3 0.592 .770*** Supply Chain related Factors
-0.066 -0.246
SSV1 0.831 .912*** SSV2 0.776 .881*** Consultant related Factor
0.080
RSV1 0.688 .830*** RSV2 0.791 .889*** Contractor related Factor
Notes: a Standard first-order loading is the standard regression weight of the individual variables’ loading on to one of the component factors. Figures in parentheses are critical ratios from the unstandardised solutions; b Standard first-order loading for component factors (i.e. project-related, client-related, consultant-related, contractor-related, supply chain-related and external environment-related) is the covariance between any two of these component factors; *** The critical ratio is not available, because the regression weight of the first variable of each component factor is fixed at 1; Χ2=261.549, Df=107, Χ2/df=2.444, RMSEA=0.083, GFI=0.877, NFI Value=0.913, IFI=0.947, CFI=0.946, PNFI=0.719 and CFI=0.745

144
7.4.3 Second order measurement model of CSFs
The structural equation modelling was conducted at the second stage of the model to
test the relationships between the first order constructs and the second order construct,
namely project success (Figure 7.4)
χ2 statistics =3.190, RMSEA Value=0.1023, GFI Value=0.835, CFI Value=0.910, PNFI Value=0.759 and PCFI=0.790. Figure 7.4: Second order CSFs measurement model (Final)
As shown in Figure 7.4, the six constructs: project related, client related, consultant
related, contractor related, supply chain related and external environment related are
correlated and they load on project success construct. The estimated model fit indices
shown below the second order measurement model (figure 7.4) were found to be
adequate and the variable loadings were similar to the first order loadings. The second
order loadings on project success are 0.529 for project related factor, 0.551 for
environmental related factor, 0.495 for consultant related factor, 0.475 for contractor

145
related factor, 0.448 for client related factor and 0.410 for supply chain related factor.
The loadings of the other five CSFs on external environment related factor were very
low except on project related factor (-0.427) and client related factor (0.317). These
means that project related factor and client related factor have significant relationship
with external environment related factor.
The target coefficient of the second order measurement model is 0.766. Therefore, the
second order constructs (project success) explain 76.6% of the variation in the first-
order factors, the required evidence that project success is a second order construct.
7.4.4 Evaluation of constructs in CSFs measurement model
Validation of the constructs of CSFs, involved a systematic evaluation of the final
KPIs model it terms of dimensionality, reliability and validity. Whereas
unidimensionality is evaluated on the basis of item analysis, both reliability and
validity requires further analysis. The validation process is described below.
7.4.4.1 Unidimensionality and face validity: The development of the initial CSF
construct followed a thorough and extensive literature review. Views of experts
consisting mainly of academicians and practitioners were also sought when
developing the construct. All the items generated were checked for their
appropriateness. Further, through CFA, items were purified based on their empirical
findings and theoretical underpinnings so as to maximise face and content validity.
The remaining items after item purifications loaded on single constructs supporting
the existence of unidimensionality.
7.4.4.2 Construct Reliability: Reliability measures the internal consistency of the
observed variables. Table 7.19 reveals the values for construct reliability which range
from 0.85 to 0.96. According to Hair et al. (2006), the rule of thumb for reliability
estimate is 0.7 or higher. These findings demonstrate that the six constructs are highly
reliable. The table further reveals that the items constituting project related factor
exhibit the highest reliability followed by the client related factor.

146
Table 7.19: Reliability test of CSFs among CDF construction projects Variable Project
related Factor
Client related Factor
Enviro-nment related Factor
Supply Chain related Factor
Consultant related Factor
Contractor related Factor
Item
reliab
ilities
Eigen Value
Delta
PSV1 .996 0.992 0.008 PSV2 .947 0.896 0.104 PSV3 .868 0.753 0.247 PSV4 .854 0.730 3.371 0.270 CSV2 .992 0.985 0.015 CSV4 .909 0.827 0.173 CSV5 .730 0.532 2.344 0.468 ESV1 .881 0.777 0.223 ESV2 .851 0.724 0.276 ESV3 .761 0.579 2.080 0.421 LSV1 .993 0.986 0.014 LSV2 .804 0.647 0.353 LSV3 .770 0.593 2.226 0.407 SSV1 .912 0.831 0.169 SSV2 .881 0.776 1.607 0.225 RSV1 .830 0.689 0.311 RSV2 .889 0.790 1.479 0.210
Average Variance Extracted
84.28% 78.13% 69.33% 74.17% 80.30% 73.95%
Construct Reliability
0.96 0.91 0.87 0.89 0.89 0.85
In table 7.19, factor loadings are similar to standardised regression weights whereas
item reliabilities are the same as squared multiple correlations, R2. The delta values,
also known as the standardised error variances, describe that proportion of the
indicator variable that cannot be attributed to the specific construct. The eigenvalue of
the constructs shown in Table 7.19 indicate the variance extracted by each construct
in absolute terms. These values are then used to compute average variance extracted
(AVE) by the constructs, which demonstrates the average variance that a construct is
able to extract from each measurement item that loads on it. In other words, this
indicates the explanatory power of the constructs
Table 7.19 indicates that the project related construct possesses the highest
explanatory power as evidenced by AVE (84.28%), followed by consultant related
Squared factor loadings (communalities) Factor Loadings
3.371/4
Delta (standardised error variance) =1-item reliability e.g 1-.992= .008.
(.996+.947+.868+.854)2/[(. 996+.947+.868+.854)2+(.008+.104+.247+.270)]=0.96

147
construct (80.30%), client related construct (78.13%), supply chain related construct
(74.17%), contractor related construct (73.95%) and the environment related construct
(69.33%). An AVE of 0.8428 in project related construct indicates that up to 84.28%
of the variation in the measurement items relating to the project can be explained by
the same construct.
7.4.4.3 Construct Validity: Construct validity was addressed through convergent
validity and discriminant validity.
(i) Convergent validity: The six constructs in the CSFs scale mentioned above
have Average Variance Extracted (AVE) ranging from 0.69 to 0.84. This
reveals that the variables of every construct share high proportion of variance
amongst them. Therefore, convergent validity is considered adequate because
all values of AVE are above 0.5 (Hair et al., 2006).
(ii) Discriminant validity: The square root of AVE calculated for each construct
is compared with the correlation between each construct and other constructs
as shown in Table 7.20.
Table 7.20: Discriminant Validity of CSFs Construct Project
related factor.
Client related factor
Environment related factor
Supply chain related. factor
Consult-ant related factor
Contractor related factor
Project related factor 0.917 Client related factor .419 0.883 Environment related factor -.285 .179 0.830 Supply chain related factor .047 -.107 .069 0.860 Consultant related factor .231 .496 .154 -.071 0.894 Contractor related factor .060 .061 -.016 -.275 .066 0.860 Average Variance Extracted
0.84 0.78 0.69 0.74 0.80 .74
Diagonal elements are the square root of average variance extracted (AVE) and the other matrix entries represent correlations between constructs.
For discriminant validity to exist, the values representing the square root of AVE (the
diagonals) for all the constructs should be greater than the correlations between the
constructs (off-diagonals).
All the values of AVE estimates in the above table are larger than the corresponding
correlations between the constructs. This implies that the indicators have more in

148
common with the construct they are associated with than they do with other
constructs. Therefore, the six construct CFA model demonstrates discriminant
validity.
7.5 Structural Equation Modelling (SEM)
In the previous sub sections, two measurement models: one for KPIs and the other
CSFs have been tested and validated.
7.5.1 A summary of CFA results
Measurement properties of the two measurement models (KPIs and CSFs) were
evaluated by examining convergent validity and discriminant validity Specifically, for
convergent validity to be significant: a) Standardised factor loadings for each
observed item should be at least 0.5, b) construct reliability (CR) for each construct be
at least 0.6 and c) average variance extracted (AVE) should be 0.5 or higher (Hair et
al., 2006). Whereas the standardised factor loadings are part of the output of AMOS
software, C.R for each construct is computed as the square of summation of factor
loadings divided by the sum of the square of summation of factor loadings and the
summation of error variances. AVE, on the other hand, is computed by taking the
total of all squared standardized factor loadings divided by the number of items. Table
7.21 shows the values of CR and AVE of each construct and standardised factor
loadings of each item used in the performance evaluation framework.
As shown in Table 7.21 the CR for 11 constructs was above 0.7 indicating adequate
reliability of these constructs (Hair et al, 2006). The CR for safety is, however, 0.57 a
value just below 0.6 recommended as an acceptable value of CR (Hair et al., 2006).
Thus, the results provide evidence to the fact that the scales are reliable. All of the
factor loadings are statistically significant at five percent level and exceed the
threshold value of 0.5 standard (Hair et al., 2006). AVE is more conservative than
Cronbach’s alpha (α) as a composite reliability measure, and its accepted value is 0.5
or above for a construct.

149
Table7.21: Summary of the results of Confirmatory Factor Analysis Construct Construct
Reliability Average Variance Extracted
Item Standardised Factor loadings
Project Related Factor
0.96 0.84 PSV1: Influence of Design Complexity. .996 PSV2: Adhered to the requisite Quality standards.
.947
PSV3: Continuous monitoring of actual expenditures.
.868
PSV4: Formal dispute resolution structures. .854 Client Related Factor
0.91 0.78 CSV2: Cheap materials were used. .992 CSV4: Client’s emphasis on time rather than quality.
.909
CSV5: Design documents approved on time. .730 Environment Related Factor
0.87 0.70 ESV1: Community had no issues against the project.
.881
ESV2: Adversely affected by the surrounding weather.
.851
ESV3: Effect of the Governance policy. .761 Supply chain Related Factor
0.89 0.74 LSV1:Few internal procurement challenges .993 LSV2: Right equipments were available. .804 LSV3: Effect of stringent insurance/warranty rules.
.770
Consultant Related Factor
0.89 0.80 SSV1: No variations were incorporated. .912 SSV2: Adequate designs/specifications/ documentations.
.881
Contractor Related Factor
0.85 0.74 RSV1: Site Managers possessed requisite skills. .830 RSV2: Contractor had adequate technical skills.
.889
Time Performance
0.88 0.71 TPV1: Timely delivery of resources .824 TPV2: Harmonious relationship on site. .803 TPV3: A clear plan was formulated. .901
Cost Performance
0.91 0.78 CPV1: Equipments at pre budgeted rates. .997 CPV2: Stable labour costs .696 CPV4: Minimum variations cost were incurred .927
Site Dispute Performance
0.91 0.78 DPV1: No serious dispute due to specifications. .994 DPV2: Disputes due to the frequent changes .875 DPV3: No incidences of trade union agitation .768
Environmental impact Performance
0.86 0.68 EPV1: Project has led to air pollution. .976 EPV2: Increased solid waste. .663 EPV3: Utilised environmentally friendly technology.
.807
Quality Performance
0.96 0.89 QPV1: Right material was used for the construction work.
.992
QPV2: A sound QMS adhered to. .914 QPV3: Workers were trained on positive attitudes
.923
Safety Performance
0.57 0.40 SPV1: Accidents were reported. .549 SPV2: Fatalities did occur. .702

150
As shown in the third column of Table 7.21, the 12 constructs in the two measurement
models represented in Table 7.21 have AVE ranging from 0.40 to 0.89. This shows
that the variables of every construct share high proportion of variance within each
construct except in one construct, safety whose AVE is, however, just below 0.5 (Hair
et al., 2006). This construct was, however, retained due to its theoretical importance in
of performance measurement among construction projects. Therefore, convergent
validity may be considered reasonably good based on the AVE as shown in the Table
7.21. AVE can also be used to establish discriminant validity of a measurement scale.
Once constructs are ascertained to have significant convergent validity, they are
retested for discriminant validity which measures the extent to which the conceptually
different constructs are distinct. To get satisfactory discriminant validity, the square
root of AVE of each construct should be greater than the correlation between the
constructs (Hair et al., 2006).
Discriminant validity evaluates whether the constructs are measuring different
concepts (Hair et al., 2006).The square root of the variance extracted for each
construct should be greater than the correlations between the construct and all other
constructs (Wang et al., 2007). Conceptually, this implies that the average variance
shared should be greater than the variance shared between the constructs themselves.
7.5.2 Evaluation of structural model
The proposed performance evaluation structural model is presented in Figure 7.5.

151
Figure 7.5: Initial performance evaluation model.
This structural model was analysed using SEM as provided by AMOS Version 20.0 in
order to test the hypotheses formulated earlier for the model fit. The performance
evaluation model was estimated using the maximum likelihood (ML) method. The
SEM results suggest that though the model meets several GOF indices, it can still be
refined. Modification indices confirmed the presence of interrelations between three
pairs of exogeneous constructs: project related factor and client related factor; client
related factor and consultant related factor and finally, supply chain related factor and
contractor related factor. Thus the model should be improved by adding these
interrelations. Figure 7.6 shows the final model while Table 7.22 highlights the results

152
of GOF tests of both the initial and final models. All fit indices of the final model fall
within the recommended intervals, a pointer to model reliability.
Figure 7.6:Re-specified performance evaluation model.
The GOF measures are shown in Table 7.22. The revised model is supported because
both the IFI and CFI are greater than 0.9.

153
Table 7.22: Goodness of fit tests of SEM Evaluation index Goodness of Fit Description of the
test Initial performance evaluation model
Re-specified performance evaluation model
Absolute fit index
Chi square The least 1133.423 1031.129 Degrees of freedom Number 521 518 Chi square/df <4 2.175 1.991 P Value >0.05 0.000 0.000 RMR Value <0.05 0.613 0.407 RMSEA Value <0.05 indicates
very good fit (Threshold level=0.10)
0.075 0.069
GFI Value 0 (no fit) to 1 (perfect fit)
0.787 0.798
Relative fit index NFI Value 0 (no fit) to 1 (perfect fit)
0.815 0.831
IFI Value 0 (no fit) to 1 (perfect fit)
0.890 0.908
CFI Value 0 (no fit) to 1 (perfect fit)
0.890 0.908
Parsimonious fit index
PNFI Value >0.5 0.757 0.768 PCFI Value >0.5 0.826 0.838 Hoelter CN Value >=200 107 117
Cross validation Akaike AIC The least 1281.423 1185.129 ECVI The least 6.102 5.643
Table 7.22 shows that the re-specified structural model has good fit with data based
on assessment criteria such as GFI, CFI, TLI, and RMSEA.
In reference to the performance evaluation framework (Figure 7.6), it is suggested that
six categories of factors should be considered by project stakeholders. Further, the
framework shows that performance of construction projects can be measured on the
basis of six dimensions. The figure also shows inter-correlations between project
related and client related factors; consultant related and client related factors; and
contractor related and supply chain related factors. The measurement items of all
constructs including CSFs and KPIs are shown in Table 7.23.

154
Table 7.23: Summary of the constructs and measurement items in the Structural Equation Model
Construct Measurement items
Project Related Factor (PSV) PSV1: Influence of Design Complexity.
PSV2: Adhered to the requisite Quality standards.
PSV3: Continuous monitoring of actual expenditures.
PSV4: Formal dispute resolution structures.
Client Related Factor (CSV) CSV2: Cheap materials were used.
CSV4: Client’s emphasis on time rather than quality.
CSV5: Design documents approved on time.
Environment Related Factor
(ESV)
ESV1: Community had no issues against the project.
ESV2: Adversely affected by the surrounding weather.
ESV3: Effect of the Governance policy.
Supply chain Related Factor (ESV) LSV1:Few internal procurement challenges
LSV2: Right equipments were available.
LSV3: Effect of stringent insurance/warranty rules.
Consultant Related Factor (SSV) SSV1: No variations were incorporated.
SSV2: Adequate designs/specifications/documentations.
Contractor Related Factor (RSV) RSV1: Site Managers possessed requisite skills.
RSV2: Contractor had adequate technical skills.
Time Performance (TPV) TPV1: Timely delivery of resources
TPV2: Harmonious relationship on site.
TPV3: A clear plan was formulated.
Cost Performance (CPV) CPV1: Equipments at pre budgeted rates.
CPV2: Stable labour costs
CPV4: Minimum variations cost were incurred
Site Dispute Performance (DPV) DPV1: No serious dispute due to specifications.
DPV2: Disputes due to the frequent changes
DPV3: No incidences of trade union agitation
Environmental impact
Performance (EPV)
EPV1: Project has led to air pollution.
EPV2: Increased solid waste.
EPV3: Utilised environmentally friendly technology.

155
Amongst the six categories of CSFs influencing project success in the performance
evaluation model (figure 7.6), project related factor with a standardised coefficient of
0.738 is the most important followed by consultant related factor, client related factor,
contractor related factor and then supply chain related factor (with standardised
coefficients =0.666, 0.663, 0.631, and 0.566, respectively). External environment
related factor with a standardised coefficient of 0.517 is the least important, though it
was found significant during project construction. Greater efforts should be made to
facilitate all supply chain related and external environment factors when constructing
development projects. Similarly, Figure 7.6 shows that the most important dimensions
of overall project performance are cost, quality, time and site disputes (with
standardised coefficients= 0.995, -0.715, 0.517 and -0.314 respectively) in order of
importance as perceived by project stakeholders. Whereas the coefficient for site
disputes is rightly negative that of quality performance is also negative, implying that
cost conformance is attained at the expense of quality.
Further the SEM results show that project success is related to overall project
performance as exhibited by a standardised loading of 0.690. This means that the
success of construction projects can be reflected through its overall performance. The
relationship between each of the CSFs and each KPI can be obtained by multiplying
the three standardised coefficients (for instance, the relationship between project
related factor and cost is 0.507= (0.738x0.690x0.995).
7.5.3 Tests of hypotheses and Discussion
Hypotheses relating to both direct effects and indirect effects were tested.
7.5.3.1 Test of direct impact of re-specified model
Thirteen hypotheses proposed in Chapter 6 section 6.2 are tested based on the direct
effects. These hypotheses relate to the influence of the six CSFs on projects success,
the association between project success and overall project performance and the
relationship between overall project performance and KPIs. Table 7.24 summarises
the results of tests of hypotheses based on standardised regression weights in the
performance evaluation model

156
Table 7.24 Direct impact of re-specified model based on standardized regression weights
Hypothesis Relationship between exogenous and endogenous
Std estimate
S.E C.R P-Value
H1a Support Client related factor Project success
.663 ** ** **
H1b Support Supply chains related factor Project success
.566 .** ** **
H1c Support Project related factor Project success
.738 ** ** **
H1d Support Consultant related factor Project success
.666 ** ** **
H1e Support Contractor related factor Project success
.631 .** ** **
H1f Support External environment related factor Project success
.517 ** ** **
H3 Support Project success Overall project performance
.690 ** ** **
H4a Support Overall project performance Cost performance
.995 .** ** **
H4b Support Overall project performance Site disputes performance
-.314 .076 -2.452 .014
H4c Reject Overall project performance Environmental impact performance
-.080 .071 -.592 .554
H4d Support Overall project performance quality performance
-.715 .063 -6.950 ***
H4e Reject Overall project performance Safety performance
-.018 .056 -.102 .919
H4f Support Overall project performance Time performance
.517 .069 4.057 ***
** This is a construct whose regression weight turned out to be 1.000 hence does not have standard error (S.E) and critical ratio (C.R). *** These are constructs that are significant at all values of p.
The test results of these 13 hypotheses reveal that 11 of them are supported whereas 2
are not supported on the basis of data collected on CDF construction projects. As
regards the influence of CSFs on project success, it was found that all the hypotheses
are supported. These imply that these factors significantly influence project success.
Similarly, four of the six hypotheses pertaining to relationship between overall project
performance and KPIs were supported. Whereas cost and time had a direct
relationship with overall project performance, the relationship of overall project
performance with site disputes and quality was negative but significant. The
relationship between site disputes and overall project performance is expected to be
negative because an increase in site disputes will definitely affect project in terms of

157
completion time and cost. An examination into the nature of CDF projects shows that,
project stakeholders working on CDF construction projects strive towards completing
the projects as per the funds disbursed by the government. Therefore, they endeavour
to achieve good performance in terms of the tangible performance dimension of time
and cost. The findings also positively support the association between project success
and overall project performance.
7.5.3.2 Test of indirect impact of re-specified model
Table 7.25 shows the indirect effect estimates to test the mediating effect of external
environment related factor on the remaining five factors as hypothesized in H2a to
H2e.
Table 7.25: Indirect impact of re-specified model based on standardized regression weights
Hypothesis Exogenous factor
Mediating factor
Endogenous factor
Indirect effect.
Direct effect.
Total effect.
H2a Reject Client related factor
External environment related factor
Project success
-.193 .663
.470
H2b Reject Supply chain related factor
External environment related factor
Project success
-.107 .566
.459
H2c Reject Project related factor
External environment related factor
Project success
-.264 .738
-.474
H2d Reject Consultant related factor
External environment related factor
Project success
.020 .666
.686
H2e Reject Contractor related factor
External environment related factor
Project success
-.074 .631
-.557
Accordingly, the re-specified model indicates that the indirect effects were
significantly small, compared to total effects for all the five constructs. Therefore, all
the hypotheses in this section, H2a, H2b, H2c, H2d and H2e are rejected. The external
environment related factor does not significantly mediate the relationships between
project success and the five CSFs.

158
CHAPTER 8: CONCLUSION
8.0 Introduction
This chapter presents the conclusion of the study in several sections. The first section
summarises the findings of the study in relation to the objectives. The second section
discusses the managerial implications of this study while the third section provides
recommendations. The fourth section highlights the limitations of the study and
finally, the last section suggests future research directions.
8.1 A snapshot of summary findings
The purpose of the current study was to develop a performance evaluation framework
for assessing performance amongst public sector construction projects in developing
countries. In order to realise this objective, the researcher first conducted an extensive
review of the relevant literature in order to identify the existing body of knowledge in
the domain of performance measurement of construction projects. Based on the
review, performance indicator variables and the variables that influence project
success were identified and discussed with the experts in the area of construction
management. The variables were refined and a survey instrument was designed. This
was subsequently administered to clients, consultants and contractors who had been
involved in the CDF projects in the Western province, Kenya. The demographic
statistics regarding project characteristics and respondents’ profile were analysed
using Chi-square test of independence and one way Analysis of Variance (ANOVA).
The relevance of the performance indicator variables and success related variables
amongst CDF construction projects in Kenya was established through EFA, CFA and
SEM.
The study resulted in a set of KPIs that reflect the economic, social and environmental
dimensions of public sector construction projects. Further, the study identified and
confirmed a set of CSFs based on the KPIs which would enable the projects to
achieve performance on the identified KPIs. Finally, based on the two scales, one for
KPIs and the other for CSFs, a performance evaluation framework was developed.
The relationships on the developed framework were hypothesised and analysed using
SEM.

159
These ensured that all the research objectives are addressed. A snapshot of summary
findings in relation to the objectives is given below.
The occurrence of time overrun, cost overrun and quality defects does not vary
on the basis of the type of CDF construction projects. All types of projects are
prone to these problems pointing towards the need for other factors to be
considered.
Respondents’ experience has no relationship with the occurrence of time
overrun, cost overrun and quality of defects on CDF construction projects.
Most of these projects are characterised by standard procedures which guide
the construction process.
The occurrence of time overrun and quality defects on CDF construction
projects does not vary with the project procurement method. However, the
occurrence of cost overrun varies across different procurement approaches.
This is because different procurement approaches have implications on how
project costs are computed and appropriated amongst different parties who are
responsible for undertaking construction.
Project performance of CDF construction projects are evaluated on the basis
of six KPIs namely project time, cost, quality, safety, site disputes and
environmental impact. These KPIs address the economic, social and
environmental dimensions of public sector construction projects.
Whilst not all the KPIs are significant in terms of their relationship with
project performance, there is significant evidence and support for
measurement of project performance on the basis of time, cost, quality and site
disputes.
There are six CSFs that influence success of public sector construction
projects: project-related factor, client-related factor, consultant-related factor,
contractor-related factor, supply chain related factor and external
environment-related factor.
All these six CSFs assessed are significant, providing empirical support for
considering them as factors that influence success of public sector construction
projects.

160
The external environment related factor does not mediate the influence of the
remaining CSFs on project success.
Client related and project related factors; client related and consultant related
factors; and contractor related and supply chain related factors are inter-
correlated.
Success of public sector construction projects has a significant positive
association with overall project performance on the various KPIs. This
supports inclusion of the two concepts in the performance evaluation
framework for assessing performance of public sector construction projects.
These findings are briefly described in the following sections.
8.1.1 Summary findings regarding the relationship between projects’
characteristics, respondents’ profile and occurrence of time overrun, cost
overrun and quality defects.
In the exploratory study, it was found that majority of the projects funded under CDF
were Educational in nature followed by Health Care facilities while the number of
Industrial Estates and Agricultural Markets turned out to be the same. Most of these
projects were found to have been procured through the negotiated general contract
approach. With regard to cost overrun, time overrun and quality defects, it was found
that majority of projects got delayed but in most cases they met budgetary allocations
and quality specifications. With regard to respondents’ profile, majority of the
respondents were clients owing to their number in the target population, followed by
contractors and then consultants. Most of these respondents were found to posses
several years of experience in which they worked on relatively large projects as
evidenced by the value of the projects. These findings were confirmed in the study in
phase II, except that unlike in the exploratory study where the number of projects
under Industrial Estates and Agriculture was the same, the number of Industrial
Estates came out to be the least.
While examining the occurrence of time overrun, cost overrun and quality defects
across different types of projects in Phase II, it was found that the extent of
occurrence of cost overrun, time overrun and quality defects did not differ across the

161
different types of projects. Similarly, it was found that project procurement approach
did not have any effect on the occurrence of time overrun and quality defects.
However, the occurrence of cost overrun was found to be dependent on the type of
project procurement approach. While examining the relationship between
respondents’ experience and the incidences of time overrun, cost overrun and quality
defects, the results show that respondents’ experience has no effect on the occurrence
of any of the three indicators of project performance.
8.1.2 Summary findings regarding KPIs
The KPIs of overall project performance of CDF construction projects were assessed
at three levels. First, based on literature review and discussion with experts, a list of
35 performance related variables (shown in table 8.1) was identified. At the second
level, performance measurement variables were refined through EFA. This resulted in
27 performance variables which loaded into six dimensions of overall project
performance namely time, cost, quality, safety site disputes and environmental impact
as can indicated in table 8.1. The empirical findings of the study and the subsequent
analyses suggest that the performance of public sector construction projects does not
merely depend on the traditional internal criteria of time, cost and quality. It also
depends on another internal measure, safety and two external measures namely site
disputes and environmental impact. At the exploratory level, it was found that project
time is the most important KPI followed by cost while safety comes last in the order
of importance.
In the third step, the 27-variable six-factor of KPIs scale was further analysed using
CFA. The analyses resulted in a 17-item six construct measurement scale for CDF
construction projects. Test statistics of both first order and second order measurement
models are acceptable for performance measurement amongst CDF construction
projects. Table 8.1 summarises the findings of the three steps used in assessing KPIs.

162
Table 8.1: Summary of the dimensions of KPIs and performance measurement variables in both survey I and survey II Literature review and discussion with experts (Performance variables)
Exploratory Study (Phase I) Confirmatory Study (Phase II)
PV1: There has not been any increase in the cost of raw materials during construction of this project. PV2: Labour costs more or less remained stable over the period of construction of the current project. PV3: The project experienced minimum variations and hence hardly any additional cost attributable to variations was incurred. PV4: The required equipments were available at pre budgeted rates. PV5: The amount/quantity of different type of resources required during the implementation phase matched with those estimated during planning stage. PV6: There were no incidences of fraudulent practices and kickbacks during project execution. PV7: There were no incidences of agitation by the trade unions in the current project. PV8: There were no serious dispute between the client and contractor due to non adherence to the specifications. PV9: Disputes were observed due to the frequent changes in the design of the current project. PV10: Dispute resolution meetings were often held during project execution. PV11: At time of project completion, there were no financial claims that remained unsettled from this project. PV12: This construction project has adversely affected the quality of groundwater level. PV13: All required resources for the project were delivered on time during execution of this project. PV14: A clear plan was formulated and an efficient planning and control system was designed to keep the current project up-to-date. PV15: No changes were introduced in the designs of the current during project execution. PV16: Harmonious relationship between labour and management existed in the project site and hence no work disruptions were reported during project
Dimension Items Dimension Items Time Performance (7)
TPV1: Timely delivery of resources TPV2: Harmonious relationship on site. TPV3: A clear plan was formulated. TPV4: No delays in securing funds. TPV5: No effect of weather and climatic conditions. TPV6: No design changes. TPV7: At handover there were no apparent defects
Time Performance (3)
TPV1: Timely delivery of resources TPV2: Harmonious relationship exists on site TPV4: No delays in securing funds
Cost Performance (6)
CPV1: Equipments at pre budgeted rates. CPV2: Stable labour costs CPV3: No increase materials cost CPV4: Minimum variations co CPV5: Adverse effect on quality of groundwater level. CPV6: No financial claims at completion.
Cost Performance (3)
CPV1: Equipments available at pre budgeted rates CPV2: Stable labour costs CPV3: No increase in materials cost
Site Disputes DPV1: No serious dispute Site Disputes DPV1: No serious

163
execution. PV17: This project has led to air pollution in the adjoining areas. PV18: This project has led to depletion of the precious natural and mineral resources in the surrounding areas. PV19: There has been an increase in solid waste due to the construction of the current project. PV20: Accidents were often reported during project construction. PV21: Near misses occurred quite often during construction. PV22: Fatalities did occur on this project during construction. PV23: The construction work utilised environmentally friendly technology. PV24: This project has led to the increased release of toxic material. PV25: No delays were experienced in securing funds during project implementation. PV26: At the time of handover, the current project was free from apparent defects PV27: The project contractors were often called back during the Defects Liability Period to repair defects. PV28: Weather and climatic conditions did not have much impact on delaying the project. PV29: The current project has utilised reusable and recyclable materials in construction work. PV30: The right material was used for the construction work. PV31: Employees working in the current project possessed requisite skills and most of them had worked on similar kinds of projects in the past. PV32: A sound quality management system was strictly adhered to during project execution phase of the current project. PV33: Training was imparted to the workers in order to develop a positive attitude and also to enable them to apply the right method of work. PV34: All stakeholders associated with the current project supervised the quality of the project in all its phases. PV35: Proper medical facilities were available for people working on the project
Performance (4)
due to specifications. DPV2: Disputes due to the frequent changes DPV3: No incidences of trade union agitation DPV4: Dispute resolution meetings
Performance (3) protests by the community due to the nature of the project DPV2: Disputes due to frequent changes in designs DPV3: No incidences of trade union agitation
Environmental impact Performance (4)
EPV1: Project has led to air pollution. EPV2: Increased solid waste. EPV3: Utilised environmentally friendly technology. EPV4: Project has led to depletion natural resources.
Environmental impact Performance (3)
EPV1: Project has led to air pollution EPV2: Project has given rise to increase in solid waste EPV3: Utilised environmentally friendly technology
Quality Performance (3)
QPV1: Right material was used for the construction work. QPV2: A sound QMS adhered to. QPV3: Workers were trained on positive attitudes
Quality Performance (3)
QPV1: Right material was used for the construction work QPV2: A sound QMS was adhered to QPV3: Workers were trained on positive attitudes
Safety Performance (3)
SPV1: Accidents were reported. SPV2: Fatalities did occur. SPV3: Near misses occurred.
Safety Performance (2)
SPV1: Accidents were reported SPV2: Fatalities did occur.

164
The results show that the cost construct has positive correlation with time construct
and negative correlation with quality construct. However, quality performance
deteriorates when cost performance improves. The second order measurement model,
shows that the quality constructs possesses the maximum explanatory power. It is
also the most reliable amongst the KPIs. However, all the other KPIs were also found
to have adequate explanatory power of overall project performance. This indicates
that the measurement items across all constructs may be considered as valid and
reliable which may be successfully utilized by the project managers while evaluating
construction projects. The CFA findings of the second order measurement model
reveal that cost is the most important followed by quality whereas safety comes last.
8.1.3 Summary findings regarding CSFs
The procedure of identifying and confirming CSFs was also carried out in three
stages, (literature review, exploratory phase and confirmatory phase), similar to the
stages enumerated in section 8.1.2. A list of 30 variables (shown in table 8.2)
influencing project success was identified based on literature review and discussion
with experts. These variables were subjected to EFA which yielded 27 success
variables loading in six components representing project success namely project
related, client related, consultant related, contractor related, supply chain related
and external environment related factors. Out of the six success factors, client
related, consultant related and contractor related factors are stakeholder based
whereas project related factor is based on project features and characteristics. Supply
chain related factor is based on management processes in terms of sourcing and
delivering of right materials and components in time and external environment
related factor addresses all environmental issues that affect project success. The
relative importance of the six CSFs varies. The results reveal that project related
factor is the most important factor followed by client related factor while contractor
related factor turns out to be the least in order of importance.
The 27-item six factor scale of CSFs was further analysed using CFA which resulted
in 17 item six construct scale of CSFs for CDF construction projects. Table 8.2
summarises the findings of the qualitative analysis, exploratory analysis and the
confirmatory analysis.

165
Table 8.2: Summary of the CSFs and success variables in both survey I and survey II. Literature review and discussion with experts (Success Variables)
Exploratory Study (Phase I) Confirmatory Study(Phase II)
SV1: The location and Site conditions did not affect the construction of this project. SV2: Design Complexity of project (Type, size, nature and number of floors) has influenced the project cost and time. SV3: Project planning, Scheduling and control were adequately done on this project SV4: The client secured necessary funds for the project and hence there were no delays in material acquisition and payments to contractor. SV5: The client got the design documents approved on time for this project. SV6: The client had adequate experience on similar kind of projects. SV7: Information sharing and collaboration among project participants were adequate in the current project. SV8: The construction work adhered to the requisite Quality standards. SV9: Continuous monitoring of actual expenditures and project schedules and their comparison with the budget was done regularly. SV10: There was a formal organization structure for dispute resolution within the project organization. SV11: Site Managers possessed requisite skills necessary for the kind of projects executed. SV12: The contractor had adequate technical skills and experience on similar type of projects. SV13: The contractor used latest construction methods in the project. SV14: The community did not raise any social, political or cultural issues against construction of the current project. SV15: The project execution was adversely affected by the surrounding weather and climatic conditions. SV16: Macro- economic conditions (such as interest rates, inflation) did not
Dimension Items Dimension Items Project Related Factor (7)
PSV1: Influence of Design Complexity PSV2: Adhered to the requisite Quality standards. PSV3: Continuous monitoring of actual expenditures. PSV4: Formal dispute resolution structures. PSV5: Effect of location and Site conditions. PSV6: Adequate Information sharing and collaboration. PSV7: Adequate Project planning and, Scheduling.
Project Related Factor (4)
PSV1: Influence of Design Complexity PSV2: Adhered to the requisite Quality standards PSV3: Continuous monitoring of actual expenditures PSV4: Formal dispute resolution structures
Client related factor(5)
CSV1: Adequate experience on similar projects. CSV2: Cheap materials were used. CSV3: Project funds secured on time. CSV4: Client’s emphasis on time rather than quality. CSV5: Design documents approved on time.
Client related factor (3)
CSV2: Cheap materials were used CSV4: Client’s emphasis on time rather than quality CSV5:Design documents approved on time
External environment related factor (6)
ESV1: Community had no issues against the project. ESV2: Adversely affected by the surrounding weather.
External environment related factor (3)
ESV1: Community had no issues against the project ESV2: Adversely

166
significantly affect the execution of this project. SV17: The project was affected by the Governance policy of the relevant government agencies which affects project success. SV18: The consultant was highly committed to ensuring construction work according to design specifications. SV19: There were adequate designs, specifications and documentations for the use of contractor. SV20: The client emphasized on completing the current project very fast without any reference to quality. SV21: The client tended to purchase construction materials at cheaper rate which led to the dilution of other project objectives. SV22: No variations in original design took place in the current project during construction phase. SV23: The level of technological sophistication considered in the project was satisfactory. SV24: There were no incidences of disagreements resulting from industrial relations prevailing at the time of project implementation. SV25: The physical and ecological conditions surrounding the project were favourable to project execution. SV26:There were very few internal procurement challenges SV27: The client’s decisions were timely and objective. SV28: Right equipments were available in the construction site of this project. SV29: The project faced stringent insurance and warranty contractual requirements. SV30: Working capital was adequate.
ESV3: Effect of the Governance policy. ESV4: Favourable physical and ecological conditions. ESV5: Effect of Macro- economic conditions. ESV6: No incidences industrial unrests.
affected by the surrounding weather ESV3: Effect of the Governance policy
Supply chain related factor (3)
LSV1:Few internal procurement challenges LSV2: Right equipments were available. LSV3: Effect of stringent insurance/warranty rules.
Supply chain related factor (3)
LSV1: Few internal procurement challenges LV2: Right equipments were available LSV3: Effect of stringent insurance/warranty rules
Consultant related factor (3)
SSV1: No variations were incorporated. SSV2: Adequate designs/specifications and documentations. SSV3: Adequate consultant committed to project.
Consultant related factor (2)
SSV1: No variations were incorporated SSV2: Adequate designs/specifications and documentation
Contractor related factor (3)
RSV1: Site Managers possessed requisite skills. RSV2: Contractor had adequate technical skills. RSV3: Contractor used latest construction methods.
Contractor related factor (2)
RSV1: Site Managers possessed requisite skills RSV2: Contractor had adequate technical skills.

167
Testing of the first order measurement model and the second order measurement
model (that includes mediation of external environment related factor) through
appropriate test statistics indicate that both models are acceptable. In the first order
model, some constructs are found to be positively correlated while others are
negatively correlated. For instance, project related construct has positive correlation
with client related construct and negative correlation with environment construct. This
probably indicates that the positive influence of project related factor is accompanied
by the positive influence on client related factor and vice-versa. However, the
influence of project related factor on environment is negative.
The first order model further shows that the project related construct possesses the
maximum explanatory power followed by consultant related construct while the
environment related construct has the minimum explanatory power. Further project
related construct is also has the highest reliability. Similarly the remaining five
constructs were also found to posses adequate scale reliability. This indicates that the
measurement items across all constructs may be considered as valid and reliable
which may be successfully utilized by the project managers for evaluating CSFs of
construction projects.
The second order construct and its relationships with the first order constructs enables
project managers to view the project success at a higher level. Due to this, the model
could reveal patterns of relationships among the constructs which are otherwise not
visible in the first order model. The second order model shows that all the six CSFs
are important in determining the success of CDF construction projects, as shown
through the standardised second order loadings. The external environmental related
factor possess the most influence on project success followed by project related factor
while supply chain related factor has the least influence.
8.1.4 Summary findings regarding the Performance Evaluation Framework
A SEM was developed to evaluate the impact of CSFs on project success. Further, it
was hypothesised that project success is positively associated with overall project
performance which is again expressed in terms of time, cost, quality, safety, site
disputes and environmental impact. The reliability of the twelve constructs and of the

168
model was found satisfactory. The GOF indices of the structural model were also
found quite satisfactory. However, not all the path coefficients were significant.
The influence of CSFs on project success
The results indicate that all the CSFs are appropriate success factors for CDF
construction projects since they have high factor loadings that are significant
at 5%. Based on the loadings of these CSFs on project success, it can be stated
that the most important CSF is project-related factor, followed by consultant-
related factor, client-related factor, contractor-related factor, supply chain-
related factor and external environment-related factor in descending order of
importance.
The results of the SEM model also suggest that mediation of external
environment related factor into the relationships between project success and
each of the CSFs is not fully supported.
The association between project success and overall project performance
Given that all the CSFs were found to influence the success of CDF
construction projects, the main challenge facing these projects is still
construction management which is undertaken by the client, consultants and
contractors. The success of construction management is reflected through
overall project performance. The association of project success and overall
project performance was found to be significant and positive indicating that
the two concepts are related in the assessment of project performance.
The relationship between overall project performance and KPIs
Results of SEM indicate that “cost” is the predominant indicator of overall
project performance followed by “quality”, “time” and “site disputes” in that
order. Three of these indicators cost, time and quality are well represented in
the literature on the “iron triangle” and have not been contradicted in the
current study. “Site disputes” being a contemporary measure of performance,
is an addition to the iron triangle emerging from the current study which seeks
to ensure harmony at the construction site (David, 2009; Tabish & Jha, 2011).

169
The remaining two performance indicators, safety and environmental impact
were not significant. The reason for this insignificant relationship of safety
with overall project performance seems to be its intangibility. Further, the
outcome of environmental impact of a project becomes evident long after the
construction process is completed. Because of this, it may not occur to the
project stakeholders that a project may have some adverse environmental
impact.
Whereas cost and time performances were positively related to overall project
performance, quality and site disputes performance were negatively related.
8.2 Managerial implications of the findings
The findings of the current study have several implications to the managers and
stakeholders involved in the implementation of public sector construction projects.
Below is a brief description of these implications.
The findings of the study on project characteristics and respondents’
demographic profile imply that some of the project procurement approaches
are more cost effective than others.
The findings of KPIs imply that public sector construction projects can be
evaluated on the basis of six KPIs namely cost, time, quality, site disputes,
safety and environmental impact. The positive and negative relationships
among the KPIs give important insights to the managers to the fact that when
performance on one KPI improves, the performance on the other KPIs might
improve or deteriorate.
The final findings of KPIs also imply that while measuring performance of
public construction projects, project cost is the most important performance
indicator, followed by time, quality and site disputes.
Findings reveal that cost and time performance are positively related to overall
project performance whereas quality and site disputes are negatively related to
overall project performance. This implies that improvement in cost and time
performance will improve overall project performance whereas insistence on
quality and site dispute resolution could undermine overall project

170
performance. Therefore project stakeholders consider pursuance of quality as
an effort that requires additional cost and time thereby impacting negatively
on overall project performance.
Further, the findings also imply that while implementing public sector
construction projects, there are six CSFs that influence the success of public
sector construction projects. Project success can therefore, be evaluated on the
basis of each individual success variables which may be used as a check list to
pinpoint areas of weaknesses which may need to be corrected in case of
unsatisfactory performance on a particular item.
Project related factor is relatively more important on success of public sector
construction projects implying that project characteristics are likely to have
significant impact on the project than the remaining factors. Therefore, the
findings provide insights to the managers in terms of how to monitor the
progress of public construction projects based on CSFs.
Further, the inter-correlations amongst three pairs of CSFs imply that project
stakeholders should take a holistic view of CSFs while determining their
influence on project success as one CSF is likely to be associated with another
CSFs
Similarly, the findings imply that project success and overall project
performance are distinct components of a performance evaluation framework.
They are however associated although each is captured through different
constructs.
8.3 Recommendations
The project stakeholders can use this performance evaluation framework to clarify
their understanding of performance of public sector construction projects during
construction and be able to take corrective action in order to improve overall
performance. It is therefore, recommended that project stakeholders should
Consider using those project procurement approaches which are cost effective
in order to avoid cost overrun on the projects.

171
Understand the needs of the community through proper involvement of the
representatives of the community and other stakeholders and accordingly
select suitable projects which would cater to their needs.
Understand the urgency of evaluating public sector construction projects on
multi-dimensional performance measures incorporating economic, social and
environmental aspects. Develop appropriate operational metrics to reflect the
three broad dimensions of performance of public sector construction projects.
Develop a holistic performance evaluation framework of public sector
construction projects consisting of the six KPIs with the help of 17 observable
performance related variables.
Allocate considerable amount of resources into the issues relating to project
time, cost, quality and site disputes of public construction projects. This is
because cost, time, quality and site disputes were relatively more important.
On the basis of KPIs, identify the CSFs that are appropriate for attainment of
success on the various KPIs and consider monitoring the progress of public
sector construction projects on the basis of CSFs.
Put more emphasis on project characteristics as they ranked higher in
importance among the CSFs influencing project success. However, the
contractors play an important role in the day-to-day management of the
construction activity. Thus even though the other factors were not ranked as
high as the project related factor, the managers should allocate sufficient
resources to the remaining factors as well which would enable them to
achieve satisfactory success on these CSFs for public sector construction
projects.
Distinguish between successful project implementation and overall project
performance and utilize the framework developed to compare success of
different types of construction projects on different CSFs. Similarly, project
managers could compare overall project performance of different projects
based on specific performance indicators.
8.4 Limitations of the study
The current study suffers from the following limitations

172
The responses to the questionnaire were based on perceptions of respondents
regarding the performance measurement variables and project success
variables. However, the frame of mind of the respondents may differ, and
hence, the responses provided are fraught with some element of subjectivity.
Secondly, the study was based on the perceptions of clients, consultants and
contractors but left out the community which actually benefits from the public
sector construction projects and for whom the projects are expected to be
relevant. The study did not consider community satisfaction with project
implemented though this is one of the desired outcomes of public construction
projects.
Further, there could be direct interactions between CSFs and the various KPIs.
The scope of the current study could not allow the researcher to examine such
direct relationships.
Similarly, the data for the development of the measurement instrument was
gathered in one province in Kenya. The prevailing circumstances in Western
province, Kenya could be different from the circumstances in other provinces
in Kenya and other developing countries.
Further these projects are characterized by the involvement of many
stakeholders with varying interests, numerous bureaucratic hassles and of
course, varying political interests, which facilitates corruption. Corruption
which includes bribery, embezzlement, kickbacks and fraud in construction
projects undermines the delivery of infrastructure services. These practices can
lead to increases in cost, extension of time and poor quality of constructed
facilities. The element of corruption has not been included in the present
study.
8.5 Directions for Future Research
This section recommends some potentially useful future research that can address
some of the limitations of this study.
Researchers could undertake a study in performance evaluation from the
perspectives of the community which constitutes the actual beneficiaries of the

173
projects. In such a study, the level of community satisfaction with the projects
implemented can be addressed.
Further future studies can attempt to identify the direct relationship between
the CSFs and KPIs through empirical studies. Also, future studies may
examine moderating factors that may have an effect on the relationship
between CSFs and project success.
Future researchers could advance the current construction project performance
evaluation scale and test its applicability within the context of other
constituencies in different regions in Kenya and those projects in other
developing countries. There is, therefore, an important need to undergo cross-
cultural validation of the instrument using data gathered from other provinces
of Kenya and other developing countries as well in order to enhance the
generalization of items.
Finally, a study incorporating the effect of corruption in performance
evaluation of public sector construction projects is of great importance. This is
because the intended objectives of public sector construction projects can be
properly realised in a corruption free environment. It is a well known fact that
these kinds of projects are severely affected by the scams prevalent in many
countries.
REFERENCES
Aaltonen, K., & Jaakko, K., (2010). A project lifecycle perspective on stakeholder
influence strategies in global projects. Scandinavian Journal of Management
(2010) 26, 381—397.
Abidin, A., (2007). The Profile of Construction Disputes. Unpublished Masters
Dissertations, Universiti Teknologi, Malaysia, Skudai
Abdul R. R., Taib W. B., Ahmad M. A., Nasid, N. A., & Zainordin Z.M. (2006).
Effect of procurement systems on the performance of construction projects.
International Conference on Construction Industry, Padang, Indonesia, 21-25th
June.

174
Abdul-Kadir, M. R., & Price, A. D. F., (1995). Conceptual phase of construction
projects International Journal of Project Management, Volume 13, Issue 6,
December 1995, Pages 387–393
Abdullah, M. R., Abdul, A. A. A., & Abdul, R.I., (2009). Potential effects on large
MARA projects due to construction delay. International Journal of Integrated
Engineering (Issue on Civil and Environmental Engineering) 1(2): 53-62.
Abudayyeh, O., Fredericks, T., Butt, S., & Shaar, A., (2006). An investigation of
management’s commitment to construction safety. International Journal of
Project Management, 24(2), pp. 167-174.
African Economic Outlook, (2012). Kenya Macroeconomic Policy. Retrieved from
www.africaneconomicoutlook.org/en..
Ahadzie, D.K., Proverbs, D. G., & Olomolaiye, P.O., (2008). Critical success criteria
for mass house building projects in developing countries. International Journal of
Project Management, 26 (6), 675–687.
Ahsan, K., & Gunawan, I., (2010). Analysis of cost and schedule performance of
international development projects, Original Research Article. International
Journal of Project Management, Volume 28, Issue 1, January 2010, Pages 68-78.
Alba F., Miquel, C., Marta, G., Nuria F., Marcel M., & Xavier R., (2013). An
Environmental Impact Causal Model for improving the environmental
performance of construction processes. Journal of Cleaner Production, 52
(2013).
Al Haadiri, S., & Panuwatwanich, K., (2011). Critical Success Factors for Safety
Program Implementation among Construction Companies in Saudi Arabia.
Procedia Engineering Volume 14, (2011), Pages 148-155.
Ali, A.S., & Rahmat, I., (2010). The performance measurement of construction
projects managed by ISO-certified contractors in Malaysia. Journal of Retail &
Leisure Property (2010) 9, 25–35.
Ali, A.S., & Kamaruzzaman, S.N., (2010). Cost Performance for Building
Construction Projects in Klang Valley. Journal of Building Performance, 1 (1),
110 - 118.
Al-Momani, A.H., (2000). Construction delay: A quantitative analysis, International
journal of Project Management, 18 (2000) 51-59.

175
Alwaer, H. & Clements-Croome, D.J., (2010). Key performance indicators (KPIs) and
priority setting in using the multi attribute approach for assessing sustainable
intelligent buildings, Building and environment 45 (2010) 799-807.
Al-Kharashi, A., & Skitmore, M., (2008). Causes of delays in Saudi Arabian public
sector construction projects. Construction Management and Economics, 27(1).
pp. 3-23.
Al-Tmeemy, S. M. H., Abdul-Rahman, H., & Harun, Z., (2011). Future criteria of
success of building projects in Malaysia. International Journal of Project
Management, 29 (3), 337-348.
Alwi, S., Hampson, K., & Mohamed, S., (2002). Waste in the Indonesian
Construction Project. Proceedings of the 1st International Conferences of CIB
W107 – Creating a Sustainable Construction Industry in Developing Countries,
11-13 November 2002, South Africa, ISBN: 0-7988-5544-4, pp. 305-315.
Alzahrani, J. I., & Emsley M. W., (2013). The impact of contractors’ attributes on
construction project success: A post construction evaluation. International
Journal of Project Management, 31 (2013) 313–322.
Ameh, O.J., Soyingbe, A.A., & Odusami, K.T., (2010). Significant factors causing
cost overrun in telecommunication projects in Nigeria. Journal of Construction in
Developing Countries, 15 (2), 49-67.
Ankrah, N. A., & Proverbs, D (2005). A framework for measuring construction
project performance:overcoming key challenges of performance measurement.
In: Khosrowshahi, F (Ed.), 21st Annual ARCOM Conference, 7-9 September
2005, SOAS, University of London. Association of Researchers in Construction
Management, Vol. 2, 959-69.
Assaf, S.A., & Al Hejji, S., (2006). Causes of delay in large construction projects.
International Journal of Project Management, Vol. 24, pp. 349-361.
Atkinson, R., (1999). Project management: cost, time and quality, two best guesses
and a phenomenon, it’s time to accept other success criteria. International
Journal of Project Management 17, 337–342.
Awiti, V.P., (2008). An Assessment of the use and management of Development
Funds. The case of Constituencies Development Fund in Kenya. Unpublished

176
masters dissertation submitted to the institute of Social Studies for MA in
Development Studies, Hague, Netherlands.
Azhar, S., Ahmed, S.M., & Ahmad, I., (2002). Supply chain management in
construction scope, benefits and barriers. Delhi Business Review Vol. 3, No. 1,
January - June 2002.
Azhar,N., Farooqui, R.U., & Ahmed, S.M., (2008). Cost overrun factors in
construction industry in Pakistan. First International Conference on Construction
in Developing countries (ICCIDC-I, advancing and integrating construction
education, research and practice).
Barasa, R. M., (2010). Review of Constituencies Development Fund Projects A North
Rift Case Study, October 2010 3rd Draft No.37. www.afrepren.org/Pubs/
WorkingPapers/wpp378_ sum.htm Accessed on 15/05/2012
Barclay, C., Osei-Bryson, K.M., (2010). Project performance development
framework: an approach for developing performance criteria & measures for
information systems (IS) projects. International Journal of Production Economics
124, 272–292.
Basheka, B. C., & Tumutegyereize, M., (2012). Measuring the performance of
contractors in government construction projects in developing countries:
Uganda’s context. African Journal of Business Management Vol. 6(32), pp.
9210-9217, 15 August, 2012.
Baskin, M., (2010). Constituency Development Funds (CDFs) as a tool of
Decentralised Development. 56th Commonwealth Parliamentary Conference,
Nairobi, Kenya, 10th-19th September.
Bassioni, H., Price, A., & Hassan T., (2004). Performance Measurement in
Construction. Journal of Management Engineering, 20(2), 42-50.
Beck, T., (2006). Evaluating humanitarian action using the OECD-DAC criteria: An
ALNAP guide for humanitarian agencies. London, UK: Overseas Development
Institute.
Billy, H., Cameron, I., & Duff, A.R., (2006). Exploring the integration of health and
safety with pre-construction planning. Engineering, Construction and
Architectural Management, 13(5): 438-450.

177
Blake, D.W., (2008). Scope for Improvement: A Survey of Pressure Points in
Australian Construction and Infrastructure Projects. A Report Prepared for the
Australian Constructors Association by Blake Dawson Waldron Lawyers,
Sydney, Australia. Retrieved from http: //www.constructors.com.au/
publications/sfi_2008/ACA_ Scope_for_Improvement_2008.pdf.
Blindenbach-Driessen, F., (2006). Innovation management in project-based firms,
Doctoral thesis, School of Management Erasmus University, Rotterdam.
Blyth, A. and Worthington, J. (2001). Managing the Brief for Better Design. Spon,
London.
Bon-Gang H., Xianbo Z., & Si Yi N., (2013). Identifying the critical factors
affecting schedule performance of public housing projects. Habitat
International 38, 214-221Online publication date: 1-Apr-2013.
Bordoli, D.W. & Baldwin, A.N., (1999). A methodology for assessing construction
project delays. Construction Management and Economics, Vol. 16, pp. 327-37.
Borvorn I.N. A., (2011). Common disputes related to public work projects in
Thailand. Songklanakarin Journal of Science and Technology, 33 (5), 565-573,
Sep. - Oct. 2011.
Briscoe, G., & Dainty, A., (2005). Construction supply chain integration: an elusive
goal? Supply Chain Management: An International Journal, Vol. 10 Iss: 4,
pp.319 – 326.
Bryde, D. J., & Robinson, L., 2005. Client versus contractor perspectives on project
success criteria. International Journal of Project Management, 23(8), 622—629.
Cao, Q., & Hoffman .J .J. (2011). A case study approach for developing a project
performance evaluation system. International Journal of Project Management 29
(2011) 155–164.
Chalabi, F.A. & Camp, D., (1994). Causes of delays and overrun of construction
projects in developing countries, CIB Proceedings, no. 2, pp. 723-34.
Chan, A. P.C., (2001). Design and build project success factors: multivariate analysis,
Journal of construction engineering and management 93–100 Mar/Apr.
Chan, A.P.C., & Chan, A.P.L., (2004). Key performance indicators for measuring
construction success. Benchmarking: An international journal 11, 203–221.

178
Chan, A.P.C., & Tam, C.M., (2000). Factors affecting the quality of building projects
in Hong Kong. International Journal of Quality & Reliability Management, 17
(4/5), 423 – 442.
Chan, D. W. M., & Kumaraswamy, M. M., (1997). A comparative study of causes of
time overrun in Hong Kong construction projects,’ International Journal of
Project Management, 15(1), 55–63.
Chen, Y., Okudan, G. E., & Riley, D. R.,(2010). Sustainable performance criteria for
construction method selection in concrete buildings, Automation in Construction
Article in Press, Corrected Proof, doi:10.1016/j.autcon.2009.10.004.
Chianca, T., (2008). The OECD/DAC Criteria for International Development
Evaluations: An Assessment and Ideas for Improvement. Journal of Multi-
Disciplinary Evaluation 2008; 5(9): 41-51.
Cooke-Davis, T., (2002). The ‘real’ success factors on projects. International Journal
of Project Management, Vol. 20, pp 185-190.
Constituency Development Fund (CDF) Act, (2003), Republic of Kenya.
Construction users roundtable (CURT), ( September, 2005 report). Construction
Measures: Key Performance Indicators. UP-101. Retrieved from
http://www.nwoglca.org/PDF_Files/Construction%20Measures_Key%
20Performance%20Indicators.pdf
Costa, D. B. & Formoso, C. T. (2004). Evaluating performance measurement systems
for construction companies, In: Aouad, G., Amaratunga, D., Kagioglou, M.,
Ruddock, L.and Sexton, M. (Eds.), The International Salford Centre for Research
and Innovation(SCRI) Research Symposium.
Coursaris, C.K., Sweirenga, S.J., & Watrall, E. (2008). An Empirical Investigation of
color Temperature and Gender Effects on Web Aeshetics. Journal of Usability
Studies, Volume 3, Issue 3, May 2008, pp. 103-117.
Datta, M., (2004). Challenges Facing the Construction Industry in Developing
Countries. http://citeseerx.ist.psu.edu/viewdoc/summary?doi=10.1.1.194.6404
accessed 07/06/2013.
David, W., (2009). Public-Sector Project Management. John Wiley and Sons, Inc.
Hoboken, New Jersey.

179
Diallo, A., & Thuillier, D., (2005). The success of international development projects,
trust and communication: An African perspective. International Journal of
Project Management, 23(3), 237—252.
Ding, G.K.C., (2005). Developing a multicriteria approach for the measurement of
sustainable performance. Building Research & Information, Vol. 33 No. 1, pp. 3-
16.
Enshassi, A.,Mohamed, S., and Ekarriri, A., (2009). Essential Skills and Training
Provisions for Building Project Stakeholders in Palestine. Journal of
Construction in Developing Countries, 14 (1), 31- 50.
Eriksson, P.E., & Westerberg, M., (2011). Effects of cooperative procurement
procedures on construction project performance: A conceptual framework.
International Journal of Project Management, 29 (2), 197-208.
Essam, K.Z., (2006). Construction claims in United Arab Emirates: Types, causes,
and frequency. International journal of Project Management vol. 24, no.5 pp
453-459, 2006.
Field, P.A., (2005). Discovering Statistics using SPSS, 2nd Edition. London. Sage.
Fortune, J & White, D., (2006). Framing of project critical success factors by a
systems model. International journal of Project management 24(2006) 53-65.
Frimpong, Y., Oluwoye, J. & Crawford, L., (2003). Causes of delays and cost overrun
construction of groundwater projects in developing countries, Ghana as a case
study, Journal of project management, 21, 321-326.
Gangolells M, Casals M, Gassó S, Forcada N, Roca X, & Fuertes A., (2009). A
methodology for predicting the severity of environmental impacts related to the
construction process of residential buildings. Building and Environment 2009;
44(3)
Gangolells M, Casals M, Gassó S, Forcada N, Roca X, & Fuertes A., (2011).
Assessing concerns of interested parties when predicting the significance of
environmental impact related to construction process of residential buildings.
Building and environment 46 (2011) 1023-1037.
Gardiner, K. S., (2000). Revisiting the Golden Triangle of Cost, Time, and Quality:
the Role of NPV in Project Control, Success, and Failure. International Journal
of Project Management 18 (4), 251-256.

180
Gemunden H., Salomo S. & Krieger A., (2005). The influence of project autonomy
on project success. International Journal of Project Management, 23 (2005), pp
366-373.
Global construction 2020, (2011). A report of Global construction perspectives and
Oxford Economics. www.globalconstruction2020.com (Accessed 27/03/2012).
Grace, F.M., (2010). Types of Construction Projects Article Source:
http://EzineArticles.com/?expert=Grace_F._M. Accessed o7/06/2013.
Halpin, D.W., & Woodhead, R.W., (2006). Construction management. 3rd Ed. New
York ; Chichester : Wiley.
Hamad A., & Sangwon H. (2013). Analysis of Causes of Construction Defects Using
Fault Trees and Risk Importance Measures. Journal of Construction Engineering
and Management 139:7, 870-880.
Harrison, P. (2007). Can measurement error explain the weakness of productivity
growth in the Canadian construction industry? International Productivity
Monitor, 14 (Spring): 53–70.
Haslama, R.A., Hidea, S.A., Gibbb, A.G.F., Gyia, D.E., Pavitt, T., Atkinsona, S., &
Duff, A.R. (2005). Contributing factors in construction accidents. Applied
Ergonomics 2005; 36:401–15.
Henricsson, P. & Ericsson, S. (2005). Measuring Construction Industry
Competitiveness: A Holistic Approach. Proceedings: The Queensland University
of Technology Research Week International Conference. Brisbane,Australia, 4–8
July.
Ibnu, A.M., 2006. Causes and Effects of delays in ACEH Construction Industry.
Unpublished MSc Thesis in construction management, Faculty of Civil
Engineering, University Technology Malaysia.
Ika L.A., Diallo A., & Thuiller D., (2012). Critical success factors for World Bank
projects. An Empirical Investigation. International journal of project
Management 30 (2012) 105-116.
ILO, (2001). The construction industry in the twenty first century: Its image,
employment prospects and skill requirements. International Labor Office,
Geneva.

181
Jahmane, A., Van Hoorebeke, D., & Louart, P., (2011). The link between financial
performance and the voluntary departure of personnel through a measurement
scale. Business and Management Review Vol. 1(6) pp. 48 – 61.
Jha N. K., & Iyer C.K., (2006). What attributes should a project coordinator possess’?
Journal of Construction Management and Economics, 24 (9), 977-988.
Jin X.H., Doloi, H., & Gao, S.Y. (2007). Relationship-based-determinants of building
project performance in China. Journal of Construction Management and
Economics, 25, 297–304.
Kaliba, C., Muya, M., & Mumba, K. (2009). Cost escalation and schedule delays in
road construction projects in Zambia. International Journal of Project
Management, 27 (5), 522-531.
Kaming, P. F., Olomolaiye, P. O., Holt, G. D., & Harris, F. C., (1997). Factors
influencing construction time and cost overrun on high-rise projects in Indonesia.
Construction. Management Economics, 15(1), 83–94.
Kamrul, A. & Indra, G., (2010). Analysis of cost and schedule performance of
international development projects Original Research Article, International
Journal of Project Management, Volume 28, Issue 1, January 2010, Pages 68-78.
Kenya National Bureau of Statistics (KNBS), (2010), Republic of Kenya.
Kerzner H., (2006). Project Management; A Systems Approach to Planning,
Scheduling, and Controlling, Ninth ed. John Wiley & Sons, Inc., Hoboken, New
Jersey.
Khan R.A., (2008). Role of Construction Sector in Economic Growth: Empirical
Evidence from Pakistan Economy. Proceedings of the first International
Conference on Construction in Developing Countries (ICCIDC–I) titled
‘Advancing and Integrating Construction Education, Research & Practice’,
August 4-5, Karachi.
Khosravi, S. & Afshari, H., (2011). A success measurement model for construction
projects. International conference on Financial management and economics
IPEDR Vol, 11 (2011) IACSIT Press Singapore www.ipedr.com vol.11/36-
wooo14.pdf. accessed 10/08/2012.
Kimani F., Nekesa P., & Ndung’u B., (2009). Best practices in Constituency
Development Fund (CDF). A paper prepared for the collaborative centre for

182
Gende and Development and International Development Research. Available:
www.ccentregd.org. Accessed 23/08/2012.
Kimenyi K. M., (2005). Efficiency and Efficacy of Kenya’s Constituency Development
Fund: Theory and Evidence. University of Connecticut, Department of
Economics Working Paper Series. Working Paper 2005-42 April 2005.
Koushki P.A., Al-Rashid, K., & Kartam N. (2005). Delays and cost increases in
construction of private residential projects in Kuwait. Journal of Construction
Management and Economics, 23(3), 285-294.
Kratzer J. Leenders R. & Van Engelen J. (2005). Informal contacts and performance
in innovation teams. International Journal of Manpower, 26 (6), pp. 513-528.
Kylindri, S., Blanes, G., Henriksen, L., & Tanev S., (2012). Measuring Project
Outcomes: A Review of Success Effectiveness Variables. Accessed 06/06/2012.
Available http://mibes.teilar.gr/proceedings/2012/ oral/Kylindri-Blana-
Henriksen-Tanev.pdf)
Leenders, R., Th. A. J., Van Engelen, J.M.L., & Kratzer J. (2003). Virtuality,
communication, and new product team creativity: social network perspective.
Journal of Engineering and Technology Management, 20, pp. 69-92.
Le-Hoai, L., Lee, Y.D., & Lee, J.Y. (2008). Delay and cost overrun in Vietnam large
construction projects: A comparison with other selected countries. Journal of
civil engineering; 12(6): 367-377.
Lim, C.S. & Mohamed, M.Z., (1999). Criteria for project success, an exploratory re-
examination. International Journal of Project management volume 17 no. 4 pp
243-248.
Litsikakis, D., (2009). Analysis of Project Success Criteria and Success Factors: How
to maximise success in your projects using meaningful criteria and factors.
Accessed on April 23, 2011. http://knol.google.com/k/dimitrios-litsikakis/
analysis-of-project-success-criteria/3ib8exvrc87n4/4.
Long, N.D., Ogunlana, S., Quang, T., & Lam K.C., (2004). Large construction
projects in developing countries: a case study from Vietnam. International
Journal of Project Management, 22 (7), 553–561.

183
Love P.E.D, Edwards, J.D., Watson, H & Davis, P., (2010). Rework in Civil
Infrastructure Projects: Determination of Cost Predictors, Journal of construction
Engineering and management, Volume 136, Issue 3, pp. 275-282 (March 2010).
Love, P.E.D., Iran, Z. & Edwards, J.D.A. (2004). Rework Reduction Model for
Construction Projects, IEEE transactions on engineering management, vol. 51,
no. 4, November 2004.
Malhotra, N.K. & Dash, S., 2011. Marketing research: An applied orientation. 6th
edn, Prentice Hall, New Jersey.
Mapesa, B. and Kibua, T., (2006). An Assessment of the Management and Utilization
of the Constituency Development Fund in Kenya. Discussion Paper No.076/2006.
IPAR Discussion Paper Series.
Marosszeky, R.T.M., Karim, K., David, S. & McGeorge, D., (2002). The importance
of project culture in achieving quality outcomes in construction. Paper presented
at the IGLC, Brazil, 2002. Retrieved from http://www.researchgate.net/
publication/ 228796833_ The_ importance_ of_project_culture_in_achieving_
quality_outcomes_in_construction.
Medineckiene, M ,Turskis, Z. & Zavadskas, E.K., (2010). Sustainable construction
taking into account the building impact of the environ, Journal of environmental
engineering and landscape management 18 (2), 118-127.
Memon, F.H., Ismail A. R., & Ade A. A. A., (2012). Time and Cost Perfomance in
Costruction Projects in Southern and Cenrtal Regions of Penisular Malaysia.
International Journal of Advances in Applied Sciences, Vol.1, No.1, March
2012, pp. 45~52.
Miles R.L., Greer, L., Kraatz, D. & Kinnear, S., (2008). Measuring community
wellbeing: A central Queensland case study. Australasian Journal of Regional
Studies, Vol. 14 No.4.
Murali, S., & Yau Wen, S., 2007. Causes and effects of delays in Malaysian
construction industry. International Journal of Project Management 25 517–526.
National Construction Corporation (NCC) Act, (1972, Republic of Kenya.
National Taxpayers Association, (2010). Citizen’s Constituency Development Fund
Report Card for Aldai Constituency, Nandi North District. DfID, March 10,
2009, pg. 22. 07/29/2010.

184
Ngacho, C., & Das, D., (2013a). A performance evaluation framework of public
construction projects: An Empirical study of Constituency Development Fund
(CDF) Projects in Kenya, International Journal of Project Management (Under
final revision for publication).
Ngacho, C., & Das, D., (2013b). A performance evaluation framework of construction
projects: insights from literature. International Journal of Project Organisation
and Management, Vol. X, No. Y, xxxx (Accepted for publication).
Ngacho, C., & Das, D., (2012). Development of a Performance Measurement
Framework for Evaluating Constituency Development Fund (CDF) Projects in
Kenya using Confirmatory Factor Analysis. XVI Annual International
Conference of the Society of Operations Management (SOM) on Advances in
Operations and Supply chain Management, Indian Institute of Technology, Delhi,
India, December 21-23, 2012.
Ngacho, C., & Das, D., (2011). Development of a Theoretical Framework for
Performance Evaluation of Construction Projects in Developing countries. XV
Annual International Conference of the Society of Operations Management
(SOM) on Sustainable Operations Management, Indian Institute of Management
Calcutta, India, December 16-18, 2011.
Ngacho, C., Das, D., & Makori, J., (2012). Evaluation framework for construction
projects performance in Developing countries-Development from Literature
Review. African International Business and Management (AIBUMA 2012)
Conference, University of Nairobi, School of Business, July 12-13, 2012.
Ngowi, A. B., (2000). Impact of culture on the application of TQM in the construction
industry in Botswana, International Journal of Quality &Reliability Management,
17, 442-452(11).
Nidumolu, (1996). Standardization, requirements, uncertainty and software project
performance, Information & Management, Vol.31, no. 3, pp. 135-150.
Nurul, I. A. & Poh K. N. (2011). The Role of Time, Cost and Quality in Project
Management. Industrial Engineering and Engineering Management (IEEM),
IEEE International Conference on Date of Conference: 6-9 Dec. 2011.

185
Odeh, A.M., & Battaineh, H.T.,(2002). Causes of construction delay: traditional
contracts. International Journal of Project Management, 20, 67-73.
Ofori, G., (2000). Challenges for construction industries in developing countries.
Proceedings, Second International Conference of the CIB Task Group
29,Gaborone, Botswana, November, pp. 1-11.
Ogano, N. O., & Pretorius, L., (2010). Quality performance: the case of construction
projects in the electricity industry in Kenya. South African Journal of Industrial
Engineering May 2010.
Okpala D.C., & Aniekwu, A.N., (1988). Causes of high costs of constructionin
Nigeria. Journal of Construction Engineering and Management, 114 (2), 233-
244.
Olawale, Y., & Sun, M., (2010). Cost and time control of construction projects:
Inhibiting factors and mitigating measures in practice. Construction Management
and Economics, 28 (5), 509 – 526.
Omoregie, A., & Radford, D., (2006). Infrastructure delays and cost escalation:
causes and effects in Nigeria. 3rd International Built a. Human Environment
Research Week, (), 03 Apr 2006 - 07 Apr 2006.
http://www.irbnet.de/daten/icconda/CIB8964.pdf accessed 01/05/2013.
Ortega, I., (2000). Systematic prevention of construction failure. Quality Management
and Technology 2000, 9:1-13.
Ortiz, O., Castells, F. & Sonnemann, G., (2009). Sustainability in the construction
industry: a review of recent developments based on LCA. Construction and
Building Materials, 23(1), 28-39.
Othman A. A, Torrance, J. V. & Hamid A., (2006). Factors influencing the
construction time of civil engineering projects in Malaysia. Engineering,
construction and Architectural management Vol. 13 No. 5 2006 pp 481-501. pp.
171-181.
Ozorrhon, B., Arditi, D., Dikmen I., & Birgonul M. T., (2007). Effect of host country
and project conditions in international construction joint ventures. International
Journal of Project Management, 25 (2007), 799-806.

186
Palaneeswaran, E Ramanathan, M. & Tam, C., (2007). Rework in Projects: Learning
from Errors, Surveying and Built Environment Vol 18 (2), 47-58 December 2007
ISSN 1816-9554.
Patanakul, P & Milosevic, D., (2009). The Effectiveness in Managing a group of
Multiple Projects: Factors of influence and Measurement Criteria. International
Journal of Project Management. 2009, 27, 216-233.
Patrick X. W. Z., (2011). Fostering a Strong Construction Safety Culture Leadership.
Journal of Management Engineering volume 11.
Pheng, L. S.; Chuan, Q. T. (2006). Environmental factors and work performance of
project managers in the construction industry. International Journal of Project
Management 24: 24–37. doi:10.1016/j.ijproman.2005.06.001.
PMI, (2008). Guide to Project Management Body of Knowledge. Project
Management Institute, New Square, PA, USA.
Poli, M. Cosic I. & Lalic B., (2010). Project Strategy: Matching Project Structure to
Project Type to Achieve Better Success. International Journal of Industrial
Engineering and Management 1(1), pp. 29-40.
Puspasari, T.R., (2006). Factors causing the poor performance of construction
project. Masters thesis, Universiti Technologi Malaysia, Faculty of Civil
Engineering.
Ratnasabapathy, S., (2008). Exploratory Study of External Environmental Factors:
Influencing the Procurement Selection in Construction. Viewed April 27, 2011,
<http://www.bear2008.org/post/49.pdf >.
Romero, G., (2009). Decentralization, Accountability and the MPs Election. The case
of the Constituency Development Fund in Kenya. A paper publishe in Publication
for improving Institutions for the Pre-Poor growth, University of Oxford.
Accessed 23/08/2012. Available www.iig.ox.ac.uk.
Salleh, R., (2009). Critical success factors of project management for Brunei
construction projects. Improving project performance. Unpublished PhD thesis,
Faculty of Built Environment and Engineering, Queensland University of
Technology.

187
Saparauskas, J. & Turskis, Z., (2006), Evaluation of construction sustainability by
multiple criteria methods, Technological and Economic development of Economy,
12: 4, 321-326.
Saqib, M., Farooqui, R.U., and Lodi, S.H. (2008).Assessment of Critical Success
Factors for Construction Projects in Pakistan. First International Conference on
Construction In Developing Countries (ICCIDC–I) “Advancing and Integrating
Construction Education, Research & Practice” August 4-5, 2008, Karachi,,
Pakistan
Segersted, A & Olofsson, T., (2010). Supply chains in the construction industry,
Supply Chain Management: An International Journal, 15 (5), 347-353.
Shao, J. & Müller, R., (2011). The development of constructs of program context and
program success: A qualitative study. International Journal of Project
Management, Dec 2011, Volume: 29 Issue: 8 pp.947-959.
Shen, L., Tam, V., Tam, L., & Ji, Y., (2010). Project feasibility study: the key to
successful implementation of sustainable and socially responsible construction
management practice. Journal of Cleaner Production, 18 (3), 254-259.
Shenhar, A. J., Asher, T., Dov, D., Stanislav, L., & Thomas, L., (2002). Refining the
search for project success factors: A multivariate typological approach. R & D
Management, 32(2), 111–126.
Shenhar, A.J., (2001). One size does not fit all projects: Exploring classical
contingency domains. Management Science, 47 (3), 394-414.
Shenhar, A.J., Levy, O., & Dvir, D., (1997). Mapping the Dimensions of Project
Success, Project Management Journal 28, no. 2 (1997): 5-13.
Skene, M. and Shaban, R., (2002). Strategies to Avoid and Resolve Construction
Disputes. Prepared for a conference held in Vancouver, B.C. hosted by Pacific
Business & Law Institute, March 6, 2002.
Sweis, G., Sweis, R., Abu Hammad, A., & Shboul, A., (2007). Delays in construction
projects: The case of Jordan. International Journal of Project Management, 26,
665–674.
Syed, M.A. Salman,A. Pragnya, K., & Dharam G., (2003). Delays in Construction: A
Brief Study of the Florida Construction Industry. Florida International University
Miami, FL, 2003.

188
Tabish, S.Z.S., & Jha, K.N., (2011). Analysis of irregularities in public procurement
in India. Journal of Construction Management and Economics. 29(3): 261-274.
Tae- Hong, C., Sangyoon, C., Su-Won, Y., & Soon-Wook, K. (2011). A service-
oriented integrated information framework for RFID/WSN-based intelligent
construction supply chain management. Automation in Construction Volume 20,
Issue 6, October 2011, Pages 706–715.
Takim, R., Akintoye A. & Kelly J., (2004). Analysis of measures of construction
project success in Malaysia. Association of Researches in Construction
Management, Vol.2, No.9, pp. 1123-113.
Takim, R & Akintoye, A., (2002). Performance indicators for successful construction
project performance. In: Greenwood, D (Ed.), 18th Annual ARCOM Conference,
2-4 September 2002, University of Northumbria. Association of Researchers in
Construction Management, Vol. 2, 545-55.
Tan, Y Shen,L.,& Yao, H., (2011). Sustainable construction practice and contractors’
competitiveness. A preliminary study, Habitat international 35 (2011) 225-230.
Toor, S.R. &, Ogunlana S.O., (2010). Beyond the iron triangle, Stakeholder
perception of Key performance indicators (KPIs) for large-scale public sector
development projects. International journal of project management 28 (2010)
228-236.
Tsoulfas, G.T. & Pappis, C.P., 2008. A model for supply chains environmental
performance analysis and decision making, Journal of cleaner production 16
(2008) 1647-1657.
Tyson Building Corporation, (2005). Selecting Project Delivery
www.tysonbuilding.com /images/SelectingProjectDelivery.pdf. Accessed
10/03/2012.
Walker, D.H.T., (1995). An investigation into construction time performance.
Construction Management and Economics, Vol. 13 No. 3, pp. 263-74.
Wang, X. & Huang, J., (2006). The relationships between key stakeholders' project
performance and project success: Perceptions of Chinese construction supervising
engineers. International Journal of Project Management, Vol. 24, PP. 253-260.

189
Wang, Y., Wang, H. & Shee, D.Y., (2007). Measuring e-learning systems success in
an organisational context: Scale development and validation. Computers in
Human Behaviour 23 (2007) 1792-1808.
Wanjiru G., (2008). The CDF Social Audit Guide, a Handbook for Communities,
Open Society Initiative of East Africa, February 2008. http://www.soros.org/
initiatives/ osiea/articles_publications/ publications/cdf_20080201/resource_
20080808.pdf accessed 23/10/20.
Wells, J., (1986). Construction Industry in Developing Countries: Alternative
Strategies for Development. London: Croom Helm.
Westerveld, E. (2002). The project Excellence Model®
: linking success criteria and
critical success factors. International Journal of Project Management, 6: 411-
418.
Willard, B.K., (2005). Project success-a different view. Accessed May 23, 2012 from
http:// maxwideman.com/guests/ metrics/view.htm.
Williams, T., (2003). Assessing Extension of Time delays on major projects Original
Research Article, International Journal of Project Management, Volume 21,
Issue 1, January 2003, Pages 19-26.
Willis, C.J. & Rankin, J.H., (2011). Measuring the Performance of Guyana’s
Construction Industry Using a Set of Project Performance Benchmarking Metrics
Journal of Construction in Developing Countries, Vol. 16(1), 19–40, 2011
Xiao, H. & Proverbs, D. (2003) Factors influencing contractor performance: an
international investigation, Engineering Construction and Architectural
Management, 10 (5), 322-332.
Xue, X., Wang, Y., Shen, Q., & Yu, X., (2007). Coordination mechanisms for
construction supply chain management in the Internet environment. International
Journal of Project Management 25 (2007) 150–157.
Yakubu, D.M., & Bakri I.M. (2013). Evaluation of Safety and Health Performance on
Construction Sites (Kuala Lumpur). Journal of Management and Sustainability;
Vol. 3, No. 2; 2013.
Yu J.H., & Kwon H.R., (2011). Critical Success Factors for Urban Regeneration
Projects in Korea. International Journal of Project Management. 29: 889‐899.

190
Yu, A. T. W., Shen, Q., Kelly, J., & Hunter, K., (2006). Investigation of critical
success factors in Construction project briefing by way of content analysis.
Journal of Construction Engineering and Management, ASCE, 132(11), 1178-
1186.
Yung, P. & Yip, B., (2010). Construction quality in China during transition: A review
of literature and empirical examination. International Journal of Project
Management, 28 (1), 79-91.
Zhao, Z, Zuo, J, Zillante, G, & Wang, X., (2010). Critical success factors for BOT
electric power projects in China: Thermal power versus wind power. Renewable
Energy 35 (2010) 1283–1291.
Zhu, O.J., Sarkis, L., & Lai, K., (2008). Confirmation of a Measurement Model for
Green Supply Chain Management Practices & Implementation. International
Journal of Production Economics, (111), pp. 261-273.
Zuo, P.X.W., Zhang, G & Wang, J., (2007). Understanding the key risks in
construction projects in China. International Journal of Project Management. 25
(6), 601-614.

191
APPENDICES
Appendix A1: Questionnaire for Exploratory Study (Phase I)
SECTION A: PROJECT AND RESPONDENT INFORMATION
1. Contract at: .......................................Constituency......................................................
2. Type of project: Educational Health Care Industrial Estates
Agricultural Market
3. Your position on the project: Client Consultant Contractor
4. Please indicate how long you have been involved in the construction of CDF
projects?
Below 3 years 3 – 6 years over 6 years
5. Which of these indicate the average quantity of building construction projects you
handle/year in the constituency
Up to 3 projects 4–6 projects 7 – 9 projects 10 projects and above
6. Please indicate the overall value of CDF construction projects that you have
worked on in the last 3 years? Over Ksh. 15 Millions (£175,000) Ksh. 10
Million to Ksh.15 Millions (£115,000-£175,000) Up to Ksh. 10 Million
s (£115,000)
7. Please indicate the procurement approach employed for this project (please tick)
Design/Bid/Build Design/Build Competitive bid
Negotiated general contract Build–Own–Operate–Transfer
Turnkey contract
8. Project dates and cost estimate.
Contract start on site: Original contract sum
Original completion date: Approved variations:
5
1
6
4
32
1 2 3
4
1 2 3
321
431
32
1
2

192
Actual completion date: Final project cost
SECTION B KEY PERFORMANCE INDICATORS
Based on your experience associated with the current as well as other construction
projects undertaken in the past, you are kindly requested to indicate your level of
agreement with each of the following performance measurement variables on 1 to 5
point Likert scale (1=strongly disagree, 2=Disagree, 3=Indifferent, 4=Agree and
5=strongly Agree).
PERFORMANCE VARIABLES (PV) LEVEL OF
AGREEMENT
There has not been any increase in the cost of raw materials during
construction of this project.
Labour costs more or less remained stable over the period of
construction of the current project.
The project experienced minimum variations and hence hardly any
additional cost attributable to variations was incurred.
The required equipments were available at pre budgeted rates.
The amount/quantity of different type of resources required during
the implementation phase matched with those estimated during
planning stage.
There were no incidences of fraudulent practices and kickbacks
during project execution.
There were no incidences of agitation by the trade unions in the
current project.
There were no serious dispute between the client and contractor due
to non adherence to the specifications.
Disputes were observed due to the frequent changes in the design of
the current project.
Dispute resolution meetings were often held during project
execution.
At time of project completion, there were no financial claims that
remained unsettled from this project.
54321
54321
54321
54321
54321
54321
54321
54321
54321
54321
54321

193
This construction project has adversely affected the quality of
groundwater level.
All required resources for the project were delivered on time during
execution of this project.
A clear plan was formulated and an efficient planning and control
system was designed to keep the current project up-to-date.
No changes were introduced in the designs of the current during
project execution.
Harmonious relationship between labour and management existed
in the project site and hence no work disruptions were reported
during project execution.
This project has led to air pollution in the adjoining areas.
This project has led to depletion of the precious natural and mineral
resources in the surrounding areas.
There has been an increase in solid waste due to the construction of
the current project.
Accidents were often reported during project construction.
Near misses occurred quite often during construction.
Fatalities did occur on this project during construction.
The construction work utilised environmentally friendly
technology.
This project has led to the increased release of toxic material.
No delays were experienced in securing funds during project
implementation.
At the time of handover, the current project was free from apparent
defects
The project contractors were often called back during the Defects
Liability Period to repair defects.
Weather and climatic conditions did not have much impact on
delaying the project.
The current project has utilised reusable and recyclable materials in
construction work.
54321
54321
54321
54321
54321
54321
54321
54321
54321
54321
54321
54321
54321
54321
54321
54321
54321
54321

194
The right material was used for the construction work.
Employees working in the current project possessed requisite skills
and most of them had worked on similar kinds of projects in the
past.
A sound quality management system was strictly adhered to during
project execution phase of the current project.
Training was imparted to the workers in order to develop a positive
attitude and also to enable them to apply the right method of work.
All stakeholders associated with the current project supervised the
quality of the project in all its phases.
Proper medical facilities were available for people working on the
project.
SECTION C. FACTORS AFFECTING SUCCESS OF CDF FUNDED
CONSTRUCTION PROJECTS.
This section seeks to determine the factors that affect the performance of construction
projects. On basis of the project you were involved with, you are kindly requested to
indicate your level of agreement with each of the following project success variables on 1 to
5 point Likert scale (1=strongly disagree, 2=Disagree, 3=Indifferent, 4=Agree and 5=strongly
Agree).
SUCCESS VARIABLES (SV) AGREEMENT
The location and Site conditions did not affect the construction of this
project.
Design Complexity of project (Type, size, nature and number of
floors) has influenced the project cost and time.
Project planning, Scheduling and control were adequately done on
this project.
The client secured necessary funds for the project and hence there
were no delays in material acquisition and payments to contractor.
The client got the design documents approved on time for this
project.
The client had adequate experience on similar kind of projects.
54321
54321
54321
54321
54321
54321
54321
54321
54321
54321
54321
54321

195
Information sharing and collaboration among project participants
were adequate in the current project.
The construction work adhered to the requisite Quality standards.
Continuous monitoring of actual expenditures and project schedules
and their comparison with the budget was done regularly.
There was a formal organization structure for dispute resolution
within the project organization.
Site Managers possessed requisite skills necessary for the kind of
projects executed.
The contractor had adequate technical skills and experience on
similar type of projects.
The contractor used latest construction methods in the current project.
The community did not raise any social, political or cultural issues
against construction of the current project.
The project execution was adversely affected by the surrounding
weather and climatic conditions.
Macro- economic conditions (such as interest rates, inflation) did not
significantly affect the execution of this project.
The project was affected by the Governance policy of the relevant
government agencies which has a bearing on the project performance.
The consultant was highly committed to ensuring construction work
according to design specifications.
There were adequate designs, specifications and documentations for
the use of contractor.
The client emphasized on completing the current project very fast
without any reference to quality.
The client tended to purchase construction materials at cheaper rate
which led to the dilution of other project objectives.
No variations in original design took place in the current project
during construction phase.
The level of technological sophistication considered in the project
was satisfactory.
There were no incidences of disagreements resulting from industrial
54321
54321
54321
54321
54321
54321
54321
54321
54321
54321
54321
54321
54321
54321
54321
54321
54321
54321

196
relations prevailing at the time of project implementation.
The physical and ecological conditions surrounding the project were
favourable to project execution.
There were very few internal procurement challenges
The client’s decisions were timely and objective.
Right equipments were available in the construction site of this
project.
The project faced stringent insurance and warranty contractual
requirements.
Working capital was adequate.
54321
54321
54321
54321
54321
54321

197
Appendix A2: Questionnaire for Confirmatory Study (Phase II)
Section A: Project and Respondent information
1. Contract at: .......................................Constituency......................................................
2. Type of project: Educational Health Care
Industrial estate Agricultural Market
3. Your position on the project: Client Consultant Contractor
4. Please indicate how long you have been involved in the construction of CDF
projects?
Below 3 years 3 – 6 years over 6 years
5. Which of these indicate the average quantity of building construction projects you
handle/year in the constituency
Up to 3 projects 4–6 projects 7 – 9 projects 10 project and above
6. Please indicate the overall value of CDF construction projects that you have
worked on in the last 3 years? Over Ksh. 15 Millions (£175,000) Ksh. 10
Million to Ksh.15 Millions (£115,000-£175,000) Up to Ksh. 10 Million s
(£115,000)
7. Please indicate the procurement approach employed for this project (please tick)
Design/Bid/Build Design/Build Competitive bid Negotiated general
contract Build–Own–Operate–Transfer Turnkey contract.
8. Project dates and cost estimate.
Contract start on site: Original contract sum
Original completion date: Approved variations:
Actual completion date: Final project cost
5
1
6 4
32
1 2
3 4
1 2 3
321
431
32
1
2

198
Section B Performance measurement variables amongst CDF Construction
Projects
Based on your experience associated with the current as well as other construction
projects undertaken in the past, you are kindly requested to indicate your level of
agreement with each of the following performance measurement variables on 1 to 5
point Likert scale (1=strongly disagree, 2=Disagree, 3=Indifferent, 4=Agree and
5=strongly Agree).
PERFORMANCE VARIABLES (PV) LEVEL OF AGREEMENT
Time Performance Factor (7)
TPV1: Timely delivery of resources
TPV2: Harmonious relationship on site.
TPV3: A clear plan was formulated.
TPV4: No delays in securing funds.
TPV5: No effect of weather and climatic conditions.
TPV6: No design changes.
TPV7: At handover there were no apparent defects
Cost Performance Factor (6)
CPV1: Equipments at pre budgeted rates.
CPV2: Stable labour costs
CPV3: No increase materials cost
CPV4: Minimum variations cost were incurred
CPV5: Adverse effect on quality of groundwater level.
CPV6: No financial claims at completion.
Site Dispute Performance Factor (4)
DPV1: No serious dispute due to specifications.
DPV2: Disputes due to the frequent changes
DPV3: No incidences of trade union agitation
DPV4: Dispute resolution meetings
Environmental Impact Performance Factor(4)
EPV1: Project has led to air pollution.
EPV2: Increased solid waste.
EPV3: Utilised environmentally friendly technology.
54321
54321
54321
54321
54321
54321
54321
54321
54321
54321
54321
54321
54321
54321
54321
54321
54321
54321
54321
54321

199
EPV4: Project has led to depletion natural resources.
Quality Performance Factor (3)
QPV1: Right material was used for the construction work.
QPV2: A sound QMS adhered to.
QPV3: Workers were trained on positive attitudes
Safety Performance Factor (3)
SPV1: Accidents were reported.
SPV2: Fatalities did occur.
SPV3: Near misses occurred.
SECTION C. FACTORS AFFECTING SUCCESS OF CDF FUNDED
CONSTRUCTION PROJECTS.
This section seeks to determine the factors that influence the success of CDF
construction projects. These factors have been categorised under six heads; Project
related, client related, consultant related, contractor related, supply chain related and
External environment related factors. On basis of the project you were involved in,
you are kindly requested to indicate your level of agreement with each of the following
project success variables on 1 to 5 point Likert scale (1=strongly disagree, 2=Disagree,
3=Indifferent, 4=Agree and 5=strongly Agree).
PROJECT SUCCESS VARIABLES (SV) LEVEL OF AGREEMENT
Project Related Factor (7)
PSV1: Influence of Design Complexity.
PSV2: Adhered to the requisite Quality standards.
PSV3: Continuous monitoring of actual expenditures.
PSV4: Formal dispute resolution structures.
PSV5: Effect of location and Site conditions.
PSV6: Adequate Information sharing and collaboration.
PSV7: Adequate Project planning and, Scheduling.
Client related factor(5)
CSV1: Adequate experience on similar projects.
CSV2: Cheap materials were used.
CSV3: Project funds secured on time.
54321
54321
54321
54321
54321
54321
54321
54321
54321
54321
54321
54321
54321
54321
54321
54321
54321

200
CSV4: Client’s emphasis on time rather than quality.
CSV5: Design documents approved on time.
External environment related factor (6)
ESV1: Community had no issues against the project.
ESV2: Adversely affected by the surrounding weather.
ESV3: Effect of the Governance policy.
ESV4: Favourable physical and ecological conditions.
ESV5: Effect of Macro- economic conditions.
ESV6: No incidences industrial unrests.
Supply chain related factor (3)
LSV1:Few internal procurement challenges
LSV2: Right equipments were available.
LSV3: Effect of stringent insurance/warranty rules.
Consultant related factor (3)
SSV1: No variations were incorporated.
SSV2: Adequate designs/specifications/documentations.
SSV3: Adequate consultant committed to project.
Contractor related factor (3)
RSV1: Site Managers possessed requisite skills.
RSV2: Contractor had adequate technical skills.
RSV3: Contractor used latest construction methods.
54321
54321
54321
54321
54321
54321
54321
54321
54321
54321
54321
54321
54321
54321
54321
54321
54321