an assessment of the performance and management of
TRANSCRIPT

An Assessment of the Performance and Management of Advanced Onsite Systems
in FloridaElke Ursin
Environmental Health Program Consultant
11/19/2013

2
Onsite sewage systems in Florida
There are approximately
2.6 million onsite sewage
systems in Florida

Florida Department of Health
Statewide rule
implemented by
67 county offices
3
“Advanced Systems”• Aerobic Treatment Units (ATUs)
• Performance-based Treatment Systems (PBTS)
• Innovative Systems
4

Management Levels1. Homeowner Awareness2. Maintenance Contracts3. Operating Permits4. Responsible Management
Entity (RME) Operation and Maintenance
5. RME Ownership
5

How are these systems working?• What are the options?
• How effective are they?
• How are systems working day-to-day?
• How are these systems perceived?
6

EPA Nonpoint Source Pollution program funding - Section 319(h)
7

Project Objectives1. Inventory system number, types, and locations 2. Assess operational status of systems 3. Quantify reduced loading of contaminants from
systems4. Survey perceptions of user groups 5. Determine consistent assessment of systems6. Identify best management practices
8

Project Objectives1. Inventory system number, types, and locations 2. Assess operational status of systems 3. Quantify reduced loading of contaminants from
systems4. Survey perceptions of user groups 5. Determine consistent assessment of systems6. Identify best management practices
9

Where are the advanced systems?
10
There are approximately
12,000 advanced systems in
Florida
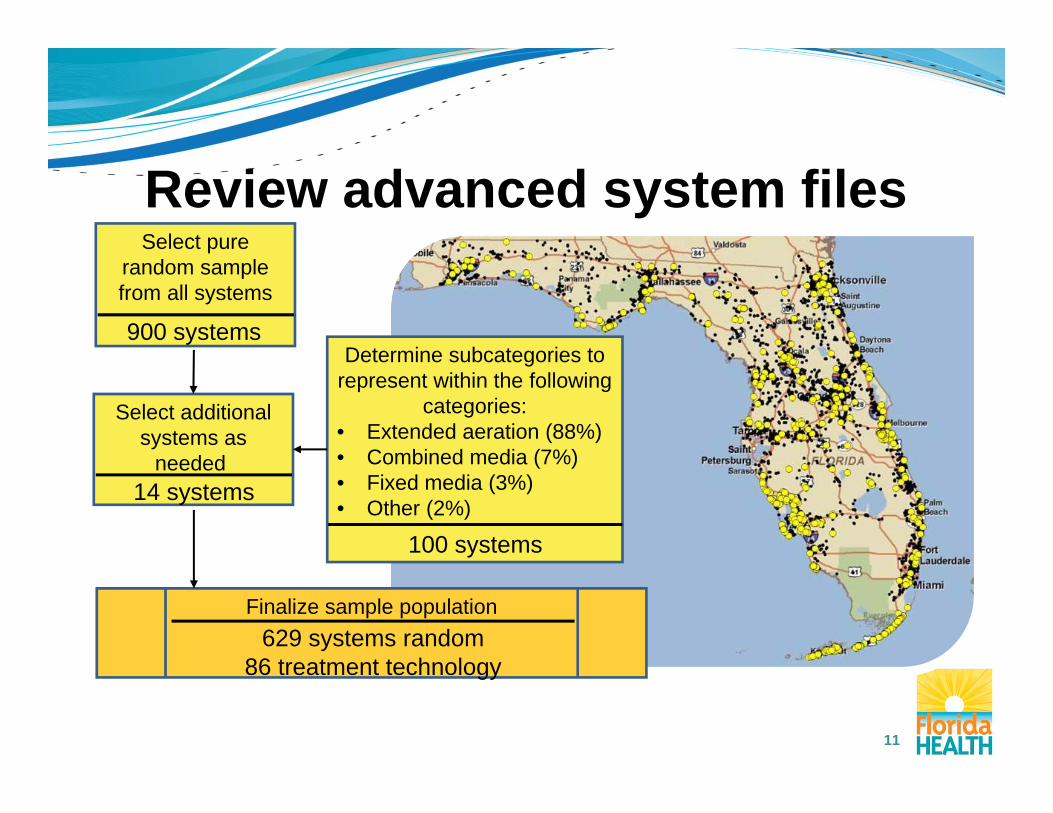
Review advanced system files
11
Select pure random sample from all systems
Select additional systems as
needed
Determine subcategories to represent within the following
categories:• Extended aeration (88%)• Combined media (7%)• Fixed media (3%)• Other (2%)
Finalize sample population
900 systems
14 systems
100 systems
629 systems random86 treatment technology

Treatment technology manufacturers
12
27%
15%
11%11%
10%
9%
4%
4%2%
2%2%1%1%1% Consolidated
Aqua-Klear
Hoot
Norweco
Clearstream
Delta
Bio-Microbics
H.E. McGrew
Other (Combined Total of 14Manufacturers with Total Under 100)Jet
Earthtek
Acquired Wastewater Technologies
American Wastewater
Ecological Tanks, Inc.

Construction information• Most for new homes
• 300 gallons per day (gpd) flow / 500 gpdtreatment capacity
• 65% have drainfield sidewalls extending above natural grade
13
Mineral aggregate,
28%
Chamber systems,
24%
Drip irrigation systems,
15%
Multi-pipe rockless systems,
15%
Other, 18%

Project Objectives1. Inventory system number, types, and locations 2. Assess operational status of systems 3. Quantify reduced loading of contaminants from
systems4. Survey perceptions of user groups 5. Determine consistent assessment of systems6. Identify best management practices
14

Sampling protocolThree groups of measurements:
1. Initial system assessment
2. System operation evaluation
3. Sample analysis
15

16
Sampling team
50 systems visited
71 systems visited
120 systems visited
140 systems visited
166 systems visited

Initial system evaluation• Power is on
• No sewage on the ground
• Aeration occurring
• Alarms are off
• Changes to site conditions
17

The exception!

19
Vacancy and system operation(all randomly selected visited systems)
Occupancy Status
Switched off
Power indicator off Aeration off
Vacant (n=89) 54% 54% 59%
Non-Vacant (n=445) 6% 17% 14%

20
Issues for non-vacant systemsn=454 non-vacant systems based on permit review
# of non-operational systems = 127 (28%)Reason for non-
operational status Number Percent of total non-operational
systems Power switched off 54 43%
Power indicator off 79 62%
Aeration not working 73 57%
Sanitary nuisance 20 16%
Alarm issue 19 15%
Project Objectives1. Inventory system number, types, and locations 2. Assess operational status of systems 3. Quantify reduced loading of contaminants from
systems4. Survey perceptions of user groups 5. Determine consistent assessment of systems6. Identify best management practices
21

Sampling
22
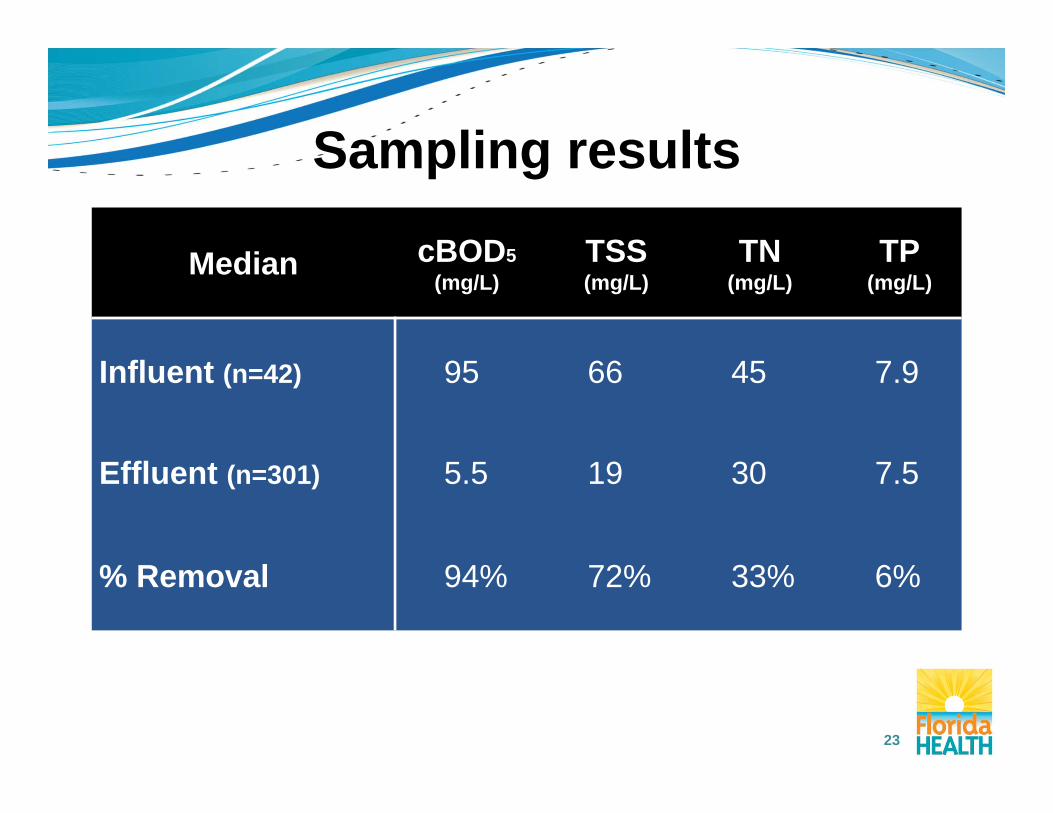
Median cBOD5(mg/L)
TSS(mg/L)
TN(mg/L)
TP(mg/L)
Influent (n=42) 95 66 45 7.9
Effluent (n=301) 5.5 19 30 7.5
% Removal 94% 72% 33% 6%
Sampling results
23
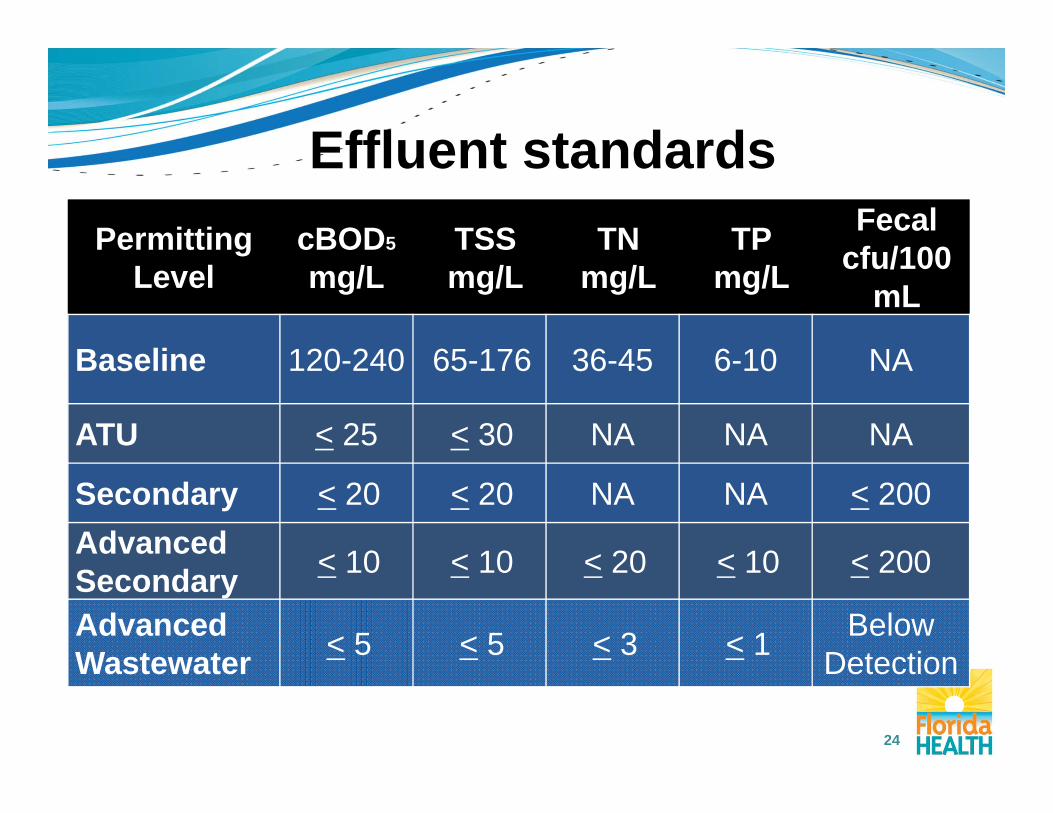
PermittingLevel
cBOD5
mg/LTSSmg/L
TNmg/L
TPmg/L
Fecalcfu/100
mL
Baseline 120-240 65-176 36-45 6-10 NA
ATU < 25 < 30 NA NA NA
Secondary < 20 < 20 NA NA < 200Advanced Secondary < 10 < 10 < 20 < 10 < 200
Advanced Wastewater < 5 < 5 < 3 < 1 Below
Detection
Effluent standards
24

Treatment standard exceedances
25
System Type cBOD5 TSS TN TP Fecal
PBTS (random) 37%(n=30)
50%(n=30)
70%(n=23)
28%(n=18)
50%(n=4)
PBTS (other) 36%(n=22)
50%(n=22)
93%(n=14)
42%(n=12)
88%(n=8)
ATU (random) 22%(n=267)
36%(n=275) NA NA NA
ATU (other) 14%(n=7)
25%(n=8) NA NA NA

Comparison of results aerating and non-aerating systems
Parameter Influent n=42
Aeratingn=237
Non-Aeratingn=42
Result % Removal Result % Removal
cBOD5 (mg/L) 95 4.6 95% 38 60%
TSS (mg/L) 66 18 73% 23 65%
TN (mg/L) 45 29 36% 47 -4%
TKN (mg/L) 45 4.9 89% 42 8%
TP (mg/L) 7.9 7.3 7% 8.7 -10%
26

Field screening of samples• Option to perform in situ sample screening
• Saves expense of sample analysis
• Results were favorable for:
• Apparent color & turbidity (cBOD5 & TSS) • Nitrate (nitrate+nitrite)• Ammonia (TKN)
27

Variability of performance• Repeat visits to sites
• Influent and effluent results stay within a factor of two
• Variations in loading influence both influent and effluent
• Variability does not affect treatment effectiveness estimates
28

Project Objectives1. Inventory system number, types, and locations 2. Assess operational status of systems 3. Quantify reduced loading of contaminants from
systems4. Survey perceptions of user groups 5. Determine consistent assessment of systems6. Identify best management practices
29

Survey of stakeholders• Homeowners
– 3,800 surveys sent– 660 completed surveys (17%)– Most from full-time residents with the system– Most systems served less than 4 people
• Maintenance entities, installers, engineers, manufacturers
• Florida Department of Health at County Offices
30

• Pump failures• Electrical
problems• Faulty alarms• Bad motors
Homeowner reported problems
No problems
55%1-2
problems34%
Several problems
11%
31
Most were mechanical:

Homeowner satisfaction
38%
41%
11%
10%Very satisfiedSatisfiedDissatisfiedVery dissatisfied
32
How would you describe your overall satisfaction with your advanced onsite sewage system (septic system)?

Overall perception of treatment performance
0% 20% 40% 60%
Excellent
Good
Fair
Poor
No Basis to Judge
EngineersMaintenance EntitiesInstallersRegulators
33

Project Objectives1. Inventory system number, types, and locations 2. Assess operational status of systems 3. Quantify reduced loading of contaminants from
systems4. Survey perceptions of user groups 5. Determine consistent assessment of systems6. Identify best management practices
34

Permitting violations requiring enforcement (n=262)
47%
39%
9%
3% 1% 1% Expired MaintenanceAgreementExpired OperatingPermitSystem Not WorkingProperlyFailure to ConductInspectionsSampling NotPerformedOther
35

Current paperwork+
Regular inspections=
Satisfactory system operation=
Sample results meet standards
36

Monitoring protocol• Up-to-date paperwork • Field evaluation to check:
• Power/on • No alarms on• Aeration on – bubbles and mixing• No sewage on the ground
• Good as-built drawing: show sample location• Easy access to treatment units• Clear and consistent sampling requirements• Regular inspections
37

Project Objectives1. Inventory system number, types, and locations 2. Assess operational status of systems 3. Quantify reduced loading of contaminants from
systems4. Survey perceptions of user groups 5. Determine consistent assessment of systems6. Identify best management practices
38

What is a “best” management practice?
1. Complete, accurate, and current documentation
2. System operating conditions
3. System sampling results
4. User group recommendations
39

Major categories of BMPs1. Recordkeeping practices
2. System maintenance practices
3. Enforcement practices
4. Fiscal practices
5. Communication practices
40
Recordkeeping practices1. Central data location
2. Complete and accurate system file
3. Recording sample/performance information
4. Synchronization between data sources
5. Online billing system
41

System maintenance practices1. Increased homeowner awareness/education
2. Statewide standardized form with maintenance and inspection requirements
3. Quality maintenance inspections performed routinely
4. Access to system interior and monitoring locations
42

System maintenance practices (continued)
5. Access to appropriate equipment for inspections6. Sufficient access to resources7. Clear monitoring/sampling requirements8. Notification of system malfunctions9. Consistency between regulator and maintenance
entity10.Keep track of vacant properties
43

Enforcement practices1. Effective, standardized, and consistently applied
enforcement procedure2. Document systems in property records3. Consistent pre-notification for payments4. Standard timeframe for non-compliance letters5. Build relationships between regulators and local
government6. Simplify the current rule
44

Fiscal practices1. Ensure adequate staffing
2. Reduce cost of systems
3. Adjust payment schedules
• installment billing
• automatic payments
45
Communication practices1. Training and education for all user groups
2. Open communications between user groups
46
Recommendations
47
1. Continue analyzing data
2. Implement database and website enhancements
3. Develop statewide standardized form
4. Evaluate low cost and effective nutrient reduction technologies
Recommendations (continued)
48
5. Develop a homeowner awareness and education campaign
6. Select a pilot county to implement the best management practices
7. Standardize enforcement procedures
8. Conduct workshops to discuss BMPs

What’s next?
49
Florida Department of HealthResearch Review
and Advisory Committee

Florida Onsite Sewage Nitrogen Reduction Strategies Study
Study cost-effective ways to reduce nitrogen from onsite wastewater treatment systems
Original image source:http://www.bgs.ac.uk/science/landUseAndDevelopment/images/urban_geoscience/suds/soakaway.jpg
50

Thank you!Elke Ursin
850-245-4444 x [email protected]
http://www.floridahealth.gov/healthy-environments/onsite-sewage/research
Division of Disease Control & Health Protection
11/19/2013