an assessment of the highway inventory data collection ...docs.trb.org/prp/15-2403.pdf · an...
TRANSCRIPT
An Assessment of the Highway Inventory Data Collection Method Using Photo/Video Logging
Mohammad Jalayer* Ph.D. Graduate Student, Dept. of Civil Engineering
Auburn University, Auburn, AL 36849-5337 Phone: +1-312-351-4730
Shunfu Hu Professor, Dept. of Geography
Southern Illinois University Edwardsville, Edwardsville, IL 62026-1800 Phone: +1-618-650-2281
Huaguo Zhou Associate Professor, Dept. of Civil Engineering
Auburn University, Auburn, AL 36849-5337 Phone: +1-334-844-1239, Fax: +1-334-844-6290
Rod E. Turochy Associate Professor, Dept. of Civil Engineering
Auburn University, Auburn, AL 36849-5337 Phone: +1-334-844-6271, Fax: +1-334-844-6290
*Corresponding Author
Word Count = 3,690 (Text) + 250×11 (Tables and Figures) =6,440
A Paper Submitted for Presentation at the 94th Transportation Research Board Annual Meeting

Jalayer, Hu, Zhou, and Turochy 2
ABSTRACT 1 For many years, state departments of transportation (DOTs) and local agencies have collected 2
and maintained highway inventory data (HID) in order to assist the decision-makers at different 3
levels. In light of the implementation of the Highway Safety Manual (HSM) in 2010, many state 4
DOTs have sought to tailor the various safety measures and functions to evaluate the safety in 5
their jurisdictions; however, insufficient HSM-required HID in many current DOT’s databases 6
necessitating the collection of the absent features. In order to obtain these data, various 7
techniques for different purposes have been utilized, including field inventory, photo/video log, 8
integrated GPS/GIS mapping systems, aerial photography, satellite imagery, terrestrial laser 9
scanners, airborne LiDAR, and mobile LiDAR. Among many data collection methods, the 10
photo/video log is widely employed by DOTs due to its simplicity and low cost; therefore, the 11
focus of this manuscript, which is a timely and needed research, is to evaluate the capability of 12
the photo/video logging method to collect HID for supporting HSM implementation through a 13
comprehensive literature review, a nationwide survey, and a field trial. The results of this study 14
demonstrated that the photo/video log can provide worthy and relevant HSM datasets with 15
acceptable accuracy. 16
17
Keywords: Highway Inventory Data (HID), Highway Safety Manual (HSM), Photo/Video Log 18
Method, Data Collection 19
Jalayer, Hu, Zhou, and Turochy 3
INTRODUCTION 1 The Highway Safety Manual (HSM), released in 2010, assists state department of transportations 2
(DOTs) and local agencies to evaluate roadway safety performance at planning, design, 3
construction, and operation stages. The manual provides predictive models for three types of 4
facilities, including [1] rural two-lane, two-way roads, [2] rural multilane highways, and [3] 5
urban and suburban arterials (1). In order to implement these models, collection of all the 6
necessary information along the roadways, which is time-consuming and often requires 7
significant cost, is imperative. As of today, many different data collection techniques are being 8
used by state DOTs and local agencies including, but not limited to, field inventory, photo/video 9
log, integrated Global Positioning System (GPS)/Geographic Information Systems (GIS) 10
mapping systems, aerial photography, satellite imagery, airborne Light Detection and Ranging 11
(LiDAR), terrestrial laser scanners, and mobile LiDAR. The difference between these methods is 12
associated with the demanded efforts for data collection as well as data reduction. The major task 13
is to match the data collection techniques to highway inventory applications. It is not clear which 14
of these methods or any combination of them is capable of efficiently collecting required data 15
while minimizing costs and safety concerns. Presently, however, among aforementioned data 16
collection techniques, the photo/video log is rapidly employed by state DOTs due to less data 17
collection effort and associated cost than other methods. The video log process moves the 18
inventorying practice from the field into the office. 19
The focus of this study is to evaluate the capability of the photo/video logging method to 20
collect highway inventory data (HID) for supporting HSM implementation. In doing so, a 21
nationwide web-based survey was developed and sent to all the state DOTs to gather their 22
opinions toward the photo/video log method and their perception of which features are collected 23
via this method. Field trials were also conducted to recognize the pros and cons of the 24
photo/video log to gather related HSM-required datasets. By virtue of the fact that many state 25
DOTs are currently redesigning their asset management plans to meet Moving Ahead for 26
Progress in the 21st Century (MAP-2) requirements, which proactively address safety concerns, 27
the outcomes of this research effort may provide a resource for saving money and time. 28
29
RESEARCH BACKGROUND 30
HSM-related Highway Inventory Data 31
In the HSM, highway safety performance functions (SPFs) estimate the average crash frequency 32
for roadway segments and intersections based on roadway characteristics (i.e., length) and traffic 33
conditions (i.e., Average Annual Daily Traffic [AADT]). This estimation is accomplished by 34
categorizing all the facilities into three groups including rural two-lane roadways, rural multi-35
lane highways, and urban and suburban arterials. Each of these facilities has their own uique 36
inputs. Tables 1 and 2 summarize the required input data for the predictive models in the HSM. 37
The check marks indicate the required variables for roadway segments and intersections. 38
39

Jalayer, Hu, Zhou, and Turochy 4
TABLE 1 Highway Inventory Data Required for Road Segments in the HSM (1) 1
Variables Rural Two-lane, Two-way Roads
Rural Multilane Highways
Urban and Suburban Arterials
Number of through lanes Lane width Shoulder width Shoulder type Presence of median Median width Presence of passing lane Presence of rumble strips Presence of two-way left-turn lane (TWLTL) Driveway density Number of major/minor commercial driveways Number of major/minor residential driveways Number of major/minor industrial/institutional driveways
Number of other driveways Horizontal curve length Horizontal curve radius Horizontal curve superelevation Presence of spiral transition Grade Roadside hazard rating (RHR) Roadside slope Roadside fixed object density/offset Percent of length with on-street parking Type of on-street parking Presence of lighting Presence of auto speed enforcement
2 TABLE 2 Highway Inventory Data Required for Intersections in the HSM (1) 3
Variables Rural Two-lane, Two-way Roads
Rural Multilane Highways
Urban and Suburban Arterials
Number of intersection legs Number of approaches with left-turn lane(s) Number of approaches with right-turn lane(s) Intersection skew angle Presence of lighting Pedestrian volume/lane Number of bus stop within 1000 ft. Number of alcohol sales within 1000 ft. Presence of schools within 1000 ft.
4
To date, many of these variables have already been or are routinely collected by state 5
DOTs and are available in their highway inventory databases. Nevertheless, in many states, there 6
is a lack of worthy highway databases that include all the required variables as inputs for the 7
HSM predictive models. The current Illinois Department of Transportation (IDOT) databases 8
contain a number of roadside information collection requirements, such as roadside fixed objects, 9
their density and offset to the edge of travel, and RHR. The latter is a subjective measure, which 10
is categorized in seven different categories, to characterize the potential hazard related to 11
roadside environment. The main contribution of this study is the evaluation of the capabilities/ 12
Jalayer, Hu, Zhou, and Turochy 5
incapabilities of the photo/video log method to collect the absent information in the most 1
economical and effective way. Given that these features are also missing in many state DOTs 2
databases, the findings of this study are valuable in providing guidance for other states. 3
4
Review of Photo/Video Logging Method 5
HID collection methods can be broadly categorized in two groups: land-based and air- or space-6
based methods. The photo/video logging method almost falls more closely under the first group, 7
land-based, while taking advantages of GPS and imaging technology. In this method, a vehicle 8
drives along the roadway while automatically recording photos/videos that can be examined later 9
to extract required information. Short field data collection time and less exposure to traffic are 10
two major advantages; however, the inability to measure feature dimensions and the need for 11
large data reduction efforts are some disadvantages of the photo/video logging method. Maerz 12
and McKenna (1999) conducted a study to collect data on objects, features, structures, and 13
landmarks along the highways using a high-speed multifunction vehicle equipped with a video 14
system (2). The results revealed that this technology not only was safe for the survey crew but 15
also was fast in data collection. A relative comprehensive dataset, including signs and their 16
positions, guiderails, bridges, cables, and slopes, can be collected using this method and then 17
stored in a database or even in GIS database. 18
Another study, sponsored by the Iowa Department of Transportation (3), concentrated on 19
collecting roadside features using mobile digital cameras. Through this research, three-20
dimensional locations of roadside features were captured without the necessity of ground control. 21
The locations of features could be extracted by relative cameras’ exposure locations via GPS. 22
The results demonstrated the capability of this method to collect features, such as road edges and 23
utility poles with a relative accuracy of two inches. The National Cooperative Highway Research 24
Program (NCHRP) conducted research to develop an image processing algorithm to enhance the 25
roadside sign data collection process (4). Since collecting data on roadside signs is time-26
consuming, costly, and in some ways unsafe, using video log images equipped with this 27
recognition algorithm can provide significant assistance. In an attempt to create an automated 28
road sign inventory system using stereo and tracking, Wang et al. (2010) collected and analyzed 29
a research site in Fayetteville, Arkansas. The detailed investigation selected 26 out of 52 signs on 30
the site for the road test. The results indicated that the required dataset could be gathered with 31
acceptable accuracy (5). 32
The Institute of Critical Technologies and Applied Science (ICTAS) at Virginia Tech. 33
sponsored a study to evaluate a novel video-based recognition technology to collect DOT-34
required asset inventories (6). Using the videos recorded from the mounted camera on the 35
vehicle, an algorithm was developed to automatically recognize the roadside features. Like other 36
studies, the results of research demonstrated the capability of this method in collecting roadside 37
features with reasonable accuracy. 38
Based upon a comprehensive literature review (2-19), it can be noted that although there 39
is a considerable number of studies on the photo/video log method, none of them have solely 40
focused on supporting HSM implementation. Moreover, it is not obvious to what extent this 41
method has been employed by various state DOTs. Such valuable information might provide 42
other state DOTs and local agencies a guideline to better understand what kinds of information 43
can be gathered through photo/video logging to prepare adequate HSM-required road inventory 44
datasets. 45
Jalayer, Hu, Zhou, and Turochy 6
SURVEY DATA COLLECTION AND ANALYSIS 1 In many states, there is a lack of statewide that include all the required variables as inputs for the 2
HSM predictive models. On the other hand, many state DOTs do have road inventory databases 3
that provide some data elements that can be used in the HSM predictive models. In order to gain 4
understanding of the implementation status of various HID collection methods and their pros and 5
cons, a web-based survey was developed and sent to 50 state and seven Canadian provinces. The 6
respondents were asked to mark their primary data collection methods and their views in terms 7
of time, cost, safety, data storage requirements, and accuracy. Particularly, roadside objects and 8
roadside slopes, for the purpose of this study, were addressed in the proposed survey. The 9
roadside features included: bridge rails, fence, fire hydrants, glare screen, guardrails, impact 10
attenuators, jersey barriers, junction boxes, lighting, luminaries, milepost, paddles, signs, rock 11
outcropping, sign support, signals, trees, tree groupings, utility poles, and walls. 12
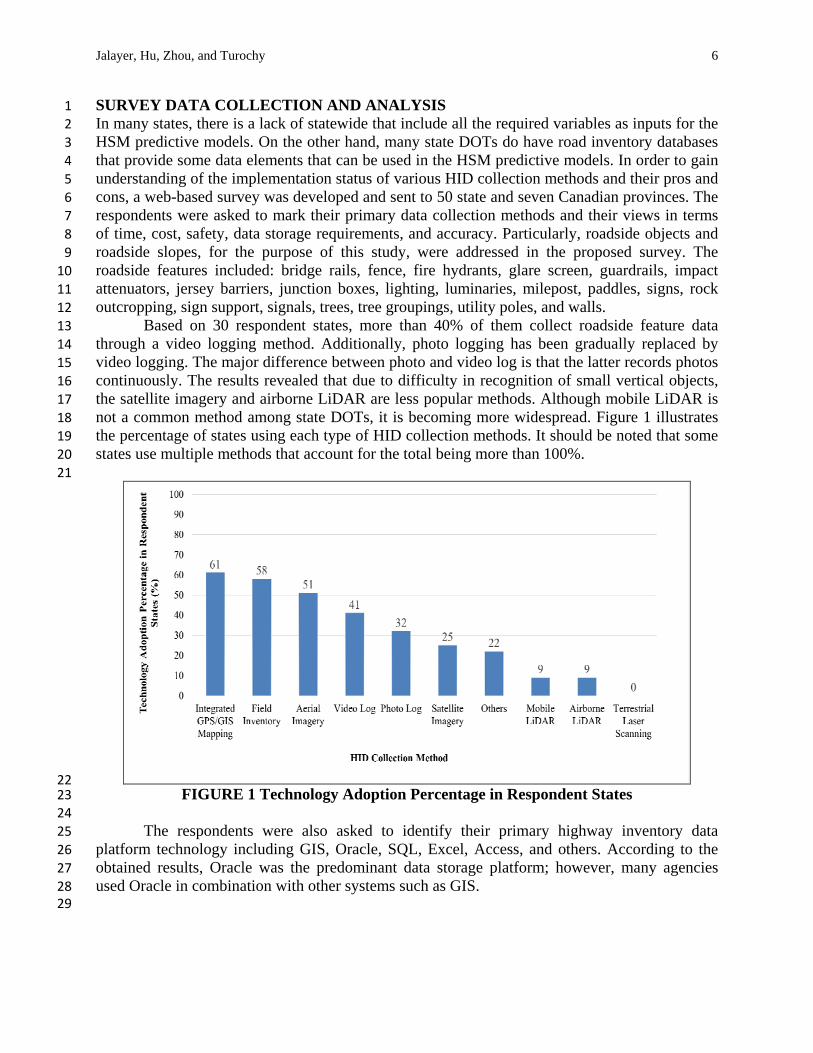
Based on 30 respondent states, more than 40% of them collect roadside feature data 13
through a video logging method. Additionally, photo logging has been gradually replaced by 14
video logging. The major difference between photo and video log is that the latter records photos 15
continuously. The results revealed that due to difficulty in recognition of small vertical objects, 16
the satellite imagery and airborne LiDAR are less popular methods. Although mobile LiDAR is 17
not a common method among state DOTs, it is becoming more widespread. Figure 1 illustrates 18
the percentage of states using each type of HID collection methods. It should be noted that some 19
states use multiple methods that account for the total being more than 100%. 20
21
22 FIGURE 1 Technology Adoption Percentage in Respondent States 23
24
The respondents were also asked to identify their primary highway inventory data 25
platform technology including GIS, Oracle, SQL, Excel, Access, and others. According to the 26
obtained results, Oracle was the predominant data storage platform; however, many agencies 27
used Oracle in combination with other systems such as GIS. 28 29

Jalayer, Hu, Zhou, and Turochy 7
1
FIGURE 2 Percentage Use of Each Data Storage Platform in Respondent States 2 3
To further investigate the capability of each data collection method to gather roadside 4
features, the respondents were requested to specify those features collected using each applied 5
method, indicating that guardrails, shoulders, and mileposts signs are the most predominant 6
objects collected. Among the roadside features, the photo/video log has the ability to collect all 7
the roadside features except side slope and curvatures characteristics. Notably, less than 10 8
percent of states collected roadside slope and curvature alignments. Along with data collection 9
methods, data storage platforms, and types of data collected, the survey respondents were asked 10
to indicate their level of satisfaction with their primary collection method using a scale of 1 to 5 11
(representing unacceptable, fair, good, very good, and excellent, respectively). Based on the nine 12
satisfaction indicators used in this study as shown in Table 3, most states expressed their level of 13
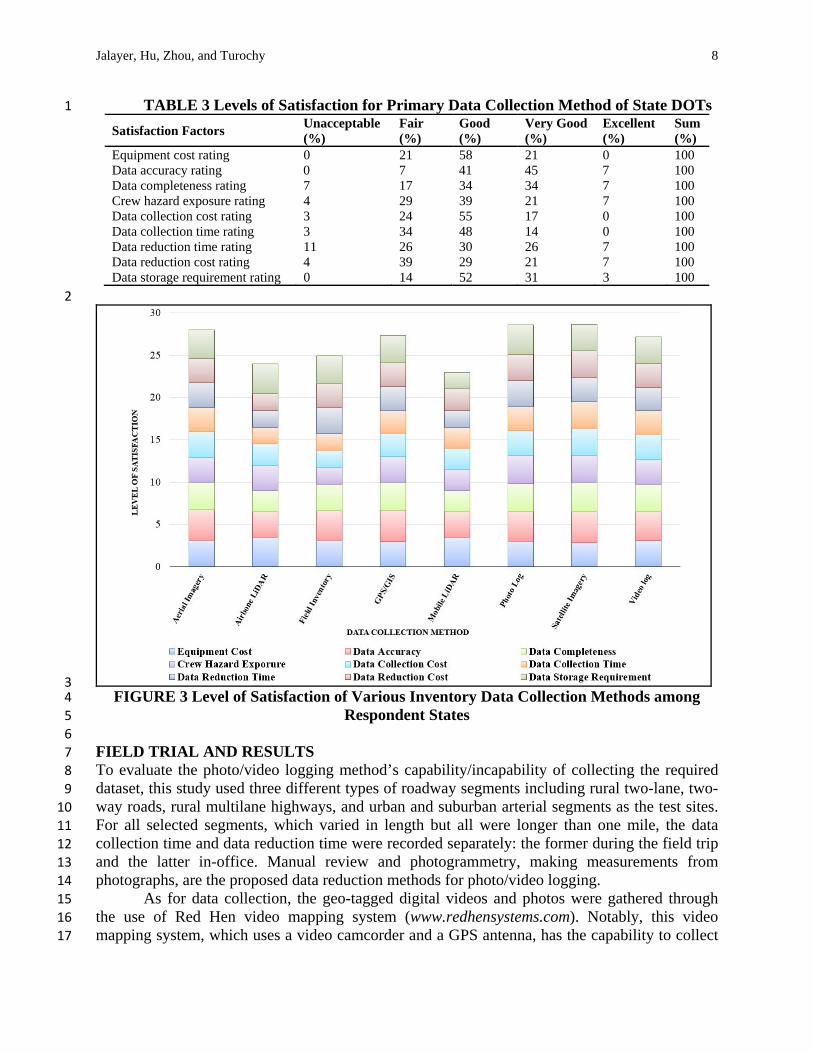
satisfaction as “good” for the primary data collection methods. More specifically, Figure 3 14
illustrates the detailed information toward the different levels of satisfaction for the primary data 15
collection method among respondent states. 16
Based on Figure 3, the photo log, the satellite imagery, and the aerial imagery scored 17
highest among all the HID collection methods. Looking at the results in detail, the lowest scores 18
were assigned to data reduction time, data collection time, and data collection cost. The results 19
indicated that data collection, reduction efforts, and associated cost are the most common 20
concerns for state DOTs. Given this fact, the photo/video logging method appeared more 21
desirable to state DOTs. 22
Jalayer, Hu, Zhou, and Turochy 8
TABLE 3 Levels of Satisfaction for Primary Data Collection Method of State DOTs 1
Satisfaction Factors Unacceptable (%)
Fair (%)
Good (%)
Very Good (%)
Excellent (%)
Sum (%)
Equipment cost rating 0 21 58 21 0 100 Data accuracy rating 0 7 41 45 7 100 Data completeness rating 7 17 34 34 7 100 Crew hazard exposure rating 4 29 39 21 7 100 Data collection cost rating 3 24 55 17 0 100 Data collection time rating 3 34 48 14 0 100 Data reduction time rating 11 26 30 26 7 100 Data reduction cost rating 4 39 29 21 7 100 Data storage requirement rating 0 14 52 31 3 100
2
3 FIGURE 3 Level of Satisfaction of Various Inventory Data Collection Methods among 4
Respondent States 5
6
FIELD TRIAL AND RESULTS 7 To evaluate the photo/video logging method’s capability/incapability of collecting the required 8
dataset, this study used three different types of roadway segments including rural two-lane, two-9
way roads, rural multilane highways, and urban and suburban arterial segments as the test sites. 10
For all selected segments, which varied in length but all were longer than one mile, the data 11
collection time and data reduction time were recorded separately: the former during the field trip 12
and the latter in-office. Manual review and photogrammetry, making measurements from 13
photographs, are the proposed data reduction methods for photo/video logging. 14
As for data collection, the geo-tagged digital videos and photos were gathered through 15
the use of Red Hen video mapping system (www.redhensystems.com). Notably, this video 16
mapping system, which uses a video camcorder and a GPS antenna, has the capability to collect 17

Jalayer, Hu, Zhou, and Turochy 9
geo-tagged digital video with essential locational information. Figure 4 depicts a configuration of 1
a video logging system implemented in this study. The researchers collected video with a total 2
data volume of slightly over 5 GB, for a total of 28 miles for selected roadways during two 3
hours. The GPS enabled photo/video logging requires a relatively short time of data collection 4
with an extensive feature extraction effort in the office. In this study, the average time for data 5
collection using this method was 4.3 minutes per mile. 6
7
8 FIGURE 4 A Video Logging System Configurations in Use for Data Collection 9
10
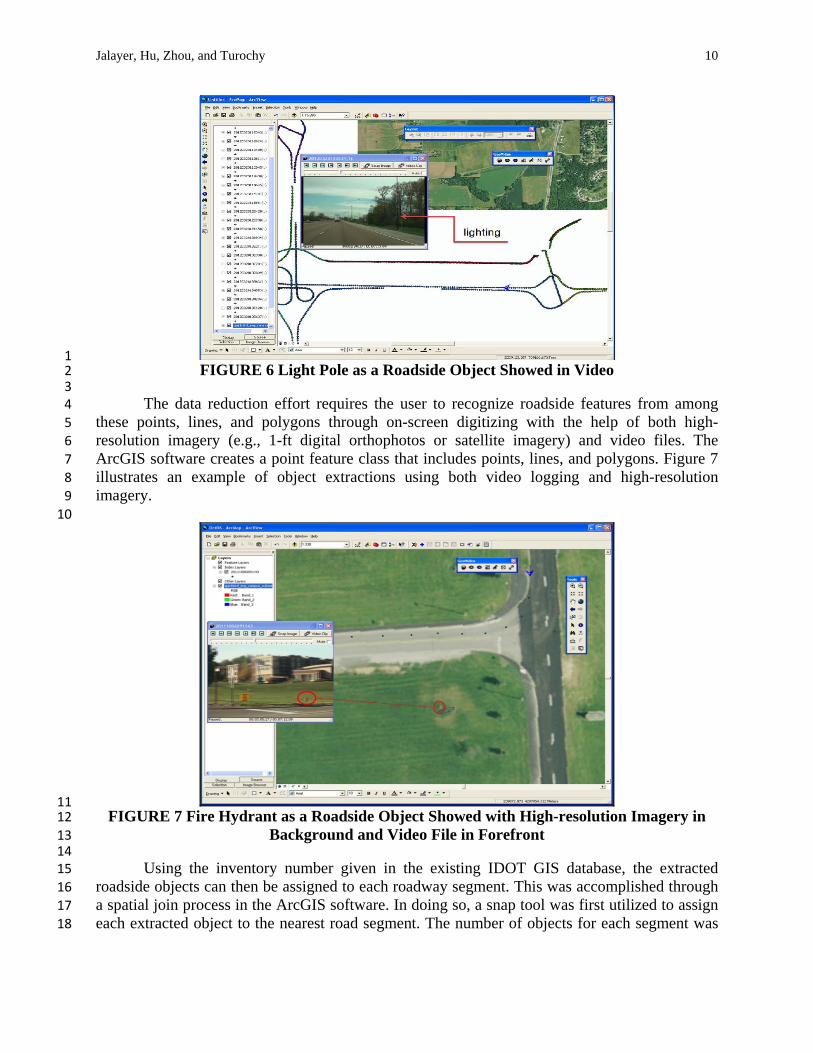
After data collection, the video files were imported into ArcGIS 9.3 software (with an 11
ArcView 9.3 or Arc Editor 9.3 license) as inputs for an ArcGIS extension (or GeoVideo). These 12
files contained both digital motion pictures and GPS locations for the roadways. This GeoVideo 13
program creates a point feature class that correlates with the GPS locations where each video 14
was taken. The GeoVideo allows the user to click on any point to start playing the video file, 15
allowing the system operator to identify roadside objects (Figures 5 and 6). 16
17
18 FIGURE 5 Guardrail as a Roadside Object Showed in Video 19
Jalayer, Hu, Zhou, and Turochy 10
1 FIGURE 6 Light Pole as a Roadside Object Showed in Video 2
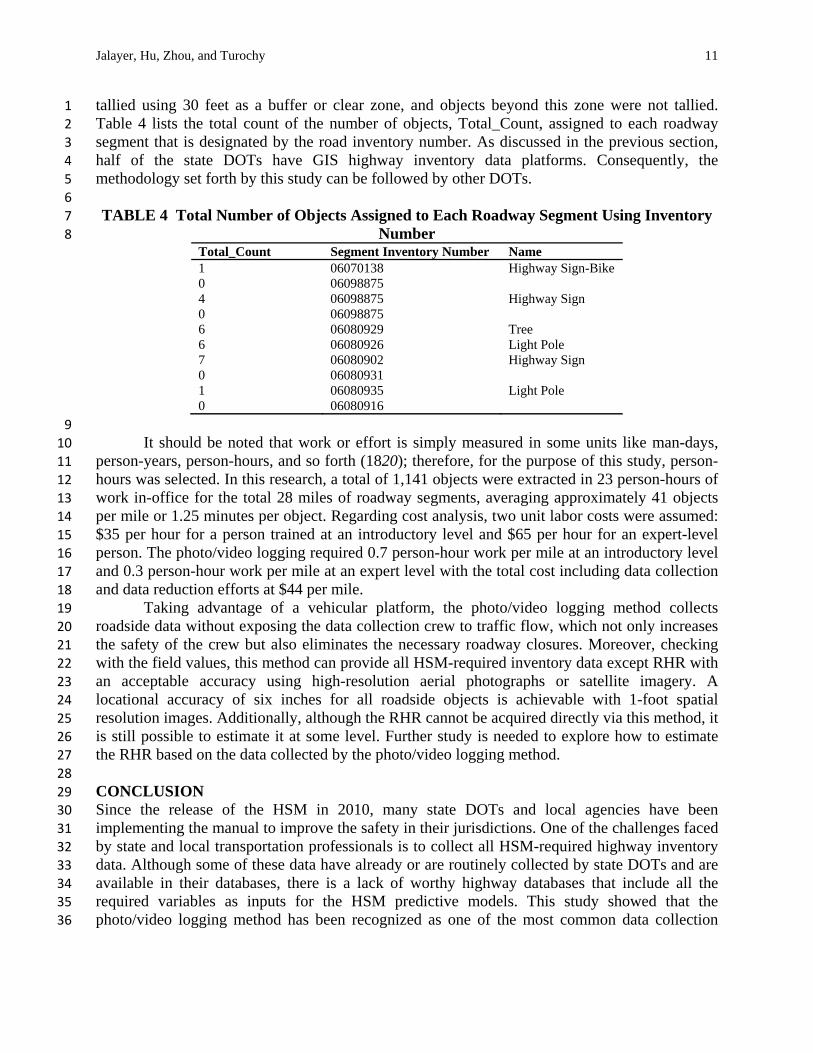
3 The data reduction effort requires the user to recognize roadside features from among 4
these points, lines, and polygons through on-screen digitizing with the help of both high-5
resolution imagery (e.g., 1-ft digital orthophotos or satellite imagery) and video files. The 6
ArcGIS software creates a point feature class that includes points, lines, and polygons. Figure 7 7
illustrates an example of object extractions using both video logging and high-resolution 8
imagery. 9
10
11 FIGURE 7 Fire Hydrant as a Roadside Object Showed with High-resolution Imagery in 12
Background and Video File in Forefront 13 14
Using the inventory number given in the existing IDOT GIS database, the extracted 15
roadside objects can then be assigned to each roadway segment. This was accomplished through 16
a spatial join process in the ArcGIS software. In doing so, a snap tool was first utilized to assign 17
each extracted object to the nearest road segment. The number of objects for each segment was 18
Jalayer, Hu, Zhou, and Turochy 11
tallied using 30 feet as a buffer or clear zone, and objects beyond this zone were not tallied. 1
Table 4 lists the total count of the number of objects, Total_Count, assigned to each roadway 2
segment that is designated by the road inventory number. As discussed in the previous section, 3
half of the state DOTs have GIS highway inventory data platforms. Consequently, the 4
methodology set forth by this study can be followed by other DOTs. 5
6
TABLE 4 Total Number of Objects Assigned to Each Roadway Segment Using Inventory 7
Number 8 Total_Count Segment Inventory Number Name 1 06070138 Highway Sign-Bike 0 06098875 4 06098875 Highway Sign 0 06098875 6 06080929 Tree 6 06080926 Light Pole 7 06080902 Highway Sign 0 06080931 1 06080935 Light Pole 0 06080916
9
It should be noted that work or effort is simply measured in some units like man-days, 10
person-years, person-hours, and so forth (1820); therefore, for the purpose of this study, person-11
hours was selected. In this research, a total of 1,141 objects were extracted in 23 person-hours of 12
work in-office for the total 28 miles of roadway segments, averaging approximately 41 objects 13
per mile or 1.25 minutes per object. Regarding cost analysis, two unit labor costs were assumed: 14
$35 per hour for a person trained at an introductory level and $65 per hour for an expert-level 15
person. The photo/video logging required 0.7 person-hour work per mile at an introductory level 16
and 0.3 person-hour work per mile at an expert level with the total cost including data collection 17
and data reduction efforts at $44 per mile. 18
Taking advantage of a vehicular platform, the photo/video logging method collects 19
roadside data without exposing the data collection crew to traffic flow, which not only increases 20
the safety of the crew but also eliminates the necessary roadway closures. Moreover, checking 21
with the field values, this method can provide all HSM-required inventory data except RHR with 22
an acceptable accuracy using high-resolution aerial photographs or satellite imagery. A 23
locational accuracy of six inches for all roadside objects is achievable with 1-foot spatial 24
resolution images. Additionally, although the RHR cannot be acquired directly via this method, it 25
is still possible to estimate it at some level. Further study is needed to explore how to estimate 26
the RHR based on the data collected by the photo/video logging method. 27
28
CONCLUSION 29 Since the release of the HSM in 2010, many state DOTs and local agencies have been 30
implementing the manual to improve the safety in their jurisdictions. One of the challenges faced 31
by state and local transportation professionals is to collect all HSM-required highway inventory 32
data. Although some of these data have already or are routinely collected by state DOTs and are 33
available in their databases, there is a lack of worthy highway databases that include all the 34
required variables as inputs for the HSM predictive models. This study showed that the 35
photo/video logging method has been recognized as one of the most common data collection 36

Jalayer, Hu, Zhou, and Turochy 12
techniques among state DOTs due to its simplicity and low associated costs. It also provides 1
timely and needed research on identifying the capability of the photo/video logging method to 2
collect HSM-required datasets. Given this information, a comprehensive literature review, a 3
nationwide survey, a field trial, and a cost analysis has been conducted to demonstrate the pros 4
and cons of this method. The results revealed that, unlike many other HID collection methods, 5
photo/video logging with high-resolution imagery is less costly and less time-consuming. 6
Additionally, this method can be utilized to gather required data with an acceptable accuracy 7
required by the HSM for large-scale statewide data collection in a short time period. 8
9
ACKNOWLEDGMENT 10 This study was made possible through funding from the Illinois Department of Transportation 11
(IDOT) and the Illinois Center for Transportation (ICT). The authors thank the Technical Review 12
Panel (TRP) members for their inputs on this project. 13
14
REFERENCES 15
1. Highway Safety Manual. American Association of State Highway and Transportation 16
Officials (AASHTO), Washington D.C., 2010. 17
2. Maerz, N. H., and S. McKenna. Mobile Highway Inventory and Measurement System. In 18
Transportation research Record: Journal of Transportation Research Board, No. 1690, 19
Transportation Research Board of the National Academies, Washington, D.C., 1999, pp. 135-20
142. 21
3. Jeyapalan, K., and E. Jaselskis. Technology Transfer of As-Built and Preliminary Surveys 22
Using GPS, Soft Photogrammetry, and Video Logging. Publication TR-446, Iowa 23
Department of Transportation, Ames, IA, 2002. 24
4. Tsai, Y. Using Image Pattern Recognition Algorithms for Processing Video Log Images to 25
Enhance Infrastructure Data Collection. Publication NCHRP IDEA 121, Transportation 26
Research Board, Washington, D.C., 2009. 27
5. Wang, K. C. P., Z. Hou, and W. Gong. Automated Road Sign Inventory System Based on 28
Stereo Vision and Tracking. Journal of Computer-Aided Civil and Infrastructure 29
Engineering, Vol. 25, No. 6, 2010, pp. 468-477. 30
6. Balali, V., M. Golparvar-Fard, and J. M. de la Garza. Video-Based Highway Asset 31
Recognition and 3D Localization. Presented at International Conference on Computing in 32
Civil Engineering, Los Angeles, CA, 2013, pp. 379-386. 33
7. Hu, X., C. V. Tao, and Y. Hu. Automatic Road Extraction from Dense Urban Area by 34
Integrated Processing of High Resolution Imagery and LiDAR Data. Presented at 35
International Archives of Photogrammetry, Remote Sensing and Spatial Information 36
Sciences, Istanbul, Turkey, 2004, pp. 288-292. 37
8. Degray, J., and K. L. Hancock. Ground-based Image and Data Acquisition Systems for 38
Roadway Inventories in New England: A Synthesis of Highway Practice. Publication 00-1. 39
New England Transportation Consortium, University of Connecticut, Storrs, CT., 2002. 40
9. Jeyapalan, K. Mobile Digital Cameras for As-Built Surveys of Roadside Features. Journal of 41
Photogrammetric Engineering and Remote Sensing, Vol. 70, No. 3, 2004, pp. 301-312. 42
10. Robyak, R., and G. Orvets. Video based Asset Data Collection at NJDOT. New Jersey 43
Department of Transportation (NJDOT), Newark, NJ, 2004. 44

Jalayer, Hu, Zhou, and Turochy 13
11. Wu, J., and Y. Tsai. Enhanced Roadway Geometry Data Collection Using an Effective Video 1
Log Image-Processing Algorithm. In Transportation Research Record: Journal of 2
Transportation Research Board, No. 1972, Transportation Research Board of the National 3
Academies, Washington, D.C., 2006, pp. 133-140. 4
12. Gong, J., H. Zhou, C. Gordon, and M. Jalayer. Mobile Terrestrial Laser Scanning for 5
Highway Inventory Data Collection. Presented at International Conference on Computing in 6
Civil Engineering, Clearwater Beach, FL, 2012, pp. 545–552. 7
13. Jalayer, M., J. Gong, H. Zhou, and M. Grinter. Evaluation of Remote Sensing Technologies 8
for Collecting Roadside Feature Data to Support Highway Safety Manual Implementation. 9
Presented at 92nd Annual Meeting of the Transportation Research Board, Washington D.C., 10
2013. 11
14. Zhou, H., M. Jalayer, J. Gong, S. Hu, and M. Grinter. Investigation of Methods and 12
Approaches for Collecting and Recording Highway Inventory Data. Publication FHWA-ICT-13
13-022. Illinois Center for Transportation, IL, 2013. 14
15. Jalayer, M., S. Hu, H. Zhou, and R. E. Turochy. Evaluation of Geo-tagged Photo/Video 15
Logging Methods to Collect Geospatial Highway Inventory Data. Journal of Papers in 16
Applied Geography. Vol. 1, No. X, 2015 (in Press). 17
16. Balali, V., and M. Golparvar-Fard. Segmentation and Recognition of Roadway Assets from 18
Car-Mounted Video Streams using Scalable Non-Parametric Image Parsing. Journal of 19
Automation in Construction. Vol. 49, 2015, pp. 27-39. 20
17. Jalayer, M., H. Zhou, J. Gong, S. Hu, and M. Grinter. A Comprehensive Assessment of 21
Highway Inventory Data Collection Methods. Journal of Transportation Research Forum. 22
Vol. 53, No. 2, 2014, pp. 73-92. 23
18. Mallela, J., S. Sadasivam, and N. Lefler. MIRE Element Collection Mechanisms and Gap 24
Analysis. Publication FHWA-SA-11-49. Federal Highway Administration (FHWA), 25
Washington, D.C., 2012. 26
19. Mallela, J., S. Sadasivam, R. Becker, D. Raghunathan, N. Lefler, R. Fiedler, and H. McGee. 27
MIRE Data Collection Guidebook. Publication FHWA-SA-13-009. Federal Highway 28
Administration (FHWA), Washington, D.C., 2013. 29
20. Connell, F. O. What You Need to Know about Project Management, Capstone, Minnesota, 30
2011. 31