an assessment of the effectiveness of strategic planning
TRANSCRIPT

Loyola University Chicago Loyola University Chicago
Loyola eCommons Loyola eCommons
Dissertations Theses and Dissertations
1991
An Assessment of the Effectiveness of Strategic Planning An Assessment of the Effectiveness of Strategic Planning
Systems Within Educational Organizations Systems Within Educational Organizations
Deborah Joyce Knox Loyola University Chicago
Follow this and additional works at: https://ecommons.luc.edu/luc_diss
Part of the Education Commons
Recommended Citation Recommended Citation Knox, Deborah Joyce, "An Assessment of the Effectiveness of Strategic Planning Systems Within Educational Organizations" (1991). Dissertations. 3176. https://ecommons.luc.edu/luc_diss/3176
This Dissertation is brought to you for free and open access by the Theses and Dissertations at Loyola eCommons. It has been accepted for inclusion in Dissertations by an authorized administrator of Loyola eCommons. For more information, please contact [email protected].
This work is licensed under a Creative Commons Attribution-Noncommercial-No Derivative Works 3.0 License. Copyright © 1991 Deborah Joyce Knox

An Assessment of the Effectiveness of Strategic Planning Systems
Within Educational Organizations
by
Deborah Joyce Knox
A Dissertation Submitted to the Faculty of the Graduate School
of Loyola University of Chicago in Partial Fulfillment
of the Requirements for the Degree of
Doctor of Education
May
1991

2
DEDICATION
To My Loving Parents, Eddie and Mabel Knox

COPYRIGHT - 1990
ALL RIGHTS RESERVED
3

VITA
The author, Deborah Joyce Knox is the daughter of Eddie
L. Knox and Mabel (Crutcher) Knox. She was born in Chicago,
Illinois on March 14, 1955. Miss Knox attended public
elementary schools in Chicago and graduated from Harlan High
School in 1972. She received a Bachelor of Science degree in
Special Education from Chicago State University in 1975, and
a Master of Science degree in Special Education from the same
University in 1978.
Miss Knox began her professional career in September
1975, with the Chicago Board of Education, as a teacher of
multiply handicapped students at Davis Developmental Center.
She is currently a teacher of physically handicapped / other
health impaired students at Jane A. Neil in Chicago,
Illinois.
4

SUMMARY
The Strategic Planning process is defined as a process
that (a) identifies the purpose of an organization, (b)
determines internal and external forces which impact an
organization, (c) analyses the forces that these factors
have, or will have on the organization (d) develops
strategic plans or strategies to achieve the mission.
Strategic Planning is a process that has been successful
in the business world, but it is a relatively new process in
the educational community. Before this process can be used
effectively in the area of education, the process must be
studied, in order to determine (1) if the strategic planning
process is effective in the area of education and (2) what,
if any specific actions or conditions make it a successful
process.
This study examined the use of the strategic
planning process in the educational organization in order to
determine:
1. to what extent educators are currently involved in
the strategic planning process.
2. if these planning systems are effective.
3. if specified conditions (7 dimensions of planning)
are directly related to effectiveness in planning.
4. how strategic planners and nonstrategic planners
compare.
5

ACKNOWLEDGMENTS
TO GOD BE THE GLORY
I would like to express my sincere appreciation to all
who contributed to the success of this project.
To Dr. Max Bailey - Thank you for the direction and help
you have given me, not only with this study, but throughout the
doctoral program. Your help has been invaluable and greatly
appreciated.
6
To Dr. Philip Carlin - Thank you for the helpful
suggestions and advice you have given, as well as the gentle
reminders to continue working toward completion of this project.
To Dr. Edward Rancic - Thank you for your assistance, and
for helping me to complete this study successfully.
To Dr. Fred Lunenberg - Thank you for your early assistance
and guidance in this project.
To my parents, Eddie and Mabel Knox, and my brothers,
Eddie and Allen - Thank you for your continued support, help,
encouragement and love.
To Dr. Beryl Holmes - Having a diligent ABO doctoral
candidate as a library partner and friend, made this
experience a much more enjoyable one than it would have been
alone. Good luck with all of your pursuits.
To Mr. Harrison Phillips - Thank you for your help and
support.
To Mr. Lawrence A. Boose Jr. - Thank you for your
expert guidance in all computer matters.

To Dr. Keenan and the staffs of Jane A. Neil and Davis
Developmental Center. Thank you for your help and support
throughout this endeavor and my professional career. Thank
you for providing a challenging and rewarding work
experience.
To the students of Davis and Neil - Thank you
for making my life at work a wonderful, rewarding
adventure.
7

TABLE OF CONTENTS
VITA . . . . . . . . . . . . . . . . . . . . . . . . . . . . . . . . . . . . . . . . . . . . . . . SUMMARY. . . . . . . . . . . . . . . . . . . . . . . . . . . . . . . . . . . . . . . .
Page
4
5
6 ACKNOWLEDGMENTS
CHAPTERS
I.
II.
INTRODUCTION
General Background
Specific Background
Criterion
Criterion
I
II
. . . . . . . . . . . . . . . . . . . . . . . . . . . . . . .
Criterion III
Dimensions . . . . . . . . . . . . . . . . . . . . . . . . . . . . . . . . Methods and Procedures
Research Design
Comparison .•••••••
Research Questions
12
12
17
17
19
19
19
21
21
24
27
Instrument Development..................... 27
Sampling Technique........................ 28
Data Collection/ Methodology............. 28
Data Computerization
Statistical Analysis
summary . . . . . . . . . . . . . . . . . . . . . . . . . . . . . . . . . . . . . . REVIEW OF RELATED LITERATURE
Effectiveness in Planning .• . . . . . . . . . . . . . . . . . . . History Evolution of Planning
29
29
30
32
34
36
Future Planning. . . . . . . . . . . . . . . . . . . . . . . . . . . . . . . 40
8

Futuring
Strategy
Techniques .......................... . 41
55
Strategic Planning . . . . . . . . . . . . . . . . . . . . . . . . . . . 56
Planning in Educational Organizations .•.•.... 73
Summary • • • • • • • • • • • • • • • • • • • • • • • • • • • • • • • • • • • • • • 8 O
III. FINDINGS. . . . . . . . . . . . . . . . . . . . . . . . . . . . . . . . . . . . . . . . . 81
Research Question 1 ••......•••••••..••••••.•• 82
Strategic Planners • . . . . . . . . • . . . • • • • . . • • • . • • • . 82
Research Question 2
Research Question 3
82
91
Characteristics of Strategic Planners ..... 94
Nonstrategic Planners
Research Question 2
Research Question 3
94
94
107
Characteristics of Nonstrategic Planners .. 110
Strategic Planners vs. Nonstrategic Planners . 110
Research Question 4 110
Nonstatistical Findings .....••.••......•.•..• 112
Summary . . . . . . . . . . . . . . . . . . . . . . . . . . . . . . . . . . . . . . 112
IV. SUMMARY, CONCLUSIONS, AND RECOMMENDATIONS ...... 113
Summary . . . . . . . . . . . . . . . . . . . . . . . . . . . . . . . . . . . . . . 113
Interpretations and Conclusions •............. 117
Strategic Planners ........................ 117
Nonstrategic Planners .......•....••......• 118
Comparison of Strategic and Nonstrategic
Planners. . . . . . . . . . . . . . . . . . . . . . . . . . . . . . . . . . . . . . 118
9

comparison of Current Study with Ramanujam
Study. . . . . . . . . . . . . . . . . . . . . . . . . . . . . . . . . . . . . . . . . 12 0
Implications for Administrators 120
Interpretations and Conclusions From
Nonstatistical Findings ......•••.•..••....... 121
Limitations . . . . . . . . . . . . . . . . . . . . . . . . . . . . . . . . . . 121
Recommendations for Future Research .•..•••..• 121
Recommendations for Strategic Planning •....•• 122
REFERENCES • • • • • • • • • • • • • • • • . • • • • • • • • • • • • • • • • . • . . • . • • • • • 123
APPENDICES 130
CHARTS ••••••••••••••••••••••••••••••••••••••••••••••••
Dimensions of a Planning System •••••••••.•••.•.•••• 21
Comparison of Physically Fit Person and
Effective Planning Systems •.••••••••••.••..•..•.••• 25
Comparison of Instructional Program Model and
Comprehensive
TABLES (STATISTICS)
Model ............•................
Strategic Planners ................................ .
Table 1 - Discriminant Analysis (Criterion # 1)
Table 2 - Discriminant Analysis (Criterion # 2)
Table 3 - Discriminant Analysis (Criterion # 3)
Table 4 - Means, Standard Deviations, and •.••...••.
77
85
87
89
Intercorrelations of Variables Measuring ......•
Effectiveness of Planning Systems.............. 90
Table 5 - Means, Standard Deviations, and •....•..••
Intercorrelations of the Seven Dimensions of ...
Planning Systems . . . . . . . . . . . . . . . . . . . . . . . . . . . . . . . 9 2
10

Table 6 - Relative Importance Rankings ••......••••• 93
Table 7 - Characteristics of Respondents........... 95
Nonstrategic Planners •............•••.•..........•.
Table 8 - Discriminant Analysis (Criterion # 1)
Table 9 - Discriminant Analysis (Criterion # 2)
Table 10 -Discriminant Analysis (Criterion # 3)
Table 11 - Means, Standard Deviations, and
Intercorrelations of the Seven Dimensions of •.•
99
102
104
Planning Systems . . . . . . . . . . . . . . . . . . . . . . . . . . . . . . . 106
Table 12 - Means, Standard Deviations, and ....•..••
Intercorrelations of Variables Measuring •••••••
Effectiveness of Planning Systems ••••...••••••• 108
Table 13 - Relative Importance Rankings •••••..•...• 109
Table 14 - Characteristics of Respondents •••••.•..• 111
11
CHAPTER I
INTRODUCTION
General Background
12
A review of administrative literature reveals an
abundance of information which suggests that planning within
the educational organization is a process of central
importance. Yet there is concern that the educational
community lags behind business and industry in the area of
planning, more specifically in the area of strategic
planning. In a recent study, Lewis (1983) concluded that
only 30 % of all state departments of education require some
form of long range or strategic planning. This is of
particular concern to many because of the widespread belief
that effective planning contributes to increased productivity
and efficiency within the organization.
Planning is defined as "any set of formal and rational
activities that seek to anticipate conditions, directions,
and challenges at some future point in time for the purposes
of enhancing the readiness of personnel and the organization
to perform more effectively, and to attain relevant
objectives by optimal means (Knezevich, 1984, p. 97).
Strategic Planning is a process that: (a) identifies the
purpose of an organization, (b) determines internal and

13
external forces which can or do impact the organization,
(c) analyzes the forces that these factors have, or will have
on the organization; (d) develops strategic plans or
strategies to achieve the goals, and (e) institutes action
plans to carry out those strategies to achieve the mission.
This process is based on the concept that "visualizing the
ideal is an absolute necessity to achieving that condition"
(Ingram, 1985, p. 15).
One basic difference between the concept of long term
planning and strategic planning, is the idea of planning
around existing conditions. Long term planning was designed
to develop and carry out a set of plans designed to improve
existing conditions within an organization. The existing
conditions were used as a basis for reform. Long term
planning assumed a static or unchanging environment. It did
not take into account a changing, dynamic world.
The strategic planning process is based on the concept
that we are in a changing world. It examines internal and
external conditions which affect the educational
organization. The process defines the purpose of the
organization, describes the desired image of the
organization, and devises action plans and activities to
help achieve that goal. Strategic planning focuses on the
desired condition of the organization and diminishes the
importance of existing conditions. It is a process which
recognizes the dynamic nature of our world and takes into
account current changes or possible changes when plans and

14
decisions are being made. Goals and objectives are devised to
promote the achievement of the overall purpose or mission of
the organization.
The general purpose of any type of organization is to
prepare the organization for a better, more productive
future. In the business world, this could indicate the need
for a better product, or a desire for increased profits. In
the educational community, a more productive future can be
interpreted as better student achievement, and sufficient
preparation for the world students will face as adults.
Managers and administrators often recognize that the
quality or lack of quality of our future depends on the
caliber of our planning techniques. our current actions
will affect the quality of the future for individuals
as well as for organizations. Planning is an ongoing
process; planners must use time, space and funds effectively
to adequately prepare the organization for a more productive
future.
According to Lewis (1983) planning is not a panacea. It
"will not solve all educational ills, predict the future
accurately, or prevent mistakes. Planning will, however,
minimize the degree to which administrators and teachers will
be caught by surprise and enable them to revise goals and
objectives by reacting to dynamic variables within the school
- community environment" (p. 3). Lewis (1983) synthesized a
number of planning definitions, to include these key

concepts:
1. Planning must be long- and short-range in duration.
short range plans are implemented to achieve long-range
goals.
2. Planning is a comprehensive and systematic strategy
for the effective and efficient use of human and nonhuman
resources to effect change and improvement in the school
organization.
3. Performance gaps are eliminated and opportunities
15
are explored to improve the overall performance of the school
district.
4. Internal and external variables that can affect
planning decisions are determined as accurately as possible
so that these variables can be considered in the overall
planning process.
5. The planning process is incomplete if it does not
include a systematic method for the evaluation of performance
standards toward long-range goals, short range objectives,
performance standards and the execution of plans.
6. Planning is a continuous process that involves
representatives from all areas of the school district. It is
not a yearly or quarterly exercise.
7. Planning is not forecasting. Forecasting is an
essential element of planning, which predicts what will
happen on the basis of certain assumptions. The planning
process differs, in that it is an attempt to determine what

should occur and what steps should be taken to make it
happen.
16
a. Crucial areas of the school organization must be
pinpointed so that plans can be initiated to improve results
in these areas.
9. Planning views strengths as internal variables and
opportunities as external variables that may affect planning
positively. Likewise, weaknesses are viewed as internal
variables and problems as external variables that affect
planning negatively unless corrective actions are taken. The
interrelationship of these variables must be understood to
arrive at an information base to make adequate planning
decisions.
10. Problem solving planning must take place before
strategic and operational planning, and long range planning
should take place before short range planning.
Because the strategic planning process is relatively new
in the educational field, there is a need to study strategic
planning techniques within the educational community, to
determine what types of planning techniques are being used
and what planning techniques influence the effective
performance of the organization. The educational community
must determine if the strategic planning process is
worthwhile; and if there are specific actions or conditions
which contribute to the success of the planning system.
Specific Background
This study examined the use of strategic planning
techniques in the educational organization, assessed the
effectiveness of the strategic planning systems within
17
the organization and explored the dimensions of planning
elements contributing to differences in effectiveness between
more and less effective systems.
The current investigation was similar to one
performed by Ramanujam, V., Venkatraman, N., and Camillus, J.
c. (1986). Their study, titled "Multi-Objective Assessment
of Effectiveness of Strategic Planning: A Discriminant
Analysis Approach" examined the dimensions of planning
elements that contribute to differences in effectiveness
between more and less effective systems. The Ramanujam study
examined seven dimensions of planning and linked those
dimensions to three established criteria of effectiveness.
According to Ramanujam, et al., (1986) these three
criteria are an indication of whether a planning system
is more or less effective. These criteria have the support
of literature. They are:
1. The extent of fulfillment of key planning objectives.
2. The economic performance of an organization.
3. An overall measure of satisfaction within the
organization.
Criterion I
Fulfillment of Key Planning Objectives
The first criterion examined the extent of fulfillment
of key planning objectives. Six commonly emphasized
objectives were used to assess this criterion. They are:
18
1. Predicting Future Trends - Organizations have become
increasingly turbulent, necessitating some formal mechanisms
for monitoring and coping with environmental change. Planning
should help organizations to delineate probable, plausible,
and preferable future states of the world (Amara, 1981).
According to Paul, Donavan, & Taylor, (1978) one major
problem with planning is the inability of planners to produce
reasonably valid forecasts of the future. Predicting future
trends is recognized as an 'important task of planning.
2. Evaluating Alternatives - A good planning system
should serve as a vehicle for mind stretching (Camillus,
1975) and delicately balance control and creativity (Shank,
Niblock, & Sandalls, 1973).
3. Avoiding Problem Areas - Effective planning systems
should be adaptive learning systems. They should increase
the probability of achieving goals and minimize the
recurrence of errors. The effective planning system should
avoid problem areas (Lorange & Vancil, 1977).
4. Enhancing Management Development - Planning systems
should improve the quality of management and facilitate
management succession. (Hax & Majluf, 1984; Lorange &
Vancil, 1977).
5. Improving Short Term Performance & 6. Improving Long
Term Performance - Improving short-term and long- term

performance is the major reason for adopting planning
systems.
criterion II
Performance Relative to Competition
19
Effective planning systems should improve organizational
performance in a way which permits organizations to not only
achieve their objectives, but to perform at a relatively
higher level. The Ramanujam study used four performance
indicators: (a) growth in sales, (b) growth in earnings,
(c) changes in market share, and (d) return on investment.
Criterion III
Satisfaction with Planning Systems
Satisfaction with planning systems was listed as an
additional criterion of effectiveness. This criterion is
especially important when planning systems are mandatory.
This approach is common in literature concerning
implementation of management information systems (Lucas,
1978). Dimensions
The dimensions of a planning system described in
Ramanujam study include:
1. System Capability - The ability of a formal planning
system to balance creativity and control; adaptive
flexibility of a system and its capability to support
strategy formulation and implementation (Ansoff, 1975, 1984;
Anthony & Dearden, 1976; Camillus, 1975; Lorange & Vancil,
1977; King & Cleland, 1978; Thompson, 1967).
2. Use of techniques - The degree of emphasis given to

20
the use of planning techniques to structure ill-defined,
messy, strategic problems (Grant & King, 1979, 1982; Hofer &
Schendel, 1978; Hax & Majluf, 1984).
3. Attention to Internal Facets - The degree of
attention to internal (organizational) factors, past
performance, and analysis of strengths and weaknesses
(Camillus & Venkatraman, 1984; Grant & King, 1982; King &
Cleland, 1978; Lorange & Vancil, 1977; Stevenson, 1976).
4. Attention to External Facets - The level of emphasis
given to monitoring environmental trends. (Aguilar, 1965;
Fahey & King, 1977; Keegan, 1974; Kefalas & Schoderbek,
1973; Thomas, 1980).
5. Functional Coverage - The extent of coverage given to
different functional areas with a view to integrating
different functional requirements into a general management
perspective. (Hitt, Irland, & Palia, 1982; Hitt, Irland, &
stadter, 1982; Lorange, 1980; Snow & Hrebiniak, 1980).
6. Resources Provided for Planning - The degree of
organizational support in the form of number of planners,
involvement of top management in planning, etc. (King &
Cleland, 1978; Steiner, 1979).
7. Resistance to Planning - The need to anticipate and
overcome resistance to planning and to create a favorable
climate for effective planning (Steiner, 1979; steiner &
Schollhammer, 1975; Schultz & Slevin, 1976).
The seven dimensions of planning, and the three
established criteria of effectiveness used in the Ramanujam
21
study have extensive literature support. The Ramanujam study
was conducted in the business sector, with Fortune 500
companies.
The results of the Ramanujam study suggested that the
dimensions of planning that are associated with effectiveness
tend to vary depending on the specific criterion of
effectiveness. Key planning dimensions were: (a) system
capability, (b) resources provided for planning and
(c) functional coverage. These dimensions were highly linked
to more effectiveness within the business organization.
Chart 1 presents a summary of the dimensions.
Purpose
Methods and Procedures
Research' Design
The purpose of this study was to examine the use of
strategic planning techniques in the educational
organization, assess the effectiveness of the strategic
planning systems within the organization, and explore the
dimensions of planning elements contributing to differences
in effectiveness between more and less effective systems.
The present investigation was a partial replication of
the Ramanujam study; it was designed to perform a similar
investigation within the educational community.
The current study adapted the evaluation of the economic
performance of an organization, to include an evaluation of
student characteristics and academic achievement within the
educational organization.

22
CHART 1
Dimensions of Planning systems
-------------------------------------------------------------Dimensions Description Key Supporting Literature
-------------------------------------------------------------Design elements
system capability
Use of techniques
Atten. to internal facets
Attent. to external facets
The ability of a planning system to balance control and creativity; flexibility of a system; ability to support strategy formulation and implementation.
Degree of emphasis given to planning techniques.
Degree of attention given to internal factors, past performance, and organizational strengths and weaknesses.
Level of emphasis given to examining environmental trends.
Ansoff (1975, 1984) Anthony & Dearden (1976 Camillus (1975) Lorange & Vancil (1977) King & Cleland (1978) Thompson (1967)
Grant & King (1979, 1982) Hof er & Schendel (1978) Hax & Majluf (1984)
Camillus & Venkatraman Grant & King (1982) King & Cleland (1978) Lorange & Vancil (1977) Stevenson (1976)
Aguilar (1965) Fahey & King (1977) Keegan (1974) Kef alas & Schoderbek (1973) Thomas (1980)

23
CHART 1
Dimensions of Planning Systems
---------------------------------------------------------~1;;nsions Description Key Supporting Literature
-------------------------------------------------------------Functional coverage
organizational context of planning
Resources provided for planning
Resistance to planning
Degree of emphasis given to different functional areas with a view to integrating different functional requirements into a general management perspective.
Degree of organizational support given in the form of the number of planners, involvement of top management in planning.
The need to anticipate and overcome resistance to planning and to create a favorable climate for effective planning. Slevin
Hitt, Ireland, & Palia (1982) Hitt, Irland, & Stadter (1982) Lorange (1980) Snow & Hrebiniak
(1980)
King & Cleland (1978) Steiner (1979)
Steiner (1979) Steiner & Schollhammer (1975) Schultz & ( 1976)
Chart from: Multi-Objective Assessment of Effectiveness of Strategic Planning: A Discriminant Analysis Approach Ramanujam, V., Venkatraman, N., and Camillus, J. c. (1986).

More specifically the Ramanujam study evaluated these
economic factors within a business organization:
1. growth in sales
2. growth in earnings
3. change in market share
4. return on investment
The current investigation evaluated these educational
factors:
24
1. Test scores in reading as compared to previous scores
within the school or school system.
2. Test scores in math as compared to previous scores
within the school system.
3. Test scores in reading as compared to national norms.
4. Test scores in math as compared to national norms.
5. Student attendance rate as compared to previous
attendance rate within the school system.
6. Student dropout rate as compared to previous dropout
rate within the school system.
7. Percentage of college bound students as compared to
previous percentage.
Comparison
In order to gain a clearer understanding of criteria of
effectiveness and dimensions of a planning system, the author
compared the evaluation of a planning system to the
evaluation of a person's level of physical fitness.
For example, we could say that a person is physically
fit if he or she meets the following criteria: (a) he or she

25
is at the correct weight (b) he or she has a healthy heart,
mind and body (c) he or she has good muscle tone and a good
muscle to fat ratio. If these criteria are present, then he
or she is physically fit.
The dimensions would be the many controllable factors
that contribute to whether or not that person is physically
fit. For example, we would consider the: (a) types of food
consumed (b) number of calories consumed (c) exercise habits
(d) lifestyle, including smoking, alcohol or drug habits (e)
sleep habits (f) emotional state of mind. Whether or not
these dimensions are present would have a significant effect
on the three criteria which determine whether or not a person
is physically fit.
In the same way, the author shows that according to
literature, a planning system is effective if these three
criteria are present: (a) six key planning objectives are
fulfilled (b) there is growth or improvement in educational
performance (c) an overall measure of satisfaction is
present. In an effective organization, these criteria are
present.
The dimensions or factors which contribute to this
effectiveness are (a) system capability (b) use of techniques
(c) attention to internal facets (d) attention to external
facets (e) functional coverage (f) resources provided for
planning (g) resistance to planning (measures lack of
resistance). Chart 2 presents a comparison of physical
fitness and effective planning.

CHART 2
Comparison of a Physically Fit Person and an Effective Planning System
Criteria Dimensions
Physically Fit
calories
26
type of consumed exercise food consumed I +-habits
lifest:yle: smoking etc.
+++------------+-------------++ Criteria
1. Correct weight 2. Healthy heart, mind body
3. Good muscle tone, muscle to fat ratio
++---------------------------++
Criteria Dimensions
Effective Planning Systems
System
emotional state
Resistance to Capability Use of planning I I +-techniques
Resources provided for planning
+++------------+-------------++ Criteria
1. Fulfill key objectives 2. Good student performance
3. Satisfaction with planning systems
++---------------------------++
. I I Functional Attention to Coverage external facets
Attention to internal
facets

Research Questions
1. To what extent are educators involved in strategic
• ? planning. How many years have they been involved in the
process?
2. Are the strategic planning systems in educational
organizations effective, according to three established
criteria of effectiveness?
3. Is this effectiveness directly related to seven
established dimensions of planning which influence
effectiveness?
27
4. How do strategic and non strategic planners compare?
Instrument Development
The instrument was a five point Likert - Scale
Questionnaire, titled "Strategic Planning Assessment For
Educational Organizations".
The current investigation sought to ensure content
validity with the advice and approval of administrators and
strategic planning experts.
Several of the questions in the current study were
identical to those used in the Ramanujam study, which sought
to assure content validity of each dimension by the use of
multiple experts (including the authors of the study) and
with the use of an iterative procedure for insuring
exhaustive coverage of each construct's domain. The use of
the multi-item scales was motivated by the aim of enhancing
the reliability of measurements (Nunnally, 1978).
Additional items were derived from published definitions

28
of strategic planning, and from information from the State
Report card developed by the Illinois State Board of
Education. Information about standardized reading and math
tests were also included. In addition, content validity was
reexamined after the instrument was pilot tested among six
superintendents in several counties in Illinois.
potential problems with test content and test administration
were generated during the pilot test, and changes were made
in order to avoid problems in the study.
Sampling Techniques
The population included the 288 district superintendents
in Chicago and Chicagoland area. superintendents in the six
county metropolitan area, Cook, DuPage, Lake, McHenry,
Kane, and Will counties, were asked to participate in
this study.
Data Collection / Methodology
An experimental procedure was conducted to evaluate:
1. the effectiveness of strategic planning systems
within educational organizations.
2. seven established dimensions of planning systems
which influence effectiveness within educational
organizations.
3. the effectiveness of planning systems as
statistically compared to seven dimensions of the planning
systems.
The data were collected in the following manner:
In an attempt to discover to what extent districts in the

Chicago six county metropolitan area are involved in the
strategic planning process, questionnaires were sent to
29
all district superintendents within the specified boundaries.
Each superintendent was asked:
1. if his/her district is involved in the strategic
planning process.
2. if he/she would be willing to complete a brief (15
min.) questionnaire regarding the strategic planning process
within their district.
A questionnaire was mailed to 288 potential
respondents with a cover letter that briefly described the
survey, and estimated the approximate amount of time needed
to complete the questionnaire. The letter requested the
return of the questionnaire within two weeks; and sought to
assure the confidentiality of the survey results. All
correspondence included self addressed stamped envelopes
to make the process as easy as possible for each participant.
Each questionnaire was coded, so that the writer
had a record of questionnaires that had been returned.
A follow up letter was sent to those who had not
returned the questionnaire after three weeks.
Data computerization
The Twin Spreadsheet Software System and the s Statistical
program language was used to perform statistical functions.
Statistical Analysis
Statistical analysis included:
1. characteristics of respondents.

2 • means, standard deviation, and intercorrelations of
the seven dimensions of planning systems.
30
3. means, standard deviations, and intercorrelations of
the variables measuring effectiveness of planning systems.
4. discriminant analysis for groupings based on
satisfaction.
5. discriminant analysis for groupings based on
variables measuring fulfillment of objectives.
6. discriminant analysis for groupings based on
performance relative to competition.
7. relative importance rankings of the dimensions of
planning in 13 discriminant analyses.
8. a comparison of those who identified themselves as
strategic planners with those who plan, but do not use the
strategic planning process.
Summary
The Strategic planning process is defined as a process
that (a) identifies the purpose of an organization, (b)
determines internal and external forces which impact an
organization, (c) analyses the forces that these factors
have, or will have on the organization; (d) develops
strategic plans or strategies to achieve the mission. This
process is based on the concept that "visualizing the ideal
is an absolute necessity to achieving that condition (Ingram,
1985' p. 15) •
Strategic planning is a process that has been successful
in the business world, but it is a relatively new process in

31
the educational community. Before this process can be used
effectively in the area of education, the process must be
studied, in order to determine: (1) if the strategic planning
process is effective in the area of education and (2) what,
if any specific actions or conditions make it a successful
process.
This study examined the use of the strategic
planning process in the educational organization in order to
determine:
1. to what extent educators are currently involved in
the strategic planning process.
2. if these planning systems are effective.
3. if _specified conditions (seven dimensions of
planning) are directly related to effectiveness in planning.
4. if there are differences in those who identify
themselves as strategic planners and those who identify
themselves as nonstrategic planners.

CHAPTER II
LITERATURE REVIEW
32
Planning is a complex process which attempts to
systematize an organization and guide it toward a better,
more productive future. It is the way organizations attempt
to deal with a changing environment. Planning is an active,
creative process for securing a successful future; whereby
the organization attempts to redirect and refocus its goals.
The process is intended to help increase the level of
performance within the organization, while preparing a set of
decisions which will delineate and guide actions to be
carried out in the future.
The literature review section of this study presents a
description of effectiveness in planning, and explains the
history of planning systems. In addition, it defines future
planning, and strategy. This section also describes current
futuring techniques and discusses the strategic planning
process.
According to Knezevich (1984) planning should be
(a) future oriented (b) goal oriented (c) based on rational
and verifiable procedures and data and (d) related to
performance enhancements and goal achievement by optimal
means.
Effective plans are functional and realistic. They do
not reflect the delusive expectations of the planners, nor
the emotional expressions of hopes for the best. Planning for
the sake of planning is not a viable or justifiable option.

The planning process is closely related to the
management of change. It is a process which attempts to
ensure a successful procedure for significant modification
within the goals and operations of the organization.
33
Planning is vital in the management of an organization
because it is basic to the other crucial management functions
and must be done at all administrative levels. The best
measure of the quality of a plan is evident during the
implementation stage. At this point, whether or not plans are
bringing about desired results becomes apparent.
some writers closely relate planning and decision
making because the steps in the decision making process and
in planning are similar. Others acknowledge planning as the
preparation phase of the decision making process. Planning
precedes and helps determine the optimal decisions to be
made.
Knezevich (1984) defined planning as "any set of
formal and rational activities that seek to anticipate
conditions, directions, and challenges at some future point
in time for the purposes of enhancing the readiness of
personnel and the organization to perform more effectively,
and to attain relevant objectives by optimal means" (p. 97) •
Although The American College Dictionary (1966) defined
planning as "to draw or make a plan of 'a building etc.'" (p.
926), planning should be less concerned with the process and
more concerned with the identification of the outcomes or
goals to be pursued by the organization. Determining the

34
direction of the organization is a major goal of the planning
process. "A plan is conceptualized as a predetermined
strategy, detailed scheme, or program of action related to
the accomplishment of an objective" (Knezevich, (1984, p.
85). It is a mental activity used for the purpose of
developing a method or strategy for achieving a goal.
Effectiveness in Planning
Assessing the effectiveness of a planning system is a
difficult process because a plan cannot be truly evaluated
until it has been carried out (Greenley, 1983). Assessment
of planning effectiveness can be determined after a plan has
been implemented, but it cannot be used to ameliorate action
which has already been carried out. If effectiveness is
assessed during the planning stage (before execution) the
assessment becomes a "subjective estimation of likely
performance" (Greenley, 1983, p. 1). Generally, assessing
planning effectiveness has been an evaluation of success of
the achievement of the goals or objectives of the plan.
Knezevich (1984) recognized the need for educational
administrators to develop and sharpen their planning skills.
There is a need for top administrators to be able to
differentiate between excellent and poorly conceptualized
plans, and have the skills necessary to develop superb plans.
Knezevich (1984) stated "The higher one moves up the
administrative hierarchy, the more emphasis and the higher
priority are granted in the administrators time schedule",
thus making planning techniques a highly desirable and needed

skill for educational administrators {p. 97).
Fayol {1959) cited four major characteristics of an
effective plan:
1. Unity - There should be no more than one plan for
any organizational dimension to be approved and implemented
at one time.
35
2. Continuity - The planning process is a continuous,
ongoing process. There is no "end" to the planning process.
3. Flexibility - Plans should be flexible, allowing for
modifications as unforeseen circumstances arise.
4. Precision - Vague, ambiguous plans must be revised
to assure accuracy and clarity of all elements.
The planning process should also tap the talents and
capabilities of the personnel within the organization.
Top management is responsible for the important task of
"matching organizational competencies with opportunities and
risks created by environmental change in ways that will be
both effective and efficient over the time such resources
will be deployed" {Lorange, 1979 p. 92).
According to Hofer, {1973) upon analyzing major firms,
the establishments with the highest degree of planning
effectiveness were those that changed both their scope and
distinctive competencies. The 2nd most successful were those
that changed only their distinctive competencies. Third,
were those firms that changed only their scope. The least
successful firms were those made no changes (Lorange,
1979, p. 93).

History - Evolution of Planning
Planning has evolved from a simple to a more
comprehensive process. Hax & Majluf (1984) recognized five
major stages in the evolution of planning. They were:
1. budget and financial control
2. long range planning
3. business strategic planning
4. corporate strategic planning
s. strategic management
Stage I
Budgeting and Financial Control
36
The 1930's brought about the earliest stage in the
evolution of the strategic planning process in the corporate
world. The budgeting and financial control stage is a
process that presented projections of costs and revenues
covering a one year period. All important activities within
an organization were monitored with a master budget.
The major goal of the budgeting stage was to prevent
"undue concern for short term profitability at the expense of
the long term development of the firm" (Hax & Majluf, 1984,
p. 8) •
The budgets were developed with the use of estimated
figures derived from standards of performance. These figures
were based upon historical observations drawn from internal
data and external data.
The purpose of this administrative system was to
achieve higher operational efficiency, and to promote better

37
use of financial resources. Budgeting and financial control
evolved as a result of excessive concern with short term
profits. Companies neglected the overall long term
success of the organization by focusing on short term
profits.
Stage II
Long Range Planning
The second stage, Long Range Planning, was introduced in
the 1950's. This was a comprehensive effort toward
developing or defining programs, goals, objectives and
budgets for a time period of many years. In the Long Range
Planning process, there was an attempt to project the coming
trends and to plan the organizational goals and objectives
with those trends in mind. Organizations considered current
trends before developing plans that guided the future of the
organization. The major focus of this stage was the
development of multi-year forecasts of firm sales. All other
organizational functions viz., manufacturing, marketing,
personnel were developed to enhance the achievement of the
forecasts.
Many firms adopted long range planning in an attempt to
more effectively manage the extraordinary financial
growth triggered during the post World War II period.
In an attempt to respond to this unprecedented growth, it was
not enough for American firms to rely on one year budgetary
projections. "To meet the required expansions of capacity
and to find the corresponding financial resources, it became

necessary to extend this planning horizon" (Hax & Majluf,
1984, P• lO) •
This process was adequate for that time period. Hax &
Majluf (1984) stated "Long range planning makes sense
38
under the conditions that prevailed after w. w. II; that is,
high market growth, fairly predictable trends, firms with
essentially a single dominant business, and relatively low
degree of rivalry among competitors" (p. 11).
The long range planning method assumed that the future
would have been a continuation of the past. It did not
take change into account. Long range planners did not
predict change, nor did they promote differing strategies
from those-earried out in the past.
Stage III
Business Strategic Planning
The 1960's brought about a change in the economic
structure of the United States. Economic growth was minimal,
and competition among companies increased. Businesses became
more complex, increasing in size and scope. This phenomena
led to businesses being broken down into smaller, more
manageable units called Strategic Business Units or SBU's.
"The SBU's were initially designed so as to assure
organizational integrity, while permitting the SBU general
manager to carry out the business strategy effectively and
competitively without affecting the strategies of other SBU's
within the firm" (Hax & Majluf, 1984, p. 15).
In business strategic planning, the expression of the

39
business purpose, as well as the required degree of
excellence to assume a position of competitive leadership,
was the essential first step toward the formulation of the
business strategy. This expression of purpose was referred to
as the mission statement of the business.
Stage IV
Corporate Strategic Planning
The 1960's and 1970's marked a major change in the
socio-political environment in America (Hax & Majluf, 1984).
Energy and environmental problems were primary societal
concerns. There was a shift from the trend toward
decentralization and of autonomous business units, and a
shift toward sharing of resources such as manufacturing
facilities, distribution networks, common sales forces, and
centralized purchasing.
In the corporate strategic planning process, the
decisions of a company determined the purposes, objectives,
and goals of that company and produced the principal
policies and plans for achieving those goals. This process
defined the range of businesses the company pursued, and
described the organization in economic and human terms.
The plan further described the nature of the economic and
noneconomic contributions it made to its shareholders,
employees, customers, and communities. This strategic plan
defined the businesses in which a company would compete,
and focused resources in order to develop competitive
advantages.
stage y Strategic Management
40
Although strategic planning is the major focus of this
study, it is not the final process in administrative
functioning. In order to be effective, planning must lead to
carefully integrated administrative techniques, which
integrate all major functions of the organization. It should
promote strategic thinking. strategic planning is the key
process to properly define critical processes of the
organization, but it is not the only factor leading
administrators to better, more efficient organizations.
Strategic management is a process of integrating
strategic planning with the operational system of the
organization. The planning becomes integrated with the other
significant administrative functions of the organization.
Strategic management requires careful follow up and close
monitoring in order to achieve success. Strategic planning
systems should include specific directions for monitoring,
analyzing and controlling the implementation process.
Today strategic management is thought of as a way of
managing a company whereby the overall strategy and purposes
of the firm dominate decision making at all levels of the
company. "No longer is it sufficient for the chief executive
alone to have a sense of where the company is headed"
(Hamermesh, 1983, pg. 3).
Future Planning
Steiner (1969) stated "Planning is not forecasting, but

41
forecasts are essential in planning" (p. 17). In the act of
planning, administrators and instructors must be cognizant of
the fact that students are preparing for a world unlike the
one in which we live and we can no longer base future plans
on past realities. Knowing this, educational leaders must
plan with the thought of preparing their students for a
probable and preferable future world. It is practically
impossible to make any rational, justifiable plans without
some image of the future. Plans within the organizational
setting are preparations for a healthy, vital and effective
future.
"Planning is not making future decisions but it is
concerned with making current decisions in light of their
futurity" (Knezevich, 1984, p. 90).
"Todays futurists for the most part, lay no claim to the
ability to predict" (Toffler, 1972, p. 4). They are not
concerned with making statements which predict with any
certainty what will happen; instead they concentrate on the
alternatives available to decision makers, stressing that
"the future is fluid, not fixed or frozen" (Toffler, 1972,
p. 4). Current futurists focus not only on possible or
probable futures, their primary concern is defining,
describing, and determining events and conditions that will
effect an organization and its personnel. Included in this
text are a number of popular futuring techniques.
Futuring Techniques
Educational organizations have generally neglected the
adoption of a systematic plan for studying and planning the
future, despite the fact that dozens of futuring techniques
and methods of forecasting have been developed. The
Literature Review section of this study examined
42
several of the more popular or common futuring techniques
which are available and currently being used in many parts of
society. Joseph (1974) identified three fundamental
approaches to forecasting:
1. The first approach, named the "Exploratory
Forecasting" approach is used to anticipate what is likely to
happen. This approach emphasizes trends and possible
opportunities or problems related to the future (Heathers,
Roberts, & Weinberger, 1977).
2. The predominant activities of Normative Forecasting
techniques are to discover, set norms, and invent desired
alternatives for the future. This approach is used to
propose what will need to be done in order to achieve some
desired future goal. For example, in predicting an
individual's life span a medical doctor can use one of two
approaches. An "exploratory indicative" comment might be,
"if you don't lose weight, you'll be dead before you're 60".
The normative approach to the same problem could be: You'll
increase your chances of living beyond 70 years if you lose
weight and exercise regularly. The normative approach
describes the steps necessary to achieve the desired goal.
3. Joseph (1974) described the Forecasting through
the Modeling / Simulation approach. This involves gaining

43
an understanding of the structure of the future by
analyzing natural laws (physical, social, and environmental)
and assessing their impact.
The futuring techniques examined in this study
include: (a) the futuring process, (b) brainstorming,
(c) a Delphi survey of perceived possibilities, (d) trend
extrapolation, (e) trend impact analysis, (f) contextual map
forecasting, (g) force analysis, (h) technology assessment,
(i) simulation / gaming, (j) multi-factor forecasting,
(k) relevance trees, (1) futures wheels, (m) cross impact
matrices, (n) scenarios, and (o) strategic planning.
The Futuring Process
Wagschal and graduate students at the University of
Massachusetts, in conjunction with Phi Delta Kappa, (1984)
developed the Futuring Process as a tool for the examination
of alternative futures.
The futuring process is based on the premise that no
expert opinion is valuable if it has little or no popular
support; it relies on a series of diverging and converging
futuring techniques which alternately expand and focus the
participants thoughts. This process eventually results in a
scenario, which is a written conceptual image of a future
trend. The process of developing a scenario brings about a
clearer understanding of the complex relationships among
events. It is advisable to include parents, teachers,
administrators, staff, students, community and business
leaders in the futuring process. This technique is most

44
effective when there is a diversity of opinion from which to
draw. The Wagschal process allows planners to examine the
desirability of possible trends and to assess the probability
or possibility of the occurrence of forecasted events. It
then blends the opinions of all participants into a workable
package or solution which all participants agree upon.
The futuring process incorporates five established
futuring techniques: (a) Brainstorming, (b) the Delphi
Technique, (c) Futures Wheels, (d) Cross Impact Matrices, and
(e) scenarios. These techniques are described within this
text.
Brainstorming
Brainstorming is a method for generating ideas or lists
of trends. This group activity is the first step in the
Wagschal futuring process. The participants are encouraged
to create a list of societal or educational trends, or to
generate solutions to a problem which could affect the future
of education. Each participant is encouraged to generate as
many ideas as possible within a specified time period. One
or two people record the ideas as they are generated. The
brainstorming process is a method which "encourages building
on previous ideas and stretching the mind to include the
bizarre" (Phi Delta Kappa, 1984, p. 3). Quantity of ideas or
thoughts, and not quality, is emphasized at this stage, and
all ideas are accepted whether they appear to be practical or
not, in order to encourage creativity. This stage is free of

45
inhibition, judgement and evaluation.
The Delphi survey
The Delphi Survey, which is the second stage of the
wagschal Futuring process, was designed to identify the
trends which are perceived by the public to be the most
probable, most desirable, and the most important. The process
collects opinions, and establishes consensus among the
participants about future probabilities. The survey was
originally developed by Olaf Helmer and colleagues of the
Rand Corporation. The Delphi Survey is probably the most
widely used technique for future policy research. "It is
based on the premise that many heads are better than one - or
as earl SaR<iburg phrased it: 'Everybody is smarter than
anybody'" (Heathers, et al., 1977, p. 1-2-25). The survey is
mailed to each participant. It is performed in several
rounds, usually three, each including the same questions.
Participants are asked to "respond to each item by
forecasting the probable date, the desirability, and
sometimes the probability of each event" (Heathers, et
al., 1977, p. 1-2-27). The Wagschal format asked
participants to assess the importance of each event.
Upon the receipt of the 1st round responses, the
forecaster tabulates the results, and records the averages on
the Round 2 copy of the survey.
After each round, the participants are given information
about how the others responded. This allows for "cross
fertilization" of thinking (Phi Delta Kappa, 1984). They

receive copies of the responses of each participant after
each round. Participants are then encouraged to revise and
explain their responses after each round. The goal of each
stage is to achieve greater consensus than in the previous
stage. The forecaster tabulates and averages the responses
after each round.
Three main characteristics of the Delphi Survey are:
1. Each participant contributes to the topic before
seeing the input of the others.
2. the input of the participants is anonymous.
3. There are a series of investigations; all previous
inputs are shared as part of the next input.
46
It is important to include people with as many different
viewpoints as possible when conducting the survey. The
survey by Phi Delta Kappa and Wagschal (1984) was mailed to a
group of 1,200 educators, futurists, and business people,
with a 25% rate of return. The items were rated by
probability, desirability and importance. Of the 30
trends included on the survey, six trends were selected for
future study.
The design of the Delphi survey: (a) identifies the
topic of research, (b) identifies the respondents - including
experts in the field as well as participants from other
areas, (c) includes a literature review which covers research
on the topic and related recent developments, (d) includes
the Delphi survey questions, to be used in each round.
The questioning technique used in the Delphi survey

follows certain guidelines:
1. Phrasing is consistent. Either statements or
questions should be used, but not both.
2. Questions and directions are clear and concise,
not ambiguous or vague.
47
3. Double questions are avoided. (e.g., When will A and
B happen)?
4. Assumptions and leading questions are avoided.
5. The questionnaire is brief.
6. The questionnaire allows for a range of possible
responses.
The Futures Wheel
The Futures Wheel is a technique which generates the
most probable consequences of a trend. The technique was
introduced by Cindy Guy and Jerry Glenn in a 1976 issue of
"The Futurist". Heathers et al. (1977) defined it as: "an
intuitive study of needs and consequences likely to
develop from a given forecast" (P. 1-2-10). Phi Delta Kappa
(1984) described the Futures Wheel, which is the third stage
of the Wagschal method, as the "heart of the futuring
process" (p. 4). Each immediate consequence generates
several more likely consequences. The process is repeated in
at least four stages. The futures wheel amplifies the full
ramifications of the trends; and unanimous agreement is
required before a consequence can be included. Every
participant should agree that the completed futures wheel has
only likely consequences. The discussion should be minimized
so the process is not too long. In this process:
1. "The forecaster notes the development to be studied
and circles the statement, thus forming the hub of the
wheel" (Heathers et al., 1977, p. 1-2-10).
2. "As needs and consequences come to mind, the
forecaster records them in satellite circles on spokes from
the hub" (Heathers et al., 1977, p. 1-2-10).
48
J. "Statements in the satellite circles in turn suggest
further needs and consequences which are noted" (Heathers et
al., 1977, p. 1-2-10).
Cross Impact Matrices
The Cross Impact Matrix helps identify consequences
which tend to cancel each other out, and consequences that
are reinforced by others. This is the fourth step in the
Wagschal futuring process. The process is defined as "an
experimental approach by which the probability of each item
in a f orecasted set can be adjusted in view of judgements
relating to potential interactions of the forecasted items"
(Heathers, et al., 1977, p. 1-2-7). Theodore J. Gordon
pioneered the use of this technique. Cross Impact Matrices
were "originally designed to determine the probability of an
interacting set of forecasts, cross impact analysis has also
been used to determine positive and / or negative impact of
related developments, and to increase the depth of
understanding of interactive relationships" (Heathers, et
al., 1977, p. 1-2-7).
Current futurists now perform the technique using

49
sophisticated computer programs. Each consequence is set up
in a matrix against other elements in a futures wheel. The
participants are asked to determine if the trend on the
vertical axis occurs if it will make the trend on the
horizontal axis more likely to happen, (+) or less likely to
happen(-). If the participants are uncertain a (O) is
marked. For example, Trend 1. Automobile technology is
becoming computerized. Trend 2. Automobiles are becoming
more expensive. Will computerized technology affect the
price of automobiles and make them more expensive? Will the
expense of automobiles determine whether or not they will
become increasingly computerized? Forecasts based on cross
impact analysis are based on intuition, but they are
considered useful because of the consideration of interacting
forces.
Scenarios
The fifth step in the Wagschal process is performed
upon completion of the cross impact matrix. The elements
of the future wheels synthesizes seemingly unconnected
consequences into a written conceptual image or a scenario
which describe a central trend. Herman Kahn is considered to
be a leader in scenario writing. His book "The Year 2000 11
discussed the advantages and usefulness of this tool.
Scenarios are written in the present or past tense.
The process of writing the scenario encourages the
participants to analyze, and compare trends. The participants
then identify internal consistencies and inconsistencies, and

connect the future scenario to the present in some way.
The process shows "how to get there from here" (Phi Delta
Kappa, 1984, p. 6).
50
According to Heathers, et al. (1977) scenarios typically
follow certain guidelines. They: (a) specify the forecast
date, (b) identify the focus or main subject, (c) identify
related subjects or issues, (d) present relevant information,
especially that which identifies probable innovations, (e)
assume a no - change, surprise free future is least likely,
and (f) reveal imaginative considerations of alternatives.
Trend Extrapolation
"The most common way of viewing the future is to project
that current trends will continue" (Heathers, et al., 1977,
p. 1-2-3). Trend Extrapolation is a technique which is used
for projecting the magnitude of a present trend into the
future. It examines the history of a topic and estimates how
the trend will continue in the future. Trend extrapolation
generally examines statistical trends; social trends are
generally difficult to forecast. Using this method, a
variable is plotted graphically over time creating a curve,
which can then be extended into the future. The advantage of
trend extrapolation is that it is simple, inexpensive, and
easily understood. It is displayed graphically and is often
very close to being right. It is a good tool for identifying
problems or issues that require attention. Most current
social and educational problems have been evident for some
time. The disadvantage of trend extrapolation is that it

51
operates on the basic assumption that the same factors that
operated in the past will continue to shape the future. This
method is risky because it does not provide for changes in
trends or values.
Trend Impact Analysis
Trend Impact Analysis is a continuation of the trend
extrapolation process. Its purpose is to identify, determine
and evaluate the probability that certain events could have
an impact on any particular trend. In this method, a group
of researchers generate a list of possible, significant
events that could affect a trend. The team of researchers
list estimates of the probability, time frames, and degree
of impact on the trend of events. These events are stated in
positive or negative percentages; and the estimated
information is then entered on a computer. After the
probabilities, impacts and estimates of time have been
calculated, a computer simulation of the probable impact on
the trend of each event is created. The process results in a
newly extrapolated mean curve. The advantage of trend
impact analysis is that it is designed to reduce surprise
by forecasting the effects of multiple influences upon a
trend with regard to the future. The computerized projection
is then tested and revised. The disadvantage of trend impact
analysis is that the results are based on the subjective
judgements of the researchers who use the technique; and the
entire process, even with the use of a computer, is time
consuming.
Exponential Growth
Exponential growth recognizes the fact that all trends
do not progress at a steady rate. Many trends have an
accelerated rate of change. This process takes the
accelerated rate into account. For example, as computers
become a more common and vital part of society, the rate of
sale can probably be expected to grow. This can eventually
be proven or disproved with the use of statistics.
Force Analysis
52
Force analysis is a method used to identify and assess
the future impact of trends which are likely to cause
institutional change. In this method a forecasting team
selects a specific topic. Knowledgeable persons who are not
a part of the forecasting team are asked to identify forces
related to the topic. The forecasting team then selects a
number of these forces to be projected into the future and
writes descriptions of the forces that include the past
nature of the topic and its previous problems and influences.
Force analysis is beneficial because it is both simple
to perform and practical, and easy for beginners to learn.
This method is also useful for considering short range goals
or futures, and helping the participant to gain a better
understanding of the forces and factors that can influence
the future. Its limitations occur with the subjective
insights of the participants. The descriptions of the future
will only be as good as the insights of the participants.

53
Technology Assessment
A Technology Assessment is a technique in which
forecasting teams plan, anticipate, and analyze the potential
impacts of new technologies in society. With this method,
the forecasting team first identifies and describes the
technology to be assessed. Next, they determine the probable
future conditions of society and assess how technological
advances might be manifested in that society. Third, the
impact areas of society and the affected parties such as
segments of society, population groups, institutions, etc.,
are identified. After these determinations have been made,
the participants evaluate the impacts according to
probability, direction, magnitude, and duration. The
participants then identify the policy options and decision
makers that could affect the impact of a technology on
society. This technique emphasizes the relationships between
social change and technological development. Its approach is
interdisciplinary and can therefore be used in conjunction
with other futuring techniques. This technique can be used
to make assessments of the impact of technology on single
communities, institutions, or for more global assessments.
Technology assessments are limited because the results
of this technique are entirely dependant on the assumptions
of the forecasting team.
Relevance Tree & Contextual Map Forecasting
Relevance Tree and Contextual Map Forecasting techniques
enable forecasting participants to describe alternative

54
pathways of reaching or achieving desired future goals and
a~oiding undesirable goals. These techniques generate trees
and maps which show graphically a logical sequence of events
together with their interrelatedness. In this method,
participants identify a goal and describe logical sequential
steps to outline possible procedures for attaining the goal.
second, the steps are placed on a relevance tree or a
contextual map to show the relationships graphically.
The advantage of these techniques is that they assist
participants in developing plans for reaching future desired
goals. These methods give participants a sense of control
over future happenings. "The participants can identify
precursory events and deduce short range actions, decisions,
and implications from long-range goals. The use of these
techniques can also highlight the relevance of multiple
forecasts, as well as identify resources that can be used in
reaching a desired goal" (Phi Delta Kappa, 1984, p. 24).
The disadvantage of this technique is that it can be
used to manipulate approaches, resources, and decisions to
reach a biased desired goal; and those using this technique
often concentrate on existing possibilities, rather than
future goals.
Simulation / Gaming
This process involves computer simulated events of
situations that provide an analyses of alternative futures
and their possible impacts. In this method a replica of the
operation of a system such as the energy industry or the

55
national economy is described mathematically, and programed
into a computer. This method of simulation can compress a
years worth of data in seconds. It can also allow for gaming
which is a risk free experimentation with variables. The
simulation process is time consuming and costly.
strategy
In the book "Strategic Management", by Harvard Business
Review, Hamermesh (1983) defined strategy as "the pattern of
objectives, purposes, or goals and major policies and plans
for achieving those goals, stated in such a way as to define
what business the company is in or is to be in and the kind
of company it is, or is to be.
Strategy entails two equally important tasks, strategy
formulation and strategy implementation. The formulation of
strategy requires the general manager to create a fit among:
1. the opportunities in the external industry
environment.
2. the strengths and weaknesses of a firm.
3. the personal values of key implementers and
4. the broader societal expectations of the firm"
(p. 1-2).
Haller (1983) conveyed the definition of strategy given
in Dr. Hofer's book "Strategy Formulation: Analytical
Concepts: "Strategy is the fundamental pattern of present and
planned resource deployments and environmental interactions
that indicates how the organization will achieve its
objectives" (p. 7).
56
"Significantly, it (strategy) has less to do with doing
things right than with doing the right thing, as Peter
orucker has pointed out many times. There is a big
difference" (Haller, 1983, p. 6).
Haller (1983) defined "street strategy" as "the kind
of strategy lightweights can talk about extemporaneously
with no preparation, with only a passing knowledge of the
situation and with a heavy sprinkling of platitudes" (p. 4).
He further defined Gourmet Strategy as "the kind of
thing you would have to think about for a while; the
qualitative difference would be similar to comparing the
economic insights offered on Saturday Night Live with those
on William Buckley's Firing Line (Haller, 1983, p. 5).
Haller believes that no amount of fancy execution will
keep you out of trouble without good strategies.
Strategic Planning
The strategic planning process: (a) identifies the
purpose of an organization, (b) determines internal and
external factors which impact the organization, (c) analyses
the impact of these factors, (d) develops strategic plans
to achieve the goals, and (e) institutes action plans to
carry out those strategies and achieve the mission.
The strategic planning process begins with a vision of
what the organization should be, not an assessment of where
the organization is currently. This management style allows
the members of the organization to be productive, important
parts of the organization.

57
strategic planning is based on the concept that
nvisualizing the ideal is an absolute necessity to achieving
that condition. It reverses the typical needs assessment
analysis of comparing existing conditions against desired
condition" (Ingram, 1985, p. 15).
strategic Planning focuses on the desired condition of
the organization as it diminishes the importance of existing
conditions. It emphasizes the forces outside the
organization that can be used to achieve success once
recognized and understood.
This planning process can be compared to the scientific
approach of stating a hypothesis and determining which
alternatives work and which do not.
outside forces, and collected information are studied
and analyzed to shape a desired future and achieve desired
outcomes. For example: a person desiring to become a
certified public accountant must first apply to a university,
take prerequisite courses, take required exams before being
accepted into a program. After being accepted, the student
must successfully complete all required courses and exams
before taking the CPA exam. After successfully completing
the exam after one, two, or more attempts, the student
finally earns the title of certified public accountant. This
goal is reached only after successful planning, taking
specific steps toward the goal, and completion of those
steps.
Strategic Planning serves as a link between an

58
organization and the environment. It ensures that the
organizations activities and objectives are consistent with
the goals and plans of the organization. strategic Planning
helps to integrate the activities necessary for establishing
and achieving goals in a coordinated manner.
Educators must also learn to visualize the desired
school or school wide system, and identify the educational,
social, political, and economic forces which effect the
system. They must then take steps toward establishing a plan
which will achieve the goals.
In strategic planning the best results are achieved when
using a top - down / bottom - up approach in developing the
strategies, instead of allowing all planning to be done by
top management or planning specialists.
"School boards, superintendents and top management need
to set the broad strategic and operational goals with middle
management advising at the operational level. Middle
management then needs to have the opportunity to develop with
their staffs the means for achieving those goals" (Ingram,
1985, p. 16).
The action plan (objectives / activities) should be
developed by those responsible for implementing the plan. The
goal of strategic planning is to train educators or others to
think and plan in a manner similar to coaches, generals or
business people. It is a process to help educators become
cognizant of the desired outcomes of the educational process,
and the process necessary to achieve those desired goals.
59
"Strategic planning is a survival skill for educational
leaders. It should dominate the time and attention of school
board members, superintendents and top managers in every
school district" (Ingram, 1985, p. 16).
A study of corporations which have implemented strategic
planning was performed by Business Week. The study examined
the problems which have surf aced over the last ten years and
discussed the reasons for many unsuccessful attempts at
strategic planning. The problems included:
1. Planners who were responsible for designing
strategies were unable to implement them. The planners were
not the managers who were responsible for the implementation.
Plans were-11\ade, but never implemented.
2. Top level management was not involved in the planning
process in a meaningful way. Plans that were handed down
were not realistic or useful. Managers had no vested
interest in the plans and did not implement them.
3. Planners and managers feuded. Planners were there to
design the plans and managers were there to follow their
instructions and do their bidding.
4. The strategic planning process grew away from the
external world of competitors and customers. The article
quotes: "The notion that an effective strategy can be
constructed by someone in an ivory tower is totally
bankrupt" (Business Week, 1984, p. 64).
5. Strategic plans became too voluminous. It seemed
that employees prepared their business plans as a matter of

60
routine, instead of designing plans for the betterment of the
corporation.
6. "Companies felt that strategic planners disrupt a
companies ability to assess the outside world and to create
strategies for a sustainable competitive advantage" (Business
week, 1984, p. 64).
7. There was a danger of internal focus. Corporations
did not consider what was happening in other companies. This
became the downfall of some company plans.
There is also a problem with understanding the
difference between strategy, planning and implementation.
The original purpose of the strategic planning process became
lost. General Electric Chairman Welch believed that the
problem in the strategic planning process was the difference
between being externally or internally focused. He believed
making sure that managers understand the difference is an
important part of the strategic process.
Welch explained strategy as "trying to understand where
you sit today in todays world. Not where you wish you were
and where you hoped you would be, but where you are. And
it's trying to understand where you want to be in 1990. It's
assessing with everything in your head the competitive
changes, the market changes that you can capitalize on or
ward off to go from here to there. Its assessing the
realistic chances of getting from here to there" (Business
Week, 1984).
61
Welch explained that a strategy can be summarized in a
page or two. "It is different from plan appropriation
requests, building a plant, developing a product, ••• that's
implementation of a strategy of where you want to be".
(Business Week, 1984, p. 66}.
General Electric and other companies made changes as a
result of the problems and failures that resulted from
strategic planning:
1. Companies cut down on the number of strategic
planners. For example groups of 50 were cut down to 25.
2. A greater emphasis was placed on implementation.
3. Companies made managers an integral part of the
planning team. The managers were the ones responsible for
implementing the plans.
4. Companies looked for managers who were "Strategic
Thinkers."
5. Companies tried to anticipate what their competitors
would do.
6. General Electric, Westinghouse, and other companies
discouraged ridged and lengthy strategic planning
structures and instructions and replaced them with five to
six written pages.
7. strategic planners and consultants became training
managers and assumed strategic planning duties.
strategic planning is not operational or tactical
planning. The major focus is not on day to day
accomplishments or scheduling. Strategic Planning is a
process that involves making strategic decisions about the
major focus or plan of the organization.
Those who plan strategically must be cognizant of:
62
i. outside factors which can and do effect the
organization, with the realization that these elements should
be incorporated into the planning process.
2. the time period for which they are planning.
3. the fact that strategic planning involves decisions
that commit vast amounts of the organizations efforts.
The Strategic Plan defines where the organization should
be going in the long run - as well as defining short term
goals. It decides what programs and services should be the
major focus of the organization, and determines what changes
should be made in future challenges. These plans focus on
the system as a whole - emphasizing all goals and objectives
which are used in an attempt to satisfy the ultimate
strategic plan.
A study, titled "Multi-Objective Assessment of
Effectiveness of Strategic Planning: A Discriminant Analysis
Approach" conducted by Ramanujam, v., Venkatraman, N., &
Camillus, J. c. (1986) examined the dimensions of planning
elements that contribute to differences in effectiveness
between more and less effective planning systems. The
Ramanujam study examined seven dimensions of planning and
linked these dimensions to three established criteria of
planning effectiveness.
According to Ramanujam, Venkatraman & Camillus, (1986)

the stated three criteria are an indication of whether a
planning system is more or less effective. These criteria
bave the support of literature, and include:
63
1. the extent of fulfillment of key planning objectives.
2. the economic performance of an organization.
3. an overall measure of satisfaction within the
organization.
Criteria I
Fulfillment of Key Objectives
criteria I examines the extent of fulfillment of key
planning objectives. Six commonly emphasized objectives were
used to assess this criteria. They were:
1. Predicting Future Trends - Organizations are becoming
increasingly turbulent, necessitating some formal mechanisms
for monitoring and coping with environmental change. Planning
helps organizations to delineate probable, plausible, and
preferable future states of the world (Amara, 1981).
According to Paul, Donavan, & Taylor, (1978) a major problem
with planning is the inability of planners to produce
reasonably valid forecasts of the future. Predicting future
trends is recognized as an important task of planning.
2. Evaluating Alternatives - Good planning systems
serve as a vehicle for mind stretching (Camillus, 1975) and
delicately balance control and creativity (Shank, Niblock, &
Sandalls, 1973).
3. Avoiding Problem Areas - Effective planning systems
are adaptive learning systems. They increase the probability

of achieving goals and minimize the recurrence of errors.
The effective planning system should avoid problem areas
(Lorange & Vancil, 1977).
64
4. Enhancing Management Development - Effective planning
systems should improve the quality of management and
facilitate management succession. (Hax & Majluf, 1984;
Lorange & Vancil, 1977).
s. Improving Short Term Performance & 6. Improving Long
Term Performance - The improvement of short-term and long
term performance is the major reason for adopting planning
systems.
criteria II
Performance Relative to Competition
Effective planning systems should improve organizational
performance in ways which permit organizations to not only
achieve their objectives, but to perform at a relatively
higher level. The Ramanujam study used four performance
indicators: (a) growth in sales, (b) growth in earnings,
(c) changes in market share, and (d) return on investment.
criteria III
Satisfaction with Planning Systems
satisfaction with planning systems was an additional
criteria of effectiveness. This criteria is especially
important with mandatory planning systems. This approach is
common in literature concerning implementation of management
information systems (Lucas, 1978).
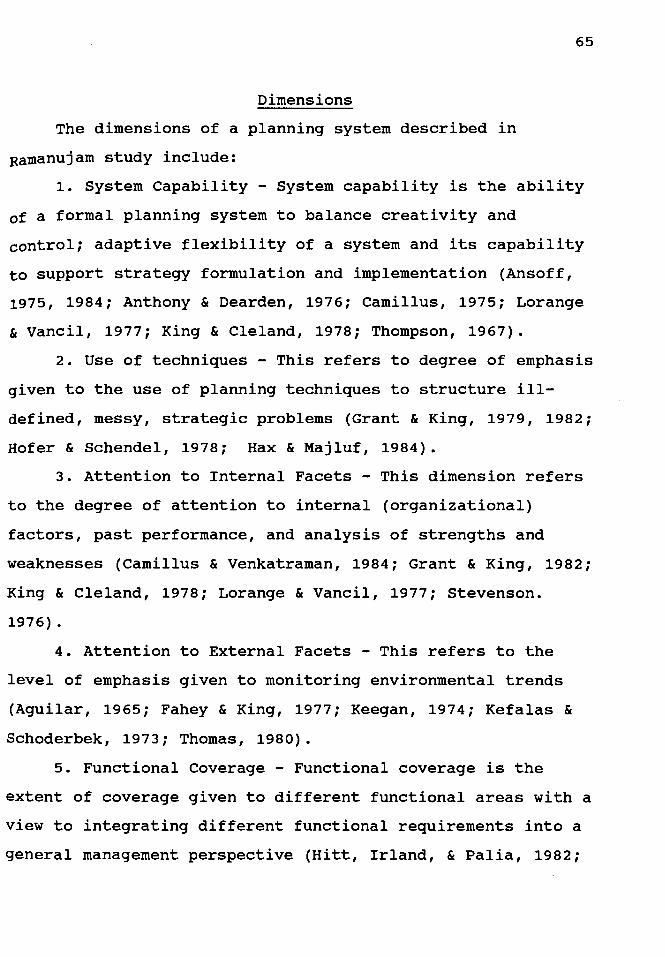
Dimensions
The dimensions of a planning system described in
Ramanujam study include:
65
1. System Capability - System capability is the ability
of a formal planning system to balance creativity and
control; adaptive flexibility of a system and its capability
to support strategy formulation and implementation (Ansoff,
1975, 1984; Anthony & Dearden, 1976; Camillus, 1975; Lorange
& Vancil, 1977; King & Cleland, 1978; Thompson, 1967).
2. Use of techniques - This refers to degree of emphasis
given to the use of planning techniques to structure ill-
def ined, messy, strategic problems {Grant & King, 1979, 1982;
Hofer & Schendel, 1978; Hax & Majluf, 1984).
3. Attention to Internal Facets - This dimension refers
to the degree of attention to internal (organizational)
factors, past performance, and analysis of strengths and
weaknesses {Camillus & Venkatraman, 1984; Grant & King, 1982;
King & Cleland, 1978; Lorange & Vancil, 1977; Stevenson.
1976) .
4. Attention to External Facets - This refers to the
level of emphasis given to monitoring environmental trends
(Aguilar, 1965; Fahey & King, 1977; Keegan, 1974; Kefalas &
Schoderbek, 1973; Thomas, 1980).
5. Functional Coverage - Functional coverage is the
extent of coverage given to different functional areas with a
view to integrating different functional requirements into a
general management perspective (Hitt, Irland, & Palia, 1982;
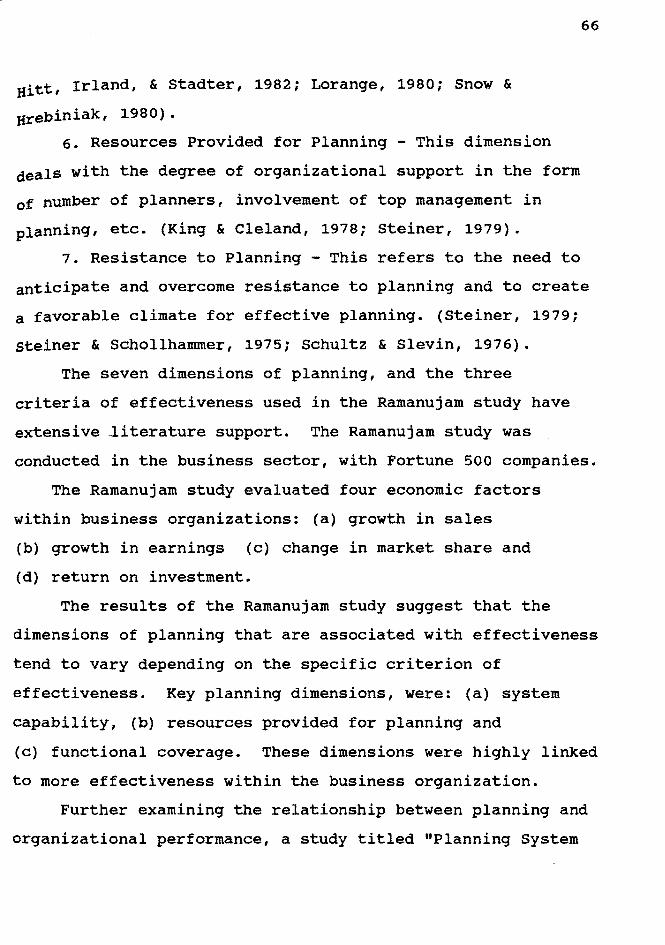
gitt, Irland, & Stadter, 1982; Lorange, 1980; Snow &
arebiniak, 1980) .
6. Resources Provided for Planning - This dimension
deals with the degree of organizational support in the form
of number of planners, involvement of top management in
planning, etc. (King & Cleland, 1978; Steiner, 1979).
66
7. Resistance to Planning - This refers to the need to
anticipate and overcome resistance to planning and to create
a favorable climate for effective planning. (Steiner, 1979;
steiner & Schollhammer, 1975; Schultz & Slevin, 1976).
The seven dimensions of planning, and the three
criteria of effectiveness used in the Ramanujam study have
extensive literature support. The Ramanujam study was
conducted in the business sector, with Fortune 500 companies.
The Ramanujam study evaluated four economic factors
within business organizations: (a) growth in sales
(b) growth in earnings (c) change in market share and
(d) return on investment.
The results of the Ramanujam study suggest that the
dimensions of planning that are associated with effectiveness
tend to vary depending on the specific criterion of
effectiveness. Key planning dimensions, were: (a) system
capability, (b) resources provided for planning and
(c) functional coverage. These dimensions were highly linked
to more effectiveness within the business organization.
Further examining the relationship between planning and
organizational performance, a study titled "Planning System
67
characteristics and Planning Effectiveness" by two of the
three authors of the aforementioned study, Ramanujam &
venkatraman, (1987) adapted the study "Multi-Objective
Assessment of Effectiveness of Strategic Planning: a
oiscriminant Analysis Approach" (1986) slightly. This study
examined the multivariate relationship between six instead of
seven characteristics of planning systems and three different
criteria of planning effectiveness.
In this study system capability was categorized as a
criteria of effectiveness instead of a dimension of a
planning system as it was in the original study. A measure
of satisfaction within the organization was dropped as one of
the three criteria of planning effectiveness.
The authors explained that their purpose was to redirect
planning systems research by addressing the limitations of
previous research which included:
1. Research that viewed planning in terms of
dichotomous classifications such as planner vs. non planner
or formal planner vs. informal planner.
2. Research which dealt almost exclusively with the
financial benefits of planning.
3. Research that was performed without adequate
analytical schema or statistical methods for examining the
interrelationship between planning system characteristics and
planning effectiveness.
The study asked "What characteristics of a planning
system are central for planning effectiveness, with

68
effectiveness being construed in a much broader sense than it
bas been so far?" (Ramanujam & Venkatraman, 1987, p. 454).
The data were collected by means of a detailed
questionnaire sent to Fortune 500 companies. Six hundred
companies were targeted and there was a response of 34.5 %
or 201 companies.
Resistance to planning and resources provided for
planning were the dimensions which contributed most to the
effectiveness of the planning. Of the design dimensions, use
of techniques and external orientation were the important
factors. Internal Orientation and Functional coverage were
not key determinants of effectiveness.
"Strategy, Strategy Making & Performance - An Empirical
Investigation by Segev (1987) studied the effects of the
relationship between strategic types described by Miles and
Snow (1978) and strategy making mode defined by Mintzberg
(1978) on organizational performance.
Mintzberg (1973) described three strategic modes: (a)
Entrepreneurial, (b) Adaptive and (c) Planning.
The Entrepreneurial Mode (Mintzberg, 1973) is
characterized by an active search for new opportunities.
Power is centralized in the hands of the chief executive,
dramatic forward leaps are made in the face of uncertainty,
and growth is the dominant goal of the organization (Segev,
1987, p. 260).
In the Adaptive Mode, (Mintzberg, 1973) clear goals do
not exist. There is not a proactive search for
opportunities, but reactive solutions made to deal with
existing problems. The adaptive mode generally produces a
10wer level of performance.
In the planning mode (Mintzberg, 1973) information
necessary to the functioning of the company, such as costs,
and benefits of competing proposals is systematically
analyzed, so that decisions and strategies can be
integrated.
69
Mintzberg's focus dealt with the motives for decisions,
and on the process used to develop strategies, rather than
focusing on the content of the strategies. "He focused
mainly on the motives for decisions, who makes them, how
alternatives are evaluated, the decisions, horizons,
linkages, organizational goals, flexibility of modes, age of
organization, and types of environments beneficial to each
mode" (Segev, 1987, p. 258).
Miles and Snow (1978) described four strategic types:
(a) Prospector (b) Reactor (c) Defender and (d) Analyzer.
Prospector Organizations value being the first in new
sprung areas, even when their efforts are not profitable.
Their goals are periodically redefined and the organization
responds quickly to new opportunities or early indications of
opportunity.
Organizations of the Reactor type take fewer risks than
their competition. These organizations respond only when
forced to, due to a changing environment. They do not
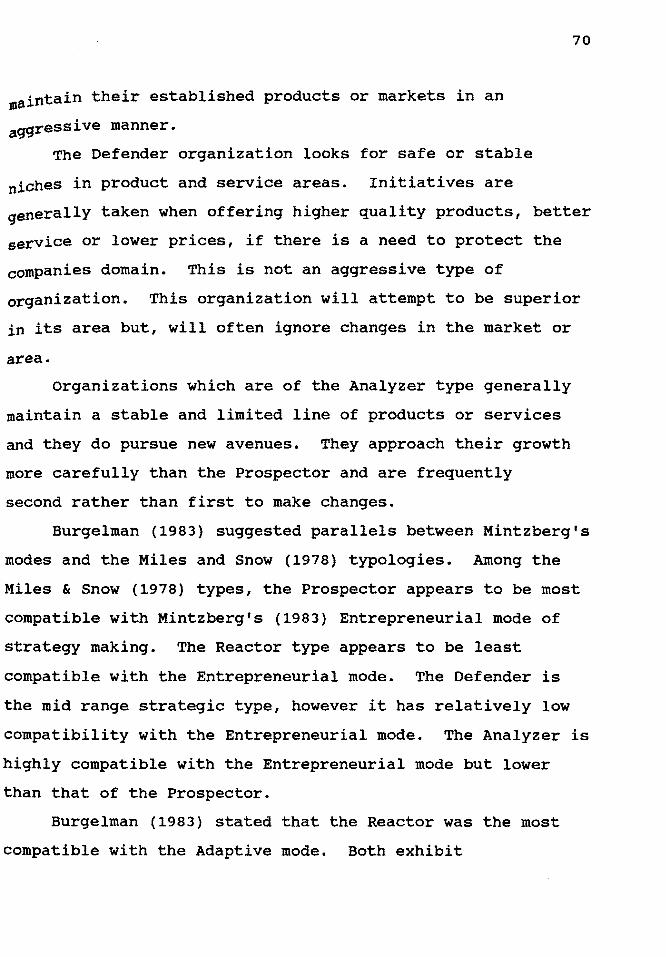
•aintain their established products or markets in an
aqqressive manner.
The Def ender organization looks for safe or stable
70
niches in product and service areas. Initiatives are
qenerally taken when offering higher quality products, better
service or lower prices, if there is a need to protect the
companies domain. This is not an aggressive type of
organization. This organization will attempt to be superior
in its area but, will often ignore changes in the market or
area.
organizations which are of the Analyzer type generally
maintain a stable and limited line of products or services
and they do pursue new avenues. They approach their growth
more carefully than the Prospector and are frequently
second rather than first to make changes.
Burgelman (1983) suggested parallels between Mintzberg's
modes and the Miles and Snow (1978) typologies. Among the
Miles & Snow (1978) types, the Prospector appears to be most
compatible with Mintzberg's (1983) Entrepreneurial mode of
strategy making. The Reactor type appears to be least
compatible with the Entrepreneurial mode. The Defender is
the mid range strategic type, however it has relatively low
compatibility with the Entrepreneurial mode. The Analyzer is
highly compatible with the Entrepreneurial mode but lower
than that of the Prospector.
Burgelman (1983) stated that the Reactor was the most
compatible with the Adaptive mode. Both exhibit
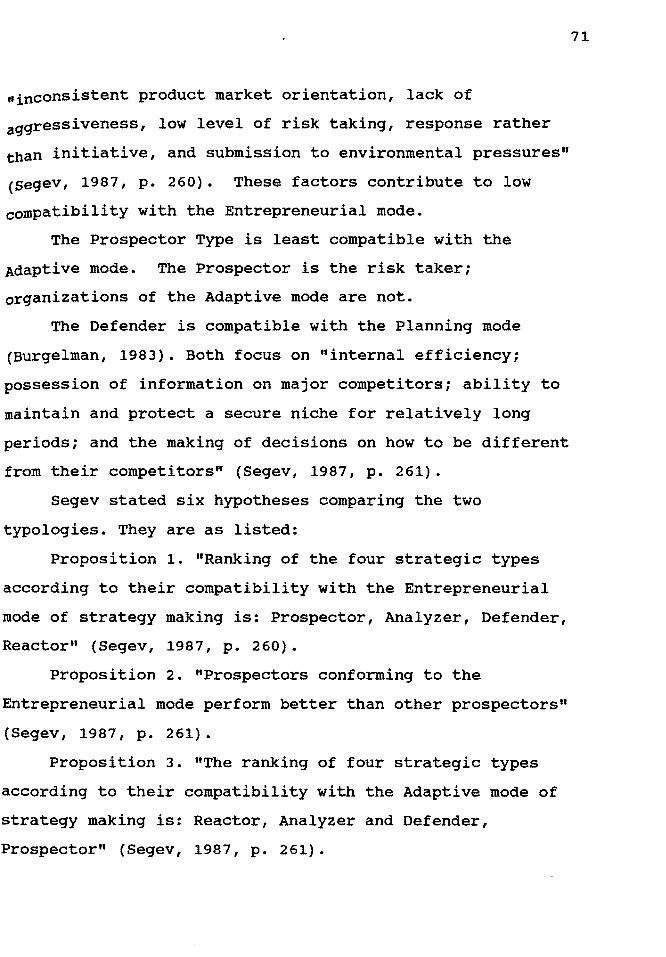
"inconsistent product market orientation, lack of
aggressiveness, low level of risk taking, response rather
than initiative, and submission to environmental pressures"
(Segev, 1987, p. 260). These factors contribute to low
compatibility with the Entrepreneurial mode.
The Prospector Type is least compatible with the
Adaptive mode. The Prospector is the risk taker;
organizations of the Adaptive mode are not.
The Defender is compatible with the Planning mode
(Burgelman, 1983). Both focus on "internal efficiency;
possession of information on major competitors; ability to
maintain and protect a secure niche for relatively long
periods; and the making of decisions on how to be different
from their competitors" {Segev, 1987, p. 261).
Segev stated six hypotheses comparing the two
typologies. They are as listed:
Proposition 1. "Ranking of the four strategic types
according to their compatibility with the Entrepreneurial
mode of strategy making is: Prospector, Analyzer, Defender,
Reactor" (Segev, 1987, p. 260).
Proposition 2. "Prospectors conforming to the
Entrepreneurial mode perform better than other prospectors"
(Segev, 1987, p. 261).
Proposition 3. "The ranking of four strategic types
according to their compatibility with the Adaptive mode of
strategy making is: Reactor, Analyzer and Defender,
Prospector" (Segev, 1987, p. 261).
71

Proposition 4. "Reactors which conform more to the
Adaptive mode perform worse than other Reactors" (Segev,
1987, P· 261).
72
Proposition 5. "The ranking of the four strategic types
according to their compatibility with the Planning mode of
strategy making is: Defender, Analyzer, Prospector and
Reactor" (Segev, 1987, p. 261).
Proposition 6. "Defenders which conform more to the
Planning mode perform better than other Defenders" (Segev,
1987' p. 261).
The findings clearly supported Propositions one, three,
& five, finding strong links between the two typologies.
Propositions two, four, & six were only slightly supported by
the data.
The level of conformity between the strategic types and
the strategy making modes (Propositions one, three, & five)
were analyzed using analysis of variance and mean
comparisons. Organizations categorized as Reactors conformed
to the Entrepreneurial mode of strategy making with a mean of
(3.17). This degree was significantly smaller than those of
the three other strategic types. The Prospectors mean
(4.97) was significantly higher than the mean of the
Defenders (4.15).
Propositions 2, 4, & 6 which dealt with performance as
a function, were analyzed using Pearson r correlations, and
only received slight support.
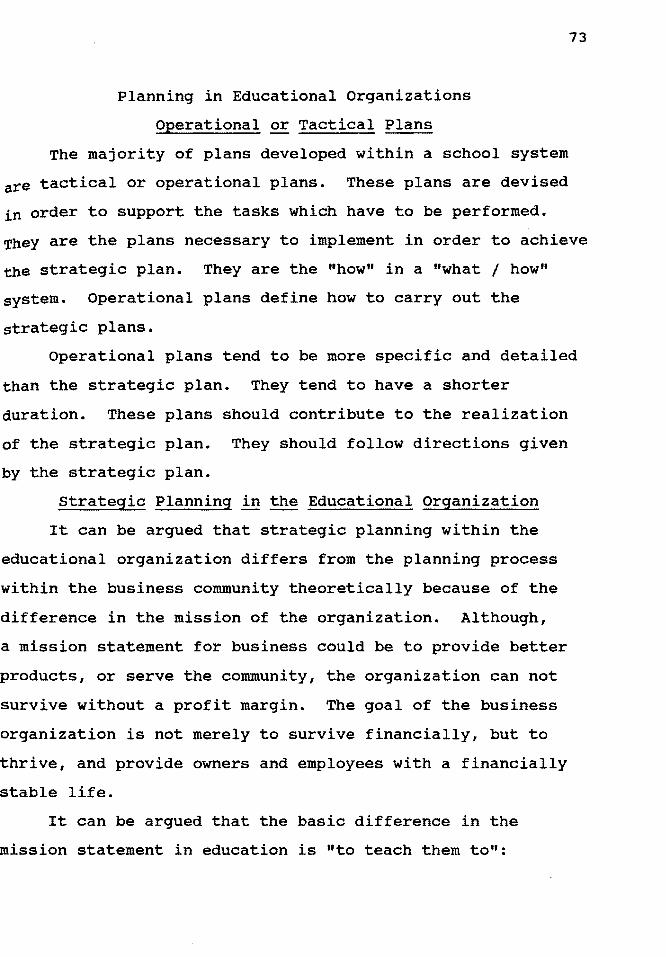
Planning in Educational Organizations
Operational or Tactical Plans
73
The majority of plans developed within a school system
are tactical or operational plans. These plans are devised
in order to support the tasks which have to be performed.
They are the plans necessary to implement in order to achieve
the strategic plan. They are the "how" in a "what / how"
system. Operational plans define how to carry out the
strategic plans.
Operational plans tend to be more specific and detailed
than the strategic plan. They tend to have a shorter
duration. These plans should contribute to the realization
of the strategic plan. They should follow directions given
by the strategic plan.
Strategic Planning in the Educational Organization
It can be argued that strategic planning within the
educational organization differs from the planning process
within the business community theoretically because of the
difference in the mission of the organization. Although,
a mission statement for business could be to provide better
products, or serve the community, the organization can not
survive without a profit margin. The goal of the business
organization is not merely to survive financially, but to
thrive, and provide owners and employees with a financially
stable life.
It can be argued that the basic difference in the
mission statement in education is "to teach them to":

(a) survive (b) thrive.
One can counter the reasoning that the mission
statement of business or education can differ. Businesses
attempt also "to teach the organizations to" survive
and thrive, but at the same time they must prove
their ability to survive, or the organization will cease to
exist.
74
It can also be countered by arguing that students are
expected to survive. Survival of the fittest exists within
the elementary and secondary school organization. Students
who do not learn to read, write, or perform mathematical
functions do not survive the demands of the organization, and
generally do not survive the demands of society. They become
the misfits of society.
In the text "Long Range and Short Range Planning for
Educational Administrators," Lewis (1983) described how to
adapt the strategic planning process to the world of
education.
Most school administrators recognize the essential need
for planning. However, it appears that few school districts
have incorporated effective long range or strategic planning
systems. The mission statements of school districts are
often assumed, and planning is a process which is often
neglected.
According to Lewis (1983) the basic purpose of a school
district is not only to increase student achievement, but
also to: (a) help produce productive members of society

(b) provide students with a better understanding of people
and the world around them (c) help increase literacy and
75
(d} help inculcate the countries political beliefs.
Educational planning is now identifying, collecting, and
analyzing critical internal and external data in order to
prepare and execute long and short range plans to achieve the
basic purposes, mission and operational goals of the school
system.
In the educational community strategic planning is
divided among the central planning unit and the school
planning unit. The central planning unit which includes
central administrative staff (superintendent, assistant
superintendent, directors and others who are accountable to
the superintendent). The central planning unit should be as
small as possible, and should have knowledge of the internal
and external school environment. The School Planning Units
include all schools within the district. The school
planning unit should be provided with the same written plans
as the central planning unit. It should then analyze all
data in its internal and external environment and extend the
plans to meet the unique needs of the school unit.
There are two approaches currently being used to
implemeJlt strategic planning in the educational setting.
They are:
1. The Instructional Program Model - which consists of
developing educational goals and objectives and attempts to
improve performance gains.

76
2. The Comprehensive Model - This approach considers
and critically analyzes the internal and external school
environment and develops mission statements, basic purposes,
educational goals, planning assumptions, long range goals &
strategies to reach those goals.
Lewis (1983) recommended a ten stage process for
installing a strategic planning process within a school
district.
stage ! - Develop and Disseminate Planning Guidelines
The central planning unit is responsible for developing
the planning guidelines which should include a critical
analysis of the internal and external factors of the school
district, past performance results, planning assumptions,
long range goals, program strategies, long range budget, and
operational plans.
stage II - Use Planning Guidelines or Manual to Train Staff.
The planning guidelines or manual should be used to
train the staff in the process of strategic and operational
planning. Actual organization problems should be used in the
training process.
Stage III - Develop Critical Analysis
Essential data about the school district's strengths and
weaknesses is recorded and used as a starting point for
planning. A description of the school district,
demographics, aims of the school district, faculty
information, and student information are included.
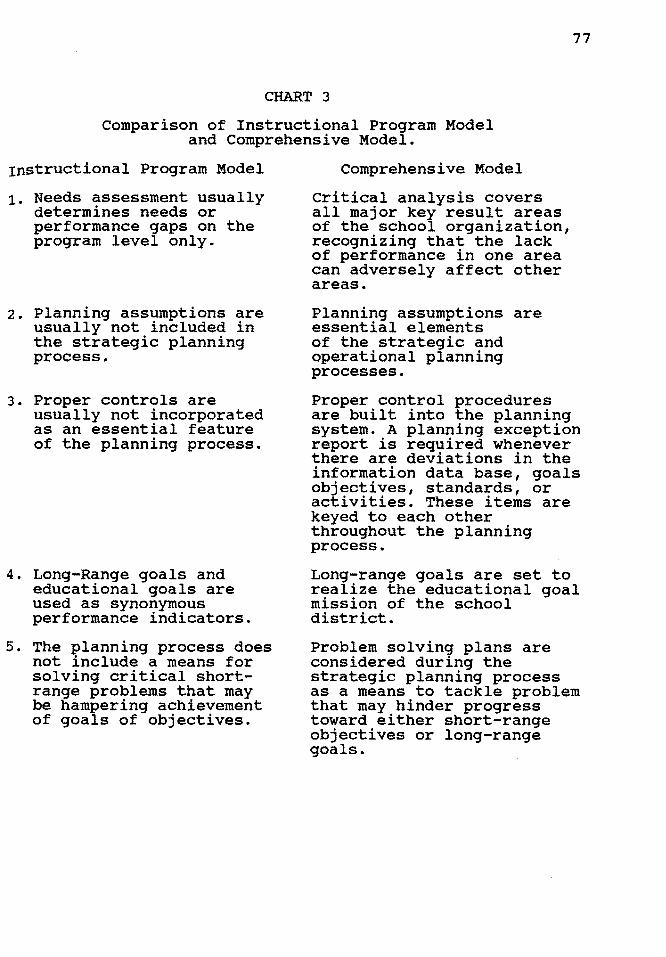
77
CHART 3
Comparison of Instructional Program Model and Comprehensive Model.
Instructional Program Model
1. Needs assessment usually determines needs or performance gaps on the program level only.
2. Planning assumptions are usually not included in the strategic planning process.
3. Proper controls are usually not incorporated as an essential feature of the planning process.
4. Long-Range goals and educational goals are used as synonymous performance indicators.
5. The planning process does not include a means for solving critical shortrange problems that may be hampering achievement of goals of objectives.
Comprehensive Model
Critical analysis covers all major key result areas of the school organization, recognizing that the lack of performance in one area can adversely affect other areas.
Planning assumptions are essential elements of the strategic and operational planning processes.
Proper control procedures are built into the planning system. A planning exception report is required whenever there are deviations in the information data base, goals objectives, standards, or activities. These items are keyed to each other throughout the planning process.
Long-range goals are set to realize the educational goal mission of the school district.
Problem solvin9 plans are considered during the strategic planning process as a means to tackle problem that may hinder progress toward either short-range objectives or long-range goals.
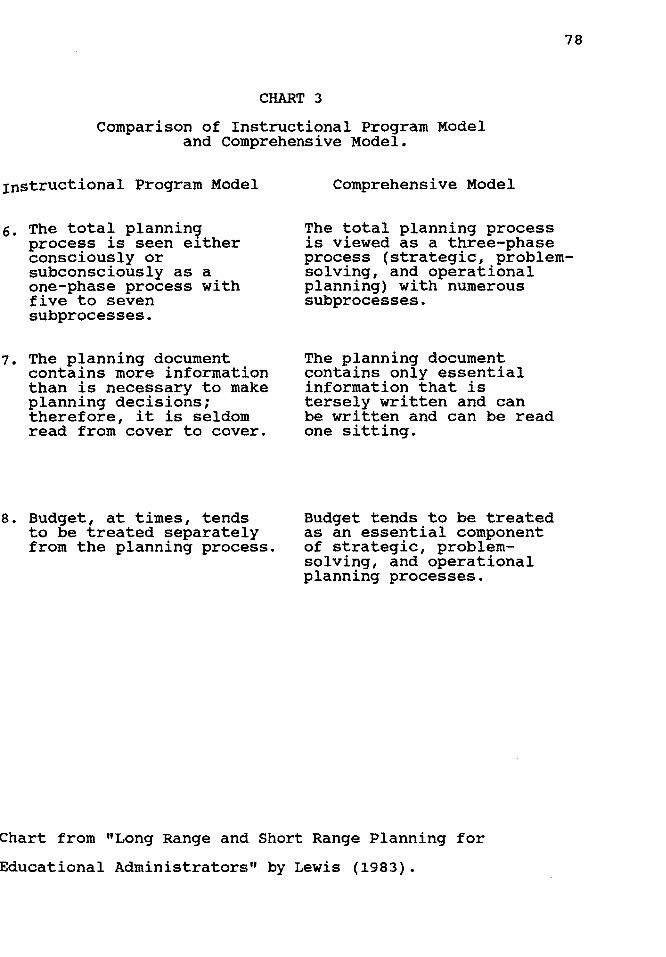
78
CHART 3
Comparison of Instructional Program Model and Comprehensive Model.
instructional Program Model
6. The total plannin~ process is seen either consciously or subconsciously as a one-phase process with five to seven subprocesses.
1. The planning document contains more information than is necessary to make planning decisions; therefore, it is seldom read from cover to cover.
8. Budget, at times, tends to be treated separately from the planning process.
Comprehensive Model
The total planning process is viewed as a three-phase process (strategic, problemsolving, and operational planning) with numerous subprocesses.
The planning document contains only essential information that is tersely written and can be written and can be read one sitting.
Budget tends to be treated as an essential component of strategic, problemsolving, and operational planning processes.
Chart from "Long Range and Short Range Planning for
Educational Administrators" by Lewis (1983).

Information about the external environment of the school
district is also included.
~age IV - Develop Individual Strategic Plans
Unit administrators construct strategic plans for
individual school planning units using information provided
by the central planning units.
stage ~ - Consolidate, Review and
Analyze Individual Strategic Plans
79
Planning coordinator collects individual unit strategic
plans and reviews and evaluates them for content and
comprehensiveness. If the plans are satisfactory, they are
further examined by the central planning unit. Assistance is
provided to unit administrators with unsatisfactory plans.
Stage VI - Plan Adjustment
Central unit personnel suggest changes for improvement
of the individual school strategic plans.
Stage VII - Final Approval of Plans
Strategic plans are submitted to the Board of Education
for approval. Changes are suggested and made, and final plan
is distributed to each planning unit administrator.
Stage VIII - Construct Operational Plans
Planning unit administrators and staff members are
responsible for developing operational plans which help
accomplish the strategic plan. The operational plan is then
submitted to the central office for approval.
Stage IX - Evaluation
Planning unit administrators submit monthly or quarterly

reports to the central unit. These reports serve as the
,asis for the evaluation of the short range objectives
!Pd activities that help reach the strategic goals.
~a~ ~ - Recycle
80
Information is reviewed and updated on an annual basis.
For an additional explanation of the strategic
,1anning process within the educational organization - the
reader is ref erred to Long Range and Short Range Planning for
~ducational Administrators by Lewis (1983).
Summary
The planning process is a intricate procedure with an
9xtensive history. Planning has evolved from a simple to a
:omplex and comprehensive process. It is a process which
!ttempts to increase the level of performance within
Jrganizations as it guides actions to be carried out in the
Euture.

CHAPTER III
FINDINGS
Research Questions
This study addressed the following research questions:
1. To what extent are educators involved in strategic
planning?
2. Are strategic planning systems in educational
systems effective, according to three established
criteria of effectiveness?
3. Is this effectiveness directly related to seven
established dimensions of planning which influence
effectiveness?
81
4. How do strategic and nonstrategic planners compare?
The first research question examines the extent to which
educators are involved in the strategic planning process. The
respondents were separated according to whether they defined
themselves as: (a) strategic planners or (b) planners who do
not use the strategic planning process.
Research questions two and three are examined twice.
Both the strategic planners and the nonstrategic planners
were analyzed statistically in order to determine whether
their planning systems were effective or ineffective.

82
Effective and ineffective planners are described as
Group 1 and Group 2, for both the strategic and nonstrategic
planners. Group 1 represents the effective planners; Group 2
represents the ineffective planners.
Research question four compares the results of the
strategic and nonstrategic planners.
Research Question 1
To What Extent are Educators Involved in Strategic Planning?
In order to determine to what extent educators are
involved in strategic planning, 288 surveys were sent to all
district superintendents in the 6 county Chicago metropolitan
area.
There was a good return rate, as 172 of the surveys
were returned. Of the 172 returned, 156 were usable.
Therefore, there was a net of 54% usable returned surveys.
Seventy-three percent (114) of the respondents defined
themselves as strategic planners. The other 27% (42) defined
themselves as planners, but not strategic planners.
Strategic Planners
Research Question 2
Are the Strategic Planning Systems Effective According
to Three Established Criteria of Effectiveness?
Criterion # 1
Fulfillment of Key Planninq_Objectives
Of the 156 respondents, 85% of the superintendents in
83
the six county area are fulfilling the key planning
objectives. The six key objectives are: (a) predicting future
trends, (b) evaluating alternatives, (c) avoiding problem
areas, (d) enhancing management development, (e) improving
short term performance, and (f) improving long term
performance.
Evaluating alternatives and improving long term
performance had the highest level of fulfillment at 86%.
Predicting future trends was next with 76% fulfillment of
objectives. Improving short term performance had 74%
fulfillment. Enhancing management development was 68%, and
avoiding problem areas 60%. The objective composite was 85%.
Table 1 depicts the results of the discriminant
analysis using variables measuring fulfillment of objectives
as the effectiveness criteria.
The results of the discriminant analysis using variables
measuring fulfillment of objectives as the effectiveness
criteria are presented in Table 1. All of the
discriminant functions were significant at p < .001. The
unequal group sizes may be partly responsible for the invalid
assumption of equality of group dispersion matrices, i.e.,
groups do not have equal variances for each variable.
The percent classified accurately by the linear
classification rule was significantly greater than the
percentage accuracy of chance model based on sample prior
probabilities.
84
Functional coverage and resistance to planning were the
variables with significant standardized discriminant function
coefficients for predicting future trends. For evaluating
alternatives, four variables had significant standardized
discriminant function coefficients: (a) attention to internal
facets, (b) attention to external facets, (c) functional
coverage and (d) resistance to planning.
For avoiding problem areas, resistance to planning
was the only significant variable. System capability was the
only variable which contributed significantly to enhancing
management development and improving long-term performance.
No single variable significantly predicted improving short
term performance. System capability and resources provided
for planning significantly contributed to the objective
composite.
Criterion # 2
Evaluation of Student Performance
As compared to 1983 statistics, superintendents had
positive evaluations of their district's student performance.
Seventy-two percent of the superintendents reported national
math scores as better or much better than they were in
1983. Seventy percent reported better district math scores.
Superintendents had higher evaluations of improvement in math
scores than reading scores. National reading scores were

85
TABLE 1
Results of Discrimininant Analysis for Groupings Based on variables Measuring Fulfillment of Objectives (Criterion # 1)
Strategic Planners
Measures of Fulfillment of Objectives
Predictin9 Avoidlnc; £nhancin9 Inoprovinq Inoprovinq Future Evaluatin<J Problem H;ment. Short•term l.c:lnq-te m Obj.
Criterion 11 Trends Alternat 1 ws Areas Develop. Perform. l?erfom. C°""'°s.
Nm> 114 114 114 114 114 114 114 Gro\lp Size• 87 (7H) ta (86•) " (60•) 71 (18•1 84 (74•1 118 (86'1 97 (85•1
Group 1 - Eff. Plan: -.tulfilled or en t..irflly tulf illed
GroUp 2 - Ineff. Plant 27 (24') 16 (14'1 46 (40•) 31 (32•1 30 (2'•) 16 €14'1 17 (15,) eat.ir-1.y unfu.lfilled, - what unful-fill.O, or n.utral
SitnJ,fica.nce leveb of p < .001 p < .001 p < .001 p < .001 p < .001 p < .001 p < .001 ll.nM..I: dbcrUl:i.nant tunc:=ielft9
A.Nullplticm of equality p < .0012 p < .0001 p < .0023 p < .001 p < .020 p < .005 p < .001 of 9~ di11P9nicn Mtrfces<P for Bcm'• IO
Percent cluaifi.O acc:urat.ely by linear claHificat.icn J:'Ul.•
Gmup 1 18.4t 10.Zt 15.0t 70.ft Q.2' 79.lt 14.7' Gmup 2 Q.5t 71.4t 10.0t 54.H 57.5' 11.n "·" OVlu:all 67.0t 79.0t 63.0t 65. 7' 61.0t 7!1.0t 13.9'
P~ aoccw:acy of 63.5' 75.tt 52.0t 57.0t '1.5' 76.0t 75.7' c:Mnce moclel biaHd Clll S1111Pl• prior prabl.b111t1••
sund.ucl11ecl diacr:iainant func:t.1on coefficient•
s:v-- Cllplbility -o.os -o.u 0.41 O.H 0.07 O.IO o. 71
O•oft"""'.-• -0.0f -0.01 0.41 O.lt 0.21 0.21 -0.22
Mtmll:i• Mt J.ac--.1 0.40 0.11 -0.07 -0.ll -0.07 0.11 -0.52 fMICa
M:t...uan Mt ....... ) -0.42 -0.72 0.3t -0.12 0.15 0.04 -0.20 f..U
l'\anc:tJ.ona1 oo••.,. 0.50 0.5f 0.14 -o·.02 o.u O.lt 0.3t
........ pnri.dlld 0.15 o.os -0.0I 0.11 -0.15 0.01 o.u tor planninlJ
Reailtancll to PlMlnint 0.15 O.t'7 -0.50 0.01 o.ot 0.40 0.44
• lD CM ft.ra'*Jic Plami.ft9 .bWJ 11 It. ~. Gmup 1 (Ufec.iftl •i..m.nt ~· zau.np of 4 _. 5,
Gmup 2 (IM!ftlCtiftl ti..m.n> ~ mUnp of 1,2, and 3. RaUlllP 1-5 are •• followaa
l"'Wlt.inly ~fill.a 4----.t fulfilled 2 1w1.mt. tul.Wl.O ~y tul.Wl.0 ~

86
reported improved by 67% of the superintendents, and
district reading scores were reported improved by 61%.
Fifty-nine percent of superintendents reported improvement in
student attendance. Student dropout rate, and percent of
college bound students were applicable only to school
districts with high schools.
Table 2 shows that of all districts, 48% of strategic
planners reported an improvement in dropout rate, and 50%
reported improvement in percentage of college bound students.
The performance composite indicated that of all districts,
61% of strategic planners saw improvement in student
performance. The majority of districts indicate student
performance has improved since 1983.
Table 2 depicts the results of the discriminant analysis
for groupings based on performance relative to competition.
All of the discriminant functions were significant at
p <.001. The unequal group sizes may be partly responsible
for the invalid assumption of equality of group dispersion
matrices,
variable.
i.e., groups do not have equal variances for each
The percent classified accurately by the linear
classification rule was significantly greater than the
percentage accuracy of chance model based on sample prior
probabilities. Attention to external facets and resistance to
planning were the variables with significant standardized
discriminant function coefficients for district reading
scores performance measures. For national math scores,
functional coverage had significant standardized discriminant
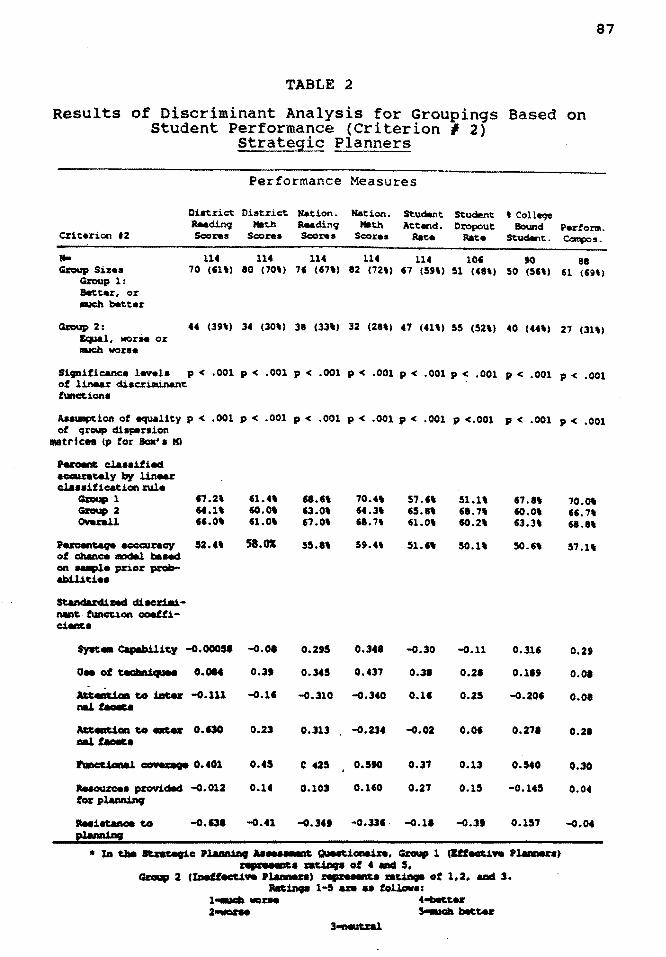
87
TABLE 2
Results of Discriminant Analysis for Groupings Based on Student Performance (Criterion # 2)
Strategic Planners
CriteriOCI tz
... Gl:'OUp Sizes
G.roup 1: a.teer, or .u:h. batter
District a..cli.nq Scores
114 70 (Sltl
Performance
District •tion. Math bacli.nq
Scores Scores
114 114 80 (70t) " (67')
Measures
•tion. Student Student t College Math AttWtd. Dxopout Bound Perform.
Scores Rat• Rat• StucMint. Ccqx>s.
114 114 106 90 88 ez nzt1 '7 (5H) 51 (48') 50 (SHI 151 (Sin)
Gl:'OUp z: 44 (39') 34 (30t) 38 (33\) 32 (28') 47 (41') 55 (52\) 40 (44') 27 (31') lqu&l, worH or .u:h. worse
Sifnificance levela p < .001 p < .001 p < .001 P < .001 p < .001 p < .001 p < .001 p < .001 of 11-r diacrilllinant funct.iona
Aaampc:ion of llqU&lity p < .001 p < .001 p < .001 p < .001 p < .001 p <.001 p < .001 p < .001 of qrcup d11per1ion
matrices Ip for Sox'• Ml
'--* claa1ified aocun1:ely by l1tl.-r claHification .r:W.• ~1 '7.2' '1.4' "·" 70.4' 57.H 51.1' "·" 70.0t ~2 '4.1' '°·°' 63.0t '4.3t '5.8' "·" so.ot "·" ov.mail H.Ot '1.0t '7.0t 68.7' '1.0t so.2t 63.3t 61.8'
P~ acccurac:y 52.4' 58.0I 55.8' 5t.4' 51.H 50.1' 50.H 57.n of ch&nc9 lllDdlll balled on M1111Pl• prior pzob-abili.ti ..
Standud:l&ed di1crill:L-MDC.· function coeffi-cienc.1
Syft• Olpabilic.y -0.000H -0.01 0.2t5 o •. 348 -0.30 -0.11 0.311 0.2t
DM oftldlahpM O.OM O.lt 0.345 0.437 0 • .11 0.21 O.llt 0.01
~to illCAlr -o.u1 -o.u -0.310 -0.340 0.11 0.25 -0.20• 0.08 nal tllOllU
AUmtiaa to ate&' 0.'30 0.23 0 • .113 -0.234 -0.02 0.01 0.271 0.21 Ml tllOllU
l"uac:Ciwl 00"9D9'J 0.401 0.45 c 425 0.590 0.3'1 0.13 0.540 0.30
R.eaow:ce• pzoridld -0.012 o.u 0.103 o.uo 0.2'1 0.15 -0.145 o.ot for plAnnincJ
,..1st.Moe to -0.131 -o.u -0.ltt -0 • .1H. -0.11 -0.31 0.15'1 -0.0t p1ann.inJ
• In tM 1Ua1:e9ic Pl.alla.taf 1.1t .. _,c, ~onaire, ~ 1 ~ecUft Pl.tmlllnl E~• zaU,.• of t and 5,
Gz:aup 2 (lneUecc.t.ft Pl.tmlllnl ~· mtiftp of 1,2, and 3. ktinp 1-s an u foll.ow•:
l"'IUC!b WDrM 4 ... U&' 2-..one 5-acb ~tu
l"'MUU!ll

88
function coefficients.
For percent of college bound students, functional
coverage was the only significant variable. No single
variable significantly predicted district math scores,
national reading scores, student attendance rate, or dropout
rate.
criterion # 1
satisfaction With Planning Systems
Of the 114 strategic planners 76% classified themselves
as satisfied planners. Table 3 represents the results of
the discriminant analysis using satisfaction as the measure
of effectiveness. The discriminant function was significant
at p <.001. The inequality of group sizes may be partly
responsible for the invalid assumption of equality of group
dispersion matrices, i.e., the groups do not have equal
matrices for each variable. At least three-fourths of the
sample was correctly classified. This was significantly
greater that the 63.08 accuracy of chance model based on a
sample group prior probabilities.
System capability and resources provided for planning
were the only two variables with significant standardized
discriminant function coefficients.
Table 4 shows corresponding statistics for the
variables measuring effectiveness and composites. The
conclusions show that all variables show tendency to positive
effectiveness of planning systems. Restated, all variables
are related.
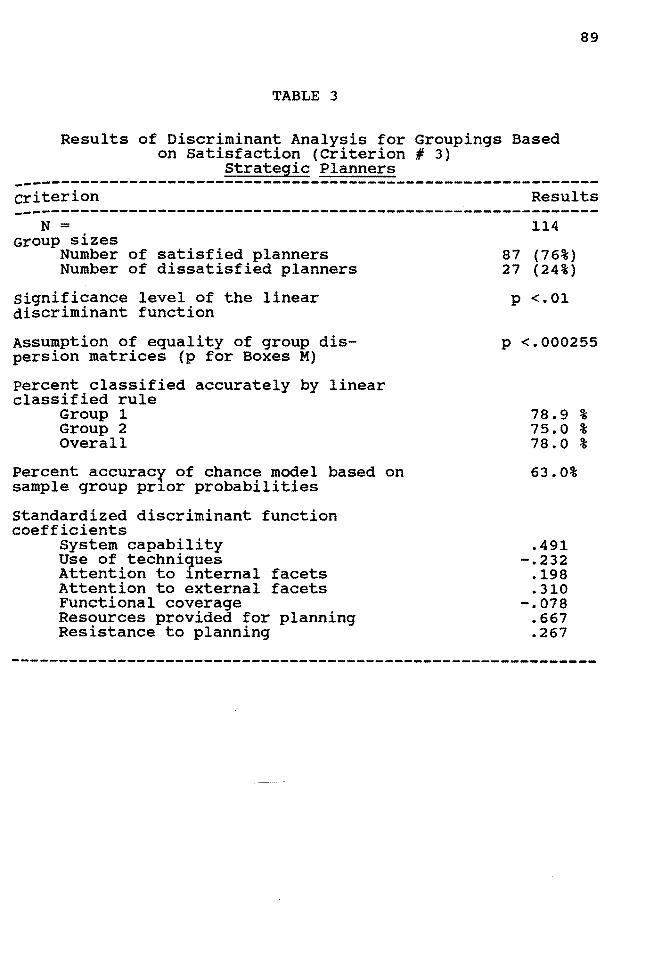
89
TABLE 3
Results of Discriminant Analysis for Groupings Based on Satisfaction (Criterion # 3)
Strategic Planners -------------------------------------------------------------criterion Results -------------------------------------------------------------
N = Group sizes
Number of satisfied planners Number of dissatisfied planners
significance level of the linear discriminant function
Assumption of equality of group dispersion matrices (p for Boxes M)
Percent classified accurately by linear classified rule
Group 1 Group 2 overall
Percent accurac¥ of chance model based on sample group prior probabilities
Standardized discriminant function coefficients
System capability Use of techni9ues Attention to internal facets Attention to external facets Functional coverage Resources provided for planning Resistance to planning
114
87 (76%) 27 ( 24%)
p <.01
p <.000255
78.9 % 75.0 % 78.0 %
63.0%
.491 -.232
.198
.310 -.078
.667
.267

90
TABLE 4
Means, Standard Deviations, and Intercorrelations of the Variables Measuring Effectiveness of Planning Systems
strategic Planners
Variable a n Maans s.d. l 2 3 4 s 6 7 8 9 10 11 12 13 14 15 16
1. Predict. 114 3.94 0.81 1.0 .62 .24 .34 .24 .38 . 71 .08 .ll .lS .11 -.OS .12 .19 .21 .33 future t::.nda
2. Evaluate altemativea
114 4.17 0.69 1.0 .18 .39 .23 .47 .70 .08 .ls .09 .11 .04 .04 .18 .22 .42
3. Avoid 114 3.68 l.06 - - l.O .14 .2S .17 .S7 .03 .01 -.09-.lS -.16 .02 .06 .07 .OS Ptoi:>l- Area.a
4. EnhanC41 ~t deVelopnant
S • I111>rove short Tenn P•rformanc:•
6. !l11>Z:OV• lonq term perfoi:manc:•
8. Ccaplriaon
113 3.9 0.86 - - - 1.0 .27 .43 .66 .14 .OS .19 .12 .01-.00 .22 .24 .46
114 3.89 0.73 - - - - l.O .32 .S7 .27 .20 .24 .12 .OS .08 .23 .28 .09
114 4.26 0.74 -- - - - - 1.0 .68 .19 .lS .18 .13 .10 .09 .32 .29 .60
113 3.97 0.52 - - - - - - 1.0 .17 .14 .18 .09 -.01 .10 .33 .34 .47
of district. 114 3.69 0.64 - - - - - - - LO .72 .SO .39 .32 .45 .36 .68 .16 T••t ac:or•• in readinq
9. Coqiar:i-aion of 114 3.82 0.66 - --- --- - -- - - - l.O .SO .S6 .29 .34 .30 .66 .09 district. t••t sc:or•• in math
10. OOl!pl.rison of national readinq ac:or••
11. OOl!pl.ri•on of national. -th sc::orea
12. Student attendance. rate
13. Student dropout rate
14. percent of c:olleqe bound student•
15. Perform. on CCJllllOISit•
16. Satisf.
113 3.88 o. 79 - - - - - -- - - - 1.0 .85 .so .28 .S6 .80 .lS
114 3.98 0.77 - - - - - - - - - - 1.0 .Sl .25 .42 .75 .12
- - - - - - - - - - - 1.0 .62 .S7 . 72 .14 114 3.80 0.81
106 3.73 O.H - - - - - - - - - - - - l.O .SS .65 .14
90 3.73 0.82 - - - - - - - - - - - - - l.O .76 .33
88 3.78 o.ss - - - - - - - - - - - - - - 1.0 .27
114 3.88 0.81 - - - - - - - - - - - - - - - 1.0
All correlations above r - .205 are significant at p < .05
91
Table 5 shows the means, standard deviations, ranges and
intercorrelations of the seven dimensions of planning
systems. All seven dimensions represent normally distributed
variables. The intercorrelations are moderate (.3 -.6)
oiscriminant analysis was determined to be the appropriate
statistical approach. The use of multiple regression may
seem appropriate, but it is not when multicollinearity is
present in the data. Multicollinearity does not affect
the interpretation of the results of discriminant analysis.
Research Question l
Is This Effectiveness Directly Related to the Seven
Established Dimensions of Planning?
Six out of seven dimensions are positive: (a) system
capability, (b) attention to external facets, (c) attention
to internal facets, (d) emphasis on functional coverage
(e) resources provided for planning and (f) resistance to
planning were positive factors. Use of techniques was a
neutral factor.
Table 6 presents relative importance rankings of the
dimensions of planning in a number of discriminant analysis.
The results relating the dimensions to the effectiveness
measures show that the most important factor for predicting
future trends is use of techniques. Functional coverage and
attention to external facets rank second and third,
respectively, in the importance of predicting future trends.
Attention to internal facets is fourth in relative
importance, while system capability is fifth. The variables

TABLE 5
Means, Standard Deviations, and Intercorrelations of the Seven Dimensions of Planning Systems
Strategic Planners
92
-------------------------------------------------------------oimensions Means s.d. 1 2 3 4 5 6 7
-------------------------------------------------------------1. System 52.43
capability 43.32 1 .30 .46 .47 .58 .37 .47
2. Use of 18.23 17.65 1. 0 .28 .47 .33 .41 .32 Technique
3. Attention 11. 77 3.12 1. 0 .50 .41 .22 .22 to internal facets
4. Attention 15.95 4.60 ---- 1. 0 .58 .37 .38 to external facets
5. Functional 28.16 14.01 ---- --- 1.0 .36 .32 coverage
6. Resources 14.13 10.46 ---- --- 1. 0 .47 provided planning
for
7. Resistance 7.38 11.12 ---- --- 1.0 to planning
-------------------------------------------------------------All values are based on data from 114 school districts used in the discriminant analysis.
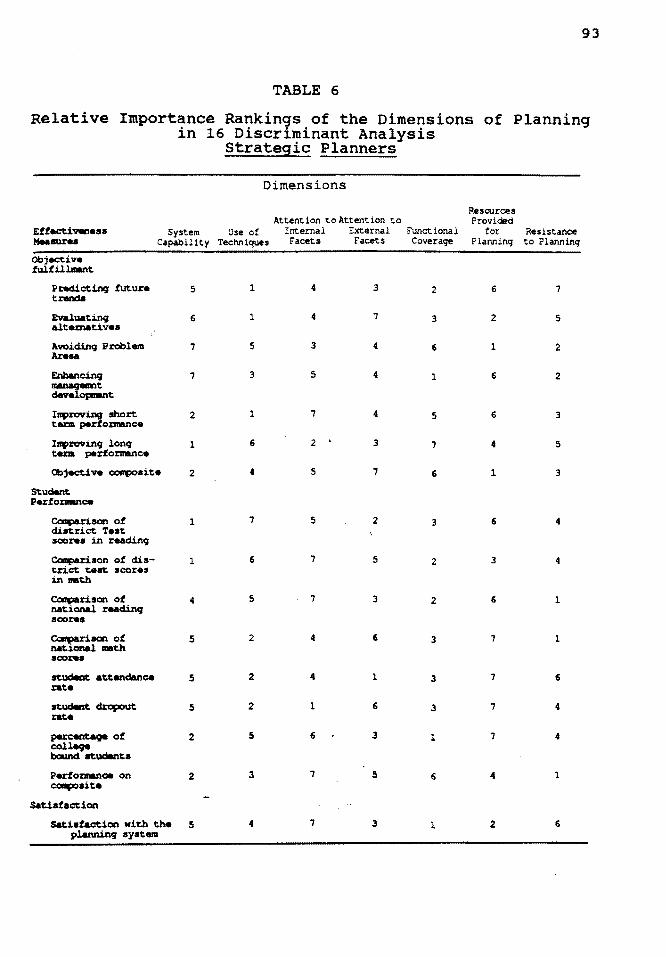
93
TABLE 6
Relative Importance Rankings of the Dimensions of Planning in 16 Discriminant Analysis
Strategic Planners
Dimensions
Attention to Attention to System Use of Internal External Functional
Capability Techniques Facets Facets Coverage
Objective fulfil1-nt
Pndicting future trenda
Evaluating alteaiativea
Awidinq Problem Arllaa
Enhancing lllllNlqmrlt delrelopnant
Inp:mving short texm perfo:r::mance
Inp:mvinq lonq te:i:m. performance
Objec:tive coq;>oeite
Stuo.nt Perf o:tnmtce
Colparisan of district Test soor.a in readinq
Ccmpariaon of district test score• in mth
Ccmpariscn of national readinq aoor.•
Satisfaction
s
6
7
7
2
1
2
1
1
4
s
s
s
2
2
Sati•f&ction with t.he S planninq ayatem
1 4 3 2
1 4 7 3
s 3 4 6
3 s 4 1
1 7 4 5
6 2 3 7
4 5 7 6
7 5 2 3
6 5 2
5 7 3 2
2 4 3
2 4 1 3
2 l 6 3
s 6 3 l
3 7 s 6
4 7 3 1
Resources Provided
for Resistance Planning to Planning
6 7
2 s
1 2
6 2
6 3
4 s
1 3
6 4
3 4
6 1
7 l
7 6
7 4
7 4
4 1
2 6

that are sixth and seventh in the relative importance for
pedicting future trends are resources provided for planning
and resistance to planning.
Characteristics of Strategic Planners
94
The characteristics of the respondents and their school
districts in Table 7 show that there is clearly a bias in
favor of male superintendents. The majority (77%) have been
employed in the field of education for 21 or more years.
seventy-six percent of the sample has been employed by the
current school system for up to 15 years. Over three-fourths
of the sample has a doctorate. Eighty-nine percent of the
sample has been involved in strategic planning for up to
eight years.
Nonstrategic Planners
Research Question £ Are the Planning Systems Effective According to the
Three Established Criteria of Effectiveness?
Criterion # 1
Fulfillment of Key Planning Objectives
The superintendents who classified themselves as non
strategic planners in the six county metropolitan area are
fulfilling five out of six key planning objectives, but at a
lower rate than the strategic planners. Evaluating
alternatives had the highest level of fulfillment at 75%.
Improving long term performance was second at 69%. Improving
short term performance and avoiding problem areas had a 67%
level of fulfillment. Enhancing management development had a

TABLE 7
characteristics of Respondents and Their School Districts Strategic Planners
95
-------------------------------------------------------------Characteristics Respondents (n = 114) -------------------------------------------------------------position
Superintendent Assistant Superintendent Other
sex Male Female
Number of Years Employed in Field of Education
o 5 years 6 - 10 years 11 - 15 years 16 - 20 years 21 - 25 years 26 - 30 years 31 - + years
Number of Years Employed by current School system
o 5 years 6 - 10 years 11 - 15 years 16 - 20 years 21 - 25 years 26 - 30 years 31 - + years
Highest Degree M.A. C.A.S. Doctorate
District - Directly Involved in School Planning
Yes No
District - Directly Involved in Strategic Planning
Yes No
Number of Years District has been Involved in Strategic Planning
o 2 years 3 5 years 6 8 years 9 - 10 years 11 + years
93.86 5.26 0.88
93.86 6.14
1. 75 0.88 2.63
18.42 31.58 29.83 14.91
40.35 19.30 16.67 9.65 9.65 2.63 1. 75
19.30 3.51
77.19
100.00 0.00
100.00 o.oo
17.54 42.11 28.95 9.65 1. 75
~11 figures are percentages. All nonrespondents have been excluded.

96
5a% level of fulfillment. Predicting future trends was
neutral at a 50% level of fulfillment. The objective
composite was 72%. The strategic planners had a higher
ievel of fulfillment of objectives in all six areas than the
nonstrategic planners, and at a higher percentage rate.
Table 8 p~esents the results of discriminant analysis
for groupings based on variables measuring fulfillment of
objectives. For predicting future trends, the significance
level of the linear discriminant function was p < .001. The
assumption of the equality of group dispersion matrices was
met (p for Box's M was< .39). The percent classified
accurately by the linear classification rule was far greater
than chance (63.9 vs. 50). The individual variables that
contributed to group discrimination were: (a) system
capability, (b) functional coverage and (c) resistance to
planning.
For evaluating alternatives, the significance level of
the linear discriminant function was p < .001. The
assumption of the equality of group dispersion matrices was
not met (p for Box's M was< .01). The percent classified
accurately by the linear classification rule was far greater
than chance (83.3 vs. 62.5). The individual variables that
contributed to group discrimination were: (a) system
capability, (b) use of techniques, (c) functional coverage
and (d) resistance to planning.
For avoiding problem areas, the significance level of
linear discriminant function was p < .001. The assumption of
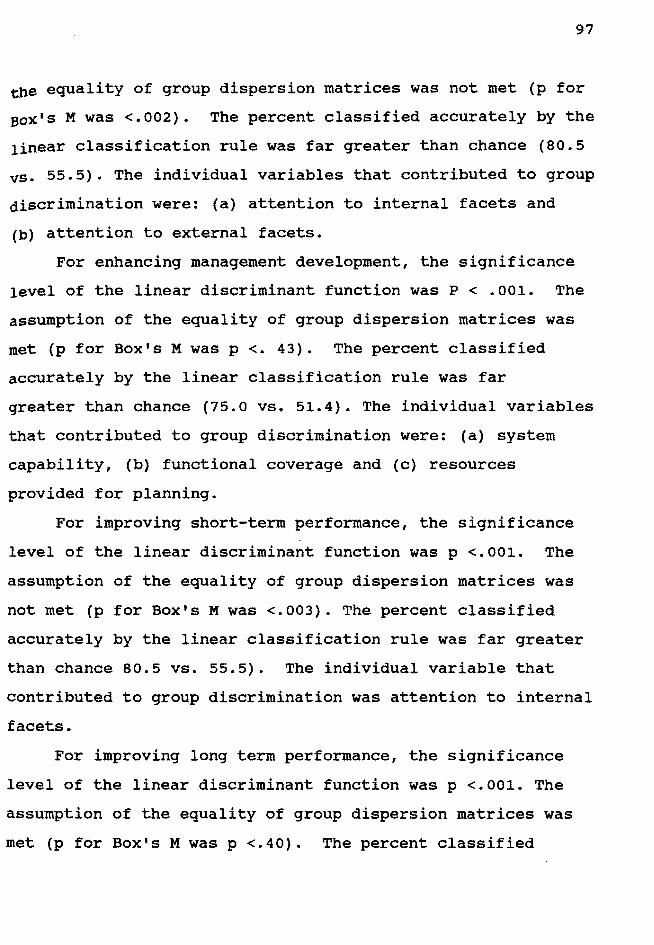
97
the equality of group dispersion matrices was not met (p for
sox's M was <.002). The percent classified accurately by the
1inear classification rule was far greater than chance (80.5
vs. 55.5). The individual variables that contributed to group
discrimination were: (a) attention to internal facets and
(b) attention to external facets.
For enhancing management development, the significance
1evel of the linear discriminant function was P < .001. The
assumption of the equality of group dispersion matrices was
met (p for Box's M wasp<. 43). The percent classified
accurately by the linear classification rule was far
greater than chance (75.0 vs. 51.4). The individual variables
that contributed to group discrimination were: (a) system
capability, (b) functional coverage and (c) resources
provided for planning.
For improving short-term performance, the significance
level of the linear discriminant function was p <.001. The
assumption of the equality of group dispersion matrices was
not met (p for Box's M was <.003). The percent classified
accurately by the linear classification rule was far greater
than chance 80.5 vs. 55.5). The individual variable that
contributed to group discrimination was attention to internal
facets.
For improving long term performance, the significance
level of the linear discriminant function was p <.001. The
assumption of the equality of group dispersion matrices was
met (p for Box's M wasp <.40). The percent classified

98
accurately by the linear classification rule was greater than
chance (83.3 vs. 57.6). The individual variables that
contributed to group discrimination were: (a) system
capability, (b) attention to external facets and
(c) resistance to planning.
For the objective composite, the significance level of
the linear discriminant function was p <.001. The
assumption of the equality of group dispersion matrices was
not met (p for Box's M wasp <.03). The percent classified
accurately by the linear classification rule was far greater
than chance (88.9 vs. 59.9). The individual variables that
contributed to group discrimination were: (a) attention to
external facets and (b) resistance to planning.
Criterion # ~
Evaluation of Student Performance
As compared to 1983 statistics nonstrategic planning
superintendents reported positive evaluations of their
district's student performance at a higher rate than the
strategic planners. National and district reading scores
among nonstrategic planners were reported better or much
better at a higher rate than national and district math
scores in contrast to strategic planners. All percentage
rates in the area of student performance, with the exception
of percentage of college bound students were reported better
or much better at a higher rate among nonstrategic planners
than they were among strategic planners.
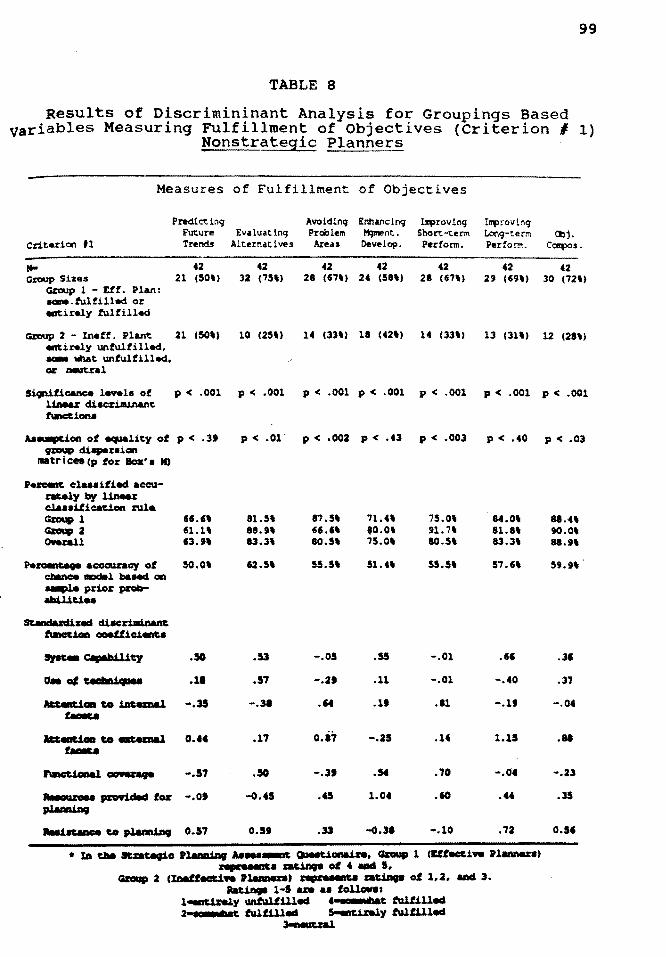
99
TABLE 8
Results of Discrimininant Analysis for Groupings Based variables Measuring Fulfillment of Objectives (Criterion # 1)
Nonstrategic Planners
Measures of Fulfillment of Objectives
Predict inq Awidinq Enhancing Iq:>roving !qi roving Future E:vduatinq Problem Mc;ment. Short-term Long-term Cbj.
Criterion 11 Trends Altern•tiws Are.as Develop. Perform. Perform. CQll'f>OS.
""' 42 42 42 42 42 42 42 Group Sizes 21 (50') 32 (75'1 28 (67') 24 (58') 28 (67') 29 (69,) 30 (72'1
Gzoup l - Uf. Plan: .ana.tulfilled or .atiraly tulfill<ld
Gzoup 2 - In•!!. Plant 21 (50,, 10 (25•> 14 (33') 18 (42•> 14 '"''
13 (31') 12 (28'1 entir.ly untulfill<ld, - tiihat 1:1nfulfill<ld, or -1:.ral
SiC)nificanc. 1-.la of p< .001 p < .001 p < .001 p < .001 p < .001 p < .001 p < .001 11-r diac.ri.111.i.n.ant function•
AallQllPC.ion of ..,_11cy of p< .lt p < .01 · p < .002 p < .43 p < .003 p < .40 p < .03 9ftlUP di11p9.rmion
matrices (p fo.r Bmc' • M)
••zcent. c1 .. aifilld ac::cu-nt.ely by l:irleu claaaitica~on zule. GIOl.1p 1 H.C• 81.5' 87.5' 71.4' 75.0, 84.0, ..... GIOl.1p 2 n.u 88.H 66.H eo.o' 91." 81.8' 90.0, ON.rall 63.H 83.3' 80.5' 75.o• 80.5• 83.3. lt.H
P•~ acccuracy of 50.0• 62.5' 55.5' 51."' 55.5, 57.H 59.H c:bAncta model. balled on -.J.• prior prob-abiliu ..
StMdudind diac:riainaft'C tunc:cioa caetfic:imU
~- ClpebilU:y .50 .53 -.05 .55 -.01 .H .lt
o.. ot c1•nhpH .11 .57 -.21 .11 -.01 -.40 .3'7
AU...UC. t:o iDCemal -.lS -.31 .M .lt .11 -.lt -.04 faall&e
AU-t.oa t:o at•rnel O.H .17 o.i? -.21 .14 1.1!1 ... faall&e
l'llDc:Uoaal ~ -.57 .50 -.3' .s. • '70 -.o. -.u
JllMoamee pamdlid for -.Of -0.t!I .4!1 1.04 ·'° ... .3!1 pl4tlllliNJ
Rllili.cance t:o plam.t.nlJ 0.!17 O.!lf . .u -0.31 -.10 .'72 O.!I,
* IA tbe ltntAllJiO t~ A.9Ma~ QlaMt.ianain, Gnup 1 fl:U.ct.199 Pl.&Man) ~ r:aunp of • aad !I.
Gnup 2 (Inllffect.199 Pl.umeft) ~ r:aUftp of 1,2, aad 3. RaUftp 1-!I are u follont
1-unly W'lfulfilllld ·-·· lbat fllWlllld 2 II l lbat fulfilled ~y fulfilled ~
100
National reading scores were reported improved by 78% of
the superintendents, district reading scores were reported
improved by 75%. National math scores were reported improved
bY 64% of the non strategic planning superintendents.
student dropout rate and percentage of college bound
students, which was applicable only to districts with high
schools, reported improvement at a 53% and 29% respectively.
The performance composite reported improvement in student
performance by 77% of the nonstrategic planning
superintendents.
Table 9 presents the results of discriminant analysis
for groupings based on performance relative to competition.
The performance measures were: (a) district reading scores,
(b) district math scores, (c) national reading scores,
(d) national math scores, (e) student attendance rate,
(f) student dropout rate, and (g) percent of college bound
students.
For all of the discriminant analyses, the significance
level of the linear discriminant function was p <.001.
For district reading scores, the assumption of the
equality of group dispersion matrices was not met (p for
Box's M was <.06). The percent classified accurately by the
linear classification rule was far greater than chance (80.6
vs. 62.5). All variables except: (a) system capability,
(b) attention to internal facets and (c) resources provided
for planning were significant.
101
For district math scores, the assumption of the equality
of group dispersion matrices was met (p for Box's M was
<.20). The percent classified accurately by the linear
classification rule, was greater than chance (66.6 vs.
53.9). All variables except system capability and attention
to internal facets were significant individually.
For national reading scores, the assumption of the
equality of group dispersion matrices was not met (p for
Box's M was <.08). The percent classified accurately by the
linear classification rule was far greater than chance (83.3
vs. 65.4). The individual variables that contributed to
discrimination were: (a) use of techniques, (b) attention to
external facets and (c) resistance to planning.
For national math scores, the assumption of the equality
of group dispersion matrices was met (p for Box's M was
<.10). The percent classified accurately by the linear
classification rule was far greater than chance (77.8
vs. 59.9). All variables except system capability and
attention to internal facets were significant individually.
For student attendance rate, the assumption of the
equality of group dispersion matrices was met (p for Box's M
was <0.19). The percent classified accurately by the linear
classification rule was greater than chance ( 63.9 vs. 53.9).
No individual variable significantly contributed to
discrimination.
For student dropout rate, the assumption of the equality
of group dispersion matrices was met (p for Box's M was

102
TABLE 9
Results of Discriminant Analysis for Groupings Based on Student Performance (Criterion I 2)
Nonstrategic Planners
Performance Measures
District Oiatrict Nation. Nation. Studant Studant ' Coll4199 Read.i.ng Math bad.i.ng Math Attend. OE'Op:)'l.lt Bound Pu-form.
dt.uion t2 Scona Scons Scor.s Scores Rate Rate Student. Cc:lllp:I•.
. 42 42 42 42 42 31 315 35 i:oup Sizes 32 {75,) 27 (154') 33 (78') 30 (72'> 27 (154') 20 (53,) 10 (29') 27 (77')
Group l: a.t:.ter. or mc:b becter
r:oup 2: 10 {25') 15 (315\) 9 (22') 12 {28\l 15 (315\) 18 (47'1 215 (71') 8 (23') llcfal• ¥0.r:M or 111.lCb ¥Orsa
Ltnifi- lev.la of p < .001· p < .001 p < .001 p < .001 p < .001 p < .001 p < .001 p < .001 ~-:: diac:.d.llWl&nt 111ccion•
1~ion of equality p < .015 p < .20 p < .01 p < .10 p < .19 p < .11 p < .151 p < .oo ~ qroup diaptnion trices {p for Box'• M>
ircenc claaaified :cu.rately try lift .. :: .aaaification rule
Gmup l 77." '°·" 71.H 73.l' flt.9' 70.H "·" 82.H Gmup 2 81.8' "·" 100.0, 90.0, 159.2, 80.0, U.H 100.0' ovvall 80.H "·" 13.3' 77.H 63.9' 75.0, 64.5, 81.H
·~ acccurac:y of 152. 5, 53.9' 155 ·"' 59.9' 53.9' 50.2• 58.8' 64.2, c:banoa llllldlll baMd on 811111ple prior pEab-
abiliti••
MCludiMd diacnm-nt 1\lncUon coeffi-eat.Al
~ Clplbility 0.13 -0.13 0.17 -0.11 0.27 0.31 0.01 0.31
U• of ~ecbni9au 0.90 0.10 1.13 1.07 -o.os 0.11 0.1' 0.91
Atttac.ion t.o ~ 0.42 O.H 0.2' 0.31 -0.33 -0.lt 0.11 0.10 f..U
At;tmd.aa t.o ac.mai-1.u -0.17 -1.02 -1.15 0.21 -0.25 -0.H -1.77 famu
~CO'ND911 O.IO 1.00 0.31 0.90 0.31 0.75 0.43 O.IO
~prcwided o.47 O.IO 0.21 O.IS -0.0I 0.35 0.25 0.93 for: plann.i.ft9
... i~ to pl.u- -0.72 -1.00 -0.5' -1.03 -0.02 -0.14 -0.77 -0.91
N.nt • ID t!Mt 8t:r:at4191c lll.uaWMJ Aa••~ ~. Group l (l:ffect:ift 11.-r•)
~ zatiDp of ... 5, Group 2 (InetfecUft fl.aane.n) ~· ratinp of 1,2, ud 3.
11.stinp 1-5 Aft aa fOl.lowal 1-m 'MDrM 4"""9\:ter 2~ 5...acb IMlr.ter
3-tJ:lll

<0.11}. The percent classified accurately by the linear
classification rule was far greater than chance (75.0
vs. 50.2}. The individual variables that contributed to
discrimination were functional coverage and resistance to
planning.
103
For percent of college bound students, the assumption of
the equality of group dispersion matrices was met (p for
sox's M was< 0.61). The percent classified accurately by the
linear classification rule was greater than chance (64.5 vs.
58.8). The individual variables that contributed to
discrimination were: (a) attention to internal facets,
(b} attention to external facets and (c) resistance to
planning. For the performance composite, the assumption of
the equality of group dispersion matrices was not met (p for
Box's M < .0001). The percent classified accurately by the
linear classification rule was far greater than chance (86.6
~s. 64.2). All of the variables except system capability
~ere significant individual contributors to discrimination.
:riterion # 3
>atisfaction With Planning System
Of the 42 non strategic planners, 64% classified
:hemselves as satisfied planners. Table 10 presents the
~esults of discriminant analysis for groupings based on
iatisfaction. The grouping_v~riable is satisfaction of
1lanners (satisfied vs. dissatisfied}. The significance level
•f the linear discriminant function is P <.001. The
.ssumption of equality of group dispersion matrices
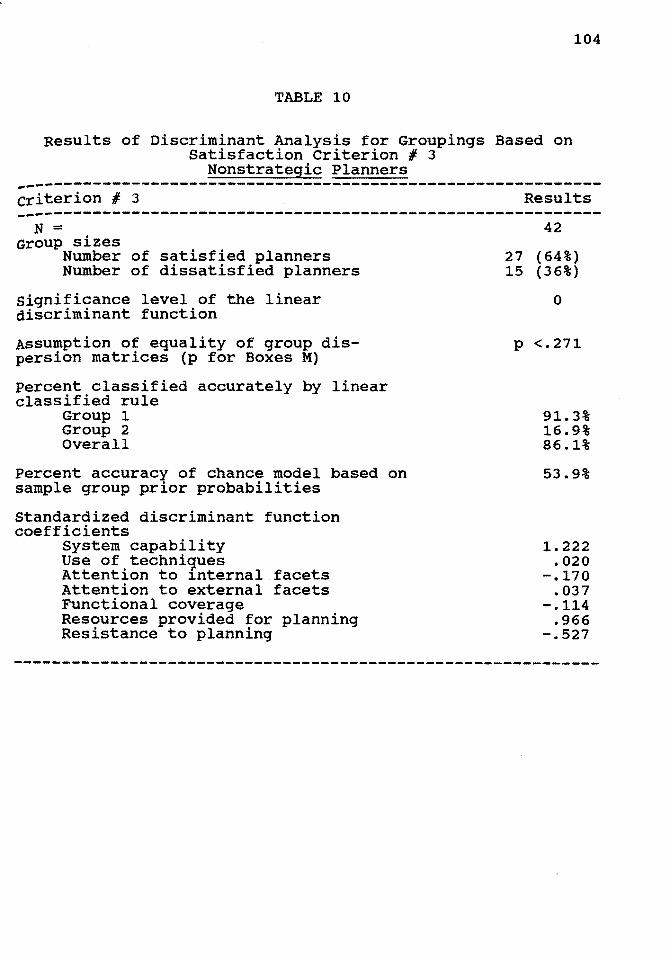
104
TABLE 10
Results of Discriminant Analysis for Groupings Based on Satisfaction Criterion # 3
Nonstrategic Planners ~------------------------------------------------------------criterion # 3 Results -------------------------------------------------------------
N = Group sizes
Number of satisfied planners Number of dissatisfied planners
significance level of the linear discriminant function
Assumption of equality of group dispersion matrices (p for Boxes M)
Percent classified accurately by linear classified rule
Group 1 Group 2 overall
Percent accuracy of chance model based on sample group prior probabilities
standardized discriminant function coefficients
System capability Use of techni9ues Attention to internal facets Attention to external facets Functional coverage Resources provided for planning Resistance to planning
42
27 (64%) 15 (36%)
0
p <.271
91.3% 16.9% 86.1%
53.9%
1. 222 .020
-.170 .037
-.114 .966
-.527
-------------------------------------------------------------
was met, (p for Boxes M < .271). Dissatisfied planners
are classified well above the percent accuracy of chance
model based on sample group prior probabilities (91.3
105
vs. 53.9). The same was not true for satisfied planners, who
were classified well below the percent accuracy of chance
model based on sample group prior probabilities (16.9 vs.
53.9) The overall percents classified accurately by the
linear classification rule is 86.1, so the discriminant
function does provide useful information overall, as depicted
by the highly significant p - value (p <.001). The
variables that contributed independently to discrimination
were: (a) system capability, (b) resources provided for
planning and (c) resistance to planning.
Table 11 presents the means, standard deviations and
intercorrelations of the seven dimensions of planning
systems. All the variables appear normally distributed with
the exceptions of: (a) use of technique, (b) resources
provided for planning and (c) resistance to planning. This
was determined without the aid of graphical data analysis
since the standard deviations for those variables are
obviously much larger than their means. The
intercorrelations are low to moderate. The range is from
0.03 to 0.48. The only exceptionally high correlation (0.71)
was between resources provided for planning and resistance to
planning. Resistance to planning actually measured lack of
resistance to planning or a positive attitude toward
planning.

106
TABLE 11
Means, Standard Deviations, and Intercorrelations of the Seven Dimensions of Planning Systems
Nonstrategic Planners -------------------------------------------------------------oimensions Means s.d. 1 2 3 4 5 6 7
-------------------------------------------------------------1. System 51.21 35.43
capability
2. Use of 14.93 24.02 Technique
3. Attention 11.74 1.47 to internal facets
4. Attention 15.10 4.38 to external facets
5. Functional 26.98 15.31 coverage
6. Resources 10.51 15.95 provided for planning
7. Resistance 3.90 11.63 to planning
1 .22 .11 • 35 .48 .25 .31
1.0 • 26 • 41 .06 .17 .16
1.0 .35 .17 -.04 .03
1.0 .48 .06 .06
1.0 .06 .19
1.0 .71
--- 1.0
All values are based on data from 42 school districts used in the discriminant analysis.

Research Question I
Is the Criteria of Effectiveness Among Nonstrategic
planners Directly Related to Seven Dimensions of Planning?
107
Five out of seven dimensions had positive correlations
with effectiveness in planning systems. The positive
dimensions were: (a) system capability, (b) attention to
internal facets, (c) attention to external facets,
(d) functional coverage and (e) resistance to planning.
Table 12 presents the means, standard deviations and
intercorrelations of the variables measuring effectiveness of
planning systems. All of the variables are normally
distributed. The intercorrelations range from extremely low
to high (-0.29 to 0.91). All correlations above r = 0.33
were significant at p < .OS. Among the low correlations were
the comparison of avoiding problem areas and of national
reading scores (r = -0.02) and between improving long term
performance and district test scores in reading (r = 0.02).
Among the high correlations were the comparison of national
reading scores (r = 0.91) and between comparison of national
math scores and performance a composite (r = 0.89).
Table 13 presents the relative importance rankings of
the dimensions of planning in all of the discriminant
analyses of effectiveness measures related to objective
fulfillment and relative performance. For improving long term
~erformance, the most important variable is use of
techniques. Resources provided for planning is second,
~esistance to planning is third and functional coverage is

108
TABLE 12
Means, Standard Deviations, and Intercorrelations of the Variables Measuring Effectiveness of Planning Systems
Nonstrategic Planners
variables n Means s.d. l 2 3 4 5 6 7 8 9 10 11 12 13 14 15 16
1. Predict 42 3.40 0.80 1.0 .69 .06 .49 .38 .66 .75 .06 .17 .06 .09 -.04-.29-.11-.02 .60 future trends
2. Evaluate 42 3.76 0.76 1.0 -.01 .55 .51 .50 .74 .07 .26 .12 .13 -.05-.06-.23 .08 .53 altematives
3. Avoid 42 3.66 0.87 1.0 .13 .32 .43 .45 .04 -.06-.02-.06 .05 .07 .13 .08 -.06 Problem Areas
4. Enhance 42 3.52 0.94 - - -- 1.0 .55 .54 • 77 .22 .25 .08 .07 .09 .03 -.29 .13 .69 manaqement development
5. Iq>rove 42 3.69 0.95 - - - - 1.0 .52 .76 .28 .39 .13 .16 .06 .02 -.03 .17 .45 short Term Performance
6. Iq>rove 42 3.74 0.66 - - - - - 1.0 .84 .02 .05 -.08-.11-.12-.27-.08-.10 .49 lonq term performance
7. Objective 42 3.63 0.57 - - - - 1.0 .17 .25 .07 .07 .01 -.10-.14 .09 .63 -coq>asite
8. Conparison 42 3.86 0.72 - -- - - __. -- - 1.0 .87 .73 .69 .24 .26 .11 • 77 .20 of district Test "scores in readinq
9. Ccxlpari- 42 3. 74 0.80 - - - - - - - - 1.0 .62 • 71 .24 .21 .10 .74 .28 sion of district test scores in nath
10. Con;ari- 42 4.02 0.84 - - - - - - - - 1.0 .91 .44 .33 .23 .86 .27 son of na-tional read-inq scores
11. Conpari- 42 4.00 0.99 - - - - - - - - - - 1.0 .48 .37 .27 .89 .26 son of na-tional math scores
- - - - - - - - -- - 1.0 .66 .28 .68 .14 12. Student 42 3.88 0.73 attendance rate
13. Student 38 3.76 1.05 - - - - - - - - -- - - 1.0 .27 .64 .03 dropout rate
14. percent 36 3.33 0.83 - - - - - - - - -- - - 1.0 .45 .03 of colleqe bound stu-dent a
15. Perform. 35 3.78 0.64 - - - - - - - - -- - -- -- 1.0 .28 on ~aite
16. Satisf. 42 3.68 0.82 - - - - - - - - -- - - -- 1.0 vith the planninq syat ..
All correlations above r • .325 are significant at p < .05

109
TABLE 13
Relative Importance Rankings of the Dimensions of Planning in 16 Discriminant Analysis
Nonstrategic Planners
Dimensions
Resources Attention to Attention to Provided
Effectiveness System Use of Internal External Functional for Resistance Measures Capability Techniques Facets Facets Coverage Planning to Planning
Objective fulfillment
Pred.ictinq future .. 2 6 1 5 3 7 t:ntnds
Evaluatinq 1 6 7 5 3 .. 2 alternatives
Avoidinq Problem 7 1 .. 2 3 6 5 Areaa
Enhancinq 1 5 2 7 4 6 3 manageimt developmnt
Iql%gvinq short .. 3 6 7 5 2 1 tez:m performance
Iq:ovinq lonq 6 1 5 7 .. 2 3 tez:m performance
Cl:ljective cont=>O•ite 3 5 6 .. 7 1 2
Studllnt Perfo;cmnce
~aon of 7 4 1 6 2 3 5 district Teat acer.a in readinq
Copa.iaon of dia .. 7 1 6 2 5 3 trict test acer.a in _th
~aon of 2 .. 7 3 5 6 1 national re&ditlq a coma
~•on of 5 2 7 3 6 4 1 national aath acoma
studmt attendance 2 .. 7 3 5 1 6 Rte
studlnt dropout 2 7 5 .. 6 3 1 :rate
percmta99 of 5 1 .. 3 2 6 7
coll999 bound atuclmlta
Perf oaance on 7 1 .. 6 3 2 ccqioaite
Satiafaction
Satiafaction with 7 .. 3 6 2 5 1 the planninq syst-

110
fourth. Attention to internal facets, system capability and
attention to external facets are fifth, sixth, and seventh,
respectively.
Characteristics Of Nonstrategic Planners
Table 14 presents the characteristics of respondents who
are not directly involved in strategic planning. Almost 98%
are superintendents. Ninety percent are male. Ninety-three
percent have been employed more than 15 years in the field of
education. Seventy-two percent have been employed up to 15
years by their current school system. sixty-nine percent
have a doctorate. Ninety-three percent have a graduate level
degree. Almost 98% are directly involved with school
planning.
Strategic Planners vs. Nonstrategic Planners
Research Question 4
How do Strategic and Nonstrategic Planners Compare?
The strategic planners were effective according to the
three established criteria of effectiveness. The strategic
planners also demonstrated six out of seven dimensions
of planning systems. one dimension (use of techniques)
was neutral.
Non strategic planners reported effective planning
systems according to the three established criteria of
effectiveness, in two areas: (a) extent of fulfillment of key
planning objectives and (b) satisfaction of planning systems)
at a lower percentage rate than the strategic planners. The

111
TABLE 14
Characteristics of Respondents and Their School Districts Nonstrategic Planners
Characteristics
Position
sex
Superintendent Assistant Superintendent Other
Male Female
Number of Years Employed in Field of Education
o 5 years 6 - 10 years 11 - 15 years 16 - 20 years 21 - 25 years 26 - 30 years 31 - + years
Number of Years Employed by current School System
o 5 years 6 - 10 years 11 - 15 years 16 - 20 years 21 - 25 years 26 - 30 years 31 - + years
Highest Degree M.A. C.A.S. Doctorate
District - Directly Involved in School Planning
Yes No
District - Directly Involved Strategic Planning
Yes No
in
Number of Years District has been Involved in strategic Planning
O 2 years 3 5 years 6 8 years 9 - 10 years 11 + years
Respondents (n = 42)
97.62 o.oo 2.38
90.48 9.52
0.00 o.oo 7.14
14.29 28.57 28.57 21.43
42.86 11.91 16.67
9.52 9.52 4.76 4.76
23.81 7.14
69.05
97.62 2.38
00.00 100.00
All figures are percentages. All nonrespondents have been excluded.

nonstrategic planners reported evaluation of student
performance at a higher level than strategic planners.
Those who identify themselves as nonstrategic
planners generally have the majority of the same
characteristics of the strategic planners but at a lesser
percentage rate.
Nonstatistical Findings
112
There was a great deal of interest in the strategic
planning process. In many of the incomplete surveys, there
were questions about the definition of strategic planning and
questions about the way the process differed from long range
planning.
Summary
Chapter III presented the results of research which
examined strategic planning systems and nonstrategic planning
systems. These planning systems were studied in order to
determine what factors make a planning system effective or
ineffective. The strategic planning systems and nonstrategic
planning systems were compared.

CHAPTER IV
SUMMARY, CONCLUSIONS, AND RECOMMENDATIONS
Summary
113
Planning procedures are becoming increasingly important
as school administrators face school reform. Society is
demanding change within our school systems, and the most
efficient way to enact change is with effective planning
procedures.
Effective planning is not a reaction to circumstances or
planning as the result of an emergency. Effective planning
strives to use the energy within the system to think and plan
ahead for excellence within the organization.
The purpose of this study was to examine the use of
strategic planning techniques in the educational
organization, determine the effectiveness of the strategic
planning systems within the organization and explore the
dimensions of planning elements contributing to differences
in effectiveness between more and less effective systems.
Three criteria were used to determine whether a planning
system was effective or ineffective. They were:
l. Criterion # l - The extent of fulfillment of key
planning objectives which include:
a. Predicting Future Trends - Planning which helps
organizations to delineate probable, plausible, and
preferable future states of the world, and produces
reasonably valid forecasts of the future. Predicting future
trends is recognized as an important task of planning.
b. Evaluating Alternatives - the ability to
delicately balance control and creativity, look at and
examine all alternatives, and make wise judgements.
114
c. Avoiding Problem Areas - the ability to increase
the probability of achieving goals and minimize the
recurrence of errors.
d. Enhancing Management Development - the ability to
improve the quality of management and facilitate management
succession.
e. Improving Short Term & Long Term Performance -
Improving selection of short and long term goals, and
improving the ability to improve those goals.
2. Criterion # 2 - The academic achievement of the
organization.
3. Criterion # 3 - An overall measure of satisfaction
within the organization.
Seven planning dimensions were analyzed to determine if
one, more or all seven contributed to the effectiveness of
the planning system. The dimensions included:
1. System capability - The ability of a formal planning
system to balance creativity and control; adaptive
flexibility of a system and its capability to support
strategy formulation and implementation (Ansoff, 1975, 1984;
Anthony & Dearden, 1976; Camillus, 1975; Lorange & Vancil,
1977; King & Cleland, 1978; Thompson, 1967).
2. Use of techniques - The degree of emphasis given to
the use of planning techniques to structure ill-defined,
115
messy, strategic problems (Grant & King, 1979, 1982; Hofer &
Schendel, 1978; Hax & Majluf, 1984).
3. Attention to Internal Facets - The degree of
attention to internal (organizational) factors, past
performance, and analysis of strengths and weaknesses
(Camillus & Venkatraman, 1984; Grant & King, 1982; King &
Cleland, 1978; Lorange & Vancil, 1977; Stevenson, 1976).
4. Attention to External Facets - The level of emphasis
given to monitoring environmental trends. (Aguilar, 1965;
Fahey & King, 1977; Keegan, 1974; Kefalas & Schoderbek,
1973; Thomas, 1980).
5. Functional Coverage - The extent of coverage given to
different-functional areas with a view to integrating
different functional requirements into a general management
perspective. (Hitt, Irland, & Palia, 1982; Hitt, Irland, &
Stadter, 1982; Lorange, 1980; Snow & Hrebiniak, 1980).
6. Resources Provided for Planning - The degree of
organizational support in the form of number of planners,
involvement of top management in planning, etc. (King &
Cleland, 1978; Steiner, 1979).
7. Resistance to Planning - The need to anticipate and
overcome resistance to planning and to create a favorable
climate for effective planning (Steiner, 1979; Steiner &
Schellhammer, 1975; Schultz & Slevin, 1976).
The study addressed four research questions:
1. To what extent are educators involved in strategic

planning? How many years have they been involved in the
process?
2. Are the strategic planning systems in educational
organizations effective, according to three established
criteria of effectiveness?
J. Is this effectiveness directly related to seven
established dimensions of planning which influence
effectiveness?
116
4. How do strategic and nonstrategic planners compare?
The instrument used to address the research questions
was a five point Likert Scale Questionnaire, titled
"Strategic Planning Assessment For Educational
organizations".
The population included 288 district superintendents in
the six county metropolitan RTA area of Illinois (Cook,
DuPage, Lake, McHenry, Kane, and Will counties).
The Twin Spreadsheet Software System and the S statistical
program language were used to perform statistical functions.
statistical analysis included:
1. characteristics of respondents.
2. means, standard deviation, and intercorrelations of
the seven dimensions of planning systems.
J. means, standard deviations, and intercorrelations of
the variables measuring effectiveness of planning systems.
4. discriminant analysis for groupings based on
satisfaction.
5. discriminant analysis for groupings based on

variables measuring fulfillment of objectives.
6. discriminant analysis for groupings based on
performance relative to competition.
7. relative importance rankings of the dimensions of
planning in 13 discriminant analyses
8. A comparison of those who identified themselves as
strategic planners with those who plan, but do not use the
strategic planning process.
Criterion # 1
Interpretations and Conclusions
Strategic Planners
In the area of objective fulfillment, among the
strategic planners, the top three dimensions were:
1. resources provided for planning
2. system capability
3. resistance to planning
Criterion # 2
In the area of student performance, the top three
dimensions among the strategic planners were:
1. resistance to planning
2. system capability
3. use of techniques
Criterion # 3
In the area of satisfaction, the top three dimensions
among the strategic planners were:
1. functional coverage
2. resources provided for planning
117

3. attention to external facets
Nonstrategic Planners
criterion # 1
In the area of objective fulfillment, the top three
dimensions among the nonstrategic planners were:
1. resources provided for planning
2. resistance to planning
3. system capability
criterion # 2
In the area of student performance, the top three
dimensions among the nonstrategic planners were:
1. attention to internal facets
2. resistance to planning
3. resources provided for planning
Criterion # 3
In the area of satisfaction, the top three dimensions
among the nonstrategic planners were:
were:
1. resistance to planning
2. functional coverage
3. attention to internal facets
Comparison
When comparing each, the strongest three dimensions
1. resistance to planning
2. resources provided for planning
3. system capability
118
Functional coverage was the fourth strongest dimension

119
for both strategic planners and nonstrategic planners.
Although both strategic and nonstrategic planners met
the three criteria for effectiveness, the strategic planners
were stronger in two out of three areas than the nonstrategic
planners; (a) fulfillment of objectives, and (b)
satisfaction. The nonstrategic planners were stronger
in the area of student performance. overall, the strategic
planners had a higher percentage of effectiveness than the
nonstrategic planners. The emphasis on dimensions appear to
differ in the three weaker dimensions. For the strategic
planners, the relative importance rankings (Table # 6) show
that: (a) attention to external facets and (b) use of
techniques were listed among the top three dimensions in at
least one performance composite. Attention to internal
facets was not a top dimension with the strategic planners
Among the nonstrategic planners, the relative importance
rankings (Table 13) show that: attention to internal facets
was among the top three dimensions in one performance
composite. Attention to external facets and use of
techniques were not top dimensions.
Three of the seven dimensions appear to be more highly
correlated with effectiveness than the other dimensions.
They are:
1. resistance to planning
2. system capability
3. resources provided for planning
Comparison of Current Study
with Ramanujam Study
120
Two of the seven dimensions were more highly correlated
with effectiveness than the other dimensions in both the
current study and the Ramanujam study. They were:
1. system capability
2. resources provided for planning
Implications for Administrators
The majority of superintendents appear to have effective
planning systems. However, the strategic planners appear to
be slightly more effective than the nonstrategic planners.
Although the seven dimensions are thought to be important
in determining the effectiveness of planning systems, it
would appear that some dimensions contribute to the
effectiveness of planning more so than others. In both
strategic planning systems and nonstrategic planning systems:
(a) resources provided for planning, (b) resistance to
planning and (c) system capability appear to be key
dimensions. Both the strategic planners and nonstrategic
planners focus on functional coverage to a lesser degree.
The dimension that was weak among the strategic planners
was attention to internal facets. The dimensions that were
weak among the nonstrategic planners were (a) attention to
external facets and (b) use of techniques. Perhaps greater
emphasis on the top dimensions and some emphasis on all
dimensions would improve the planning among strategic and
nonstrategic planners.

Interpretations and Conclusions
From Nonstatistical Findings
121
There appears to be a great deal of interest in
strategic planning among superintendents in the educational
system. There was an overall 60% return of surveys,
157 of 298 surveys were returned, as compared to most mail
surveys which have low response rates. It appears that
most nonstrategic planners have many of the same qualities of
the strategic planners only to a slightly lesser extent.
Limitations in Design,
Sampling, Statistics
The major limitations of this study were that:
The information was biased from superintendents point of
view. The response was overwhelmingly from a male
superintendent perspective.
There is a possibility that it was further biased by
those who have particular interest in planning or strategic
planning systems.
Recommendations for Future Research
In future research studies of strategic planning, the
author recommends repeating the objective study using the
"Strategic Planning Assessment for Educational Organizations"
In addition to the superintendents, the author recommends
including other levels of planning personnel in the study, so
as to obtain a broader perspective of the planning process.
In addition to the objective study, the author
recommends doing an in depth subjective study of the
122
strategic planning process of one or more school districts
that were identified as having effective strategic planning
systems. In this part of the study, the author recommends
interviews and observations with the intent of gaining
knowledge from the experienced, effective strategic planning
superintendent and staff.
Recommendations for Strategic Planning
1. Identify and state the purpose of the organization.
2. Carefully produce the goals of the organization.
3. Minimize the importance of the current status of the
organization.
4. Work diligently toward achieving the goals.
5. Research and use a strategic planning process, do not
plan haphazardly.

123
REFERENCES
Aguilar, F. J. (1965). Scanning the Business Environment. New York: Macmillan Book Pu lishing Co.
Ansoff, H. I. (1975). Managing Strategic Surprise by Response to Weak Signals. California Management Review, 18 (2), 21-33.
Ansoff, H. I. (1984). Implanting Strategic Management. Englewood Cliffs, New Jersey: Prentice Hall. .
Anthony, R. N. & Dearden, J. (1976). Management Control Systems. Homewood IL: Dow Jones-Irwin: Richard o. Irwin.
Anthony, w. P. (1985). Practical Strategic Planning. Connecticut: Quorum Books.
Amara, R: {1980~. ! Framework for Corporate Strategic Planninl: Philosophy, Process, and Practice. Prepared for Chemica Marketing Research AssOCTation. (ERIC DOCUMENT REPRODUCTION NUMBER ED 199 163)
Amara, R. c. (1981). The Futures Field: Searching for Definitions and Boundaries. The Futurist, 15 (1), 25-29.
Armstrong, J. s. (1982}. The Value of Formal Planning for Strategic Decisions: Review of Empirical Research. Strategic Management Journal, ~, 197-211.
Barn~ar~, c. L. (ED.). (1966). The American College Dictionary. New York: Random House.
Best, J. w. (1977). Research in Education. Englewood Cliffs, New Jersey: Prentice-Hall,-Ync.
Boulton, w. R. (1984). The Art of Strategic Management. New York: Macmillan Publishing Company.
Bozeman, w. c., & Schmelzer, s. {1984). Strategic Planning: Applications in Business and Education. Planning & Changing, 15 (1), 35-49.
Burgelman, R. A. (1983). Cor~orate Entrepreneurship and Strategic Management: Insights from a Process Study. Management Science, 29 (12) 1349-1364.
Burgelman, R. A. (1984). On the Interplay of Process and Content in Internal Corporate Ventures: Action and Cogniti?n in Strategy-Making. Academy of Management Proceedings, 2-6.

124
Business Week, (1984). Sept. 17, The New Breed of strategic Planne'F"62-67.
Camillus, J. c. (1975). Evaluating the Benefits of Formal Planning. Long Range Planning,~ (3), 33-40.
Camillus, J. C. & Venkatraman, N. (1984). Dimensions of Strategic Choice. Planning Review, 12 (1), 26-31, 46.
Cirincione-Coles, K. (1981). The Future of Education. Beverly Hills: Sage Publications. ---
Clarke, w. E. (1984). Long-Range Planning: The Need for Strategic Skills. The Journal of Business strategy, ~, 101-102. ---
Collier, D. (1984). How to Implement Strategic Plans. The Journal of Business Strategy. !, 92-96.
Cope, R. G. (1985). A Contextual Model to Encompass the Strategic Planning Concept. Planning for Higher Education, 13 (3), 13-20.
Day, G. s. (1984). strategic Market Planninf: The Pursuit of com.;:etitive Advantage. st. Paul, Minneso a: West Pub ish1ng Co.
Dess, G. G., & Robinson, R. B. (1984). Measuring Organizational Performance in the Absence of Objective Measures: The Case of the Privately-held Firm and Conglomerate Business Unit. Strategic Management Journal, ~, 265-273.
Dutton, J. E., & Duncan, R. B. (1987). The Influence of the Strategic Planning Process on Strategic Change. Strategic Management Journal, ~, 103-116.
Ewing, D. W. (1964). Long-Range.Planning for Management. New York: Harper & Row, Pu l1shers.
Fahey, L., & King, W.R. (1977). Environmental Scanning for Corporate Planning. Business Horizons, 20 (4), 61-71.
Fayol, H. (1972). Planning. In H. Koontz (Ed.), & c. O'Donnel, Management: A Book of Readings (3rd ed.). (pp. 99-102). New York: Mc~raw-HiII. .
Ferkiss, V. c. (1977). Futurology: Promise, Performance, Prospects. Beverly Hills: Sage Publications.
Foster, M. J. (1986). The Value of Formal Planning for Strategic Decisions: a Comment. Strategic Management Journal, z, 179-182.
Fox, D. J. (1969). The Research Process in Education. New York: Holt, Rinehart and Winston, Inc-.-
125
Freeman, A. R. (1981). Uses of Future Studies Techni~ues ~ Educational AdministrafOrS:- Paper presented at t e Australian Institute of Tertiary Educational Administrators National Conference. (ERIC DOCUMENT REPRODUCTION NUMBER ED 207 134)
Goodlad, J. I. (1976). Facing the Future. New York: McGrawHill.
Grant, J. H. & King, W.R. (1979). strategy Formulation: Analytical and Normative Models. In D. E. Schendel & c. w. Hof~r (Eds.), Strateyic Management: ~New View of Business Policy and Planning pp. 104-122). Boston:-r.;rft'Ii, Brown & co.
Grant, J. H. & King, W.R. (1982). The Logic of Strategic Planning. Boston: Little, Brown &"'""CO. ~
Greenley, G. E. (1983). Effectiveness in Marketing Planning. Strategic Management Journal, !r 1-10.
Greenwood, W. T. (1965). Management and Organizational Behavior Theories: An Interdisci~IIilar* Approach. Cincinnati, Ohio: South-Westernublis ing Company.
Gupta, A. K. (1984). Contingency Linkages Between Strategy and General Manager Characteristics: A Conceptual Examination 1. Academy of Management Review, ~, 399-412.
Gupta, A. K., & Govindarajan, v. (1984). Business Unit Strategy, Managerial Characteristics, and Business Unit Effectiveness at Strategy Implementation 1. Academy of Management Journal, 27, 25-41.
Haller, T. (1983). Secrets of the Master Business Strategists. Englewood CITfIS; New Jersey: Prentice Hall, Inc.
Hambrick, D. c. (1983). Some Tests of the Effectiveness and Functional Attributes of Miles and Snow's strategic Types 1. Academy of Management Journal, 26, 5-26.
Hamermesh, R. G. (ED). (1983). Strategic Management, Harvard Business Review. New York: John Wiley & Sons.
Hanson, E. M. (1979). Educational Administration and Organizational Behavior. Boston: Allyn and Bacon, Inc.
Harvard Business Review. (1975). On Management. New York: Harper & Row.

126
Hax, A. c., & Majluf, N. s. (1984). Stratetic Mana~ement: An Intefrative Perspective. Englewood Clif s, New ersey: ~ Pren ice-Hall, Inc.
Heathers, G., Roberts, J., & Weinberger, J. (1977). Educators' Guide for the Future. Pennsylvania: Research for Better School'S-;-Inc.
Hencle¥, s. P., & Yates, J. R. (1974). Futurism in Education. California: Mccutchan Publishing Corporation ~
Hipple, T. H. & others (1974). The Future of Education: 1975 - 2000. California: Goodyear Publishing-Company, Inc.~~
Hitt, M.A., Ireland, R. A., & Palia, K. A. (1982). Industrial Firms' Grand Strategy and Functional Importance: Moderating Effects of Technology and Structure. Academy of Management Journal, 25, 265-298.
Hitt, M. A., Ireland, R. A., & Stadter, G. A. (1982). Functional Importance and Company Performance: Moderating Effects of Grand strategy and Industry Type. Strategic Management Journal, li 315-330.
Hofer, c. w. & Schendel, o. E. (1978). Strategi Formulation: Analytical Concepts. St. Paul, Minn.: West uhlishing Company.
Horovitz, J., (1984). New Perspectives on Strategic Management. The Journal of Business Strategy,! (3), 19-33.
Hosmer, L. T. (1978). Academic Strategy. Michigan: The University of Michigan.
Hyman, H. H. (1972). Secondara Analysis of sample surveys: Principles, Procedures, an Potentialities. New York: John Wiley & Sons, Inc. ~-
Ingram, R. (1985). Strategic Planning and Effective School Management: A Commentary. Thrust, 14, 15-17.
Joseph, E. C. (1974). An Introduction to Studying the Future. Ins. P. Hencley & J. R. Yates (EDs.). Futurism in Education (pp. 1-26). Berkeley, California: Mccutchan Publishing Corp.
Keegan, W. J. (1974). Multinational Scanning: A Study of Information Sources Utilized bf Head9uarters Executives in Multinational Companies. Administrative Science Quarterly, 19, 411-421.

Kefalas, A., & Schoderbek, P. P. (1973). Scanning The Business Environment: Some Empirical Results. Decision Sciences, !, 63-74.
127
Kerlinger, F. N. (1967). Foundations of Behavioral Research. New York: Holt, Rinehart and Winston, Inc.
King, w. R. (1983). Evaluating Strategic Planning Systems. Strategic Management Journal, !, 263-277.
King, w .. R. & Cleland, D. I. (1978). Strategic Planning and Policy. New York: Van Nostrand Reinhold co.
Knezevich, s. J. (1984). Administration of Public Education (4th ed.). New York: Harper & Row. ~
Koontz, H. (1976). Making Strategic Planning Work. Business Horizons, 19 (2), 37-47.
Levin, B. (1974). Future Directions for School Finance Reform. Massachusetts: Lexington Books.
Lewis, J. (1983). Long-Range and Short-Range Planning for Educational Administrators:---Boston: Allyn and Bacon-;--Inc.
Lorange, P. (1979). Im~lementation of Strategic Planning. Englewood Cliffs, N : Prentice Hall.
Lorange, P. (1980). Corporate Planning: An Executive Viewpoint. Englewood Cliffs, N. J.: Prentice-Hall.
Lorange, P., & Vancil, R. F. (1977). Strategic Planning Systems. Englewood Cliffs, N. J.: Prentice-Hall.
Lucas, H. c. (1978). Em~irical Evidence for a Descriptive Model of Implementation. MIS Quarterly,~ (2), 27-31.
Miles, R. E. & Snow, c. c. (1978). Organizational Strategy, Structure and Process. New York: McGraw Hill.
Mintzberg, H. (1973). Strategy Making in Three Modes. California Management Review, 16 (2), 44-53.
Mintzberg, H. (1978). Patterns in Strategy Formation. Management Science, 24 (9), 934-948.
Mintzberg, H. (1979). The Structuring of Organizations. Englewood Cliffs, New Jersey: Prent'ICe Hall.
Morrison, J. L., & Cope, R. G. (1985). Using Futures Research Techniques in Strategic Planning: A Simulation. Planning for Higher Education, 13 (2), 5-9.
Naisbitt, J. {1984). Megatrends. New York: Warner Books, Inc.
Newitt, J. (1979). Future Trends in Education Policy. Massachusetts: Lexington Books-.-
Paul, R. N., Donavan, N. B., & Taflor, J. w. (1978). The Reality Gap in Strategic Planning. Harvard Business Review, 56 (4), 124-130.
Peters, T. J. & Waterman, Jr. R.H. (1982). In Search of Excellence. New York: Harper & Row. ~
128
Phi Delta Kappa. (1984) Handbook for Conductini Future Studies in Education. (Report-m:>. ISBN -o- 7367-791-9). Phi Delta-Kappa, Bloomington Ind., Prepared by the Phi Delta Kappa Commission on Schooling for the 21st century. (ERIC DOCUMENT REPRODUCTION NUMBER ED 254 268)
Qualitative Study Yields Strategic Planning Guidelines. (1984). Management Review, 73, 54.
Ramanujam, V., Venkatraman, N., & Camillus, J. c. (1986). Multi-Objective Assessment of Effectiveness of Strategic Planning: A Discriminant Analysis Approach. Academy of Management Journal, 29, 347-372.
Ramanujam, v., & Venkatraman, N. (1987). Planning System Characteristics and Planning Effectiveness. Strategic Management Journal, ~, 453-468.
Roe, W. H., & Drake, T. L. (1980). The Principalship (2nd ed.). New York: Macmillan Publishing co., Inc.
Rowe, A. J., Mason, R. o., & Dickel K. (1982). Strategic Management and Business Policy: A Methodological Approach. Massachusetts: Addison-Wesley Puolishing Company.
Rubin, L. (1975). The Future of Education: Perspectives on Tomorrows. Boston: Allyn &-Sacon, Inc. ~
Schroeder, R., (1984). Operations Strategy: Missing Link in Corporate Planning? Management Review, 73, 20-23.
Schultz, R. L., & Slevin, D. P. (1976). Implementation of OR/MS. New York: Elsevier-North Holland. ~
Segev, E. (1987). Strategy, strategy Making, and Performance -An Empirical Investigation. Management Science, ~, 258-269.
Sergiovanni, T. J., & Starratt, R. J. (1983). Supervision: Human Perspectives (3rd ed.). New York: McGraw-Hill.
Shank, J. K., Niblock, E.G., & Sandalls, w. T., Jr. (1973). Balance "Creativity" and "Practicality" in Formal Planning. Harvard Business Review, 51 (1), 87-95.
129
Slavin, R. E. (1984). Research Methods in Education: A Practical Guide. Englewood Cliffs, New Jersey: PrenticeHall.
Snow, C. c., & Hrebiniak, L. G. (1980). Strategy, Distinctive Competence, and Organizational Performance. Administrative Science Quarterly, 25, 317-336.
Steiner, G. A. (1969}. Top Management Planning. London: MacMillan.
Steiner, G. A. (1979}. Strategic Planning: What Every Manager Must Know. New York: Free Press.
Steiner, G. A., & Schellhammer, H. (1975). Pitfalls of Multinational Strategic Planning. Long Range Planning, 8 (2), 2-12.
Stevenson, H. H. (1976). Defining Corporate strengths and Weaknesses. Sloan Management Review, 17 (3), 51-68.
Stunard, E. A. ~1980}. ~Analysis of the Lo~g Ranfe Planning Processes Bein£ Used in Selected Institutions o Higher Education. Doc orar-DISsertation, Loyola University of Chicago_.
Thomas, P. s. (1980). Environmental Scanning: The State of the Art. Long Range Planning, 13 (1), 20-28.
Thompson, J. D. (1967}. Organizations in Action. New York: McGraw-Hill Book Co. ~
Toffler, A. (ED.). (1972). The Futurists, New York: Random House.
Tourangeau, K. W. (1981}. Strategy Management: How to Plan, Execute and Control. New York: McGraw-Hill.
Venkatraman, N., & Grant, J. H. (1986). Construct Measurement in Organizational Strategy Research: A Critique and Proposal. Academy of Management Review, 11, 71-87.
Why Strategic Planning Doesn't Always Work. (1983). Management Review, 72 (6), 55-56.

130
May 29, 1988
Dear •tit* *LN*,
As part of my doctoral dissertation research at Loyola University, I am conducting a study examining strategic planning systems in Chicago's six county metropolitan, RTA area.
The purpose of this letter is to request your participation in the pilot research phase of this study.
Enclosed, please find a copy of a survey instrument pertaining to strategic planning in the educational organization. I ask that you complete the survey and give an honest, objective o~inion of the quality of the instrument. Please indicate if there are problems with the length of the questionnaire, clarity of the questions, or reading of the instructions. All responses will be kept confidential.
Please complete the questionnaire, and forward it to me in the self addressed stamped envelope at your earliest convenience.
Thank you for your cooperation. It is greatly appreciated.
Sincerely,
Deborah J. Knox Loyola University
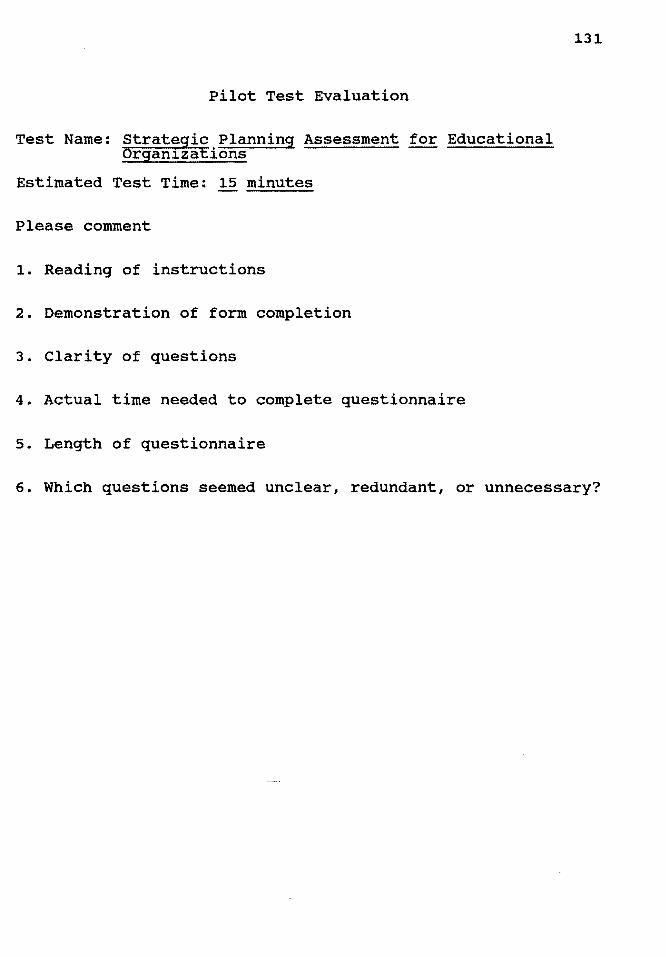
Pilot Test Evaluation
Test Name: Strategic Planning Assessment for Educational Organizations
Estimated Test Time: 15 minutes
Please comment
1. Reading of instructions
2. Demonstration of form completion
3. Clarity of questions
4. Actual time needed to complete questionnaire
5. Length of questionnaire
131
6. Which questions seemed unclear, redundant, or unnecessary?

132
July 29, 1988
Dear *tit* *LN*,
As part of my doctoral dissertation research at Loyola University, I am conducting a study examining strategic planning systems in Chicago's six county metropolitan, RTA area.
The purpose of this letter is to request your participation in the research phase of this study. As the superintendent, I believe you are the one most knowledgeable about the planning process in your district, and I am asking that you complete the questionnaire.
Enclosed, please find a copy of a survey instrument pertaining to strategic planning in the educational organization. Although the survey appears lengthy, it should take only ten minutes to complete. All responses will be kept confidential.
Please complete the questionnaire, and forward it to me in the self addressed stamped envelope at your earliest convenience.
Thank you for your cooperation. It is greatly appreciated.
Sincerely,
Deborah J. Knox

133
August 27, 1988
Dear *tit* *LN*,
Please be reminded of a recent letter requesting your participation in a study that examines strategic planning in the educational setting. Your experience as the superintendent of schools makes your input highly valuable and desirable. Your response to the survey will contribute to the reliability and value of the research findings.
Enclosed, you will find a co~y of the survey instrument dealing with strategic planning. I ask that you complete the questionnaire, and forward it to me in the enclosed self addressed stamped envelope at your earliest convenience. All information will be kept confidential.
Thank you for your help. It is greatly appreciated.
sincerely,
Deborah J. Knox

STRATEGIC PLANNING ASSESSMENT
FOR EDUCATIONAL ORGANIZATIONS
134
* It is re9uested that the superintendent complete this survey, if at all possible. Thank you.
2. Male Female ------ -------
3. Number of years employed in field of education.
O - 5 years__ 6 - 10 years __ _
16 - 20 years__ 21 - 25 years __ _
31 years or more ---
11 - 15 years __
26 - 30 years __
4. Number of years employed by current school system.
o - 5 years__ 6 - 10 years__ 11 - 15 years ___ _
16 - 20 years___ 21 - 25 years__ 26 - 30 years __ _
31 years or more __ _
5. Highest Degree
B.A. M.A. Doctorate --- --- ----6. Are you directly involved in school planning?
Yes No ----- ------
7. Is your organization involved in strategic planning?
Yes No ---------- ----------8. Number of years your district has been involved in
strategic planning?
o - 2 years __
9 - 10 years __
3 - 5 years __
11 years or more
6 - 8 years -------

PLEASE CIRCLE YOUR RESPONSES. Thank You.
How would you rate your organization's:
Low
9. ability to anticipate 1 surprises and crises?
10. flexibility to 1 adapt to unanticipated changes?
11. value as a mechanism 1 for identifying new opportunities?
12. role in identifying 1 key problem areas?
13. value as a tool 1 for managerial motivation?
14. capacity to generate 1 new ideas?
15. ability to communicate 1 top administration's expectations down the line?
16. value as a tool for management control?
17. capacity to foster organizational learning?
1
1
18. ability to communicate 1 line management's concerns to top administration?
19. value as a mechanism 1 for integrating diverse functions and operations?
20. value as a basis for enhancing innovation?
1
2
2
2
2
2
2
2
2
2
2
2
2
3 4
3 4
3 4
3 4
3 4
3 4
3 4
3 4
3 4
3 4
3 4
3 4
135
High
5
5
5
5
5
5
5
5
5
5
5
5
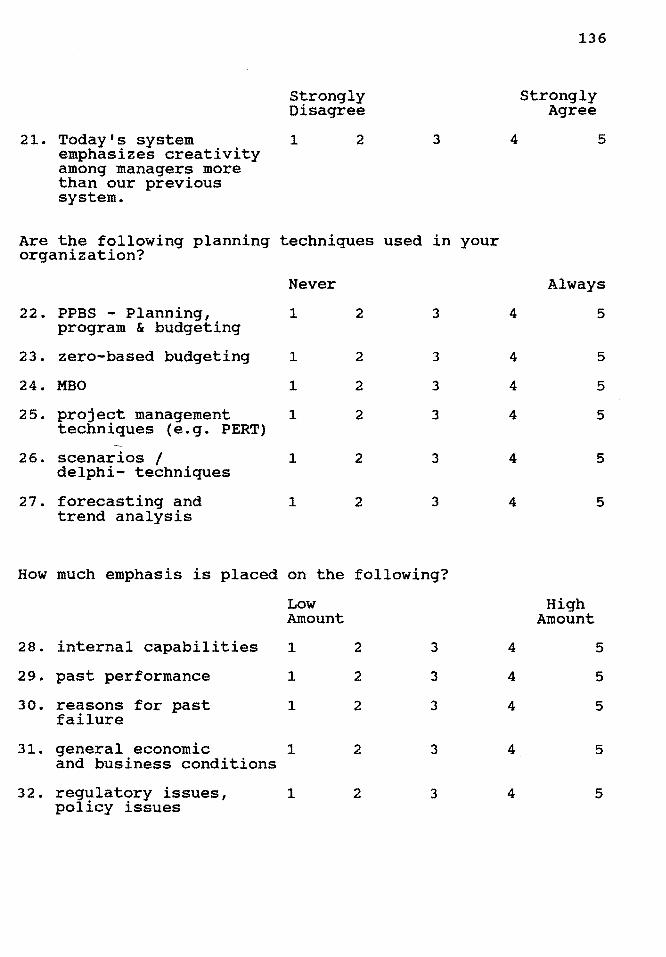
136
Strongly Strongly Disagree Agree
21. Today's system 1 2 3 4 5 emphasizes creativity among managers more than our previous system.
Are the following planning techniques organization?
used in your
Never Always
22. PPBS - Planning, program & budgeting
1 2 3 4 5
23. zero-based budgeting 1 2 3 4 5
24. MBO 1 2 3 4 5
25. project management 1 2 3 4 5 techniques (e.g. PERT)
26. scenarios / 1 2 3 4 5 delphi- techniques
27. forecasting and 1 2 3 4 5 trend analysis
How much emphasis is placed on the following?
Low High Amount Amount
28. internal capabilities 1 2 3 4 5
29. past performance 1 2 3 4 5
30. reasons failure
for past 1 2 3 4 5
31. general economic 1 2 3 4 5 and business conditions
32. regulatory issues, 1 2 3 4 5 policy issues

137
Low High Amount Amount
33. identification 1 2 3 4 5 of the purpose of the organization?
34. external factors 1 2 3 4 5 which influence the organization?
35. the current state 1 2 3 4 5 of the organization?
36. the desired state 1 2 3 4 5 of the organization?
37. Educational trends 1 2 3 4 5
38. technological trends 1 2 3 4 5
39. public relations 1 2 3 4 5
40. day to day administration
1 2 3 4 5
and teaching
41. finance 1 2 3 4 5
42. personnel function 1 2 3 4 5
43. purchasing and 1 2 3 4 5 procurement function
44. studies, surveys 1 2 3 4 5 and technology
45. computers 1 2 3 4 5
How much emphasis planning?
is placed on resources provided for
Low High Amount Amount
46. number of planners 1 2 3 4 5
47. time spent b¥ the 1 2 3 4 5 chief executive officer in strategic planning
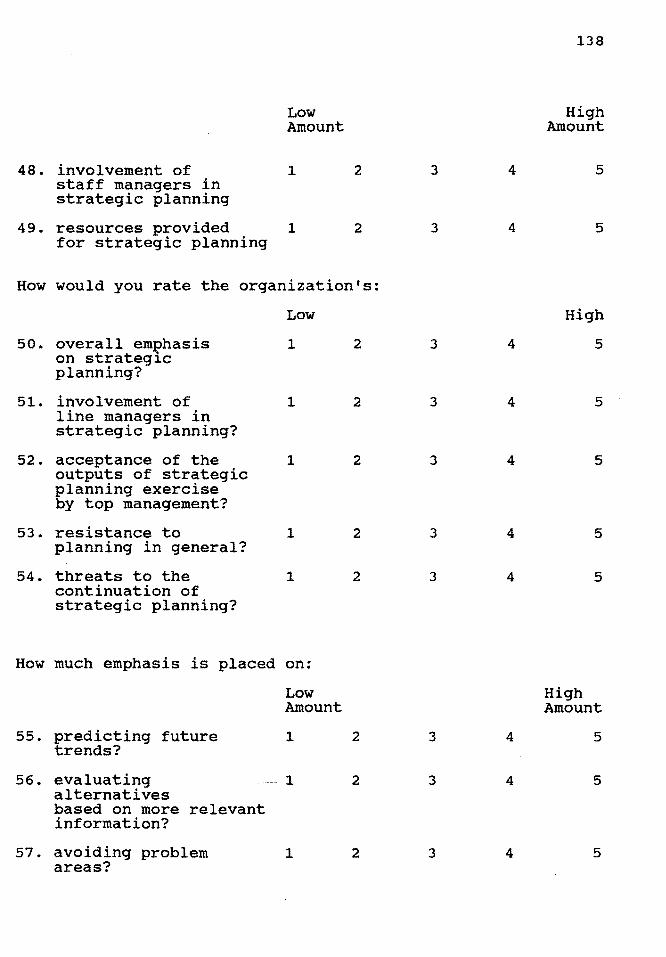
138
Low High Amount Amount
48. involvement of 1 2 3 4 5 staff managers in strategic planning
49. resources provided 1 2 3 4 5 for strategic planning
How would you rate the organization's:
Low High
50. overall emJ?hasis 1 2 3 4 5 on strategic planning?
51. involvement of 1 2 3 4 5 line managers in strategic planning?
52. acceptance of the 1 2 3 4 5 outputs of strategic planning exercise by top management?
53. resistance to 1 2 3 4 5 planning in general?
54. threats to the 1 2 3 4 5 continuation of strategic planning?
How much emphasis is placed on:
Low High Amount Amount
55. predicting future 1 2 3 4 5 trends?
56. evaluating 1 2 3 4 5 alternatives based on more relevant information?
57. avoiding problem 1 2 3 4 5 areas?

58. enhancing management development?
59. improvement in short term performance?
60. improvement in long term performance?
Low Amount
1
1
1
2 3 4
2 3 4
2 3 4
In comparing the school district's current student characteristics with those organization's:
of 1983, how would you rate
Much Worse
61. test scores in reading as compared to previous scores within the school
1 2 3 4
or school system
62. test scores in 1 2 3 4 math as compared to previous scores within the school or school system
63. test scores in 1 2 3 4 reading as compared to national norms
64. test scores in 1 2 3 4 math as compared to national norms
65. student attendance 1 2 3 4 rate
66. student dropout 1 2 3 4 rate
67. percentage of 1 2 3 4 college bound students
139
High Amount
5
5
5
your
Much Better
5
5
5
5
5
5
5

140
What degree of satisfaction organization's:
do you have with your
Low High
68. planning? 1 2 3 4 5
69. implementation 1 2 3 4 5 of plans?
70. evaluation 1 2 3 4 5 of plans?
71. refinement 1 2 3 4 5 of plans?

STRATEGIC PLANNING ASSESSMENT
FOR EDUCATIONAL ORGANIZATIONS
EXPLANATION OF QUESTIONS
141
The questions included in the strategic planning survey
which were sent to the superintendents in the Chicagoland
area are explained in this section. Responses for all items
were measured with five point scales. Items followed by (R)
were reverse coded. The first eight questions measured
descriptive information, including whether or not the
superintendents were strategic planners.
Dimensions of Planning Systems
System Capability
System capability was measured on a scale ranging from
"much improvement" to "much deterioration", or "strongly
disagree" to "strongly agree" with the following 13 items:
(Questions 9 - 21)
1. ability to anticipate surprises and crises
2. flexibility to adapt to unanticipated changes
3. value as mechanism for identifying new business
opportunities
4. role in identifying key problem areas
5. value as a tool for managerial motivation
6. capacity to generate new ideas
7. ability to communicate top administration's
expectations down the line
8. value as a tool for management control

9. capacity to foster organizational learning
10. ability to communicate line management's concerns
to top administration
11. value as a mechanism for integrating diverse
functions and operations
12. value as a basis for enhancing innovation
142
13. today's system emphasizes creativity among managers
more than our previous system
Use of Techniques
Use of techniques was measured on a scale ranging from
"significant decrease in use" to "significant increase in
use" with the following six items: (Questions 22 - 27)
1. PPBS
2. zero-based budgeting
3. MBO
4. project management techniques (e.g. PERT)
5. scenarios / delphi- techniques
6. forecasting and trend analysis
Attention to Internal Facets
Attention to internal facets was measured on a scale
ranging from 11 signif icantly less emphasis" to "significantly
more emphasis" with the following three items: (Questions 28
- 30)
1. internal capabilities
2. past performance
3. reasons for past failure
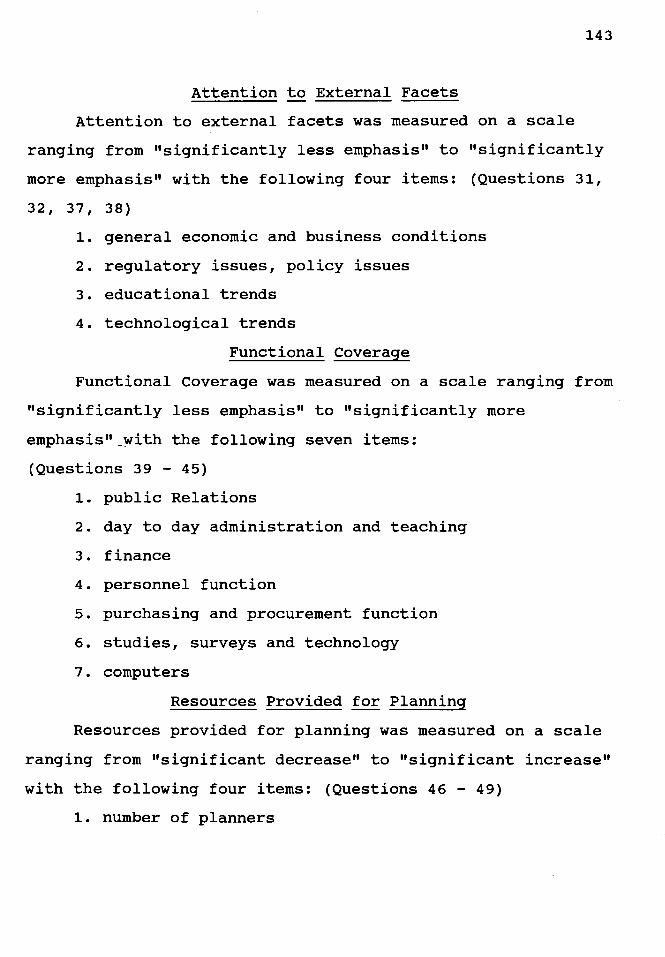
143
Attention to External Facets
Attention to external facets was measured on a scale
ranging from "significantly less emphasis" to "significantly
more emphasis" with the following four items: (Questions 31,
32' 37' 38)
1. general economic and business conditions
2. regulatory issues, policy issues
3. educational trends
4. technological trends
Functional Coverage
Functional Coverage was measured on a scale ranging from
"significantly less emphasis" to "significantly more
emphasis"_with the following seven items:
(Questions 39 - 45)
1. public Relations
2. day to day administration and teaching
3. finance
4. personnel function
5. purchasing and procurement function
6. studies, surveys and technology
7. computers
Resources Provided for Planning
Resources provided for planning was measured on a scale
ranging from "significant decrease" to "significant increase"
with the following four items: (Questions 46 - 49)
1. number of planners

2. time spent by the chief executive officer in
strategic planning
144
3. involvement of staff managers in strategic planning
4. resources provided for strategic planning
Resistance to Planning
Resistance to planning was measured on a scale ranging
from "significant decrease" to "significant increase" with
the following four items: (Questions 50 - 54)
1. overall emphasis on strategic planning (R)
2. involvement of line managers in strategic planning
(R)
3. acceptance of the outputs of strategic planning
exercise by top management (R)
4. resistance to planning general
5. threats to the continuation of strategic planning
Effectiveness of Planning Systems
Fulfillment of Objectives
Fulfillment of objectives over the past five years was
measured on a scale ranging from "entirely unfulfilled" to
"entirely fulfilled" with the following six items: (Questions
55 - 60)
1. predicting future trends
2. evaluating alternatives based on more relevant
information
3. avoiding problem areas
4. enhancing management development
5. improvement in short term performance

6. improvement in long term performance
Performance Relative to Competition
145
Performance relative to competition over the past five
years was measured on a scale ranging from "much worse" to
"much better" with the following seven items: (Questions 61 -
67)
1. test scores in reading as compared to previous scores
within the school or school system
2. test scores in math as compared to previous scores
within the school or school system
3. test scores in reading as compared to national norms
4. test scores in math as compared to national norms
5. student attendance rate
6. student dropout rate
7. percentage of college bound students
Overall Satisfaction
Overall satisfaction with planning systems over the past
five years was measured on a scale ranging from "significant
decrease" to "significant increase" with the following four
items: Questions 68 - 71)
1. planning
2. implementation
3. evaluation
4. refinement
Strategic vs. Nonstrategic Planners
Originally, the current study included questions
designed to measure whether or not those claiming to be

146
strategic planners actually fulfilled the goals of strategic
planning systems. (Questions 33 - 36) It was later decided
that only one question (Question 7) would be used to
determine whether school systems used the strategic planning
system.

APPROVAL SHEET
The dissertation submitted by Deborah Joyce Knox has been read and approved by the following committee:
Dr. Max A. Bailey Associate Professor Educational Leadership and Policy Studies
Dr. Philip M. Carlin Associate Professor Educational Leadership and Policy Studies
Dr. Edward T. Rancic Assistant Professor Educational Leadership and Policy Studies
147
The final copies have been examined by the director of the dissertation and the signature which appears below verifies the fact that any necessar¥ changes have been incorporated and that the dissertation is now given final approval by the Committee with refer~nce to content and form.
The dissertation is therefore accepted in partial fulfillment of the requirements for the degree of Doctor of Education (Ed.D.).
~, /61 NU Date Director's Signatle