an assessment of the contribution of cashew production to local
TRANSCRIPT

AN ASSESSMENT OF THE CONTRIBUTION OF CASHEW PRODUCTION TO LOCAL
ECONOMIC DEVELOPMENT, A CASE STUDY OF THE BRONG AHAFO REGION
BY
PETER KWASI SARPONG
B. A (HONS.)
A Thesis submitted to the School of Graduate Studies,
Kwame Nkrumah University of Science and Technology
in partial fulfillment of the requirements for the degree of
MASTER OF SCIENCE
in Development Policy and Planning,
College of Architecture and Planning
SEPTEMBER, 2011

ii
DECLARATION
I hereby declare that this work is my own work towards the Master of Science degree and that to
the best of my knowledge, it contains no material previously published by another person nor
material which has been accepted for the award of any other degree of the University, except
where due acknowledgement has been made in the text.
Peter Kwasi Sarpong (PG1861807) …………………… …………………..
(Student Name & ID) Signature Date
Certified by:
Dr. K. O. Agyeman …………………...... ……………................
(Supervisor) Signature Date
Certified by:
Dr. Imoro Braimah ……………………… .………………………
Head, Department of Planning Signature Date
iii
ABSTRACT
Effective poverty reduction in Ghana is underpinned by sustainable local economic growth and
development. It is for this reason that the Government of Ghana aims to ensure local ownership
of development interventions. One way of ensuring local economic development is through the
promotion of non-traditional agricultural commodities such as cashew. With the Brong Ahafo
Region‟s comparative advantage in the production of cashew, the industry has gained currency
with several farmers engaged by it.
Following this the study sought to assess the contribution of the cashew industry to the local
economic development towards poverty reduction. With data from both primary and secondary
sources, the study identified that first; the cashew industry has provided employment to about
8,233 people in Jaman North, Tain, Wenchi and Kintampo districts. These farmers received
technical and logistical support from MoFA, chiefly under the Cashew Development Project
(CDP).
A total amount of GH¢2,417,013.00 has been dispensed as credit to about 4,580 farmers
towards the CDP between 2004 and 2007. However, the study revealed that the low priced
variety is mostly produced in the study areas. Again it was identified that there was no fixed
prices for the cashew products like that of Cocoa. The prices of cashew products were rather
determined by the forces of demand and supply.
For the cashew industry to have improved the economic lives of many of the people in the
districts, the study recommended that MoFA should educate and train farmers to use improved
cashew seeds and disease resistant varieties. Again, the government should take over the
responsibility of fixing the prices of cashew nuts like that of cocoa so that the farmers would be
secured even if there is a bumper harvest. Finally, the government could operate a buffer stock
system to avoid a situation where supply exceeds demand to force the price down.

iv
ACKNOWLEDGEMENTS
I can see afar because I had the chance to stand on other people‟s shoulders. To such people, I
am highly indebted and would like to express my profound gratitude. First, I thank Dr. K.O.
Agyeman, my supervisor, for his wonderful effort and professional guidance that have greatly
contributed to the success of this study. I would also like to thank all the Lecturers of this
programme for their patience, pieces of advice and hard work that have combined to bring me
this far. God bless them all. For his encouragement, I pray for the Lord‟s bosom for the late Mr.
B.K. Annor Anim, former director of this programme.
My sincere thanks also go to the Officers of the MoFA in the Tain, Wenchi, Kintampo and
Jaman Districts of Brong Ahafo Region for making some vital information available to me for
this piece of work. To the participants in this exercise who shared their experiences with me to
make this piece a success, I thank them all. I really appreciate their time and effort.
To Him, the one and only giver of wisdom, the omnipotent, omnipresent and the giver of life, I
say “BLESSED BE THY NAME”. Finally, I dedicate this study to my children, Alex Osei
Sarpong, Ofosu Sarpong Kobi and Nana Gyensaa Sarpong.

v
TABLE OF CONTENTS
CONTENTS PAGES
COVER PAGE……...……………………………………………………………..………….......i
DECLARATION..……………………………………………………………………………….ii
ABSTRACT..….……………………………………………………………….......................... iii
ACKNOWLEDGEMENTS………….………………………………………………..………. iv
CONTENTS ……….………………………………………………………………………...…..v
LIST OF TABLES…...……………………………………………………………..…………...ix
LIST OF FIGURES..…………………………………………………………………………… x
LIST OF PLATES …..…………….…….………………………………………………….......xi
LIST OF APPENDICES …………………………………………………...………………….xii
LIST OF ABBREVIATIONS AND ACRONYMS…………………………………………..xiii
CHAPTER ONE
GENERAL INTRODUCTION
1.1 Background to the Study …………………………………………………………….……...1
1.2 Problem Statement ………………………………………………………………................3
1.3 Research Questions ……………………………………………………….............................5
1.4 Key Assumption ……………………………………………………………………………..5
1.5 Objectives of the study ………………………………………………………………............5
1.6 Scope ……………………………………………………………………………………….....6
1.7 Justification ………………………………………………………………………….…….6
1.8 Limitations of the Study ………………………………………………….............................7
1.9 Organisation of the Study …………………………………………………………………..8

vi
CHAPTER TWO
LITERATURE REVIEW AND CONCEPTUAL FRAMEWORK
2.1 Introduction …………………………………………………………………….……………9
2.2 Definition of some Related Concepts…………………………………………….……….....9
2.2.1 The Concept of Economic Growth and Development …………………………….………..9
2.2.2 The Concept of Development ……………………………………………………………. 10
2.2.3 The Concept of Local Economic Development (LED)...……………………..………...…12
2.3 Approaches to Local Economic Development …………………………………… …..14
2.3.1 Growth Promotion Approach to LED ……………………………………………….......14
2.3.2 Structural Change Approach to LED……….. ……………………………………….....15
2.3.3 Localization Approach to LED ……………………………………………………….....16
2.4 Local Government Authorities and Local Economic Development…...…….…………..17
2.5 The Status of Cashew Industry in Ghana…… ………….……………………………..…20
2.6 The Performance of Cashew Industry in some selected Countries ……………. ……22
2.6.1 International Cashew Industry ………………………………………………….…. ….. 22
2.6.2 Cashew Industry in Nigeria ……………………………………………………………...26
2.6.3 Cashew Industry in Tanzania …………………………………………………………….29
2.6.4 Mutual Link between Cashew Industry and the Economy……………………….. …........30
2.7 Conceptual Framework for LED …………………………………………………………31
2.8 Lessons Learnt from the Review ………………………………………………………….33
CHAPTER THREE
RESEARCH METHODOLOGY
3.1 Introduction ………………………………………………………………...………......34
3.2 Research Approach…………………………………………………………...…….......34
3.3 Research Units ………………………………………………………………...………34

vii
3.4 Research Variables …………………………………. …………………………..…….35
3.5 Sample Size Determination ……..…………………………………………..….…...….35
3.6 Sampling Procedure …………………………………………………………….…...….36
3.7 Sources of Data and Data Collection Techniques ……….……………………..……..37
3.8 Data Analytical Techniques ………………………………………………………...…38
3.9 Summary …………………………..…………………………………………….……..….39
CHAPTER FOUR
ANALYSIS, PRESENTATION AND DISCUSSION OF DATA
4.1 Introduction ………………………………………………………………...………………40
4.2 Background of the Study Districts in Regional Context….……………...………...….40
4.2.1 Location and Size ……………………………………………………………………….....40
4.2.2 Vegetation and Climate ……………………………………………………………………41
4.2.3 Population ………………….………………………………………………………...…....42
4.2.4 Age an Sex Structure …………………………………………………………………...…42
4.2.5 Employment Status………………………………………………………………………...43
4.2.6 Industry ………………………………………………………………………………........43
4.2.7 Occupation ………………………………………………………………………………...44
4.2.8 Transportation …………………………………………………………………..................44
4.3 The Status of Cashew Industry in Brong Ahafo Region ……………..………………….45
4.3.1 Land Acquisition …………………………………………………………………….….....47
4.3.2 Income Distribution among Cashew Farmers ………………………………………….….48
4.3.3 Gender Distribution in Cashew Industry …………………………………………….........50
4.3.4 Access to Credit Facilities ...………………………………………………………….….52
4.3.5 Access to Market Opportunities ………………………………………………...................52
4.3.6 Raw Cashew Nuts Processing ……………………………………………………………..53
4.3.7 Environmental Situation …………………………………………………………….. …...55
4.3.7.1 Environmental Impacts of Cashew Production ……………...…………………..……...55
4.3.8 Access to Agricultural Extension Services …………………………………………..........57
4.3.9 Constraints of Cashew Production..……………………..…………………………............58

viii
4.3.10 The prospects of cashew industry in the study area ……………………… …………......60
4.4 Cashew Industry and Local Economic Development.....……………………....................60
4.5 Summary …………………………………………………………………………………....63
CHARPTER FIVE
KEY FINDINGS, RECOMMENDATIONS AND CONCLUSION
5.1 Introduction …………………………………………………………….…………………..64
5.2 Key Findings ………………………………………………………………………………..64
5.2.1 The Role of the Cashew Industry to LED………………………………………….... …....64
5.2.2 Effects of Cashew Production on the Environment ……………………………………….64
5.2.3 The Extent to which MoFA facilitates cashew production in the Study Areas ……….....65
5.3 Recommendations …………..…………………………………………………………..….66
5.3.1 Production and Harvest of Cashew Nuts………. …………………………………………66
5.3.2 Formation of Ghana Cashew Board…………………………………….………………….67
5.3.3 Encouragement of Non-Governmental Organisations ……………………………….........67
5.3.4 Price Regulation/ Producer price Stabilisation …………………………………………....68
5.3.5 Production of Small –Size Cashew Nuts ………………………………………………….68
5.3.6 The Role of the Public Sector in LED ………………………………………………….....68
5.4 Conclusion ………………………………………………………………………………….68
References……….………………………………………………………………………………70

ix
LIST OF TABLES
Tables Pages
Table 2.1 Major Cashew Production Districts in Ghana…………………………………….21
Table 2.2 Cashew Products..…………………………………………………………………...24
Table 2.3: India’s Imports of Raw Cashew Nuts ………………………………………….....25
Table 2.4: Income from Cashew Exports, 2003 -2008 ………………….……………………27
Table 3.1: Sample Sizes .…………………..……………………………….…………………..36
Table 3.2: Research Questionnaire Response Rate ………………………………………….38
Table 4.1: Volumes and Values of Cashew Exports 2000 - 2008 ...………………………...46
Table 4.2: Land Ownership …………………………………………………………… ……..48
Table 4.3: Income Distribution ………………………………………………….……….…..48
Table 4.4: Gender Distribution in Cashew Production …………………………….………..51
Table 4.5: Gender Distribution in Cashew Processing Factories …………………….……..51
Table 4.6: Access to CDP-ADB Credit Facilities, 2004 – 2007……..………………….….…52
Table 4.7: Major Cashew Nut Processors in the Study Areas ………………….….…….….54
Table 4.8: Training Programmes for Cashew Farmers in the Study Areas..…….…..…......57
Table 4.9: Farmers’ Assessment of Extension Services Received ……………….….……..58
Table 4.10 District Assemblies’ Revenue from Cashew Produce ...……………….………...62
x
LIST OF FIGURES
Figures Pages
Figure 2.1 Public Investment and LED…...…………………………………………………..20
Figure 2.2: A Conceptualised Relationship between Cashew Industry and LED …………32
Figure 4.1: Lorenz Curve showing Income Disparity among Cashew Farmers……........... 50
Figure 4.2: Environmental Rating by Farmers……………………………………………….56
xi
LIST OF PLATES
Plates Pages
Plate 2.1: Cashew Kernels Prepared and Packaged Differently......………………………...23
Plate 4.1: Raw Cashew Nuts being off loaded at Nuts Processing Factory at Nsawkaw..…54
xii
LIST OF APPENDICES
Appendices Pages
Appendix 1: Questionnaire for District Agriculture Development Units ...…………………...75
Appendix 2: Questionnaire for Cashew Farmers ……….…….…………………………. …..... 79
Appendix 3: Questionnaire for Cashew Buyers……….………………………………….……...83
Appendix 4: Questionnaire for Cashew Processors…… …..........................................................87
Appendix 5: The Map of the Study Districts in Regional Context ……………………………...91
Appendix 6: Cashew Tree…………………………………………………….………………….92
Appendix 7: Cashew Fruits…………………………………………………….………………...93

xiii
LIST OF ABBREVIATIONS AND ACRONYMS
AAGDS Accelerated Agricultural Growth and Development Strategy
ADB Agricultural Development Bank
ADF African Development Fund
ADRA Adventist Development and Relief Agency
AfDB African Development Bank
BoG Bank of Ghana
CAPEAG Cashew Processors and Exporters Association of Ghana
CDP Cashew Development Project
CNSL Cashew Nut Shell Liquid
DADU District Agricultural Development Unit
DPA Direct Productive Activity
EU European Union
FAO Food and Agricultural Organisation
GDP Gross Domestic Product
GNP Gross National Product
GNPA Ghana National Procurement Agency
GoG Government of Ghana
GPRS I Ghana Poverty Reduction Strategy
GPRS II Growth and Poverty Reduction Strategy
IMF International Monetary Fund
LED Local Economic Development
LEDNA Local Economic Development Network of Africa
MoFA Ministry of Food and Agriculture
MTDP Medium Term Development Plan
NGO Non Governmental Organisation
NTES Non-Traditional Export Sector
PRS Poverty Reduction Strategy
PSD Private Sector Development
PSDS Private Sector Development Strategy

xiv
RAISE Rural and Agricultural Incomes in a Sustainable Environment
SOC Social Overhead Capital
TIPCEE Trade and Investment Programme for Competitive Export Economy
UK United Kingdom
USA United State of America
USAID United States Agency for International Development
1
CHAPTER ONE
GENERAL INTRODUCTION
1.1 Background to the Study
Blakely (1988), defines Local Economic Development (LED) as a process by which local
government and/or community –based groups manage their existing resources and enter into
new partnership arrangements with the private sector, or with each other, to create jobs and
stimulate economic activities in a well defined economic zone. In other words, LED is about
local people working together to achieve sustainable economic growth that brings economic
benefits and improvement in the quality of life for all in the locality. The essence of LED is
therefore a process whereby optimal use is made of endogenous potentials and resources to
ensure the creation of economic activities to bring about an improvement in the living conditions
of the people. In contemporary times, the local levels are seen as the main focus for economic
development. Local economic development has become a major development focus and
paradigm over the past three decades due to the failure of centralized economic management to
provide all the necessary development especially, at the local level.
The Government of Ghana (GoG) launched a 25 –year perspective plan (Ghana Vision 2020), in
1995 for national development. The aim was to transform Ghana from a low-income economy to
middle –income country by the year 2020. To attain the rate of growth required to make such a
transformation, the Ministry of Food and Agriculture (MoFA) formulated a medium term (1997-
2007) Accelerated Agricultural Growth and Development Strategy (AAGDS) to increase the
Agricultural sector‟s growth rate from 2-3 per cent (1990- 96) to 5-6 per cent per annum (ADF,
2000).
In line with the AAGDS, MoFA identified cashew as one of the Non-Traditional agricultural
commodities for which Ghana has a comparative advantage to produce for domestic market
(food and industrial material), and for export to regional and international markets. MoFA as a
result have been providing technical and logistical supports to the cashew farmers.

2
The cashew industry is one sub-sector that has the potential to increase Ghana‟s foreign
exchange earnings. However, the long-term neglect of the cashew in favour of cocoa production
has left Ghana behind in competing for a global cashew market worth billions of US dollars
(ADF, 2000). However, the past 14 years in Ghana have been characterised by frantic
government efforts to resuscitate the economy through structural reforms recommended and
supported by donor agencies, particularly the World Bank and the International Monetary Fund
(Bank of Ghana, 2007 cited in CDP (2008).
The Non-Traditional Export Sector (NTES) has been given attention in economic development
due to persistent deterioration in the terms of trade for the country‟s major or traditional exports
– cocoa, timber, and minerals (gold, diamond, bauxite and manganese). (Bank of Ghana, 2007
cited in CDP (2008). For example the cashew sub-sector grew at 30 per cent in value to
US$1,164.5 million in 2007, from US$892.9 million in 2006.
Cashew is one of the agricultural products with the greatest potential for increasing foreign
exchange and employment. There is a growing demand on the world market for cashew kernels
as well as its by-products. It is ranked third in the world of nuts after Almond and Walnut with a
world demand of about 1.75 million metric tonnes (Ghana Cashew Association, Brong Ahafo
chapter, 2008).
There are prospects to increase cashew production and processing for both local consumption
and export even though Ghana is a late developer of cashew crop. For example production of
raw cashew nuts increased from 6,338 tonnes in 2003 to 34,633.88 tonnes in 2006; 23,616.40
tonnes in 2007 and 81,190.47 tonnes in 2008 (ISSER, 2002, 2006, 2007, 2008). In 2006, Ghana
exported 47,000 metric tonnes of raw nuts. This earned the country about US$ 23 million. This
figure is considered small when compared with world excess demand of 430,000 metric tonnes
of raw nuts, valued at US$270 million, and growing at a rate of 5-8 per cent per annum (Ghana
Shippers Council, 2007 cited in CDP (2008).

3
Cashew is thus fast becoming an important component of the country‟s Non-Traditional Export
Sector (NTES). It has become the source of livelihood to some Ghanaians, especially in the
Brong Ahafo Region (BAR). Mim Cashew and Agricultural Products factory in the Asunafo
North district of BAR processes cashew into brandy and cashew wine. Nsawkaw, Sampa and
Awisa cashew factories in the Tain, Jaman North and Wenchi districts respectively process
cashew into kernels for local consumption and export.
About 819,190 persons, representing 79.2 per cent of the population in (BAR), are economically
active and about two-thirds (66.4 per cent) of this are in Agriculture (Ghana Statistical Service,
2005). About eight thousand people in the study areas are into cashew production. Many others
are engaged as cashew farm labourers and workers in other related activities. The African
Development Bank (AfDB) and MoFA have selected Wenchi, Tain, Jaman, Techiman and
Kintampo districts in the region for the implementation of cashew development project, (ADF,
2000). It is therefore necessary to assess the contributions of the cashew production to the
economic development of these areas and make recommendations where necessary.
1.2 Problem Statement
The Non-Traditional Export Sector (NTES) has been given attention in economic development
due to persistent deterioration in the terms of trade for Ghana‟s traditional exports – cocoa,
timber, and minerals (gold, diamond, bauxite and manganese). Cashew has thus been identified
as one non-traditional crop that has the potential to generate foreign exchange for the country
(Bank of Ghana, 2007 cited in CDP (2008).
In 1998, the Brong Ahafo Cashew Farmers Association at a durbar held at Sampa, Jaman District
complained of low prices for their cashew products resulting in low incomes at the end of the
farming seasons. The causes of the low prices for the cashew products may be many. Few
among them are; first, unlike cocoa, the prices of cashew products are neither fixed nor
determined by the Government. The prices are rather determined by the forces of demand and
supply. There is therefore a high level of price fluctuations. Secondly, the products are priced
depending on the type of variety. However, in the study areas, the local (tiny, low priced)
varieties of cashew are largely produced. Since the demand for the local type is low, these poor

4
farmers are compelled by the situation to take any price offered by the buyers. Again poor post -
harvest handling or drying of the nuts reduces the utility (usefulness) in them. The buyers feel
reluctant to buy such deformed nuts and that offer low prices for them. Finally, the cashew
products in the study areas attract low prices because there are inadequate processing plants to
add value to the raw nuts. The nuts are mostly sold in their raw state.
The issue of low prices and the resultant low incomes for cashew farmers in the study areas
discourage the farmers from working on their farms. This reduces the Agricultural sector‟s
contribution to Gross Domestic Product (GDP) and also worsens the farmers‟ living conditions.
In the end some of these farmers claim they find it difficult to repay the loans they take to
maintain their farms. This is likely to kill the industry in the study areas and increase the
incidence of unemployment and poverty.
In July 2000, a mission was sent by the African Development Fund (ADF) upon the request of
Government of Ghana (GoG) to appraise a Cashew Development Project (CDP) for financing by
ADF. The sector‟s goal for the project was to improve living standards of the rural population by
generating rural employment in order to contribute to poverty reduction, and earn foreign
exchange for the country. It also sought to increase production and village level processing of
cashew products towards poverty reduction. The CDP became operational in 2003 with ADF
providing 85.7 per cent of the total project costs while the GoG also provided the remaining 14.3
per cent of the total project costs (ADF, 2000).
The study areas -Wenchi, Tain, Jaman and Kintampo districts were among the districts selected
by the Ministry of Food and Agriculture (MoFA) in collaboration with the African Development
Bank (AfDB) for the implementation of the CDP, (ADF, 2000). According to the District
Agricultural Development Units (DADU) in the study districts, there are over 8,000 cashew
farmers in these sampled districts. However, some of these cashew farmers do not take cashew
production as a full time employment, perhaps due to the low prices for their cashew products
and the resultant low incomes at the end of their farming seasons. On April 4, 2008, the
Ghanaian Chronicle newspaper reported that cashew production had become attractive to the
farmers in Jaman, Tain, Wenchi and Kintampo districts in the Brong Ahafo Region. It therefore

5
reported the need for cashew stakeholders to support the industry with more processing plants in
these production centres to add value to the raw nuts. The Newspaper identified low prices as the
major complaint of the farmers. This research is thus necessary to identify other challenges of the
industry for consideration and address by the appropriate authorities.
1.3 Research Questions
1. What is the role of the cashew industry in Local Economic Development?
2. What effects has cashew production on the local environment?
3. What roles does the Ministry of Food and Agriculture play in the development of the
cashew industry?
4. What are the prospects and challenges of the cashew industry in the study areas?
5. What is the way forward for the cashew industry?
1.4 Key Assumption
The objectives of the research are based on the premise that cashew production in the study area
brings about local economic development. This is because there are about five processing
factories and over twenty purchasing centres in the area.
1.5 Objectives of the study
The general objective of the study is to assess the potentials of the cashew industry for local
economic development and propose policy options that will facilitate it.
Contextually, the study seeks to:
i. examine the role of the cashew industry in local economic development;
ii. assess the effects of the cashew production on the environment;
iii. examine the roles of MoFA in the development of the cashew industry in the study
area;
iv. suggest policy options that could promote local economic development; and
v.
vi. examine the prospects and challenges of the cashew industry in the study areas.

6
1.6 Scope
Geographically, the study is limited to the Jaman, Tain, Wenchi and Kintampo districts of Brong
Ahafo Region. However, comparisons are made with other regions or countries where necessary.
The content of the study focuses on the cashew industry with emphasis on its contribution to the
economic development of the study districts. The study expands from 2003 to 2008, the period
when the Cashew Development Project by the MoFA and ADF became operational.
1.7 Justification
The Brong Ahafo Cashew Farmers Association claimed in 1998 that the cashew farmers receive
low prices for their products. They claimed that this results in low incomes for the farmers at the
end of the farming seasons thereby worsening their living standards and rendering them indebted
to their creditors. Meanwhile, the Government of Ghana (GoG) through the MoFA and ADF
introduced Cashew Development Project (CDP) which became operational in 2003 to „improve
living standards of the rural population by generating rural employment in order to contribute to
poverty reduction, and earn foreign exchange for the country. It also sought to increase
production and village level processing of cashew products towards poverty reduction (CDP,
2008). The study districts were captured under the CDP and so this study is necessary to assess
the contribution of cashew production to the LED.
The Ghanaian Chronicle newspaper reported on April 4, 2008 that cashew production had
become attractive in Jaman North, Tain, Wenchi and Kintampo districts of Brong Ahafo Region
but that the farmers were faced with low prices and inadequate processing plants in the
production centres. The report was silent on the contribution of the cashew industry to the LED.
This study is therefore necessary since it will identify the real challenges of the cashew
industry, assess the contribution of cashew industry to LED, identify the prospects of the cashew
industry to fight poverty and enhance local economic development in the study areas.
Finally, poverty reduction takes the centre stage in the development policies of many developing
countries. Against this background, the ADF‟s Appraisal Report on the Cashew Development
Project in 2000, states that cashew production has the potential of generating significant

7
additional income for the rural population, and that contribute to poverty reduction. Again, a
report by the Ghana Cashew Association, Brong Ahafo chapter in 2008, states that there are
brighter opportunities in the cashew sub-sector for economic development in the Brong Ahafo
Region but these opportunities seem not to be fully utilized. The report noticed that farmers as
well as investors in the cashew industry in the region are not efficiently resourced and motivated
to contribute effectively to the development of the local economies. The report claimed most
farmers do not have access to credit facilities to maintain their farm. A research into the cashew
industry in four selected districts of the B/A Region is therefore necessary since it will help to
identify the challenges and potentials of the industry. It is hoped that the identification of the
challenges and potentials in the industry will guide cashew stakeholders to take appropriate steps
to bring about improvement in the local economies leading to reduction in unemployment rate,
increased income generation, and reduced armed robbery and rural-urban migration. The
findings and recommendations that have direct relevance on the industry in the study areas shall
be the fulcrum around which similar studies will revolve in future.
1.8 Limitations of the Study
The study faced the following challenges in the process of collecting data;
a). Lukewarm attitudes of some respondents
Some respondents did not see the essence of the exercise since according to them, there had been
similar exercises conducted in their communities which did not yield any fruitful results. This
made it difficult to get some farmers to answer the questions. However, upon several
interactions, most farmers came to realise that they had to provide the necessary information to
enable other people get to know what was happening in the cashew production in their areas.
b). Limited time/ Wrong timing
The timing for the study coincided with the season when the farmers were busy working on their
farms. A number of follow -ups were therefore made before they could be found. In certain
cases, meetings had to be rescheduled. Again, the communities are so dispersed that a
considerable amount of time was spent in traveling to respondents.

8
c). Illiteracy and Poor Record Keeping
Most of the respondents lacked formal education. This coupled with poor record keeping
practices hindered smooth access to information. For instance, the estimation of the annual
proceeds from their farms was a problem. However, with guidance they were able to cope with
the study.
d). Financial and Personnel Constraints
There were not enough funds and hence only a handful qualified personnel could be engaged to
assist in the data collection. As a result, the scheduled time had to be extended for seven days.
1.9 Organisation of the Study
The study is organised into five chapters. Chapter one contains the background to the study, the
research problem, objectives, justification and limitations of the study. Chapter two covers a
detailed review of literature on concepts of local economic development, economic growth and
development and the contribution of cashew industry to LED. The third chapter presents the
methodology for the study while chapter four analyses and presents the research findings. The
fifth chapter takes a look at the key issues or findings from the analysis of the data collected from
the field, offers recommendations to policy formulators and the general populace with respect to
investment opportunities and LED in the study areas.
9
CHAPTER TWO
LITERATURE REVIEW AND CONCEPTUAL FRAMEWORK
2.1 Introduction
This chapter examines existing literature on Local Economic Development (LED) to have a
theoretical understanding of how the local economy could be developed with the available local
resources and potentials. The chapter thus examines the concept of LED and its place in
promoting growth and development in society. Various related concepts such as the concept of
development, the concept of economic growth and development are discussed to assess the essence
of developing the local economies to sustain social, political and economic development of local
areas. The chapter also discusses how public investment can lead to LED. Also present is the
performance of cashew industry in other countries such as Nigeria, India and Tanzania. This is
examined to learn lessons from best practices to enhance Ghana‟s cashew sub-sector. Also present
in this chapter is the conceptual and analytical framework. It explains how certain factors combine
to bring about LED.
2.2 Definition of Concepts
The concept of economic growth and development, and the concept of development are two
concepts that focus on development issues. These concepts are employed in this study to ease
understanding of the concept of Local Economic Development (LED).
2.2.1 The Concepts of Economic Growth and Development
Economic development in the past was seen in terms of the planned alteration of the structure of
production and employment so that agriculture‟s share of both production and employment declines
while that of manufacturing and services increase (Todaro, 2003). Todaro claims that economic
growth is a necessary condition to improve the quality of life. Development was therefore defined
as a rapid and sustained rise in real output per head and attendant shifts in the technological and
economic characteristics of society. This conceptualisation gave priority to increased commodity
output instead of the human beings involved in the production. Increases in the output of such

10
industries were recorded as growth in the economy and for that matter development for the country
(Kane and Sand, 1988).
Economic development implies a qualitative change in what or how goods and services are produced
through shifts in resource use, production methods, workforce skills, technology, information, or
financial arrangements. In other words, it is the growth of the country‟s wealth that is to improve the
well being of the country‟s inhabitants (Todaro, 2003). Economic development increases a regional
economy‟s capacity to create wealth for local residents. It depends upon deployment of a region‟s
building blocks – labour, financial capital, facilities and equipment, know-how, land, other physical
resources, and public and private infrastructure, (Kane and Sand, 1988 cited by Kane, 2004). A
regional economy can grow without changing if it simply produces more of the same goods and
services in the same manner. For example, an increase in the population of an area will mean more
income and more demand-driven growth even absent of qualitative changes in the economic
development environment.
Public officials pursue economic development initiatives to spur job growth, increase income for
residents, raise property values, expand the tax base, improve the quality of life, stabilise
communities, reduce poverty, and even lower crime rates (Kane, 2004). In the drive to influence
regional economies, policymakers commit public resources to economic development efforts. The
expected payoffs are growth and development but public resources may be misdirected or wasted if
state and local governments engage in economic development efforts without understanding the
opportunities and limits regarding public actions and regional growth. State and local economic
development efforts work best when they fit the role for public-sector action and build upon local
potentials and strengths to improve the long-run prospects for economic growth and vitality, (Kane
and Sand, 1988 in Kane, 2004).
2.2.2 The Concept of Development
The concept of development has varied meanings and has been defined differently by different
people at different times and at different locations. According to Curle (1995), development means
the creation of a form of society in which certain conditions (safety, sufficiency, stimulus and
satisfaction) prevail for human beings. Curle argues that development should focus on assuring all

11
people of sufficient resources to live and flourish, a safe environment, the satisfaction of a rich
cultural life, and of stimulus for further growth and human development.
Prior to the 1970s, the concept of development was seen as an economic phenomenon in which rapid
gains in overall and per capita Gross National Product (GNP) growth would either “trickle down” to
the masses in the form of jobs and other economic opportunities or create the necessary conditions
for the wider distribution of the economic and social benefits of growth. Issues relating to poverty,
income distribution and unemployment were of less importance. However, in mid 1970s, the concept
changed with emphasis on development of the people rather than development of things. For
instance in Cocoyoc, Mexico in 1974, the new concept stressed more on human life and the natural
environment rather than economic indicators such as Gross Domestic Product (GDP), Gross
National Product (GNP) and economic growth UNCTAD/UNEP, (1974).
Seers (1969), states that development occurs when there is reduction and elimination of poverty,
inequality and unemployment within a growing economy. To him, Economic growth is an increase
in real GDP. GDP is just one dimension of development and so economic growth is a narrow
measure of economic welfare. Seers therefore advocates for a sustainable development that meets
the needs of the present people without compromising the ability of future generations to meet their
own needs. That is, ensuring a better quality of life for everyone, now and for generations to come.
Kokor (2001) states that, development is not a cluster of benefits given to people in need but rather a
process by which a populace acquires greater mastery over its own destiny. To him, three
implications could be drawn from the above because with this type of development, there is the
sharing of the means of production and decision-making which leads to empowerment. First, is a
populist concern which stresses a more people and locally- centered dimension of development.
Again, there is the need for participatory processes and methods whereby the concerned people are
offered considerable scope to introduce their own development agenda, direct the process and
control the results. Finally, there is an increase capacity of local people to act in their own interest
and take ownership responsibility over their own development.

12
The researcher cites with Kokor because when the local people are involved in the development
processes they tend to see the result as their brainchild and that feel proud to protect it. Again, it is
inappropriate for government officials who had no idea about the prevailing conditions in the rural
areas to prepare plans for implementation in these areas. The study thus adopts Kokor‟s definition
of development because it talks about participatory processes which allow the concerned people to
play a role in their own development agenda. For this study, development occurs when there is
improvement in the indicators of human well-being. That is, improved living standard, reduction in
poverty, inequality, unemployment and economic growth within the economy as indicated in
Figure 2.2.
2.2.3 The Concept of Local Economic Development
“Local Economic Development (LED) is a process by which local governments and/or
community-based groups manage their existing resources and enter into new partnership
arrangements with the private sector, or with each other to create new jobs and stimulate economic
activity in a well-defined economic zone” (Blakely,1988). Bergman and Goldstein (1986) cited in
ILO (2001) define local or “the economic zone” as referring to a geographic area composed of a
group of government authorities that share a common economic base and are close enough
together to allow residents to commute between them for employment, recreation or retail
shopping.
Kokor (2001) identifies three levels of locality. The first local level is a set, collectivity or
consortium of communities, which have some established patterns of communication, economic
exchange and social co-operation potential for collective action. Here, there is a local mode of
communication and mobilisation for social development as well as face-to-face relations. Based on
this, the district in the Ghanaian situation could be considered as a local level. The next is the
community level, equivalent to town or a group of villages and often described as the most
important level for development mobilisation and planning efforts. It is defined in geographic
context. The last is a group or sub group level, which involves people associating together in
clearly face-to – face relationship such as kinship and residential locations, ethnicity or others.

13
According to ILO (2001), LED is seen as a participatory development process that encourages
partnership arrangements between the main private and public stakeholders of a defined territory,
enabling the joint design and implementation of a common development strategy, by making use
of the local resources and competitive advantage in a global context, with the final objective of
creating decent jobs and stimulating economic activity. LED is thus about the indigenous
development policies that employ the potentials of local human, institutional, economic and
physical resources. This orientation leads to a focus on taking local initiatives in the development
process to create new employment and stimulate increased economic activity. The reasons being
that the previous economic development theories and programme efforts relied heavily on a belief
that the benefits of economic growth and expansion will trickle down to improve the conditions of
the poor. Policy formulators thus separated macroeconomic policies and maintenance programmes
into two separate and distinct camps (Corporation for Enterprise Development, 1982).
Policy formulators focused almost exclusively on trying to remedy perceived defects in the poor
communities in the form of inadequate education or skills, weak community supports, lack of
motivation and ignored the very real, potent barriers in the structure of opportunities the poor
confront on the demand side of the labour market equation (Corporation for Enterprise
Development, 1982). LED is based on local initiative, driven by local stakeholders and it involves
identifying and using primarily locally available resources, ideas and skills in an integrated way to
stimulate economic growth and development. The aim is to improve quality of life for all (Local
Economic Development Network of Africa (LEDNA, 2008).
Whatever form it takes, LED aims to increase the number and variety of job opportunities
available to the local people. The local government and/or community groups must take on an
initiative, rather than a passive role. In essence, local government with community participation
and using the existing resources required can help to assess the potentials and mobilise the
necessary resources to design and develop the local economy. For the purpose of this work, LED
can be referred to as the process by which community based organisations stimulate or maintain
economic activities and/or create employment opportunities. The principal goal for local economic
development can thus be to develop local employment opportunities in sectors such as agriculture,
industry, commerce, tourism etc. that will aid in the improvement of the lives of community
14
members using existing human, natural and institutional resources. This means LED aims at
promoting participation and consensus building in the economic lives of people at the local level to
promote growth and development. The ability to achieve this is based on the capacity to improve
the business and productive infrastructure, or create an enabling environment that is favourable for
entrepreneurial initiatives and investments, including access to financial resources and credit, in
order to harmonise economic development and environmental protection. For a developed local
economy, this study expects increased employment opportunities, reduced incidence of poverty
and improved living standards of the local people.
National governments make policy and provide funds, research and other support for local
economic development. However, local government authorities decide on LED strategies based
on the overall vision outlined in their development plans. This should take into account the result
of the analysis done to identify problems and prioritise development projects, (LEDNA, 2008).
2.3 Approaches to Local Economic Development
The general objective of LED as a development concept is to take some measure of control of the
local economy back from the markets and the state. In pursuit of this, three approaches are
conceptualised (Boothroyd, 1991).
These are:
Growth promotion approach;
Structural change approach; and
Localisation approach.
2.3.1 Growth Promotion Approach to LED
The growth promotion approach predates the term LED itself, and places emphasis on the “E” in
LED. Traditionally, growth promotion had been considered as economic promotions by chambers
of commerce unions and politicians to grasp at any opportunity to attract investment in order to
increase the size of the economy Eisinger, (1988). To Clarke et al. (1992), the Growth Promotion
Approach is characterised by a focus on industrial recruitment through financial incentives such as
tax abatement and loans in order to lower costs associated with land, infrastructure, and labour. This
is known as “smokestack chasing”. Under the smokestack form of growth promotion, the role of the

15
local economic developer has been, first, to attract capital to the locality by pointing out the
advantages of the locality to the investor. Secondly, he/she seeks to enhance local advantage by
inducing the local government to augment and improve the local infrastructure and to initiate fiscal
measures for the benefit of potential industrial investors without comprehensive strategy to
minimise the net benefit of this investment for the locality. That is, the developer promotes the
location to the potential employer, be it a factory, mine or college and tries to improve the
likelihood of the employer locating within the area by providing incentives such as cheap land,
labour or lax environmental regulations, (Clarke et al. 1992). This approach merely generates
unhealthy competition between localities and develops into a game which there are substantially
more players than prizes thereby inevitably leading to a sizeable number of losers.
Boothroyd and Davis (1991) observes in Canada that at worst, the smokestack chase promotion
approach to LED has simply set into motion an international jet of con artists, charlatans, and plain
crooks who demand grants, incentives, and tax advantages to set up plants that employ workers at
low wages. They move in, skim off the cream, and then move on to another disadvantaged area.
This approach to development has resulted in expensive fiascos right across Canada. Boothroyd
(1991) thus sounds a note of caution to the policy of going all- out to solicit for investment from
outside by all means through enticements without proper examination or consideration of local
alternatives.
2.3.2 Structural Change Approach to LED
The focus of this approach is on the “D” in LED. Thus, it emphasises development as opposed to
economic growth. Proponents of this approach are more concerned with stability and independence.
Practitioners use strategies to retain and expand existing firms and also include a focus on small
business development through entrepreneurial tools like loans and enterprise zones, (Clarke et al.
1992).
The proponents of the structural change approach claim that there are Strategic options that local
authorities can develop to achieve stability and sustainability. These strategic options can be
categorised into the following:
Diversification of markets, product, job requirements and skills;

16
Import substitution;
Support of non-cash economy, for example: housework, traditional hunts and local exchange
trading system, labour credit co-operatives and mutual aid;
Local investment and ownership through credit unions, employee share- ownership plans, co-
operatives and community development corporations;
Resource control through resolving land claims and co-management.
Perhaps, the most significant structural change strategy of all is the control gained by local
communities over their natural resources threatened by commercial interests which have no stake
in any particular local economy. The strategy hence reduces dependence on external investment by
increasing local-ownership; reduces dependence on outside decision-makers by increasing local
control over resource management; and reduces dependence on traditional export markets.
2. 3.3 Localisation Approach to LED
This approach to LED postulates that structural change is necessary but not sufficient as a goal. A
community can be stable and independent but remains exploitative and lonely. The main aim of
proponents of this approach is to create a more “just or fair” production and distribution functions.
The emphasis is shifted from growth and stability to equity. In other words, “L” is considered
more of importance in LED (Boothroyd, 1991). This strategy or approach has been referred to as
Sustainable Local Economic Development (SLED) because of the emphasis on local community
Clarke et al. (1992).
The localisation approach employs a wide range of strategies, some of which relate to eliminating
marginalisation and exploitation of particular groups within the locality such as women, children
and the physically challenged. The strategies used can be categorised into the following:
Distribution mechanisms devised for fair distribution of both economic benefits and costs;
Non – cash mutual aid practices to help the weaker members of the locality;
Quality of working life improvements;
Democratic management structures.
17
The localisation approach is based on social development concerns which are based on the
assumptions that;
The local economy encompasses monetary and non-monetary market transactions just as in
the family, economic and social relationships are interwoven;
The primary goal of LED is to create equality and strengthen the sense of community among
all individual members of the locality;
Economic entrepreneurship should evolve more from collectivism than individualism;
All members must be empowered to participate in decision-making processes that shape the
locality‟s economic future.
Critics of this approach assert that for an individual, privacy displaces a sense of responsibility
for and commitment to the public good. Wilson, (1983) as cited in Boothroyd (1991) alleges that
life itself will become a refuge from an anonymous, faceless society. Since it is believed that
humans cannot change anything, people create a sanctuary where they can, at least be
comfortable by themselves. The approach is therefore, for many, a utopian ideal.
LED is a multi-faceted activity and must therefore respond to social and economic demands of
localities. This means that to achieve an all-round development, the concept must be all
embracing and borrow from each of the three approaches to LED.
2.4 Local Government Authorities and Local Economic Development
The District Assemblies, according to the local governments Act 462 (1993), are charged with
the responsibility to see to the overall development of their areas of jurisdiction. This implies that
the Assemblies are to ensure the development of all sectors of the local economies. This requires
some investment in three sectors of the economy - the real sector consisting of agriculture and
industry; the social infrastructural sector, that is the provision of education, health, housing,
sports and recreation and water and sanitation facilities and the economic infrastructural sector
comprising the provision of market infrastructure, extension electricity (energy), hospitality,
trade, transportation and communication. These constitute what Curle (1995) refers to as certain
conditions (safety, sufficiency, stimulus and satisfaction) in his definition of development.
18
Kokor and Kroes (1996) discuss four roles of local government authorities for local economic
development. These are; Participatory, Facilitation, Regulatory and Adjustive.
(a) Participatory
With the participatory role, the local governments act as market entities. This is owners of
productive assets. Local government authorities thus participate in equity positions and
partnership arrangements which make purposeful use of local public resources directly available
to the local economy. The local authorities in this sense can employ the growth promotion
approach, structural change or localisation approach to ensure development of the area.
(b) Facilitation
The local government authorities in pursuance of facilitation role use instruments such as
subsidies and incentives to encourage economic activities including delivery of public services.
For example, the local government may provide electricity, water or roads at a particular locality
with the view to attracting investors to the place. It may also be an incentive to retain the young
and energetic working population, all for the purpose of LED.
(c) Regulatory
By this role, the local governments use their rating systems and by-laws to monitor the local
private market. The local authorities see themselves as key players in an evolving national
economic competition. One that requires efforts to shift to free economy and in many instances
improves the socio-economic standing of its folks through equity planning during the strategic
economic development process. Thus, the focus should be on strategies such as public-private
partnerships to create a conducive economic atmosphere for the business entrepreneurs in the
locality.
(d) Adjustive
This is a social role by which the local governments get involved in the provision of local public
services that mitigate the negative effects of the markets, especially on the disadvantaged groups,
reduce the uneven distribution effects of market forces. Market prices act as signals to producers
to supply more or less of a commodity according to changing profitability of production. The
19
efficiency of the market relies on price acting as signals, and suppliers responding, on the
mobility of the factors of production which enable supply. These conditions enable markets to
perform allocative and creative functions. However, due to market imperfections, prices may not
reflect marginal cost. Many developmental goods, which adequately meet social needs and
services; where benefits go to entire society, may not be produced at all because markets are
incomplete or missing entirely. The state therefore intervenes on behalf of consumers, especially
the poor.
For LED, the local government authorities should adopt strategies that ensure the development of
all sectors of the local economies. The real sector for instance, has the capacity to provide
employment for the local populace and improve the revenue base of the local governments in the
country. Unfortunately, most governments in developing countries like Ghana commit the chuck
of the country‟s scarce resources into provision of social infrastructures. Figure 2.1 depicts
that the main sectors; social, economic and real are mutually supportive of each other and that
attention should be paid to all to serve as a conduit for growth and development. Nonetheless, the
social and economic infrastructural sectors should facilitate the creation of an enabling
environment for the real sector to bring about the needed development with the collaborative
effort of the private sector, civil society and public institutions. The local government authorities
facilitate and regulate the social and economic sectors to support the real sector that comprises
agriculture and industry to provide employment opportunities with ripple effects in the economy
as shown in Figure 2.1.

20
Figure 2.1: Public Investment and Local Economic Development
.
Source: Author‟s Construct May, 2009.
2.5 The Status of Cashew Industry in Ghana
Cashew is grown as a cash crop in the coastal belt (Central, Greater Accra, and Volta Regions),
the transitional belt (north of Ashanti, Brong-Ahafo) and guinea savanna belt (parts Northern,
Upper West and East regions). The ideal rainfall regime is between 750mm – 1300mm. Cashew is
a hard crop which grows well on marginal lands. It is seen as an ideal crop for soil conservation
and afforestation, especially in savannah areas (ADF, 2000). The crop is cultivated in all the ten
regions of Ghana. The major production districts in the country are listed in Table 2.1.
PUBLIC INVESTMENT IN THE
LOCAL ECONOMY
ECONOMIC
INFRASTRUCTURE
SOCIAL
INFRASTRUCTURE
REAL SECTOR
INDUSTRY
AGRICULTURE
LOCAL ECONOMIC DEVELOPMENT
LOCAL GOVERNMENT
AUTHORITIES

21
Table 2.1: The major Cashew Production Districts in Ghana
Region Districts
Greater Accra Ga West, Dangbe West
Ashanti Region Ejura Sekyeredumase, Sekyere West, Offinso, Sekyere East
Central Gomoa, KEEA, Asikuma, Twifo Hemang
Eastern Afram Plains, Suhum Kraboa, Asuogyaman
Western Ahanta West, Mpohor Wassa, Bibiani, Wassa Amenfi
Volta Nkwanta, Hohoe, Kpandu, Akatsi, Keta
Brong Ahafo Jaman, Wenchi, Kintampo, Nkoranza, Techiman, Atebubu
Northen West Gonja, Bole, Yendi, Mamprusi
Upper East Bawku, Builsa and Kassina-Nankena districts
Upper West Nadowli, Jirapa-Lambussie and Sissala districts
Source: ADF, 2000.
An estimated 3.24 million ha of suitable land is available for cashew cultivation in the country.
Since 2003, the Cashew Development Project (CDP) has been ensuring the availability of improved
planting materials or farm inputs, access to extension services, credit facilities for establishment of
new cashew farms. This intervention was to overcome the problem of farmers using planting
materials from unselected trees/farms for planting which had resulted in a lot of the farms
established in the 90s producing uneconomic yields. To enhance the efficiency of cashew marketing
in Ghana, Cashew Processors and Exporters Association (CAPEAG) has been formed and
registered. The producer associations and processors/exporters associations are currently being
trained on quality standards developed by the industry through appropriation of grades and
standards, spearheaded by USAID TIPCEE project with support from the MOFA-CDP and other
stakeholders (ADF, 2000).
The total installed capacity of the Nasaka group of processors, Winker Agro Processing, Shop
Best, Nsuro, CRIG and Krobo Group of Processors is about 377 tonnes annually. However, about
50 per cent of this capacity is only utilised due to the inadequate working capital to purchase and
stock raw nut all year round. About 25.6 million Ghana cedis credit facility was disbursed to at least
12,000 small holder farmers under MOFA‟s Cashew Development Project. But the farmers still do

22
not have easy access to farm credit to finance maintenance and expansion of their operations (CDP,
2008).
2.6 The Performance of Cashew Industry in some selected Countries
Cashew grows widely across the tropics under a range of conditions from managed plantations,
through smallholding plots, to semi-wild or wild populations. Trade in the cashew industry revolves
primarily around the raw nuts and kernels, although the cashew apple and the cashew shell present
other marketing opportunities.
2.6.1 Cashew Industry in India
African countries produce about 36 per cent of the world‟s cashew nuts but export 75 per cent of
the nuts in raw form, mostly to India. The value of such nuts as imported to India is about US$900
per tonne. But the export value after processing averages US$5,300 per tonne, about 489 per cent
change. In India, an estimated 500,000 women process cashew nuts for a living in Tamil Nadu and
Kerala, two states in Southern India. A report by Action Aid cited by Sijaona M.E.R. (2002) was
that about 6,700 tonnes of cashew nuts are exported from India to the UK annually and 80 per cent
of it is sold through supermarkets. The Indian Women shelling cashew nuts could produce between
5 and 10kg of nuts per day and export to UK for £9 per 1kg. However, trade liberalisation has had a
damaging impact on the cashew processing industries in developing countries. For example, a
condition of a World Bank loan to Mozambique was that it liberalised its cashew production,
including abolishing subsidies to processing operations. World Bank‟s condition for abolishing
subsidies for cashew processing led to the closure of most processing factories and the loss of
10,000 jobs, (Co-operative College, 2007).
Cashew Products
The kernel is what the tree is primarily valued for. The cashew shell contains a corrosive phenol,
Cashew Nut Shell Liquid (CNSL), which must be extracted before the shell can be removed to
yield the kernel. CNSL has found many applications in the polymer-based industries -the most
important use is in the manufacture of brake linings and clutch facings in the automotive industry.
Some of the products of cashew on the international market are displayed in plate 2.1.

23
Plate 2.1: Cashew Kernels prepared and packaged differently
Source: Chemonics International Inc., 2002.
Consumer Demand
The overall market for edible nuts – walnuts, almonds, macadamia, pecans, etc. has increased,
particularly as consumers increasingly consider nuts as health food, albeit one with a high fat
content. Products such as honey-roasted peanuts, chili-coated peanuts and tropical nut blends
have been introduced into the market to meet consumer demands, and many traditional foods
e.g. bread, corn flakes, chocolate, salads and bakery products, are now enriched with nuts.
Cashew kernels are high value luxury commodity with sales growing steadily at an annual rate of
7.0 per cent. There is substantial potential to exploit cashew by-product such as butter (from
broken kernels), CNSL and Vitamin C-rich juice of cashew apples among others, (Hammed et al,
and 2008).
Although, the sales of some basic nut products, such as peanuts, have been static, the premium
nut market, i.e. cashews, pistachios, etc., has been doing well. Cashew is among the most
popular nuts, although sales are restricted due to prices. They have low levels of saturated fats
and soluble sugars; contain high percentages of proteins and polyunsaturated fatty acids to
reduce cholesterol levels in the blood; and have high levels of mineral salts (Topper 2002). Since
cashew production is restricted to the tropics, the kernel demand in the temperate markets must

24
be met through imports. The cashew kernel is used in the snacks, confectionery and bakery
industries, with at least 60 per cent of kernels consumed as snacks. Kernels are popular as a
roasted and salted nut for snacking, and whole, larger kernels are preferred for this purpose. The
remaining 40 per cent, composed primarily of pieces of inferior grades based on size and colour,
is supplied to the bakery and confectionary sectors for chocolate and candy making (Ezeagu,
2002). Table 2.2 shows how some cashew products are prepared and used.
Table 2.2: Cashew Products
Input Products Description and Uses
Nuts Kernels Raw nuts are processed into kernels by boiling, cracking, decorticating and
roasting.
Apple Prunes Cashew prunes, produced by boiling the cashew apple in molasses, is very
similar to dehydrated prunes or dates.
Apple Juice Cashew fruit is pulped by grating or pounding and the juice is pressed out
and strained. Cashew juice has five times more citric acid than orange juice
and is thus a good source of preservation acid medium when mixed with
other fruit juices or vegetables.
Apple Wine The juice from the cashew fruit can be processed into wine using the
conventional method of producing fruit wines. The alcoholic content
averages 18 per cent.
Apple Pulp The fibrous pulp obtained after extracting juice from the cashew apple can
be used as animal feed or dried and processed into diet fiber biscuits.
Apple CNSL Extracted from the cashew shell, Cashew Nut Shell Liquid (CNSL) is used
in the manufacturing of paints, varnishes, resins and brake linings.
Shell Fuel
Wood
After extraction of the shell liquid, the spent shells are used as a processing
fuel.
Source: Chemonics International Inc., 2002.

25
Production
Four producer countries, India, Brazil, Vietnam and Tanzania, dominate the cashew industry. It
is difficult to provide an exact assessment of global production, as information could not be
accessed. However, figures provided by the Food and Agriculture Organization (FAO) in 2001
suggest a global output of 1.4 million tonnes per year. India is the largest buyer of raw nuts,
followed by Vietnam and Brazil, and the raw nut trade is primarily focused on the Indian
requirement. India and Vietnam import raw nuts in order to keep processors in operation year-
round. Table 2.3, taken from Indian import figures, illustrates that India has been increasing its
raw nuts imports. Africa supplied about 90 per cent of India‟s raw nuts requirement. While Asia
has declined in importance as a supplier, West Africa has been the fastest growing source of raw
nuts globally.
Table 2. 3: India‟s Imports of Raw Cashew Nuts in Metric Tonnes (MT)
Origin/Yr 1993/94 1996/97 1999/00 Trend % Increase
W. Africa 51,482 61,260 110,000 79.6
E.Africa 80,219 88,149 109,400 24.0
Asia 59,000 52,155 10,760 -20.6
Other 621 11,288 12,523 10.9
Total 191,322 212,852 242,683 14.0
Source: Chemonics International Inc., 2002.
Key: increasing, falling, and increasing over 10 per cent per annum.
Cashew Kernels
Cashew kernels represent the next step in processing of raw nuts, a step that India and Brazil
have long profited on, and which is being attempted by many other cashew exporting countries.
Vietnam, Tanzania, Mozambique, and others are all seeking to focus on export of processed
kernels as the logical step in building their industries.

26
Processing Technology
Before the nut can be consumed, the shell must be removed to release the kernel. This
decortication is difficult and labour intensive. It is not a process that can be carried out by the
consumer, as in the case of almonds or walnuts; neither is it viable to shell cashew nuts in
developed economies where labour costs are high. It is critical to understand that although the
shelling adds value to the product, the increase in value reflects the low yields of kernels, at
around 22 - 24 per cent of the raw nuts input. One tonne of raw cashew nuts yields 150kg –
250kg (15-25) of decorticated kernels; this includes all grades, from wholes to pieces. Of these
decorticated kernels the yield of wholes will vary from 55 to 85 per cent depending on the
process and the skill of the operators, (Ezeagu, 2002). Cashew nuts can be shelled at the village
level and there is significant local consumption throughout the growing regions. However, for
export, volume output must be consolidated and the fragile kernel requires specialised
packaging. Shelling therefore is usually centralised in processing factories, which may be
entirely labour-based.
2.6.2 The Cashew Industry in Nigeria
Cashew has tremendous potential as a “cash crop” to generate foreign exchange and to create
employment, especially for women, as well as curb desertification. There is a large and growing
domestic and regional market for surplus kernels, as well as other cashew by-products. West
Africa is now the major supplier of raw materials to the Indian processing powerhouses; co-
operation between major exporting countries in West Africa could leverage improved prices. The
industry focuses on low-end raw nut production, losing substantial income to countries like India
and Vietnam by not focusing on value added products like the cashew kernel, (Ezeagu, 2002).
a/ Cashew Kernels
Nigeria processes approximately the same quantity of kernels as it exports as raw nuts. The
majority of the kernels processed, approximately 75 per cent, are processed for the local market.
Local kernels vary in quality and grades from those tied in nylons to those packaged in tins and
bottles, competing for and in most cases winning shelf space with the few imports. Prices also
vary considerably from US$5-US$14/kg, depending on quality, packaging and marketing outlet.
Surprisingly, Nigeria has made inroads into the U.K., U.S. and the Middle Eastern cashew kernel

27
markets by consistently providing quality products in a timely fashion. Besides adding value,
these facilities employ up to 550 people during peak production, more than half of them women.
However, these processors need support to build and strengthen their position in the international
market so as to earn more foreign exchange for the country. For example, in 2001 the
Government earned a total of US$ 7.459474 billion from cashew exports as depicted in Table
2.4.
Table 2.4: Income from Cashew Exports, 2000 -2001
Criteria 2001 US$
Cashew Kernel 0.439,474 bn
Raw Nut 7.02 bn
Total 7.459474 bn
Source: Chemonics International Inc., 2002.
b/ Market
Local consumption of cashew kernels follows the same market patterns as the international trade.
The large sized kernels are consumed as snacks while the smaller splits, bits and pieces are used
for cooking by bakeries, confectioneries and restaurants, particularly Chinese cuisine. The
suppliers of cashew kernels to the local markets include factory processors (e.g. AgroPro;
Cashew Nuts Processing Industry, Ibadan; Fugard, etc.), who supply to the supermarkets and
restaurants/hotels while artisan processors process and package the kernels in nylons and
recycled bottles for sale at the local markets and streets throughout Nigeria, (Chemonics
International Inc., 2002).
c/ Trade
About 30 per cent of recorded Nigerian raw cashew nuts (valued at about US$12 million) are
exported to the major processing countries, such as India, Brazil and recently, Vietnam, for
further value-added processing. Approximately, 10 per cent more goes unrecorded through
Lagos port and/or neighbouring Cotonou, Benin Republic, where they receive a 20 per cent
premium. Roughly 30-40 per cent of raw nuts are processed into kernels, the majority of which is
for local consumption. A couple of Nigerian producers currently supply some US and UK

28
brokers with cashew kernels. There are usually two major buying outlets at the village level -
buying centres and local markets. Buying centers are located in major producing areas where
farmers can sell their products. These centres usually buy several commodities, depending on the
seasonality of the product mix. The raw nuts are either exported or further processed into kernels
for local consumption and/or export, (Chemonics International Inc., 2002).
d/ Processing
The local market processors/suppliers are more diverse. There are those that process just up to an
intermediate stage, and then sell to finishers that roast, package and retail. Others perform all of
the processing, packaging and distribution. These processors vary in size and sophistication from
the individual artisans to the semi-automated factory. For instance, Agropro, which is based in
Okigwe, Imo State was established in 1998 to process kernels for the export market. However,
when kernel prices crashed in year 2001, the company was left with no choice but to focus on the
unexploited local market. Surprisingly, Agropro is making much profit by concentrating on the
domestic market, (Chemonics International Inc., 2002).
The majority of processing plants in Nigeria employ the labour-intensive Indian processing
technology. The Oyo State Cashew Nuts Processing Company Plc. utilises the mechanised
Italian process but it has the disadvantage of producing discoloured kernels resulting from the
dripping of CNSL during processing. Under the labour-intensive Indian processing technology, a
small-scale plant can process about 180 metric tonnes raw nuts per month during peak
processing and requires about 550 people. An average of 350 of these 550 employees is women
(64 per cent).
e/ Processing Constraints
Although a few processors have successfully supplied the international market, they still need
help to strengthen and grow their very small, almost negligible market share. Major constraints
include the high cost of capital and high staff turnover; more importantly, the challenges include
purchasing and storing raw nuts to process throughout the year. India, the world‟s largest
processor, purchases raw nuts throughout the year at favourable financing rates to supplement
their supply. Brazil has a ban on the export of raw nuts and also imports when domestic supplies

29
are short. Since raw nuts constitute roughly 80 per cent of production cost in Ngeria, there is a
need to develop cost effective methods to keep processors stocked with their raw inputs. Again,
additional time and labour are needed to peel the testa from the kernel and to upgrade poor
hygiene standards, as kernels produced are food products, (Ezeagu, 2002).
f/ Job Creation
In 2000, about 122,000 people were employed in the Nigerian cashew processing sector. This is
projected to increase by over 100 per cent to 246,000 people in 2008 (Chemonics International
Inc., 2002). This is an indication that the processing industry has the potential to employ a lot of
people given the necessary boost. For example, in the view of Kokor and Kroes (1996), the local
government authorities could provide public services such as electricity, water or roads at a
particular locality to attract and /or retain investors to the place. It may also be an incentive to
retain the young and energetic working population, all for the purpose of LED.
2.6.3 The Cashew Industry in Tanzania
Cashew provides an important source of income for some 280,000 smallholder farmers in
Tanzania (Mitchell, 2004). It is especially important in the southern coastal region, where the
districts of Mtwara, Lind, and Ruvuma account for 80-90 percent of Tanzania‟s marketed
cashew crop. Cashew nuts are also important to the national economy, providing 18 per cent of
Tanzania‟s merchandise export earnings, (World Bank OED, 1998). Marketed production rose to
121,207 tons in 1999/00, from a low of 29,868 tonnes in 1990/91. Export earnings from raw
cashew nuts rose from less than US$4 million in 1990 to US$107 million in 1998. This recovery
has been credited to the economic reforms begun in 1986, especially trade liberalisation and
exchange rate adjustments, and to the sector reforms begun in the mid-1990s, which eliminated
the monopoly of the Cashew Nut Marketing Board (Mitchell, 2004). Tanzania and Mozambique
have been major suppliers of cashew nut to India. Tanzania has been supplying about 41 per cent
by value of total Indian imports followed by Mozambique, with about 12 per cent (Topper,
2002).

30
Constraints
Several major issues in the cashew sector were highlighted by events during the 2000/2001
marketing season. The most important were the deterioration in export crop quality and the
corresponding decline in export unit values compared with other exports, farmers‟ need to
finance production costs, the overall taxes on producers and the increases in local taxes. In
general, the production and harvesting performance of cashew nut sector are affected by the
following factors;
a/ access to land and the availability of better planting materials and other farm inputs
b/ farmers training and establishment of village based nurseries operated by farmers
c/ implementation of a comprehensive agricultural extension approach to complement the
national extension service that was particularly aimed at promoting cashew nut production
d/ market liberalisation of the cashew industry, whereby inputs, crop and processing business
were privatised with minimum interference from the government (Topper et al., 1998).
2.6.4 Mutual Link between Cashew Industry and the Economy
A link is established between the cashew industry and the economies of the study areas. This
link as deduced from the literature is in the area of employment, income and foreign exchange to
the government. The national and/or local authorities adopt certain strategies or policies such as
subsidies for farm inputs, removal of taxes for all cashew processing machinery and equipment,
the export expansion grant to allow processors and exporters of kernel the opportunity to
repatriate 20 per cent of their foreign proceeds (Sijaona, 2002). At times the Government of
Tanzania negotiates for credit facilities for cashew farmers or processors to enable them increase
productivity.
a/ Employment
Cashew provides an important source of income for some 280,000 smallholder farmers in
Tanzania, (Topper et al, 1998). According to Mitchell (2004), about 20,381 workers were
engaged to shell about 107,000 tonnes of cashew nuts in Tanzania in 2001. The value added per
day of such manual processing was about three times the average wage in Tanzania.

31
b/ Taxes
Mitchell (2004) states that cashew nuts are important to the national economy, providing 18 per
cent of Tanzania‟s merchandise exports. He claims, in Tanzania the cashew traders are required to
pay the district taxes before they purchase cashew nuts and that total taxes on cashew products
amount to about 18 per cent of the producer prices. Obviously, the workers in the industry;
farmers, traders and others engaged in the cashew related activities pay taxes to the government.
c/ Foreign Exchange
Between 2006 and 2008, Ghana earned US$42,998.09 for exporting 139,440.75 tonnes of cashew
(CDP, 2008). Tanzania received a total of US$220.7m from cashew export in 2000 and 2001
while Nigeria received a total US$7.459474 billion, as foreign exchange earnings from cashew
exports in 2001 as depicted in Table 2.3 (Ezeagu, 2002).
d/ Access to Credit Facilities and other Incentives
The Ghanaian government through MoFA, in collaboration with the ADB disbursed a total amount
of GH¢ 2,417,013.00 to 4,580 farmers under CDP in the study districts between 2004 -2007. The
multiplier effects of the credit facilities in the communities include the possibility to boost local
economic activities. Again, to promote local processing of cashew nuts, export levy on cashew
kernel as well as taxes for processing machinery, equipment and spares were removed in Tanzania.
This reduces production cost and indirectly increases the profit of processing firms.
2.7 Conceptual Framework for LED
Based on the performance of the cashew industry in the selected countries above, a correlation
between the cashew industry and national or local economies can be conceptualised. That is, the
cashew industry affects economic development of the locality and the national or local economy
also affects the cashew industry. It is deduced that the cashew industry provides foreign exchange
and income for the Government. It also provides employment, with its trickle down effects, for
people in the communities. In that same way, the cashew industry also depends on the national
and/or local economies for labour (skilled and unskilled), improved seeds and farm inputs,
agriculture extension services, skills and technical training, market opportunities, credit facilities
as well as socio-economic infrastructure (essential factors) as illustrated in figure 2.2.

32
From figure 2.2, it is assumed that the availability of the essential factors such as land, improved
seeds and farm inputs, agriculture extension services, credit facilities and socio-economic
infrastructure will bring about high productivity as well as improvement in income and foreign
exchange earnings. It is also assumed that high productivity in the cashew industry, improved
incomes for the farmers and processors and increased foreign exchange earnings for the
government will help to increase the rate of employment in the study districts and ensure booming
economic activities as ripple effects. As a result, there will be an improvement, generally in the
living conditions of the producers. However, whether these essential factors required to propel the
cashew industry are adequate in the study areas is part of this research.
Figure 2.2: Conceptualised Relationship between Cashew Industry and LED
Source: Author‟s Construct, 2009
Essential Factors
Access to land
Access to improved seeds & other farm inputs
Access to extension services, skills and technical training
Availability of market opportunities/market liberalisation
Access to credit facilities
Provision of infrastructure/services
IMPROVED CASHEW INDUSTRY
IMPROVED INCOME
IMPROVED FOREIGN
EXCHANGE EARNINGS
SSEARNINGS
HIGH
PRODUCTIVITY
INCREASED
EMPLOYMENT
IMPROVED LIVING
STANDARDS
REDUCED INCIDENCE
OF POVERTY
IMPROVED LOCAL ECONOMIC DEVELOPMENT
33
2.8 Lessons learnt from the Review
LED is about local people working together to achieve sustainable economic growth that brings
economic benefits and improvement in the quality of life for all people in the locality. The
essence of LED is the use of endogenous potentials and resources to ensure the creation of
economic activities to bring about an improvement in the living conditions of the people.
Another lesson is that, contrary to the 1970s when development was measured by the gains in
the overall and per capita Gross National Product (GNP), in latter times, the concept of
development has changed with emphasis on development of the people rather than development
of things. Thus development occurs when there is improvement in the indicators of human well-
being; reduction in poverty, inequality, unemployment with economic growth within the
economy. The new concept of development therefore stresses more on human life and the natural
environment rather than economic indicators such as Gross Domestic Product (GDP), GNP and
economic growth alone.
It has also been learned that the development process in an economy requires investments in
different sectors of the economy, such as the real sector, economic infrastructure sector and the
social infrastructure sector. Most Governments in developing countries tend to shift a chunk of
their resources to the provision of social infrastructure services but a lesson learnt from the
review is that in agrarian economies, there is the need to invest chiefly in the real sector. Thus
the social and economic infrastructural sectors should facilitate the creation of an enabling
environment for the real sector to bring about the needed development with the collaborative
effort of the private sector, civil society and public institutions. Finally, it has been realised that,
to attract investors requires the ability to sell or market the available potentials of a locality to the
investors and create an enabling environment that is conducive for investment.
34
CHAPTER THREE
RESEARCH METHODOLOGY
3.1 Introduction
This chapter explains the methodology used to conduct this research. The chapter is concerned
about how the data were collected and analysed. It is organised in the following order; the
introduction which is followed by the research design adopted for the study. Research units is
followed by research variables, determination of sample size, sampling methods, data collection
techniques and ends with summary of the chapter.
3.2 Research Approach
This study adopted a survey research approach to assess the contribution of cashew production to
local economic development. Survey research is a scientific social research method that involves
sampling people to answer some questions (Babbie1990). The broad area of survey research
encompasses any measurement procedures that involve asking questions of respondents. A
"survey" can be any form, a paper-and-pencil feedback form or one-on-one in-depth interview
Trochim (2006). Standardised questionnaires were designed and administered to get information
about the research question(s) for analysis. A survey research approach was employed because
the researcher has no control over the real life situation of the Units to be studied in this research.
It also helps to collect information such as attitudes, opinions and behaviours that are not
available from other sources
3.3 Research Units
According to Kreuger and Neuman (2006), a research unit is the kind of empirical case that a
researcher observes, measures and analyses in a study. Research units for this study were the
people and organisations sampled for the study. The population (universe of units) targeted for
this study were people and organisations involved in the cashew industry in the study areas. The
units for this study are composed of all cashew farmers, buyers and processors in Jaman, Tain,
Wenchi and Kintampo districts of Brong Ahafo Region. The units used include cashew farmers,
buyers, Agricultural Extension Agents (AEAs) who were in charge of cashew crop in the study

35
districts, cashew processing factories at Sampa, Kabile, Nsawkaw and Awisa and Ghana Nuts
Ltd. Techiman.
3.4 Research Variables
The variables employed for this study include access to farm lands, access to agricultural
extension services and training, access to credit facilities and market opportunities in the study
districts. The availability or otherwise of these variables have implications for the productivity of
the research units. Other variables include employment, farm incomes, women participation in
the industry as well as the effects of cashew production on the environment. The indicators used
to measure or describe the goodness or otherwise of the variables were excellent, very good,
good, fair or poor and friendly or unfriendly.
3.5 Sample Size Determination
The sample size for each district was determined by using a mathematical formula of Dickey
Watts (1998), cited in Cochran, W.G. (1977);
n = N .
1+N (α) 2
Where n= sample size,
N= sample frame and
α= confidence level
The sample frames (N) for Kintampo, Jaman, Tain and Wenchi districts were 3305, 2017, 1340
and 1,410 respectively. With 90 percent confidence level (0.10), the sample sizes (n) were
estimated as shown in Table3.1;
The sampling frames (list of all units in the population from which samples were selected) were
received from the various offices of the MoFA at the district level. Ten names from each district
list were randomly picked and rechecked during the day reconnaissance survey in each districts.
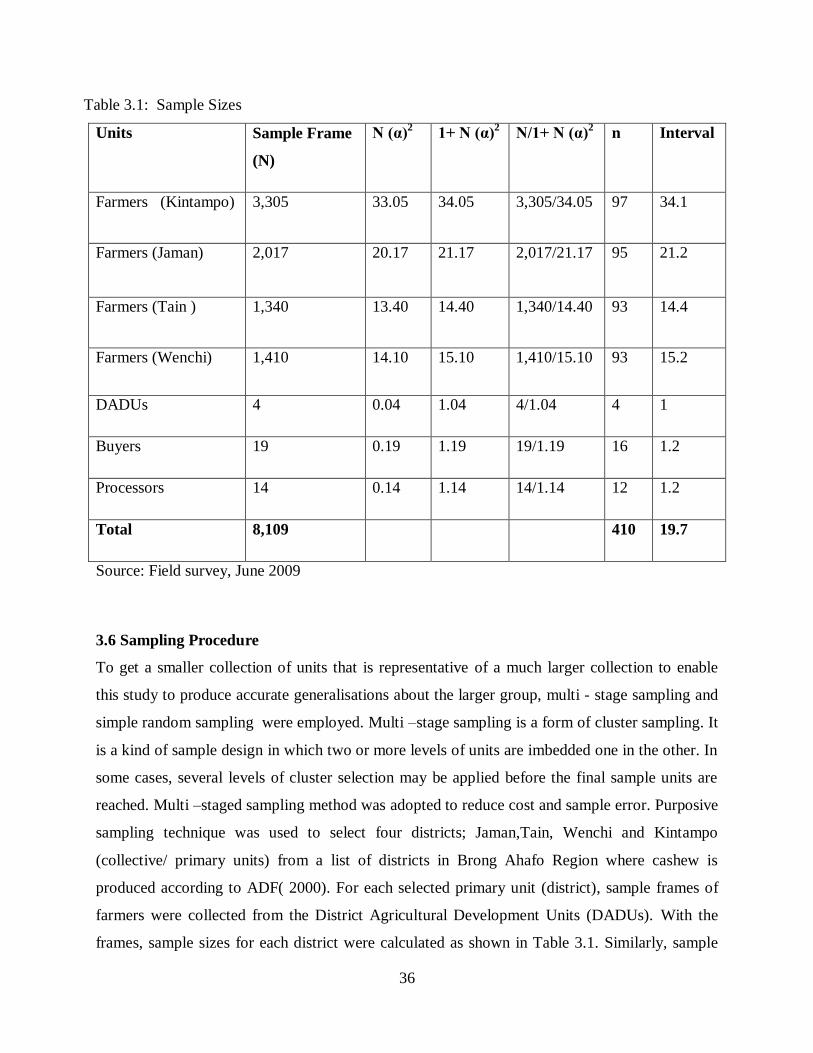
36
Table 3.1: Sample Sizes
Units Sample Frame
(N)
N (α)2 1+ N (α)
2 N/1+ N (α)
2 n Interval
Farmers (Kintampo) 3,305 33.05 34.05 3,305/34.05 97 34.1
Farmers (Jaman) 2,017 20.17 21.17 2,017/21.17 95 21.2
Farmers (Tain ) 1,340 13.40 14.40 1,340/14.40 93 14.4
Farmers (Wenchi) 1,410 14.10 15.10 1,410/15.10 93 15.2
DADUs 4 0.04 1.04 4/1.04 4 1
Buyers 19 0.19 1.19 19/1.19 16 1.2
Processors 14 0.14 1.14 14/1.14 12 1.2
Total 8,109 410 19.7
Source: Field survey, June 2009
3.6 Sampling Procedure
To get a smaller collection of units that is representative of a much larger collection to enable
this study to produce accurate generalisations about the larger group, multi - stage sampling and
simple random sampling were employed. Multi –stage sampling is a form of cluster sampling. It
is a kind of sample design in which two or more levels of units are imbedded one in the other. In
some cases, several levels of cluster selection may be applied before the final sample units are
reached. Multi –staged sampling method was adopted to reduce cost and sample error. Purposive
sampling technique was used to select four districts; Jaman,Tain, Wenchi and Kintampo
(collective/ primary units) from a list of districts in Brong Ahafo Region where cashew is
produced according to ADF( 2000). For each selected primary unit (district), sample frames of
farmers were collected from the District Agricultural Development Units (DADUs). With the
frames, sample sizes for each district were calculated as shown in Table 3.1. Similarly, sample
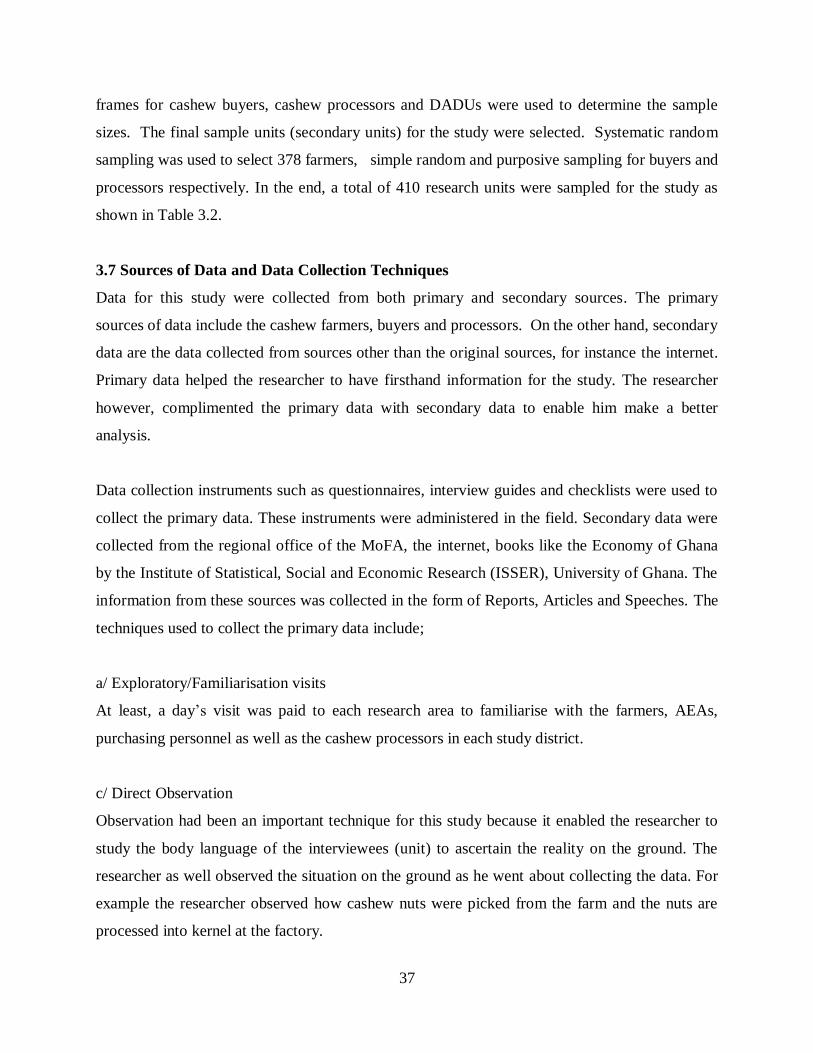
37
frames for cashew buyers, cashew processors and DADUs were used to determine the sample
sizes. The final sample units (secondary units) for the study were selected. Systematic random
sampling was used to select 378 farmers, simple random and purposive sampling for buyers and
processors respectively. In the end, a total of 410 research units were sampled for the study as
shown in Table 3.2.
3.7 Sources of Data and Data Collection Techniques
Data for this study were collected from both primary and secondary sources. The primary
sources of data include the cashew farmers, buyers and processors. On the other hand, secondary
data are the data collected from sources other than the original sources, for instance the internet.
Primary data helped the researcher to have firsthand information for the study. The researcher
however, complimented the primary data with secondary data to enable him make a better
analysis.
Data collection instruments such as questionnaires, interview guides and checklists were used to
collect the primary data. These instruments were administered in the field. Secondary data were
collected from the regional office of the MoFA, the internet, books like the Economy of Ghana
by the Institute of Statistical, Social and Economic Research (ISSER), University of Ghana. The
information from these sources was collected in the form of Reports, Articles and Speeches. The
techniques used to collect the primary data include;
a/ Exploratory/Familiarisation visits
At least, a day‟s visit was paid to each research area to familiarise with the farmers, AEAs,
purchasing personnel as well as the cashew processors in each study district.
c/ Direct Observation
Observation had been an important technique for this study because it enabled the researcher to
study the body language of the interviewees (unit) to ascertain the reality on the ground. The
researcher as well observed the situation on the ground as he went about collecting the data. For
example the researcher observed how cashew nuts were picked from the farm and the nuts are
processed into kernel at the factory.
38
d/ Photography
The use of photography to support data analysis has been of great importance to this piece.
Photographs are supposed to be direct replica of the real situation. It can be considered as one of
the best means of recording, keeping and presenting data. This technique is adapted to show
photographs of cashew farms, processing factories and several kinds of cashew products to
readers.
3.8 Data Analytical Techniques
Data gathered as well as the responses to questionnaires were analysed descriptively. The choice
of a particular analytical tool was influenced by the problem statement and the objectives of the
study. Frequency distribution, tables, bar charts, simple ranking procedures and methods have
been used to present data.
In all, 410 questionnaires were administered to the various groups or clusters sampled for the
study as shown in Table 3.2. The response rate was 94 per cent. That is, 385 questionnaires were
received for the analyses. The reason for the 6 per cent non response rate was ignorance. The
research units, especially the farmers did not see the need to waste time on a study that will
neither increase their output nor income.
Table 3.2 Research Questionnaires Response Rate
Sample Units Sample size Questionnaires Response Rate %
Dispensed Received
DADUs 4 4 4 100
Farmers 378 378 360 95
Buyers 16 16 12 75
Processors 12 12 9 75
Total 410 410 385 94
Source: Field Survey June, 2009
39
3.9 Summary
A research methodology as a guide for understanding how a particular research was carried out,
in this piece of work, has been simplified such that whosoever followed it would get the same or
similar results. The data gathered and the units involved allowed the use of primary level
analysis. Data was analysed straight forward based on variables in the questionnaire without any
form of cross tabulation among the variables. Tables, charts and percentages were thus the main
analytical tools employed for interpretation of data. In spite of the challenges encountered, the
necessary efforts were made to ensure that the outcome of the research is the true reflection of
the fact on the ground. It is therefore hoped that, the processes elaborated in this chapter can be
followed to replicate the research. The outcome and results of the study are presented in the next
chapter.

40
CHAPTER FOUR
ANALYSIS AND PRESENTATION OF DATA
4.1 Introduction
In this chapter both primary and secondary data collected from the research units are analysed
and presented. In addition, the background information, demographic as well as economic
characteristics of the study areas are presented in this chapter. This is followed by the discussion
of the performance of the cashew industry in the study areas with respect to local economic
development. The chapter ends with a summary of the issues discussed.
4.2 Background of Study Districts in Regional Context
The region has a „young‟ population characterised by a high proportion (43.1 per cent) of
persons under 15 years and a low percentage (4.5 per cent) of persons at age 64 and older. The
region‟s proportion for the under 15 years (43.1 per cent) is higher than 41.3 per cent for the
entire country. The distribution of the economically active population in the study districts like
that of the region is much concentrated in primary industry and the self-employed with no
employees and private informal sector workers dominating the employment landscape, (Ghana
Statistical Service, 2005 ).
4.2.1 Location and Size
The Brong Ahafo Region, formerly part of the Ashanti Region, was created in April 1959 with
the capital at Sunyani. With a territorial size of 39,557 square kilometers, it is the second largest
region in the country (16.6 per cent) in terms of land area. It shares boundaries with the Northern
Region to the north, the Volta and Eastern Regions to the south-east, Ashanti and Western
Regions to the south, and Cote d‟Ivoire to the west, (Ghana Statistical Service, 2005 ).
Kintampo, the central point of the landmass of Ghana is located between latitudes 8º 45‟N and 7º
45‟N and longitudes 1º 20‟W and 2° 1‟E. It shares boundaries with central Gonja district to the
north, Bole district to the west; east Gonja district to the north-east. It is bounded to the south by
Techiman Municipality and to the south- east by the Pru district.
41
Wenchi District lies within latitudes 7º 30‟N and8º 05‟N and longitudes 2º 15‟W and 1º 55‟E. In
terms of land area, it covers 3,494 square kilometers. It shares boundaries with the Techiman
district to the west, Kintampo district to the northwest, Tain district to the east and Sunyani
Municipality to the south. Tain district was carved out of Wenchi district and inaugurated on the
19th August 2004. It shares common boundaries to the west with Jaman-north district, to the east
with Wenchi municipal, to the south with Sunyani-west district, Berekum municipal to the south-
west, and La Cote d‟Ivoire to the north-west, (Wenchi District Data base, 2004). Jaman north
district is located between latitude 7º 40‟N and 8º 27‟N and longitude 2º 30‟W and 2º 60‟W. The
district is located to the western part of the region and to the north western fringes of the
neighbouring Cote d‟Ivoiré. It shares local boundaries with Tain district to the north through to
the eastern part of the district, Jaman south district to the south west and Berekum municipal to
the south east as shown on the Map, appendix 5 (Jaman North District Data base, 2004).
4.2.2 Vegetation and Climate
There are two main vegetation types, the moist semi-deciduous forest, mostly in the southern and
south-eastern parts of Brong Ahafo and the guinea savannah woodland, which is predominant in
the northern and north-eastern parts of the region. The study districts have guinea savanna
woodland vegetation type except Wenchi which has moist semi-deciduous forest. Like the region
the study districts have a tropical climate, with high temperatures averaging 23.9º C (75oF) and a
double maxima rainfall pattern. The rainfall in the region ranges from an average of 1000 mm to
1400 mm (CDP, 2008). Cashew plantations are found in the Jaman, Tain and Atebubu districts
as well as Wenchi, Kintampo, Techiman and Asunafo Municipalities of Brong ahafo region. To
add value to cashew to obtain more foreign exchange, raw cashew nuts are roasted for food
whilst some of the apples are processed into brandy in the Asunafo north district (CDP, 2008).
The study area has comparative advantage and the potential for the production of cashew in the
region due to the tropical climate with high temperatures and a double maxima rainfall pattern.
The vegetation and climate of the study area are condusive for the cashew crop according to
ADF, (2000). The vegetation and the climate thus serve as strength for cashew production.

42
4.2.3 Population
The Brong Ahafo region has a population of about 1,815,408, accounting for 9.6 per cent of the
country‟s total population. The inter-censal growth rate of 2.5 per cent between 1984 -2000 is
lower than the national rate of 2.7 per cent (Ghana Statistical Service, 2005). The population of
Jaman district is 78,192 with a growth rate of about 2.9 per cent, (Jaman North District Database,
2004). The Kintampo district has an estimated population of 96,358 with a growth rate of 2.6
per cent. The district has a population density of 18.86 persons per square kilometer, (Kintampo
District Database, 2004). The Tain district has a population size of 85,216 as at 2004 with a
growth rate of 3.3 per cent. The district‟s population density is 22.0 persons per square
kilometer, which is less than the regional population density of 45.9 persons per square kilometer
and the national figure of 49.3 persons/km2(Tain District Database, 2004). The population of
Wenchi district is 68,417 with a growth rate of about 3.3 per cent, (Wenchi District Data base,
2004).
4.2.4 Age and Sex Structure
A large proportion (43.1 per cent) of the region‟s population is under 15 years, with a small
proportion (4.5 per cent) older than 64 years. The proportion for the under 15 years for the region
is higher than that for the total country (41.3 per cent). Such structure of the population implies a
high proportion of dependent population. The age dependency ratios show the relative
predominance of persons in dependent ages (youth under 15 years and persons 65 years and
older) and those in productive ages (15 to 64 years). The dependency ratios for the region
reduced from 100.8 in 1984 to 90.5 in 2000. Jaman district has about 91.5, slightly above that of
the region. Wenchi on the other hand recorded 85.7, whilst in Kintampo district; an analysis
revealed that only 66.7 per cent of the labour force is working whilst the rest 27 per cent is in
school or under training or not working and about 6.3 per cent unemployed (Ghana Statistical
Service, 2005).
However, the number of entrants into the work force in the near future may increase. So if steps
are taken to attract and retain the youth in cashew production, it will go a long way to boost the
cashew industry, (Ghana Statistical Service, 2005).
43
The Kintampo district has a female population of 49,137 (representing 50.9 per cent) and 47,401
Male, (representing 49.1 per cent). The Tain district has 49.5 per cent male and 50.5 per cent
females. About 38.5 per cent of the total population is under 15 years. The economically active
population (15-64 years) accounts for 53.75 per cent while 7.75 per cent of the population is 65
years and above. This shows an average district dependency ratio of 1: 0.9 (100:90) which is
less than the regional dependency ratio of 100:90.5 but higher than the national figure of
100:87.1, (Tain District Database, 2004). The male and female populations of the Jaman district
are 37,904 (48.8 per cent) and 40,288 (51.52 per cent) respectively. The economically active
population of age 15-64 years is 64.0 per cent.
In Wenchi, about 7.24 per cent of the population is under 5 years, 35.45 per cent between the
ages of 5 and18 years with 50.12 per cent between 18 and 59 years. Only 6.69 per cent of the
population is above 60 years. The district‟s economically active population is 50.12 per cent,
far greater than both the national (24.4 per cent) and regional (23.9 per cent) levels. The 49.36
per cent males is a reduction from 51.5 per cent in 1984, and a rise in females from 48.5 to 50.64
per cent. This may be explained by higher male migration or high male mortality in the district.
The sex ratio in the district is 1:1.03. The ratio was 1:06 in 1984 showing the level of decline in
the male population.
4.2.5 Employment Status
It is observed that the private informal sector provides employment to about four out of every
five members of the workforce in the region. Sene district has the highest (90.9 per cent) with
Sunyani having the lowest (73.3 per cent). The employment status of the study districts is no
different; the private informal sector employs 84.5, 86.5 and 82.5 per cent of the working force
in Jaman, Wenchi, and Kintampo districts respectively (Ghana Statistical Service, 2005).
4.2.6 Industry
Changes in structural composition of economically active population often reflects the course of
social and economic development; more than two thirds (68.6 per cent) of the workforce in all
districts in the region are in Agriculture, Hunting, and Forestry, except Sunyani (the most
urbanised) (48.0 per cent) (Ghana Statistical Service, 2005). This is an indication that the study

44
areas are agrarian economies and that if cashew industry is well developed it will help increase
the rate of employment in the districts.
4.2.7 Occupation
Agriculture and related work is the major occupation in all districts, accounting for 66.4 per cent
of the region‟s economically active population. It is the main occupation for about two-thirds of
the economically active group in the study districts. In the three most urbanised districts, Sunyani
(45.9 per cent), Berekum (50.9 per cent) and Techiman (57.1 per cent), agriculture and related
work account for between 45.0-60.0 per cent. The proportion of self-employed without
employees in the region is 74.6 per cent, mainly engaged in small-scale economic activities
operated by individuals while others are also peasant farmers engaged in subsistence agriculture.
The percentage of employees within the economically active population is 9.7 relatively lower
than the national proportion of 15.2 per cent (Ghana Statistical Service, 2005).
4.2.8 Transportation System
The principal mode of transportation in the region is by road. The region‟s road network consists
of highways, urban roads and feeder roads. The villages and small towns are connected to each
other by feeder roads, while small towns, large towns are connected by highways. The
Department of Urban Roads provides the road network within the urban centres. Sunyani, the
administrative capital, is the focal point of most of the roads in the region. The region at present
has 1,894.9 kilometres of major roads, which represent 13.1 per cent of the total network of
major roads in the country, thus making it the region with the second widest network of major
roads after Northern Region (Ghana Statistical Service, 2005).
About a third (33.1 per cent) of the region‟s major roads are paved, this forms 11.1 per cent of
the national paved or asphalted roads. These include the Kumasi-Dormaa Ahenkro road, the
Yamfo road, Sunyani-Techiman road, Techiman-Nkoranza road, Techiman-Wenchi road and
Kumasi-Yeji road. In addition to the major roads, the region has the longest network of feeder
roads (3,463.0 kilometres). In terms of total road network, therefore, the region has the longest
road network in the country, measuring 5,357.9 kilometres, followed by the Northern Region,

45
with 5,170.8 kilometres, the Ashanti Region with 4,782.2 kilometres and Western Region with
4,452.4 kilometres (Ghana Statistical Service, 2005).
Unfortunately, the Researcher observed that the road network in certain parts of the study
districts is not good. For instance, in the Jaman North district there is not even a metre of tarred
road, and most of the graveled roads linking the production centres are in a deplorable state. This
makes conveyance of produce from the production centres difficult. Some farmers, especially in
Kojee, Dormoli and Dorbor in the Tain district find it difficult to convey their produce to the
buying centres due to bad road network. In spite of the ready market for cashew in the study
districts, bad road network can be a disincentive to farmers.
4.3 The Status of Cashew Industry in Brong Ahafo Region.
Cashew cultivation in Brong Ahafo region is largely a small holder activity. Majority of the
farmers have an average farm size of between 0.8 – 2.5ha. An estimated 5,564.6 hectares of
cashew is cultivated in the region. About 12,000 small holder farmers are engaged in cashew
cultivation in the study area (Ghana Cashew Association, Brong Ahafo chapter, 2008). The
major producing districts in the region are Jaman, Tain, Wenchi, Kintampo, Nkoranza, Techiman
and Atebubu.
In recent years, the interest for the crop has grown nationwide and this is evidenced by the
increase in the national demand for cashew seed nuts from about 1 metric tonne in 1994 to about
10 metric tonnes in 2007 (CDP 2008). About 25 per cent of the cashew nuts in the area is
processed by the local factories at Nsawkaw, Kabile, Awisa and Sampa. About 75 per cent of
cashew nuts is exported and the prices on the world market keep on changing as national figures
are shown in Table 4.1.
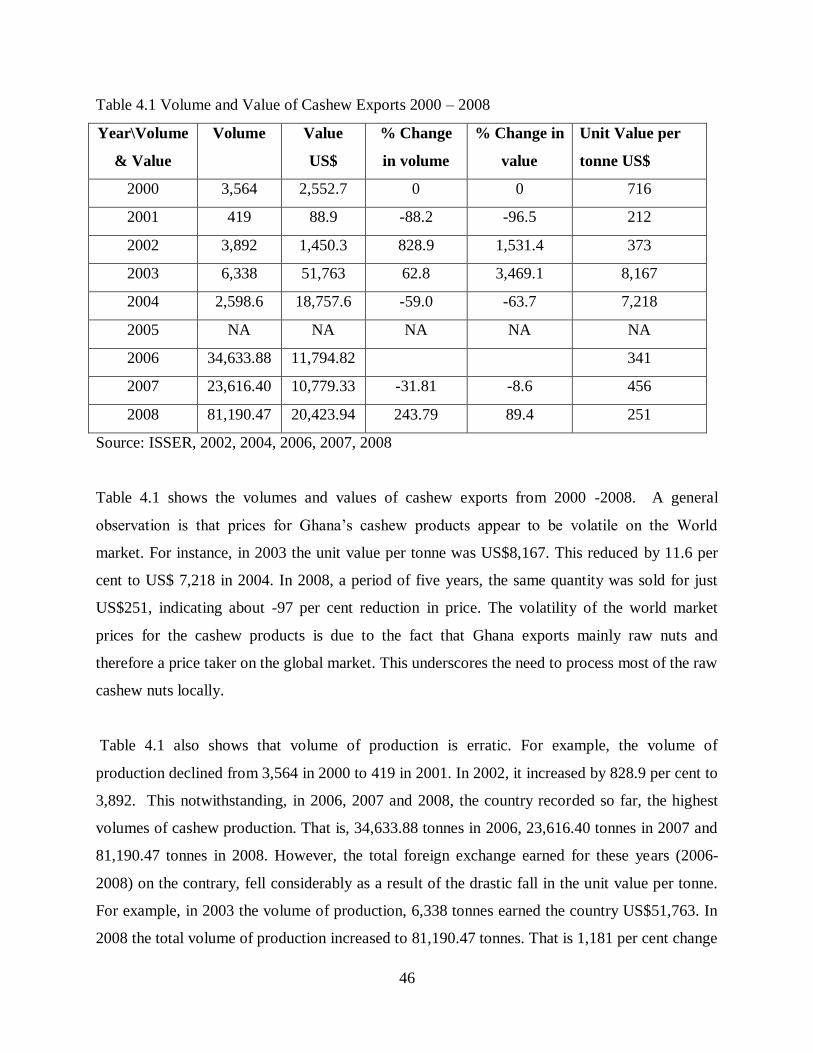
46
Table 4.1 Volume and Value of Cashew Exports 2000 – 2008
Year\Volume
& Value
Volume Value
US$
% Change
in volume
% Change in
value
Unit Value per
tonne US$
2000 3,564 2,552.7 0 0 716
2001 419 88.9 -88.2 -96.5 212
2002 3,892 1,450.3 828.9 1,531.4 373
2003 6,338 51,763 62.8 3,469.1 8,167
2004 2,598.6 18,757.6 -59.0 -63.7 7,218
2005 NA NA NA NA NA
2006 34,633.88 11,794.82 341
2007 23,616.40 10,779.33 -31.81 -8.6 456
2008 81,190.47 20,423.94 243.79 89.4 251
Source: ISSER, 2002, 2004, 2006, 2007, 2008
Table 4.1 shows the volumes and values of cashew exports from 2000 -2008. A general
observation is that prices for Ghana‟s cashew products appear to be volatile on the World
market. For instance, in 2003 the unit value per tonne was US$8,167. This reduced by 11.6 per
cent to US$ 7,218 in 2004. In 2008, a period of five years, the same quantity was sold for just
US$251, indicating about -97 per cent reduction in price. The volatility of the world market
prices for the cashew products is due to the fact that Ghana exports mainly raw nuts and
therefore a price taker on the global market. This underscores the need to process most of the raw
cashew nuts locally.
Table 4.1 also shows that volume of production is erratic. For example, the volume of
production declined from 3,564 in 2000 to 419 in 2001. In 2002, it increased by 828.9 per cent to
3,892. This notwithstanding, in 2006, 2007 and 2008, the country recorded so far, the highest
volumes of cashew production. That is, 34,633.88 tonnes in 2006, 23,616.40 tonnes in 2007 and
81,190.47 tonnes in 2008. However, the total foreign exchange earned for these years (2006-
2008) on the contrary, fell considerably as a result of the drastic fall in the unit value per tonne.
For example, in 2003 the volume of production, 6,338 tonnes earned the country US$51,763. In
2008 the total volume of production increased to 81,190.47 tonnes. That is 1,181 per cent change
47
in volume of production over the 2003 figure, but this could only earn the country
US$20,423.94, indicating -60.5 per cent change in value for the 2008 exports.
Due to cashew price volatility on the world market, the planning agencies of government would
have low level of confidence to forecast or estimate the foreign exchange earnings from the
cashew industry. The implication is that the cashew industry would not be reckoned to be
important or reliable when government policies are being planned.
4.3.1 Land Acquisition
Farm land in Brong Ahafo is communally owned. Communal land is normally controlled by the
lineage or clan based land owning –groups and allocated to individuals or households on a
usufructuary basis. The national land policy published in June 1999 provides framework for
free access to land by all Ghanaians provided that a) land is available for disposal in any part of
the country where a male or female operator seeks to have it; b)the individual agrees with land
owners to adhere to the covenants and other customary practices governing the disposal of the
land; c) the individual undertakes to put the land to a use which conforms to land use plans for
the area and to principles of sound land use and management. Access to land is not restricted to
any of the sexes except that the males are traditionally more recognised as tillers of the land
than their female counterparts.
From Table 4.2, about 93.1 per cent admitted that they farm on their own or family (communal)
land. A total of 4.8 per cent of the respondents hired their farm land but 1.9 per cent claimed they
bought their farm land outright. On the average, 88 farmers cultivate on communal land, 5 hire
land for cashew production whilst 2 farmers farm on purchased land. Farm land in the study
areas are hired either by the “Abusa system” or “Rent payment”. With the Abusa system, the
Farmers and the land owners enter into agreement to share the seasonal yields by the ratio 2:1
respectively. On the other hand, the farmers under the rent payment agreement are made to pay
lump sums covering periods not less than five years, and depending on the agreement, the
farmers are required to make such advance payments at the expiration of the rent paid.

48
Table 4.2 Land Ownership
District Total Respondents Self/Family
Owned
Hired
Outright
Purchased
N % N % N %
Jaman 95 89 94.7 4 4.1 1 1.5
Tain 93 86 92.5 4 4.4 3 3.1
Wenchi 93 87 93.5 5 5.0 1 1.2
Kintampo 97 90 92.7 5 5.6 2 1.8
Total 378 352 93 18 5 7 2
Average 95 88 5 2
Source: Field Survey June, 2009
4.3.2 Incomes Distribution among Cashew Farmers
The soil type in certain parts of the study areas is such that farmers need to spend so much on
chemicals such as fertilizers before they are able to get better yields. However, according to the
people, cashew is tolerant of conditions otherwise considered marginal for agriculture. The
study identified that 28.8 per cent of the farmers interviewed could not state their last earnings
perhaps because they did not want to disclose it or failed to keep records for the year and 3.1 per
cent of them had not started harvesting at the time of the study. The remaining 68.1 per cent
(262) gave their last earnings which ranged between GH¢100 and GH¢8,000 as shown in Table
4.3.
Table 4.3 Income Distribution
Income
GH¢
No. of
Farmers
(Freq.)
Aggregate
Income
% No. of
Farmers
% Cumulative
No. Farmers
% aggregate
Income
% Cumulative
Aggregate
Income
100-1000 99 31,420 38 38 9 9
1100-2000 108 127,300 41 79 37 46
2100-3000 27 59,400 10 89 17.2 63.2
3100-4000 10 34,700 4 93 10 73.2
4100-5000 13 60,100 5 98 17.4 90.6

49
5100-6000 2 11,200 0.8 98.8 3.2 93.8
6100-7000 2 13,500 0.8 99.6 4 97.8
7100-8000 1 7,650 0.4 100 2.2 100
Total 262 345,270
Source: Author‟s Construct –April, 2009
Mean Income (X) = GH¢1,591 Standard deviation (S) = GH¢2,015
From Table 4.3, the mean (average) income earned by the farmers was GH¢ 1,592. It also
revealed a standard deviation of GH¢2,015. Looking at the income distribution by using
quartiles, the third quartile (196.5th farmer) has a corresponding income of GH¢ 1,346.20 which
is less than the average income of GH¢ 1,592. If a farmer in the third quartile earns less than the
average income it implies that income levels are generally low because a greater number of the
farmers (75 per cent) are not able to earn the average income at the end of their farming season.
Table 4.3 also reveals that there is a wide income disparity among the farmers considering the
range of income of GH¢ 7,900 given a mean income of 1,592 and a Standard deviation of GH¢
2,015. The Table further reveals 19 per cent of the farmers earn between GH¢ 2,100 – 5,000.
Only Five (5) farmers representing 1.9 per cent earn between GH¢5, 100 –GH¢ 8,000. This
means there is income disparity among the farmers as shown in Figure 4.1.

50
Figure 4.1 Lorenz Curve showing income disparities among Cashew Farmers
CUM. % AGG. INCOME
100 B
LINE OF EQUAL DISTRIBUTION→
80
60 C
40
← INCOME CURVE
20
A D
0 20 40 60 80 100
CUM % N0. OF FARMERS
Author‟s Construct –April, 2011
The ratio of the shaded area of triangle ABC in the figure 4.1 to the area of triangle ABD (Gini
Concentration Ratio) measures income inequality. That is, ABC = 24 = 0.48
ABD 50
From Figure 4.1 the total income of 50 per cent of the farmers forms only 20 per cent of the
aggregate income of GH¢345,270. The total income of 80 per cent of the farmers is only about
47 per cent, below 50% of the aggregate income. This indicates an unequal distribution of
income among farmers. The implication is that even though the aggregate income is large, only a
few farmers earn the greater part.
4.3.3 Gender Distribution in Cashew Industry
The study revealed no restriction on the basis of sex in the cashew industry. However, it was
identified that the study districts recognised the males as more healthier and capable of tilling the
land than their female counterparts. This is shown in Table 4.4 where the male –female
percentage ratio in cashew production is 87: 13.

51
Table 4.4 Gender Distribution in Cashew Production
Study Areas Farmers
Male % Female % Total %
Jaman 81 85 14 15 95 100
Tain 84 90 9 10 93 100
Wenchi 79 85 14 15 93 100
Kintampo 83 86 14 14 97 100
Total 327 87 51 13 378 100
Source: Field survey, June 2009
Table 4.4 indicates that cashew production is dominated by male in the study area. The
processing section was however, found to be dominated by the females. The women perform the
majority of quality checks including grading, picking, peeling and sorting. Table 4.5 depicts that
92.1 per cent of the people in the processing factories were identified to be females whilst only
7.9 per cent males were recorded. On average, 50 females as against 4 males were engaged in the
cashew nut processing in the study areas.
Table 4.5 Gender Distribution in Cashew Processing
Factory Employees
Male % Female % Total %
Nsawkaw Cashew Factory 3 6 50 94 53 24.5
Awisa Cashew Factory 5 8 57 92 62 28.7
Kabile Cashew Factory 4 9 39 91 43 19.9
Sampa Cashew Factory 5 9 53 91 58 27
Total 17 8 199 92 216 100
Source: Field survey, June 2009

52
Given the circumstance, if cashew processing factories are supported to expand, more people
will be employed, and this could help to reduce the poverty among the people, especially
Women in the study areas.
4.3.4 Access to credit facilities
The study established that Agriculture Development Bank, as part of the Cashew Development
Project, offered credit facilities to farmers in the area. It was revealed that access to these credit
facilities started in 2004 and as at the time of this study, 99 per cent of the sampled farmers had
accessed the facilities. This is depicted in Table 4.6, where a total amount of GH¢ 2,417,013.00
was disbursed to the farmers between 2004 -2007. About 81 per cent had been recovered as at
June, 2009. The impact of these facilities can be linked to the increase in the volume of
production from 2006 to 2008 as shown in Table 4.1.
Table 4.6: Access to CDP – ADB Credit Facilities, 2004 -2007.
Yr No. of Beneficiaries Total Total
Amount
Disbursed
GH¢
Total
Amount
Recovered
GH¢
% Loan
Recover
ed
Jaman Tain Wench
i
Kintampo
2004 NA 263 411 510 1,184 483,050.00 446,356.73 87.1
2005 342 86 265 529 1,222 660,843.00 493,104.61 68.8
2006 NA 211 430 390 1,031 588,570.00 413,046.07 62.8
2007 911 57 147 28 1,143 684,550.00 607,656.24 90.0
Total 1,253 617 1,253 1,457 4,580 2,417,013.
00
1,960,163.
65
77.2 Aver
age
626.5 154.25 313.25 364.25 1145 604,253.25 490,040.91
Source: DADUs, June 2009
4.3.5 Access to Market Opportunities
There is ready market for the produce in the study areas. According to the farmers there are more
than eight purchasing companies; NASAKA Agro Processing Ltd. Olam (Gh) Ltd., Ghana Nuts

53
Ltd among others, that operate largely through commission agents and local purchasing agents.
The quality of nuts at farm gates is a key issue that largely influences the prices. Proper post-
production handling by farmers especially drying, packaging material used and the method of
storage have a direct influence on the nut‟s quality. The competition on the market would have
been good for the farmers because it would cause demand to exceed supply there by forcing the
price up. Unfortunately, it is not so because the tiny, local (low priced) variety is what is mostly
produced in the study districts.
To enhance the efficiency of cashew marketing in Ghana, Cashew Processors and Exporters
Association of Ghana (CAPEAG) has been formed and registered. Several producer associations
also exist countrywide. Under the CDP, Seven (7) district producer associations have been
formed and registered, in close collaboration with Department of Co-operatives. The producer
associations and processors/exporters associations are currently being trained on quality
standards developed by the industry through appropriation of grades and standards, spearheaded
by United States Agency for International Development (USAID) Trade and Investment
Programme for Competitive Export Economy (TIPCEE) project with support from the MOFA-
CDP and other stakeholders, (CDP 2008).The presence of many purchasing companies in the
area brings about competition on the market. In a free market economy where demand and
supply operate to determine prices, competition for cashew products, all things being equal,
pushes the price up and this serves as a motivation for farmers to increase production.
4.3.6 Raw Cashew Nuts Processing
The four major raw cashew nut processors in the study areas are all under the Nasaka Group of
Processors. Their total installed capacity as shown in Table 4.7 is 236.18 metric tonnes.
However, about 50 per cent of the capacity is utilised. This is because they do not have enough
working capital to purchase raw nuts and stock for work all year round. Meanwhile local
processing of cashew nuts has implication for LED. For example, the study revealed that
processing of raw nuts into kernels does not only add value to the product but also provide
employment opportunities for the rural folk and the vulnerable groups such as the women. The
incomes the employees earn definitely have ripple effects on the local economic activities. This
is buttressed in Table 4.5 where the 4 processing factories in the study districts provide
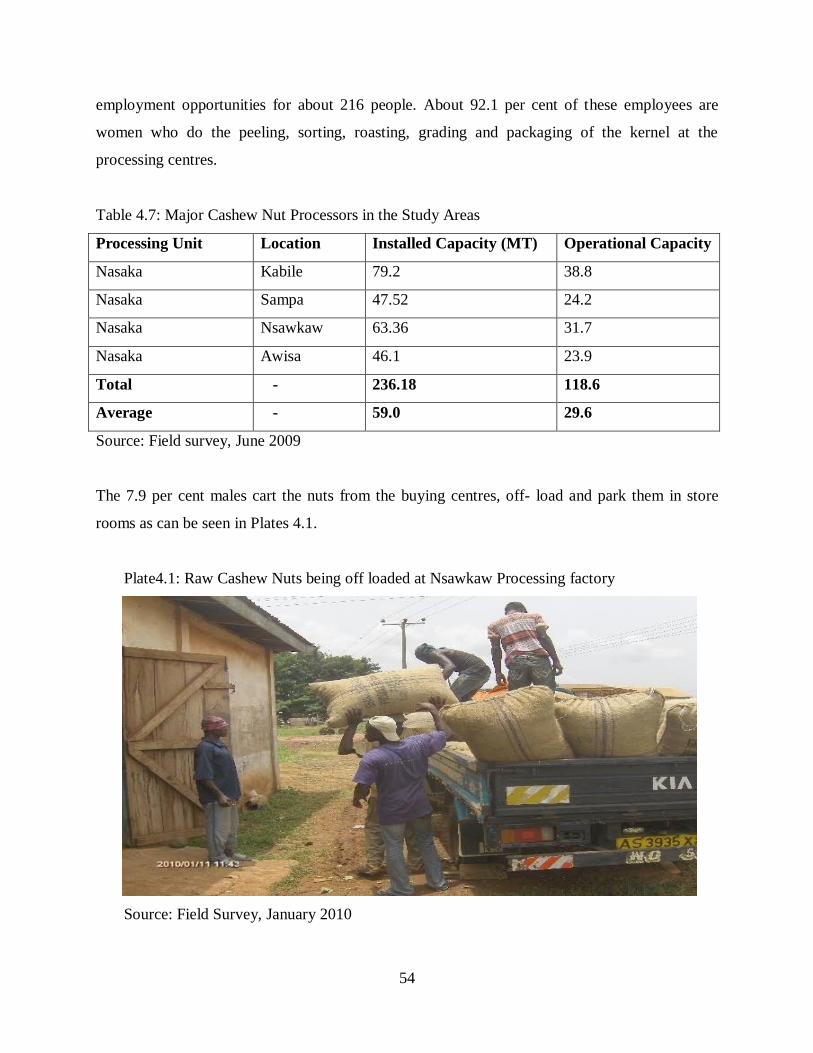
54
employment opportunities for about 216 people. About 92.1 per cent of these employees are
women who do the peeling, sorting, roasting, grading and packaging of the kernel at the
processing centres.
Table 4.7: Major Cashew Nut Processors in the Study Areas
Processing Unit Location Installed Capacity (MT) Operational Capacity
Nasaka Kabile 79.2 38.8
Nasaka Sampa 47.52 24.2
Nasaka Nsawkaw 63.36 31.7
Nasaka Awisa 46.1 23.9
Total - 236.18 118.6
Average - 59.0 29.6
Source: Field survey, June 2009
The 7.9 per cent males cart the nuts from the buying centres, off- load and park them in store
rooms as can be seen in Plates 4.1.
Plate4.1: Raw Cashew Nuts being off loaded at Nsawkaw Processing factory
Source: Field Survey, January 2010

55
4.3.7 Environmental Situation
The study districts suffer harsh harmattan seasons, which lead to many bush-fires. The 374
respondents cited bush fires as one of the challenges to their work. Surprisingly, the farmers
themselves admitted that the bush- fires are normally caused by some of their colleague farmers
clearing their farm lands as well as hunters searching for game and charcoal burners. The tree
crop cultivation such as cashew is in the right direction as it will help to replenish the depleted
land. The cashew production is also helping to curb the ritual bush fires in the area since the
farmers themselves have to control the bush fires in order to protect their cashew farms. The
environmental sustainability is vital for economic growth of the Brong Ahafo Region where
about 70 per cent of the population is employed in agriculture and its related activities.
According to the World Bank /IMF report in 2008, environmental sustainability is essential for
continued economic growth and poverty reduction.
4.3.7.1 Environmental Impacts of Cashew Production
A total of 25.2 per cent of the respondents for the study, mainly farmers said they did not know
the effects of cashew production on the environment, 55.1 per cent said cashew is
environmentally friendly. To them the cashew tree serves as a cover crop that protects the soil
against wind erosion in the north as well as water, gully and other types of soil erosion in the
southern part of the country. On the other hand, 19.7 per cent claimed that the smoke from the
factories causes air pollution. Again they claimed that cashew does not do well when planted
amidst trees hence its cultivation leads to destruction of trees. For these reasons they claimed
that cashew production is environmentally unfriendly. The DADUs see the environmental impact
of cashew as positive because of its ability to, at least, check soil erosion. Figure 4.2 illustrates
the views of the 400 respondents on the environmental impacts of cashew production.
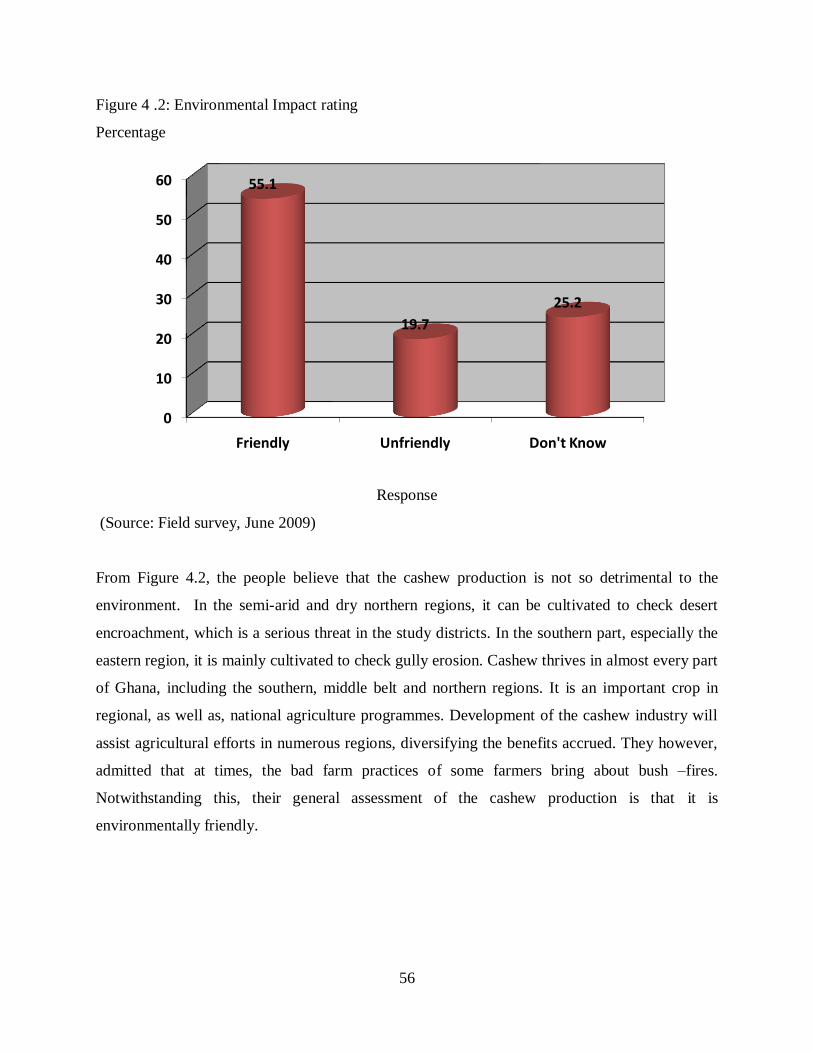
56
Figure 4 .2: Environmental Impact rating
Percentage
Response
(Source: Field survey, June 2009)
From Figure 4.2, the people believe that the cashew production is not so detrimental to the
environment. In the semi-arid and dry northern regions, it can be cultivated to check desert
encroachment, which is a serious threat in the study districts. In the southern part, especially the
eastern region, it is mainly cultivated to check gully erosion. Cashew thrives in almost every part
of Ghana, including the southern, middle belt and northern regions. It is an important crop in
regional, as well as, national agriculture programmes. Development of the cashew industry will
assist agricultural efforts in numerous regions, diversifying the benefits accrued. They however,
admitted that at times, the bad farm practices of some farmers bring about bush –fires.
Notwithstanding this, their general assessment of the cashew production is that it is
environmentally friendly.
0
10
20
30
40
50
60
Friendly Unfriendly Don't Know
55.1
19.7
25.2
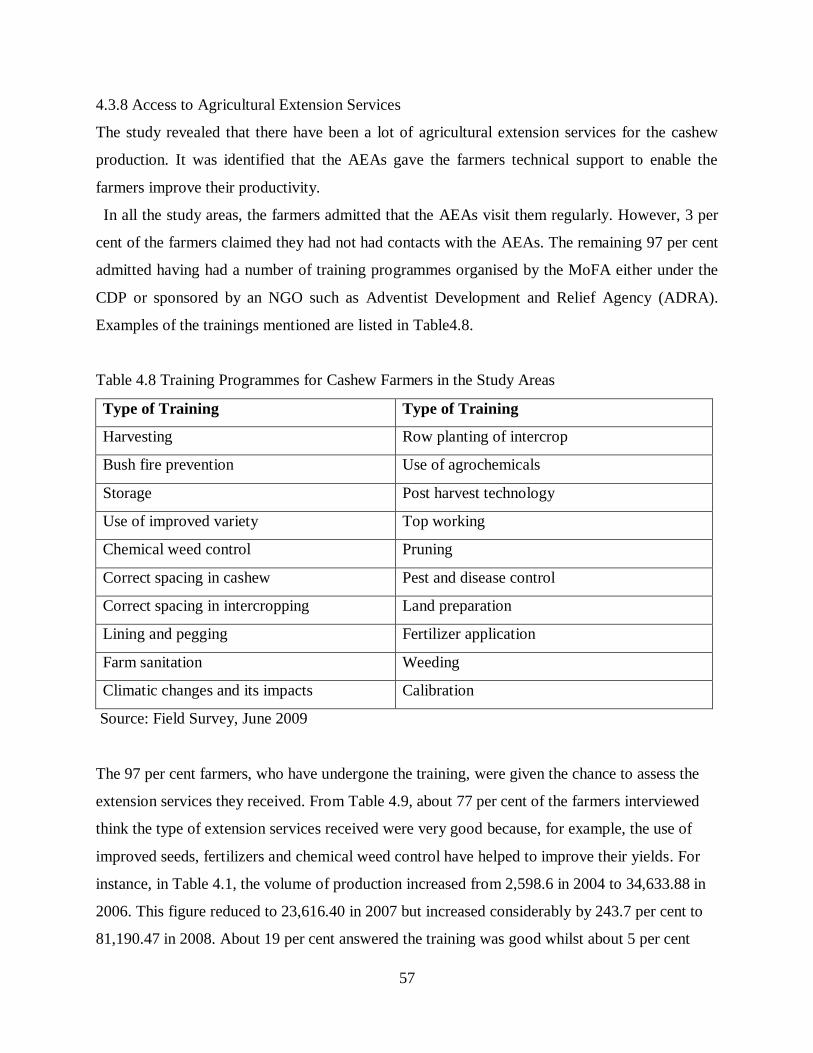
57
4.3.8 Access to Agricultural Extension Services
The study revealed that there have been a lot of agricultural extension services for the cashew
production. It was identified that the AEAs gave the farmers technical support to enable the
farmers improve their productivity.
In all the study areas, the farmers admitted that the AEAs visit them regularly. However, 3 per
cent of the farmers claimed they had not had contacts with the AEAs. The remaining 97 per cent
admitted having had a number of training programmes organised by the MoFA either under the
CDP or sponsored by an NGO such as Adventist Development and Relief Agency (ADRA).
Examples of the trainings mentioned are listed in Table4.8.
Table 4.8 Training Programmes for Cashew Farmers in the Study Areas
Type of Training Type of Training
Harvesting Row planting of intercrop
Bush fire prevention Use of agrochemicals
Storage Post harvest technology
Use of improved variety Top working
Chemical weed control Pruning
Correct spacing in cashew Pest and disease control
Correct spacing in intercropping Land preparation
Lining and pegging Fertilizer application
Farm sanitation Weeding
Climatic changes and its impacts Calibration
Source: Field Survey, June 2009
The 97 per cent farmers, who have undergone the training, were given the chance to assess the
extension services they received. From Table 4.9, about 77 per cent of the farmers interviewed
think the type of extension services received were very good because, for example, the use of
improved seeds, fertilizers and chemical weed control have helped to improve their yields. For
instance, in Table 4.1, the volume of production increased from 2,598.6 in 2004 to 34,633.88 in
2006. This figure reduced to 23,616.40 in 2007 but increased considerably by 243.7 per cent to
81,190.47 in 2008. About 19 per cent answered the training was good whilst about 5 per cent

58
thought it was fair. In general, the farmers‟ assessment indicated that the training by the AEAs
had positive impacts on their productivities.
Table 4.9 Farmers‟ assessment of Agriculture Extension Services Received
Assessment of
Agriculture
Extension Services
District Responses
District
Jaman Tain Wenchi Kintampo Average %
No % No % No % No %
Excellent 26 28.6 26 28.3 27 29 23 25.6 27.9
Very Good 44 48.4 46 50 47 50.5 42 46.7 48.9
Good 18 20 16 17.4 14 15.1 20 22.2 18.6
Fair 3 3 4 4.3 5 5.4 5 5.5 4.6
Poor - - - - - - - - -
Total 91 100 92 100 93 100 90 100 100
Source: Field Survey, June 2009
4.3.9 Constraints of Cashew Production in Ghana
The study revealed that the cashew industry in the study areas face challenges regarding the
variety of seeds produced, post harvest handling as well as processing of the cashew nuts;
a/ Production of low-priced products
From interviews with AEAs, most of the cashew nuts produced in the study areas are the local
(tiny) type which do not attract higher price on the market. According to the AEAs interviewed,
a farmer has to pick about 12,000 local nuts to get one bag (80kg) whilst only 4,000 nuts of the
hybrid are needed to fill the same sack. The implication is that the local type is more time,
energy and resource consuming, compared to the hybrid. To quote an Agriculture Extension
Officer “…my brother this is the fact but how to get the farmers to accept it and be prepared to
replace the local type with the hybrid is the hell, however, we are trying our best and with time
most of them will understand what we are teaching them”

59
b/ Post harvest handling
The survey revealed that when the nut is dried too much under the sun, it reduces its economic
value. However, if it is not dried at all, it tends to rot. It therefore beholds on the farmers to pay
heed to the pieces of technical advice received from AEAs. Two respondents in the Tain district
claimed they ignored the post -harvest handling techniques by the AEAs in 2005 and a total of
seven bags (560kg) out of forty five bags (3,600kg) got rotten. However, in 2006 when they
heeded to the technical advice by the AEAs, only three bags (240kg) got rotten out of a total of
67 bags (5,360kg). The implication is that the farmers realised less income than they would have
earned in 2005 if they had heeded to the technical advice by the AEAs.
c/ Processing
Although few processors have successfully supplied the market all year round, they still need
help to strengthen their efforts and grow. The Major constraints include the cost of capital, more
importantly, the ability to purchase and store raw nuts to process throughout the year. According
to the processors, the cost of raw nuts constitutes about 85 per cent of production cost in the
study districts. There is therefore the need to develop cost containment techniques to keep
processors stocked with raw inputs to be able to stay in business all year round. For example,
India, the world‟s largest processor, purchases raw nuts throughout the year at favourable
financing rates to supplement their supply. Brazil also has a ban on the export of raw nuts and
rather imports when domestic supplies are short, (Chemonics International Inc. 2002). Additional
processing constraints include the cost of labour to peel the testa from the kernel and to upgrade
hygiene standards, as kernels produced are final food products and therefore require good
hygiene standards.
d/ Social and Economic Infrastructures
The Public Sector is responsible for certain social and economic infrastructures such as roads,
schools, hospitals and electricity in the economy. The study revealed that these social and
economic infrastructures were inadequate in the cashew producing areas. According to the
respondents the existing ones are in a deplorable state. The absence of these amenities makes it
difficult for the industry to thrive and this can serve as a push factor for the youth to migrate to
the cities.

60
4.3.10. The Prospects of Cashew Industry in the Study Area
In spite of the challenges of the cashew industry, there are potentials for the industry in the study
districts. Firstly, MoFA has offices in all the districts. District Agricultural Development Units
(DADUs) are established in the districts to be responsible for administrative, management and
implementation as well as supervision of all MoFA activities. The study identified that cashew
farmers in the study districts have access to agricultural extension services, hybrid or improved
seeds as well as training on good cultural practices. Secondly, the climatic and rainfall conditions
in the region are favourable for the cashew cultivation. The ideal rainfall regime for the crop is
between 750mm –1300mm meanwhile the rainfall regime in the region ranges from an average
of 1000 mm in the northern parts to 1400 mm in the southern parts (CDP, 2008). Thirdly, there is
ready market for the produce, especially on the world market. World excess demand is estimated
to be 430,000 metric tonnes of raw nuts, valued at US$270 Million which grows at a rate of 5-8
per cent per annum (Chemonics International Inc., 2002).
In the region, there are more than eight purchasing companies; in the late 1980s, CashPro
Limited, a private export company established buying centres in almost all the cashew producing
communities in the Brong Ahafo Region including the study areas and other major producing
areas. Recently, other companies such as Olam (Gh) Ltd., Ghana National Procurement Agency
(GNPA), Ghana Nuts Ltd, Bet Exports, Rals Commodities, 3F Ghana Ltd., Evans Global
Investments Ltd., NASAKA Agro Processing Ltd., Asia Commodities Co. Ltd., Grand Mark Co.
Ltd., Potrodom International PVT Ltd., Wilmaroel Ltd. and Isacon Co. Ltd. have joined the
cashew buying business with buying centres in almost all the major cashew producing areas
(ADF, 2000).
4.4 Cashew Industry and Local Economic Development
According to World Bank (2003), the creation of more productive jobs and entrepreneurial
opportunity is a key measure to help poor people realise their potentials, and poverty reduction
requires that entrepreneurs set up businesses at where poor people can work. The study revealed
that the cashew industry has impacted on the lives of the people in various ways. The study
identified that the cashew production and its related activities provide employment for over

61
8,300 people in the study areas. The employment with its ripple effects has implications for local
economic development and these are discussed below.
a/ Employment
Cashew production and the presence of cashew factories in the communities have provided
employment opportunities for many people in the communities. For example, apart from the
8,288 people directly employed in the industry, there was others employed indirectly such as
food venders at the factory sites and taxi drivers that convey people to and fro the factory sites.
b/ Infrastructural Development
Provision of Water: The study revealed that there were water facilities at the various
factory sites. According to the study, apart from the Awisa factory which only extended the
water facility to the factory site, the remaining three factories drilled the boreholes with their
own resources but it was revealed that the water facilities were open to the people in the vicinity
free of charge. The study identified that the people of Ahenfi, a suburb of Nsawkaw for example,
had stopped fetching water from the nearby river as a result of the borehole at the factory site.
The implication is that the people would be free from water born diseases.
Provision of Electricity: Again, the study revealed that apart from the Kabile factory, the
electricity facilities at the various factory sites were extended to the sites by the factories
without any contributions from the people in the vicinities.
Extension of Road
The road leading to the Awisa, Sampa and Nsawkaw cashew factories were initially constructed
by the factories at their own cost to enable their trucks convey the cashew nuts to the sites.
However, 8 per cent of the respondents identified that the presence of the factories in the
communities has brought about an influx of people in their communities. To them, this has been
the cause of the high cost of living especially; the pressure on the rooms has caused rent increase.
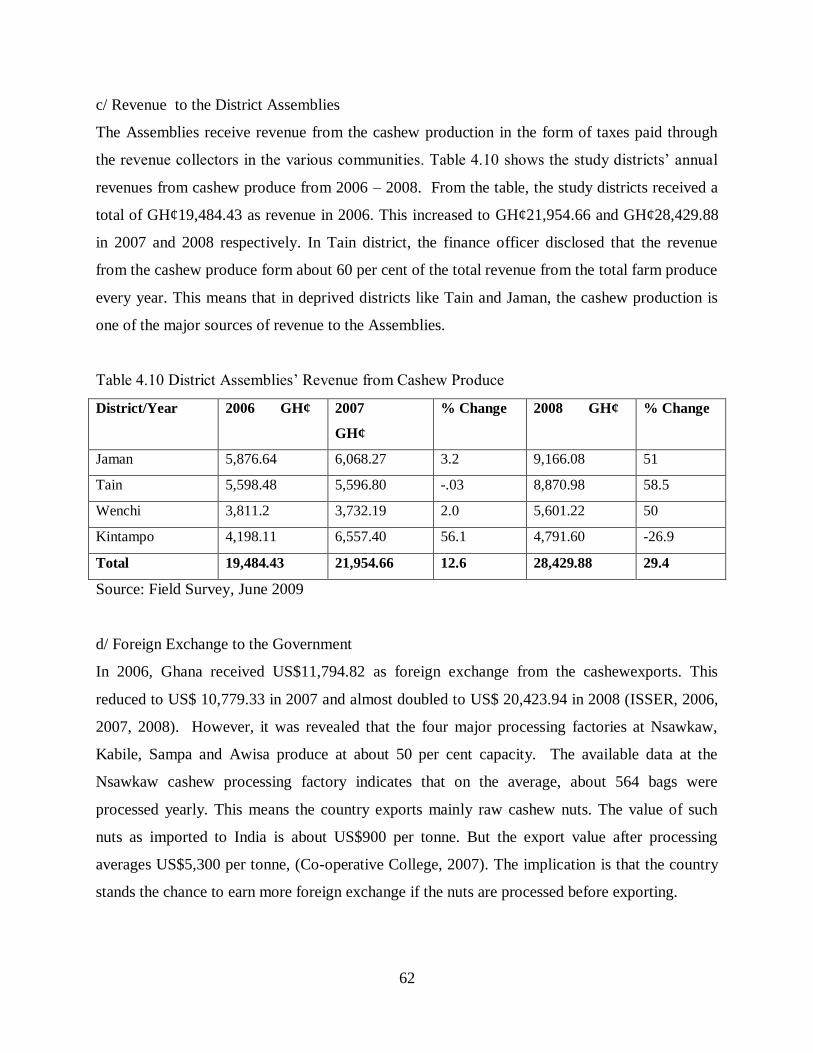
62
c/ Revenue to the District Assemblies
The Assemblies receive revenue from the cashew production in the form of taxes paid through
the revenue collectors in the various communities. Table 4.10 shows the study districts‟ annual
revenues from cashew produce from 2006 – 2008. From the table, the study districts received a
total of GH¢19,484.43 as revenue in 2006. This increased to GH¢21,954.66 and GH¢28,429.88
in 2007 and 2008 respectively. In Tain district, the finance officer disclosed that the revenue
from the cashew produce form about 60 per cent of the total revenue from the total farm produce
every year. This means that in deprived districts like Tain and Jaman, the cashew production is
one of the major sources of revenue to the Assemblies.
Table 4.10 District Assemblies‟ Revenue from Cashew Produce
District/Year 2006 GH¢ 2007
GH¢
% Change 2008 GH¢ % Change
Jaman 5,876.64 6,068.27 3.2 9,166.08 51
Tain 5,598.48 5,596.80 -.03 8,870.98 58.5
Wenchi 3,811.2 3,732.19 2.0 5,601.22 50
Kintampo 4,198.11 6,557.40 56.1 4,791.60 -26.9
Total 19,484.43 21,954.66 12.6 28,429.88 29.4
Source: Field Survey, June 2009
d/ Foreign Exchange to the Government
In 2006, Ghana received US$11,794.82 as foreign exchange from the cashewexports. This
reduced to US$ 10,779.33 in 2007 and almost doubled to US$ 20,423.94 in 2008 (ISSER, 2006,
2007, 2008). However, it was revealed that the four major processing factories at Nsawkaw,
Kabile, Sampa and Awisa produce at about 50 per cent capacity. The available data at the
Nsawkaw cashew processing factory indicates that on the average, about 564 bags were
processed yearly. This means the country exports mainly raw cashew nuts. The value of such
nuts as imported to India is about US$900 per tonne. But the export value after processing
averages US$5,300 per tonne, (Co-operative College, 2007). The implication is that the country
stands the chance to earn more foreign exchange if the nuts are processed before exporting.
63
4.5 Summary
The analyses of the performance of cashew production in relation to LED revealed that cashew
industry provides employment opportunity for over 8,000 people in the study area. A total of
216 employees; 7.9 per cent males and 92.1 females, were engaged in cashew processing. The
analyses in the chapter also depict that the people‟s impression about the environmental impacts
of cashew production is that it is not harmful even though 19.7 per cent of the respondents think
cashew cultivation leads to the destruction of large trees and as a result collapses the timber
industry. Again, the data presented shows that access to farm land is not a problem in the study
area. However, there is inadequate capital to expand the business; despite there is enough world
demand for the cashew produce. The key issues that emerged are presented in the next chapter.

64
CHAPTER FIVE
KEY FINDINGS, RECOMMENDATIONS AND CONCLUSION
5.1 Introduction
The chapter covers the key issues that emerged after analysing the data. It also covers
suggestions, policy and research recommendations as well as conclusion for the study.
5.2 Key Findings
The study revealed a number of key development issues. Some of these issues deserve special
attention in order to bring about local economic development. These issues are listed in the study
purposely to provide basic information for a pragmatic restructure of the cashew industry in the
country.
5.2.1: The Role of the Cashew Industry to LED
The study revealed that the main role of the cashew industry to LED in agrarian economies like
those of Jaman, Tain, Wenchi and Kintampo was to provide employment opportunities for the
people in farming, processing and marketing of cashew nuts. This role was identified to have
enhanced economic activities in the study areas. For instance, the study revealed that over 8,233
people earn incomes from the cashew production and its related activities. In 2008 for example,
the aggregate income for 262 farmers was GH¢345,270.00 as shown in Table 4.3.
The research established that the cashew industry contributes to the provision of certain socio –
economic infrastructures in the study area. For instance, the study revealed that water and
electricity were extended to certain parts of the communities as a result of the presence of the
cashew processing factories in these communities. The costs for extending these facilities to the
sites were borne by the factories.
5.2.2 Effects of Cashew Production on the Environment
The general impression about the environmental effects of cashew production was that cashew is
an environment-friendly crop.
65
a/ Protection against Erosion, Bushfires and Desertification: In the semi-arid and dry northern
regions, cashew is an economic crop cultivated to check desert encroachment, which is a serious
threat in the area. In the southern region, especially the eastern region, it checks gully erosion. It
was also identified that for the sake of the cashew plantations the farmers tend to fight against
bushfires. They however, admitted that at times, their bad farm practices bring about bushfires.
b/ Air Pollution: Smoke comes out during the processing of cashew nuts into kernels. This has
health implications not only for the workers at the factory sites but also the people in the
vicinities concerned.
5.2.3 The Extent to which MoFA facilitates Cashew Production in the study areas
a/ Technical support
It was established that the farmers received some technical support during the period under
review. The supports such as training programmes were sponsored by ADRA and ran by the
MoFA. In addition, the AEAs facilitated the farmer‟s access to the ADB credit facilities from
2004 – 2007.
b/ Credit Facilities and Rate of Repayment
The credit facilities were available to farmers in groups. It was Agricultural Development Bank
loan facility to cashew farmers under the Cashew Development Project (CDP) in some selected
districts. The four districts selected for the study, Jaman, Tain, Wenchi and Kintampo were
included in the CDP. The research revealed that the farmers needed no collaterals for the loans
hence they needed to form groups. The implication was that the members were guarantors of
each other. That is, if a member failed to pay back the loan, the group members were collectively
held responsible for the debt. This has both merits and demerits;
Merits;
i. The farmers did not have to provide collaterals to enable them access the facility.
ii. The members in a group serve as watch dogs for each other to make sure the loans are paid
back to enable them access it any time there is the need. As a result of the collective
responsibility, about 90 per cent of the loan facilities in 2007 had been recovered.
66
Demerits;
i. A single defaulter lands all the group members into trouble.
ii. The farmers claim that the loan was not enough for them to manage their farms effectively.
iii. Those farmers whose farms had not started producing faced problems in accessing the
facility.
(c) Agriculture Extension Agent – Farmer Relationship
The study revealed that the farmers are in close relations with the DADUs. The AEAs render
technical services to the farmers to ensure production of best quality produce and an increase in
production. Some of these services are training programmes for cashew farmers, sale of
improved seeds to farmers, linking farmers to Non Governmental Organisations such as ADRA,
and also assisting farmers to get access to credit facilities where possible. The result is the
increases in the volume of production from 2006 to 2008 in Table 4.1.
5.3. Recommendations
Local economic development requires the creation of an enabling environment capable of
stimulating new opportunities in rural and urban areas where opportunities for economic growth
may be limited. Local economic development programmes should thus identify and recommend
sustainable income generating opportunities such as cashew production, for the local community.
In order to boost or revamp the cashew industry, DADU on behalf of the district assemblies,
should encourage cultivation of improved varieties to transform the study areas from a low-
priced commodity producer to an exporter of high quality cashew products (organic kernels, etc).
5.3.1 Production and Harvesting of Cashew Nuts
With respect to production and harvesting, the Government and/or NGOs such as ADRA and
African Development Bank can assist the cashew sub sector in the form of;
Sponsorships for training programmes for cashew farmers to expose them to the best
agronomic practices, post-harvest handling, marketing and quality control and management.
Promotion of certified organic cashews to improve the export value of cashew products and
open new niche markets to Ghanaian exporters.

67
Distribution of improved cashew seeds and disease resistant varieties to Farmers. All farmers
but not only those under the CDP should be sponsored to acquire the improved seeds.
Processing of raw nuts before exporting. The government should negotiate with ADF to
extend the financial assistance (credit facilities) to processing factories to add value to the raw
nuts before exporting. This will help to increase the price and as a result increase the country‟s
foreign exchange earnings.
These could be achieved through individual endeavours or cashew stakeholders - including
producers, processors, exporters and financiers joining hands with the government to provide the
needed social and economic support in the cashew producing areas to retain and entice the
energetic youth to farm.
5.3.2 Formation of Ghana Cashew Board (GCB)
There is the need for the formation of Ghana Cashew Board (GCB) like the Cocoa Board to
ensure sustainability and betterment of the industry. In the mean time, however, the existing
cashew associations in the region could arrange and negotiate for befitting policies and initiatives
for the industry. If the Cashew Board is formed, it would take the burden of providing higher-
level coordination between the industry and the policy formulators so as to ensure that it
develops to its fullest capacity. For instance, the Cashew Board of Tanzania regulates and
promotes quality in the marketing and export of raw and processed cashew nuts. It is also
responsible for advising the government on matters relating to the cashew nut industry and for
carrying out other functions deemed necessary by the Ministry of Agriculture (Sijoana 2002).
5.3.3 Encouragement of Non-Governmental Organisations
The Non-Governmental Organisations such as ADRA should be encouraged by the government
to continue to support MoFA to provide technical assistance to the farmers. Accessing credit
facilities from the financial institutions is difficult but through the collaborative efforts of MoFA
and ADRA, the farmers were mobilised in groups to access loan facilities from the Agricultural
Development Bank with ease. More of such facilities could come to them if they are serious and
prove credit wealthy.

68
5.3.4 Price Regulation/ Producer Price Stabilization.
The producer price is a function of many considerations and influences, the most important of
which are production cost structure, the international cashew supply and demand dynamics, the
domestic market situations, the effectiveness of regulation mechanism and the tax structure on
the agricultural sector. The government could thus operate a buffer stock system whereby the
produce are purchased and stored to make sure supply does not exceed demand on the local
market to force the price down.
5.3.5 Production of Small-Size Cashew Nuts
The bulk of the produce in the study districts is the local (tiny, low-priced) type however, the
AEAs are trying all they can to educate the farmers on the need to replace them with the hybrid
plants. There is the need for MoFA to intensify the awareness on the need to use improved
planting materials.
5.3.6 The Role of the Public Sector for LED
The Local government authorities are responsible for certain social and economic infrastructures
such as roads, schools, hospitals and electricity in the communities. These are what Hirschman
(1958) refers to as Social Over head Cost (SOC). The study revealed that this is inadequate in
the cashew producing areas. The absence of these amenities makes it difficult for the industry to
thrive. The local government authorities in the study districts through their participatory,
facilitation, regulatory and adjustive roles should provide the rightful social and economic
infrastructure that is be capable of creating enabling environment for LED.
5.4 Conclusion
The study set out to assess the contribution of cashew production to the economic development
of Jaman, Tain, Wenchi and Kintampo districts of the Brong Ahafo Region in particular and the
Ghanaian economy as a whole. It was revealed that the study districts are captured under the
cashew development project started in 2003 and which assists the farmers with hybrid seeds,
technical and financial supports.
69
A mutual link was identified to exist between the cashew industry and the societies (economies)
of the study areas in particular and the nation as a whole. That is, the cashew industry provides
food, employment and income for the people, and foreign exchange for the country as a whole.
On the other hand, the societies provide the cashew industry with farm land, labour, technical
support and at times subsidies and tax incentives.
It was also revealed that over 8,000 people engaged in the cashew production in the study
districts complain of low producer prices and resultant low incomes from the cashew production.
The major causes identified for the low prices of cashew nuts were; first, the production of local
(tiny, low – priced) varieties in the area, second, lack of proper pricing policy for the product,
unlike that of cocoa and finally, export of nut in its raw state.
On the whole, it was established that the cashew industry has been the source of income for over
8,233 people in the study districts, and it has the potential to expand when given the necessary
support. The study thus recommends that the government or her agencies take pragmatic
strategies to create an enabling environment for the sector to thrive. This requires support from
all cashew stakeholders. For instance, the Cashew Board of Tanzania regulates and promotes
quality in the marketing and export of raw and processed cashew nuts. The GoG could set a
cashew board to operate in that direction to ensure that the cashew industry expands to provide
income for more people in the local areas.

70
References
African Development Fund, (2000) Cashew Development Project Appraisal Report
GHA/PAAA/2000/01
Babbie E. (1990), Survey Research Methods, 2nd ed. California: Wadsworth Publishing
Blakely, E. J. (1988), Planning Local Economic Development. Theory and Practice Sage
Publications Inc. Available at
http://www.alibris.com/search/books/qwork/5157362/used/PlanningLocalEconomic
Development. A Theory and Practice. (Accessed in April, 2008)
Boothroyd, P. (1991). The Meaning of Community Economic Development The Paradigm of
Community Development, Available at http://cdj.oxfordjournals.org/content/30/1/21.full.pdf./
(Accessed in April, 2008)
Boothroyd, P. and Davis H. C. (1993), Community Economic Development: Three Approaches.
Journal of Planning Education and Research 12. Available at
http://jpe.sagepub.com/content/12/3/230.abstract (Accessed, January 10, 2011)
Cashew Development Project (2008), The Status of Ghana Cashew Industry. Available at
www.ghanacashewproducts.com.(Accessed in June,2009)
Chemonics International Inc. (2002), Subsector Assessment of the Nigerian Cashew Industry.
Available at http://pdf.usaid.gov/pdf_docs/PNACY675.pdf. (Accessed April18, 2008)
Clarke, Susan E; Gary L. Davis (1992), Post federal Local Economic Development strategies;
Economic Development Quarterly 6 (2): 187–198. Available at
http://en.wikipedia.org/wiki/Waves of Economic Development. (Accessed, January10, 2011)
Cochran, W.G. (1977), sampling techniques. New York: John Wiley & Sons. Available at
http://www.cals.ncsu.edu/agexed/aee577a/Class11/sample.html. (Accessed on April 20, 2008)
Company.
Co-operative College, (2007) Issues of Cashew Nuts Production, fair and square. Available at
http://www.fairandsquare.coop/?q=node/321 (Accessed, January 10, 2011).
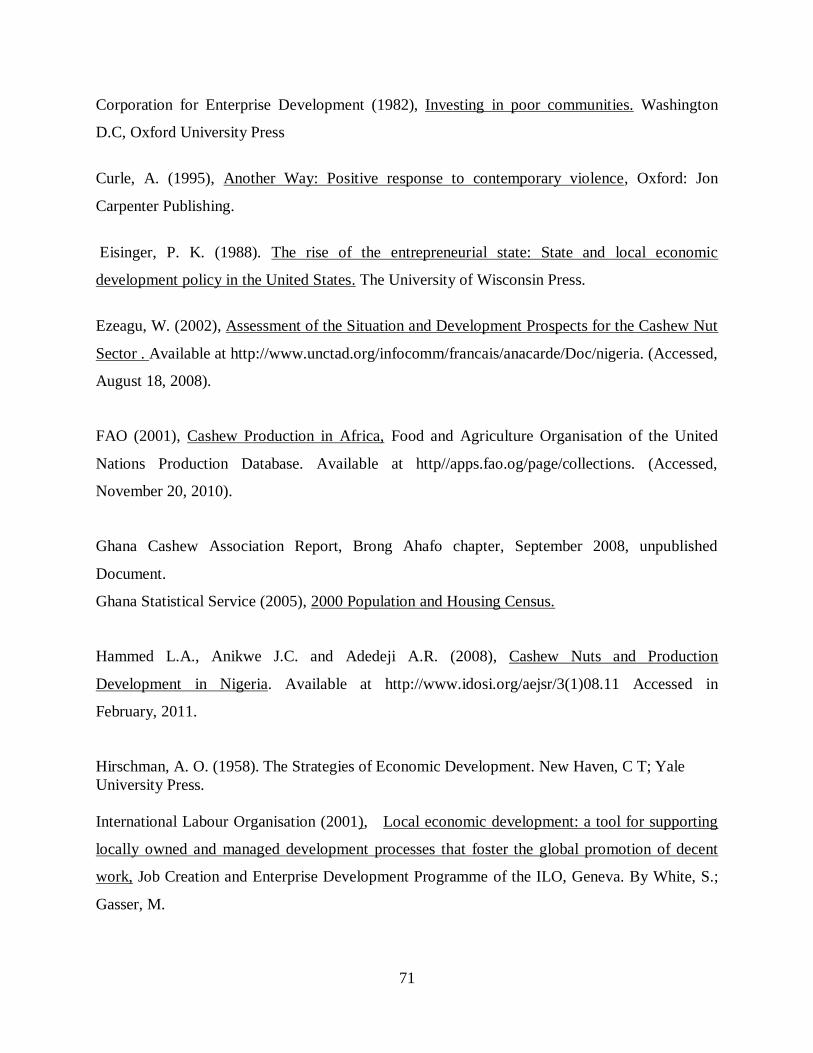
71
Corporation for Enterprise Development (1982), Investing in poor communities. Washington
D.C, Oxford University Press
Curle, A. (1995), Another Way: Positive response to contemporary violence, Oxford: Jon
Carpenter Publishing.
Eisinger, P. K. (1988). The rise of the entrepreneurial state: State and local economic
development policy in the United States. The University of Wisconsin Press.
Ezeagu, W. (2002), Assessment of the Situation and Development Prospects for the Cashew Nut
Sector . Available at http://www.unctad.org/infocomm/francais/anacarde/Doc/nigeria. (Accessed,
August 18, 2008).
FAO (2001), Cashew Production in Africa, Food and Agriculture Organisation of the United
Nations Production Database. Available at http//apps.fao.og/page/collections. (Accessed,
November 20, 2010).
Ghana Cashew Association Report, Brong Ahafo chapter, September 2008, unpublished
Document.
Ghana Statistical Service (2005), 2000 Population and Housing Census.
Hammed L.A., Anikwe J.C. and Adedeji A.R. (2008), Cashew Nuts and Production
Development in Nigeria. Available at http://www.idosi.org/aejsr/3(1)08.11 Accessed in
February, 2011.
Hirschman, A. O. (1958). The Strategies of Economic Development. New Haven, C T; Yale
University Press.
International Labour Organisation (2001), Local economic development: a tool for supporting
locally owned and managed development processes that foster the global promotion of decent
work, Job Creation and Enterprise Development Programme of the ILO, Geneva. By White, S.;
Gasser, M.

72
Kane, M. (2004), Public - Sector Economic Development: Concept and Approaches, Northeast
– Midwest Institute.
Kane, M. and P. Sand (1988), Economic Development: what works at the Local Level.
Washington, DC: National League of Cities.
Kokor J.Y (2001), Local Governance of Development in Ghana. SPRING Research Series No.
30, SPRING Centre, Dortmund.
Kokor J.Y and Kroes G. (1996) Expenditure Pattern Ghanaian Districts: How do local
communities benefit? SPRING Research Series No. 10 UST, Kumasi.
Krueger L. and Neumann W. (2006), Social Work Research Methods: Qualitative and
Quantitative Approaches, New York, Pearson Education.
Local Economic Development Network of Africa (2008), Sharing Expertise for Growth,
http://www.linkedin.com/in/connieledna. (Accessed in May, 2010).
Local Government Act of Ghana, Act 462 (1993), Ghana Publishing Corporation.
Mitchell, D. (2004). Tanzania‟s Cashew Sector: Constraints and Challenges in a Global
Environment. Available at http://www.worldbank.org/afr/wps/index.htm. (Accessed, April 16,
2009).
Nigerian Cashew Industry. Cashew Unpublished Document, January, 2002, Abuja – Nigeria.
Available at http://pdf.usaid.gov/pdf_docs/PNACY675.pdf (Accessed August 18, 2008).
Seers, D. (1969), The Changing meaning of Development. Available at http://www.palgrave-
journals.com/development/journal/v50/n1s/full/1100386a.html. (Accessed January 10, 2011)

73
Sijaona M.E.R. (2002), Assessment of the Situation and Development of the Cashew nut Sector
in Tanzania. Available at http://www.unctad.org/infocomm/francais/anacarde/Doc/tanzania.pdf.
(Accessed, January 10, 2011)
The Ghanaian Chronicle paper, April 4, 2008 . Available at
http://allafrica.com/stories/200804040676.html. (Accessed, October, 2008)
The Institute of Statistical, Social and Economic Research (ISSER) (2002), The State of the
Ghanaian Economy. University of Ghana, Legon.
The Institute of Statistical, Social and Economic Research (ISSER) (2004), The State of the
Ghanaian Economy. University of Ghana, Legon.
The Institute of Statistical, Social and Economic Research (ISSER) (2006), The State of the
Ghanaian Economy. University of Ghana, Legon.
The Institute of Statistical, Social and Economic Research (ISSER) (2007), The State of the
Ghanaian Economy. University of Ghana, Legon.
The Institute of Statistical, Social and Economic Research (ISSER) (2008), The State of the
Ghanaian Economy. University of Ghana, Legon.
Todaro, M. (2003), Sample Essay on Economic Development Definition. Available at
http://homework.placefeedback.com/sample-essay-on-economic-development-definition-
definition-essay/. (Accessed 10th
November,2010)
Topper, C.P (2002), Issues and Constraints related to the Development of Cashew Nuts from five
African countries . Available at http://www.untad.org/information /francais/anacarde/Doc.
(Accessed, November 20,2010).
Topper, C.P., Martin, P.J., Katinila, N., Kikoka (1998), The historical and institutional
background of the Tanzania Cashew Industry, proceedings of the international cashew and
coconut conference; Trees for life- the key to Development. Biohybrids International Ltd.
Reading UK. Available at linkinghub.elsevier.com/retrieve/pii/. (Accessed, January 10, 2011).
Trochim, M.K. (2006), Social Research Methods. Available at
http://www.socialresearchmehods.net/kb/survey.php. (Accessed on March 11, 2009).

74
UNCTAD/UNEP (1974), Patterns of Resource Use, Environment and Development Strategies,
Cocoyoc, Mexico. Available at http://www.jstor.org/pss/2706353 . (Accessed April 20, 2008)
Unpublished Document of Brong Ahafo Region.
WB/IMF (2008), Global Monitoring Report 2008, MDGs and the Environment: Agenda for
Inclusive and Sustainable Development, Washington DC.
William, M. and K. Trochim, (2006). Research Methods Knowledge Base. Available at
(http//www.socialresearchmethods.net/kb/order.php). (Accessed on March 11, 2009).
World Bank (2003), World Development Report, Available at
http://econ.worldbank.org/wdr/wdr2003/. (Accessed on August 18, 2008)
World Bank OED, (1998), Tanzania, Agriculture, and the World Bank. An Operations
Evaluation Department Review. Report 18111. Washington D.C.

75
Appendix 1: Questionnaire for District Agriculture Development Units
Department of Planning
College of Architecture and Planning
Kwame Nkrumah University of Science and Technology, Kumasi.
I am Peter Kwasi Sarpong, a student, Master of Science “Development Policy and Planning” at
the above mentioned institution. I am conducting this study as part of the requirements for the
award of the degree. Your participation in this interview will enable me provide accurate and fair
view about the situation on the ground. You may choose not to take part in this interview, but if
you do, I guarantee that all information you provide will be treated as confidential and that no
statement you make in this interview will be identified with you personally.
SECTION A
Background Information
1.1 Name of District …………………………… 1.2 Date of interview ……………
1.3 Rank/position …………………… 1.4 Age of Respondent....................................
SECTION B
Land Acquisition
2. Do farmers face any problem in acquiring land for cashew production? Yes [ ] No [ ]
2.1 If Yes, what are the problems? ………………………………………………….....
2.2 How many farmers are under your programme in the District? ……………….........
2.3 What is the total acreage cultivated in the district. ……………….................................

76
SECTION C
Access to Credit Facilities
3. Do Cashew farmers in the district have access to credit facilities? Yes [ ] No [ ]
3.1 If Yes, from which source?
a) Government [ ]
b) Financial Institutions [ ]
c) NGO [ ]
d) Personal Arrangements [ ]
3.2 If No why? ………………………………………………………………………
SECTION D
Marketing
4. How do farmers sell their Cashew Products in the district? ………………...................
………………………………………………………………………………………
4.1 Do farmers get fair producer prices for their produce? Yes [ ] No [ ]
4.2 Explain your answer in 4.1 ……………………………………………………………
...................................................................................................................
4.3 How does your answer in 4.1 affect the farmers‟ income at the end of the seasons?
…………………………………………………………………………………………….

77
SECTION E
Cashew Production and Local Economic Development (LED)
5. What role do you think the Cashew Industry is expected to play in LED?
…………………………………………………………………………………………
5.1 What benefits do farmers in the district derive from Cashew production? ..................
………………………………………………………………….........................................
5.2 Does Cashew Industry contribute to the development of the locality? Yes [ ] No [ ]
5.3 Explain your answer in 5.2 ………………………………………………..................
………………….................................................................................................................
5.4 Do Cashew Farmers receive any form of support from any NGOs in the District? Yes [ ]
No [ ]
5.5 If Yes, what kind of support?…………………………………………………………
5.6 If Yes, name the NGOs concerned.... .........................................................................
5.7 What are the effects of Cashew production on the environment? ................................
…………………………………………………………....................................................
5.8 What is the ratio of Male to Females cashew farmers? …………………………………….

78
SECTION F
Challenges of Cashew Production
6. Do Farmers face any challenges in producing cashew in the district? Yes [ ] No [ ]
6.1 If Yes, what are the challenges? .....................................................................................
………………………………………………………………………...................................
6.2 How are the challenges being addressed? .......................................................................
.......................................................................................................................................
6.3 What has been the role of MoFA in promoting Cashew Production in the district?
………………………………………………………………………………………….....
Thank you.

79
Appendix 2: Questionnaire for Cashew Farmers
Department of Planning
College of Architecture and Planning
Kwame Nkrumah University of Science and Technology, Kumasi.
I am Peter Kwasi Sarpong, a student, Master of Science “Development Policy and Planning” at
the above mentioned institution. I am conducting this study as part of the requirements for the
award of the degree. Your participation in this interview will enable me provide accurate and fair
view about the situation on the ground. You may choose not to take part in this interview, but if
you do, I guarantee that all information you provide will be treated as confidential and that no
statement you make in this interview will be identified with you personally.
SECTION A
Background Information
1.1 Name of District ……………………. 1.2 Date of interview ……………………
1.3 Gender of Respondent M [ ] F [ ] 1.4 Age …………..……………………
1.5 Level of terminal formal education of respondent
a) Nil [ ]
b) Basic [ ]
c) Secondary/Vocational [ ]
d) Tertiary [ ]
Others, specify ………………………………

80
SECTION B
Land Acquisition
2. How did you acquire land for Cashew production? Hired [ ] Family Owned [ ] Outright
purchase [ ]
2.1 How long have you been farming cashew?
a/ 0-5 years [ ]
b/ 6-10 years [ ]
c/ over 10 years [ ]
2.2 What is the land size of your farm? .....................................................................
2.3 Do you do any other work(s) apart from Cashew production? Yes [ ] No [ ]
2.4 If Yes, what are the other work(s) that you do ………………………………………
SECTION C
Access to Credit Facilities
3. Do you have access to credit facilities? Yes [ ] No [ ]
3.1 If Yes, from what source? Government [ ] Financial Institutions [ ] NGO [ ] Personal
arrangements [ ]
3.2 If No why? ………………………………………………………………………..........

81
SECTION D
Marketing of Cashew Products
4. How do you sell your products? ................................................................................... ..
4.1 Do you find the Marketing system convenient to you? Yes [ ] No [ ]
4.2 If No, what are your reasons? ……….................................... ......................................
……………………………………………………………………………………….........
4.3 Do you get fair producer prices for your produce? Yes [ ] No [ ]
4.4 Explain your answer …………………………………………………………………
4.5 How does your answer in 4.3 affect your end of season income ?
…………………………………………………………………………………………..
SECTION E
Cashew Production and Local Economic Development
5. How many People do you employ? .............................................................................
5.1 How many of your employees are Women? ..................................................................
5.2 Do you have access to Agriculture extension services in your farm activities? Yes [ ] No [ ]
5.3 If No, why? ……………………………………………………………………….....
5.4 If Yes, what are some of the services that you receive? ............................................

82
5.5 How many bags do you harvest a year?
a/ 1-5 bags [ ]
b/ 5 -10 bags [ ]
c/ 10 – 15 bags [ ]
d/ over 15 bags [ ]
5.6 Do you derive any benefit from the cashew production? Yes [ ] No [ ]
5.7 If Yes, state examples of the benefits…………………………………………..............
5.8 What is the contribution of the Cashew Industry to the Local Economic Development?
.......................................……………………………………………………………...........
5.9 What are the effects of Cashew production on the Environment?
...........................................................................................................................................
SECTION F
Challenges of Cashew Production
6. Do you face any challenges in Cashew Production? Yes [ ] No [ ]
6.1 If Yes, what are the Challenges?.....................................................................................
…………………………………………………………........................................................
6.2 What initiatives have been taken to address the challenges? ..........................................
............................................................................................................................ ..............
Thank you.

83
Appendix 3: Questionnaire for Cashew Buyers
Department of Planning
College of Architecture and Planning
Kwame Nkrumah University of Science and Technology, Kumasi.
I am Peter Kwasi Sarpong, a student, Master of Science “Development Policy and Planning” at
the above mentioned institution. I am conducting this study as part of the requirements for the
award of the degree. Your participation in this interview will enable me provide accurate and fair
view about the situation on the ground. You may choose not to take part in this interview, but if
you do, I guarantee that all information you provide will be treated as confidential and that no
statement you make in this interview will be identified with you personally.
SECTION A
Background Information
1.1 Date of interview ………………………… 1.2 Gender of Respondent M [ ] F [ ]
1.3 Age ……………………………..
SECTION B
Land Acquisition
2. Do you face land acquisition problem? Yes [ ] No [ ]
2.1 If Yes what is the problem? ...........................................................................................
.....................................................................................................................................

84
SECTION C
Access to Credit Facilities
3. Do you have access to credit facilities? Yes [ ] No [ ]
3.1 If Yes, from which source? Government [ ] Financial Institutions [ ] NGO [ ] Personal
arrangements [ ]
3.2 If No why? ………………………………………………………………………
SECTION D
Marketing of Cashew Products
4. How do you get the Cashew products to buy….........................................................
…………………………………….. ...........................................................................
4.1 How many bags are you able to buy every year?
a. 5- 50 bags [ ]
b. 50 -100 bags [ ]
c. over 100 bags [ ]
4.2 What measurement is used to purchase the cashew produce?
a) Special Sucks and containers [ ]
b) Measurement Scale [ ]
c) Others, specify …………………………………………..
4.3 On average, how many bags are you able to buy yearly?

85
................................................................................................................................................
4.4 Do you get the required quantity? Yes [ ] No [ ]
4.5 If No, what do you think are the reasons? ......................................................................
................................................................... ......................................................................
4.6 Does Government regulate the prices of cashew products like that of cocoa? Yes [ ] No [ ]
4.7 If No how are the prices of cashew products determined?
a/ by demand and supply (invisible hand) [ ]
b/ by farmers [ ]
c/ by buyers [ ]
d/ Others, specify ……………………………………………………..
4.8 Are you satisfied with the pricing system? Yes [ ] No [ ]
4.9 State reason (s) for your answer ………………………………………………............
............................................................................................................................. ...............
4.10 What do you do to the products you purchase? They are;
a. resold locally [ ]
b. exported [ ]
c. processed [ ]

86
SECTION E
Cashew Production and Local Economic Development
5. How many People do you employ? ................................................. ..............................
5.1 How many of your employees are Women? ...............................................................
5.2 What benefit do you derive from the cashew Industry? ................................................
............................................................................................................................. .....
5.3 What is the contribution of the Cashew Industry to the Local Economic Development?
..............................................................................................................................................
SECTION F
Challenges of Cashew Production
6. Do you face any challenges in the Cashew Industry? Yes [ ] No [ ]
6.1 If Yes, what are the Challenges?....................................................................................
…………………………………………………………......................................................
6.2 What do you think can be done to overcome the challenges? ………………….........
……………………………………………………………………………………..
Thank you.

87
Appendix 4: Questionnaire for Cashew Processors
Department of Planning
College of Architecture and Planning
Kwame Nkrumah University of Science and Technology, Kumasi.
I am Peter Kwasi Sarpong, a student, Master of Science “Development Policy and Planning” at
the above mentioned institution. I am conducting this study as part of the requirements for the
award of the degree. Your participation in this interview will enable me provide accurate and fair
view about the situation on the ground. You may choose not to take part in this interview, but if
you do, I guarantee that all information you provide will be treated as confidential and that no
statement you make in this interview will be identified with you personally.
SECTION A
Background Information
1.1 Date of interview ………………….. 1.2 Gender of Respondent M [ ] F [ ]
1.3 Rank/Position …………………………… Age ……………………………
SECTION B
Land Acquisition
2. How did you acquire the land for your factory? Hired [] Family owned [] Outright purchase []
2.1 Do you face any problems about land acquisition? Yes [ ] No [ ]
2.2 If Yes, what are the problems? …………………………………………………......
............................................................................................................................................

88
SECTION C
Access to Credit Facilities
3. Do you have access to credit facilities? Yes [ ] No [ ]
3.1 If Yes, from which source? Government [ ] Financial Institutions [ ] NGO [ ] Personal
Arrangements [ ]
3.2 If No why? ………………………………………………………………………
SECTION D
Marketing
4. Into what do you process cashew?
a. Roasted kernel [ ] b. Brandy/ Gin [ ] c. Others, specify ……………………
4.1 How do you get (Raw materials) Cashew Products for your work?
a. Buy directly from the farmers [ ] b. Buy from the middlemen [ ] c. Buy through agents [ ] d.
Others, specify ……………………………………
4.2 Do you get enough quantity? Yes [ ] No [ ]
4.3 If No, what is /are the reason (s) ? …………………………………….............................
............................................................................................................................................
4.4 What is your target market? Local market only [ ] Foreign Market (Export) only [ ]
Both Local and Foreign markets [ ]

89
4.5 Do you get fair prices for your processed products? Yes [ ] No [ ]
4.6 If No, State reason (s) ……………………………………………….........................
............................................................................................................................. ............
SECTION E
Cashew Production and Local Economic Development
5. How many People do you employ? ................................................ .............................
5.1 How many of the employees are Women? .................................................................
5.2 What benefit do you derive from the Cashew Industry? ……………………………
…………………………………………............................................................................
5.3 What is the contribution of the Cashew Industry to the Local Economic Development?
...............................................................................................................................................
5.4 What have been the impacts of your factory on the local economy?.............................
……………………………………………………………………………………......
SECTION F

90
Challenges
6. Do you face any challenges in the Cashew Industry? Yes [ ] No [ ]
6.1 If Yes, what are the Challenges?..................................................................................
6.2 What can be done to address the challenges? …………………....................................
………………………………………………………………………………...........
6.3 What can be done to improve the Cashew Industry in Brong Ahafo?
………………………………………………………………………………………......
Thank you.
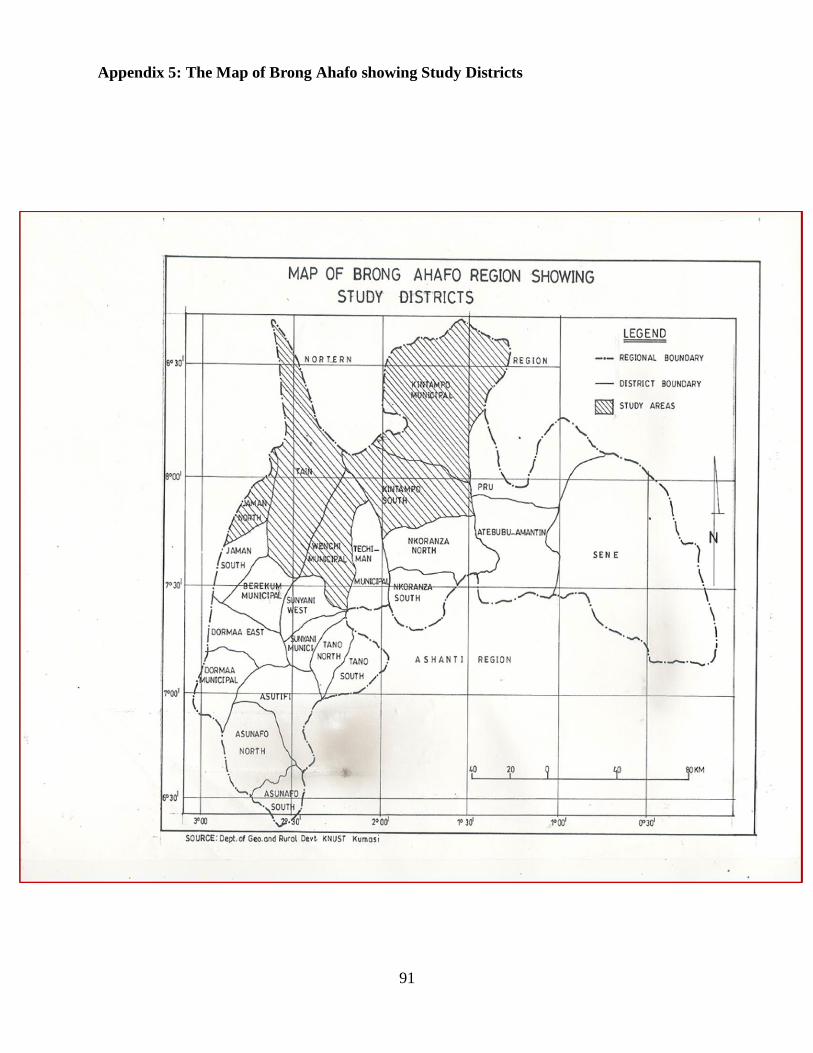
91
Appendix 5: The Map of Brong Ahafo showing Study Districts
92
Appendix 6: Cashew Tree
Source: Chemonics International Inc., 2002.

93
Appendix 7: Cashew Fruits
Source: The Ghanaian Chronicle Paper, 2008.