an assessment of overt malicious activity manifest in
TRANSCRIPT

An Assessment of Overt Malicious Activity Manifest inResidential Networks
Gregor Maier1,2, Anja Feldmann2, Vern Paxson1,3,Robin Sommer1,4, and Matthias Vallentin3
1 International Computer Science Institute, Berkeley, CA, USA2 TU Berlin / Deutsche Telekom Laboratories, Berlin, Germany
3 University of California at Berkeley, CA, USA4 Lawrence Berkeley National Laboratory, Berkeley, CA, USA
Abstract. While conventional wisdom holds that residential users experience ahigh degree of compromise and infection, this presumption has seen little valida-tion in the way of an in-depth study. In this paper we present a first step towards anassessment based on monitoring network activity (anonymized for user privacy)of 20,000 residential DSL customers in a European urban area, roughly 1,000users of a community network in rural India, and several thousand dormitoryusers at a large US university. Our study focuses on security issues that overtlymanifest in such data sets, such as scanning, spamming, payload signatures, andcontact to botnet rendezvous points. We analyze the relationship between overtmanifestations of such activity versus the “security hygiene” of the user popula-tions (anti-virus and OS software updates) and potential risky behavior (access-ing blacklisted URLs). We find that hygiene has little correlation with observedbehavior, but risky behavior—which is quite prevalent—more than doubles thelikelihood that a system will manifest security issues.
1 Introduction
Conventional wisdom holds that residential users experience a high degree of compro-mise and infection, due to a dearth of effective system administration and a plethoraof users untrained or unwilling to observe sound security practices. To date, however,this presumption has seen little in the way of systematic study. Such analysis can provedifficult to conduct due to major challenges both in obtaining access to monitoring resi-dential activity, and in determining in a comprehensive fashion whether a given systemhas been subverted given only observations of externally visible behavior.In this paper we develop first steps towards such an investigation. We examine the
network activity of 20,000 residential DSL customers within a European urban area,roughly 1,000 users of a community network in rural India, and several thousand dormi-tory users at a large US university. As a baseline, we include in our assessment the sameanalyses for Internet traffic seen at a large research laboratory that has a track recordof effectively protecting its roughly 12,000 systems without employing a default-denyfirewall policy.We in addition investigate the relationship between problems flagged by our analy-
ses and the level of apparent “security hygiene” in our populations. One may expect that

users who perform regular OS updates and deploy anti-virus software are less likely tohave their systems compromised. Likewise, one might presume that users who partakein risky behavior have more security problems. To check these assumptions, we exam-ine the end-user systems in our data sets for signs of regular operating system updates,anti-virus deployments, and contacts to URLs blacklisted by Google’s Safe BrowsingAPI [8].We emphasize that given our data we can only assess malicious activity that overtly
manifests in network traffic. Clearly, this reflects only a (perhaps quite small) subsetof actual security problems among the users. Thus, what we provide constitutes only afirst step towards understanding the nature and prevalence of such problems. Given thatcaution, we frame some of our more interesting findings as:
– In all of our environments, only a small fraction of hosts manifest malicious activity.– We do not find significant differences between the environment in rural India andthe other residential environments, though the former poses a number of analysisdifficulties, so this finding is only suggestive.
– While OS software updates and anti-virus technology are widely deployed, we donot find that their use correlates with a lower degree of overt malicious activity.
– We observe frequent risky behavior, and users exhibiting such risky behavior areroughly twice as likely to manifest malicious activity.
We structure the remainder of this paper as follows. After introducing our data setsand methodology in §2, we study security hygiene in §3 and then investigate maliciousactivity in §4. We present related work in §5. Finally, we discuss our results and presentavenues for future work in §6.
2 Methodology
We start our discussion by summarizing the specifics of the data sets we captured in thefour network environments we examine in this study. We then discuss how, using thesetraces, we identify the operating systems used by individual hosts. Finally, we presentthe metrics we deploy for detecting overt malicious activity.
2.1 Data Sets
We started our work by recording network traces in all environments. However, due tohigh traffic volume it did not prove feasible to record the full network data stream foran extended period of time in most environments. We therefore leveraged Maier et al.’s“Time Machine” system [13] to reduce the stored amount of data. The Time Machinerecords only the first N bytes of each connection, discarding the remainder. For ex-ample, in the ISP environment, using N=50KB allowed us to record ≈ 90% of allconnections in their entirety while only retaining 10% of total volume.1
1 We note that due to operational constraints we used different cutoff values in each environment,as detailed in the corresponding sections.

Table 1. Data sets for European ISP, Univ, and LBNL. We collected all these using the TimeMachine.
Location Start Duration Total volume After cutoff applied LossISP Mar 13, 2010 14 days > 90 TB > 9 TB 0%Univ Sep 10, 2010 7 days > 35 TB > 2 TB 0.005%LBNL Apr 29, 2010 4 days > 25 TB > 350GB 0.2%
Table 2. Data sets for AirJaldi.
Name Start Duration # IPs Size LossAirJaldi1 Mar 10, 2010 40 h 263 65GB 0.35%AirJaldi2 Mar 13, 2010 34 h 188 31GB 1.07%AirJaldi3 Apr 22, 2010 34 h 261 51GB 0.44%
We used the Bro system [14] with Dynamic Protocol Detection [6] to detect andextract application layer headers. Our capturing processes made sure to anonymize thedata in accordance with the network operators’ policies, and all data classification andheader extraction executed directly on the secured measurement infrastructures. Table 1and Table 2 summarize our data sets.
Lawrence Berkeley National Laboratory. The Lawrence Berkeley National Labora-tory (LBNL) is a large research institute with more than 12,000 hosts connected to theInternet via a 10Gbps uplink, and we use it a baseline for our study. Since LBNL offersan open research environment, LBNL’s security policy defaults to fairly unrestricted ac-cess, with only limited firewalling at the border. LBNL’s security team actively monitorsits network for malicious activity, deploying a toolbox of strategies including detectorsfor scanning and spamming. Systems detected as compromised are quickly taken offthe network. Thus, we expect to find little malicious activity in this environment.We analyze one 4-day packet-level trace. The trace covers two weekdays and a
weekend, with a total of 7,000 hosts active during that period. Large individual flowsare common at this site, so the Time Machine proved especially effective at reducingvolume of collected data. We ran it with a cutoff value of 25KB. During our recordinginterval, the capture mechanism reported 0.2% of all packets as dropped.In terms of application protocol mix, we find that HTTP contributes about 42% of
bytes at LBNL and SSH 21%. About 23% of the traffic remains unclassified.
European ISP. Our largest data set represents a 14-day anonymized packet-level traceof more than 20,000 residential DSL lines, collected at an aggregation point within alarge European ISP. The ISP does not employ any traffic shaping or blocking (suchas filtering outbound SMTP connections), providing us with an unobstructed view ofpotential malicious activity.We used the Time Machine with a cutoff value of 50KB. Since we employed En-
dace monitoring cards and discarded the bulk of the data, we did not experience anypacket loss. In addition, we also have access to several further day-long traces for com-parison purposes.

This ISP data set includes meta-data associating the anonymized IP addresses inthe trace with the corresponding (likewise anonymized) DSL line IDs, which enablesus to distinguish customers even in the presence of the frequent address reassignmentemployed by this ISP [11]. For our study, we thus use these line IDs as our basic analysisunit.Furthermore, the NAT detection approach developed in [12] works well in this en-
vironment and allows us to reliably identify the presence of NATs on any of the DSLlines. In addition, the NAT detection approach enables us to estimate the number ofhosts connected at a DSL line. We find that 90% of the DSL lines use NAT and that46% connect more than one device to the Internet.The application protocol mix in the monitored ISP network is dominated by HTTP
(> 50% of the total volume), while the prevalence of peer-to-peer applications is rathersmall (15%). NNTP accounts for roughly 5%, and less than 15% of the traffic remainsunclassified but is likely P2P.
Indian community network.. The AirJaldi [1] wireless network is a non-profit com-munity network in the Himalayas of India. Using approximately 400 wireless routers,it covers a radius of 80 km in and around the city of Dharamsala. AirJaldi connectsthousands of users and machines with two leased lines from broadband ISPs, whichprovide a total uplink capacity of 10Mbps. The majority of the rural population ac-cesses the Internet via publicly shared machines in cybercafes or libraries. In addition,some residential users connect to the network with individually administered machines.In the AirJaldi network, a single IP address is assigned to each “customer site”, such
as a specific building, library, or village. Customer sites can in turn provide connectivityto anywhere from one to several hundred systems, and the larger ones typically employa multi-tiered NAT architecture on their inside, with NAT gateways connecting furtherNAT gateways.Due to this architecture, we cannot directly distinguish individual systems at our
monitoring point which is located at the central uplink router. Likewise, the NAT de-tection approach we use for the European ISP cannot reliably determine the numberof hosts behind the larger gateways. We therefore report only aggregate findings formalicious activity and risky behavior for the AirJaldi environment.However, to get an idea of the size of the user population, we can still estimate the
number of active individual users by extracting (anonymous) user ID cookies found inHTTP traffic: the IDs sent to google.com, Doubleclick, and Google Analytics consis-tently indicate that we are seeing at least 400–600 users in each trace.In our traces, HTTP dominates AirJaldi’s application protocols mix, accounting for
56–72% of the total traffic volume, similar to the European ISP. However, in contrastto the ISP, interactive communication protocols (instant messaging, VoIP, Skype, etc.)account 2.5–10% at AirJaldi, while NNTP and P2P are not prevalent.
University Dormitories. We also examine network traffic recorded at dormitories ofa major US University, where our monitoring point allows us to observe all their ex-ternal traffic. While the dormitory network generally employs a default-open firewall,it deploys a custom “light-weight” Snort setup configured to detect a small set of re-cent malware. Users flagged by Snort are automatically moved over to a containmentnetwork from where they can then only access resources for disinfecting their systems.

Note that this containment prevents such victims from further triggering our maliciousactivity metrics once the dorm setup has restricted their access.The IP address space for the dorm users is large enough to assign public IP addresses
to each local system, with no need for a central gateway NAT. In our data set, weobserve about 10,000 active IP addresses. Analyzing user IDs (as we discussed with theAirJaldi network), we find roughly 14,000 distinct ones, suggesting that a single publicIP is only used by few machines. We also find that user-to-IP mappings remain mostlystable, and thus we can use IP addresses as our main analysis unit here. Similar to theISP, however, we cannot further distinguish between different hosts/devices connectedpotentially through a user-deployed NAT gateway.We note that the NAT detection approach developed in [12] does not work well
in this environment. As it leverages IP TTLs, it relies on a well-known hop distancebetween the monitoring point and the user system, which is not the case in the dormenvironment.We analyze one 7-day packet-trace from the Univ environment, recorded using the
Time Machine with a 15KB cutoff (i.e., smaller than for the European ISP). The ap-plication protocol mix in the dorm network is dominated by HTTP, which accounts forover 70% of all bytes, with 20–25% of traffic unclassified.
2.2 Operating Systems
Malware often targets particular operating systems, and some OSes are perceived asmore secure due to architectural advantages or smaller market shares that render themless attractive targets. To assess these effects, we annotate our traces with the operatingsystem(s) observed in use with each DSL line (for the European ISP) or IP address (forthe other environments). We determine operating systems by analyzing HTTP user-agent strings reflecting the most popular browsers (Firefox, Internet Explorer, Safari,and Opera).Doing so, we can identify one or more operating systems on more than 90% of all
DSL lines of the European ISP. Analyzing the operating system mix, we find that 59%of the lines use only a single version of Windows, while 23% use different Windowsversions. Mac OS is present on 7.6% of the lines, and used exclusively on 2.7%. Wefind Linux on 3.7% of the lines. However, we also observe that Linux is generally usedin combination with other operating systems, and the fraction of lines with only Linuxis too small to assess malicious activity separately.At LBNL, we can identify at least one operating system for 60% of all active IPs.
We find that 70% of these IPs use only a single version of Windows. We see Macs inuse with 19% of those IPs, and Linux with 8.6%.In the Univ environment, we are able to determine operating systems for 73% of all
active IPs. Mac OS is the dominating operating system here, present on 56% of them.34% of IPs use a single version of Windows exclusively, and Linux is present on justover 4% of IPs.At AirJaldi, we observe a large number of operation systems per IP due to its exten-
sive NAT deployment and thus cannot further estimate the distribution.

2.3 Manifestations of Compromised Systems
To identify end systems that overtly manifest malicious activity or signs of likely com-promise, we search for three behavioral indicators—address scanning, port scanning,and spamming—and also monitor for network-level signatures aimed at detecting threemalware families, Zlob, Conficker, and Zeus.To take advantage of the long duration of our traces, we analyze and report man-
ifestations of malicious activity first separately for each day of our multi-day traces(European ISP, Univ, and LBNL). We then further aggregate the results by accumulat-ing all activity over increasing trace durations into cumulative data sets. For example,consider a local system (DSL line or IP address) that started to be a scanner on day4. In the daily data set this system is marked as a scanner on day 4. In the cumulativedata set, it is marked as scanner on day 4 as well as for all following days, regardless ofwhether the system is again acting as a scanner on any of the subsequent days or not. Inparticular, the cumulative data for the last day of a trace reflects the aggregate behaviorover the full observation period.
Scanning. Extensive address scanning often reflects the precursor of an attack thattargets services that answer the scan. Most network intrusion detection systems (NIDS)therefore detect and report such scanners but their detectors typically target externalhosts probing a monitored network. For our study, however, we instead wish to findoutbound scanners. This can prove harder to do, as the potential probes are embeddedwithin the host’s benign activity.We found that for our environments, a simple threshold-based scan detector often
erroneously flags benign user activity such as web browsers. Detectors that count failedconnection attempts work better, but still can misfire for P2P-style traffic patterns. Wetherefore use an approach loosely modeled on that of TRW [10]: we compute the ratioof successful vs. unsuccessful TCP connections initiated by a local host. We define aconnection as unsuccessful if a client sends a SYN but either receives a RST back or noanswer at all.We find that our data exhibits a sharply bi-modal distribution of success ratios: Con-
nections between a specific pair of local and remote hosts tend to either always succeedor always fail. However, when investigating the fraction of remote destinations per localhost that tend to fail, we do not find such a clear distribution. Presumably, P2P clientscan have similarly large numbers of mostly unsuccessful destinations, thus renderingthis approach impractical. We can overcome this ambiguity, however, by limiting ourscan analysis to 14 ports that frequently appear in inbound scanning, as identified bythe security monitoring in our baseline environment, LBNL. These ports include, e.g.,the Windows services 135–139, 445, and 1433. For activity targeting these ports, we in-deed find that local systems either have a small (< 20) or large (> 100, often > 1,000)number of unsuccessful remote contacts; see Figure 1. We thus deem activity as overtlymanifesting a compromised local system if a host unsuccessfully attempts to contact> 100 destinations.Another dimension of scanning regards port scanning: probing many ports on a
single remote host. Since few benign applications need to contact numerous distinctports on a single system, we use a simple threshold-based approach: we consider a local

# successful destinations1 10 100 1000 10^4 10^5
1
10
100
1000
10^4
10^5
10^6
# un
succ
essf
ul d
estin
atio
ns
(a) including all ports# successful destinations
1 10 100 1000 10^4 10^5
1
10
100
1000
10^4
10^5
10^6
# un
succ
essf
ul d
estin
atio
ns
(b) only including 14 likely scan ports
Fig. 1. Scatter plot showing number of successful vs. unsuccessful connections with remote IPsper DSL line, computed for a single day of the ISP trace. The size of the circles is proportionalto the number of lines having the corresponding ratio.
system to manifest malicious activity if it unsuccessfully contacts at least two remotehosts on more than 50 ports within a single day.
Spamming. Another manifestation of malicious activity concerns local hosts sendingspam. To find an appropriate indicator for classifying a host as a spammer, we exam-ined SMTP activity of local systems in terms of how many remote SMTP servers theycontact. The number of distinct SMTP servers can be an indicator since we do not ex-pect many users to run their own SMTP servers, but instead to rely on a (small) numberof e-mail providers to deliver their mails. Particularly in the ISP environment, e-mailproviders are necessary since the IP range of the monitored DSL lines is dynamicallyassigned and many SMTP servers generally reject mails from any dynamic addressesunless specifically authenticated. We find that DSL lines consistently contact either lessthan 25 SMTP servers or more than 100. Indeed, most lines contact less than 10. Weultimately classify a system as a spammer if it contacts> 100 distinct SMTP servers inone day.
Known malware families. We can also observe manifestations of host compromiseby flagging activity related to known malware families. To do so, we focused on Zlob,Conficker, and Zeus.The Zlob malware family [24] changes the DNS resolver settings of infected hosts
(and even broadband routers), altering them to a well-known set of malicious remotesystems. We thus classify a system as reflecting a Zlob infection if it uses one of thoseknown DNS resolvers. We note that Zlob targets both Windows and Mac systems, sub-verting systems using social engineering in the guise of a fake codec download.Another malware family that has attracted much attention is Conficker [15]. For
April 2010, the Conficker Working Group [4] reported 5–6M distinct Conficker A+Binfected IPs and 100–200K distinct Conficker C infected IPs. Note however that thenumber of IPs does not necessarily provide a good estimation of the population size

due to aliasing. The group estimates the true population size to be between 25–75% ofthe IP addresses seen per day.To find rendezvous points, Conficker A and B generate a list of 250 different domain
names each day (Conficker C uses 50,000 domains) and then try to resolve them. Sincethe algorithm for generating the domain names is known [22], we can compute therelevant domain names for our observation periods and check which local hosts try toresolve any of these. To account for potential clock skew on the client machines, wealso include the domain names for the days before and after our observation period.Conficker C sometimes generates legitimately registered domains, due to its fre-
quent use of very short names. To rule out false positives, we therefore only flag a sys-tem as manifesting a Conficker infection if it issued ≥ 50 lookups for known Confickerdomains. We note that Conficker also uses address-scanning to find other vulnerablemachines and spread itself. Thus, we expect to find a correlation between address scan-ning and Conficker lookups.We use the Zeus Domainblocklist [25] to identify local systems infected with Zeus.
Since the list does not only contain seemingly random domain names but also some in-dicating scare-ware (e. g., updateinfo22.com) or typo squatting (e. g.,google-analytiics.cn), we require ≥ 4 lookups per system and day to classify asystem as infected. We found that fewer lookups often reflect embedded ads or otherartifacts not due to compromise. Since we initially lacked a continuous feed of the Zeusdomain list, we used a one-day snapshot from Mar 23, 2010 for the ISP trace and Air-Jaldi1/AirJaldi2. We used another snapshot from May 6, 2010 for LBNL and AirJaldi3.For Univ, we were able to continuously update the list during the measurement period.
Alternative Manifestations of Compromised Systems. We also examined further al-ternative approaches to detect compromised systems, which however did not turn out togenerate sufficiently reliable results.One obvious approach is to leverage a NIDS’ output directly. Consequently, we
attempted using a standard signature set: the Emerging Threats rules [7] loaded intoSnort [18]. We excluded all rules that are labeled as aiming at finding “inappropriate”activity (e. g., gaming traffic or P2P) as such is not in scope for our study. Still, analyzinga single day of ISP traffic, we get more than 1 million hits, flagging more than 90% ofthe monitored local systems. Clearly, such results have to include many false positives.We can reduce the number of hits by restricting the analysis to examine only out-
bound activity, and whitelisting rules that are likely to flag benign activity. However,Snort still reports too many alarms to be a reliable indicator for us. The main problemswith the Emerging Threats rules are their sheer size (more than 3,500 rules in total), anda general lack of documentation (many rules are not documented at all). In particular,the rules do not include any indication on how tight they are (i. e., what their likelihoodof false positives is), nor how severe one should consider the activity they target (e. g.,is this rule triggered by a C&C channel or by adware).Another approach we tried as an indicator of likely system compromise is check-
ing whether a local system’s IP address appears on an anti-spam blacklist, such asSpamhaus. However, we find that doing so proves difficult in our settings: address as-signments are dynamic and can often reflect numerous different hosts over short timeintervals. Thus a single blacklist entry can tar the reputation of many distinct local

systems. In addition, some anti-spam providers proactively blacklist all dynamicallyassigned IP address ranges.
3 Security Hygiene and Risky Behavior
To analyze whether residential users are aware of potential hazards and take recom-mended countermeasures, we analyze (i)whether local systems use anti-virus scanners;(ii) if they regularly update their OS software (e. g., Windows Update); and (iii) whetherthey download Google’s Safe Browsing blacklist.Most anti-virus and OS software updates are done using HTTP, and they use spe-
cific user-agents and/or HTTP servers. Searching for those allows us to classify a localsystem as a software updater and/or anti-virus user. Likewise, the HTTP servers servingGoogle’s blacklist are well-known, and we can thus identify local systems which usethe blacklist. Moreover, we also check if local systems downloading the blacklist stillrequest any blacklisted URLs. Such behavior clearly has to be considered risky. Forfinding such “bad” requests, we determine whether a requested URL was blacklisted atthe time of the request by keeping a local change history of the blacklist over the courseof our measurement interval.We note that me might over-estimate the number of actual OS or anti-virus updates.
OS updaters often only check whether an update is available and then ask the user toinstall it, however the user might decline to do so. Likewise, anti-virus products mightdownload (or check for) new signatures but not use them unless the user has a currentlicense for the anti-virus software. Our analysis flags these cases as anti-virus user andOS updater respectively. However, we cross-checked our results by only considering alocal system as anti-virus user if the anti-virus software transferred at least 1MB and100KB of HTTP body data.
3.1 European ISP
Figure 2 shows the fraction of active DSL lines vs. lines performing anti-virus or OSupdates. On any given day 57–65% of DSL lines performOS software updates, and 51–58% update their anti-virus signatures (or engines). From the cumulative data we seethat over the 14 day observation period up to 90% of lines check for updates to their OSand 81% use anti-virus software. This highlights that the user-base in principle exhibitselementary “security hygiene” and performs recommended precautions.When focusing on DSL lines exhibiting exclusively MacOS activity, we find that up
to 2% do anti-virus updates and up to 78% perform software updates.But what about risky behavior such as requesting potentially dangerous URLs?
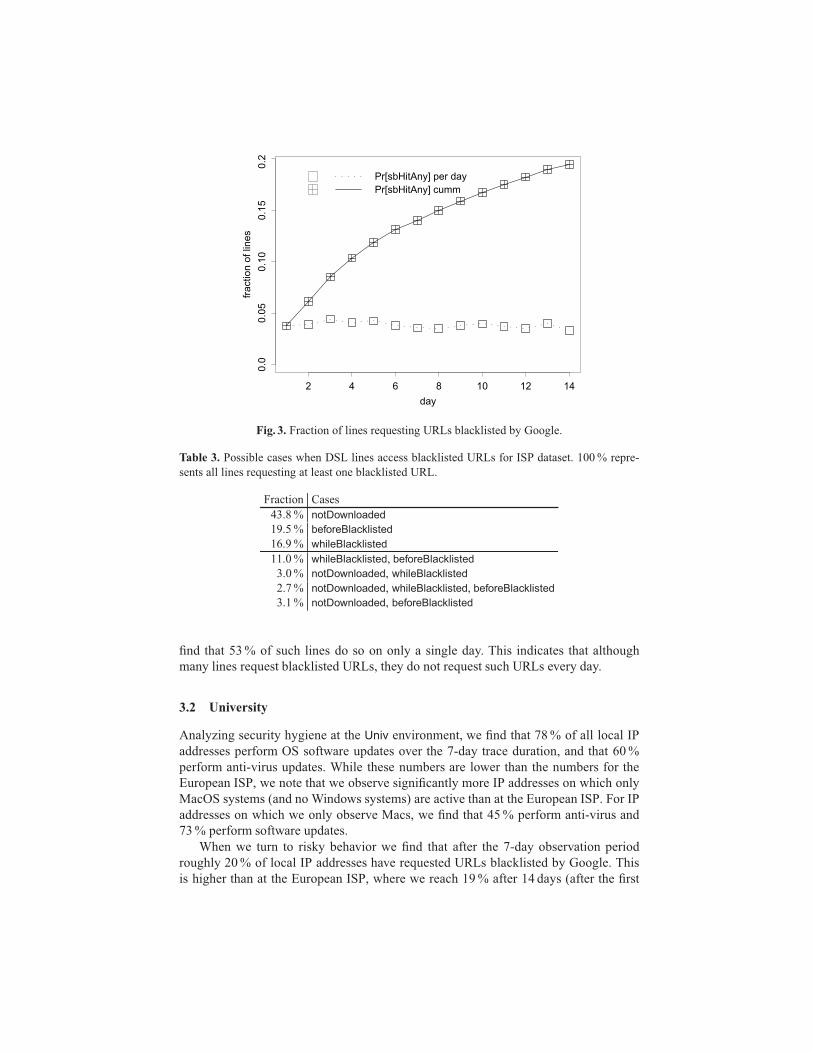
Overall, we find that only about 0.03% of all HTTP requests appear on Google’s SafeBrowsing blacklist. However, investigating the per-DSL line behavior, we find that onany given day up to 4.4% of the DSL lines request at least one blacklisted URL (seeFigure 3). Across the whole 14-day period we see that a striking 19% of lines requestat least one blacklisted URL.To check if the browser may have warned the user about doing these requests, we
next examine if the user-agent placing them actually downloaded the blacklist from

day
fract
ion
of li
nes
2 4 6 8 10 12 14
0.10.20.30.40.50.60.70.80.91.0
active daydidAV daydidSW update day
active cummdidAV cummdidSW update cumm
Fig. 2. Fraction of active lines, lines with anti-virus updates, and software updates for daily andcumulative data sets from the ISP.
Google earlier. For doing so, we distinguish three cases when a user accesses a black-listed URL:
– notDownloaded: The browser did not download the blacklist at all, thus the usercould not have been warned.
– beforeBlacklisted: The browser downloaded the blacklist, however the URL wasrequested before it appeared on the blacklist, thus the user could likewise not havebeen warned.2
– whileBlacklisted: The browser downloaded the blacklist and requested the URLwhile it was blacklisted. That is, the user placing the request (presumably by click-ing on a link) should have been warned by the browser that the URL is consideredmalicious.
In Table 3 we list for each combination of cases the fraction of DSL lines exhibitingthis combination. We find that for the majority of lines requesting blacklisted URLs thebrowser either did not download the blacklist (notDownloaded), or the request occurredbefore the URL was blacklisted and thus the browser could not have warned the userabout the URLs potential malignity. However, we find a significant number, 33.6%,of DSL lines that request blacklisted URLs even though the users should have beenwarned by their browsers (any combination in which whileBlacklisted is present). Whenwe investigate how often DSL lines request URLs that are on Google’s blacklist, we2 We allow for a 1 hr grace period, relative to the time when a URL has appeared on our localcopy of the list. Google suggests that browser developers implement a 25–30minute updateinterval for the blacklist. Furthermore, Google states that a warning can only be displayed tothe user if the blacklist is less than 45minutes old, thus forcing browsers to regularly updatethe list.
day
fract
ion
of li
nes
2 4 6 8 10 12 14
0.0
0.05
0.10
0.15
0.2
Pr[sbHitAny] per dayPr[sbHitAny] cumm
Fig. 3. Fraction of lines requesting URLs blacklisted by Google.
Table 3. Possible cases when DSL lines access blacklisted URLs for ISP dataset. 100% repre-sents all lines requesting at least one blacklisted URL.
Fraction Cases43.8% notDownloaded19.5% beforeBlacklisted16.9% whileBlacklisted11.0% whileBlacklisted, beforeBlacklisted3.0% notDownloaded, whileBlacklisted2.7% notDownloaded, whileBlacklisted, beforeBlacklisted3.1% notDownloaded, beforeBlacklisted
find that 53% of such lines do so on only a single day. This indicates that althoughmany lines request blacklisted URLs, they do not request such URLs every day.
3.2 University
Analyzing security hygiene at the Univ environment, we find that 78% of all local IPaddresses perform OS software updates over the 7-day trace duration, and that 60%perform anti-virus updates. While these numbers are lower than the numbers for theEuropean ISP, we note that we observe significantly more IP addresses on which onlyMacOS systems (and no Windows systems) are active than at the European ISP. For IPaddresses on which we only observe Macs, we find that 45% perform anti-virus and73% perform software updates.When we turn to risky behavior we find that after the 7-day observation period
roughly 20% of local IP addresses have requested URLs blacklisted by Google. Thisis higher than at the European ISP, where we reach 19% after 14 days (after the first
7 days the European ISP environment reaches 14%). Similar to the ISP we find that36.4% of the IPs requesting blacklisted URLs do so although the browser should havewarned the user.
3.3 AirJaldi
Comparing security hygiene at the European ISP with the AirJaldi network in India,we find them quite similar. In terms of HTTP requests, we find that at AirJaldi ap-proximately 0.02% are blacklisted by Google (European ISP: 0.03%), and 0.5–1.12%are related to anti-virus software (European ISP: 1%). For OS software updates, thenumbers differ more: up to 2.8% of all HTTP requests at AirJaldi, vs. only 0.3% atthe European ISP. Assessing security hygiene on a per host basis is difficult in thisenvironment, however, given the layered NAT structure. We find that 29.6%–40.7%of the observed sites at AirJaldi perform anti-virus and OS software updates, and 3.8–5.4% request blacklisted URLs. Recall, however, that each site can connect anywherebetween a handful and several hundred users.
3.4 LBNL
We next turn to security hygiene at LBNL. We find relatively few hosts there updatinganti-virus software (24%) or operating systems (31%). This can be explained how-ever by the fact that LBNL uses centralized, internal update servers. The operatingsystem distribution also differs notably from the ISP environment, with significantlymore Linux and Mac hosts in use at LBNL. Turning to risky behavior, we find that only0.01% of all HTTP requests are blacklisted. In terms of the fraction of hosts requestingblacklisted URLs, we also find a smaller number than at the European ISP: up to 0.92%of hosts per day and less 1.25% overall. However, we find that users at LBNL still re-quest blacklisted URLs even though they should have been warned by their browser;23.4% of IPs requesting blacklisted URLs do so.
4 Malicious activity
After finding that even though users appear to be security aware and take appropriateprecautions they still engage in risky behavior, we now use our indicators for identify-ing malicious behavior. Moreover, we also study the influence of security awareness,risky behavior, NAT deployment, and operating systems on infection probability. Weemphasize that the overall estimate of malicious activity that we derive can only be alower bound of the total present in these environments.We start by studying the characteristics of the DSL customers of the European ISP
since that is our richest data set. We then compare the results from the European ISPwith those from the university dorms (Univ), the AirJaldi community network, and theLBNL setting, as applicable.

day
prob
abili
ty [%
]
2 4 6 8 10 12 14
0.0
0.2
0.4
0.6
0.8
1.0
1.2
Pr[isbad] per dayPr[isbad] cumm
Fig. 4. Probability that a line triggers malicious activity indicators (isbad) for the ISP, shownseparately for the daily and cumulative data sets.
4.1 European ISP
Figure 4 shows the likelihood that a DSL line triggers any of the malicious activityindicators for the European ISP. We find that both on a per-day basis as well as overallonly a small fraction of local systems manifest overtly malicious activity; < 0.7% and< 1.3%, respectively. Moreover, these percentages do not vary much across days.However, even though the cumulative probabilities remain small, they are increasing
over our 14-day period. This indicates that over time we are able to identify more linesthat manifest malicious activity, and it may imply that longer observation periods wouldreveal even more lines manifesting such activity.We find that overall the malware families and spammers contribute most to the
observed manifestations of compromised systems, while scanners are less prominent;see Table 4. On a per-day basis, only the malware-based indicators are prominent.More than 44% of the spammers are only active on a single day, i. e., they trigger the
indicator only on a single day. In contrast, only 11% of the scanning activity is limitedto a single day. On average (mean and median) scanners are seen for 4 days.For most indicators, we observe a difference between the mean number of days that
the indicator is triggered and the median number of days. This indicates that there is noconsistent behavior by the local systems manifesting malicious activity. Indeed, an in-depth analysis reveals that some spammers and scanners start their malicious behavioras soon as the DSL line becomes active, while others stop temporarily or are only activefor a short period. The fact that the malware families typically trigger on 5–8 days(mean) confirms that the bots engage in activity on a regular basis. However, maliciousactivity such as port scanning or spamming seems to be limited to sub-periods.We find only a small overlap among the lines that trigger any of the indicators. Most
lines that manifest malicious activity trigger only a single indicator (92%); about 7%

Table 4. Probability that a DSL line triggers a malicious activity indicator. The daily numberssummarize the range of the probability values per day. To estimate the persistence of the activity,we include the mean/median number of days that each indicator triggered and the percentage oflines for which the indicator triggered only on a single day.
Probability Activity prevalenceIndicator daily prob. cumm. prob. mean / median only single day activitySpam 0.03–0.10% 0.25% 3.6 / 2 days 44%Scan 0.01–0.06% 0.09% 4.3 / 4 days 11%Port Scan 0.01–0.03% 0.06% 3.5 / 2 days 39%Zlob 0.13–0.19% 0.24% 8.4 / 10 days 10%Conficker 0.17–0.26% 0.23% 6.5 / 6 days 27%Zeus 0.07–0.15% 0.28% 4.9 / 2 days 38%Total 0.50–0.66% 1.23% 5.9 / 4 days 28%
trigger two. There is some correlation (0.227) between lines that manifest Confickerand scanning activity, as we would expect due to Conficker’s regular network scans insearch of further vulnerable hosts. We also observe a correlation of 0.109 between DSLlines triggering the Spam and Zeus metrics.Next we check whether the likelihood that a local system manifests malicious ac-
tivity is influenced by other parameters.
Security Hygiene. We start our investigation by examining the impact of anti-virusdeployment and OS software updates. Surprisingly, we do not see any strong effectsin this regard. Anti-virus software does not noticeably reduce the likelihood of a DSLline manifesting malicious activity (1.10% with anti-virus vs. 1.23% without, consid-ering all indicators). We cross-check these numbers for a potential over-estimation byonly considering DSL lines that transferred at least 100KB (1MB) of anti-virus HTTPpayload, we find that still 1.06% (0.82% for 1MB) of lines trigger our metrics. Whilethe latter is a drop of roughly 30%, anti-virus software still seems less effective thanone might presume. Likewise, we do not observe any particular impact of performingOS updates. We verified that these findings are not biased by NATed DSL lines withmultiple hosts. That is, even for lines that do not show multiple hosts, the likelihood ofinfections is not significantly changed by using anti-virus or doing updates.
Google Blacklist. Given the large fraction of DSL lines requesting blacklisted URLs,we next study whether such behavior increases the chance of manifesting maliciousactivity (see Figure 5). Indeed, we find that the probability of a line triggering any ofour indicators rises by a factor of 2.5, up to 3.19% (from 1.23%) if we also observe thesame line requesting at least one URL found on Google’s blacklist. While in absoluteterms the elevated level still remains low, our indicators only track overt manifestationsof security issues, so the more salient takeaway concerns the more-than-doubled rate ofhost compromise for systems with poor “security hygiene”.
NAT. Next, we evaluate whether NAT influences the probability of triggering our mali-cious activity indicators.We find that DSL lines that connectmultiple hosts are 1.5 timesmore likely to trigger one (1.81%). Lines on which no NAT gateway is present are aslikely to trigger an indicator as all DSL lines.

day
prob
abili
ty [%
]
Pr[isbad] dayPr[isbad] cumm
Pr[isbad | sbHit] dayPr[isbad | sbHit] cumm
01
23
4
2 4 6 8 10 12 14
Fig. 5. Probability that a line triggers any malicious activity indicator (isbad) given it requested ablacklisted URL (BlkLst) for ISP.
Malicious activity on Macs. Next, we turn to DSL lines on which all traffic is fromMacs (2.7% of all lines) and evaluate their likelihood of manifesting malicious activity.When analyzing the full 14-day observation period, we find that Mac lines trigger oneof our indicators at less than half the rate of all systems (0.54% vs. 1.23%), and theydo so via a single indicator, infection with Zlob. In this regard, however, Macs are morethan twice as likely to manifest an infection as all systems (0.24%).These findings are somewhat difficult to interpret. They appear to suggest that in
general,Mac systems fare better thanWindows systems in terms of resisting infection—but possibly only because most infection targets only the latter, and when infectionalso targets Macs, they may in fact be more vulnerable, perhaps due to less securityvigilance.
4.2 University
We next turn to manifestations of malicious activity in the Univ dorm environment. Asthe dorm network provides central DNS resolvers to all local systems, we are not able toobserve DNS requests from local systems unless they specifically configure a different,external DNS resolver. This implies that we cannot use our DNS-based indicators (Con-ficker and Zeus) for directly identifying infected local systems. We are however able toobserve DNS requests from the central resolvers, allowing us to recognize whether anylocal systems are infected. Analyzing the DNS requests in Univ’s traffic, we find noConficker lookups at all, indicating that no hosts infected with Conficker were active(outside the containment network) during our measurement interval. We do howeverobserve lookups for Zeus domains.

When using the other indicators, we observe that only a few local systems (0.23%)manifest overtly malicious activity during our 7-day observation period. At the Euro-pean ISP, 1% of DSL lines manifest such activity over 7 days (1.23% over 14 days),and 0.8% excluding Zeus. In contrast to the European ISP, we find that port scannersat Univ contribute most to the overall number of local systems manifesting maliciousactivity. Scanners trigger on 0.13% of local systems and all other indicators combinedtrigger on 0.1% of local systems.We do not observe any local systems that trigger more than one of our malicious ac-
tivity indicators. This is however not surprising given that we cannot observe Confickerand Zeus activity. Recall that at the European ISP, these two tend to correlate most withother indicators.Similar to the European ISP, we find that risky behavior (requesting blacklisted
URLs) nearly doubles the rate of manifesting malicious activity, with the 0.23% overallfigure rising to 0.4% in that case. Again, we find that neither OS software nor anti-virusupdate activities affect the rate at which security problems manifest.
4.3 AirJaldi
Fig. 6. Summary of malicious activity and security hygiene for all AirJaldi traces.
Within the Indian AirJaldi network, we observe very limited malicious activity.However, given that AirJaldi uses a multi-tiered NAT hierarchy, we can only exploremalicious activity by customer site rather than per end-system. Within each trace weobserve between 188 to 263 active customers sites. Each customer site can connect

multiple, possibly hundreds, of hosts. However, exploring the number of destinationsfor scanners and spammers for each flagged site, we find that they are well within therange of what we observe at the European ISP. Therefore, we conclude that each of thereported scanning and spamming sites is likely due to a small number of infected hosts.Indeed, most likely it is due to a single one.Across all three traces only a total of 12 customer sites triggered any of our indica-
tors. Figure 6 summarize the results, listing all 12 customer sites that triggered any ofour indicators. An “X” indicates that a site was not observed in a particular trace. Wealso further annotate each site with labels based on whether any of its systems requestedblacklisted URLs (BLK), or updated anti-virus (AV) or OS software (SW).A detailed look at the spammers shows that site 11 contacted 56 remote SMTP
servers, less than our cutoff of 100. However, since no other site contacts more than10 SMTP servers, we flag this site as a likely spammer (Spam?) rather than a certainspammer (Spam).Only two sites trigger our malicious activity indicators in more than one trace. We
never observe more than 7 sites manifesting malicious activity in any single trace, andin only one case do we find multiple forms of malicious activity at a single customersite. We note that sites 4–7 are in the same /24 network and could potentially be a singlecustomer site using multiple IP addresses over the trace duration.Even though we cannot reliably determine the number of infected hosts at each
customer site, we can attempt to estimate it. For Conficker this is possible since eachinfected host will in general generate 250 DNS lookups per day. Thus we estimate thenumber of infected hosts by dividing the total number of Conficker lookups by 250. Welist the number of Conficker lookups per site in parentheses (Conficker(n)) in Figure 6.Given the inability to identify end hosts, we cannot soundly correlate activity levels,
anti-virus, OS software updates, or Google blacklist hits with malicious activity.
4.4 LBNL
At LBNL, our indicators trigger only for a small number of benign hosts. Not sur-prisingly, local mail servers are reported as “spammers”; and hosts deployed by theLab’s security group for penetration testing purposes are flagged as “scanners”. Whileconfirming that our detectors are working as expected, such false alarms are unlikelyto occur in the residential environments. Other than these, we do not find any furthermalicious activity reported at LBNL.
5 Related Work
In our study, we examine several manifestations for malicious activity including scan-ning and spamming which are established indicators of compromised systems. Mostnetwork intrusion detection systems (NIDS), such as the open-source systems Snort [18]and Bro [14], use simple threshold schemes to find scanners. Bro also provides a moresensitive detector, Threshold Random Walk [10], that identifies scanners by tracking asystem’s series of successful and failed connection attempts. However, existing detec-tors do not work well for finding outbound scans, as needed for our study.

Spamming is often countered by blocking known offenders via DNS-based black-lists, such as SORBS [19] or Spamhaus [21]. However, due to the high IP addresschurn we experience (for example, due to DSL lines frequently changing their IP ad-dress [11]), such blacklists do not provide us with a reliable metric. Furthermore, manyblacklists include the full dynamic IP space. Ramachandran et al. [17] identify spam-mers by observing the destinations they try to connect to. This eliminates the need forcontent inspection. The Snare system [9] extends this approach by building a reputation-based engine relying on additional non-payload features. These approaches, however,deploy clustering algorithms, and thus rely on suitable training sets, which are not avail-able for our data set.We also check our data sets for indicators of specific malware, all of which are ana-
lyzed and tracked in detail by other efforts: Conficker [4,15]; Zlob [24]; and Zeus [25].For example, Bailey et al. [2] survey botnet technology and Dagon et al. [5] examinemalware that changes a client’s DNS resolver, including the Zlob trojan.Carlinet et al. [3] ran Snort on DSL traffic from about 5,000 customers of a French
ISP to study what contributes to a user’s risk of being infected with malware. For theirstudy, Carlinet et al. simply removed the 20 Snort signatures triggering the most alarms.However, they do not further analyze how the remaining signatures contribute to theoverall results, what their false-positive rate is, or whether there is relevant overlapbetween them.We also leverage Google’s Safe Browsing blacklist [8]; the approach used for col-
lecting the blacklist is originally described by Provos et al. in [16].Stone-Gross et al. [20] try to identify malicious (or negligent) Autonomous Sys-
tems (AS). They analyze data from their honeyfarm to identify IP addresses of botnetC&C servers and use four data feeds to find IP addresses of drive-by-download hostingservers and phishing servers. They correlate the information from these sources and thelongevity of these malicious servers to compute a “malicious score” for the ASes host-ing such malicious servers. ASes with high scores can then be blacklisted or de-peeredby other ISPs or network operators. Thus their focus is on the hosting infrastructurerather than individual infected machines.There has been some work on the prevalence of individual malware. The Conficker
Working Group states that 3 million infected hosts is a “conservative minimum esti-mate”, and it cites the study of an anti-virus vendor that finds that 6% of the monitoredsystems are infected. Weaver [23] estimates the hourly Conficker C population size inMarch/April of 2009 to average around 400-700K infections.
6 Conclusion
In this work we have aimed to develop first steps towards understanding the extent ofsecurity problems experienced by residential users. Such studies face major difficultiesin obtaining in-depth monitoring access for these users. To this end, we have madepartial progress by acquiring network-level observations for tens of thousands of users.However, we lack direct end-system monitoring, and as such in this study we mustlimit our analysis to security issues that overtly manifest in network traffic. On the otherhand, we were able to obtain such observations from a number of sites that differ in

size, geographic location, and nature of the residential users. This diversity then givesus some initial sense of what facets of the residential security experience appear to holdregardless of the specific environment, and what relationships we find behind differentfacets of each environment and the differing behavior of individual users.In this regard, our analysis develops a number of findings:
– A typical residential system is unlikely to engage in scanning or spamming, nor tocontact known botnet command-and-control servers.
– Residential users generally exhibit good “security hygiene”: many of them updatetheir systems regularly and deploy anti-virus software.
– However, such hygiene does not appear to have much impact on the likelihood ofbecoming infected with malware.
– A significant subset of users exhibit risky behavior: they contact malicious siteseven though, as best as we can deduce, their browsers have warned them in advance.
– Such risky behavior roughly doubles the likelihood of becoming infected with mal-ware.
Our range of data sets allows us to also infer relative comparisons between differentresidential environments. Our main finding in this regard is that seemingly quite differ-ent sites—a European ISP, a US university dorm complex, and a rural Indian network—all exhibit similar levels of both security hygiene and risky behavior. Fairly assessinglevels of overt malicious activity across these environments is challenging, in part dueto ambiguity and limited information for the rural Indian network and limited observ-ability (no DNS based metrics) at the Univ dorm environment. However, for both theEuropean ISP and the Univ environment often only a single indicator manifests per lo-cal system. In contrast, for our baseline system at LBNL, we do not observe any overtmalicious activity, and significantly less risky behavior.Finally, our work establishes that much more detailed data will be required to build
up a fully comprehensive picture of security issues in residential environments.We haveshown that overt malicious activity is in fact fairly tame for these networks. The next,very challenging, step is to determine how to construct a sound understanding of covertmalicious activity.
7 Acknowledgments
We would like to thank Yahel Ben-David of AirJaldi for helping us with the AirJaldinetwork and the anonymous reviewers for their valuable comments. We would also liketo thank our data providers: the European ISP, the US University, the AirJaldi network,and the Lawrence Berkeley National Laboratory.This work was supported in part by NSF Awards CNS-0905631 and NSF-0433702;
the U.S. Army Research Laboratory and the U.S. Army Research Office under MURIgrant No. W911NF-09-1-0553; a grant from Deutsche Telekom Laboratories Berlin;and a fellowship within the postdoctoral program of the German Academic ExchangeService (DAAD). Opinions, findings, and conclusions or recommendations are those ofthe authors and do not necessarily reflect the views of the National Science Foundation,the U.S. Army Research Laboratory, the U.S. Army Research Office, or DAAD.

References1. AIRJALDI NETWORK. http://www.airjaldi.org.2. BAILEY, M., COOKE, E., JAHANIAN, F., XU, Y., AND KARIR, M. A survey of botnettechnology and defenses. In Proc. Cybersecurity Applications & Technology Conference forHomeland Security (2009).
3. CARLINET, Y., ME, L., DEBAR, H., AND GOURHANT, Y. Analysis of computer infectionrisk factors based on customer network usage. In Proc. SECUWARE Conference (2008).
4. CONFICKER WORKING GROUP. http://www.confickerworkinggroup.org.5. DAGON, D., PROVOS, N., LEE, C. P., AND LEE, W. Corrupted DNS resolution paths: Therise of a malicious resolution authority. In Proc. Network and Distributed System SecuritySymposium (NDSS) (2009).
6. DREGER, H., FELDMANN, A., MAI, M., PAXSON, V., AND SOMMER, R. Dynamicapplication-layer protocol analysis for network intrusion detection. In Proc. USENIX Se-curity Symposium (2006).
7. EMERGING THREATS. http://www.emergingthreats.net/.8. GOOGLE. Google safe browsing API. http://code.google.com/apis/safebrowsing/.9. HAO, S., FEAMSTER, N., GRAY, A., SYED, N., AND KRASSER, S. Detecting spammerswith SNARE: spatio-temporal network-level automated reputation engine. In Proc. USENIXSecurity Symposium (2009).
10. JUNG, J., PAXSON, V., BERGER, A., AND BALAKRISHNAN, H. Fast portscan detectionusing sequential hypothesis testing. In Proc. IEEE Symp. on Security and Privacy (2004).
11. MAIER, G., FELDMANN, A., PAXSON, V., AND ALLMAN, M. On dominant characteristicsof residential broadband internet traffic. In Proc. Internet Measurement Conference (IMC)(2009).
12. MAIER, G., SCHNEIDER, F., AND FELDMANN, A. NAT usage in residential broadbandnetworks. In Proc. Conf. on Passive and Active Measurement (PAM) (2011).
13. MAIER, G., SOMMER, R., DREGER, H., FELDMANN, A., PAXSON, V., AND SCHNEI-DER, F. Enriching network security analysis with time travel. In Proc. ACM SIGCOMMConference (2008).
14. PAXSON, V. Bro: A system for detecting network intruders in real-time. Computer NetworksJournal 31, 23–24 (1999). Bro homepage: http://www.bro-ids.org.
15. PORRAS, P., SAIDI, H., AND YEGNESWARAN, V. An analysis of Conficker’s logic andrendezvous points. Tech. rep., SRI International, 2009.
16. PROVOS, N., MAVROMMATIS, P., RAJAB, M. A., AND MONROSE, F. All your iFRAMEspoint to us. In Proc. USENIX Security Symposium (2008).
17. RAMACHANDRAN, A., FEAMSTER, N., AND VEMPALA, S. Filtering spam with behavioralblacklisting. In Proc. ACM Conf. on Computer and Communications Security (CCS) (2007).
18. ROESCH, M. Snort: Lightweight intrusion detection for networks. In Proc. Systems Admin-istration Conference (LISA) (1999).
19. SORBS. http://www.au.sorbs.net.20. STONE-GROSS, B., KRUEGEL, C., ALMEROTH, K., MOSER, A., AND KIRDA, E. FIRE:
FInding Rogue nEtworks. In Proc. Computer Security Applications Conference (ACSAC)(2009).
21. THE SPAMHAUS PROJECT. http://www.spamhaus.org.22. UNIVERSITAT BONN. http://net.cs.uni-bonn.de/wg/cs/applications/
containing-conficker/.23. WEAVER, R. A probabilistic population study of the Conficker-C botnet. In Proc. Conf. on
Passive and Active Measurement (PAM) (2010).24. WIKIPEDIA. Zlob trojan. http://en.wikipedia.org/wiki/Zlob_trojan.25. ZEUS TRACKER. https://zeustracker.abuse.ch.