an assessment of health outcomes among orphans in the
TRANSCRIPT

An Assessment of Health Outcomes Among Orphans in the Positive Outcomes for Orphans Study in Rural Settings of Kenya and Tanzania
by
Dunstan Eugine Achwoka
Duke Global Health Institute
Duke University
Date: _____________________
Approved:
_________________________
Nathan Thielman, Supervisor
_________________________
Wendy O'Meara
_________________________
Mabel Nangami
Thesis submitted in partial fulfillment of the requirements for the degree of Master of Science in the Duke Global Health Institute in the Graduate School of Duke
University
2011

ABSTRACT
An Assessment of Health Outcomes Among Orphans in the Positive Outcomes for Orphans Study in Rural Settings of Kenya and Tanzania
by
Dunstan Eugine Achwoka
Duke Global Health Institute
Duke University
Date: _____________________
Approved:
_________________________
Nathan Thielman, Supervisor
_________________________
Wendy O'Meara
_________________________
Mabel Nangami
An abstract of a thesis submitted in partial fulfillment of the requirements for the degree of Master of Science in the Duke Global Health Institute in the Graduate
School of Duke University
2011

Copyright by
Dunstan Eugine Achwoka
2011

iv
Abstract
Objectives: To compare measures of health and health quality between
Orphans and Vulnerable Children (OVC) in different living arrangements--
institutional and community care; and to correlate different measures of OVC
health and health quality using clinical, laboratory and quality of life instruments.
Design: Cross-sectional study.
Setting: Two rural districts (sites) in East Africa, Bungoma in Kenya, and
Kilimanjaro in Tanzania.
Participants: 77 male and 45 female OVC aged 16-18 years (N=122).
Participants, who had attained a minimum age of 16 at the date of interview,
were selected from the larger sample of OVC in the Positive Outcomes for
Orphans (POFO) study. POFO, a longitudinal study in five less wealthy countries
that started in 2006, obtained its sample through cluster randomization.
Methods: To obtain self-ratings of OVC physical health, OVC responded to an
interviewer administered SF-36 questionnaire, a multipurpose generic measure
of health status. A neutral examiner then measured OVC physical health using 4
clinical variables: a physical health examination, body mass index, hemoglobin
level, and the Harvard physical fitness score.
Main Outcome Measures: SF-36 scores presented as a two component score-
the physical health and mental health composite sub-scores. For physical health,

v
normal findings for age were considered as meeting the threshold for good
physical health.
Results: Of the 122 OVC, 89 (73%) lived in the community while 33 (27%) lived
in institutional settings. For the SF-36, the mean physical composite score for the
entire study population was 50.6 (SD=6.2). Mean body mass index (BMI) was
19.3 (SD=2.4). Mean hemoglobin was found to be 13.2g/dl (SD=1.8). The
average Harvard physical fitness score was found to be 40.7(SD=16.9).
Pearson’s correlations between SF-36 Physical Functioning and hemoglobin,
BMI, and the Harvard Step-Test fitness score were 0.1, 0.1, and -0.1
respectively. There was no evidence that self-rating of OVC health outcomes
differed by living arrangement. Using paired t-tests for continuous variables and
chi-square tests for categorical variables, no significant p- values were obtained
at the 95% level. Using a threshold of vision 20/20 for normal vision, 91.0% of
community OVC and 78.8% of OVC in institutions had normal vision (p=0.07).
Conclusion: Although this study did not detect significant differences in self-
reported measures of health among OVC in different living arrangements,
physical examination revealed a slightly high incidence of poor vision among
those living in institutions. In this sample, the correlations between SF-36
physical functioning sub-score and 3 physical health outcomes of BMI,
hemoglobin, and the Harvard Step-test fitness score were weak.

vi
Dedication
To my dear family: My wife Ruth, my daughter Neema, and my son Leon.
You are the strongest pillar in my life.

vii
Contents
Abstract ................................................................................................................iv
List of Tables ...................................................................................................... viii
List of Figures .......................................................................................................ix
Acknowledgements .............................................................................................. x
1. Introduction ....................................................................................................... 1
2. Methods and Materials ..................................................................................... 3
2.1 Field-site Description................................................................................... 3
2.2 Sampling ..................................................................................................... 3
2.3 Measures .................................................................................................... 5
2.3.1 General Health ..................................................................................... 5
2.3.2 Health Assessment............................................................................... 6
2.4 Change in Methodology .............................................................................. 7
2.5 Analysis ....................................................................................................... 8
3. Results ............................................................................................................. 9
3.1 Demographic Characteristics ...................................................................... 9
3.2 Health Characteristics ............................................................................... 10
3.3 Multivariate Analysis ................................................................................. 13
4. Discussion and Conclusion............................................................................. 16
Appendix A: Health Examination Questionnaire ................................................. 20
Appendix B: Child Health and SF-36 Questionnaire ........................................... 22
Appendix C ......................................................................................................... 27
I. Duke IRB approval .................................................................................... 27
II. KEMRI IRB Approval ............................................................................. 28
III. KCMC IRB Approval .............................................................................. 29
Appendix D: Consent Forms............................................................................... 30
I. In English .................................................................................................. 30
II. In Swahili ............................................................................................... 33
References ......................................................................................................... 37

viii
List of Tables
Table 1. Sociodemographic Characteristics of Study Participants ………………9
Table 2. Differences in Health Outcomes Among OVC in Community and Institutional Settings ………………………………………………………………… 11
Table 3. Mean Item scores for items of the SF-36 Physical Functioning scale in Study Participants and other Studies from Tanzania and the US ………………13

ix
15
12
14
14
15
List of Figures
Figure 1. SF-36 Scores of Study Participants (n=122) …………………………
Figure 2. Comparison of Study Participants’ (n=122), SF-36 Physical Sub-scores with Hemoglobin Levels by Gender ………………………………………………
Figure 3. Comparison of Study Participants’ (n=122), SF-36 Physical Functioning Sub-scores with BMI by Gender ……………………………………………………
Figure 4. Comparison of Study Participants’ (n=122), SF-36 Physical Functioning Sub-scores with Harvard Step-Test Fitness scores by Gender …………………
Figure 5. Comparison of Study Participants’ (n=122), Harvard Step-Test Fitness Score with BMI by Gender …………………………………………………………

x
Acknowledgements
To see this thesis come to fruition, has involved the tireless efforts of
many special people who deserve acknowledgement. First, is Ann Lurie; for
sponsoring my education at Duke and remaining interested in my academic
progress. Ann, you sure have a heart of gold, and I remain forever indebted to
you for facilitating my dream.
The entire faculty at Duke Global Health Institute (DGHI), from whom I
benefitted greatly, also deserves special mention. I have benefited from their
diligence, unwavering support, and innovative problem-solving skills as they work
towards ensuring the program at Duke remains world-class. And although I owe
something to most of you, I wish to mention just a few of the most memorable
names: Chris Woods (Course Director), Sarah Martin, and Sammy Tchwenko.
I have also learnt a great deal from my cohort members at DGHI. Ours
was a closely knitted cohort, extremely talented, with varied and exciting
interests. I wish you well in your endeavors as your set off in your future careers.
I wish to also thank my research committee for their helpful suggestions,
advice, multiple reviews of my draft manuscripts and detailed comments: Nathan
Thielman, both my supervisor and mentor; Wendy O’Meara; and Mabel
Nangami.
I have benefitted immensely from the work of Positive Outcomes for
Orphans (POFO) study researchers, field personnel and partner organizations—
ACE-Africa and the Tanzania Women Research Foundation, (TAWREF). All of

xi
you work diligently and have been instrumental in the success of my work. I pay
special gratitude to all of you. Again, I wish to mention just a few memorable
names: Kate Whetten, Lynne Messer, Brian Pence, Amy Hobbie, Augustine
Wasonga, Cyrilla Were and Berny Agala.
Finally, and not the least, I am thankful for all my friends and family who
stood with me throughout the course of my studies. I appreciate all your prayers
and good wishes. Without your constant support, I certainly would not have made
it this far. Thank you.

1
1. Introduction
The population of Orphans and Vulnerable Children (OVC) has been on
the rise in recent years [1]. Thirty years on, the HIV/AIDS pandemic continues to
fuel the OVC crisis, and in Sub-Saharan Africa, it remains the leading cause of
new orphans [1, 2]. With most of these children living in resource poor settings,
policy makers have increasingly become concerned on OVC future outcomes. In
particular, OVC health outcomes are now taking a center stage presence.
Several studies on OVC, albeit in retrospect, continue to report mixed
health outcomes [3-7]. To determine the physical health of orphans under their
custody, most of these studies use proxy-reports of caregivers [7, 8]. In some of
these studies, the Cinderella hypothesis, the notion that caregivers may prioritize
their own children over the fostered child, has been sustained [5]. A few studies
have also assessed OVC physical health using OVC self–reports [9]. In the
Positive Outcomes for Orphans Study (POFO), among caregivers and pre-
adolescents OVC, Whetten and colleagues (2010), demonstrate a strong direct
correlation for poor health between caregiver reports of health and OVC reports
of health. Caregivers who reported poor health were more likely to report poor
health in OVC under their custody [10]. Thus, most studies among pre-
adolescents that utilize both self and proxy reports reveal a positive correlation.
In contrast, studies on quality of life and health outcomes in older school-
going children and adolescents that utilize both proxy and self-reports, at best,
obtain fair to moderate concordance [11]. Considering, the numerous challenges

2
that adolescent OVC face, such as an increased risk of early sexual debut as
compared to their non-orphans counterparts , this low concordance bears
important implications for policy and healthcare and highlights the need to
explore measures of adolescent orphan health more fully [2, 12].
Assessing health outcomes for teenage OVC represents an opportunity
for informing policy and planning. Yet in the literature of teenage OVC health
outcomes, a dearth exists. Currently, most research on adolescents OVC health
either utilizes generic measures to assess general health or assesses specific
health conditions. To date, studies that attempt to obtain health outcomes among
teenage orphans through a holistic approach incorporating the child, the
caregiver and a neutral professional examiner are lacking.
Through this study, I seek to address this gap in the literature by
combining both generic health measurement using the Short Form 36 (SF-36)
tool and a comprehensive health assessment. The latter includes a physical
health examination, anthropometric measurement of body mass index,
determination of hemoglobin level, and the Harvard Step physical fitness test.
For this paper, I examined the following two questions:
a. Are there differences in health measures between teenage OVC living in
the community when compared to those living in institutions?
b. How does OVC health correlate with different measures of health and
health quality using clinical, laboratory and quality of life instruments?

3
2. Methods and Materials
2.1 Field-site Description
A cross sectional survey was conducted among orphans enrolled in rural
sites of the Positive Outcomes for Orphans Study (POFO), in 2 East-African
countries – Kenya and Tanzania. Other than the two countries, the POFO study
has enrolled participants from 3 more countries: Ethiopia, Cambodia, and India.
This multi-country study is longitudinal in nature and seeks positive outcomes for
orphans in multiple dimensions, among which is health. In Kenya, the interviews
and health examinations were conducted from May 2010 to July 2010 in
Bungoma District of Western province. In Tanzania, interviews and health
examinations were conducted in Moshi on the Kilimanjaro region in September
2010. Descriptions of the two rural sites in both Kenya and Tanzania, are found
elsewhere [13].
2.2 Sampling
POFO participants enrolled into this study, had been previously selected
through a two stage randomization at the country level, and cluster
randomization at the institution and community levels [14]. Additionally,
participants of either gender, had to meet the following criteria: 1) be registered in
the POFO database, 2) be 16 years of age or more, at the time of the interview
and health examination , and, 3) be either living in an institution or the
community. Participants found to be pregnant, with physical disabilities or

4
illnesses that constrained their performance of physical exercise, were excluded
from the Harvard Step fitness test.
At the commencement of the data collection, a query was made on the
POFO database. In Bungoma, there were 98 eligible orphans for the study, while
in Moshi there were 151 eligible orphans. Two interviewers and the researcher
contacted 61 orphans (62.2%) in Bungoma. We were unable to make contact
with 37 orphans for the following reasons: 1) 13.2% of the orphans who study in
boarding schools and distant locations (outside the region), were unavailable
until official school break; 2) 20.5% were lost to follow-up; and 3) 4.1% were not
reached despite three visits to their last known location. Similarly, in Moshi 61
orphans (40.4%) were contacted. We were unable to make contact with 94
orphans for the following reasons: 1) 20.5% of the orphans study in boarding
schools and were inaccessible until official school break; 2) 6.6% declined to
participate in the study; and 3) 32.5% had migrated to other towns in Tanzania.
The total sample size in both Kenya and Tanzania was 122 orphans.
Research protocols for this study were approved alongside those of
Round 8 of the POFO study by ethical review committees at Duke University,
Kenya Medical Research Institute (KEMRI), and the Kilimanjaro Christian
Medical Center (KCMC).
The survey instrument consisted of old questions from POFO I (POFO
rounds 1-7) plus new questions added in round 8 that were intended to address
the specific aims of POFO II grant. POFO interviewers, who are native Swahili

5
speakers, translated the SF-36 questionnaire from English to Swahili. Different
translators were used for the translations and back-translations to English. The
original English text and English back-translation were then reviewed by Duke
Staff to ensure that the content was correct. In both study sites, local adult and
youth community advisory boards (CABS) reviewed the new questions for round
8 of POFO and made comments regarding the acceptability and appropriateness
of the language. They also helped identify response options for some questions.
Two interviewers in each study site administered the questionnaire to the
participants. The researcher was blinded to both the SF-36 questionnaire and the
participants’ SF-36 survey responses. After the interview, the interviewers alerted
the researcher who subsequently conducted the OVC health assessment.
2.3 Measures
2.3.1 General Health
General health was measured in the questionnaire using the Short Form-
36 scale (SF-36) health survey adopted from the Medical Outcomes Trust,
Boston, MA [15]. Although the SF-36 has been documented in more than 4000
publications [16], and been translated into over 60 languages including a Swahili
version for use in Tanzania [17] for this study, the SF-36 was translated from
English to Swahili by trained POFO field interviewers. The SF-36 is a
multipurpose generic measure of health status that is non-specific to age,
disease, or treatment group and consists of 36 items. It yields an 8- scale profile
of scores and 2 summary measures. The 8 scores are: physical functioning,

6
physical role, bodily pain, general health, vitality, social functioning, emotional
role, and mental health. Scores are transformed to a 0-100 scale, with higher
scores reflecting better health [11]. The two health summary measures are the
physical health component score, and the mental health component score [18].
2.3.2 Health Assessment
The health assessment measured participants’ physical health using 4
clinical variables. These included the following: 1) complete physical health
examination; 2) anthropometric measurement of body mass index (BMI); 3)
hemoglobin level; and, 4) physical fitness testing by means of the Harvard Step
Test. In situations where pathological conditions were detected, the researcher
counseled the participant before making a referral to the local district hospital. In
all cases, test results were explained to the study participants. 34 referrals were
made; 6 from the institutions, and 28 from the community.
Anthropometric measurements of weight and height of the orphans were
performed to obtain the BMI, which is the weight in kilograms divided by the
height in meters squared (kg/m2). Weight was measured to the nearest 0.1kg on
a calibrated digital bathroom scale. Standing height was measured from a flat
surface and expressed to the nearest 0.1cm using a wooden foldable
measurement ruler.
Quantitative determination of hemoglobin and a calculated value for
hematocrit were obtained through 10µL specimen of capillary blood collected
through a sterile finger prick. The blood was placed onto a Hemoglobin Test Strip

7
and affixed onto a portable Mission ® Hemoglobin Meter manufactured from
ACON Laboratories, Inc. San Diego, CA 92121 USA. The strips function by
lysing erythrocytes and converting the released hemoglobin into methemoglobin.
Cardiorespiratory fitness was assessed through the Harvard Step Test
[19]. The test is considered submaximal since the subject works below maximum
effort. Extrapolation is used to estimate maximum capacity. The test was
originally conducted among young men aged 17- 27 years, and has been
adapted and validated among different teenage populations in the US, India and
East-Africa [19-21]. It involves stepping onto and down from a platform 20 inches
high, 30 times a minute for 5 minutes, or until the subject is unable to continue.
Once the exercise is completed, the participant’s pulse is counted during the
periods, 1-1.5, 2-2.5, and 3-3.5 minutes. A fitness index is then calculated as =
(100* Exercise duration (sec))/ (2*sum of the 3 pulse counts). It is then
interpreted as: excellent > 90; good 80 – 89; high average 65 – 79; low average
55- 64; and, poor < 55.
2.4 Change in Methodology
Although the study had IRB approval to assess for HSV-2 antibodies, the
absence of a consensus on a HSV-2 test-result disclosure protocol to OVC
caregivers led the larger team of POFO investigators to unanimously stop the
test mid-study. At this point, 63 (52%) of the OVC had been tested for HSV-2
antibodies and they all tested negative for HSV-2 antibodies.
8
2.5 Analysis
Data were analyzed using STATA/IC version 11.2. Univariate and
bivariate analyses comparing health outcomes between teenage OVC living in
the community and those living in institutions were conducted using Chi-square
tests for categorical variables and t-tests for continuous variables. Multivariate
analyses were conducted to compare SF-36 physical functioning scores and
objective physical health outcomes of hemoglobin, BMI, and Harvard Step-Test
fitness scores. Pearson’s correlations were then sought.

9
3. Results
3.1 Demographic Characteristics
Study participants in Bungoma, Kenya and Kilimanjaro region in Tanzania
were drawn from the POFO study sample- a longitudinal multi-site study. The
total enrollment was 122 participants, with 50% of the study sample being
derived from either country. A majority of the participants were male (63.1%). On
average, participants were 16.8 years old (SD = 0.5). The main living
arrangement was in the community (73.0%), with over a quarter (27.0%) living in
institutions (see table 1).
The 139 eligible OVC that were not contacted had an average age of 16.9
years (SD=0.5), with 48% living in the community and 52% in institutions.
Table 1. Sociodemographic Characteristics of Study Participants
(n=122) Kenya (n=61)
Tanzania (n=61)
Age (M, SD) 16.8(0.5) 16.6(0.6) 17.0(0.8)
Gender
Female (%) 36.9 32.8 41.0
Male (%) 63.1 67.2 59.0
Living Arrangement
Community (%) 73.0 65.6 80.3
Institution (%) 27.0 34.4 19.7

10
3.2 Health Characteristics
OVC living in community settings and those living in institutions were
found to have similar health outcomes. When compared by a neutral examiner
along 4 different health indicators, (physical examination, body mass index,
hemoglobin levels, and the Harvard test score of physical fitness), no significant
differences were found. Although 97.5% of the OVC in both community and
institutional settings were found to be in good physical health, the mean Harvard
test score of physical fitness for all OVC was classified as poor ( x = 40.7;
SD=16.9). Of the 11 OVC found to have a resting tachycardia (heart rate of
above 100 beats per minute), 9 were females (82.0%). Incidence of poor vision
was 12.3%, though none wore glasses. Among the 77 male OVC in the entire
sample, 73 were circumcised (98.4%) (see table 2).

11
Table 2. Differences in Health Outcomes Among OVC i n Community and Institutional Settings
(n=122) Community (n=89)
Institution (n=33) p-value
Physical Examination • Good General Appearance (n,
%) 119(97.5) 86(96.6) 33(100) 0.3
• Normal Visual Acuity 20/20 (n, %)
107(87.7) 81(91.0) 26(78.8) <0.1†
• Normal Hearing (n, %) 119(97.5) 86(96.6) 33(100) 0.3
• Normal Head Findings (n, %) 122(100) 89(100) 33(100) -
• Normal EENT Findings (n, %) 113(92.6) 83(93.3) 30(90.9) 0.7
• Normal Chest Findings (n, %) 120(98.4) 87(97.8) 33(100) 0.4
• Normal Abdominal Findings (n, %)
120(98.4) 87(97.8) 33(100) 0.4
• Systolic Blood Pressure (mmHg) (M, SD)
115(9.7) 115(8.5) 113(12.4) 0.4
• Diastolic Blood Pressure (mmHg) (M, SD)
66(8.4) 66(7.8) 66(9.8) 0.9
• Resting Pulse (b/pm) (M, SD) 75(15.7) 77(15.6) 71(15.4) <0.1†
• Male (M,SD) 70.4(13.8) 72.3(14.0) 65.7(12.4)
• Female (M,SD) 83.7(15.3) 84.4(15.2) 81.3(16.0)
BMI (kg/m2) (M, SD) 19.4(2.4) 19.4(2.5) 19.4(2.2) 0.9
• Male (M,SD) 18.9(2.0) 18.8(2.2) 18.9(1.5)
• Female (M,SD) 20.3(2.8) 20.2(2.7) 20.5(3.0)
Hemoglobin (g/dl) (M, SD) 13.2(1.8) 13.3(1.9) 12.8(1.6) 0.2
• Male (M,SD) 13.5(1.7) 13.7(1.8) 13.1(1.6)
• Female (M,SD) 12.5(1.7) 12.6(1.8) 12.2(1.4)
Harvard Test Score (M, SD) 40.7(16.9) 41.7(16.4) 38.5(8.3) 0.4
• Male (M,SD) 44.7(16.0) 44.5(16.5) 45.2(15.1)
• Female (M,SD) 32.5(16.0) 35.7(14.7) 24.9(17.1)
Standardized SF-36 Physical Composite Score (M, SD)*
50.6(6.2) 50.9(6.0) 49.6(6.7) 0.3
• Male (M,SD) 50.7(6.1) 50.8(5.9) 50.6(6.5)
• Female (M,SD) 50.3(6.4) 51.1(6.1) 47.6(6.9)
Standardized SF-36 Mental Composite Score (M, SD)*
48.2(9.1) 48.6(9.2) 47.0(8.9) 0.4
• Male (M,SD) 47.5(9.4) 47.7(9.6) 47.2(9.0)
• Female (M,SD) 49.3(8.6) 50.1(8.4) 46.5(9.0)
† p<0.1; *SF-36 scores are standardized to US general population norms[15, 18]

12
In this sample, the SF-36 showed a high level of internal reliability
(Cronbach’s α = 0.86). Participants reported a mean standardized physical
composite score of 50.6 (SD=6.2) and a mean standardized mental composite
score of 48.2 (SD=9.1). Between the OVC groups, there was no note of a
statistically significant difference.
Figure 1. SF-36 Scores of Study Participants (n=122 )
PF is physical functioning; RP is physical role; BP is bodily pain; GH is general
health; VT is vitality; SF is social functioning; RE is emotional role; MH is mental
health; PCS is physical composite score; and MCS is mental composite score.
50
60
70
80
90
100
00
SF
-36
Sco
re
PF RP BP GH VT SF RE MH PCS MCSSF-36 subscale
OVCs
BestHealth
PoorHealth

13
Table 3. Mean Item Scores for items of the SF-36 Ph ysical Functioning scale in Study Participants and other Studies from Tanzania and the US
Item content
Mean item score
OVC (n=122)
Tanzania† (n=3,802)
US‡ (n=2,474)
Vigorous Activities 2.71 2.74 2.17
Climbing Several flights 2.74 2.73 2.54
Bending, kneeling, stooping 2.78 2.89 2.59
Walking more than a km 2.80 2.90 2.55
Moderate Activities 2.73 2.88 2.65
Lifting or carrying groceries 2.76 2.88 2.72
Walking several hundred meters 2.72 2.94 2.69
Climbing one flight 2.75 2.88 2.78
Walking 100 meters 2.74 2.95 2.82
Bathing or dressing 2.89 2.98 2.88
† Source: Wagner and colleagues [17]. The Tanzanian sample was a population sample aged 15 years and above.
‡ US data is from a general population sample of adults who completed the SF-36 within a survey conducted for the Health Institute by the National Opinion Research Center [17].
3.3 Multivariate Analysis
Stratifying along gender, Pearson’s correlations between SF-36 physical
functioning (SF-36 PF) sub-score and 3 health outcomes were weak. It was 0.1
between SF-36 PF and hemoglobin, 0.1 between SF-36 PF and BMI, and -0.1
between SF-36PF and the Harvard Fitness score. Similarly, correlations with the
Harvard Fitness score were weak. It was -0.4 between the Harvard Fitness score
and BMI, -0.5 between the Harvard Fitness score and resting pulse, and 0.2
between the Harvard Fitness score and height.

14
Figure 2. Comparison of Study Participants’ (n=122), SF-36 Physical Sub-scores with Hemoglobin Levels by Gender
Figure 3. Comparison of Study Participants’ (n=122), SF-36 Physical Functioning Sub-scores with BMI by Gender
81
01
21
416
18
Hem
ogl
obin
(g
/dl)
0 20 40 60 80 100SF-36 Physical Functioning subscore
Female MaleLine of best fit for Both Line of best fit for MalesLine of best fit for Females
1520
25
30B
ody
Mas
s In
dex
(kg
/m2)
0 20 40 60 80 100SF-36 Physical Functioning subscore
Female MaleLine of best fit for Both Line of best fit for MalesLine of best fit for Females

15
Figure 4. Comparison of Study Participants’ (n=122), SF-36 Physical Functioning sub-scores with Harvard Step-Test Fitne ss scores by Gender
Figure 5. Comparison of Study Participants’ (n=122), Harvard Step-Test Fitness Score with BMI by Gender
02
04
06
080
Har
vard
Sco
re
0 20 40 60 80 100SF-36 Physical Functioning subscore
Female MaleLine of best fit for Both Line of best fit for MalesLine of best fit for Females
1520
25
30B
ody
Mas
s In
dex
(kg
/m2)
0 20 40 60 80Harvard Score
Female MaleBest of line for Both Best line of fit for MalesBest line of fit for Females
16
4. Discussion and Conclusion
In this study, when physical health outcomes and self-rated quality of
health measures were compared among OVC living in institutions versus those
living in the community, no difference was found. Applying US general population
norms to the SF-36 generic health questionnaire, regardless of living
arrangement, all OVC had an above-average composite score for physical
health. For a majority of the OVC, physical examination revealed normal findings
for blood pressure, head, EENT, chest, abdominal, and extremities. However, of
note was a high prevalence of undiagnosed poor visual acuity. Most rural areas,
from which the sample was drawn from, lacked access to eye-care centers. The
insidious, non-painful nature of most eye illnesses, and poor access to Vitamin-A
rich dietary sources, also serve to increase the prevalence of poor visual acuity.
When adjusted for age and gender, BMI and hemoglobin levels were
found to be within normal reference standards [22, 23]. Incidences of both
underweight and anemia conditions in both community and institutional settings
were low and homogenously spread. Despite age-appropriate physiological
indices, the average fitness score obtained from the Harvard Step test was poor.
This observation could be attributed to several factors. Participants of a short
stature, females who wore tight or short clothing inappropriate for physical
exercise, absence of privacy when the test was conducted, and anxiety among
participants may have had a major negative impact on test performance.
Correlates between SF-36 physical functioning sub- scores and 3 physical
health outcomes of hemoglobin, BMI, and the Harvard Step-Test fitness score,

17
were weak. The 3 health outcomes were chosen as they provided the most
objective continuous variables for comparison purposes. Nonetheless, plotted
against the SF-36 composite score for physical health, all the 3 outcomes
showed little association.
Although this is among the first few studies to examine OVC health ratings
at ages above 16, findings of no difference by living arrangements have been
reported before. Drawing from ages 6-12 of the larger POFO sample, Whetten
and colleagues found the health of OVC to be no worse in institutions than in the
community[10]. Consistent with this finding are results from Uganda, Ethiopia,
and rural China [9, 24, 25]. In Uganda, despite findings of higher prevalence of
self-reported morbidity in orphans than non-orphans, Sarker and colleagues
found no differences in reported health seeking behavior and measured
anthropometric parameters [24]. However, despite the findings in support for no
difference in health outcome in group homes and institutional care, for chronically
ill orphans, such as with HIV/AIDs, social and cultural contexts of the living
arrangements matter [25]. Thus, this study reaffirms the finding of no difference
in health outcomes for OVC living in different arrangements.
On the second finding in this study of a weak correlation between SF-36
and the 3 chosen physical outcomes, literature is mixed. Overall, the SF-36
composite scores obtained in this study are above average [15] .Consistent with
this finding, is a study from Mozambique [26]. While examining anthropometric
measures among school-going children and adolescents, using the
recommended cut-offs were, Prista and colleagues were unable to establish the

18
biological meaning of BMI. Other studies are more cautious. Despite finding an
association of a higher BMI with a worse performance in some physical fitness
tests, Monyeki and colleagues, preferred to interpret BMI as an indicator of
muscle mass [27]. However, working in rural Senegal, Benefice and colleagues
find that activity levels are less dependent on physiological characteristics in
children in traditional subsistence societies. For instance, they found that adult
women had better cardiorespiratory fitness and were more active than
adolescent girls [28].
Inherent in this study are several limitations. The first relates to the
characteristics of the study sample. Not only was the study sample inadequately
powered, but also non-random refusal to participate led to skewed gender, age
and living arrangements distributions. Hence, the generalizability of the results
presented in this paper is limited. Secondly, the results are generalizable only to
OVC aged above 16 years in rural East-African settings. The narrow age range
of the sample, may further explain the lack of variability in the results. Thirdly, the
absence of local references for BMI and an appropriate comparison group for the
SF-36, limit the comparability of these results. Finally, for this study, I used the
same Harvard Step for both male and female participants. Although use of the
same step ensured uniformity, this may have contributed to the overall poor
Harvard fitness score. In order to take regional population differences into
account, several studies have readjusted the height of the Harvard step to cater
for differences in gender and short stature [20, 21].

19
By utilizing a neutral examiner to examine OVC health outcomes and
compare their ratings to a standardized tool such as the SF-36, this study is one
of the first ones to examine how accurately OVC rate their health. If adequately
powered and more biological outcomes such as HIV testing are included, studies
similar to the one reported in this paper might obtain more generalizable results.
These studies could provide future direction on whether the SF-36, could serve
as objective screening tool for physical health of OVC and other adolescent
populations.
In conclusion, this study found no differences in health outcomes among
OVC in different living arrangements. The mean composite score for physical
health on the SF-36 was above average. On 3 chosen physical health outcomes
of hemoglobin, BMI, and the Harvard Step-test fitness score plotted against the
SF-36 physical composite score, no correlations were noted. Although the SF-36
has been used on many other populations, this is among the first studies that
have used it in a rural east African setting among adolescent OVC. Thus, this
study provides a focal point for similar research. Next, it will be useful for policy
makers to know what variables predict both the eight SF-36 scores, and the two
summary composite scores for mental and physical health in adolescent OVC
populations.

20
Appendix A: Health Examination Questionnaire

21

22
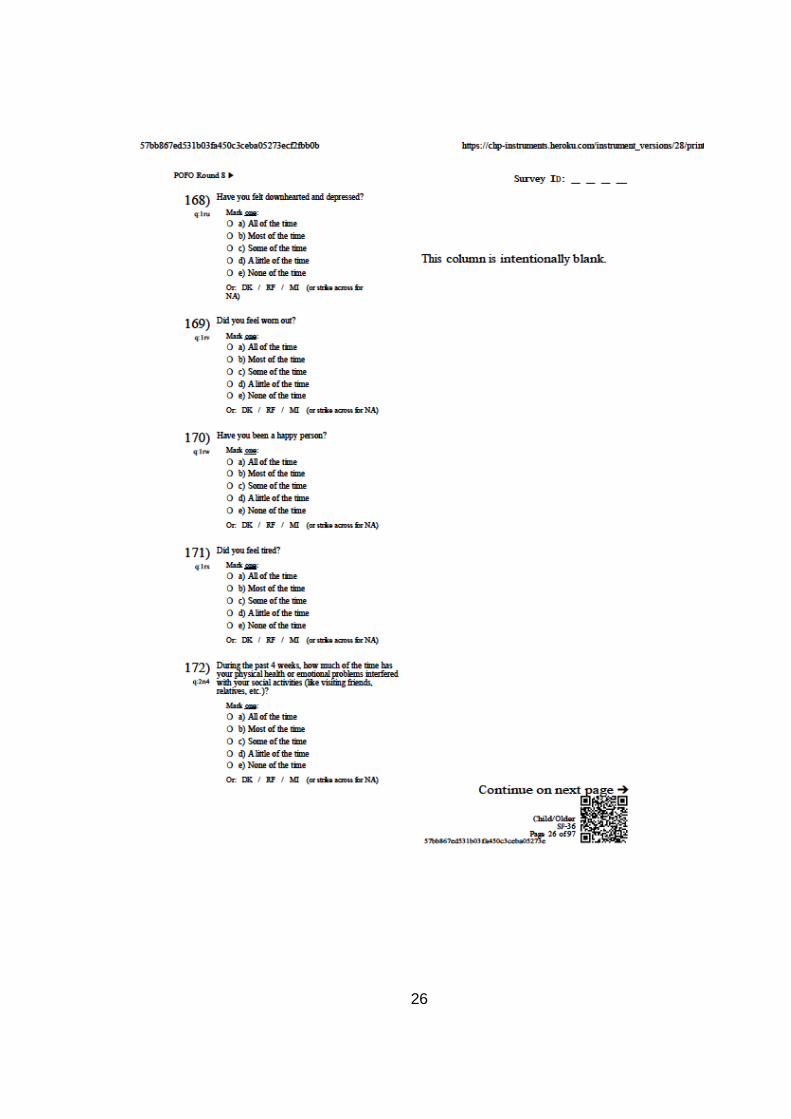
Appendix B: Child Health and SF-36 Questionnaire

23

24

25
26

27
Appendix C
I. Duke IRB approval

28
II. KEMRI IRB Approval

29
III. KCMC IRB Approval

30
Appendix D: Consent Forms
I. In English

31

32

33
II. In Swahili

34

35

36

37
References 1. UNAIDS, UNICEF, and USAID, Africa's Orphaned and Vulnerable
Generations: Children Affected by AIDS, Joint Report., 2006, UNICEF: New York.
2. Kang, M., et al., Maternal versus paternal orphans and HIV/STI risk among adolescent girls in Zimbabwe. AIDS Care, 2008. 20(2): p. 214-7.
3. Kidman, R., et al., AIDS in the family and community: The impact on child health in Malawi. Social Science & Medicine, 2010. 71(5): p. 966-74.
4. Mishra, V., et al., Education and nutritional status of orphans and children of HIV-infected parents in Kenya. AIDS Education and Prevention, 2007. 19(5): p. 383-95.
5. Parikh, A., et al., Exploring the Cinderella myth: intrahousehold differences in child wellbeing between orphans and non-orphans in Amajuba District, South Africa. AIDS, 2007. 21 Suppl 7 : p. S95-S103.
6. Andrews, G., D. Skinner, and K. Zuma, Epidemiology of health and vulnerability among children orphaned and made vulnerable by HIV/AIDS in sub-Saharan Africa. AIDS Care, 2006. 18(3): p. 269-76.
7. Ntanda, H., et al., Orphanhood predicts delayed access to care in Ugandan children. The Pediatric Infectious Disease Journal, 2009. 28(2): p. 153-5.
8. Amoako Johnson, F., S.S. Padmadas, and P.W. Smith, Orphanhood and vulnerability: a conduit to poor child health outcomes in Rwanda. AIDS Care, 2010. 22(3): p. 314-23.
9. Hall, A., et al., Case-control analysis of the health and nutrition of orphan schoolchildren in Ethiopia. Tropical Medicine and International Health, 2010. 15(3): p. 287-95.

38
10. Whetten, K., et al., A comparison of the wellbeing of orphans and abandoned children ages 6-12 in institutional and community-based care settings in 5 less wealthy nations. PLoS One, 2009. 4(12): p. e8169.
11. Agnihotri, K., et al., A study of concordance between adolescent self-report and parent-proxy report of health-related quality of life in school-going adolescents. J Psychosom Res, 2010. 69(6): p. 525-32.
12. Birdthistle, I., et al., Is education the link between orphanhood and HIV/HSV-2 risk among female adolescents in urban Zimbabwe? Social Science & Medicine, 2009. 68(10): p. 1810-8.
13. DGHI. Positive Outcomes for Orphans. 2011 [cited 2011 October 26th]; Available from: http://globalhealth.duke.edu/research-docs/POFO_Wealth_Index_Creation_sept-2010.pdf.
14. DGHI. Duke Global Health Institute Fieldwork Open Projects. 2011 1/22/2011]; Available from: http://globalhealth.duke.edu/dghi-fieldwork/open-projects/pofo-study-design.
15. Ware, J.E., SF-36 Health Survey Update. SPINE, 2000. 25(24): p. 3130-3139.
16. QualityMetric. SF-36.org. A community for measuring health outcomes using SF tools. 2011 [cited 2011 22nd October]; Available from: http://www.sf-36.org/tools/SF36.shtml#VERS2.
17. Wagner, A.K., et al., A Kiswahili Version of the SF-36 Health Survey for Use in Tanzania: Translation and Tests of Scaling Assumptions. Quality of Life Research, 1999. 8(1/2): p. 101-110.
18. Ware, J., et al., User’s manual for the SF-36v2 health survey 2ed, ed. Lincoln2007, Rhode Island: QualityMetric Incorporated.
19. Keen, E.N. and A.W. Sloan, Observations on the Harvard step test. J Appl Physiol, 1958. 13(2): p. 241-3.
20. Stephenson, L.S., et al., Physical fitness, growth and appetite of Kenyan school boys with hookworm, Trichuris trichiura and Ascaris lumbricoides

39
infections are improved four months after a single dose of albendazole. J Nutr, 1993. 123(6): p. 1036-46.
21. Amit, B., Queen's College Step Test as an Alternative of Harvard Step Test in Young Indian Women. International Journal of Sport and Health Science, 2008. 6: p. 15-20.
22. CDC. Healthy Weight - it's not a diet, it's a lifestyle! 2011 [cited 2011 October 13th]; Available from: http://www.cdc.gov/healthyweight/assessing/bmi/adult_bmi/index.html.
23. Buchanan, A.M., et al., Establishment of haematological and immunological reference values for healthy Tanzanian children in Kilimanjaro Region. Tropical Medicine & International Health, 2010. 15(9): p. 1011-1021.
24. Sarker, M., C. Neckermann, and O. Muller, Assessing the health status of young AIDS and other orphans in Kampala, Uganda. Trop Med Int Health, 2005. 10(3): p. 210-5.
25. Hong, Y., et al., Care arrangements of AIDS orphans and their relationship with children's psychosocial well-being in rural China. Health Policy Plan, 2010.
26. Prista, A., et al., Anthropometric indicators of nutritional status: implications for fitness, activity, and health in school-age children and adolescents from Maputo, Mozambique. Am J Clin Nutr, 2003. 77(4): p. 952-9.
27. Monyeki, M.A., et al., Body composition and physical fitness of undernourished South African rural primary school children. Eur J Clin Nutr, 2005. 59(7): p. 877-83.
28. Benefice, E. and G. Ndiaye, Relationships between anthropometry, cardiorespiratory fitness indices and physical activity levels in different age and sex groups in rural Senegal (West Africa). Ann Hum Biol, 2005. 32(3): p. 366-82.