an assessment of financial stability in trinidad & tobago...
TRANSCRIPT

An assessment of Financial Stability in Trinidad & Tobago
using micro and indicators
Varuna L. PhD. Candidate
SALISES, UWI, St. Augustine
An assessment of Financial Stability in Trinidad & Tobago
using micro and macroprudentialindicators
L. RamlalPhD. Candidate
SALISES, UWI, St. Augustine

Financial Stability (FS)
Schinasi (2004) identified 4 key elements:
1. The broadness of FS must be considered and this includes its effects on the various aspects such as the types of institutions, market structures.
2. The efficiency of the payment system FS in an economy.
3. Financial stability ensures not only an financial crisis, but an ability of the system to repair crises as they begin to occur.
4. Financial stability affects the workings of the economy in general and has far-reaching consequences that extend beyond the activity of the firm
Financial Stability (FS)
(2004) identified 4 key elements:
of FS must be considered and this includes its effects on the various aspects such as the types of institutions, market structures.
efficiency of the payment system is imperative to
Financial stability ensures not only an absence of ability of the system to repair
as they begin to occur.
Financial stability affects the workings of the economy reaching consequences that
extend beyond the activity of the firm.

FS defined in TT
Andrew Crockett (2005) “Financial stability requires that (i) the key institutions in the financial system are stablehigh degree of confidence that they can continue to meet their contractual obligations without interruption or outside assistance, and (ii) the key markets are stableparticipants can confidently transact in them at prices that reflect fundamental forces and that do not vary substantially over short periods when there have been no changes in fundamentals.”
FS defined in TT
Andrew Crockett (2005) “Financial stability key institutions in the
financial system are stable, in that there is a high degree of confidence that they can continue to meet their contractual obligations without interruption or outside assistance, and
key markets are stable, in that participants can confidently transact in them at prices that reflect fundamental forces and that do not vary substantially over short periods when there have been no changes in
Financial
� Financial stability: ability of the market to withstand shocks that stem from the financial system without experiencing major upheaval
� Indicators of financial stability usually calculated at the micro level and macro level
� Microprudential indicators: individual financial institutions' health
� Macroprudential indicators: health of the system as a whole
Financial Stability
Financial stability: ability of the market to withstand shocks that stem from the financial system without experiencing major upheaval
Indicators of financial stability usually calculated at the micro level and macro level
Microprudential indicators: individual financial
Macroprudential indicators: health of the system

Importance of FS
� The recent global financial crisis has encouraged interest in the area of financial stability and central banks now conduct stress tests regularly to determine how well the system can withstand financial upheaval
� In Trinidad & Tobago the CBTT produces a FS report every six months
Importance of FS
The recent global financial crisis has encouraged interest in the area of financial stability and central banks now conduct stress tests regularly to determine how well the system can withstand financial upheaval
In Trinidad & Tobago the CBTT produces a FS report every six months
Assessment of FS
� Microprudential indicators, usually aggregated; CAMELS (Evans et al 2000)
� C – Capital adequacy
� A – Asset quality
� M – Management soundness
� E - Earnings
� L - Liquidity
� S – Sensitivity to market risk
Assessment of FS
Microprudential indicators, usually aggregated; CAMELS (Evans et al 2000)
Management soundness
Sensitivity to market risk

Assessment of FS cont'd
� Macroprudential and macroeconomic indicators
� Economic growth
� BOP
� Inflation
� Interest and exchange rates
� Lending and asset price booms
� Contagion effects
� Other factors
Assessment of FS cont'd
Macroprudential and macroeconomic indicators
Interest and exchange rates
Lending and asset price booms

Indicators used in TT
� TT follows the CAMELS structure included for each section
� TT also reports major macroeconomic indicators
� According to Evans et al (2000) this is the best approach to properly determine FS in an economy
Indicators used in TT
TT follows the CAMELS structure – indicators included for each section
TT also reports major macroeconomic
According to Evans et al (2000) this is the best approach to properly determine FS in an

Regulation in TT
� Insurance Act (1980) and Insurance Amendements (2004, 2007, 2009)
� Companies Act (1995), amended in 1999, 2003
� Central Bank Act (and amendments)
� Securities Industry Act
� Finance Act and amendments
� Financial Institutions Act
� Also various other CB guidelines which are not mandatory but strongly suggested
Regulation in TT
Insurance Act (1980) and Insurance (2004, 2007, 2009)
Companies Act (1995), amended in 1999, 2003
Bank Act (and amendments)
Finance Act and amendments
Financial Institutions Act
Also various other CB guidelines which are not mandatory but strongly suggested

GENERAL MACROECONOMIC ENVIRONMENT IN TRINIDAD & TOBAGO
GENERAL MACROECONOMIC ENVIRONMENT IN TRINIDAD & TOBAGO

Graph showing growth in TT
1998 2000 2002 2004 2006 2008
-10
-5
0
5
10
15
20
25
30
35
Growth Rates - TT 2000 to 2010 - Selected Sectors
Graph showing growth in TT
2010 2012
Growth Rates - TT 2000 to 2010 - Selected Sectors
Real GDP Growth - Non-Petroleum Sector - 2000=100
Real GDP Growth - Finance Insurance & Real Estate - 2000=100
Real GDP Growth - Petroleum Sector - 2000=100
Real GDP Growth - Total - 2000=100

Trade summary TT
1998 2000 2002 2004 2006
0
1000
2000
3000
4000
5000
6000
7000
8000
9000
10000
Net Exports 2000-2010
Trade summary TT
2006 2008 2010 2012
Net Exports 2000-2010
Balance of Trade

BOP
1998 2000 2002 2004 2006 2008
-1000
-500
0
500
1000
1500
2000
2500
3000
BOP Balance 2000-2010
BOP
2008 2010 2012
BOP Balance 2000-2010
BOP Overall Surplus/Deficit (US$Mn)
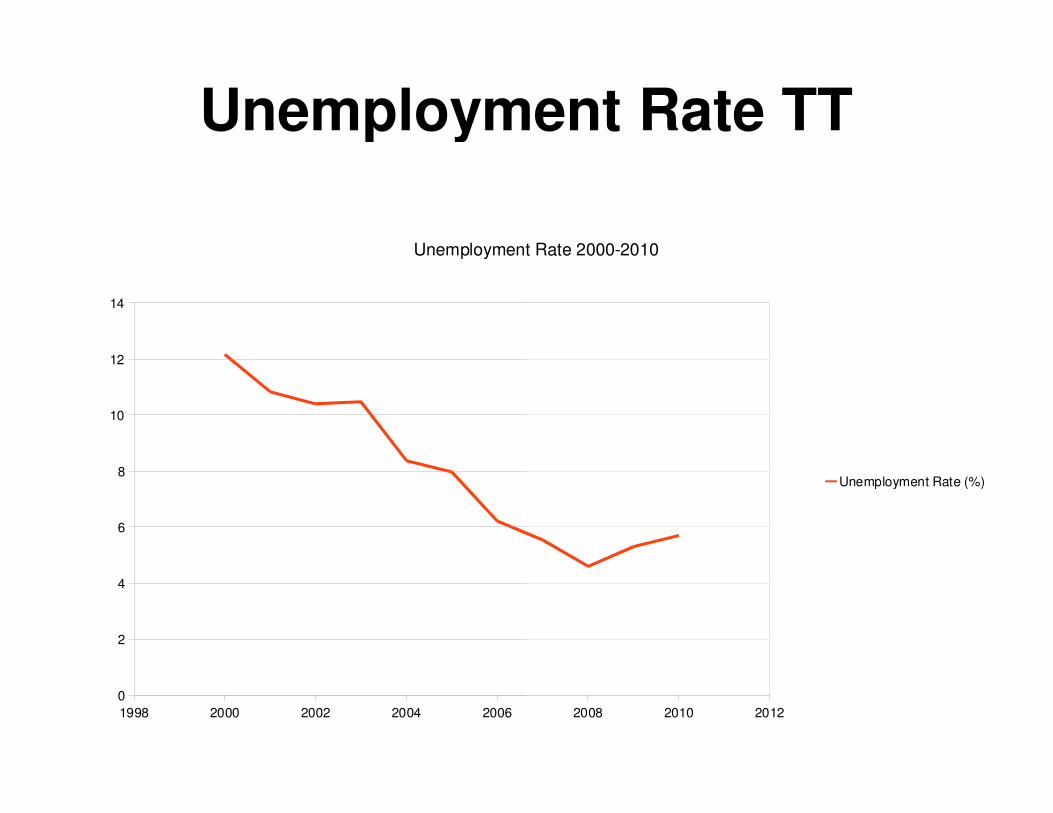
Unemployment Rate TT
1998 2000 2002 2004 2006
0
2
4
6
8
10
12
14
Unemployment Rate 2000-2010
Unemployment Rate TT
2008 2010 2012
Unemployment Rate 2000-2010
Unemployment Rate (%)

Employment
1998 2000 2002 2004 2006 2008
0
50
100
150
200
250
300
350
400
Employment in TT 2000 to 2010 - Selected Sectors
Employment - Sector
2010 2012
Employment in TT 2000 to 2010 - Selected Sectors
Employment in Agriculture (000's)
Employment in Construction (incl.Electricity & Water) - (000's)
Employment in Manufacturing (000's)
Employment in All Other Sectors (000's)
Employment in Petroleum & Gas (000's)

Government
1998 2000 2002 2004 2006 2008
-10000000
-5000000
0
5000000
10000000
15000000
Central Government Fiscal Balance
Government
2008 2010 2012
Central Government Fiscal Balance
Central Gov't Overall Fiscal Balance (TT$000s)

Gov't
1998 2000 2002 2004 2006 2008
0
5000000
10000000
15000000
20000000
25000000
30000000
35000000
Central Government Revenue - Oil and Non-Oil
Gov't
2008 2010 2012
Central Government Revenue - Oil and Non-Oil
Central Gov't Current Revenue Non Oil (TT$000s)
Central Gov't Current Revenue - Oil (TT$000s)

Gov't
1998 2000 2002 2004 2006 2008
0
5000
10000
15000
20000
25000
30000
35000
Central Government Debt
Gov't
2010 2012
Central Government Debt
Central Gov't Domestic Debt Outstanding (TT$Mn)
Central Govt Total Debt Outstanding (TT$Mn)
Central Govt External Debt Outstanding (TT$Mn)

Gov't
1998 2000 2002 2004 2006 2008
0
500
1000
1500
2000
2500
3000
3500
4000
4500
5000
Government Bonds
Gov't
2008 2010 2012
Government Bonds
Government Securities Bonds (TT$Mn)

Reserves
1998 2000 2002 2004 2006 2008
0
2000
4000
6000
8000
10000
12000
Foreign Reserves TT
Reserves
2008 2010 2012
Foreign Reserves TT
T&T Net Foreign Position - US$ Millions
Net Official Reserves - US$ Millions

AGGREGATED
MICROPRUDENTIAL
INDICATORS
AGGREGATED
MICROPRUDENTIAL
INDICATORS

C – Capital Adequacy
2000 2002 2004 2006 2008
0
5
10
15
20
25
30
Capital Adequacy
Capital Adequacy
2010 2012
Capital Adequacy
Regulatory capital to risk-weighted assets
Regulatory Tier1 Capital to Risk-Weighted Assets
Regulatory Tier2 Capital to Risk-Weighted Assets
Regulatory capital to total assets

A - Assets
-2
0
2
4
6
8
10
12
2000 2001 2002 2003 2004 2005 2006 2007
Non - Performing Loans
Assets
2007 2008 2009 2010 2011
Performing Loans
NPLs: Gross loans
NPL(net of prov) to K
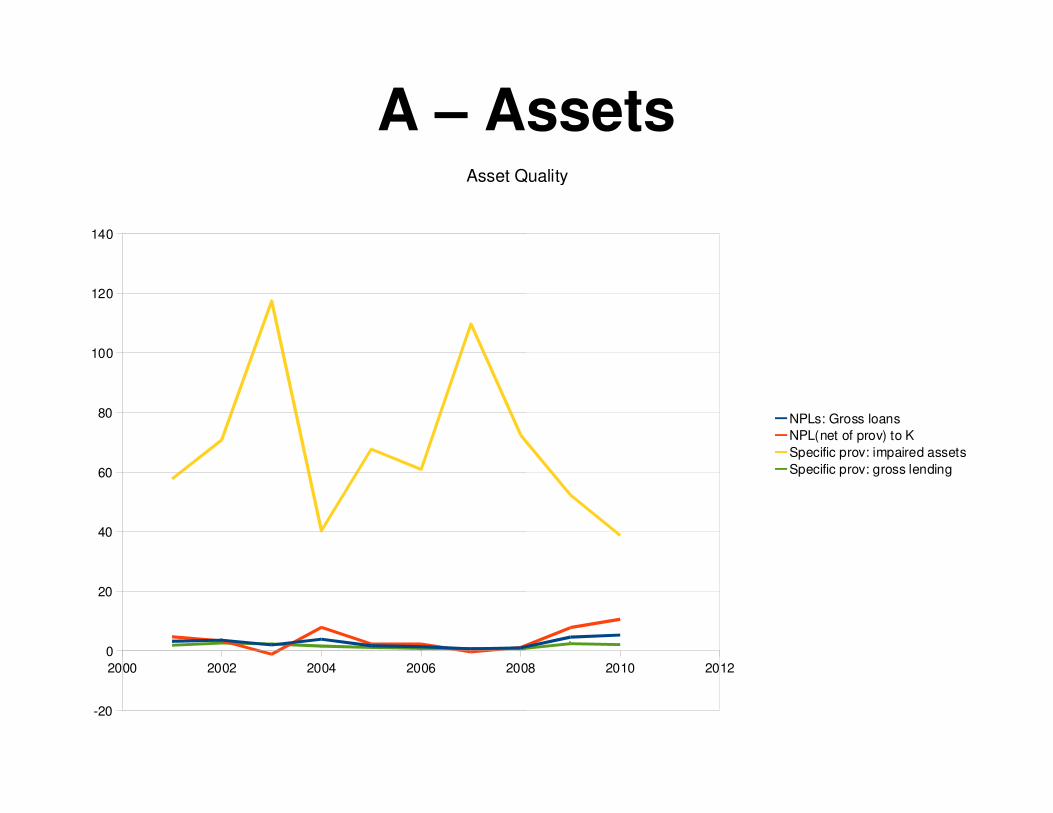
A – Assets
2000 2002 2004 2006 2008
-20
0
20
40
60
80
100
120
140
Asset Quality
Assets
2008 2010 2012
Asset Quality
NPLs: Gross loans
NPL(net of prov) to K
Specific prov: impaired assets
Specific prov: gross lending

A - Assets
2000 2002 2004 2006 2008
0
5
10
15
20
25
30
35
40
45
Asset Structure - Banking Sector
Assets
2010 2012
Asset Structure - Banking Sector
Loans to Hhs: Total Loans
Fin. Sector Loans: Total Loans
Oil and gas loans: Total loans
Construction loans: total loans
Transport and communication loans: total loans
Non-resident loans: total loans

A - Assets
0
10000
20000
30000
40000
50000
60000
70000
80000
1998 2000 2002 2004 2006 2008
Commercial Banks
Assets
2010 2012
Commercial Banks
Commercial Banks: Total Deposits (TT$Mn)
Commercial Banks: Total Loans - TT$Mn
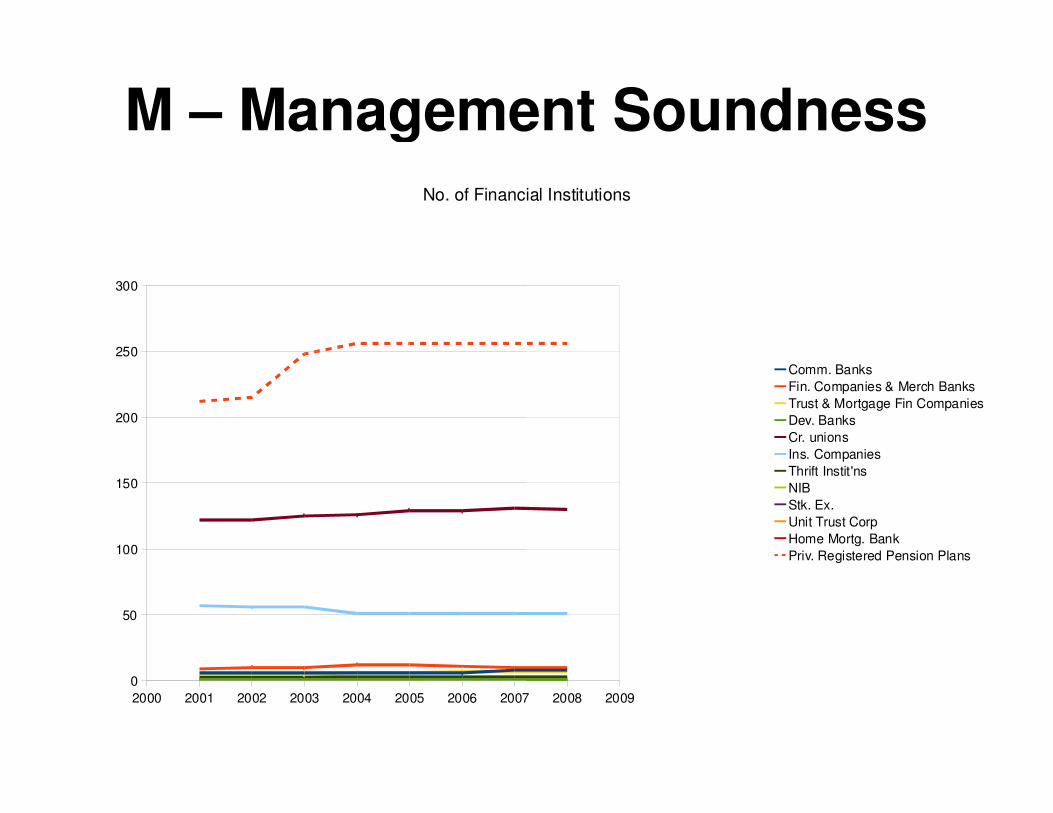
M – Management Soundness
2000 2001 2002 2003 2004 2005 2006 2007
0
50
100
150
200
250
300
No. of Financial Institutions
Management Soundness
2007 2008 2009
No. of Financial Institutions
Comm. Banks
Fin. Companies & Merch Banks
Trust & Mortgage Fin Companies
Dev. Banks
Cr. unions
Ins. Companies
Thrift Instit'ns
NIB
Stk. Ex.
Unit Trust Corp
Home Mortg. Bank
Priv. Registered Pension Plans

M – Mgt. Soundness
2000 2001 2002 2003 2004 2005 2006
0
2
4
6
8
10
12
14
Financial Institutions
Excl. Cr. Unions, Ins. Cos and Pension Plans
Mgt. Soundness
2007 2008 2009
Financial Institutions
Excl. Cr. Unions, Ins. Cos and Pension Plans
Comm. Banks
Fin. Companies & Merch Banks
Trust & Mortgage Fin Companies
Dev. Banks
Thrift Instit'ns
NIB
Stk. Ex.
Unit Trust Corp
Home Mortg. Bank
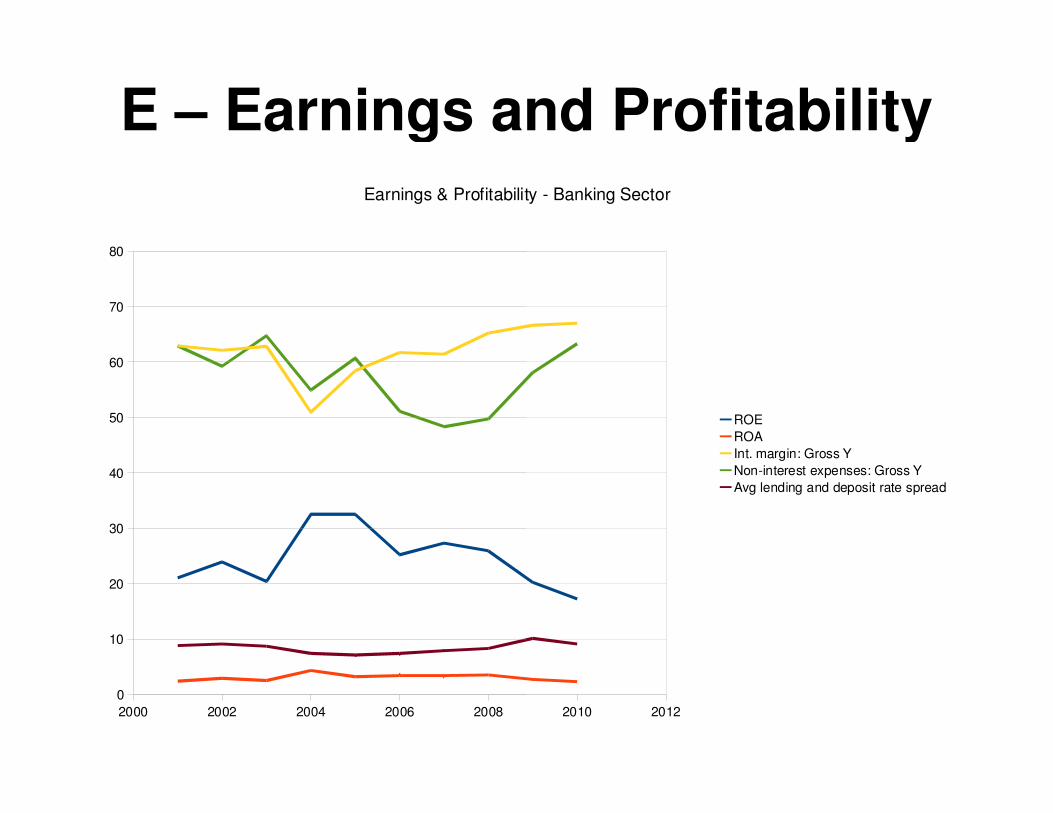
E – Earnings and Profitability
2000 2002 2004 2006 2008
0
10
20
30
40
50
60
70
80
Earnings & Profitability - Banking Sector
Earnings and Profitability
2010 2012
Earnings & Profitability - Banking Sector
ROE
ROA
Int. margin: Gross Y
Non-interest expenses: Gross Y
Avg lending and deposit rate spread
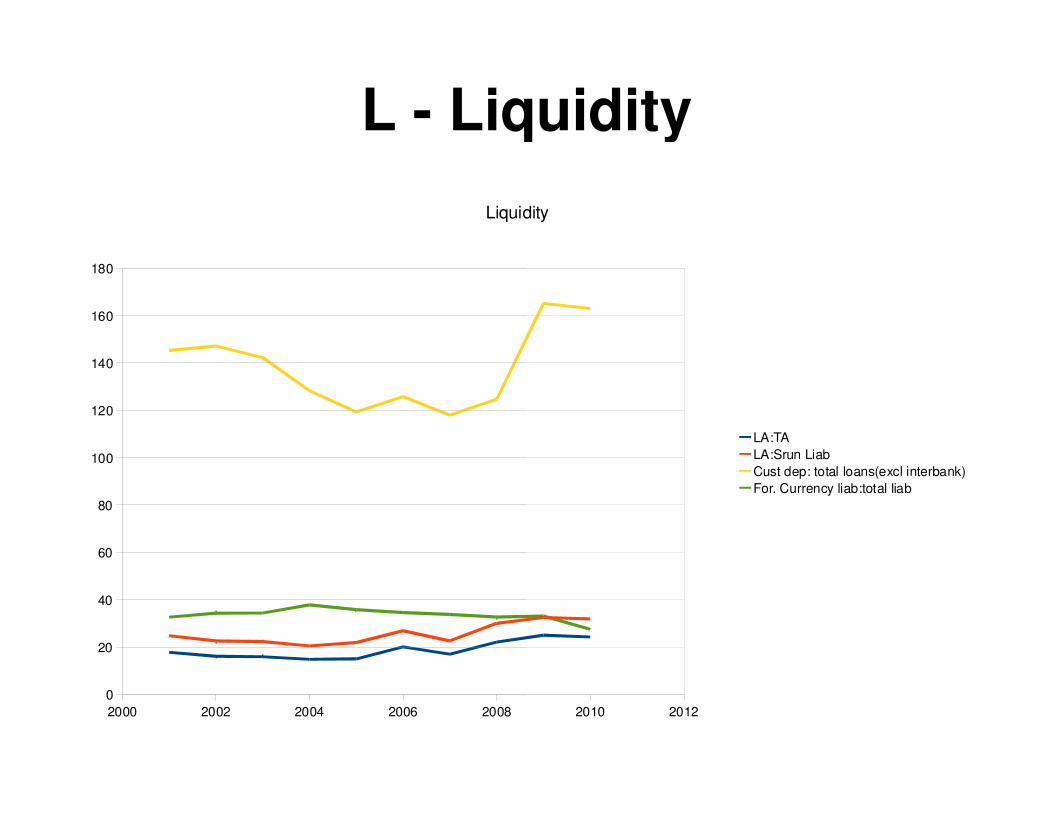
L - Liquidity
2000 2002 2004 2006 2008
0
20
40
60
80
100
120
140
160
180
Liquidity
Liquidity
2010 2012
Liquidity
LA:TA
LA:Srun Liab
Cust dep: total loans(excl interbank)
For. Currency liab:total liab

S – Sensitivity to Risk
2003 2004 2005 2006 2007 2008 2009
0
50
100
150
200
250
300
350
400
RPI 2000 to 2010
Sensitivity to Risk
2009 2010 2011
RPI 2000 to 2010
Index of Retail Prices - Food - (Jan. 03=100)
Index of Retail Prices - Housing - (Jan. 03=100)
Index of Retail Prices - Core (Jan. 03 = 100)

Interest rates TT
1998 2000 2002 2004 2006 2008
0
2
4
6
8
10
12
14
16
18
Commercial Banks Interest Rates
Interest rates TT
2010 2012
Commercial Banks Interest Rates
Commercial Banks: Demand Loans Rate (%)
Commercial Banks: Ordinary Savings Deposit Rate (%)
Commercial Banks: Basic Prime Lending Rate (%)

Exchange Rates TT
1998 2000 2002 2004 2006
0
2
4
6
8
10
12
14
Exchange Rates
Exchange Rates TT
2006 2008 2010 2012
Exchange Rates
US Selling
Barbados Selling Rate
Canadian Selling Rate
EC Selling
Euro Selling
Pound Selling

Stock market index TT
1998 2000 2002 2004 2006 2008
0
200
400
600
800
1000
1200
TT Composite Stock Price Index - Annual: 2000-2010
Stock market index TT
2008 2010 2012
TT Composite Stock Price Index - Annual: 2000-2010
Composite Stock Price Index (1983=100)

Stock Market
1998 2000 2002 2004 2006 2008
0
50
100
150
200
250
300
350
400
450
Volume of Shares Traded
Stock Market - TT
2008 2010 2012
Volume of Shares Traded
Volume of Shares Traded - TTSE ($Mn)
Financial stability
� Financial stability indicates an ability to recover from financial turmoil and a resilience to resist major negative effects of a financial crisis
� The economy of Trinidad & Tobago was not immune to the recent financial crisis of 2008
� Reaction was delayed but significant
� Recovery process still proceeding
� Financial system remained mostly stable
Financial stability
Financial stability indicates an ability to recover from financial turmoil and a resilience to resist major negative effects of a financial crisis
The economy of Trinidad & Tobago was not immune to the recent financial crisis of 2008
Reaction was delayed but significant
Recovery process still proceeding
Financial system remained mostly stable

FS -
� 2009 was the difficult year here
� Some negatives seen in deficit, growth rates fell, unemployment rising, fiscal balance negative
� Our exchange rate remained fairly stable good, indicates strong reserve
� Some recovery in 2010
- TT
2009 was the difficult year here – CLICO crisis
Some negatives seen in macroeconomy: BOP deficit, growth rates fell, unemployment rising, fiscal balance negative
exchange rate remained fairly stable –good, indicates strong reserve position
Some recovery in 2010

Policy Suggestions
� Improve regulation
� Boost investor & firm awareness
� Educate the general public
Policy Suggestions
& firm awareness
Educate the general public

The EndThe End