an approach for determining optimal product sampling for ... · an approach for determining optimal...
TRANSCRIPT

ELSEVIER
0000
An Approach for Determining Optimal Product Sampling for the Diffusion of a New Product
Dipak Jain, Vijay Mahajan, and Eitan Muller
Free samples are an effective means for introducing and promoting a new prod- uct. However, product sampling is also expensive. As a result, careful consid- eration must be given to the question of how many samples should be distributed. To encourage product adoption in any target market, a company needs to deter- mine the “right” amount of sampling. In other words, a firm needs to determine the optimal number of samples that must be available for trial by the innovators, early adopters, and other key consumers who influence the adoption rate of the new product. With too few samples, the product might not reach enough of these key consumers to generate the word-of-mouth recommendations necessary for market success. On the other hand, offering too many free samples is a waste of a company’s resources.
Dipak Jain, Vijay Mahajan, and Eitan Muller propose a framework for de- termining the optimal levels of product sampling. In addition to identifying the upper bounds for the sampling levels of both durable and nondurable products, their model identifies the optimal size of product sampling based on such param- eters as the coefficients of innovation and imitation, market potential, discount rate, and gross margin.
Several observations are made regarding the relationships between the optimal sampling level and the various parameters used in the model. For example, a high sampling level is not appropriate for a product with a high coeficient of innovation. On the other hand, if a product has a high coefficient of imitation, the sampling level should be high because a significant number of trials are neces- sary for word of mouth to be effective. High sampling levels are also indicated by a high discount rate or gross margin.
For durable goods, the optimal level of neutral sampling (i.e., sampling that does not specifically target innovators and early adopters) rarely exceeds S%, and the maximum level is 7%. The optimal target sampling level is always higher than the corresponding neutral case, but, in most cases, only marginally so. For the parameter ranges chosen in this article, the maximum level for target sam- pling is approximately 970. However, it is important to note that the theoretical upper bounds are no more than benchmarks for the maximum possible level of sampling. In practical situations, the optimal level may be considerably lower than these upper bounds. In such cases, the actual values will depend on the values for the various parameters used in the model.
Address correspondence to Dipak Jain, Kellogg Graduate School of Management, Northwestern University, Leverone Hall, 2001 Sheridan Rd., Evanston, IL 60208.
.I PROD INNOV MANAG 1995;12:124-135 0 1995 Elsevier Science Inc. 655 Avenue of the Americas, New York, NY 10010
0737-67821951$9.50 SSDI 0737-6782(94)00042-E
DETERh4INING OPTIMAL PRODUCT SAMPLING
Introduction
S amples are offers of a free amount or a trial of a product for consumers. A sample might be de- livered door-to-door, sent in the mail, picked up
in a store, found attached to another product, or fea- tured in an advertising offer [ 12, chap. 231.
Prciduct sampling is one of the most effective ways to int reduce a new product [ 191. The best way to demolnstrate a product’s superiority is to get the target custo.ner to try it. Sampling enables a firm to achieve this. Sampling, in fact, offers a firm an effective ve- hicle to create brand awareness, promote brand iden- tity, jmprove brand loyalty, and expand product cat- egory’. By distributing samples to a competitor’s customers, sampling also offers a firm an effective offensive mechanism to negate the competitor’s pro- moticlnal programs and to encourage brand switching. Sampling is one of the most widely used consumer- prom Xional tools. According to a survey conducted in 1990 by Donnelley Marketing Inc., 75% of the major corpcrations in the survey used sampling as a promo- tional tool for their new products, and 52% used it for their :stablished products [6]. In fact, after direct con- sume’. coupons and cents-off promotions, new product
BIOGRAPHICAL SKETCHES
&ak Jain is the Sandy and Morton Goldman Professor in Entre- pre-eurial Studies, and Professor of Marketing at the Kellogg Graduate School of Management, Northwestern University. His rest arch interests focus on the areas of market segmentation and con petitive market structure analysis, new product diffusion and forecasting models, and choice models for analyzing the impact of marketing mix variables on consumer purchase behavior using sea xw panel data. He is an associate editor of the Journal of Bu: :ness and Economic Sfatistics, the Journal of Management Sci- enc *, and area editor of Marketing Science. He is also a member of the editorial board of the Journal of Marlieting and the Journal of Mu ,kering Research.
wy Mahajan is the John P. Harbin Centennial Chair in Business, Graduate School of Business, The University of Texas at Austin. He has written extensively on new product diffusion, marketing strategy, and marketing research. He serves on the editorial review boaI-ds of several journals including Journal of Marketing, Journal ofh,‘arketing Research, Marketing Science. and Journal of Product Inn.wtion Management. He currently serves as the editor of the Journal of Marketing Research.
Eitan Muller is a Professor of Marketing and Associate Dean at the Recanati Graduate School of Business Administration, Tel Aviv University, Tel Aviv, Israel. He has published extensively on new product diffusion and currently serves on the editorial boards of Marketing Science and the Journal of Marketing Research.
J PROD INNOV MANAG 125 1995;12:124-135
sampling was the third most popular consumer- promotional tool used by the survey firms.
Sampling is more effective than other consumer- promotional tools when consumers without direct ex- perience find that verifying the claims of the product is either difficult or risky. Some situations commonly encountered include: (1) a product’s features or ben- efits can not be fully conveyed in advertising (e.g., a unique flavor or aroma in food products and cosmet- ics) or there are restrictions on how and where a prod- uct can be advertised (e.g., ban on broadcast adver- tising for cigarettes); (2) the product has some new or improved features that can be appreciated to overcome adoption risk only when the product is tested and used by the target customers (e.g., computers, computer softwares, ethical drugs, text books, and cosmetics); and (3) word-of-mouth plays a major role in influenc- ing the product adoption, and hence trial among inno- vators, early adopters, and other key influencing agents is critical to the success of the product (see
Pll). Despite its advantages, because samples are offered
free, sampling is also one of the most expensive ways to introduce a new product. For example, when intro- ducing its new Surf detergent, Lever Brothers distrib- uted free samples to four out of five American house- holds at a cost of $43 million [ 12, chap. 231. One of the earlier most expensive sampling programs for a new product in the U.S. was undertaken by S.C. Johnson & Sons in 1977. To introduce Agree cream rinse to prospective customers, the company distrib- uted more than thirty-one million free samples of the product [25]. It has been estimated that of the $2.5 billion spent annually by the cigarette industry on pro- motion, including media advertising, 7%-8% of its is invested in sampling [13]. A recent article published in Business Week has discussed the importance of sampling in the software industry. A personal-finance software firm promised to give free samples of the programs to the first one million customers who agreed to pay the shipping charges as part of their new product introduction strategy [7].
Given the high costs associated with sampling, the following two questions need to be considered in the development of cost-effective product sampling plans: who should be offered a free sample of the product? How many samples should be distributed?
Companies have attempted to deal with the first question by avoiding the shotgun approach and iden- tifying the target market by having the interested cus- tomers write in for samples or pick them up in a store.

126 J PROD INNOV MANAG 1995:12:124-135
D. IAIN ET AL.
In addition, some commercial vendors have also de- veloped “selective targeting” approaches to identify the likely customers of a product for promotional pur- poses (e.g., Carol Wright Share Force Program of- fered by Donnelley Marketing, see [23]). Although pretest new product forecasting models such as TRACKER [3] and ASSESSOR [26] study the sensi- tivity of product sampling on the early sales of new consumer-packaged goods, to the best of our knowl- edge, no guidelines or approaches have been sug- gested to deal with the second question for products (both durables and nondurables) for which word-of- mouth plays a major role in influencing the product adoption. Examples of such products include new products that try to establish their own market niches (e.g., products that are designed for certain target mar- kets, such as computer software), are new to the mar- ket (e.g., picture telephones), possess patent protec- tion (e.g., ethical drugs), or have enough lead time over their competitors due to product technology or unique features to establish themselves in the market- place.’ In all these situations a firm enjoys a monop- olistic situation for a while before facing competition. For these types of products it is important to determine the optimal number of product samples to generate trial among innovators, early adopters, and other key influencing agents who are critical to the success of the product.2
The objective of this article is to investigate this question. Our underlying thesis is that in any target market the “right” amount of sampling is required to initiate the adoption of a product. Too little sampling may not generate enough trials to initiate the diffusion process for the product, and too much sampling may be a waste of the firm’s resources. We use a diffusion modeling approach to investigate this problem [24].
The organization of this article is as follows. The following section delineates the necessary analytical formulations. Based on these analytical formulations, simulation results are presented next. The article con-
’ In the November 22, 1993 issue of Business Week [4], there is an advertisement from WordPerfect emphasizing the importance of word-of- mouth.
’ Our observation is also based on a small survey of ten firms that extensively use product sampling. The survey included four consumer- packaged firms, one computer company, one publishing firm, two adver- tising agencies, one consulting firm active in the pharmaceutical industry, and one consulting firm active in the consumer-packaged industry Al- though respondents from these firms confirmed the importance of the problem, they indicated that they were not aware of any empirical or analytical approaches that deal with this issue. No discussion could be found in recent textbooks on sales promotion such as [2].
eludes with limitations and further extensions of the results and the underlying approach.
Analytical Formulations
The modeling framework determining the optimum levels of product sampling builds on the dynamics of the innovation diffusion process, the process by which an innovation is communicated through certain chan- nels among the members of a social system [24]. The underlying behavioral theory in the development of the analytical model is that the innovation is first adopted by innovators, who, in turn, influence other members of the system (through word of mouth) to adopt it. In other words, the activation of interpersonal communication in a social system is initiated by the innovators and they play a major role in influencing the rate of new product acceptance in the marketplace.
In recent years, a number of mathematical models have been proposed to capture the communication dy- namics of the diffusion process and unfold the S-shaped nature of its adoption curve. The Bass model [I], the most popular model in marketing, for exam- ple, describes the diffusion process by the following differential equation:
n(r) =
= a (m - N(t)) + bN4 y Cm - N(t))
and
(1)
N(t = 0) = No (2)
where N(t) denotes the cumulative number of adopters by time t, &V(t)/& or n(t) gives the rate of change in the cumulative number of adopters at time t or the noncumulative number of adopters at time 1, m repre- sents the market potential or the number of potential adopters, and a and b denote the coefficients of inno- vation (external influence) and imitation (internal in- fluence), respectively.3 The term a(m - N(t)) defines adoptions due to external influence (e.g., advertising, promotion, etc.) and bN(t)(m - N(t))/m defines adop- tions due to the word-of-mouth influence.
3 In fact, as shown by Mahajan et al. [17], the coefficient a also measures the proportion of innovators (as compared to other four adoption categories: early adopters, early majority, late majority, and laggards de- fined by Rogers 1241).

DETER.MINING OPTIMAL PRODUCT SAMPLING J PROD INNOV MANAG 127 1995;12:12&135
Equation (2) represents the initial value condition indicating the number of adopters N, at the beginning of the diffusion process, i.e., at t = 0. Traditionally, the v-alue for N, has been assumed to be zero. We posnlate that product sampling can be an effective way CO create an initial pool of “adopters,” and this pool along with the regular group of innovators will influ :nce other potential adopters via word-of-mouth. In ot rer words, the rationale behind creating the initial pool is to enhance the rate of product adoption.
It should be noted that in recent years several at- tempts have been made to study the impact of other marketing mix variables on the diffusion of a new prod,lct. (For a comprehensive review see [ IS].) Ex- amp: es included pricing [lo], advertising [9], distri- bution [ 1 I], and detailing [ 141. Despite such efforts, to tlte best of our knowledge no efforts have been made: to study the impact of sampling on the diffusion of a new product. This is also confirmed by the com- prehensive sales promotion literature provided by Blat berg and Neslin [2].
D:fining F(t) = N(t)lm, f(t) = n(t)lm and F, = N&, equations (1) and (2) can be restated in terms of the proportion of potential adopters. That is,
f(f) = y = (a + bF(t))(l - F(t)) (3)
and
F(t = 0) = FIJ (4)
Usirlg the initial condition (4), solution of the differ- ential equation (3) can be derived to show the rela- tion,,hip between sampling, F,, adoption curves, F(t) and f(t), and their values, F(P) and fit*), at the peak timr t* (i.e., point of inflection of S-shaped curve F(t) or Ileak of f(t)). The expressions for F(t), f(t), t*, F(t* ), f(t*) are presented in Exhibit 1.
The quantity
in t’f ie second term on the right-hand side of expression (C) I-or t* in Exhibit 1 represents the change that would occur in the time to peak because of the number of adopters at the beginning of the diffusion process gen- erated through product sampling. Note that since (1 + (b/a)F,)l(l - F,) is greater than 1, t* is reduced by this quantity. It is clear that the larger F, is, the larger will be the reduction in t*.
Exhibit 1. Relationships Between Sampling Level F, and Adoption Patterns for the Bass Model
Cumulative proportion of adopters at time t:
Proportion of adopters at time t:
fw =
s (a + b)z &U - b)t 41 - Fo) --(= - bji
> *
09
l+(a+
Peak time:
1 a + bFo
t* = -(a In b(1 - Fo)
((3
Cululative proportion of adopters at t*:
Proportion of adopters at t*:
(a + b)’ f@*) = yg-- (El
Expressions (A)-(E) in Exhibit 1 show that F, ef- fects F(t), the cumulative proportion of adopters; f(t), the noncumulative proportion of adopters; and t*, the peak time of the adoption curve. It does not effect F(t*) andf(t*), the cumulative and noncumulative pro- portions of adopters at the peak time, respectively. In other words, it shifts the adoption curve to achieve the same level of adoption earlier in time thereby accel- erating product diffusion.
Relationship Between DifSusion and Sampling
As discussed earlier, product sampling is used to dem- onstrate a product’s superiority and to get a potential customer to try the new product. In the innovation diffusion context, the objective of the product sam- pling is to initiate the diffusion process and to influ- ence the adoption curve. In the Bass diffusion model, this characteristic of the diffusion process is captured by equation (4) that specifies the fraction of adopters at the beginning of the diffusion process and hence

128 I PROD INNOV MANAG 1995;12:124135
D. JAIN ET AL.
defines the fraction of individuals who adopt the prod- uct before the initiation of the diffusion process. The question now is how does product sampling, i.e., F, in equation (4), influence the diffusion process.
The dynamics of the product sampling are depicted in Figure 1. As Figure l(A) shows, as the size of the product sampling is increased (i.e., F, is increased from zero to 12%), it helps to achieve the peak earlier.
Note that in the model formulation summarized in Exhibit 1, product sampling FO has no impact on the coefficients (i.e., a and b) of the diffusion model. We define such sampling as neutral sampling. The main objective in neutral sampling, therefore, is to shift the adoption curve to achieve the same level of penetra- tion or the adoption level earlier in time. Neutral prod- uct sampling generally will be observed in those prod- uct sampling cases where samples are not targeted to opinion leaders, innovators, or early adopters. This strategy may be used by firms (e.g., text book pub- lishers, pharmaceutical, or cosmetic firms) that are interested in accelerating the initial adoption and can not wait to fully exploit the word-of-mouth dynamics.
One may also argue that because sampling is ex- pensive for firms, it may not be economical to give free samples to every potential adopter. This raises
Figure 1. Impact of product sampling on innovation diffusion patterns.
(a) NEUTRAL SAMPLING
1 1% (II) TARGET SAMPLING
I
a=.01 -.03 b=.35 r=.10 p=$100 c=540
2 4 6 8 10 12 14 16 18 20 22 24 26 28 30 TIME
0 F, = 0% 0 F, = 4% m F, = 8% l F,=:Z%
another question-who should be given the free sam- ples? One possibility may be to target the samples to a specific group-e. g . , opinion leaders, innovators, or early adopters. The rationale behind this type of target sampling is to create a seed of innovators/change agents who, through word-of-mouth communication, will create additional adopters of the product. Hence, target sampling influences the adoption curve by gen- erating additional innovators/opinion leaders and compliments the coefficient of innovation, a. There- fore, in order to capture sampling effect on the coef- ficient of innovation, we represent this coefficient as a function of the sampling level F,, i.e.,
a = W,) (5)
The functional relationship + between a and the product sampling level F, may be linear or may ex- hibit diminishing marginal returns with increasing F,. One specification for +(F,) may be the formulation used in the diffusion literature to capture the effects of marketing mix variables such as advertising [9]:
4Fo) = a + P log (1 + Fo) (6)
where @ measures the impact of sampling on the co- efficient of innovation and 01 is another parameter that equals the coefficient of innovation a when there is no sampling. The logarithmic specification ensures di- minishing marginal returns of product sampling. It is conceptually appealing and its empirical performance has been examined by [9].
Substitution of equation (6) in equation (3) and fur- ther expansion of terms yields:
= cY( 1 - F(t)) + p log (1 + Fo)(l - F(t))
+ bF(t)(l - F(t)) (7)
If p = 0, a = (x, equation (7) reduces to equation (3) and hence, as discussed earlier, it captures neutral sampling (with the initial condition given by equation (4)). The term p log (1 + FO) (1 - F(t)) in equation (7), therefore, captures the impact of sampling on the growth of the product. This impact on the potential adopters is captured by 6 log (1 + F,). In this respect, target sampling complements adoptions created by other external sources of influence (i.e., cx( 1 - F(t)).
Note from expressions (A) through (E) in Exhibit 1 that as the targeted product sampling F, influences the coefficient of innovation in the Bass model, in addi- tion to the cumulative and noncumulative fraction of

DETERMINING OPTIMAL PRODUCT SAMPLING J PROD INNOV MANAG 129 1995:12:124135
adopters, it also impacts the peak of the adoption curve (i.e., t*, f(t*) and F(t*)) given respectively by expressions (C) through (E). Figure l(B) graphically shows such influences. As depicted in Figure l(B), an increase in the size of the product sampling influences the rate of adoption as well as the peak of the adoption curve. Target sampling accelerates the diffusion pro- cess resulting in a higher peak earlier in time than wher. there is no sampling. That is, by targeting the sampling to a group of innovators and early adopters, both thle rate of adoption and the timing and the peak of the adoption curve can be influenced.
Determination of Optimal Product Sampling Size
The Iobjective of sampling is to initiate the diffusion proc:ss. As discussed earlier, too little sampling may not E enerate enough adoptions to initiate the diffusion proc.:ss for the product, and too much sampling may be a waste of the firm’s resources. The question, therc.fore, is what should be the optimal size of the prodllct sampling? We suggest here a discounted cash flow framework to answer this question.
To appreciate the formulation, note that if the firm is not engaged in any sampling, its discounted cash flow (net present value) is given by:
I cc
?-T= e-“@ - c)(dN(t)ldt)dt (8) 0
whe+e p and c are the price and cost of the product, r is the discount rate, N(t) follows equation (1) and at time zero, N, = 0.
Consider first the case of neutral sampling where the -‘ir,m offers product samples and decides about an opti nal level of N,. The cost of handling the sample is h prmr unit. This includes labor and material cost of wral-iping, shipping and handling the sample. It does not nclude the cost of production (c). We also assume that the firm does not charge any price for the sam- ple- -i.e., the product is a giveaway.
Tlhe problem, therefore, is to find an optimal N, so as tli maximize:
(p - c)(dN(t)ldt)dt - (h + c)No (9)
where dN(t)ldt is given by equation (1) for neutral sampling.4 Substitution of the value of the coefficient
4 It should be noted that because equation (8) does not involve No, maxi.nizing equation (9) with respect to N, is equivalent to maximizing equation (9) less equation (8).
of innovation from equation (6) in equation (1) yields dN(t)/dt for target sampling. It should be noted that the modeling framework assumes N, d m. In other words, we assume that m includes everybody in the market who is a potential customer; if this is not true, then our model needs to be extended to incorporate the cost of sending a free sample to a person who is not a potential customer of the product. Furthermore, we assume that each potential customer receives only one free sample of the product.
The Bass model, equation (l), has been developed to capture the adoption dynamics of a durable-type innovation. There are nondurable products (such as ethical drugs) in which although word-of-mouth plays a critical role in generating the first-purchase adoption curve, the overall success of the product depends upon repeat adoptions. For such products, it is, therefore, important to determine the optimal size of product sampling by simultaneously considering its influence in generating the first-purchase adoptions as well as subsequent repeat adoptions. Following [ 141 and [ 181, if we assume that for a nondurable product the total adoptions at any time t are composed of first-time adopters, given by equation (1), and a certain percent- age w of the total number of current adopters, equation (9) can be extended to determine optimal product sam- pling for nondurable products. In this case, the firm maximizes the net present value given by
J‘
dW q-r = x p(p - c) 0
7 + wN(t) dt - (h + c)No
(10) When w = 0, equation (10) reduces to equation (9). Again, in equation (lo), dN(t)ldt is given by equation (1) for neutral sampling and substitution of equation (6) in equation (1) gives dN(t)ldt for the target sam- pling. For clarity in presenting the results, hereafter, we consider determining an optimal value of F, (= No/m).
Although equations (9) and (10) specify the optimi- zation formulation to determine the optimal size of product sampling for both durable and nondurable products, respectively, they cannot be integrated to generate explicit closed-form formulae to determine F,. They, however, can be solved numerically to find the optimal values of F, for given values of p, c, w, h, r, a, (or (x and B in equation (6)), b and m in equations (9) and (10). Assuming various values of these param- eters, we solve the equations numerically in the next section to obtain some flavor about the nature and role of product sampling on the diffusion process. As

130 J PROD INNOV MANAG 1995:12:12&135
D. JAIN ET AL.
shown in the Appendix, however, we can derive upper bounds for the size of F,. These upper bounds are summarized in Table 1 and specify the maximum sam- pling a firm should do for a given product. For exam- ple, for a durable-type innovation, F, < F(t*) in neu- tral sampling and F, < F(t*) + B/2b for target sampling, where F(t*) is given in Exhibit 1. Similarly, for nondurable product F, < F(t*) + w/2b for neutral sampling and F, < F(t*) + (w + P)/2b for target sampling.
To sum, for a given innovation, Table 1 can be used to ascertain the maximum product sampling that a firm should do, In addition, equation (9) or equation (10) can be solved numerically to obtain the optimal size of product sampling.
Numerical Analysis and Results
In order to examine the effect of product sampling on the diffusion process, we numerically solve equations (1)) (2), (9) and (10) to determine the optimal levels of F, under a set of values for the parameters a, b, m, r, p, c, h, and w. The numerical procedure involves solving the system dynamics equations, i. e , equations (1) and (2), and the equations representing the NPV value for the firm, i.e., equations (9) and (10). For each given set of parameter values we first solve equa- tion (1) using the Euler-Cauchy numerical method [5] on Lotus 1-2-3. We select a finite time horizon of 30 periods. This time horizon is long enough for the cu- mulative sales to achieve its maximum and for the noncumulative sales to reach a zero level. We then compute the net present values using the discrete form of equation (9):
for each given set of the parameter values and a chosen value for N,,.
For numerical analysis, the base set of parameter
Table 1. Upper Bounds for Sampling Level F,”
Sampling Tvve Durable Product Non-Durable Product
Neutral F, < F(t*) F, < F(t*) + wl2b Target F, < F(t*) + @/2b F, < F(t*) + (w + P)Rb
u F(t*) is the level of penetration when adoptions reach a maximum at time t*; w is the repeat rate; p is the responsiveness of the coefficient of inno- vation to target sampling; b is the coefficient of imitation; m is the market uotential.
values chosen are: a = 0.02, b = 0.35, m = 54 million, r = 0.10, p = $100, c = $40, and h = $10. The values for the diffusion parameters a, b, and m are the averages of the values of these parameters for the eleven consumer durables analyzed by Bass [l] .5 The other parameter values were conveniently selected for illustration purposes; however, we vary them over a reasonable range in our analysis.
The optimal level of product sampling is the value of F, (= No/m) at which the NPV achieves the max- imum value. Using the previously stated set of param- eter values, we obtained the results shown in Table 2. Based on Table 2, the optimal level of sampling in the neutral case is 3%. Performing a similar analysis for target sampling, we find the optimal level to be 4%.
We also obtain the optimal levels of neutral and target sampling by varying each parameter one at a time over a suitable range. A summary of these results is provided in Table 3.
Figure 2 provides a feel for how sensitive the opti- mal levels of product sampling are to the changes in the values of the diffusion parameters (coefficients of innovation and imitation), discount rate, and the gross margin. Figure 2 suggests the following:
1.
2.
3.
4.
If the coefficient of innovation is high, it is not optimal to have a high sampling level. Given the high value for the coefficient of innovation, there would be enough innovators for the product to take-off, and any attempt to generate additional innovators through sampling may be a waste of resources. If the value of coefficient of imitation is high, the sampling level should be high because high sam- pling levels would induce significant trial for the product that is essential for the word-of-mouth to have its effect. However, beyond a certain value of the imitation coefficient, the sampling level stabi- lizes and does not increase any more. If the discount rate is high, then the sampling level should also be high. However, for neutral sam- pling, the optimal level of sampling becomes con- stant after certain value of the discount rate. If the gross margin (i.e., (pricexost of produc- tion)/price) is high, then the sampling level should also be high in order to induce trial and subse- quently generate word-of-mouth effect.
5 In the case of target sampling. the value for the coefficient of inno- vation, a, is obtained from equation (6) by using the average values for the parameter 01 and p reported in [9]. The chosen values of cx and p are o = 0.013 and p = 0.0134.
DETERMINING OPTIMAL PRODUCT SAMPLING .I PROD INNOV MANAG 131 1995;12:12&135
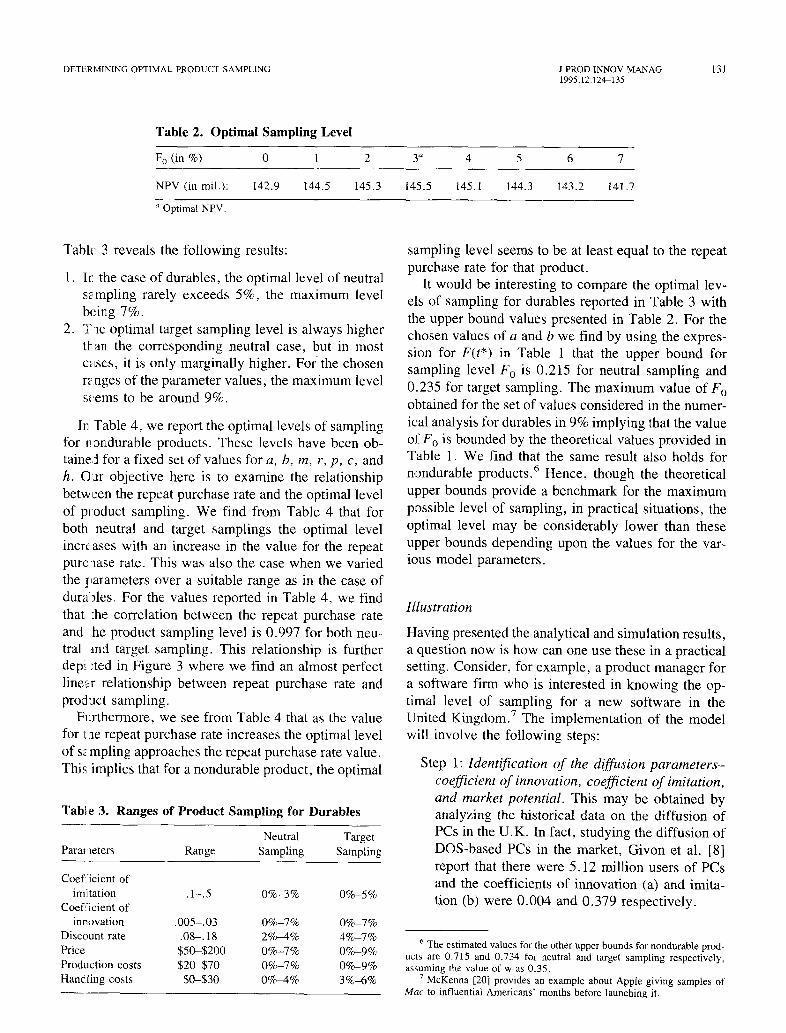
Table 2. Optimal Sampling Level
Fo (in %) 0 1 2 3” 4 5 6 7
NPV (in mil.): 142.9 144.5 145.3 145.5 145.1 144.3 143.2 141.7
a Optimal NPV.
Tablic: 3 reveals the following results:
1. Ir the case of durables, the optimal level of neutral sampling rarely exceeds 5%, the maximum level btring 7%.
2. Tie optimal target sampling level is always higher ttan. the corresponding neutral case, but in most czes, it is only marginally higher. For’ the chosen rz nges of the parameter values, the maximum level s< ems to be around 9%.
In Table 4, we report the optimal levels of sampling for I! ondurable products. These levels have been ob- tained for a fixed set of values for a, b, m, r, p, c, and h. OJr objective here is to examine the relationship between the repeat purchase rate and the optimal level of product sampling. We find from Table 4 that for both neutral and target samplings the optimal level increases with an increase in the value for the repeat pure lase rate. This was also the case when we varied the Ilarameters over a suitable range as in the case of dura..Aes. For the values reported in Table 4, we find that :he correlation between the repeat purchase rate and he product sampling level is 0.997 for both neu- tral md target sampling. This relationship is further dep-l :ted in Figure 3 where we find an almost perfect 1inez.r relationship between repeat purchase rate and prod Jet sampling.
Fl:.rthermore, we see from Table 4 that as the value for rle repeat purchase rate increases the optimal level of sz mpling approaches the repeat purchase rate value. This implies that for a nondurable product, the optimal
Table 3. Ranges of Product Sampling for Durables __-
Neutral Target Parameters Range Sampling Sampling
Coef.icient of imitation .l-.5 0%-30/c O%-5%
Coefficient of innovation .005-.03 O%-7% O%-7%
Discount rate .08-. 18 2%4% 4%-7% Price $x-$200 O%-7% O%-9% Production costs $2@$70 O%-7% O%-9% Hakling costs $G$30 0%4% 3%-6% -.
sampling level seems to be at least equal to the repeat purchase rate for that product.
It would be interesting to compare the optimal lev- els of sampling for durables reported in Table 3 with the upper bound values presented in Table 2. For the chosen values of a and b we find by using the expres- sion for F(t*) in Table 1 that the upper bound for sampling level F, is 0.215 for neutral sampling and 0.235 for target sampling. The maximum value of F, obtained for the set of values considered in the numer- ical analysis for durables in 9% implying that the value of F, is bounded by the theoretical values provided in Table 1. We find that the same result also holds for nondurable products.6 Hence, though the theoretical upper bounds provide a benchmark for the maximum possible level of sampling, in practical situations, the optimal level may be considerably lower than these upper bounds depending upon the values for the var- ious model parameters.
Illustration
Having presented the analytical and simulation results, a question now is how can one use these in a practical setting. Consider, for example, a product manager for a software firm who is interested in knowing the op- timal level of sampling for a new software in the United Kingdom.7 The implementation of the model will involve the following steps:
Step 1: Identification of the diffusion parameters- coefficient of innovation, coefficient of imitation, and market potential. This may be obtained by analyzing the historical data on the diffusion of PCs in the U.K. In fact, studying the diffusion of DOS-based PCs in the market, Givon et al. [8] report that there were 5.12 million users of PCs and the coefficients of innovation (a) and imita- tion (b) were 0.004 and 0.379 respectively.
6 The estimated values for the other upper bounds for nondurable prod- ucts are 0.715 and 0.734 for neutral and target sampling respectively, assuming the value of w as 0.35.
’ McKenna [20] provides an example about Apple giving samples of Mac to influential Americans’ months before launching it.

132 J PROD INNOV MANAG 1995:12:124-135
D. JAIN ET AL
6%
5%
Levels of 4O, Sampling a
3%
1% Coefficient
0 of Innovation
0 .005 .Ol ,015 .02 ,025 .03
4% Levels of Sampling 3%
Discount , Rate
0 6% 8% 10% 12% 14% 16% 16%
6%
Levels of Sampling
4%
Step 2: Specification of the discount rate. A com- monly used value for the discount rate is lo%, although one may assume a higher or lower value depending on the economic condition.
Step 3: Determination of the price of the product. It is a part of the firm’s marketing plan as price is one of the key marketing-mix variables. For ex- ample, for the illustration we assume the price of the new software to be about $250.
Step 4: Estimation of the product’s unit cost and handling cost. The unit cost of producing the product is available to the firm from its internal records. For the particular software discussed here, the unit cost is assumed as $83. The han- dling cost can be easily estimated based on the cost of wrapping and shipping the sample. Firms over time develop a good estimate of this cost, and in the present context it was assumed to be about $25.
Step 5: Substitution of the various parameter values in the analytical formulation to obtain the opti- mal sampling levels. Using the set of parameter values stated in the previous steps and holding the
Coefficient of Imitation
Figure 2. Parameter sensitivity of optimal levels of sampling for durables.
Gross Margin
effects of other marketing-mix variables (e.g., price, advertising) constant, the results obtained for the optimal sampling level for the U.K. mar- ket are presented in Table 5. Based on net present value figures (equation (9)), Table 5 indicates that the optimal level of sampling is 8% for neu- tral sampling and 7% for target sampling. The proposed analytical framework, therefore, pro- vides a systematic way for obtaining the product sampling levels rather than choosing an arbitrary value based on a certain ad-hoc procedure.’
Summary
In this article we have provided an analytical frame- work that enables one to assess the impact of product sampling on the diffusion of new products, both du- rables and nondurables where word-of-mouth plays a major role in influencing the product adoption and
* For target sampling, the chosen values of 01 and p in equation (6) were chosen based on the average values reported in [9].

DETERMINING OPTIMAL PRODUCT SAMPLING
Table 4. Optimal Levels of Sampling for Nondurables”
Repeal: Rate (w) -.
Neutral Sampling Target Sampling
0% 3% 5%
5% 9% 11% IO% 14% 17% 15% 21% 22%
20% 26% 28%
25% 32% 33% 30% 37% 38%
35% 42% 43% $O% 46% 48%
15% 52% 52% 50% 56% 57% 59% 60% 61% 150 7% 64% 64% 55% 68% 68% 70% 72% 12%
u The ,ial-Jes for the other parameters are: a = .02, b = -35, m = 54 Mil, r = 0 10, p = $1.00, c = $0.40. h = $0.10.
hence trial among innovators, early adopters, and othe - key influencing agents is critical to the success of thle product. Our analysis has focused on determin- ing the optimal size of product sampling before a new product is launched in the marketplace and where a new product enjoys a monopolitic situation for a while befol-e facing competition. Given that product sam- pling is an expensive way to introduce a new product, we use a discounted cash flow framework that incor- poral:es various costs associated with the distribution of fme samples.
R’e derive the optimal levels of product sampling under two cases: (1) neutral sampling-i.e., when the distribution of free product samples only shifts the adoption curve such that a certain level of penetration is attained earlier than the time it would take in the absence of any product sampling; (2) target sam- plinl;--i.e.) when the free samples are distributed di- rect] y to influence the diffusion parameters, especially the coefficient of innovation. In this case, product samJling not only accelerates the rate of adoption but also leads to higher peak sales. These two types of sam3ing cover a wide variety of situations a product manager may face while introducing new products.
Our results clearly indicate the relationship between levels of sampling and the values of the coefficients of inncvation and imitation, the discount rate, and the gross margin. Based on a given set of parameter val- ues, and holding the effects of marketing-mix vari- ables constant, the numerical results suggest that for
J PROD INNOV MANAG 1995:12:124-135
80% , (a) NEUTRAL SAMPLING
60%
50%
Levels of 40”/ Sampling ’
30%
80% , (b) TARGET SAMPLING
60%
50%
Levels of 4oy0 Sampling
30%
20%
10%
a=.oi-.03
El0
c=$40 h=SiO
0%
0.05.1 .15.2.25.3.35.4.45.5 .55.6.65.7:
133
Repeat Rate
5
Repeat Rate
5
Figure 3. Relationship between repeat rate and product sam- pling for nondurables.
durables the optimal sampling levels are not more than 9% of the total market potential. As a “benchmark” level, one may choose a value in the 5%-7% range. For nondurables, we find that for “small” values of repeat purchase rate, the optimal level of sampling is greater than the repeat rate. However, as the repeat rate increases, the optimal sampling level becomes almost equal to the repeat purchase rate for the prod- uct.
This study is not without limitations. For example, we have not incorporated the effect of competition. This can be studied using a game-theoretic frame- work. Future research may be directed toward ad- dressing the issue of competition in analyzing the im- pact of product sampling. In our analysis we have assumed that the samples are distributed free. If the firm charges a certain price for the sample, it is pos- sible to incorporate it in our framework and derive the optimal levels of sampling.
In order to obtain the optimal levels we have as-

134 .I PROD INNOV MANAG 1995;12:12&135
Table 5. Optimal Sampling Levels for the U.K. Market
D. JAIN ET AL.
F, (in %I 0 1 2 3 4 5 6 I 8 9 10
NPV (Neutral) 251.2 291.8 315.1 330.1 340.2 346.9 351.8 353.4 354.2” 353.8 352.3 NPV (Target) 323.1 342.7 355.6 364.3 370.0 373.5 375.3 315.6’ 374.8 373.1 370.5
D Optimal sampling level under neutral sampling. b Optimal sampling level under target sampling.
sumed that sales of the product evolve according to a Bass model. Although the diffusion model [l] has been found appropriate for many product categories, recently several extensions of this model have been suggested in the literature that incorporate marketing- mix variables [lo]. It may be of interest to derive the optimal sampling levels while incorporating the ef- fects of marketing-mix variables, as it would provide additional insights into the interactive effects of prod- uct sampling and other marketing-mix variables on the diffusion of new products. Such an analysis can be performed within the proposed framework by replac- ing the system dynamics equation (1) by the alterna- tive model formulation or incorporating effects of these variables in equation (7). Further, other growth models, e.g., Gompertz [ 161, can also be easily ana- lyzed using our framework.
For certain products a firm is not able to use some effective advertising vehicles such as television (e.g., cigarettes) when introducing new products. Conse- quently, the firm may not be able to create enough awareness before the product is launched and therefore the coefficient of innovation of a diffusion pattern may be smaller than when television advertising is possible [9]. In that case, one may consider product sampling as a substitute to advertising.
In summary, the major contribution of this article has been to provide a parsimonious analytical method to determine the optimal levels of product sampling using a diffusion modeling approach. As noted by Preveger [22], “Sampling has become a much more sophisticated operation than one might have imagined a few years ago.” Given this observation, we feel that the results obtained provide useful insights about the nature of impact of product sampling on the diffusion of a new product and also help product managers in developing effective marketing strategies for new product development.
The authors thank Sridhar Moorthy of the University of Rochester, Moshe Givon of Tel Aviv University, and two anonymous review- ers for their valuable comments and suggestions. Financial support
provided to the first author from the Center for Marketing Sciences at the J. L. Kellogg Graduate School of Management, Northwest- em University, is greatly appreciated.
Appendix: Derivation of the Upper Bounds for the Size of Product Sampling F, (= N&z)
We consider the general case (target sampling for a repeat purchase product) in which the firm maximizes the net present value given by
where
N(t = 0) = No 1.44
and
a = a + @log ( >
1 + 2
Clearly, the other cases can be obtained from the above formualtion as follows:
Neutral sampling for a durable product:
Target sampling for a durable product:
Neutral sampling for a repeat purchase product:
set w = 0, l3 = 0
set w = 0
set l3 = 0.
The first-order condition for optimality for the formu- lation given in (A. l)-(A.3) is obtained by differenti- ating (A.l) with respect with No and is given by:
c + h = f
= e-” 0

DETER:tiINMG OPTIMAL PRODUCT SAMPLING J PROD INNOV MANAG 1995;12:12&135
135
Perfcrming the differentiations and simplifying, we get
c+/z= f
s e-‘$3 - c)Xe-“’ -A2( 1 - Se-“)
0 (1 + Se-xt)3 i
(a + bFo)2
f3XS(l - 8eKX’) 2pS(l + Se-“) -
b(1 + F&a + bFo) + Ml + Fo)
wX(1 + 6e-“‘)
+ (a + bFo)2 -
ht6( 1 - Se-“) dt
b 1 (A.3 whel e
X=a+b I.
s = Ml - Fo)
(0 + bFo)
If 6 > 1 then
b(1 - FO) > a + bFo
which implies
; 1-E >Fo ( > Or, tising expression (D) from Exhibit 1, we get
F. < F”
where F* represents F(t*) without the argument t. Therefore, all the other upper bounds in Table 1 are established since they involve F* plus a non-negative qua:ltity .
Cln the other hand, if S < 1, then it can be shown (by differentiation) that the expression in the square brackets in (A.5) is decreasing in time. Therefore, at t = 0, the expression must be positive, otherwise the rigt t hand side of (A.4) is negative and the equality in (A. ‘Y) cannot hold. Evaluating the expression within the square brackets at t = 0, we get the following:
w(1 + 6) - X(1 - 6) - I31 $l,- 6) 0
2p(l - Fo)(a + bFo)(l - 6) -
Vl + Fo) I >o
Substituting for 6 and h in the above equation, we get 21
W PC1 - Fo)
FoiF*+2b+2b(l+Fo)2
< F* + (w + ‘) 2b
since
(1 - Fo) (1 + Fo) < I
References 1.
2.
3.
4.
5.
6.
8.
9.
IO.
11.
12.
13.
14.
15.
16.
17.
18
19
20
22
23
24
25
26
Bass, Frank M. A new product growth model for consumer durables. Management Science 15:215-221 (January 1969).
Blattberg, Robert C. and Neslin. Scott A. Sales Promotion, Engle- wood Cliffs, NJ: Prentice Hall, 1990.
Blattberg, Robert C. and Golanty, John. TRACKER: an early test market forecasting and diagnostic model for new product planning. Journal of Marketing Research 15: 192-202 (May 1978).
Business Week. A Few Words on Word Processing. (November 22, 1993).
Curtis, Gerald. Applied Numerical Analysis, Reading, MA: Addison- Wesley, 1980.
Donnelley Marketing Inc. Survey shows popularity of trade promotion and consumer databases. Potentials in Marketing, p. 49 (May 1991).
Eng, Paul M. Below bargain basement: software freebies. Business Week 88 (November 1993).
Given. Moshe, Mahajan, Vijay and Muller, Eitan. Software piracy: estimation of lost sales and the impact on software diffusion. Journal of Marketing (in press).
Horsky, Dan and Simon, Leonard S. Advertising and the diffusion of new products. Marketing Science 2:1-17 (Winter 1983).
Jain, Dipak and Rao, Ram. Effect of price on the demand for durables: modeling, estimation and findings. Journal of Business Economics and Statistics, 8(2):163-170 (1990).
Jones, Morgan J. and Ritz, Christopher J. Incorporating distribution into new product diffusion models. International Journal ofResearch in Marketing 8:91-112 (1991).
Kotler, Philip. Marketing Management. 7th edition. Englewood Cliffs, NJ: Prentice Hall, 1990.
Lazarus, George. Marlboro packs giveaway punch. Chicago Tribune, August 25, Section 3, p. 4, (1989).
Lilien, Gary L., Rao, Ambar G. and Kalish, Shlomo. Bayesian esti- mation and control of detailing effort in a repeat purchase diffusion environment. Management Science 27:493-506 (May 1981).
Mahajan, Vijay, Muller, Eitan and Bass, Frank M. New product diffusion models in marketing: a review and directions for research. Journal of Marketing 54: 1-26 (January 1990).
Mahajan, Vijay and Peterson, Robert A. Models for Innovation Dif- &ion. Beverly Hills, CA: Sage, 1985.
Mahajan, Vijay, Muller, Eitan and Srivastava, Rajendra K. Determi- nation of adopter categories by using innovation diffusion models. Journal of Marketing Research 27:37-50 (February 1990).
Mahajan, Vijay, Wind, Jerry and Sharma, Subhash. An approach to repeat purchase diffusion models. AMA Proceedings. Series 49, Pat- rick Murphy et al. (ed.). Chicago: American Marketing Association, 442446 (1983).
Marks, Lawrence J. and Kamins, Michael A. The use of product sampling and advertising: effects of sequence of exposure and degree of advertising claim exaggeration on consumers’ belief strength, belief confidence, and attitudes. Journal of Marketing Research 25:26&281 (August 1988).
McKenna, Regis. Marketing is everything. Harvard Business Review 69:65-79 (January-February 1991).
Perkins, G. Anne. Free samples: how many is best. Harvard Business Review 72:8-9 (January-February 1994).
Preveger, Robert. Marketing (U.K.) (November 1989).
Priore, Lisa Del. Breaking brand loyalty. Marketing Communications 11:40-43 (October 1986).
Rogers, Everett M. Diffusion of Innovations. 3rd ed. New York: The Free Press. 1983.
Schultz, Don E. and Robinson, William A. Sales Promotion Man- agement, Chicago, IL: Crain Books, 1982.
Silk, Alvin J. and Urban, Glen L. Pre-test market evaluation of new packaged goods: a model and measurement methodology. Journal of Marketing Research 15:171-191 (May 1978).