an appraisal of underground gas storage technologies and incidents, for the development of risk
TRANSCRIPT

Executive Health and Safety
An appraisal of underground gas storage technologies and incidents, for the development of risk assessment methodology
Prepared by the British Geological Survey for the Health and Safety Executive 2008
RR605 Research Report

Executive Health and Safety
An appraisal of underground gas storage technologies and incidents, for the development of risk assessment methodology
D J Evans British Geological Survey Kingsley Dunham Centre Keyworth Nottingham NG12 5GG
with contribution from:
Dr J M West (Microbiology)
This report was commissioned by the Health and Safety Executive to help assess the safety issues associated with the underground storage of natural gas. This has arisen because of the need to consider a number of applications submitted by various operators in the UK who wish to develop such facilities. The rising numbers of applications are as a result of UKCS oil and gas reserves showing rapid decline, to the extent that the UK became a net importer of gas during 2004. The Government recognises that the UK faces an increasing dependency on imports, yet has very little gas storage capacity and is, therefore, at a very real risk of supply shortfalls. It notes that the UK’s capacity to import, transport and store gas and LNG efficiently has to be improved and this will require greater investment in new, timely and appropriately sited gas (and LNG) supply infrastructure, part of which is likely to include (safe) onshore underground (natural) gas storage (UGS) facilities.
This report and the work it describes were funded by the Health and Safety Executive (HSE). Its contents, including any opinions and/or conclusions expressed, are those of the authors alone and do not necessarily reflect HSE policy.
HSE Books

© Crown copyright 2008
First published 2008
All rights reserved. No part of this publication may be reproduced, stored in a retrieval system, or transmitted in any form or by any means (electronic, mechanical, photocopying, recording or otherwise) without the prior written permission of the copyright owner.
Applications for reproduction should be made in writing to:Licensing Division, Her Majesty’s Stationery Office,St Clements House, 2-16 Colegate, Norwich NR3 1BQor by e-mail to [email protected]
ii

Foreword
This report is the product of a study by the British Geological Survey (BGS) into published or reported problems with and incidents at underground fuel storage facilities. It forms part of a risk assessment of underground gas storage in the UK for the Health and Safety Executive for which a contribution by Quintessa is presented in a separate report (Watson et al., 2007).
For ease of use, the BGS report is presented in two volumes. Volume One comprises the text and appendices. Volume Two contains the figures and tables referred to in Volume One.
The report and results contained are subject to either NERC General Conditions of Contract or, if appropriate, conditions previously agreed between NERC and the customer. All such agreements include intellectual property rights (IPR) considerations, including appropriate digital data and copyright licensing fees.
Disclaimer: this is wholly independent and impartial review and appraisal of the technology of Underground Fuel Storage (UFS), the incidents or problems encountered at various facilities and the general geological conditions of those areas, with an overview of the potential or likely areas for underground gas storage (UGS) in the UK, outlining the form that this might take. The BGS report neither promotes nor supports UFS, one particular form of UGS or any proposed facility location. Additionally, it does NOT address the control or prevention of pollution, safety of the surface or subsurface infrastructure: the assumption here being that the design, maintenance and operation of such facilities would be subject to the various HSE, waste and environmental regulations covered by such documents as the COSHH (2002), COMAH (1999) and appropriate British Standards. For specific elements of an underground gas storage facility, e.g. wells and surface installations, and operational procedures, it is assumed that UGS applications would be subject to existing BS standards and legislation for oil and gas exploration and should be applied or referred to in the first instance.
The parallel legislation includes:
• The Health and Safety at Work etc. Act 1974
• The Borehole Sites and Operations Regulations 1995
• The Dangerous Substances and Explosive Atmospheres Regulations 2002
• The Control of Major Accident Hazards Regulations 1999
• The Construction (Design and Management) Regulations 1994 (as amended)
• The Pipelines Safety Regulations 1996
• The Pressure Systems Safety Regulations 2000
These are in addition to the controls imposed under the Planning (Hazardous Substances) Act 1990 and the Planning (Hazardous Substances) Regulations 1992.
Whilst the BGS has made every effort to provide the HSE with a programme of work and report designed to meet their needs, this study is part of work in progress. BGS cannot be held responsible for: (i) any measurements, tests or other activities that have not been included in the work and any resulting report that subsequently become important at a later date; or (ii) any use which may be made of any part of this work in progress, nor any reliance placed on any part of this work in progress, nor any advice or information given in connection with this work in progress.
The British Geological Survey (BGS) has no responsibility for the persistence or accuracy of URL’s for external or third-party internet websites referred to in this publication, and does not guarantee that any content on such websites is, or will remain, accurate or appropriate. However, hardcopies of the documents referenced have generally been made by the report writer(s) and could be obtained by writing to them.
iii

iv
Acknowledgements
Many individuals have provided discussion during the project and to whom the author is grateful. This assistance has been received at all stages of the study and their input or granting of permission to reproduce data/images in order to illustrate this report is acknowledged below. Dr Nigel Riley of the HSE is thanked for his detailed review of an early version of the draft report, comments on which greatly improved the final product. Ron Demaine is thanked for the final preparation of many of the diagrams contained in the report. The author would like to thank the following for support and advice during the work:
Drs N Riley and S Welsh of the Health and Safety Executive
Drs S Turner and D Keeley of the Health and Safety Laboratories
Mr E Hough, Drs GA Kirby, S Holloway, R Cuss, AH Cooper & NJ Riley and Professor M Culshaw (BGS)
Drs S Watson and R Metcalfe (Quintessa)
Jennifer Cunningham, BGS Wallingford (Figure 15 - major aquifers cropping out in England and Wales)
G Church and R Smith (BGS, IPR section)
Kate Sanderson (SABIC UK Petrochemicals) for information relating to the Teesside brine caverns and their usage
Richard Stevenson (INEOS) for information relating to operations in the Cheshire saltfield
Schlumberger for permission to reproduce Figure 3
David Lee Photography Ltd, Barton upon Humber for permission to reproduce the photograph in Figure 8
The Geological Society, London for permission to reproduce both the line drawing and photograph in Figure 8 and the image of salt core in Figure 10b (From Smith, D.B. 1997; deceased, July 2007)
NATIONAL TRANSPORTATION SAFETY BOARD (NTSB) for permission to reproduce the images of the Carlsbad pipeline and Brenham incidents in Figure 25
California History Room, California State Library, Sacramento, California for permission to reproduce the image in Figure 23a (www.library.ca.gov/calhist/index.html).
Lena Tabilio and the California Division of Oil, Gas and Geothermal Resources for permission to reproduce the image in Figure 23c (http://www.consrv.ca.gov/index/siteMap.htm#doggr)
Springer Verlag for permission to reproduce Figure 28 (from Scherer et al., 2005, Environmental Geology)
Kansas Geological Survey for permission to reproduce images and figures from their website relating to the Hutchinson incident, 2001 (Figures 5c&d, 25 and 35)
Chief Forbes and the Hutchinson Fire Department for permission to reproduce photographs of the scenes in Hutchinson town immediately following the January 2001 gas storage incident (Figures 25 and 35)
Mike Heideman and the Kansas Department of Health and Environment (KDHE) for permission to reproduce the photograph of the S-1 well site at the Hutchinson gas storage facility (Figure 35)
v
CUDD Drilling and Shannon Pope of RPC Inc are thanked for permission to reproduce images in Figures 25 and 35
DS and MJ Jackson for permission to reproduce photographs relating to salt brining activities at Preesall, Lancashire (Figure 5a&b)
Jeanette Vosberg, Save Ballona Wetlands for permission to reproduce the image of gas bubbling up along old well (Figures 22d and 44c)
Hertfordshire County Council and the Chiltern Air Support unit for permission to reproduce images of the Buncefield accident (Figure 27)
Star Energy for permission to reproduce images of the Humbly Grove gas storage facility (Figure 29)
E. Schweizerbart Science Publishers for permission to reproduce the photographs of the Teutschental incident (Figure 30)
This product includes mapping data licenced from Ordnance Survey with permission of the Controller of Her Majesty’s Stationery Office © Crown Copyright and/or database right 2007. All rights reserved. 100037272
vi

Contents
1 Introduction ....................................................................................................................... 11.1 Background ................................................................................................................ 1
1.2 Risk analysis and risk assessment of UGS .................................................................. 2
1.3 Structure of the report................................................................................................. 3
2 The various types and numbers of Underground Fuel Storage facilities and storedproducts .................................................................................................................................... 6
2.1 Hydrocarbon Products ................................................................................................ 6
2.2 The basic concepts and storage scenarios.................................................................... 62.2.1 Basic concepts, ‘working’ and ‘cushion’ gases ........................................................ 7
2.2.1.1 Composition of cushion gases and ‘blanket’ materials ...................................... 8
2.2.2 Permeabilities and capillary entry pressures of well cement, shale and salt .............. 9
2.2.3 The process of drilling an exploration well/injection well, well completions andcasing .............................................................................................................................. 10
2.2.4 Damage to gas storage wells and reservoir formations........................................... 12
2.2.5 Depleted oil/gasfields ............................................................................................ 13
2.2.5.1 BS EN 1918-2:1998........................................................................................ 13
2.2.5.2 Background .................................................................................................... 13
2.2.5.3 Drive mechanisms and depleted reservoirs...................................................... 13
2.2.5.4 The Process of Gas Storage............................................................................. 14
2.2.5.5 Presence and effects of hydrogen sulphide (H2S) in oilfields........................... 14
2.2.5.5.1 Effects of H2S ............................................................................................ 15
2.2.5.5.2 Incident at Gasfield, Chongquing, China .................................................... 16
2.2.5.5.3 In the UK context ....................................................................................... 16
2.2.5.6 Susidence associated with oil and gas production............................................ 17
2.2.6 Aquifers ................................................................................................................ 17
2.2.6.1 BS EN 1918-1:1998........................................................................................ 17
2.2.6.2 Background .................................................................................................... 17
2.2.7 Salt caverns........................................................................................................... 18
2.2.7.1 BS EN 1918-3:1998........................................................................................ 20
2.2.7.2 Background .................................................................................................... 21
2.2.7.3 The process..................................................................................................... 22
2.2.7.3.1 Well design, spacing, cavern design and shaping........................................ 22
2.2.7.3.1.1 Example of a proposed salt cavern gas storage well casing program atPreesall, NW England .............................................................................................. 23
vii

2.2.7.3.2 Salt cavern design and construction............................................................ 23
2.2.7.3.2.1 Cavern stability and damage - minimum and maximum cavern operatingpressures ............................................................................................................. 24
2.2.7.3.2.2 Leaching rates and brine disposal ......................................................... 26
2.2.7.3.3 Subsidence occurring with cavern formation and overburden/caprockstability ................................................................................................................... 26
2.2.7.3.4 Insoluble (non salt) interbeds...................................................................... 27
2.2.7.3.5 Summary and examples of proposed UK cavern design and operationalranges ................................................................................................................... 27
2.2.7.4 Commissioning of caverns – pressure testing .................................................. 29
2.2.7.5 The stored products and cavern operation ....................................................... 29
2.2.7.6 Asymptotic pressurization of a cavern – post abandonment............................. 30
2.2.7.6.1 High pressure brine release, Preesall Brinefield, Fylde, Lancashire............. 31
2.2.8 Other underground fuel storage scenarios.............................................................. 31
2.2.8.1 Abandoned/reconditioned coalmines............................................................... 31
2.2.8.2 Abandoned salt mines ..................................................................................... 31
2.2.8.3 Abandoned limestone mines ........................................................................... 32
2.2.8.4 Rock Cavities other than salt and previous mine operations ............................ 32
2.2.8.4.1 Lined rock cavities (LRC) .......................................................................... 32
2.2.8.4.2 Unlined rock cavities.................................................................................. 32
2.2.8.4.3 UK Mined (Unlined) Cavern Storage – Killingholme, North Lincolnshire.. 33
2.2.9 LNG storage – potential future developments........................................................ 34
2.2.10 Examples of storage of different types of energy in salt caverns and othergeological environments .................................................................................................... 35
2.2.10.1 Hydrogen and Nitrogen storage ...................................................................... 35
2.2.10.1.1 Tees Valley Hydrogen Project and renewable energies ............................. 35
2.2.10.2 Compressed Air Energy Storage (CAES)........................................................ 36
2.2.10.2.1 Huntorf, Germany .................................................................................... 36
2.2.10.2.2 McIntosh, Alabama, USA......................................................................... 36
2.2.10.2.3 Norton, Ohio ............................................................................................ 37
2.2.10.2.4 Iowa stored energy plant........................................................................... 37
2.2.10.2.5 Markham, Texas....................................................................................... 38
Hydrocarbon seeps in petroleum-bearing basins ........................................................... 393.1 Introduction.............................................................................................................. 39
3.2 UKCS oil and gas seeps............................................................................................ 40
3.3 Hydrocarbon Migration ............................................................................................ 42
3.4 Cap rocks, faults and seals ........................................................................................ 42
3.5 Hydrocarbon leakages and flux rates ........................................................................ 45
viii
3

4 Salt deposits and factors relevant to developing gas storage caverns............................ 474.1 Introduction.............................................................................................................. 47
4.2 Salt creep.................................................................................................................. 474.2.1 Creep behaviour of halite (rocksalt) in the temperature range 20-200ºC and naturalstrain rates.......................................................................................................................... 48
4.2.2 Original brine in salt deposits and its migration through and effects on the rheologyof salt bodies...................................................................................................................... 49
4.2.3 Salt glaciers, rainwater and deformation mechanisms ............................................ 50
4.3 Gases in salt formations............................................................................................ 504.3.1 Gas in UK salt deposits ......................................................................................... 51
4.4 Anomalous zones ..................................................................................................... 51
4.5 Presence of gypsum and/or anhydrite........................................................................ 524.5.1 Dissolution of gypsum .......................................................................................... 52
4.5.2 Gypsum/anhydrite transition ................................................................................. 53
4.6 Fractures of non-halite interbeds and infilling halite ................................................. 534.6.1 Infill of fractures by precipitation from brines ....................................................... 54
4.6.2 Non-brine infill origins (and fractures) .................................................................. 55
4.7 Wet Rockhead and subsidence in onshore UK saltfields ........................................... 554.7.1 Definition and origin of wet rockhead ................................................................... 55
4.7.2 Effects of brine exploitation on the features developed at wet rockhead................. 57
4.7.3 Subsidence associated with salt mining activities and unrelated to wet rockheadconditions .......................................................................................................................... 58
5 Underground Gas Storage and areas most likely for development in Britain (includingNorthern Ireland) ................................................................................................................... 59
5.1 Introduction.............................................................................................................. 59
5.2 Oil and gasfields....................................................................................................... 595.2.1 Midland Valley of Scotland................................................................................... 60
5.2.2 North West England.............................................................................................. 60
5.2.3 East Midlands Oil Province – Carboniferous play ................................................. 60
5.2.3.1 Enhanced Oil Recovery (EOR) operations in the East Midlands Oil Province . 61
5.2.3.2 Westphalian sandbody dimensions of the southern North Sea, eastern andnorthern England ............................................................................................................ 61
5.2.4 Wessex-Channel (including the Weald) Basin ....................................................... 62
5.2.5 North East England (including the Cleveland Basin) ............................................. 62
5.3 Salt basins ................................................................................................................ 635.3.1 Non-halite interbeds in UK salt basins................................................................... 63
5.4 Aquifers ................................................................................................................... 64
5.5 Previous investigations into storing gas in porous strata in the UK onshore area ....... 645.5.1 Winchester Anticline............................................................................................. 65
5.5.2 Cliffe Anticline ..................................................................................................... 65
5.5.3 Napton .................................................................................................................. 65
ix

5.5.4 Stow...................................................................................................................... 65
5.5.5 Chipping Norton ................................................................................................... 66
5.5.6 Brackley................................................................................................................ 66
5.5.7 Huntingdon ........................................................................................................... 66
5.5.8 Nene ..................................................................................................................... 66
5.5.9 Stamford ............................................................................................................... 66
5.5.10 Sarsden .............................................................................................................. 66
5.5.11 Whichford.......................................................................................................... 66
5.6 Current UGS Facilities and applications in England.................................................. 66
6 Faults, faulting and fractures in salt sequences and UK seismicity............................... 686.1 Faults, fault terminology, sealing potential and faulting of sequences containing halite69 6.1.1 Terminology ......................................................................................................... 69
6.1.2 Sealing or non sealing (‘leaky’) faults?.................................................................. 70
6.1.2.1 Fault zone processes – development of shale gouge (Shale Gouge Ratios; SGR)........................................................................................................................ 72
6.1.3 Fault related leakage and hydrocarbon anomolies.................................................. 73
6.1.4 Strain rates, deformation and faulting in and around halite beds ............................ 73
6.1.4.1 Linear fabric and gneissic foliations within halite beds.................................... 75
6.1.4.2 Fractures and faults in the Boulby Halite, Teesside ......................................... 76
6.2 UK Seismicity, seismotectonics and seismic hazard.................................................. 766.2.1 Measurement of the magnitude or strength of an earthquake ................................. 77
6.2.2 General background to seismicity in the UK.......................................................... 78
6.2.3 Hazard from ground rupture and hazard assessment in the UK .............................. 79
6.2.4 UK seismotectonics............................................................................................... 80
6.2.5 UK seismic hazard ................................................................................................ 81
6.2.6 Summary............................................................................................................... 83
7 Methane storage in reservoir rocks - effects of (and on) microbial populations (JulieWest, BGS).............................................................................................................................. 85
7.1 The microbiology of the deep subsurface.................................................................. 85
7.2 The carbon cycle ...................................................................................................... 86
7.3 Methanotrophs.......................................................................................................... 86
7.4 The influence of methane on microbial life in a reservoir environment and resultingconsequences..................................................................................................................... 877.5 Conclusions .............................................................................................................. 88
8 Subsidence, ‘inflation’ and microseismic activity associated with oil and gasproduction, gas injection and underground storage in depleting fields and salt caverns.... 89
8.1 Reservoir Seismicity/Microseismicity, Subsidence Engineering and Surface GroundMovements associated with the injection of fluids and/or gas ............................................ 90
8.2 Deformation from pore pressure cycling................................................................... 92
x

8.2.1 Effective stress analysis using critical state concepts ............................................. 92
8.2.2 Transmission of pore pressure to the surrounding layers........................................ 92
8.2.3 Transmission of subsidence at depth to the surface................................................ 92
8.3 Fault reactivation due to subsidence.......................................................................... 92
8.4 Tensile deformation.................................................................................................. 93
8.5 Reservoir Seismicity/Microseismicity associated with withdrawal or injection ofFluids and gas.................................................................................................................... 93 8.5.1 Injection of waste fluid – the Denver earthquakes.................................................. 94
8.5.2 Injection of fluid for EOR – the Cogdell oilfield, Texas, USA ............................... 94
8.5.3 Injection of fluid for EOR – the Rangely oilfield, Colorado, USA ......................... 94
8.5.4 Exploitation of a geothermal field, The Geysers, California, USA ......................... 95
8.5.5 Microseismicity induced within a gas storage reservoir, Germigny facility, ParisBasin, France ..................................................................................................................... 95
8.5.6 Microseismic monitoring within gas storage reservoirs, Pennsylvania StateUniversity, USA................................................................................................................. 95
8.5.7 Reactivation or ‘opening’ of faults in the Salt Lake Oilfield, California................. 96
8.5.8 Discussion............................................................................................................. 96
8.6 Subsidence associated with oil and gas production and gas storage facilities at depletedoil/gasfields ....................................................................................................................... 968.6.1 Los Angeles Basin in general ................................................................................ 97
8.6.1.1 Inglewood Oilfield subsidence ........................................................................ 97
8.6.2 Ekofisk Oilfield, North Sea ................................................................................... 97
8.7 Subsidence and damage occurring at saltfields during salt extraction and gas storageoperations.......................................................................................................................... 988.7.1 Subsidence occurring with salt cavern formation and overburden/caprock stability 98
8.7.1.1 Observed and calculated rates of subsidence associated with gas storage andbrine caverns................................................................................................................... 99
8.7.1.1.1 Bryan Mound, Big Hill and West Hackberry SPR salt cavern storagefacilities, USA ............................................................................................................. 99
8.7.1.1.2 Example of predicted subsidence associated with proposed gas storage saltcaverns in the Preesall Saltfield, NW England ........................................................... 100
8.7.2 Problems of subsidence in saltfields not related to wet rockhead or linked to gasstorage 100
8.7.2.1 Problems at saltmines and brine fields........................................................... 100
8.7.2.1.1 Subsidence associated with salt caverns related to former brining operationsin the Preesall Saltfield, NW England ........................................................................ 101
8.7.2.2 Problems associated with old wells in salt bearing successions ..................... 101
8.7.2.3 Problems associated with new oil exploration wells in salt bearing successionsand former mined areas................................................................................................. 102
9 Incidents and casualties at underground hydrocarbon storage facilities .................... 1039.1 Documented incidents at depleted oil and gas field facilities................................... 103
xi

9.1.1 California and the case of numerous old oilfields with migrating gas in an urbanenvironment and the impact on the perception of gas storage safety issues. ...................... 104
9.1.2 Gas leaks at the Montebello and Playa del Rey converted oilfield gas storagefacilities ........................................................................................................................... 105
9.1.3 Hydrocarbon exploration well, Hatfield Moors, England ..................................... 106
9.1.4 Summary/discussion ........................................................................................... 107
9.2 Documented cases of problems or incidents at aquifer facilities.............................. 107
9.3 Documented cases of problems or incidents at salt cavern gas storage facilities ...... 1089.3.1 Discussion........................................................................................................... 109
9.4 Documented incidents at abandoned mine facilities ................................................ 110
9.5 Frequency rates of natural gas storage incidents and incident frequencies from otherstudies ............................................................................................................................. 1119.5.1 The MARCOGAZ European UGS Study ................................................................ 111
9.5.1.1 Relationship of this study to the Marcogaz survey......................................... 113
9.5.2 Incidents known by the Risques du Sol et du Sous-sol Directorate ...................... 114
9.5.3 Summary and discussion ..................................................................................... 115
10 Incidents and casualties in the oil and gas production/supply chain and petrochemicalindustries............................................................................................................................... 118
10.1 Casualty statistics in other areas of the energy supply chain.................................... 118
10.2 Discussion .............................................................................................................. 121
11 The Main Risk Analysis/Assessment Framework and Methods.................................. 122
11.1 General conditions common to all UFS types ......................................................... 12211.1.1 The well bore and immediate vicinity............................................................... 122
11.2 Additional salt Cavern Release Scenarios ............................................................... 12311.2.1 Uncontrolled leaching ...................................................................................... 123
11.2.2 Inadvertent intrusion ........................................................................................ 124
11.2.3 Release through the cavern seal........................................................................ 124
11.2.4 Release of stored product through cracks in the cavern wall ............................. 125
11.2.5 Release of gas through leaky interbeds or nonhomogeneous zones ................... 125
11.2.6 Partial cavern roof fall...................................................................................... 125
11.2.7 Collapse of internal ledges or benches formed by non salt interbeds................. 125
11.2.8 Potential for gas to be (naturally) present in the salt beds ................................. 126
11.3 Specific to depleted oil/gasfields - drive mechanism ............................................... 126
11.4 Risk assessment parameters for consideration in risk analysis/assessment of UKscenarios.......................................................................................................................... 12611.4.1 Risk assessment and modelling of UK scenarios .............................................. 127
11.4.2 Mitigation ........................................................................................................ 127
12 Summary and Conclusions............................................................................................ 129
Appendix 1 Gas migration rates – hydrocarbon-bearing basins .................................. 132
xii

Appendix 2 Problems and subsidence experienced at saltmines and brine caverns – i.e.not associated with gas storage ............................................................................................ 134
Appendix 3 Descriptions of current operational UK UGS facilities and proposedschemes at the planning or development stage.................................................................... 140
Appendix 4 Seismicity - Earthquake magnitude/EMS-98 intensity comparison. ........ 151
Appendix 5 Underground Fuel Storage Incidents......................................................... 152European salt cavern storage incidents leading to cavern closure ..................................... 152
American and Canadian salt cavern storage incidents ...................................................... 153
Aquifer gas storage incidents - Europe............................................................................. 166
Aquifer gas storage incidents - America........................................................................... 168
Unlined rock cavern, abandoned salt and coal mine gas storage incidents ........................ 172
Depleted oil or gasfields and converted oil or gasfield gas storage incidents .................... 174
Appendix 6 Risk Assessment - considerations............................................................... 184Well problems ................................................................................................................. 184Risk Assessment – failure mechanisms relating to geology .............................................. 184
Salt Caverns.................................................................................................................. 184
Pore storage (depleted oil/gasfield) release scenarios. Will include many of the anticipatedscenarios detailed for cavern storage but would also include others, such as:.................... 190
Pore storage (aquifer) release scenarios ............................................................................ 192
Appendix 7 Risk Assessment - parameters for consideration in risk analysis/assessmentof UK scenarios..................................................................................................................... 194
Depleted oil & gasfields .................................................................................................. 194East Midlands .................................................................................................................. 194
NE England ..................................................................................................................... 201
Southern Britain............................................................................................................... 204
NW England .................................................................................................................... 206
Salt cavern scenarios ....................................................................................................... 207Cheshire Basin ................................................................................................................. 207
NW England .................................................................................................................... 210
Wessex Basin, southern England...................................................................................... 212
NE England ..................................................................................................................... 213
Appendix 8 Brief description of the presence of H2S in oilfields, the process of drillingan exploration well/injection well and unlined rock caverns .............................................. 217
Presence of H2S in oilfields ............................................................................................. 217
Effects of H2S.................................................................................................................. 218
Incident at Gasfield, Chongquing, China.......................................................................... 218
Drilling of exploration wells, casing and tubing ............................................................... 219
Well completions - casing and casing string..................................................................... 220
Coiled tubing................................................................................................................... 221
Further detail on unlined rock caverns ............................................................................. 221
xiii

Glossary ................................................................................................................................ 224
References ............................................................................................................................. 229
xiv
Summary
This report was commissioned by the Health and Saftey Executive, Bootle. It was requested as part of their operations to assess the safety issues associated with the underground storage of natural gas, for which an increasing number of applications to develop such facilities have been submitted by various operators in the UK. The rising numbers of applications are as a result of UKCS oil and gas reserves showing rapid decline, to the extent that the UK became a net importer of gas during 2004. The Government recognises that the UK faces an increasing dependency on imports, yet has very little gas storage capacity and is, therefore, at a very real risk of supply shortfalls. It notes that the UK’s capacity to import, transport and store gas and LNG efficiently has to be improved and this will require greater investment in new, timely and appropriately sited gas (and LNG) supply infrastructure, part of which is likely to include (safe) onshore underground (natural) gas storage (UGS) facilities.
The main areas of interest and concern were, therefore, what type of facility might be developed in the UK and could the stored product escape? If so, what would any likely gas flux rates be and could the gas reach the surface, endangering populations? This report, therefore, attempts to summarise the main storage types available in the UK context, what, if any, incidents have occurred at similar facilities around the world and what were the consequences. A separate companion report by Quintessa (Watson et al., 2007) provides calculations of possible flux rates from a number of UK storage scenarios, drawn from the results of this study. The report is aimed at both non-specialists and specialist readerships and therefore contains brief introductory material to some of the geological and technical aspects of underground gas (or fuel; UFS) storage that will already be familiar to the more experienced reader. A series of appendices provide additional information for the reader interested in or requiring further detail in some areas. Given the wide-ranging scope of UFS/UGS, this report cannot and does not attempt to review all topics that might be involved, but where possible, the reader is guided to sources of further reading.
In the UK context, UGS is of two main potential types: salt cavern (man-made voids) and depleting oil/gasfields (pore storage). Opposition is raised by local groups to each UGS application who, quite naturally, fear the repetition of one or two high profile incidents that have involved small numbers of casualties both in overall total and at individual incidents. The opposition is raised and the same incidents quoted irrespective of storage type, which is important when assessing safety issues.
Over 90 years of expertise has now been gained in the technology of UGS, with around 630 UGS facilities (of different types) currently operational worldwide and there is perhaps a need to put the risks of UGS and UFS into perspective. This is in terms of both actual events and storage types, and relative to other areas of the energy supply chain. With this in mind, the BGS were asked by the Health & Safety Executive to provide an independent and impartial review of UFS and UGS incidents. The review is to assist them in assessing the geological safety and risks of gas leakage from underground storage facilities when dealing with UK applications to develop UGS sites.
This study has found 65 reports or accounts of problems encountered at UFS facilities from mainly America and Western Europe. Few cases have been found reported from Russia or Eastern Europe, but there is no reason to believe that there have not been incidents, it may be that they simply have not been reported or have been missed during this extensive search. Of varying severity and nature, those incidents found have been associated with 9 fatalities, around 62 injured and at least 6700 having been evacuated. The latter statistic does not include the
xv

numbers involved in the evacuation of the village of Knoblauch, 25 km west of Berlin, during the escape of town gas (and carbon monoxide) referred to above. Of the release incidents, 15 were accompanied by an explosion and/or fire, 10 having occurred at salt cavern facilities. Of the 9 fatalities found reported at 5 UFS incidents, 8 were at 4 incidents involving salt caverns in the USA that were not been limited to just natural gas, but included storage of other hydrocarbons. The ninth fatality occurred at an aquifer storage facility west of Berlin in the 1960s. The causes, scale, and severity of the 65 reported problems are described and shown to be extremely variable in magnitude and nature and dependent upon a combination of many factors. Most typically, release and accidents arise through failure of man-made infrastructure (including well casings and completions, pipes, valves and compressors), human error (utilisation of inappropriate and existing caverns, poor forward planning, poor management or operational practises and a lack of due diligence by the storage company or operator). One or two problems have resulted from (extreme) natural events (e.g. seismic activity) that would not be relevant to the UK.
The report also contains reviews of some incidents or developments at oil and gas fields and operational salt mines (both conventional ‘dry mining’ and brine extraction) that could have some bearing or importance to the assessment of risk/hazard in gas storage operations. They illustrate actual events during operations and that could happen during the development or operation of gas storage facilities if poor practices are employed or stringent monitoring of processes is not performed.
Casualty figures from other areas of the energy supply chain, including above ground storage vessels are reviewed. This allows those figures associated with UGS/UFS to be compared with other storage environments and parts of the energy supply chain to assess the conclusions of Bérest et al. (2001) and Bérest & Brouard (2003). These authors state “salt caverns provide one of the safest answers to the problem of storing large amounts of hydrocarbons”. Pore storage facilities are associated with even lower incident and casualty rates. Even in urban areas such as Los Angeles, Chillingar & Endres (2005) concluded “…Underground gas storage, oil and gas production can be conducted safely if proper procedures are followed. After recognition of the existing problem, proper safe operating procedures can be easily developed”...
Whilst it is acknowleged that the figures reported here probably represent a minimum (i.e. it is unlikely that all incidents have been found, or were reported), the figures collated during this work indicate that UGS has extremely low incident and casualty numbers. Rates several orders of magnitude greater are reported from other sections of the energy supply chain and which individually, have often resulted in more deaths than those of not just UGS, but all combined UFS incidents described here. This includes fatalities arising from the supply of domestic gas in the UK.
Contrary to public belief, UGS is regarded by other sectors of industry and research as having an excellent health, safety and environmental record (Lippman & Benson, 2003; Imbus & Christopher, 2005).
xvi

1 Introduction
There are a growing number of applications to develop underground gas storage (UGS) facilities in the UK (refer Fig. 1 & Table 1), each of which has been accompanied by significant opposition from local communities opposed to the development, mainly for perceived safety reasons. In the light of these applications and the opposition raised, there is a need to assess the safety record of previous and existing underground fuel storage (UFS) facilities and not just natural gas storage. This report was commissioned by the Health and Safety Executive (HSE), which is the regulatory organization that will be required to advise and inspect safe operational and working practices for such developments should they be granted planning permission and ultimately proceed to operational status. The aim of the study has been to identify and describe the main types of underground storage facilities used, any documented or reported failures and incidents leading to release of stored product, the types and number of casualties that resulted from the incident and what measures were required to bring any incident under control. The results of the research into the problems and failures of UFS sites will form a major part of a risk analysis and assessment of UGS in the UK context. This part of the study was undertaken by Quintessa and the Health and Safety Laboratory (HSL), with Quintessa providing calculations for potential release scenarios from possible UK UGS facilities (Watson et al., 2007). Quintessa have considerable experience in such work related to the underground disposal/storage of nuclear waste and CO2.
This work will, by the nature of the industry and technological progress, be a work in progress, providing a present day ‘snapshot’ of the situation and our understanding. Continued monitoring of the literature and the progress of UGS applications will almost certainly provide additional material that can feed into the results of this study and support future work.
1.1 BACKGROUND
Until recently, abundant North Sea gas reserves have meant that swings in UK demand have been taken up by increasing, or decreasing, output from North Sea gasfields. However, these fields are rapidly depleting to the extent that the UK became a net importer of gas during 2004 and UK North Sea fields no longer provide this flexibility (Fig. 2). With UK gas consumption both for domestic use and for electricity generation predicted to continue rising, the UK will become increasingly reliant upon imports (DTI, 2006a&b). The Government, clearly mindful of the UK’s impending move towards increasing import dependence on gas and increasing shortfall in supply, recognises that the UK economy and gas users face major challenges in the face of continued growth in demand (DTI, 2005, 2006a&b). Any weakness in infrastructure could result in higher gas prices, or interruptions to supply, with damaging consequences for both UK markets and consumers. To meet these challenges, manage the changes and lessen impacts on UK users, the Government believes that there will be a need to substantially increase the UK’s capacity to import, transport and, most importantly, store gas (and LNG) efficiently (DTI, 2006a&b; 2007). The UK will require greater investment in new, timely and appropriately sited gas import and storage infrastructure to provide a balanced portfolio of gas storage facilities meeting market requirements. These will include short-term (peak shaving) units such as above ground tanks that can be filled, emptied and refilled on an hourly or daily basis. However, larger and longer-term gas storage capacity may be best met through construction of underground gas storage (UGS) facilities in salt caverns, which whilst offering hourly or daily withdrawals, best provide weekly to monthly storage cycles, or pore storage facilities (depleted oil/gasfield reservoirs or aquifers), which provide more strategic and longer-term seasonal swing capacity.
1

Development of (longer-term, seasonal) aquifer storage in the UK is, for many reasons, thought likely to be some way off and is not considered a priority at this stage of this report.
UK onshore geology would permit a significant volume of natural gas to be stored underground in a variety of subsurface facilities, providing a blend of longer and shorter-term storage to meet the differing supply demands. At present, UK UGS applications are subject to numerous planning consent processes, both local planning controls, currently overseen by the Department for Communities and Local Government, and specialist development consent regimes currently administered by the Department for Business, Enterprise and Regulatory Reform (DBERR) and prior to June 2007, known as the Department for Trade & Industry (DTI). As the majority of this report was undertaken whilst it was the DTI, this report will refer to the DTI, but the reader is advised of the government department name change. In addition, local communities close to proposed facilities are fearful of a repetition of major incidents seen at certain UFS facilities, most notably in the USA. Consequently, almost every UGS application in the UK is opposed on safety grounds, often quoting inappropriate examples of facility failures to those applications placed. This brings further confusion to the assessment of applications and delays to the process of approving and consenting (or not) of any developments.
In terms of the safety of both UFS and UGS facilities, it requires knowledge of the past history of UFS and any incidents that have occurred at such facilities. The first storage of gas in an underground facility took place in a gasfield in Welland County, Ontario (Canada) in 1915. The first gas storage facility in a depleted reservoir was built in 1916, using a gasfield in Zoar near Buffalo, New York (USA). The latter is still operational (WGC, 2006) and there is, therefore, over 90 years of expertise now gained in UGS technologies. Worldwide, there are currently around 630 UFS facilities operational (Table 2), comprising three main facility types: depleted oil/gasfields, salt caverns and aquifers. The total volumes of gas currently stored in such underground facilities are around 320 billion cubic metres (Bcm1), providing daily deliverabilities of around 5.1 Bcm (Table 2). Over the period of 90 years, some 65 accounts of problems or incidents of varying cause, severity and nature at UFS facilities have been reported. A small number of these incidents (5) have led to 9 fatalities, with overall, around 62 injured and circa 6700 having been evacuated during these and other UFS incidents.
1.2 RISK ANALYSIS AND RISK ASSESSMENT OF UGS
The hazards and risks associated with gas storage in geological formations are a recurring topic whenever UGS is discussed. Hazard is taken to be the likelihood of leakage taking place. Risk is the likelihood of actual damage or loss resulting from leakage. The hazards and risks associated with storage of natural gas relate to many areas, such as system integrity, health, safety and environmental effects, economic risks and risks related to public perception and trust. Risk analysis is a tool for quantifying risk and is (normally) based upon the product of frequency and consequences of a hazard. This report focuses on identifying and defining the health and safety related risks, although not unexpectedly, some environmental risks are covered.
The major hazards associated with the operation of an underground natural gas storage facility relate to leakage of the product from the storage structure into adjacent and overlying formations and thence to the surface, which carries two very contrasting risks (Lippmann & Benson, 2003):
(1) The stored product may escape, reaching ground surface whereupon it could then represent a significant health and environmental risk.
(2) Economic burden/risk – the stored product migrates away from the storage area, whereupon it is not recoverable and a valuable commodity is lost.
3 31 Bcm = 109 m , or 1000 million cubic metres (Mcm = 106 m ). Mcm is as used by the DTI.
2

Although economic risk is important, this report focuses on the risks health and environmental risks. It is noted, however, that various processes and consequences will be common to both risk types. For underground fuel storage the risks can initially be broken down into three phases:
• During construction of the facility
• During operation of the facility
• Following closure and abandonment of the facility
To determine and calculate risk, potential sources of harm must be identified and the probability and consequence of them occurring must be estimated (risk analysis). There is then a process of comparing the estimated risks against risk criteria to determine the significance of risk (risk evaluation). The process requires assembling a number of discrete sets that include information on (Vendrig et al., 2003):
• Identification of hazards
• Frequency of occurrence of hazards
• Consequence of hazard occurring
Risk analysis of geological storage of natural gas is complicated, to some extent, by the fact that in some cases no data or only limited data for frequencies or consequences are available. There are two main areas: the engineered system, which includes the infrastructure bringing the gas to the storage facility (the above ground components) and the geological system in which the gas will be stored, which will include the man made/engineered infrastructure (boreholes, cements, valves, pipes etc.). Accidents or hazards of the engineered system include failures caused by mechanisms such as corrosion, vibration, external impact and are expected to apply to such components as pipelines (buried and surface), flanges, valves, fittings, pressure vessels, pumps, compressors and injectors, wells and their casings/cements.
As mentioned above, it is the geological system that will be the focus of this initial risk assessment for the HSE and is expected that potential operators will have to provide assessment of the reservoir rock, caprock, nature of a salt body, geological features – thin non-halite interbeds, faults etc. Clearly, however, the engineered system plays a major role in the development of any UGS facility and components are so intricately linked with the geological system (e.g. wells, casing, cement, valves, flanges, pipes etc) that they necessarily appear in the risk assessment here. The range of possible release scenarios for a given component may cover a wide range of events from a pinhole leak to catastrophic pipe rupture or a failure of the storage environment (e.g. salt cavern). Such events might be due to wear and tear, subsidence, communication with other caverns or inadvertent intrusion through boreholes due to poor planning and site characterization. This will also include excavation activities. The risks and control of these components should, however, be more fully covered by the various COMAH and HSE legislation (Vendrig et al., 2003) and which have been successfully applied to oil and gas exploration in the North Sea (and onshore) for over 40 years.
In summary, UGS facilities are designed and operated to avoid leakage. The operational pressure ranges of UGS facilities are designed to be lower than those that would induce hydraulic fracturing (opening up of fractures) in the rock. To avoid leakage through the cap rock the applied overpressures must also, therefore, be lower than the displacement/entry pressures, which are generally less than the fracturing pressures.
1.3 STRUCTURE OF THE REPORT
The report is structured in such a way as to lead the reader through the concepts of the UGS and build up the background data required to then make the risk analysis/assessment for UGS. The main text aims to present the basics and provide an introduction the main subjects. Appendices
3

1-8 provide further detail in certain areas for the non-specialist reader or those interested in additional detail.
The report opens (Chapter 2) with a general overview of the basic concepts, various types of facility, processes and numbers of Underground Fuel Storage (UFS) facilities in operation and the hydrocarbon products generally stored. Some basic descriptions of terminology such as ‘working’ and ‘cushion’ gas are included. In addition to reviews of the three main storage types that might be developed in the UK (pore storage [depleted oil/gasfields and aquifers] and salt cavern), are brief introductions to other forms of underground energy storage including hydrogen and compressed air that might in the future use the same rock formations and be the subject of planning applications in the UK.
Chapter 3 provides a review of natural hydrocarbon (oil and gas) seeps in sedimentary basins and some calculated and measured gas flux rates. It also outlines the fact that there are over 170 documented oil and gas seepages in the onshore UK area, many of which are active today and drove the early UK onshore oil and gas exploration. Appendix 1 provides examples of measurements of natural gas leakage rates and fluxes.
Chapter 4 outlines salt deposits and the factors relevant to developing gas storage caverns. Included are sections on salt properties, rheology and its self sealing nature due to viscoplastic deformation mechanisms, the development of wet rockhead and subsidence associated with salt beds, interbeds, fractures and infilling materials, the problems encountered in salt mines and areas of salt with old wells, all of which have some relevance to gas storage developments. More detailed descriptions of some events are given in Appendix 2.
Following the outlines of storage types and salt deposits, Chapter 5 provides an overview of underground gas storage (UGS) in Britain, outlining the areas in which development in the short to medium term is most likely for depleting oil/gasfields and salt cavern storage. Other forms of storage (aquifer, lined or unlined caverns, abandoned mines etc) may become favoured or technically and/or financially possible, but are not covered in this report. More detailed descriptions of UK operational or proposed developments are given in Appendix 3.
Chapter 6 deals briefly with faulting and UK seismicity. Basic principles of faults and fault rocks developed are covered, including sealing or non-sealing capacities of faults and fault zones. There is then a review of UK seismicity and the risks and types of hazard that might be predicted, expected or impact on UK underground gas storage scenarios. The UK is seen as not at risk of surface rupture, but has low to moderate seismicity that is sufficiently high enough to pose a potential hazard to sensitive structures such as dams, chemical plants and nuclear facilities. It concludes that in terms of UK proposals, potential sites lie in regions affected by earthquakes and that each application should be dealt with on site by site basis. Appendix 4 provides earthquake intensity and magnitude scales.
Chapter 7 assesses the effects of methane storage on microbial populations in reservoir rocks and whether gas storage would lead to adverse effects on the reservoir rock, boreholes (e.g. well cements and metal pipes) etc.
Chapter 8 deals with some of the preliminary issues relating to gas injection and the cyclic nature of gas storage operations, such as subsidence and microseismic activity and what impacts these have had in other areas in which gas storage is ongoing. This is mainly relating to oil and gasfields, although many of the principles are the same for caprocks in salt cavern storage.
Chapter 9 forms one of the main areas of this research and is aimed at assisting the HSE to assess safety cases for UGS. It summarises those reports found through literature and internet-based searches on incidents and casualties at UFS sites, including UGS facilities. More detailed descriptions of the incidents found are provided in Appendix 5. It deals with the incidents by storage type, i.e. depleted oil/gasfields, salt cavern, abandoned mine etc. Outlines of some gas leaks at producing oil and gasfields are also included, particularly in the California area, which
4

geologically represents a very different environment to the UK, but has attracted interest in terms of safety records.
Chapter 10 outlines the incidents and casualty rates from the oil and gas production/supply chain and petrochemical industries and contained in two or three major reports. This includes the casualty rates involved in the supply of domestic gas in the UK and USA, and is aimed at providing some means of assessing the incident and casualty levels in UFS described in Chapter 9.
From the preceding chapters and descriptions of incidents, Chapter 11 summarises the main risks and release scenarios when considering UFS and UGS and provides a framework and list of parameters for risk analysis and assessment. The background information and considerations are contained in Appendix 6. The chapter discusses the risks in UGS in general and what might be seen as the additional main issues relating to gas storage in salt caverns. The risk assessment parameters for consideration in risk analysis/assessment of UK scenarios are then developed and summarised, with Appendix 7 containing detailed parameters for the various identified UK scenarios. These findings were then input into a sister study undertaken by Quintessa defining the Features, Events and Processes (FEPs) relative to UGS and which has undertaken scoping calculations for gas release from potential UK UGS scenarios (Watson et al., 2007).
Chapter 12 draws together the various findings of this report to produce a summary of the main risks associated with UGS and considerations in the UK context of UGS.
To keep the main report as short as possible, much of the supporting information and detailed descriptions of, for example, the various problems and incidents at existing salt mines or brinefields and reported during UFS operations, are included in Appendices 1 to 7. Should the reader require further information on certain aspects then they are referred to these more detailed summaries at the back of the report.
5

2 The various types and numbers of Underground Fuel Storage facilities and stored products
The following briefly outlines the products and options most likely to be considered for underground (geological) natural gas storage facilities. Other options are available. These include abandoned/reconditioned mines and lined rock cavities. However, these are considered unlikely in the UK context for the foreseeable future, as many represent marginal, high cost and low volume scenarios.
2.1 HYDROCARBON PRODUCTS
Currently, the main hydrocarbon products held in underground (geological) storage are:
• Crude oil
• Natural gas
• Liquefied petroleum gas – (also called liquid petroleum gas, LPG, LP Gas) is a mixture of hydrocarbon gases, which is a gas at atmospheric pressure and normal ambient temperatures, but can be liquefied when moderate pressure is applied, or when the temperature is sufficiently reduced.
A further option to use underground storage in the transporting and storage of liquefied natural gas (LNG) is being evaluated (the ‘Bishop Process’ - section 2.2.9). This will involve importing LNG via tanker, converting (regassification) it to gas and then offloading for storage in underground facilities, which will be the same as for the above ‘conventional’ forms.
2.2 THE BASIC CONCEPTS AND STORAGE SCENARIOS
Underground storage has and will increasingly play an important role in the natural gas supply industry. Gas in pipelines provides part of the UK storage capability. However, this volume is limited. Additionally, gas typically flows through the network of distribution pipelines at around 25 mph. So gas imported at one import terminal requires time to get from ‘a’ to ‘b’. UGS provides a number of advantages that include the capability to store gas more locally and thus withdraw and supply to industry/users more quickly. UGS also ensures supply reliability during periods of heavy demand by supplementing pipeline capacity, serving as backup supply in case of an interruption in wellhead or gasfield production. Storage also allows load balancing of daily throughput levels on pipelines, which may be necessary to ensure smooth operation of the pipeline system. A relatively recent development in the use of storage is to manage inventory levels to take advantage of expected price movements and to support futures market trading.
Three main storage facility types that exist are:
• Depleted oil/gasfields
• Aquifers
• Salt caverns
Other facilities have been developed in abandoned mines, both coal mines and salt mines, and in lined rock caverns (LRC’s) as investigated in Sweden and in the USA near Atlanta, Georgia and Boston, Massachusetts (EIA, 1995). Although more expensive than conventional means of storing gas (in depleted oil or gas fields, aquifers or salt formations), LRC’s allow gas to be withdrawn and injected multiple times during the year which isn't always possible with the other methods. These alternative facility types are, however, rarer or only in concept stage and in the
6

case of abandoned mines, have proved problematical with leakage of stored product through cap rock sequences.
As alluded to above, worldwide there are around 630 UGS facilities currently operational (Table 2). The US operates the highest number, with 394 (although 37 were classified as marginal at the end of 2005 – that is no injections or withdrawals, or withdrawals only were made; EIA, 2006). This figure compares with 410 underground natural gas storage facilities in operation in 1998 and a peak figure of 418 operational sites in 2001. Between 1998 and 2005, 42 facilities were abandoned as uneconomic or defective, while 26 new sites were placed in operation (EIA, 2006). Europe has around 120 facilities currently operational.
The vast majority of UGS facilities are developed in depleted (or depleting) oil/gasfields (478 or 76%), with those in aquifers (80 or 13%) outnumbering those in salt caverns (66 or 11%). Other facilities (abandoned mines or lined rocks caverns) represent negligible percentages.
Most depleted reservoir storage facilities are designed to be cycled only once each year and typically require between 70 and 200 days to refill (EIA, 1995; Plaat, in press). In contrast, salt cavern facilities are designed with the intent of cycling the entire working gas capacity perhaps 5 to 10 times each year. Typical injection periods are in the range of 20 days.
The factors that determine whether or not a depleted reservoir or salt cavern storage facility will make a suitable storage facility are both geographical and geological. Geographically, potential sites would, ideally, be relatively close to the consuming regions or industry. They must also be close to transport infrastructure, including main and trunk pipelines and distribution systems. Geologically, pore storage options (depleted oil and gasfields and aquifers) require good porosity and permeability. The porosity of the formation determines the amount of natural gas that it may hold. The permeability determines the rate at which natural gas flows through the rock formation, which in turn determines the rate of injection and withdrawal of working gas. Together, the porosity and permeability of reservoirs determine the effectiveness or performance and thus economic viability of any specific site. Depleted hydrocarbon reservoirs, because they have held and produced hydrocarbons, tend to have high permeability and porosity. They have also proved the integrity of the trap to retain hydrocarbons over geological time (millions of years). This is different for aquifer storage, where the porosity, permeability and cap rock all have to be proven, which is more expensive and impacts upon the viability of any proposed development.
2.2.1 Basic concepts, ‘working’ and ‘cushion’ gases
More detailed and specific characteristics of depleted reservoirs, aquifers, and salt caverns are outlined below (and can be obtained at http://www.naturalgas.org/naturalgas/storage.asp), but essentially, an underground storage facility is prepared (“reconditioned”) prior to injection, to effectively create an underground, pressurised storage container. In the case of depleted oil/gasfields or aquifers, natural gas is injected into the interconnected pore spaces that exist between the constituent grains that make up the formation (and which have not been infilled by microbes or cementing minerals such as clays and quartz – section 2.2.4), whilst in salt caverns it is injected into the void created in the salt, building up pressure as more natural gas is added. As in the case of newly drilled oil or gas wells, the higher the pressure in the storage facility, the more readily gas may be extracted. Once the pressure drops to below that of the wellhead, no pressure differential exists to ‘push’ the natural gas out of the storage facility.
Two types of gas are referred to in storage terms:
• Working gas (sometimes called the working volume), is the maximum volume of gas available for withdrawal during the normal operation of the storage facility. Obviously, this is greatest when the facility has been filled to capacity. The capacity of storage facilities normally refers to their working gas capacity.
7

• Cushion gas (sometimes called base gas), represents gas that is present permanently in the UGS. This gas is not available for withdrawal and is required to maintain adequate pressure and ensure that sufficient energy is available to provide the required deliverability. In a salt cavern facility the volume of cushion gas may represent that gas required to maintain a minimum pressure to prevent the inward closure of the cavern walls by natural salt creep. In aquifer and cavern storages all the cushion gas needs to be injected. In depleted gas fields part, or all of the cushion gas, is gas that was originally in place.
The sum of cushion and working gas is often called the inventory and the capacity of storage facilities normally refers to their working gas capacity. As the working gas is injected against the cushion gas, pressure in the reservoir increases. Care must be taken not to overpressurize the gas reservoir due to the potential for leakage and for compromising the integrity of the formation caprock (often shale). At the beginning of a withdrawal cycle, the pressure inside the storage facility is at its highest; meaning working gas can be withdrawn at a high rate. However, as gas is withdrawn, the volume of gas stored decreases, pressure drops and the performance and deliverability of the storage facility decreases. A point is reached when it is no longer economically feasible to produce gas. This is dependant upon the physical properties of each storage site. Periodically, underground storage facility operators may reclassify portions of working gas as base gas after evaluating the operation of their facilities, particularly in the case of aquifer storage facilities.
In the normal operation of the storage facility, cushion gas remains underground. In the case of pore storage it would ultimately be left underground, although specialized compression equipment at the wellhead may permit a portion of it to be recovered. In salt caverns, unlike in pore storage facilities, most gas can ultimately be recovered prior to closure of the facility. This is because on abandonment, caverns are often filled with brine, which provides the cavern wall support and displaces the last remaining gas.
2.2.1.1 COMPOSITION OF CUSHION GASES AND ‘BLANKET’ MATERIALS
As indicated by the name “cushion,” compressibility is the key property of cushion gases. Because all gases are compressible, just about any gas can be used as a cushion gas. However, the efficiency of gas storage operations can be increased if the cushion gas has greater effective compressibility. In order to maintain pressure in depleted reservoirs, about 50% of the natural gas in the formation must be kept as cushion gas.
As the methane from a depleting gas reservoir can be sold for profit, the operator’s aims are to produce most of the gas and therefore, injection of a cheaper inert gas for use as the cushion gas is often considered. Whilst this also generates additional gas and thus revenue in the case of depleted gas reservoirs, in the case of aquifer or salt cavern storage, it also means that the operator does not have to buy and use expensive methane as a cushion gas. Although the use of inert cushion gases in the USA has been considered (e.g., Walker & Huff, 1964; U.S. DOE, 1980), they are not widely used (Oldenburg, 2002). However, inert gases such as nitrogen (N
2)
have been successfully injected specifically for use as cushion gas in Europe (e.g. Laille et al., 1986; 1988; Misra et al., 1988). Nitrogen, in addition to being used during cavern construction to protect the already created void from the effects of brine during continued solution mining of the remaining volume, is also used as cushion gas in salt cavern storage facilities, being injected and withdrawn as required during cavern filling or emptying cycles.
The physical properties of carbon dioxide (CO2) make it a potential choice as a cushion gas in
pore storage scenarios. This is related to its high effective compressibility near its critical pressure when it undergoes a large change in density (Oldenburg, 2002). Injection of CO2 has, for many years, been undertaken in a number of oil fields and is used to enhance oil and/or gas recovery. At the same time use of CO2 would have the added bonus that whilst filling the
8

reservoir with CO2, it would also provide a method of carbon sequestration (e.g. Oldenburg, 2002).
Whilst CO2 injection has been employed in many instances to improve production of oilfields, studies on the site specific CO2-rock interactions might be required to assess the likely impact of the CO2 on both reservoir and caprock sequences. CO2 could, for example, cause drying out of caprock shales, thereby altering the physical properties and strength, potentially leading to cracks and leakage pathways for gas.
In some salt caverns, a diesel blanket is used to provide protection against further leaching of the already constructed cavern roof and sides. However, it can also be used as an injected material when the cavities are operated in ‘compensated mode’ like that of brine compensated withdrawal and injection. It represents a more expensive option to brine, but would not carry the potential dangers of further salt solution and enlargement of the cavern (should the solution rate be faster than the salt creep processes).
2.2.2 Permeabilities and capillary entry pressures of well cement, shale and salt
As would be expected, a vast literature exists on the various well cements developed in the oil and gas exlporation, geothermal and waste well sectors and this cannot be reviewed here. However, an excellent entry to well cementing is provided by Nelson (1990). It is to be reasonably expected that any prospective operators of gas storage facilities will have designed the construction and completions of wells to the standards used in the oil and gas sectors: experience in these industries having been acquired over more than 100 years.
Those wells penetrating salt-prone sequences or aiming to develop salt caverns should meet the requirements of the drilling fluids not to dissolve the host salt and to obtain gas-tight well completions (bond between well cement and the borehole walls and well casing). On the latter point one study on the bond strength between the cement plug and host rock in abandoned boreholes is worthy of note (Akgün, 1997). Under testing, dissolution along the interface of the cement and the salt was observed, reducing bond strength. This might have been enhanced by clay inclusions in the salt. Gaining detailed information on the purity of halites beds might, therefore, be an area of extra consideration when assessing bedded salt successions in the UK.
Studies of potential for leakage of cement bondings in wells for CO2 injection and storage have 2shown that degraded segments of well cements might have permeabilities of 10-1 mD [10-16 m ]
(Celia et al., 2006). To produce significant leakage (1% fraction CO2), the effective permeability 2associated with the well must increase to about 105 mD (101 Darcy [10-10 m ]), which is many
2orders of magnitude larger than the permeability of intact cement (10-5 mD [10-20 m ]; Nelson, 1990; Celia et al., 2006). This illustrates clearly that in this case, well-formed cement will not leak any CO2 (Scherer et al., 2005). Based upon these data, less than well-formed cement behind well casings is more permeable than any evaporite bed that an oil or gas injection well intersects
Important to the concept of gas storage are the permeabilities and capillary entry pressures of the caprock or containing rock type. Capillary pressure in rocks is the pressure at which the nonwetting phase first displaces the wetting phase and is controlled by interfacial tension between grains, ‘wettability’, and the pore throat size distribution (section 3.4). The seal capacity is the maximum hydrocarbon column height that a seal can trap, which is controlled by the capillary entry pressure.
Salts may be both a storage medium (caverns) and provide seals to economic accumulations of hydrocarbons. Gas hydrates (clathrates) aside, salts (and associated evaporites) provide the most effective seal to hydrocarbon traps, regardless of hydrocarbon type and structural setting (Downey, 1984; Warren, 2006). Evaporite seals have very high entry pressures, very low permeabilities and large lateral extents and maintain seal integrity over wide areas and a range of
9

subsurface temperature and pressure ranges. Typical shale seal permeabilities are 10-1 to 10-5
2 2millidarcies (mD)2 [10-16 m2 to 10-20 m ] and rarely as low as 10-8 mD [10-23 m ] (Warren, 2006). 2Halite/rocksalt typically has very low permeability in the range 10-6 mD (10-21 m ) to 10-9 mD
2[10-24 m ]; Dale & Hurtado, 1997; Beauheim & Roberts, 2002; Bérest & Brouard, 2003; Warren, 22006), with anhydrite � 10-5 mD [10-20 m ] (Beauheim & Roberts, 2002; Warren, 2006). Salt has
such low permeabilities that it is thought possible that some of the permeability of the salt is induced by the cavern creation and operation (more precisely, either by tensile or high deviatoric stresses developed in the cavern wall, when the cavern fluid pressure is very high or very small – section 2.2.7.3.2.1 and Bérest & Brouard, 2003). As described above, typical well-formed
2cement in boreholes has very low permeability, of the order of 10-5 mD [10-20 m ] (Nelson, 1990; Celia et al., 2006) and there will be no significant flow of gas unless there are preferential flow paths, the material has degraded, or the material was not emplaced properly.
There are what are referred to as slightly permeable salt formations. In these cases, the 2micropermeability of relatively high permeability salt (10-20 to 10-19 m ) allows the brine pressure
in a cavern to be very slowely released. Following the cavern reaching thermal equilibrium then a state can exist where the brine outflow toward the rock mass balances the volume loss due to
2creep. When salt formation permeability is smaller (<10-21 m ), no significant pressure release occurs by brine permeation (Bérest & Brouard, 2003). However, ‘secondary’ permeability can be induced by high brine pressure in the cavern as tensile stresses at the cavern wall result in damage and a porosity/permeability (Fokker in Bérest & Brouard, 2003; also section 2.2.7.3.2.1).
Many good seals have entry pressures of more than 1000 psi, excellent seals have air-mercury entry pressures in excess of 3000 psi (PTTC, 2004). Typically, bedded evaporites, especially beds of predominantly monomineralic composition (e.g. massive halite/rocksalt), have entry pressures greater than 3000 psi, with impure evaporite beds having entry pressures greater than 1000 psi. The distance between salt (NaCl) lattice units is 2.8 x 10⁻¹⁰ m, while the smallest molecular diameter of a hydrocarbon molecule (methane) is 3.8 x 10⁻¹⁰ m (Warren, 2006). The entry pressures contrast with most shales (which are water bearing) showing typical entry pressures of 900-1000 psi (Warren, 2006).
Although shales form good seals, there is some diffusive leakage of methane (and some liquid hydrocarbons) with time via inherent microporosity. Evaporites, through a combination of the small size of molecular interspace in its ionically-bonded NaCl lattice, their ability to flow and anneal, make excellent long-term seals to substantial hydrocarbon columns, with little or no leakage of oil or gas, even by diffusion (Warren, 2006). The greater efficiency of evaporite seals is shown by the total hydrocarbon volumes held back by the two lithologies: total worldwide shale sediment volume is more than an order of magnitude greater than that of evaporites, yet the volumes of reservoired hydrocarbons below a shale or an evaporite seal is roughly 50:50 (Grunau, 1987). When allied to their viscoplastic nature, halite (or rocksalt) thus also makes an ideal rock type in which to construct voids for gas storage.
2.2.3 The process of drilling an exploration well/injection well, well completions and
casing
This section provides a brief summary of the process of drilling a standard hydrocarbon exploration and production (or injection) well. For the less experienced reader more detailed information may be obtained at http://www.oilandgas.org.uk/issues/storyofoil/exploration-02.htm and http://www.glossary.oilfield.slb.com/ and Appendix 8.
2In most oilfield applications, the millidarcy (mD; 0.001 Darcy), is used as a measure of permeability. Permeability is fundamentally a L2 unit. In SI it is expressed in μm2 and in conventional metric use as m2 or cm2. The conversion
2between oilfield and SI units is 1 Darcy = 9.87 x 10⁻¹³ m . In practical terms, 1 mD and 1 μm2 are essentially equivalent (e.g. Warren, 2006).
10

Over 40 years of North Sea exploration means that a huge amount of experience exists in the drilling and completing of oil or gas exploration wells, which are covered by strict drilling practices. Drilling of wells is now a very sophisticated, carefully designed and monitored operation, with many safety measures built in, including blowout preventors that protect against drilling into unexpected high pressure gas layers. Gas injection wells are drilled and completed to the same way and to the same strict standards as exploration wells. In exploration wells, drilling fluid (also called “mud”), which is mainly water-based, is pumped continuously down the drillstring while drilling. This acts as a lubricant and washes up the rock cuttings, which are brought to the surface by the circulating drilling fluid outside the drill pipe helping to identify the levels drilled and the presence of hydrocarbons. Gas storage wells into salt bearing strata, the drilling fluids are required not to cause dissolution of the salt and is commonly a brine solution.
All wells, including those drilled for producing water or hydrocarbons, at least when first drilled have openhole sections, but may be completed in a number of ways. After the hole is drilled to a given depth, a steel pipe (casing) is placed down the hole and is secured with cement. The casing provides structural integrity to the newly drilled wellbore and prevent caving of the wellbore wall. In addition it isolates chemically differing zones and potentially dangerous high-pressure zones or formations with significantly different pressure gradients from each other and from the surface.
Casing in its simplest form is large-diameter steel pipe, generally in sections around 13 m (40 ft) length with a threaded connection at each end. It is available in a range of material grades and sizes, internal diameters of which typically range from 4" to 30". Casing forms a major structural component of the wellbore and is lowered into an open hole borehole (wellbore) and cemented in place in order to stabilize the wellbore. The casing is assembled as a series of casing joints to form a casing string of the required length and specification for the wellbore in which it is installed. It is not uncommon for modern wells to have between two and five sets of progressively smaller hole sizes, each cemented with casing. Typically, a well contains multiple intervals of casing successively placed within the previous casing run. The following casing strings and intervals are commonly used in an oil or gas well:
• Conductor casing - prevents collapse of the loose soil near the surface and varies in size from 18" to 30"
• Surface casing – its purpose is to isolate freshwater zones and prevent contamination during drilling and completion. Surface casing is the most strictly regulated due to these environmental concerns, which can include regulation of casing depth and cement quality. Typical surface casing size is 13�"
• Intermediate casing - may be required on deeper boreholes where necessary drilling mud weight to prevent blowouts may cause a hydrostatic pressure that can fracture deeper formations
• Production casing – hung from the surface as the smallest casing and is typically 9�" • Production liner - a casing string that does not extend to the top of the wellbore but
instead is anchored or suspended from inside the bottom of the previous casing string producing a substantial savings in steel and therefore capital costs. There is no difference between the casing joints themselves and the liner is typically 7" diameter, although many liners match the diameter of the production tubing
• Production tubing - few wells actually produce through casing, because producing fluids can corrode steel or form deposits such a asphaltenes or parrafins and the larger diameter can make flow unstable. Production tubing is therefore installed inside the last casing string and the tubing annulus is usually sealed at the bottom of the tubing by a packer. Production tubing is commonly run from the completed interval back to the surface. Tubing is easier to remove for maintenance, replacement, or for various types of workover operations. Tubing is significantly lighter than casing and does not require a drilling rig to run in and out of hole; smaller pulling units are used for this purpose
11

Casing is usually manufactured from plain carbon steel that is heat-treated to varying strengths but may be specially fabricated of stainless steel, aluminium, titanium, fibreglass and other materials. Typically, a well contains multiple intervals of casing successively placed within the previous casing run.
In salt bearing sequences, casing can be inserted from above to below the top of the salt. This protects the upper salt beds if drilling is continued into underlying formations with fluids that might otherwise dissolve the salt.
2.2.4 Damage to gas storage wells and reservoir formations
Damage occurs to gas storage wells and the storage reservoir immediately adjacent to the well bore during normal operation. In the more than 350 U.S. storage reservoirs with a total of over 14,000 individual wells, gas-storage operators experience an average loss in deliverability of 5% over time (Yeager et al., 1998). Some of this damage, such as invasion and ‘sanding’ (material from some very soft or friable sandy poorly cemented formations is drawn into the wellbore during the pressure drop associated with withdrawal) are well known phenomena that also occur in oil and gas exploration and production wells. Significant amounts of solids, just as with the fluids standing in the bottom of a wellbore, are also known to decrease the deliverability of gas injection wells.
Other mechanisms are more specific to gas injection wells with Yeager et al. (1998) having identified four main types blocking pore spaces and causing formation damage (refer Fig. 3):
• Bacterial damage (see Chapter 7) - tests of fluids from reservoir intervals reveal sulphate-reducing bacteria and in some cases, acid-producing bacteria exist in many reservoirs. Sulphate reducing bacteria favour an anaerobic (oxygen-free) environment and may coexist with iron-reducing bacteria where even small amounts of oils and grease will provide nutrients for growth. Stagnant water and low-flow conditions such as those encountered at the bottom of the wellbore are ideal for bacterial growth.
• Inorganic precipitates, such as iron compounds (iron carbonate [siderite] and iron sulphides), salts (sodium chloride and/or calcium chloride), calcium carbonate and barium sulphate. The presence of iron compounds along with elemental sulphur is often a key to (and occurs in association with) the sulphate-reducing bacteria alluded to above (see also Chapter 7). Iron serves as a good electron acceptor for bacteria in the metabolism of sulphates. The presence of inorganic precipitates is influenced by 1) the type and quantity of fluids injected and withdrawn from the formation, 2) operating procedures, 3) presence of bacteria, and 4) reservoir characteristics such as temperature and pressure
• Hydrocarbons, organic residue and production chemicals - trace or very small amounts of hydrocarbon oils, ester compounds, and/or isobutylene materials have been found as a dark layer along the face of the wellbore, or as substances lining/plugging pore throats. These organic residues are assumed to be the result of compressor or lubricating oils and/or various production chemicals associated with gas delivery and injection
• Particulates - surfaces of sidewall cores show some degree of very fine material adhering to them (and thus the borehole walls), which is the product of the drilling and/or the injection process
All of these wellbore and formation problems can be overcome but require different stimulation methods to restore injectivity and deliverability. Over the years, a great deal of expertise, not just in gas storage but also in exploration and production operations, has been gained in the diagnosis of damage mechanisms and the design of stimulation techniques. Expert systems to diagnose formation damage and select the best treatments to rectify problems with gas storage wells are available (e.g. Xiong et al., 2001).
12

2.2.5 Depleted oil/gasfields
In the majority of oil/gasfields, the oil and/or gas is held in a porous rock (reservoir - often a sandstone), whereby spaces (pores) exist between the grains of sand, which form an interconnecting network between the grains, providing permeability (Fig. 4a-c). Some oil/gasfields are developed in other lithologies including carbonates and fractured basement rocks. The porosity and permeability enables the hydrocarbons to move through the rock mass. As oil (and/or gas) is produced from the oil/gasfield, so the pressure in the reservoir declines. Depending upon the drive mechanism during oil or gas production (see section 2.2.5.3), the pore spaces of the reservoir rock may remain gas or oil filled, or water may invade the pore spaces of the reservoir, due largely to hydrodynamic gradients.
The existence of an oil/gasfield attests to the capability of a structure and rock sequences to trap and successfully retain (commercial) quantities of hydrocarbons over significant periods of geological time (many millions of years). Depleted oil/gasfields thus offer the potential for re-injecting and storing natural gas underground. In many instances, re-injecting gas is associated with an increase in pressure within the reservoir, which can also lead to a period of increased oil recovery.
Depleted oil and gas fields represent the most cost effective storage option and is regarded as representing the preferred method of underground storage in the UK (BSI, 1998a).
2.2.5.1 BS EN 1918-2:1998
Underground gas storage in depleting oil and gas fields is covered by a British (and European) Standard, which also explains the concept and requirements of developing such a facility (BSI, 1998a).
2.2.5.2 BACKGROUND
Gas storage in depleted oil and gasfields is the most widespread method of storing natural gas in large quantities. Worldwide, depleted reservoirs currently number around 480 storage facilities, providing around 76% of gas storage volume (Table 2).
As indicated above, the first gas storage experiment was made in a gasfield in Welland County, Ontario (Canada) in 1915. The first gas storage facility in a depleted reservoir was built in 1916, using a gasfield in Zoar near Buffalo, New York (USA) and is still operational (WGC, 2006). By 1930, there were nine storage facilities in six different American states and prior to 1950, virtually all natural gas storage facilities were in depleted reservoirs (http://www.naturalgas.org/ naturalgas/storage.asp).
Facilities have generally been developed in depleted gas reservoirs, although increasingly, depleted oil reservoirs are being commissioned for this purpose. In the latter case this often has the added bonus of a period of enhanced oil recovery (EOR). However, prior to developing gas storage in a depleted field, studies on the cap rock gas tightness and integrity and the deliverability of the reservoir (e.g. the required injection and production rates, possible damage to the reservoir formation during production) are essential.
2.2.5.3 DRIVE MECHANISMS AND DEPLETED RESERVOIRS
Natural gas (and oil) may be produced form the reservoirs in two ways but which can span the range from:
• Depletion drive - reservoir pressure declines with gas production due to the lack of ingress of water from surrounding aquifers. In depletion-drive reservoirs, 90% or more of the gas can be produced because there is no invading water to kill the wells (e.g., Laherrère, 1997).
13

• Water drive - gas remains in near-hydrostatic pressure as water flows into the reservoir from surrounding aquifers continuously while gas is produced. In such reservoirs, much of the gas present cannot be produced because gas wells “water out,” a process by which water cones upward to the well preventing gas from entering the well thereby “killing” production. Such reservoirs typically only produce 60% or less of the original gas in place (e.g., Laherèrre, 1997).
In some fields gas is also produced by pumping from surface infrastructure, but this is clearly a less profitable way.
Regardless of whether a given reservoir is one of the two end-member types or falls somewhere in between, natural gas injection will always involve a pressure drop (�P) from the well to the reservoir (Oldenburg, 2006). The magnitude of �P depends on the rate at which gas is injected and the injectivity of the formation and for high-quality gas reservoirs will typically be on the order of 5-10 bars (75-150 psi). Injection will be easier in depletion drive reservoirs (because there is no water to displace). However, the low reservoir pressure creates the possibility of a large pressure drop between injection well and the reservoir (Oldenburg, 2006).
The drive mechanism might play a role in the safety assessment case in that higher injection pressures (with the attendant additional stresses on infrastructure and reservoir rock), would be required for water depletion fields compared to depletion drive fields.
2.2.5.4 THE PROCESS OF GAS STORAGE
The concept and principle of developing a storage facility in a depleted (hydrocarbon) reservoir is relatively simple. Natural gas is injected into the small pore spaces of a subsurface porous, permeable rock (reservoir) formation that were originally hydrocarbon bearing (refer Fig. 4), building up a volume of compressed gas, which is then withdrawn at a later date via operating wells. Additional observation wells may be drilled. Storage can be cycled between the maximum and minimum operating pressures. The maximum pressure is suggested to be the original reservoir pressure at the time of discovery, as this represents the highest known pressure at which the caprock and trap trapped hydrocarbons. Functional recommendations for the design, construction and operation of underground storage facilities in European oil and gasfields are detailed in BS EN 1918-2:1998 (BS 1998a). For specific elements of an underground gas storage facility, e.g. wells and surface installations, existing petroleum industry standards and legislation are likely to be applied.
Below the minimum operating pressure, there exists a large quantity of cushion gas in the reservoir, which is to all intents and purposes is physically unrecoverable gas. The volume of cushion gas can represent up to half the maximum volume of gas in place (http://www.naturalgas.org/naturalgas/storage.asp). Depleted reservoirs, however, having already been filled with natural gas and/or oil, do not require the same levels of injection of gas: that gas already exists in the formation. Replacing the natural gas with an alternative cushion gas can reduce investment costs.
Once oil or gas has been produced from a reservoir formation the pore space formerly occupied by the hydrocarbons is filled by invading formation waters. The generally saline water is naturally present in the rocks and its movement is driven by (hydrodynamic) pressure gradients. However, the situation can be reached where once too much water has migrated into the reservoir rock, it is difficult to displace with the injected gas, requiring pressures that make storage uneconomical or that might fracture the rock.
2.2.5.5 PRESENCE AND EFFECTS OF HYDROGEN SULPHIDE (H2S) IN OILFIELDS
Oil and natural gas (mainly methane) are the products of the thermal conversion of decayed organic matter (called kerogen) trapped in sedimentary rocks. Also present in natural gas are
14
naturally occurring contaminants including water vapour, sand, oxygen, carbon dioxide, nitrogen, hydrogen sulphide (H2S) and rare gases such as helium and neon, which have to be removed at natural gas processing facilities. H2S is an extremely poisonous gas and a few seconds of exposure in concentrations of anywhere between 750 and 10,000 ppm can prove lethal to people and animals. H2S is hazardous to rig workers and is also corrosive, causing sulphide stress-corrosion cracking of metals, which may require costly special production equipment such as stainless steel tubing. The presence of H2S in an oilfield and, if exposed to the gas during oil and gas production, its possible impacts on human health, is likely to be a potential concern for potential UGS operators. In addition to the brief details here, further details of the effects and dangers of H2S are provided in Appendix 8.
High-sulphur kerogens release H2S during decomposition, which stays trapped within the oil and gas deposits and is frequently encountered in oilfields, often to high levels, as in west Texas (Schlumberger, 2007). During oil exploration and production, H2S may enter drilling muds from subsurface formations and is also generated by sulphate-reducing bacteria in stored muds. Natural gas, or any other gas mixture which contains significant amounts of H2S, is generally termed ‘sour’ if there are more than 5.7 milligrams of H2S per cubic meter of natural gas. This is equivalent to approximately 4 ppm by volume (http://www.naturalgas.org/naturalgas/processing _ng.asp).
The H2S is removed (‘scrubbed’) from the sour gas by a process commonly referred to as ‘sweetening’ at what are termed desulphurization plants. Removal of H2S is normally done by absorption in an amine solution, while other methods include carbonate processes, solid bed absorbents (including solid desiccants like iron sponges) and physical absorption.
2.2.5.5.1 Effects of H2S
H2S variously acts as an irritant or an asphyxiant, depending of the concentration of the gas and the length of exposure. The primary route by which humans are affected is inhalation, although it also affects the eyes. Essentially, H2S blocks cellular respiration, resulting in cellular anoxia, a state in which the cells do not receive oxygen and die. Some scientific references have reported exposure to concentrations of H2S as low as one part per million can affect the central nervous system, resulting in neuropsychological effects (e.g. Chilingar & Endres, 2005), however, there is not scientific consensus on this point (UNEP3: http://www.uneptie.org/pc/apell/disasters/china _well/china.htm#impacts). At levels up to 100 to 150 ppm, H2S is a tissue irritant, causing Keratoconjunctivitis (combined inflammation of the cornea and conjunctiva), respiratory irritation with lachrymation (tears) and coughing. Skin irritation is also a common symptom. Instantaneous loss of consciousness, rapid apnea (slowed or temporarily arrested breathing) and death may result from acute exposure to levels above 1,000 ppm (Knight & Presnell, 2005; Skrtic, 2006).
The non-lethal effects can be summarized as:
• neurological –symptoms including dizziness, vertigo, agitation, confusion, headache, tremors, nausea, vomiting, convulsions, dilated pupils, and unconsciousness,
• pulmonary – symptoms including cough, chest tightness, dyspnea (shortness of breath), cyanosis (turning blue from lack of oxygen), haemoptysis (spitting or coughing up blood), pulmonary oedema (fluid in the lungs), and apnea with secondary cardiac effects (Snyder et al., 1995).
UNEP: United Nations Environment Programme
15
3

2.2.5.5.2 Incident at Gasfield, Chongquing, China
An incident in China illustrates the potentially deadly effects of H2S release during production from a gasfield. The disaster took place at the Chuandongbei gas field in Gao Qiao town in the north eastern part of Chongqing province. The incident involved a gas well blowout, which occurred at 10:00 pm on Tuesday, 23 December 2003 and resulted in the release of natural gas and H2S. According to press reports, the accident occurred as a drilling team was working on the 400 meter deep well and sent toxic fumes (sour gas - a high concentration of natural gas and H2S) shooting 30 metres out of a failed well (UNEP: http://www.uneptie.org/pc/apell/disasters/ china_well/china.htm#impacts).
The China Daily newspaper described the tragedy as “the worst of its kind in China’s history”. “The poisonous gas hovering in the air made an area of 25 square kilometres a death zone, as many villagers were intoxicated by the fumes in their sleep”. Worst hit was the village of Xiaoyang next to the gas well, where 90% (c. 243) of the residents were killed, “many having died in their sleep or were too old to escape”. More than 9,000 people were treated for injuries and 60,000 were forced to evacuate the area. (WSWS, 2003; Lloyd's Casualty Week for 23rd Jan 2003).
Many factors appear to have led to the release, most related to human error and poor operational and maintenance procedures, including operation under health and safety regulations that were far less stringent than those established in the UK.
2.2.5.5.3 In the UK context
Gas imported into an oilfield will be ‘sweet’, having been previously processed for the National Grid and would, therefore, have low H2S levels (no higher than about 3 ppm). Injection of this gas into an oilfield with H2S present would lead to its absorption (along with water), which on withdrawal would require the gas to be processed with removal of the H2S and water. To some extent, injecting large volumes of ‘sweet gas’ would potentially dilute the H2S levels in an oilfield, but levels in the subsequently withdrawn gas would be higher than prior to injection. The levels of absorption are likely to be determined by the time the gas is held in storage, which is likely to be for a period of 3-6 months or more.
The presence of H2S in oilfields considered for gas storage in the East Midlands has been raised as a concern by local residents and local District and County councillors (Davidson, in press). A number of oilfields in the East Midlands region are termed ‘sour’, i.e. the associated gas produced at some oilfields, such as Welton, has high concentrations of H2S. Supplementary information submitted by Star Energy to Lincolnshire County Council for the Welton Planning Application gave a figure of 3079 ppm by volume for H2S in the Welton oilfield and that processes to remove (‘scrub’) the gas currently being produced were already in place. However, higher levels of H2S, typically between 5,000 ppm and 10,000 ppm, with peaks as high as 15,000 ppm were recorded during trials on a ‘fixed-bed’ compact catalytic converter at the Welton oilfield in 1987 (Eddington & Carnell, 1991). This equipment is installed on vents (the first being in 1989 with others added later), and has no operating requirements other than routine analysis and removes between 92% and 100% of the H2S. The H2S is removed from the gas stream by reaction with the absorbent to form stable metal sulphides, with no impurities added to the gas stream. The ‘spent’ absorbent is nonhazardous and is discharged in the form of granules, which can be disposed of through the metal recovery industry (Eddington & Carnell, 1991).
H2S is reported in other UK oil and gasfields, but can be very variable in its concentrations. For example at Caythorpe, the upper tight (Permian) dolomite reservoir contains gas with an H2S content of around 5 parts per million (ppm). The lower main producing (Early Permian) Rotliegend gas reservoir has no reported H2S content (IEA, 1999).
16

The presence of H2S at any particular proposed UK oilfield UGS site during the oil production phase might, therefore, require particular attention, assessment and precautions in the operational plans and proposals on a site-by-site basis. However, in 1997, an atlas of the composition and isotope ratios of natural gases in northwest European gasfields in the Southern Permian Basin was produced under the European Commission JOULE Programme (Lokhorst, 1997). This provided contoured maps of the levels of the main gases around the basin. H2S is reported in other UK oil and gasfields, but can be very variable in its concentrations. The study provides important information on the levels of H2S in UK oil and gasfields. Given the common source of the gas (Westphalian), this information may be of importatnce to onshore fields in the first instance when assessing the regional trends.
2.2.5.6 SUSIDENCE ASSOCIATED WITH OIL AND GAS PRODUCTION
Subsidence associated with oil and gas production is a well-known phenomenon and one that nowadays is predictable and can be modelled. Fluid production and declining reservoir (pore) pressures may lead to a ‘relaxation’ of the reservoir. This movement may propagate to the surface, being typically manifested as a bowl-shaped subsidence (depression) at the surface, centred over the oilfield. The subject and summaries of problems of subsidence encountered at oilfield sites is considered in more detail in Chapter 8.
2.2.6 Aquifers
Aquifer storage is based up on the same concepts as depleting oil/gasfields, but represents a more costly option as aquifers require conditioning and more preliminary work to prove the capability to hold and contain gas under pressure and a greater investment in cushion gas as the reservoir formerly held saline waters (e.g. Oldenburg, 2002; Favret, 2003). Traditionally, these facilities are operated with a single winter withdrawal period, although they may be used to meet peak load requirements as well. In the UK context (and generally), aquifer storage represents the least desirable and most expensive type of natural gas storage facility for a number of reasons, perhaps most crucially, that there are likely to be environmental restrictions to using aquifers as natural gas storage.
Though not considered further in this assessment of UK underground gas storage, a brief background of aquifer storage is provided for information and completeness.
2.2.6.1 BS EN 1918-1:1998
Underground gas storage in aquifers is covered by a British (and European) Standard, which also explains the concept and requirements of developing such a facility (BSI, 1998b).
2.2.6.2 BACKGROUND
Aquifers are underground porous, permeable rock formations that act as natural water reservoirs and were first used for gas storage in 1946 in Kentucky, USA (Favrez, 2003). They are around 80 storage facilities in aquifers in the world today, most of them in the United States, the former Soviet Union and Western Europe (France, Germany and Italy). France has around 12 aquifer storage facilities.
The principle of aquifer storage is to create an artificial gasfield by ‘reconditioning’ the water-bearing formations and injecting gas into the water-bearing pore spaces (refer to oil and gas scenario; Fig 4a-c). While natural gas being stored in aquifers has already undergone all of its processing, upon extraction from a water-bearing aquifer formation the gas typically requires further dehydration prior to transporting, which requires specialized equipment on site near the wellhead.
17

However, aquifers do not have the immediate advantages that converting depleted oil/gasfields into a storage facilities has because hydrocarbons have generally not previously been trapped in the rocks (unless the trap has been breached, in which case it may not represent an ideal storage site anyway). The geological characteristics of aquifer formations are not as well known and as a result, a greater amount of site characterisation is necessary to establish the suitable geological conditions exist for gas storage, including reservoir, structure and suitable caprock. Furthermore, aquifer storage creates pressure gradients that the storage and caprock formations have not previously experienced. This could result in failure of the caprock due to the displacement of the static water column, forcing water out of the caprock and permitting gas to leak from the storage formation. This process is known as exceeding the threshold displacement pressure or threshold pressure (Lippman & Benson, 2003; see also section 3.4).
2.2.7 Salt caverns
Rock salt (halite; NaCl) exhibits unique physical properties and mechanical behaviour. Halite beds in situ are extremely soluble, highly incompressible and are thought to be almost impermeable below about 300 m (Baar, 1977). Such beds are nonporous and are known to provide the regional seal to economic accumulations of hydrocarbons. They also represent a unique host material for the development of (large) caverns and storage of materials that do not cause dissolution of the salt.
Rock salt may exist in two forms. It is deposited in sedimentary layers forming a series of bedded deposits (so called ‘thin bedded’ salt, Fig 4d). The salt is highly ductile and during burial beneath younger sediments and due to its rheological and deformation mechanisms forms a weak layer between other more competent lithologies and deforms readily by ductile (plastic) creep (refer section 4.2). Under geological timescales and geostatic pressures, it deforms (‘flows’) plastically, much like a viscous fluid and salt is often viewed as a pressurized fluid. This process is known as halokinesis and can give rise to a series of halokinetic structures (so called ‘massive’ salt), ranging from salt swells to pillows to larger, salt domes (Fig. 4d) and elongate salt wall structures. Salt domes can reach up to 1.6 km in diameter and anywhere between 5 and 9 km in height.
Rather than fracturing, most halite beds lose their seal integrity either through dissolution windows or through salt-flow induced breaches, known as ‘overburden touchdown’ or salt welds. This occurs when salt flows to a region (thickens) and as it does so is withdrawn from adjacent areas, where it consequently thins. Thick salt beds experience brittle fracture only at very shallow near surface levels and typically vadose conditions or perhaps during very high strain rates, as might be associated with major faults defining sedimentary basins. There are, however, no such active faults in the UK at present (refer section 6.2).
The preservation of soluble bedded salt (and salt in halokinetic structures) over long periods of geological time demonstrates the relatively inactive hydrological settings in which it is found. On the other hand, should salt beds come into contact with circulating groundwaters then its high solubility in water means that salt deposits can be subject to rapid degradation. The same high solubility, however, also permits the rapid creation of caverns at relatively low cost. The low permeability of salt means that should any stored material leak from the cavern, then transport away from the facility would generally be slow (Hovorka, 2000). The storage capacity for a given cavity volume (varying from several hundreds of thousands to millions of cubic metres) is proportional to the maximum operating pressure, which is dependent upon the depth from the surface.
18

The physical properties and characteristics of rocksalt offer another option for the underground storage of hydrocarbon products (including LPG and natural gas). Salt cavities may be excavated in bedded salt layers or in halokinetic structures, with two scenarios existing for UFS:
• Abandoned salt mines. These were not originally constructed (or operated) with gas storage in mind. Former salt mines, which are used in the USA for underground fuel storage, tend to be at shallower depths than those at which solution mined cavities are constructed, with the inherent problems of thinner cap rock and possible groundwater interaction
• Solution mined caverns. Many early storage caverns were originally created by solution-mining during the production of brine and chlorine products. They have subsequently been used for the storage of a range of products, including natural gas. However, the completed brine cavities were not ideally designed or constructed (in terms of their shape or spacing) for high-pressure gas storage. Gas cavities should be spherical or cylindrical in shape with domed roofs and with a grid spacing related to their size (diameter). In the UK during the 1920s, ICI was at the forefront of the development of techniques for solution mining and salt extraction at their operations in the Preesall Saltfield (e.g. Wilson & Evans, 1990; Hortholt & Highley, 1973; Evans & Holloway, in press). However, the early ICI caverns often saw the almost complete removal of salt in a cavern, leaving little or no roof salt protecting the overlying nonsalt beds. These caverns generally collapsed, but as the technique was improved and knowledge of salt mechanics grew, so to did brining techniques. This led to the production of more stable caverns, particularly on abandonment. The technique of the design and solution mining of salt cavities in bedded or domal salt structures for the purpose of high-pressure gas storage is now well advanced. The design and construction of caverns specifically for gas storage is now at such a stage that a process termed solution mining under gas (SMUG) is performed – storage of product begins as creation of the remaining cavity continues (e.g. Chabrelie, et al., 1998 – and section 2.2.7.3.2).
In England, there are an increasing number of proposals to design and construct salt cavern facilities for the purposes of underground storage of natural gas. Salt cavern facilities generally serve to store smaller volumes of gas than those that can be stored in aquifers or depleted reservoirs, although the larger cavern facilities with 10’s of caverns can provide storage volumes approaching those of small oil/gasfields. Importantly, however, salt cavern storage facilities complement large porous reservoir storage, offering several advantages including high deliverability and degree of availability, short filling period and low percentage of cushion gas (which can be almost completely recovered on abandonment of the facility). Thus the combination of the two types of storage, in porous reservoirs, which are generally used to guarantee basic demand to meet seasonal variations, and storage in salt cavities, which are generally operated to cover peak demand, allows high withdrawal rates even at the end of the withdrawal period.
Whilst halite with its extremely low permeability and general viscoplastic deformation is viewed as an ideal storage medium, there are examples of salt having suffered brittle deformation, with the indication that long-range migration of methane has occurred through the fractures (Terrinha et al., 1994; Davison et al., 1996a). This has potentially important implications for not only hydrocarbon potential of basins but also gas storage and is reviewed further in section 6.1.4.
In this report the main incidents at storage facilities that caused injuries or casualties and what were believed to be the factors and causes behind their occurrence are briefly reviewed. One or two examples of salt cavern storage facilities had to close due to volume loss and these are included for completeness. However, it is stressed that these latter incidents were not associated with cavern failure, release of stored material or any loss of life or injury. Furthermore, there are few cases of catastrophic failure (collapses) known and caverns do not, in general, fail catastrophically or close rapidly when depressurized for short periods of time. Most cavities are
19

held at hydrostatic pressure, but rarely, some may have ‘empty’ periods when they are held at atmospheric pressures. Examples exist from around the world of depressurized cavities that have remained stable for decades, for example:
• In the 1950s, a lenticular cavern was excavated by solution mining in the Bryan Mound salt dome in Texas, a site of the later Strategic Petroleum Reserve (Serata, 1984; Thoms & Gehle, 2000; Warren, 2006). It was constructed at an average depth of 550 m, with a height of 55 m and unsupported roof span of 366 m. After excavation, it was filled with LPG but subsequently lost wellhead pressure and was abandoned, empty. Thirty years later, measurements indicated that the cavern was remarkably stable, having lost only about 4% of it total volume (Warren, 2006)
• At the CAES storage caverns at McIntosh, Alabama (refer section 2.2.10.2.2), during the replacement of the main operating pipe, the cavern was depressurized for more than six months. There were no roof falls and from subsequent observations it was estimated that the volume of the cavern remained unchanged (Leith, 2001)
2.2.7.1 BS EN 1918-3:1998
Underground gas storage in salt caverns is covered by a British (and European) Standard, which also explains the concept and requirements of developing such a facility (BS EN1918-3:1998; BSI, 1998c). The standard states that salt caverns are generally seen as suitable and preferential sites for the storage of oil and gas, due to the almost zero permeability (to gas) and the viscoplastic nature of salt, which leads to the healing of any cracks and faults. Halite has very high ductility and when subjected to stress, an ability to plastically flow by crystal plastic deformation (creep) processes. This means that it has a low susceptibility to fracturing, but when it occurs, the halite ‘anneals’ (‘flows’), thereby allowing fractures and cracks to seal (see below).
The BS document also provides a series of properties and measurements that are required for the design of caverns:
1. ‘mechanical disturbances’ for cavities that require determination and include
• The change in volume loss by creep in the salt formation (convergence)
• The distribution of the cavity wall and floor deformation
• The distribution of the stress induced by the cavity in the surrounding rock
2. ‘principal stability parameters’ that need to be defined within the cavity design and include:
• The cavity geometry (shape, height, diameter, roof guard)
• The positioning (e.g. well pattern, depths, pillars, distances to caprock, bedrock)
• The distance to subsurface neighbouring activities
• The maximum operating pressure, which shall always be less than the overburden (lithostatic) pressure
• The minimum operating pressure to prevent closure of the cavern by salt creep
The above calculations and assessments are determined from borehole samples subjected to rigorous laboratory stress and strain tests and/or in situ tests in the well(s). The results of the tests provide the engineering parameters and rheological model of the salt used as the basis for the construction of high-pressure gas storage caverns. The tests and models are designed to demonstrate that the cavity will be mechanically stable and capable of containing gas under the proposed/permitted operating conditions, “using acknowledged geological methods and databases.” (BSI, 1998b; p.10). Also required is consideration of the cavern operation and performance under emergency conditions and procedures that will enable safe shut down of the facility.
20

Chapter 4 outlines some of the main conditions and characteristics of salt beds and their potential impact on the planning, design, development and construction of gas storage caverns.
2.2.7.2 BACKGROUND
As outlined above, salt for a number of reasons, represents a unique host material for the development of (large) caverns and storage of materials that do not themselves dissolve salt. Large underground salt caverns may be used for storage of liquid (oil, NGL’s, and LPG), gaseous hydrocarbons, compressed air (e.g. Crotogino et al., 2001; Leith, 2001; Cheung et al., 2003), or the disposal of (generally solid) waste materials and radioactive waste (e.g. Veil et al., 1998). Some caverns in the USA and Russia have been used for the underground testing of munitions and nuclear weapons (e.g. Thoms & Gehle, 2000; Leith, 2001).
The earlier cavern storage facilities utilised brine caverns created during the extraction of salt for the chemical industry. In Canada, LPG has been stored in solution-mined caverns constructed in bedded salts and salt domes since the late 1940s/early 1950s (Tomasko et al., 1997), whilst LPG was first stored in Texas caverns during the 1950s (Tomasko et al., 1997; Brassow, 2001; Favrez, 2003;). At about this time crude oil was being stored in caverns in England (Brassow, 2001). Storage of natural gas in salt caverns first occurred in 1961, when the Southeastern Michigan Gas Company leased an abandoned salt cavern from the Morton Salt Company near Marysville, Saint-Clair County, Michigan (Allen, 1972; Tomasko et al., 1997). In the Teesside area in the UK, former ICI brine caverns are still in use for storage of a range of hydrocarbon products (refer Table 1).
The first salt cavern specifically designed and constructed for natural gas storage was built by the Saskatchewan Power Corporation at Melville, Saskatchewan, Canada in 1963. This was followed in 1970 by the first purpose built gas storage caverns constructed in the USA, at the Eminence Dome, Mississippi (Thoms & Gehle, 2000). The American Strategic Petroleum reserve (SPR) represents the world's largest stock and supply of emergency crude oil, amounting to around 700 million barrels. The SPR was established in 1977 with a large part of the oil stock stored in huge underground salt caverns along the coastline of the Gulf of Mexico.
In Europe, salt cavern storage of natural gas commenced in Armenia (Abovian, 1964), followed by Germany (Kiel, 1969) and France (Tersanne, 1968). Storage was in caverns whose capacity was limited to between 30,000 - 100,000 m3, in order to avoid problems that were then known and encountered in salt mines (Chabrelie et al., 1998; Favrez, 2003). Between 1971 and 1978, the German Federal Republic commenced building of its strategic oil reserve, using caverns constructed in the Etzel Salt near Wilemshaven. Some of the original caverns are now converted for use in gas storage. Many countries have large numbers of caverns used for storage purposes, including the Federal Republic of Germany, which in 1982 had about 140 (Jenyon, 1986c). In 1978 the first compressed air storage facility was constructed in the Huntorf salt dome near Hamburg (Thoms & Gehle, 2000; Crotogino et al., 2001).
Hydrocarbon storage in salt caverns now has a long history, particularly in the USA. During the early 1990s there were 648 solution-mined caverns licensed in Texas alone, with around 200 being in bedded salt areas (Seni et al., 1995; Hovorka, 2000). In 2003 over 1000 caverns were in use in the USA for the storage of various products, including waste (Neal & Magorian, 1997; Brassow, 2001; Knott, 2003). Those storing hydrocarbons range in size from 0.4 million to 40 million barrels (circa 0.062 to 6.2 Mcm) and with pressures of up to 800-4000psi. Approximately 50 of these caverns were in use to hold about 200 billion cubic feet (bcf = c. 5.66 Bcm) of natural gas (Knott, 2003). Worldwide, thousands of salt caverns have previously and are currently being used for the storage of hydrocarbon products (Thoms & Gehle, 2000; Bérest et al., 2001; Bérest & Brouard, 2003).
In contrast to the practice of re-using of old brine caverns, present day design and construction of gas storage caverns includes significant geomechanical design work and engineering. This
21

ensures the long-term safety and stability of the cavern and associated below ground infrastructure.
2.2.7.3 THE PROCESS
Most modern day salt cavities used for storage of fuel products have been created by the process of solution mining. The solution mining process involves the injection of fresh (or sea) water into the salt body, which dissolves the salt resulting in brine, which is then withdrawn from the emerging cavity and replaced by injecting fresher water. The technique was taken up and pioneered in the UK by ICI during the 1920s and the process recovers up to about 25% of the total salt reserve. Nowadays, it has been recognised that brine caverns have a value after brining operations have ceased and brine caverns are often carefully designed and constructed to be used for gas storage purposes and therefore maintain the stability of the overlying strata and so avoid surface subsidence. Each cavity is developed through a single borehole drilled into the salt beds, which is used to extract the salt and which will then serve for gas injection and withdrawal once the cavity is constructed (Fig 4e). The borehole is drilled using standard oil industry drilling methods (see section 2.2.3). However, the well is initially wider than conventional oil/gas exploration and development wells and the drilling fluid used is brine to prevent dissolution the salt by water-based fluids during drilling. A series of pipes or ‘casings’ are then cemented into the borehole to provide protection for the surrounding sediments as water is injected and withdrawn during dissolution of the target salt beds (section 2.2.7.3.2).
2.2.7.3.1 Well design, spacing, cavern design and shaping
The detailed design and engineering aspects of well design, spacing and cavern shaping are beyond the scope of this report. For more information on basic solution mining techniques for various salts and the general procedures for controlling the shape of solution mined caverns the reader is referred to Remson et al. (1966), Jacoby (1974), Shock (1985) and API (1994). In the simplest system, the design of a salt solution well comprises two or more columns of steel pipes (casing strings), one inside the other. An initial borehole with a diameter large enough to accommodate the required pipes/tubings is drilled and casing cemented in place to prevent any leakage and contamination of groundwaters during the operations. Near surface the borehole is widest to allow for installation of several concentric layers of pipe casing, which assist the initial drilling of the borehole. The outermost casing (also referred to as surface casing) does not generally extend all the way down to the cavern roof. Instead, a final casing string is cemented in place from some distance above the salt to some way below the top of the target salt to ensure that during dissolution, a set thickness of salt remains in place as a salt roof to the emerging cavern. This process was not generally undertaken during purely salt brining activities, hence the propensity for the removal of all roof salt, which often led to the collapse of cavern roofs and subsidence as seen at, for example, Preesall (NW England – section 8.7.2.1.1 and Fig. 5b). One or more noncemented concentric casing strings (or tubing strings), one inside the other(s), are then placed inside the final casing string, forming one or more annuli. Through one of these strings fresh water (or undersaturated brine) is pumped down the well under carefully controlled conditions to dissolve the target salt beds and create the cavity. The resulting brine is then returned to the surface for processing and recovery via a second tubing string. As the brine is removed, it is replaced by fresher water, dissolving more salt and thereby expanding the cavity. Most modern wells have a third casing string through which an inert protective blanket fluid is injected (normally diesel, nitrogen or compressed air). This floats on top of the brine, providing insulation from the effects of solution, to the roof salt and cemented casing as it enters the cavern. It prevents rapid upward stoping and ultimately, collapse of the cavern roof and well damage. The thickness (or depth) of the blanket fluid is carefully monitored as the cavern is gradually enlarged.
22

In the USA, the brine wells are generally laid out on a regular grid with new wells being drilled around 200 m apart. Proposed and actual wellhead spacing in the UK varies, being around 400 m at Atwick and 280 m at Byley (Appendix 7). At the proposed Preesall site, it was planned that a number of deviated wells would be drilled from one site to access and supply a number of caverns from one wellhead platform.
2.2.7.3.1.1 Example of a proposed salt cavern gas storage well casing program at Preesall, NW
England
The following summarises the casing program proposed for a typical gas storage well at Preesall (Heitmann, 2005):
• Conductor casing – 22" (559.0 mm) pipe, to circa 15 m overall length • Surface casing – 18" (457.0 mm) pipe, to circa 110 m overall length • Production casing – 13 �" (339.7 mm) pipe, to circa 400 m overall length • Injection tubing string - 10�" (273.1 mm), to circa 600 m length • Injection tubing string – 7" (177.8 mm), circa 610 m length
2.2.7.3.2 Salt cavern design and construction
Salt cavern design varies not only due to engineering/construction constraints placed upon it by local ground and geological conditions, but also operational requirements. Caverns will generally be ellipsoidal in shape with long axes vertical. Ultimately, any decision to undertake gas storage in salt caverns constructed in bedded salts will generally require that a number of caverns will be located in a relatively confined area. This is partly to ensure maximum efficiency, but it also contributes to long-term security against breaching of more isolated and disparate caverns caused by future human activity. The spacing of caverns, as well as their optimum shape, are calculated based on careful simulation using in situ and laboratory tests of materials and long-term creep models (e.g. Rothenberg et al., 1999; Dusseault et al., 2001).
Typically, salt domes used for natural gas storage are between 450 m and 2000 m below ground level, although in certain circumstances they can come much closer to the ground surface. Salt beds from which salt domes develop, are usually no more than 300 m – 400 m in thickness and are often interbedded with other evaporitic and insoluble (non salt) horizons (sections 2.2.7.3.4 & 5.3.1).
Construction of ‘conventional’ large volume solution-mined salt cavities is generally possible in bedded salt layers of 150 m to more than 400 m, but caverns have been constructed in thinner salt layers of 60 m - 100 m, producing cavities with geometric volumes between 50,000 m3 and 100,000 m3 (Chabrelie et al., 1998). However, many areas of the world have thin salt layers of less than 60 m thickness and cavern storage projects have been proposed in New York State (USA), with as little as 27 m of bedded salt. At Holbrook, Arizona, short and flat LPG caverns have been constructed in only 34 m of bedded salt at depths of 305 m below ground level (Neal & Magorian, 1997). Gaz de France has investigated the technical and economic conditions in which thinner salt layers can be used for gas storage. Their studies found that tunnel-shaped cavities of 1,000 - 3,000 m2 cross-sectional area, stretching almost horizontally over several hundred metres and with a volume between 100,000 m3 and 1,000,000 m3, are stable (refer Chabrelie et al., 1998).
For caverns at a depth of 1000-1400 m, the convergence rate is usually below 1% per annum (Plaat, in press). With increasing depth, both the temperature and the overburden pressure increase, the consequence being that convergence rates increase rapidly with depth. To illustrate, near Harlingen in the Netherlands in a solution mining operation at depths up to 3000 m, convergence in the order of 70% per year has been observed (Breunese et al., 2003; Plaat, in press). The cavern thus closes almost as quickly as the salt is mined and is presumably associated with significant subsidence problems.
23

Conversely, as the pressure at which the gas can be stored increases with depth, it is desirable to create a cavern as deep as possible, maximising the amount of gas that can be stored per cavern. This means that, in general, salt caverns are found at depths ranging from 700 to 1700 m, while the optimal range is usually between 1000-1500 m (Plaat, in press).
Several methods for developing and shaping caverns exist (e.g. Warren, 2006):
• Direct circulation – fresh water is injected through the tubing strings and brine is withdrawn through the annular space between the tubing string and the final (cemented) casing. The pressure differential between the point of entry and the point of exit from the cavern, and the fact that the injected water is lighter than brine, causes convection, which is responsible for the major portion of the dissolution and in this way there is thus a continuous circulation of water (Leith, 2001). This process leads to the formation of more cylindrical caverns
• Reverse circulation – fresh water is injected through the annulus and the brine is withdrawn through the tubing string. This method produces caverns with much wider tops than bases, particularly where no fluid blanket is employed during leaching, as the less dense freshwater floats on top of the more concentrated brine
The resultant brined cavities are typically up to 145 m in diameter and up to 200 m in height, but can be significantly larger in thick salt dome salt. Two of the largest in the USA are about 670 metres in height and 180 metres in diameter, with capacities of over 17,000,000 m3 (Leith, 2001). The position of the water injection tube and the depth of the protective blanket fluid control the area of salt dissolution. By changing their position during development and by changing the direction of convection, the final size and shape of the cavity can be controlled. The brining operation can be done in a variety of ways (Fig. 4e), from the top down or, most commonly, bottom up, with cavern development monitored by sonar techniques. Insoluble mudstone falls to the bottom of the cavity and collects in what is termed the ‘sump’; a volume designed into the cavern to maximise cavern storage space and operational efficiency. Depending on the size of the cavern and the amount of impurities present in the salt (either as dolomite and anhydrite interbeds or more disseminated material throughout the salt body), more than 20 metres of residue can accumulate in the sump at the bottom of the cavern (Crossley, 1998; Warren, 2006)
In the USA, a further method of cavern construction, that of solution mining under gas (SMUG), is developed. This method allows a cavern to be put into gas storage operation sooner (Chabrelie, et al., 1998). Initially the cavern is developed by conventional solution mining techniques. However, its upper section is then developed up to its designed final diameter ahead of the lower section. The design also requires a few modifications of the wellhead and solution-mining strings in order to allow for gas storage in the cavern upper section while continuing solution mining the lower section. The upper section of the cavern is then dewatered as gas is injected and stored whilst the solution mining process is resumed, creating the lower section. Gas stored in the upper section therefore acts as the blanket for continued solution mining of the lower section. The technique also means that existing caverns can be further developed by commencing/resuming SMUG.
2.2.7.3.2.1 Cavern stability and damage - minimum and maximum cavern operating pressures
The structural stability of caverns in bedded or massive salt deposits depends upon many interrelated factors, including local hydrology, geology and rock properties, cavern operating conditions, cavern depth, cavern geometry and cavern location with respect to other caverns (e.g. Pfeifle & Hurtado, 2000; DeVries et al., 2005). Successful cavern design, construction, long-term operation and abandonment must provide conditions for long-term cavern stability in order to maintain the integrity of the salt. To achieve stability and prevent damage to the cavern walls and roof means avoiding conditions known to adversely affect cavern stability and which would
24

allow the formation of microcracks and gas permeation in the cavern walls/surroundings (see below and section 4.2).
One of the reasons rock salt is a favoured storage medium is that it is a viscoplastic material that is difficult to fail under moderate levels of confining pressure. Under conditions of triaxial compression, which is often the case for natural underground stress situations, the confining pressure may be sufficient to suppress fracture. In this case, deformation will continue indefinitely without failure. However, the introduction of a cavern within a salt body alters this steady state and results in varying states of stress around the void. The roof rock of a cavern is now in a state of triaxial extension. Rock is typically weaker in triaxial extension than in triaxial compression - salt behaviour is elastic-ductile when short-term compression tests are considered, but is elastic-fragile when tensile tests are considered (Bérest & Brouard, 2003). In the long term salt behaves as a fluid in the sense that it flows even under small deviatoric stresses (section 4.2). It is, therefore, important to understand the creep and strength characteristics of salt under these differing states of stress around the void/cavern.
Under triaxial extensional stresses, the salt body will dilate, which is manifested as a volumetric expansion (increased porosity), resulting from microfracturing of the material (refer Fokker in Bérest & Brouard, 2003; Munson et al., 1999). This process can become severe enough to cause spalling (breakouts) in the cavern roof and/or walls and subsequent damage to the cavern or hanging pipestring(s). Fracture in salt and spalling occurs by the formation and evolution of microfractures. These take the form of “wing tip” cracks (Fig. 6j), either in the body or the boundary of the salt crystal/grain (Munson et al., 1999). Under shear stresses, this type of crack deforms, opening up and producing a volume strain, or dilatency. If there is sufficient confining pressure (e.g. in nature or in a cavern with high enough gas pressure), then fracture formation is suppressed. However, if the confining pressure is too low to suppress fracture initiation and growth, then the fractures will evolve with time to give the characteristic tertiary creep response (Munson et al., 1999). This tertiary creep is a combination of the fracture development and the natural creep and fracture healing processes in salt. Significantly, the volume strain produced by microfractures may lead to changes in the permeability of the salt, which would be of concern in the cavern sealing and operation.
Maintaining structural stability and the integrity of the host salt deposit is therefore achieved by avoiding or limiting microfracturing in the salt. Cavern design must avoid the state of deviatoric stress whereby the difference between the gas pressure inside a cavern and the in situ stress of the surrounding salt becomes too large that dilation of the salt occurs (DeVries et al., 2002, 2005). In a gas storage cavern, the pressure to prevent damaging triaxial extensional stresses within the cavern walls and roof is provided by the brine during construction and gas during storage operations.
On the other hand, as alluded to elsewhere, if the cavern pressure is too high, then fracturing of the salt and surrounding rocks may occur. Hence a maximum operating pressure is calculated, to ensure that storage pressures remain below the vertical component of overpressure.
Munson et al. (1999) take these concepts and model cylindrical caverns and illustrate that stress conditions around the cavern do not lead to large amounts of damage. The damage is such that general failure will not readily occur. Furthermore, the extent of the damage does not suggest possible increased permeation when the surrounding salt is impermeable. Modelling stress distribution around cavities indicates that fracture pressure is also a function of the rate of pressure increase and the creep rate of the salt (Wallner, 1988). For slow pressure build-up rates modelled for sealed caverns, pressures greater than lithostatic can be contained within the cavern without causing fracture. However, at shallow depths and low salt creep rates, fracturing can be induced at very low-pressure change rates (Byrnes, 1997).
An aspect of the calculations on and modelling of cavern stability and internal pressures includes an assessment of the load bearing capacity of the surrounding rock mass in the event of a rapid blowout (depressurisation) of a gas storage cavern down to atmospheric pressure. The purpose of
25

this investigation is to prove that a sudden drop in pressure to atmospheric in a cavern does not lead to a chain reaction resulting in the collapse of the cavern and/or of the whole cavern field. These calculations can be done within the scope of theoretical studies of ultimate boundary conditions for a cavern wall failure based upon the knowledge of salt mechanics and specific laboratory tests.
As would be expected, many studies have been undertaken into the design of new salt caverns and the potential extension of the useful life of older salt caverns by a greater understanding of the manner in which older caverns and sealing systems might fail (see e.g. Chan et al., 1998; Lux et al., 1998; Munson et al., 1999). These studies have looked at the damage zone around older caverns and on the creep, microfracture development and healing processes in the salt body. In particular, micromechanical mechanisms of fracture and the concept of a fracture mechanism map have been developed and refined. This knowledge feeds into modern cavern design calculations.
2.2.7.3.2.2 Leaching rates and brine disposal
Leaching rates and thus construction times vary with the amount and degree of salinity of the water injected. It is common to find that for every seven cubic meters of fresh water injected, a volume of one m3 is leached (Leith, 2001). Leaching rates are normally expressed as the amount of water or brine circulated and can reach rates of 1600 m3 per day. In the U.S., leaching rates of 320,000 m3 to 400,000 m3 per year are common (Leith, 2001). Construction rates for the two 150,000 m3 solution-mined caverns at Huntorf in Germany were an average of about 360 m3 of salt per day, at a maximum circulation of 600 m3 per hour. Each cavern was completed in about 14 months and it took a further five months to remove the brine from each of the caverns (Leith, 2001).
Brine displaced from a leached cavern is normally first pumped into a surface holding tank to allow any insoluble residues that did not settle in the cavern but were carried out by the brine, to settle out. Disposal is by either injection into subsurface saline aquifer close to the development, or by pumping out to sea. In the USA, water is also injected into vugs (natural solution cavities found in the cap rock to salt domes at relatively shallow depths), a technique not available onshore the UK.
In the UK, the brine might be used as a chemical feedstock. For example, in the Cheshire Basin area, Ineos Chlor produces brine during the construction of caverns at Holford that is pumped 3 km to a purification plant at Lostock. It is then pumped to consumer plants at Brunner Mond’s two soda ash plants in Northwich, as well as Salt Union’s vacuum salt plant and Ineos Chlor’s own chlor-alkali plant, both near Runcorn.
However, during the investigations at Preesall, no immediate or nearby market was found for the brine and it is proposed that the brine will be discharged into the East Irish Sea through a pipeline to be constructed for the purpose. Similarly, it is proposed to discharge the brine from the Portland solution mining activities out at sea.
2.2.7.3.3 Subsidence occurring with cavern formation and overburden/caprock stability
It is a well-known fact that natural solution of concealed salt beds by circulating groundwaters leads to subsidence of the land surface. In addition, subsidence and impacts on hydrologeological regimes occur at many underground mining operations, causing changes to surface landforms, ground water and surface water flow. All solution-mined caverns converge as they very gradually shrink due to salt creep (Bérest & Brouard, 2003). This occurs until either the salt to fill the void or confining pressures and cavern pressures are equalised and is associated with varying degrees of subsidence. The impacts of mining and solution mining operations to man-made surface structures and other features are relatively well known and studied and are outlined further in section 8.7. Subsidence may be accelerated if total salt extraction has been allowed to
26

occur (leaving no roof salt in the cavern). This could cause collapse of a salt cavern or mine, which can in turn lead to catastrophic failure and collapse of the overburden, resulting in the formation of a (often deep) crater at surface. Such events have occurred in salt workings in Europe and in the UK at the Preesall brinefield (Lancashire – refer Wilson & Evans, 1990; Jackson, 2005 – section 8.7.2.1.1 and Fig. 5b).
2.2.7.3.4 Insoluble (non salt) interbeds
The presence and understanding of the physical and mechanical properties of non-salt interbeds are important for at least two reasons:
• Their presence could mean that salt caverns in bedded salt may be more prone to deterioration, may develop less than ideal and unstable shapes and may therefore be more expensive to develop than caverns in the more massive salts of salt domes
• Experience elsewhere has shown that the weakest point in the salt deposit are the salt/shale layer interfaces and these interfaces are where fractures may initiate and then propagate, generally in a horizontal plane (KDHE, 1997). This may become an issue if rock mechanical tests are not undertaken on such interfaces to deteremine strengths and failure pressures and/or cavern pressures are not monitored and kept below the fracture strength of the two rocks and their interface (see the account of the Hutchinson incident in Appendix 5).
In the UK, halite beds include interbedded non-halite beds (mudstones, dolomite and anhydrite beds – section 5.3.1), which are generally thin and distributed vertically throughout the salt body, such that halite forms 90-95% of the evaporite sequence, as seen at Byley and Preesall (e.g. Beutal, 2002; Evans et al., 2005). At Byley, the experience of Ineos Chlor (formerly ICI) is that the solution mining of halite sequences with marls over a metre in thickness presents no operational or safety problems, as the insoluble marls become soft, crumble and fall down to the base of the cavern during solution mining (Beutal, 2002).
2.2.7.3.5 Summary and examples of proposed UK cavern design and operational ranges
To summarise, therefore, during the design of a salt cavern gas storage facility a number of fundamental in situ and laboratory tests are required to ascertain the suitability of the halite beds and determine the size, shape and spacing of caverns. These include:
• Core study and testing to determine the purity of the salt and nature of interbed material
• Core testing to determine strength and creep of the salt and determine the essential material parameters for rock mechanical calculations
• Distance both horizontally and vertically to the nearest fault
• Distance both horizontally and vertically to the nearest non salt formation and establishing its nature
• Numerical modelling and simulation based upon the rock mechanical data
Numerical modelling based upon carefully acquired field and laboratory data on the rock mechanics, depth and thickness of salt is undertaken to design cavern shapes and spacing. The numerical simulation covers the anticipated loading history during cavern operation that includes the effects of cyclical pressurisation and extended periods at maximum pressure (to prove gas tightness of the cavern).
27

From these simulations and measured rock properties recommendations on the following are given regarding the design of a gas storage cavern in any particular area:
• minimum thickness of the salt layer above the roof
• depth of the cavern
• geometrical shape – has to be consistent, as irregular shapes could lead to areas ofdiffering stress causing spalling (microfracturing) or breakouts of the cavern walls
• minimum and maximum operating pressures to maintain cavern stability and minimise closure due to salt creep – including the allowable time period during which the cavern can be operated at the minimum pressure
• minimum pillar dimensions with respect to adjacent caverns or to the boundary of the salt rock formation or faults and pillar stability
• Loss of volume due to cavern wall convergence during operation
As examples of cavern design and specifications for proposed UK developments, information presented during the Public Inquiries into the proposals to develop salt cavern storage facilities at Byley, Cheshire (2002) and Preesall, Lancashire (2005) is summarised below:
(a) Byley caverns at depths of circa 630 m were (Crotogino, 2002):
• Maximum cavern radius = circa 45 m (90 m diameter)
• Maximum cavern height = circa 100 m
• Thickness of remaining salt above cavern = 170 m
• Distance between deepest point of cavern and underlying formation = >10 m
• Spacing between wellheads – 280 m
• Between adjacent caverns, pillar width/distance = 196 m (minimum)
• Minimum cavern pressure – 38 bar (35 bar is minimum operating pressure for rock mechanical design of cavern)
• Maximum cavern pressure – 105 bar (rock mechanical design), 110 bar is design basis for maximum operating pressure of surface equipment
(b) Preesall caverns with tops at depths of between 220 and 425 m were (Rokahr, 2005):
• Maximum cavern radius = circa 50 m (100 m diameter)
• Thickness of remaining salt above cavern = > max radius of the cavern = > 50 m
• Distance between deepest point of cavern and underlying formation = minimum of 20% of max radius of cavern
• Spacing between wellheads – not specified, wellheads will form the base for a series of directionally drilled wells to different cavern locations
• Between adjacent caverns, minimum pillar width = 3 times maximum cavern radius. At substantially greater depths (> 800m) this would be 5 times the maximum cavern radius
• Distance of cavern from significant nearby fault(s) = 3 times maximum cavern radius.
• Minimum cavern pressure – to be above 30% of the vertical component of overburden pressure
• Maximum cavern pressure – to be below 83% of the vertical component of overburden pressure
28

2.2.7.4 COMMISSIONING OF CAVERNS – PRESSURE TESTING
Tightness is a fundamental prerequisite for many underground works where minimum product leakage is required (Bérest & Brouard, 2003). This is both for safety, environmental (groundwater pollution etc.) and economic reasons – the latter can depend on the speed of stored product rotation, but the first two require greater consideration. Therefore, once the caverns are ‘brined’ out to their desired size and shape and before they can be commissioned for underground storage, a Mechanical Integrity Test (MIT) is used to test cavern (and well) tightness. The first stage involves pressure testing of the wells and the cements/casings to verify there is no leakage behind the casing. A sonar survey is also generally performed.
After the pressure testing of the well is complete, the MIT is performed pressuring the cavern up to operational pressures, shutting in and monitoring the pressure changes over a specified period. The pressuring up may be done cyclically in some tests. Two main types of MIT are currently used (Bérest et al., 2001):
• The Nitrogen Leak Test (NLT) – consists of lowering a nitrogen column in the annular space below the last cemented casing. The NLT is generally used for full size cavern testing. The central string is filled with brine and a logging tool is used to measure the brine/nitrogen interface level. Two or three measurements, separated by a specified period of time (usually 24 hours), are usually performed. The levels of the nitrogen are then compared. An upward movement of the interface is indicative of a nitrogen leak. Pressures are measured at ground level and temperature logs are performed to allow precise calculation of nitrogen seepage
• The Fuel Oil Leak Test (FLT) – a more popular test in Europe than in America and generally used before the cavern is leached out, testing the wellbore tightness. The FLT consists of lowering a fuel oil (instead of Nitrogen as above) column in the annular space. During the test, the evolution of the brine and fuel oil pressures at the wellhead is continuously monitored. Severe pressure-drop rates are indicative of poor tightness. Following the test, the fuel oil is withdrawn and weighed permitting comparison with the weight of the injected fuel oil volume.
Care must be exercised when performing a tightness test however: at the beginning, cavern pressure is built up rapidly and short-term transient creep (refer section 2.2.7.3.2.1) must be taken into account. If neglected, it can lead to serious misinterpretation of the test results (Hugout, 1988; Bérest et al. 2001; Bérest & Brouard, 2003). Transient creep and the duration of each pressure step must be taken into account when natural gas caverns are operated at varying pressures. Additionally, rock damage and coupled hydromechanical behaviour must be considered both when the cavity pressure is very low (Cosenza & Ghoreychi, 1996; Pfeifle et al., 1998; Pfeifle & Hurtado, 2000) or close to geostatic pressure – particularly important on cavern abandonment (Bérest & Brouard, 2003). Much is written on the tightness testing of storage wells and caverns and the reader is referred to Bérest et al. (2001) and Bérest & Brouard (2003) for further discussion on and comparison of the uses of both the NLT and FLT tests.
2.2.7.5 THE STORED PRODUCTS AND CAVERN OPERATION
Mention should be made of how the materials (liquids, liquefied hydrocarbons [LPG, ethylene and propylene], natural gas and compressed air) are stored and retrieved, the pressure distributions that exist in the caverns and the consequences of well failure. A fuller account is given in Bérest and Brouard (2003).
The stored product is retrieved in a variety of ways from cavern storage, depending on the product. If the products are liquid (crude oil, LPG etc), then the cavern is generally operated in what is termed ‘brine-compensated mode’. This involves injection/withdrawal of an equal volume of brine as product is removed/replaced and requires that large holding tanks or ponds of brine are available during periods when the caverns are full. The products are held under
29

pressure by the weight of brine in the tube, which has a higher density than that of oil or LPG. Oil or LPG in the annular space (between the tubing and well casing) is thus under pressure. Failure of the wellhead valve would result in the sudden release of the pressurised product held in the annular space. In the case of oil this would not be as great as LPG, which would, on the release of the pressure, move up and spill out, evaporating rapidly to form a dense low lying cloud.
It is noted that the Isle of Portland gas storage scheme would appear to be proposing operation of caverns in brine compensated mode (Egdon, 2007a). On a purely cautionary note, brine compensated operation requires careful monitoring of the brine injected. This is because the process can lead to further leaching of the cavern that has occurred unnoticed and has led to problems at some facilities (section 9.3 and Appendix 5).
Natural gas caverns may be operated in this way, but they generally rely upon the pressure of the stored gas for ‘lift’ during withdrawal phases. During the storage of natural gas, pressure builds up as the gas is injected and falls as it is withdrawn. If casing or wellhead failure occurs, then left unchecked, virtually the entire working gas volume of the (full) cavern would be expelled. The time frame for this release is dependent upon the initial gas pressure and the leakage rate. Sudden failure of the wellhead could result in rapid and catastrophic depressurisation of the cavern and release of gas. A consequence of this would be severe stressing of the cavern walls, leading to collapse in some cases. These wellhead risks are normally addressed in modern design by inclusion of fail-safe valves below the wellhead.
2.2.7.6 ASYMPTOTIC PRESSURIZATION OF A CAVERN – POST ABANDONMENT
Asymptotic pressurization of a cavern relates more to when storage operations have ceased and the cavern has been abandoned following operations (e.g. Dusseault et al., 2001). The gradual closure of large caverns due to creep of the salt can lead to substantial flexure and high strains in the overburden strata, which in turn can substantially increase their permeability. Filling the cavern to a pressure just below that of lithostatic pressure before the cavern is sealed and abandoned is a means of restricting excessive strains, perhaps indefinitely. This requires that the cavern and access well(s) do not leak, which is not always the case and should this occur, brings with it problems that require previous planning (see section 2.2.7.6.1). Thus post-gas storage cavern decommissioning/abandonment/mitigation planning strategies are worthy of note at this stage.
Five possible reasons for long-term pressure changes in a cavern exist and require modelling/consideration (Bérest et al., 2000):
a) Salt creep. This may be the dominant process, however, analysis of creep effects alone shows that cavern pressure approaches that of the lithostatic only asymptotically if creep is the only process (i.e. no leakage). Over pressuring and possible hydraulic fracturing as a result is a possibility, but is thought unlikely.
b) Thermal expansion of the cavern fluid. The slow heating of brine in a salt cavern could have a much more important effect on the increase in cavern pressure than creep itself.
c) Transport of the fluid out of the cavern into surrounding porous strata via porous nonsalt interbeds. This is likely to have been researched during studies of gas tightness for the operational phase.
d) Leakage along the well path is a very real process as identified elsewhere in this report. Bérest et al. (2000) point out that, as pressures asymptotically approach lithostatic, local pressure gradients may become quite large.
e) Additional dissolution and precipitation of the salt in the cavern (e.g., driven by temperature differences [thermal gradients] and slow convective currents in a cavern). In a brine-filled cavern of great vertical extent (e.g. up to 600 m high in the American Strategic Petroleum Reserve in
30

domal salts), slow downward growth can take place because salt solubility is fractionally higher at the base; the thermal gradients generate slow convection currents causing salt deposition at the top of the cavern. However, the effects and potential problems might be less in a bedded salt deposit where the brine is saturated and the vertical cavern extent is perhaps only 50-100 m, with only a very small temperature difference likely across the cavern height (Dusseault et al., 2001).
2.2.7.6.1 High pressure brine release, Preesall Brinefield, Fylde, Lancashire
The following incident is of note in the fact it appears to represent a documented case of salt flowage and asymptotic pressure development in an abandoned former ICI brine cavern. On abandonment of the cavern, brine was injected immediately prior to sealing in order to maintain cavern pressure and aid stability. The brine well and cavern was later the site of a (high-pressure) release of brine (Fig. 5a).
The incident occurred in 1994 and relates to a brine gusher at ICI brine well BW 124, drilled in 1985. A local resident first observed the gusher as he turned onto Highgate Lane from Staynall Lane crossroads, approximately 1.75 kms from BW 124. From there, the top of the plume of brine could be seen over the intervening hill and on closer approach, the ‘noise was deafening’. The eyewitness account continues ‘the drift from the plume of brine reached as far as Corcas Farm, about 650 m away, in the direction of Preesall, the salt was visible on the grass days after, trees were white with it’ (Jackson, 2005).
Clearly, although it is assumed that no existing brine caverns or associated pipes and well heads would be used in developing a new UGS facility in caverns, the image shows a potential problem posed by the existing brine pipework and caverns. Whilst the well was drilled in 1985, the date of cavern abandonment and well capping is not clear. However, brine extraction operations in the saltfield ceased in 1993 because of the closure of the chlorine plant at Hillhouse in Thornton Cleveleys (Evans et al., 2005; BGS, 2006a). It therefore illustrates the extent of pressure build up in the cavern in the interval to 1994 when the pressure was released by the expulsion of the brine that was left in to stabilize the cavern.
2.2.8 Other underground fuel storage scenarios
UFS is possible in a number of other geological settings, but as will be seen in later sections of the report, has in some cases been associated with problems of containment of the stored product, due to the fact that host or cap rocks (at e.g. abandoned mine facilities) have not proved gas tight. The types of facility include a number of abandoned room and pillar mines.
2.2.8.1 ABANDONED/RECONDITIONED COALMINES
Abandoned/reconditioned coalmines offer the potential for the development of natural gas or compressed air storage facilities. They are, however, rare with the Leyden coalmines, located in Jefferson County, Denver, Colorado (Fig. 4f) and abandoned coalmines in the Anderlues and Péronnes mines in the Hainaut coalfield of southern Belgium (Piessons & Dusar, 2003), being examples of such sites. The Beringen mine in the northern Campine coal basin, northern Belgium is also being investigated for the storage of CO2 (Piessons & Dusar, 2003; Shi & Durucan, 2005). Leakage from such facilities is reported (refer Appendix 5).
2.2.8.2 ABANDONED SALT MINES
Abandoned salt mines have been used quite widely to store fuel products, particularly LPG in America (e.g. Weeks Island, Louisiana), but have included the Burggraf Bensdorf mine in the former DDR in 1970 (Plaat, in press). They are based upon the same principals as abandoned coalmine storage, but are, however, generally at shallow depths and have encountered problems
31

in retaining the product, being associated with leaks and the escape of stored product (refer Appendix 5).
2.2.8.3 ABANDONED LIMESTONE MINES
Abandoned limestone mines have been converted for gas storage purposes, with the first thought to have been near Lawrenceburg, Indiana, in 1952 (Plaat, in press). Related to gas storage, in 2001, Ohio Power Siting Board approved an application by Norton Energy Storage to develop a Compressed Air Energy Storage (CAES) plant in an old limestone mine 670 m below ground at Norton, about 56 km (35 miles) south of Cleveland, Ohio (Norton Energy, 2001; Sandia, 2001; section 2.2.10.2.3).
A recent proposal has been to create caverns for gas storage in limestone formations through dissolution by acid in a similar way in which salt caverns are created using solution mining techniques (Castle et al., 2004; Plaat, in press). The process is still at the research stage with many factors that require further investigation. These include the issues of gas tightness of the caverns, cavern stability and the disposal of large amounts of CO2 that will be generated by the dissolution of the limestone. Whilst unlikely to be of immediate interest to developers in the UK, it could potetntially have applications in e.g. the Chalk in which mined caverns are already in operation to store LPG (section 2.2.8.4.3).
2.2.8.4 ROCK CAVITIES OTHER THAN SALT AND PREVIOUS MINE OPERATIONS
Although many specifically mined LPG (or other hydrocarbons) cavern storage facilities exist in for example the USA, Scandinavia and France, the technology has rarely been used in the UK outside of salt caverns in Cheshire and Teesside noted above. Facitities are not, however, unknown with the Killingholme LPG storage facility, constructed in chalk in North Lincolnshire believed to represent the first and still the only mined void LPG storage facility outside the salt beds in the UK (Trotter et al., 1985; section 2.2.8.4.3).
Although there is a lack of such facilities in the UK, the technology has been deployed and could be revisited and thus requires brief summary here. Rock cavities specifically engineered for gas storage may be of two types and are briefly described below.
2.2.8.4.1 Lined rock cavities (LRC)
Lined rock cavities (LRC) provide modest storage capacities in countries where crystalline and metamorphic strata form the majority of rocks at outcrop. LRC’s are generally large voids excavated out of the country rock with steel plate linings constructed inside the void to ensure gas tightness. This steel ‘vessel’ is then cemented in place, with the cement providing a further barrier to gas migration and also infilling the gap between the steel vessel and the rock walls to provide stability and protect the steel plate from damage against the host rock. LRC’s thus represent an expensive option but in countries lacking deep sedimentary basins with suitable reservoir and caprock sequences, may offer the only option as an economical means of meeting peak demand.
Examples of LRC facilities and investigations include demonstration plants built at Grängesberg (1988) and at Skallen (construction and evaluation 1999-2002) in Sweden (Vasquez & Tengborg, 2001). In 2004, construction commenced of a further complex of 4 LRC’s in Sweden, commenced in granite at a depth of 100 to 200 m, each with a volume of 40,000 m3 and lined with steel plating (Plaat, in press).
2.2.8.4.2 Unlined rock cavities
Unlined rock caverns have been used for decades to store a wide range of low vapour pressure products, mostly liquids such as crude oil, butane, and propane and it is this type of storage
32

facility represented at the Killingholme site (section 2.2.8.4.3). The storage technique was first tested in Texas in 1950 with the construction of an LPG storage facility in a shale formation (Lindblom, 1989). The first such storage facility in Europe was completed in France in 1966 and was followed two years later by the first operational LPG facility in Sweden (near Gothenburg). Since then and into the mid 1990s, around 70 mined LPG storage facilities were commissioned in the USA, with around 20 in Europe, mostly in Scandinavia (Lindblom, 1989a&b; Liang & Lindblom, 1994). The usual stored product is LPG, with few operational unlined cavern facilities storing natural gas. However, an air cushion surge chamber facility in Norway has provided important data on high-pressure storage in unlined rock caverns. The latter facility operated at 7.7 MPa (1117 psi) and all chambers operated satisfactorily and with only minor ‘gas’ loss (Liang & Lindblom, 1994). The principles of this method should also assist understanding of the storage of gas in other underground storage facilities and the important relationship of hydrostatic water pressures to gas containment and movement away from any injection site and within the rock unit(s).
The most widely used technique for the containment of LPG and natural gas in unlined caverns involves the excavation and construction of a storage cavern at a suitable depth below the groundwater table. Product confinement within the storage cavern is then achieved through groundwater control, either by normal hydrostatic pressure, or what is termed a water curtain (Fig. 7). The concept is to have water continuously flowing toward the cavern from outside and in all directions. The storage facility operates on the principle that hydrostatic water pressures are higher around the cavern(s) than in the cavern. Such storage facilities therefore require that the surrounding rock mass remains saturated with groundwater and the caverns generally have circled-arched (vaulted) roofs and vertical walls, which are reinforced by rock bolts.
Therefore, the cavern must be sited deep enough to ensure that the hydraulic pressure in the pores and fractures of the rock around the cavern is always higher than the vapour pressure of the product stored in the cavern. In this way, the static head (or hydrostatic pressure) of the ground water is greater than the pressure exerted by the stored product. This ensures that the liquid (LPG) or gas is contained in the caverns and prevents outward migration of the stored product out of the cavern and into the rock volume and also allows for groundwater seepage into the cavern (e.g. Åberg, 1977, 1989; Goodall, 1986; Goodall et al., 1988; Liang & Lindblom, 1995; Yamamoto & Pruess, 2004).
A water curtain represents an effective way of increasing hydrostatic pressure and preventing gas leakage from underground storage facilities. It consists of an array of boreholes, drilled over the storage cavern, which are then used to inject water to the surrounding rock and maintain a controlled water pressure (Liang & Lindblom, 1995; Yamamoto & Pruess, 2004). There may be roof water curtains or roof and wall water curtains, the latter contributing to maintaining lateral pressures. Important considerations are the proposed depths of caverns (not only to develop sufficient hydrostatic pressure for containment of high pressure LPG but also to ensure that hydraulic fracturing due to any high pressure water curtain does not occur), cavern size, cavern spacing and water curtain layout. All can have dramatic effects on the maximum storage pressures and thus gas storage capacities of facilities (see Liang & Lindblom, 1994). The cavern bottom is usually saturated with water (a so called water bed) as shown in Figure 7. Further background to and discussion of unlined rock cavity storage can be found in Appendix 8. Examples are also described where fault zones and leakage pathways exist and have been sealed to provide tightness.
2.2.8.4.3 UK Mined (Unlined) Cavern Storage – Killingholme, North Lincolnshire
As noted above, propane and butane LPG are stored in operational underground storage facilities utilising mined and unlined cavities in the Chalk at South Killingholme on the River Humber, North Lincolnshire. The storage facility, some 3 km north of Immingham (Fig. 8: Trotter et al., 1985; Geol Soc., 1985, was opened in 1985 and is jointly operated by ConocoPhillips and Calor
33
Gas Ltd. The facility comprises two large underground ‘caverns’ both having been designed to ensure that peak winter demand for LPG can be met (ConocoPhillips, 2004). Development of the scheme required close co-operation with the Health and Safety Executive and the local (Anglian) Water Authority in whose aquifer the storage caverns are constructed. The scheme was seen to represent the safest method for storage of large volumes of LPG, on two accounts: firstly the stored product is ‘safely out of the way, deep underground’ and secondly ‘the final surface area occupied is very small and compact’ (Trotter et al., 1985).
The caverns are 180-190 m below ground level near the base of the Upper Cretaceous chalk and comprise a series of nine storage galleries, each of which is 10 m wide and 10 m high, with a cross-section of 85 m2. They are constructed in the lower part of the Welton chalk with the sumps extending down into the top of the Ferriby chalk (Fig. 8). The design and their position within the local stratigraphic succession is illustrated in the sketch section through the site (Fig. 8). Access to the caverns was by two 2 m diameter drilled shafts, and the total excavation in each of the two facilities is 120,000 m3, each capable of storing up to 60,000 tonnes of LPG (ConocoPhillips, 2004). The galleries were excavated in two stages: first a top heading was excavated partly by road header and partly by blasting followed by a bench excavated by blasting.
The chalk was deposited in what is known as the ‘Northern Province’ and relative to the Chalk of southern England (commonly referred to as having been deposited in the ‘Southern Province’) has three to four times the strength (Geol Soc., 1985). At cavern level the chalk is massive and undisturbed and dips at 1-2° to the northeast. Sub-vertical joints in the chalk, with a maximum displacement of about 300 mm, are present at a spacing of several metres. The galleries require no rock support, except on a minor scale at gallery intersections. Convergence has been less than 5 mm on the 10 m gallery cross section.
The principle rock characteristics of the Welton chalk are: rock density of 2.2 to 2.3 T/m3; an unconfined compressive strength of 30-60 MPa; permeability ranging from more that 200 milli-Darcys (mD) in upper parts of the Burnham chalk to less than 10 mD at cavern level (Geol Soc., 1985).
The principle of containment of LPG in the unlined Chalk caverns requires the groundwater pressure in the chalk surrounding the cavern to exceed (by a safety margin) the maximum vapour pressure of propane - some 12 bars (or 1,200 kN/m2). At Killingholme, the depth of the caverns is almost twice that required to balance the pressure of propane (ConocoPhillips, 2004). The successful operation and maintenance of pressure requires an adequate supply of water from aquifers above and below the cavern to prevent desaturation of the chalk by seepage into the cavern and ensure a seepage rate into the cavern sufficient to guarantee containment. Artificial recharge from a water gallery above the cavern is not necessary. The seepage rate is calculated to be less than 1 m3/h (Geol Soc., 1985).
2.2.9 LNG storage – potential future developments
Liquefied Natural Gas (LNG) is natural gas in its liquid form cooled to about minus 259 °F (-162 °C). It is generally handled at slightly above atmospheric pressure, requiring the very low temperature. Natural gas is primarily methane, with low concentrations of other hydrocarbons (ethane, propane and other liquefied petroleum gases).
Salt caverns have been used to store Liquefied Petroleum Gas (LPG) for a long time and many attempts have been made to store LNG in underground storage facilities, often involving buried tanks, but with very limited success (Favrez, 2003). Numerous failures have occurred due to thermal stresses generating cracks in the host rock/soils leading to gas leaks and to unacceptably high heat flux rates between the LNG and the ground. These facilities have been decommissioned due to their excessive boil-off rate.
34

However, new R&D programs are underway in order to solve previous problems, with a pilot testing plant under construction at Daejong in South Korea during the early 2000s (Favrez, 2003). The concept of this facility is very similar to Lined Rock Cavern (LRC) UGS, but it will contain LNG. Containment of LNG will be based upon the LNG freezing the surrounding rock, forming an impervious ring of ice to a distance that will ensure LNG containment and absorb the hydrostatic loads whilst providing protection of the rock against thermal shock. Initially water is pumped out of the cavern area to assist in the freezing process and prevent hydrostatic pressure acting against the containment system. LNG in these types of storage will be injected and withdrawn using pipes.
One pilot study (founded by US Department of Energy and private companies) is to develop the concept of salt caverns used as off-loading tanks in LNG re-gasification plants (often referred to as the “Bishop Process”). Initially conceived to receive and offload LNG tankers offshore, the underground part is the classical salt cavern, with the main new development being in the re-gasification process. Using seawater as the heat source, LNG will be vapourised (regassified) at high rates to inject into underground storage. The principle consists of a pipe-in-pipe heat exchanger, which has to deal with the ranges of temperature involved (from -160°C to 20/30°C).
2.2.10 Examples of storage of different types of energy in salt caverns and other geological
environments
As alluded to above, salt cavern storage can potentially play a significant role in the underground storage of natural gas, liquid hydrocarbons and hydrogen. Storage in other geological settings also plays a role, which might be expected to increase with time. Other forms of energy storage are under consideration, for example compressed air storage.
The following sections briefly review underground energy storage scenarios with regard to potential in the UK in particular and are illustrated by examples of operational facilities from around the world and where possible the UK.
2.2.10.1 HYDROGEN AND NITROGEN STORAGE
Hydrogen is a gas at ambient temperatures and pressures, but it can be stored as a gas, a liquid or a solid. In the case of hydrogen, underground (geological) storage provides the greatest volumes and is considered in this report. Solid storage, whereby hydrogen exists as a chemical compound is not considered here.
Compressed gaseous hydrogen represents a mature technology, whereby stationary storage above ground is common, being best suited for frequent turnover. However, underground geological storage provides greater volumes and potentially represents the cheapest option for longer-term storage.
At least two former ICI salt brine cavities are used by BOC Nitrogen for the storage of nitrogen at Wilton in Teesside (refer Table 1). The caverns are in Permian salts at a depth of approximately 650 m.
2.2.10.1.1 Tees Valley Hydrogen Project and renewable energies
The Tees Valley Hydrogen Project near Middlesborough in the north east of England was established to assist in bringing new energy technologies from development to operation within an urban environment. The project capitalises on some of the assets created over the years in the area by, in the main by ICI. To this extent, a 30 km hydrogen distribution system incorporates an underground hydrogen storage facility utilising up to three former ICI salt brine caverns in bedded Permian salt deposits. For over 25 years, the caverns have been used to store up to 1,000 tonnes of hydrogen for industrial use (Padró & Putsche, 1999; BGS, 2006a; Beutal and Black, 2005).
35

2.2.10.2 COMPRESSED AIR ENERGY STORAGE (CAES)
The technological concept of CAES is more than 30 years old (e.g. Glendenning, 1981), with the first CAES facility commissioned in Germany in 1978, using caverns created in the Huntorf salt dome near Hamburg for storage (Glendenning, 1981; Thoms and Gehle, 2000). Hydroelectric power plants have, for many years, been used to store excess off peak (night-time and weekends) power and provide increased peak time output. CAES facilities likewise provide the potential to store energy and could be used alongside, for example, wind turbines. Though instances of this technology are not numerous, it is likely that compressed air energy storage will assume a greater importance as energy markets change with time. There are proposals that if widespread renewable energy is to become reality, then the utility industry might have to consider more options of energy storage including compressed air (Schaber et al., 2004). This might be facilitated by distributed generation and microgrids in which small CAES plants play an important role storing energy close to the source.
The basic concept is that during the storage phase, electrical energy (from e.g. wind energy or excess output of power plants) is used to compress air, which is stored under pressure (typically around 75 bar) in an airtight underground storage cavern (salt or rock caverns or LRC’s). However, storage can also be in porous rocks (aquifers or depleted oil/gasfields). Storage volumes required to make CAES plants economic are large hence above ground facilities are not practicable due to prohibitive costs. When required, the compressed air stored is fed either into an expansion turbine, or mixed with gas, generating power through a generator.
The main disadvantage of CAES is the identification and location of suitable geological structures or sequences close to the generation site. Technical issues surround the heat generated during compression of air, but these are lessening.
Research into CAES is ongoing around the world, with plans to construct a number of CAES plants that will utilise aquifers and former mines. Italy has operated a small 25 MW CAES research facility based on aquifer storage, whilst Israel has conducted research into building a 3x100 MW CAES facility using hard rock aquifers (Cheung et al., 2003).
The following sections outline briefly the existing or planned facilities.
2.2.10.2.1 Huntorf, Germany
The Huntorf plant, situated in north Germany, was developed in 1978 as the world’s first CAES plant, using two 150 m high salt caverns (referred to as NK1 and NK2). The caverns are constructed in the Huntorf salt dome at depths between 650 m and 800m (Crotogino et al., 2001; Cheung et al., 2003). Their maximum diameters are 60 m, with the wells spaced at 220 m. The depths permit operating pressures between 43 and 70 bar (4.3 and 7 MPa/624 and 1015 psi), although in exceptional circumstances, minimum operational of 20 bar (2 MPa/290 psi) are possible.
The Huntorf plant has run reliably on a daily cycle for over 27 years, having now completed well over 7000 starts that involve charging over an eight-hour period, then delivering 300 megawatts for 2 hours of discharge (Crotogino et al., 2001; Cheung et al., 2003).
2.2.10.2.2 McIntosh, Alabama, USA
The McIntosh facility is the first CAES plant in the USA and is constructed in the McIntosh salt dome, Alabama (Leith, 2001). Alabama Electric Cooperative's (AEC's) generating units at McIntosh, Alabama, include the compressed air energy storage (CAES) unit and twin gas-fired combustion turbines.
The CAES unit (designated McIntosh unit 1), was declared commercial on May 31st 1991 and officially fully operational on September 27th 1991. In the generation process, the 100-megawatt CAES unit uses air compressed and stored in a 0.57 Mcm (20,000,000 ft3) underground cavern.
36
When the compressed air is needed for generation, it is mixed with natural gas in a conventional gas turbine combustion process to generate electricity. The plant uses off-peak electricity to pump air into the cavern and then uses the stored air in the generation process during peak periods. One full charge from the 110 MW CAES plant provides enough electricity to supply the demands of 11,000 homes for 26 hours (http://www.caes.net/mcintosh.html).
In June 1998, contractors completed work on two single-cycle combustion turbines at the McIntosh site. The units have a generation capacity of 226 megawatts, and are designed as McIntosh units 2 and 3. While these units are not CAES units, they have increased the total power generation capacity of the McIntosh facility to over 326 megawatts.
The top of the 275 m high solution-mined salt cavern is at 457 m (1,500 ft) below ground level, with the bottom of cavern at 732 m (2,400 ft). The cavern is circa 76 m in diameter and provides approximately 315,000 m3 (19 million ft3) air storage (Leith, 2001). At full charge, air pressure is 76 bar (7.6 MPa/1,100 psi), whilst at full discharge, cavern air pressure is 45 bar (4.5 MPa/653 psi).
2.2.10.2.3 Norton, Ohio
In 2001, Ohio Power Siting Board approved the Norton Energy Storage (a subsidiary of CAES Development Company [CDC], a Houston based energy company) application for a certificate of environmental compatibility and public need to develop a CAES plant in an old limestone mine 670 m below ground (http://www.caes.net/nortpres.html). This development is located on a brownfield site within the city limits of Norton, about 35 miles south of Cleveland, Ohio.
Commercial operation was estimated to begin in 2003 and to be fully operational by 2008. The development plan involves the installation of nine 300 MW Alstom ET11NM turbines, capable of ultimately producing 2,700 MW of electricity, serving over 675,000 homes. When fully operational, it is claimed that the plant will only produce the same amount of emissions as a 600-megawatt gas-powered combustion turbine power plant.
The facility will compress air using off-peak electricity and store it in an underground limestone mine (Fig. 9). The mine was originally operated by the Pittsburgh Plate Glass Company between 1943 and 1976, producing the synthetic soda ash used in the manufacture of glass. The mine covers an area about 2130 m by 1220 m (7,000 ft by 4,000 ft, or 643 acres) and is built in a room and pillar mine configuration - rooms separated by pillars, leaving 9.6 Mcm (338 million cubic feet) of space. Although well below the water table, the mine is said to be virtually dry.
In situ and laboratory tests determined the permeability and integrity of the limestone and overlying shales and their capability to withstand pressure cycling. The limestone is a dense rock with few fractures, tests revealing it is capable of withstanding the planned operating pressure range of 55-110 bar (5.5 to 11 MPa, or 797 to 1,600 psi). Flow analyses and modelling indicated that pressurized air will move less than 30 m away from the mine in 50 years and will have no effect on the air compression and decompression cycling.
Construction will include two large concrete plugs closing off the two entrances of the mine, with layers of clay and tar within the concrete preventing leakage. Two boreholes, roughly 0.6 m in diameter, will be drilled, acting as valves for injecting and bleeding out the air.
2.2.10.2.4 Iowa stored energy plant
In 2003, it was planned to build the Iowa stored energy plant, which would be the first plant to use wind energy, as well as off-peak electricity to compress the air and store it in an underground aquifer (Haug, 2005). When generation is needed, the compressed air would be released to drive natural gas-fired combustion turbines. The proposal included building a wind farm, using 1.5-MW wind turbines.
37

Located near Fort Dodge, Iowa close to the electric transmission grid and a gas pipeline, the aquifer is Palaeozoic in age, which, during the 1960s was originally developed by Northern Natural Gas for natural gas storage. Part of the new facility could still be used to store natural gas indicating that the aquifer remains stable and with an effective seal. However, following further investigations, the geology may not be as favourable as was originally thought (Holst, 2005).
2.2.10.2.5 Markham, Texas
This is a planned salt cavern CAES storage plant being developed jointly by Ridge Energy Storage and El Paso Energy near Markham in Matagorda County, Texas (DTI, 2004; van der Linden, 2006). The projected start up date for the facility was 2005 and its configuration will provide a capacity of 540 MW (4 x 135 MW) of compressed air energy, which can be delivered in less than 15 minutes.
38
3 Hydrocarbon seeps in petroleum-bearing basins
This chapter outlines the timing of oil and gas generation in some of the UK’s oil and gasfields, indicating the length of time some of the oilfields have been stable and retained commercial hydrocarbon accumulations. The occurrence of hydrocarbon seeps in petroleum bearing basins is also outlined, drawing attention to the fact there are examples of both historical and active seeps onshore in the UK.
3.1 INTRODUCTION
The many commercial oil and gas accumulations worldwide attest to the sealing capabilities of caprock strata over periods of geological time (millions of years). The seal is generally provided by rocks with fine grain size that provide very small pore spaces, with poor connectivity (permability). The result is a rock with high entry and capillary pressures that only very slowly and under increased pressures, permit diffusion of hydrocarbons through the rock. Hydrocarbon accumulations have in some cases been trapped for hundreds of millions of years. This is true in the UK, with some of the oil in the East Midlands oilfields having been generated from late Dinantian and Namurian age source rocks buried to between 1900 and 3600 m by late Namurian times (c. 320 Ma). The oil and gas would have migrated into Westphalian reservoir rocks within both stratigraphic traps and ultimately structural traps formed during the late Carboniferous to Early Permian Variscan Orogeny (c. 310 to c. 280 Ma). Some of the earlier formed accumulations would have been disturbed by Variscan earth movements with oil and gas having leaked migrated away, perhaps to the contemporaneous land surface. Others probably remained intact. A second (Mesozoic) phase of oil and gas generation ensued from end Triassic times to the end of late Cretaceous chalk deposition (c. 65 Ma), when the structural traps formed during the Variscan movements were variously charged with hydrocarbons. This continued until strong uplift and erosion resulting from Alpine movements in Cainozoic times ‘froze’ the hydrocarbon generation (Fraser & Gawthorpe, 2003). During this time easterly tilting led to a second phase of trap disturbance and some remigration of oil and gas (Fraser & Gawthorpe, 2003; Hodge, 2003).
In the oil and gasfields of the Wessex-Weald basins of southern England, the source rocks are in the main younger Liassic clays (Lower Jurassic), although potential younger Jurassic source rocks exist and which may also have entered the oil generation window (e.g. Ebukanson & Kinghorn, 1985, 1986a&b; Penn et al., 1987). Burial history calculations suggest that oil generation from Lias source rocks would have begun during deposition of latest Jurassic and Lower Cretaceous sediments (from c. 142 Ma) and for Oxford Clay in the deepest basins from mid Cretaceous times (Penn et al., 1987). Oil generation probably peaked in late Cretaceous (65-70 Ma) to early Cainozoic (late Palaeocene; c. 55 Ma) times (Underhill & Stoneley, 1998). The oil migrated into tilted fault block traps formed during the active extensional phase of Meosozoic basin development, well before the major mid-late Cainozoic (‘mid-Tertiary’ - Miocene; c. 24 Ma) basin inversion events (Penn et al., 1987; Underhill & Stoneley, 1998). The basin inversion phase led to many of the early fault block traps being disturbed and a number of accumulations are thought to have been breached and hydrocarbons lost (Penn et al., 1987; Underhill & Stoneley, 1998). Some hydrocarbons may have remigrated into adjacent trapping structures, others may have migrated to surface and been lost. Clearly a number of oilfields survived in the area
It is perhaps noteworthy that early exploration was directed at obvious surface inversion anticlines and apart from the producing Kimmeridge Oilfield (Brunstrom, 1963; Evans et al., 2003), few hydrocarbon shows were encountered. These structures are now considered to be of low prospectivity by virtue of their structural style. The cores of the inversion structures are cut
39

through by faults with reverse movement (which commonly penetrate to the surface) and also at shallower levels by sets of extensional joints and fractures (Bevan, 1985; Penn et al., 1987).
Prospectiviey of these structures is affected in a two ways:
• Hydrocarbons can (or could) escape up the fracture systems
• Meteoric water can invade from the surface, flushing the structures and degrading any petroleum accumulations
The Kimmeridge Oilfield may be the result of the Cornbrash reservoir being overlain by the Oxford Clay and a thick sequence of soft, plastic Kimmeridge Clay cropping out in the core of the periclinal closure. The clays effectively seal the producing fracture systems and preserve the hydrocarbon accumulation intact (Penn et al., 1987; Evans et al., 2003).
However, it has been argued that no reservoir cap rock or trap has ever been shown to be a perfect seal to hydrocarbon migration over extended periods of geological time (Nelson & Simmons, 1995). Studies have shown that migration of hydrocarbons out of the trap into overlying sequences (and sometimes to the surface), is more common than might generally be thought or presumed (Nelson & Simmons, 1995; Khilyuk et al., 2000; Nelson et al., 2005; Clarke & Cleverly, 1991; Cowley & O’Brien, 2000), with petroleum leakage to the surface presently occurring in at least 126 of the 370 petroleum-bearing basins worldwide (Clarke & Cleverly, 1991). It is, however, relatively rare for seeps to overlie major fields (Macgregor, 1993).
Natural pathways and mechanisms exist that include faults, fractures, microfractures and pore spaces in the caprock, which preclude a perfect seal. These result in hydrocarbon liquids and gases very gradually leaking from the reservoir rock. The hydrocarbons generally dissipate through the overlying sequences, sometimes reaching the earth’s surface but in such small quantities and over such long periods of geological time that they rarely present a problem. The caprock, therefore, retards hydrocarbon migration, permitting the temporary (on geological timescales) accumulation of reserves within the underlying reservoir rock. It is, therefore, the rate of hydrocarbon flux across the field, achieved by migration along faults, fractures and microfractures, or by capillary action through the pore space that is of interest to the study of residence (or retention) time in any particular trap or field. If a concentration gradient (chemical potential gradient) exists, then molecular diffusion (by capillary action) is always present (Bockris & Reddy, 1970). This is generally regarded as the slowest loss mechanism and represents the minimum rate of loss from a reservoir over geological time (Nelson & Simmons, 1995). The various processes controlling migration are reviewed in section 3.3.
Gas is also found emerging at the earth’s surface as a result of shallow biogenic sources, for example, marsh gas.
3.2 UKCS OIL AND GAS SEEPS
Potential gas source rocks cover a large part of the UK Continental Shelf (UKCS) and include Quaternary peats, petroliferous source rocks such as the Carboniferous marine shales and Coal Measures and Jurassic shales, most notably the Upper Jurassic Kimmeridge Clay. Consequently, and although not widely reported they are more common than might be realised. Natural gas (and oil) seeps have been detected west of Ireland in the Porcupine Trough (Games, 2001) and are found over large areas of the North Sea seabed (e.g. Hovland & Summerville 1985; Vik et al., 1991; Hovland 2002; Hovland & Judd, 1988; Judd et al., 1997). In the North Sea gases (and other fluids) are found emerging through soft, fine-grained seabed sediments in the North Sea where they commonly produce a pockmark. These are circular to elliptical depressions on the sea floor, metres to hundreds of metres in diameter (Hovland & Summerville, 1985; Hovland & Judd, 1988). Onshore Great Britain, at least 173 occurrences of surface petroleum seepages and impregnations are reported, with oil and gas seeps reported from the East Midlands, NE England
40

and the Weald-Wessex Basin of southern England, where gas is found bubbling up along the south coast (e.g. Selley, 1992). The presence and discovery of these seepages drove the early exploration for oil and gas by D’Arcy/BP Petroleum and the Gas Council (Lees & Cox, 1937; Lees & Taitt, 1946). It should be noted that Selley did not include the many other seepages from the (considerable) outcrop of the Carboniferous strata on the UK mainland. Whilst it may be true to say that the overwhelming majority of such leakages have not been found to be associated with any existing oil or gasfield (Macgregor, 1993), it would be incorrect to say none are. The Formby Oilfield was effectively discovered because of significant oil stained soils and peats at surface above the oilfield.
In the context of the UK & the North Sea, the crust has, following glacial loading, undergone isostatic rebound several times through Pleistocene to recent times. Late stage hydrocarbon leakage and charging of reservoirs has been proposed in areas of the North Sea (North Viking Graben and Halten Terrace) as a result of repeated glaciations and de-glaciations during the Quaternary Ice Age (Statoil, 2004). This process may provide an explanation for breaching of some onshore/offshore UK fields and "pumping" of the hydrocarbons through the overburden to give us the evidence of seeps observed at the present day.
Estimates as to the gas flux across the UKCS show that natural gas seepages are significantly more important as a source of methane than had previously been established (Judd et al., 1997). Judd et al. (1997) concluded that between 120,000 and 3.5 mtonnes of methane are released from an area of 602,000 km2, representing between 2% and 40% of the total UK methane emissions. Their work included onshore estimates from Abbeystead and Wigan (Lancashire) and Youlgrave (Derbyshire). This represents an average methane flux of 0.2 – 5.6 t/km2/yr over the whole UKCS and is somewhat higher than that estimated by Williams (1994) for all UK emissions of methane, both anthropogenic and natural, then totalling around 5 mt/yr and 107,000 t/yr, respectively. Gas flux rates are covered further in section 3.5.
As alluded to, onshore in Great Britain, hydrocarbon occurrences in the form of oil or gas seeps have long been reported. This includes the Wessex-Weald Basin area in southern England (see Selley, 1993), which has producing significant quantities of oil and gas since the early 1980s. The Weald Basin also has one of the first gas storage sites to have been developed onshore the UK, at Humbly Grove, with others also planned (refer Fig. 1 and Appendix 3)
The first documented discovery of gas in the Weald area came in 1836, when it was encountered bubbling up in groundwater during the digging of a waterwell at Hawkhurst in West Sussex around 17.5 km (11 miles) ENE of Heathfield (Pearson, 1903; Strahan, 1920). Workmen excavating and augering a pit by lantern light had reached 56 m (148 ft), within the Wealden Beds when there was a sudden rush of gas, which ignited, burning two workmen to death. Subsequently, in 1875, 1884, 1895 and 1896, further gas was reported in water wells in the area (Hirst, 1985), the latter two were drilled to provide water for use in a hotel and at the London, Brighton and South Coast Railway Company station (Dawson, 1897, 1898; Woodward, 1903; Strahan, 1920; Adcock, 1963; Hawkes et al., 1998). The well at the railway station became Britain’s first natural gas well, consuming around 28.4 m3 (1000 ft3) per night to light the platforms (Pearson, 1903), the cumulative production for the well having been estimated at 566337 m3 (20 million ft3; Adcock, 1963).
Subsequently, an exploration borehole at Netherfield, Sussex, also encountered gas bubbling up through water that caused an explosion (Willett, 1875; Dawson, 1898; Pearson, 1903; Adcock, 1963). In 1902, following these discoveries, a company was set up to develop, distribute and market the gas in Heathfield, Polegate, and Eastbourne and further wells were sunk in the Sussex Weald. Oil and gas seeps were recorded from elsewhere in southern England (Strahan, 1920; Edmunds, 1928; Lees & Cox, 1937; Reeves, 1948). Such leakages have not, however, precluded the development of important oil and gas fields onshore, sometimes in close association with urban development in southern England and indeed in the East Midlands. Once the origin and
41

likely presence of these seeps and accumulations became known, then the safety and precautionary measures taken during work reduced the number of incidents.
One of the worst tragedies involving civilian deaths in the UK occurred at Abbeystead, NW England on 23rd May 1984 and resulted from the accumulation of naturally generated methane in an underground tunnel (HSE, 1985; Pearce, 1985). Forty-four people were assembled in a valve house during a tour of the Wyresdale Tunnel complex. Shortly after pumping commenced, an explosion and fireball engulfed the visitors in the valve house, blowing off the buried concrete roof. For a period of 17 days prior to the tour no water had been pumped through the system and natural gas had built up in the tunnel, which on the commencement of pumping had been displaced into the valve house, where an unidentified ignition source was encountered. In all, 16 people were killed in the incident, with no one in the valve house escaping injury: all survivors suffered a mixture of blast, crush and burn injuries (HSE, 1985; Jaffe et al., 1997). The Wyresdale Tunnel is constructed in a series of rocks of Carboniferous age that contain source rocks for both oil and gas and that have led to commercial accumulations of hydrocarbons in this region (Fraser & Gawthorpe, 1990; Fraser et al., 1990; Kirby et al., 2000). The tunnel intersects a number of faults and the Grizedale Anticline (a fold on the northern margins of the NE-SW trending Ribblesdale Foldbelt -Aitkenhead et al., 1993; Wilson et al., 1989; Kirby et al., 2000) and in which, the gas appears to have initially accumulated.
3.3 HYDROCARBON MIGRATION
Hydrocarbon migration is largely buoyancy or hydrodynamically driven (Hunt, 1979; Klusman, 1993; Tedesco, 1995; Saunders et al., 1999; Brown, 2000), with chemical gradients driving some migration. Excellent accounts of natural gas migration and emission mechanisms are given by Schroot & Schuttenhelm (2003a&b), Heggland (1997), Heggland & Nygaard (1998) and Heggland (2005).
Visible evidence of petroleum leakage includes asphalt and tar deposits (more ancient seeps) or areas where oil or natural gas is actively seeping onto the ground surface, into mines or water wells, in springs, lakes, and marine coastal areas (see examples from California in the review of incidents – Chapter 9 and Appendix 5). Such surface sites showing visible evidence that liquid or gaseous hydrocarbons are actively leaking or have previously leaked from a subsurface region are called macroseeps (Link, 1952; Hunt, 1979; Weber, 1997). The migrating hydrocarbons follow the most permeable pathways to the surface, which are commonly faults and fractures. A second type of leakage is microseepage, which is oil or gas leakage to the surface that is not visible but which is detectable by analytical methods. Microseepage is detectable above subsurface petroleum reservoirs and also above natural gas storage reservoirs (generally aquifers) when the cap rock is not an effective seal for the reservoir rock (e.g. Jones & Drozd, 1983; Pirkle, 1986; Morgan, 2004; Jones & Pirkle, 2004: http://www.eti-geochemistry.com/FinalVersion1.10.htm: refer Chapter 9 and Appendix 5). A variety of analytical procedures have been developed for detecting petroleum microseeps (Nelson et al., 2005). The same factors apply to the determination of seal performance in proposed aquifer storage sites as are covered during oil exploration.
The following sections outline briefly the required components and processes important in determining the suitability and safety of any particular site for the development of a gas storage facility. The determinations are based upon a wealth of experience gained in the characterisation, development and production of hydrocarbons from oil and gasfields around the world.
3.4 CAP ROCKS, FAULTS AND SEALS
Caprocks or seals are an essential element in the development of hydrocarbon accumulations. A caprock is generally an overlying impermeable lithological unit (shale, salt etc) capable of impeding hydrocarbon movement. A seal maybe provided by a caprock or some other physical
42

barrier such a fault or diagenetic boundary. Any lithology can provide a seal, all that is required is that the minimum displacement pressure (capillary entry pressure) of the seal rock is greater than the buoyancy pressure of the hydrocarbons in the accumulation. Capillary entry pressure in rocks is controlled by interfacial tension, wettability, and the pore throat size distribution (see below). Thus the size of the continuous pore throats and the density of the hydrocarbons and water are of great significance. The seal capacity is the maximum hydrocarbon column height that a seal can trap and can be quantified as the capillary entry pressure (displacement pressure) at which hydrocarbons will leak into a seal. This is often put at 5-10% nonwetting phase saturation (PTTC, 2004). The height of the hydrocarbon column trapped is equivalent to the sealing capacity of the weakest seal.
Three principal factors control capillary entry pressure in rocks (PTTC, 2004):
• interfacial tension between hydrocarbons and water
• wettability of the rock surfaces
• the size distribution of the pores, especially the interconnection of the pore throats.
Capillary pressure in a pore exists across the fluid interface between oil and water. The physical state of the interface is called interfacial tension when two liquids are involved and surface tension when a liquid and gas are involved. Absorption of a rock surface for a specific fluid is called wettability. If water is absorbed on the grain surface more strongly than oil or gas (water adhesive forces > cohesive forces), the grain surface is said to be water wet. The grain surface is oil wet if oil is absorbed more strongly than water (water adhesive forces < cohesive forces). In a simple capillary tube, the capillary pressure between a nonwetting phase (oil) and a wetting phase (water) can be defined in terms of the radius of curvature of the interface between the fluids, the radius of the capillary tube, the interfacial tension of the fluids and the wetting or contact angle.
Effective cap rocks for liquid and gaseous hydrocarbon accumulations are typically thick, laterally continuous, deformable rocks with high capillary entry pressures (i.e. they are impermeable). The most common caprock lithologies over commercial petroleum reservoirs are evaporites (mainly halite) and shales. Evaporites seal about 50% of the world’s largest oil fields and 36% of the world’s 25 largest natural gas fields (Hubbert, 1953; Berg, 1975; Downey, 1984; Grunau, 1987; Sales, 1997). However, carbonate-/silica cemented sandstones and cherts may also provide a cap rock.
Cap rocks, therefore, act effectively as valves that control the amount of liquid or gaseous hydrocarbons (the height of the oil or gas column) retained in reservoir rocks before the seal fails. Breakthrough pressure is the capillary pressure at which the nonwetting phase forms a continuous network within the seal. At this pressure, the nonwetting phase will leak or flow through the seal (PTTC, 2004).When the cap rock leaks, it and the overlying strata become partly saturated with oil and/or gas, which displaces the pore fluid initially present. There are many examples from the North Sea where gas chimneys have developed above fields and major structures (section 3.5). Leakage occurs by either:
• membrane seal failure can occur when gas transport is through the pre-existing pore system of the cap rock, either in solution in water or as a result of capillary failure (the pressure in the gas column beneath the cap rock may exceed the capillary entry pressure of the cap rock). This can arise as a result of either the buoyant force exerted by the vertical height of the hydrocarbon column in the reservoir and/or the existence of a chemical potential gradient across the caprock to drive diffusion. Membrane seal strength corresponds to the height of a hydrocarbon column that can be retained before leakage occurs. Determination of the capillary entry pressure and thus the pressure at
43

which membrane seals start to leak can be ascertained by mercury injection tests performed in a laboratory using cap rock core samples.
Membrane seal failure is therefore, either
o pressure driven
o diffusion (molecular) driven
In aquifer storage sites which have generally not had high pore pressures (or depleting oil/gasfields taken to higher pressures than the original reservoir pressures), this could lead to a phenomenon referred to as exceeding the threshold displacement pressure (or threshold pressure), whereby the pressure is high enough to displace water-gas menisci in the rock pore spaces. The pressure displaces the static water column, forcing water out of the cap rock and leading to gas leakage from the storage formation (Katz, 1978). An inverse relationship exists between permeability and threshold displacement pressure, i.e. less permeable formations have higher threshold pressures.
• hydraulic seal failure – leakage may occur through hydraulic failure (microfracturing) of the cap rock, perhaps associated with faulting, i.e. or by under overpressures (see also Chapter 8). This occurs where the capillary entry pressure is essentially infinite and seal failure follows by pressure in the reservoir wedging open faults or pre-existing fractures or the development of fractures in the cap rock (e.g. Vik et al., 1991; Leith et al., 1993; Caillet, 1993; Nordgard Bolas & Hermanrud, 2003). The hydraulic seal capacity of a cap rock is related to such factors as its thickness and tensile strength, the magnitude of the minimum effective stress in the sealing layer and the degree of overpressure development in the reservoir system (Watts, 1987). Leak-off tests, performed in wells, are commonly used to determine the pressure at which hydraulic seals start to leak (Watts, 1987a&b; Sales, 1997). Katz & Coats (1968) found that no fracturing of the caprock occurred at or below pressure gradients of 22.6 kPa/m (3.28 psi/m) of depth, suggesting that it could only happen at pressure gradients of 33.9 kPa/m (4.92 psi/m) depth. However, gas might open existing fractures at gradients between 22.6 and 24.9 kPa/m (3.61 psi/m) depth. Such values are higher than the maximum overpressures resulting from original hydrocarbon entrapment and thus the overpressures used in underground gas storage projects should not exceed the original reservoir pressures.
Studies of overpressured sequences across the Haltenbanken province of the North Sea have shown that well defined gas chimneys are numerous over structures and faults, indicating hydraulic fracturing of the caprock and release of gas (Vik et al., 1991).
• Wedging open of faults due to tectonic activity – a variant of the hydraulic seal failure mechanism that may be related to overpressures induced by tectonics
There is much written on the effectiveness of reservoir caprocks and rates of leakage through them by diffusion (e.g. Leythauser et al., 1982; Krooss et al., 1992a&b; Nelson & Simmons, 1992). Nelson & Simmons (1995) suggest that no caprock can be shown to be a perfect seal to hydrocarbon migration. Faults, fractures, microfractures and pore space in the caprock may often preclude a perfect seal, such that the caprock only retards migration, allowing the temporary accumulation (on geological timescales) of hydrocarbons within the trap/reservoir (Nelson & Simmons, 1995). Whilst this maybe true over geological time (millions of years), over the time period (perhaps 30-50 years) of a proposed depleted oil/gasfield UGS facility in the UK, it is likely that, providing original reservoir pressures are not exceeded, the caprock can effectively be regarded as fully sealing.
Faults can act both as barriers to fluid flow and as channels. The ability to predict which type of behaviour will have characterised a particular fault or fault segment and on what time scale, is of crucial importance in the hydrocarbon industry. Lithology is a key variable with, for example, faulting in sandstones capable of producing a sealing gouge. However, knowledge as to the
44

extent to which fault surface geometry and the width and internal structure of the damage zone can also influence the permeability characteristics of a fault, is important. These parameters are themselves functions of lithology and are also likely to vary with time in a fault subject to repeated slip. Further review of studies on faults and fault sealing capacities in oil and gas fields is provided in section 6.1.
3.5 HYDROCARBON LEAKAGES AND FLUX RATES
As indicated, there are many documented accounts of hydrocarbons leaking to surface and which may also be dispersed to varying degrees in porous and permeable layers along its migration path forming secondary accumulations within them. Appendix 1 provides examples and levels of gas migration rates from/within hydrocarbon-bearing basins.
The most common mechanisms by which natural gas migrates through lithified strata is via faults and porous and permeable beds. The well-known gas seeps above the Tommeliten gas field in the Norwegian sector of the North Sea lie above a salt diapir or dome (Hovland & Summerville 1985). Faults above the diapir act as conduits for the gas rising from depth to the near surface (Hovland 2002), with gas also widely distributed throughout the upper part of the sediment column. An area of gas-charged sediments covering approximately 120,000 m2 above the field is identified on seismic reflection data by a ‘gas chimney’: the result of the gas in the rocks degrading the seismic signal and the imaging of the strata within and beneath it (e.g. Hovland & Summerville, 1985).
In actively subsiding offshore sedimentary basins softer sediments including porous sandy or silty horizons, commonly occur, into which gas may migrate and move along, becoming dispersed. The gas may then become trapped in normal buoyancy traps beneath less permeable sediments such as clays. This results in the commonly observed shallow submarine seismic responses known as acoustic blanking, acoustic turbidity and reflector enhancement. As mentioned above, the gas often then emerges at the seabed in pockmarks (Hovland & Summerville, 1985; Hovland & Judd, 1988). Gas may also emerge through mud volcanoes, major examples of which occur, for example, around the shores of the Caspian Sea (Huseynev & Guliyev, 2004). They are stratified cones of mud on the seabed or land surface that originate when overpressured gas charged fluids migrate upwards through the less lithified strata in a sedimentary basin. They disrupt the overlying strata and rise as a column of fluidised sand, mud, gas, other fluids and blocks of sediment. At Tommeliten (Norwegian Block 1/9), where the sea bed is sandy, the gas emerges at the sea bed as bubbles, through small circular vents c. 10 mm in diameter in the sandy sea floor in a small part of the area above the gas chimney, covering about 6500 m2 (Hovland & Summerville, 1985). The vents commonly have a cone-shaped depression about 20 cm in diameter. The gas bubbles have been observed using a remotely operated vehicle and have been imaged on echo-sounder and shallow 3.5 kHz seismic records. The gas seepage equates to about 24 m3/day. Gas may also emerge through the seabed intermittently, in response to changes in hydrostatic pressure or to self-sealing mechanisms (Hovland, 2002).
A number of studies have been undertaken to calculate the diffusion rates and fluxes through a caprock. One study at the McClave Gasfield, a stratigraphic trap in the Pennsylvanian Morrow Formation (Carboniferous age) in southwestern Colorado, was undertaken (Nelson & Simmons, 1995). The reservoir lithologies are fluvio-deltaic sandstones within marine shales. Faulting is minor (generally less than 30 m) and there is little structural deformation. Therefore, any losses might reasonably be assigned to diffusion losses through/across the caprock. The methane flux over the areal extent of the field for 5% and 10% caprock porosities was calculated at 521 m3/yr (18.4 mcf/yr) and 2382 m3/yr (84.1 mcf/yr) respectively (Table 3), which would mean that the field’s entire methane volume might be replaced every 2.21 million years (my) or 485,000 yr respectively, requiring constant recharge (Nelson & Simmons, 1995).
45

3
Studies for hypothetical fields with a 1737 m thick caprock (Table 4), producing 283.2 Mcm and 2.8 Bcm (10 and 100 bcf) of gas have calculated losses of 2,832 m3/yr (0.10 mcf/yr) and 21,294 m /yr (0.752 mcf/yr) respectively4 (Smith et al., 1971). Nelson & Simmons (1995) suggest that these rates are comparable to those of the McClave Field, when differences in calculation scheme are considered. As might be expected, increased rates of loss are found with a thinner caprock of only 39.6 m.
The development of the conspicuous ‘sage anomaly’ above the Patrick Field in Wyoming, where sage and grasses were killed or showed stunted growth, was investigated for any relationship to the underlying oilfield (Arp, 1992). Studies of the geology and field production history revealed that the anomaly developed above the oilfield’s gas cap following injection of produced gas and then water to repressure the oil reservoir and increase oil production. It is calculated that perhaps 2.5 Bcm (87 bcf) of gas (and light hydrocarbons) had migrated from the reservoir to the surface, via faults, at velocities of between 76.3 m/yr (over 20 year period) and 305 m/yr (5 year period). The latter rates are comparable to those calculated by Araktangi et al. (1982) for the Leroy Gas Storage Facility in Wyoming (section 9.2 and Appendix 2).
An incident occurred in northwestern Oklahoma on January 31st 1980, when natural gas began erupting at ground surface at a number of sites in the Edith area near Camp Houston (Preston, 1980). The venting initially created a crater 6.5 m wide from which a viscous mud was ejected to heights of up to 16 m. Within hours the venting had spread to an area roughly 2.4 km square, with several more large craters produced, linked by a series of fissures several metres long. The fissuring followed two orthogonal fracture sets in the Flowerpot Formation, a 100 m thick shale sequence and could even be seen affecting the overlying unconsolidated river deposits (Preston, 1980). Flow measurements from various vents ranged from 3,398 m3/day (120,000 ft3/day) to 7,646 m3/day (270,000 ft3/day). Flow from a large crater was estimated at over 56,633 m3/day (2 million ft3/day), with the total daily gas flow conservatively estimated at 0.57 Mcm (20 million ft3/day). Investigations revealed that the gas originated from the Mississippian Chester limestone (the Chester-Oswego interval) at around 1700 m below ground and a faulty well was the prime suspect. Tests of the Leede Devine No.1 well indicated gas was entering the well at between 183 and 198 m depth, co-incident with a regionally extensive fractured evaporite interval, through which scores of wells had been drilled. Production tests (0.11 Mcm/day or 4 million ft3/day) proved gas was entering the well bore between the wall rock and the production casing at that level. The well providing the route from the gas-bearing horizon to the fractured evaporites was never found as the ventings declined steadily and by August were of no great significance (Preston, 1980).
4 Where mcf/yr = one thousand cubic feet per year (not one million cubic feet per year)
46

4 Salt deposits and factors relevant to developing gas storage caverns
This chapter outlines some of the more important aspects and characteristics of salt deposits and consequently, how they may impact on the development of salt caverns for gas storage purposes. Further details of the nature of problems encountered at individual mines or brinefields (section 4.8) are available in Appendix 2 (refer also to Appendix 5).
4.1 INTRODUCTION
As alluded to previously, halite (rocksalt) generally occurs as a member of evaporite cycles in stratified layers, or as the thickened pillow and piercement structures (diapirs) resulting from halokinesis (the process of plastic deformation and buoyancy driven deformation of the source salt layers). The question of the rheological behaviour of the salt and the deformation history is of importance when assessing the long-term stability of any body of salt and thus caverns that might be constructed in it for gas storage purposes. This chapter, therefore, attempts to outline the rheology and deformation mechanisms of halite providing an outline of some of the basic properties of rocksalt that are required for input to modelling of salt tectonic processes and the assessment of mine and cavern stability.
4.2 SALT CREEP
The mechanical and rheological behaviour of salt is of great importance to the suitability and performance of salt beds for gas storage and some aspects are still open to debate (refer Bérest & Brouard, 2003). Salt may deform either in a ductile (plastic) or brittle manner, depending on the temperature, stress state and deformation rate (section 2.2.7). Salt behaviour is elastic-ductile when short-term compression tests are considered, but is elastic-fragile when tensile tests are considered (Bérest & Brouard, 2003). In the long term salt behaves as a fluid in the sense that it flows even under small deviatoric stresses. But its viscoplastic deformation and extremely low permeability are often referred to as strong reasons for salt beds being ideal sites for gas storage. This may be confusing and it is, therefore, worthwhile briefly reviewing these fundamental and often quoted properties. The effects of faulting on salt bodies or salt beds and the deformation mechanisms are dealt with in further detail in section 6.1.4.
Due in large part to interest in radioactive waste disposal and gas storage in salt, the last 20-30 years have seen a great deal of experimental deformation work undertaken on the deformation mechanisms and steady state creep of salt. As a result of this work and as alluded to previously, it is now well known and accepted that over a range of temperatures well below its melting point of circa 800°C, and under most normal burial (increasing temperature and pressure), engineering and geologically relevant conditions, halite deforms in a viscoplastic way (plastically). To all intents and purposes the halite will creep or ‘flow’ (e.g. Jenyon, 1986a,b&c). This is achieved by intracrystalline deformation processes (Fig. 6h-i), and probably by diffusive mass transfer (pressure solution) through thin intragranular aqueous (brine) films (Heard, 1972; Albrecht & Hunsche, 1980; Carter & Hanson, 1983; Wawersik & Zeuch, 1986; Skrotzki & Haasen, 1988; Spiers et al., 1989, 1990; Franssen & Spiers, 1990; van Keken et al., 1993 – see following section 4.2.1 for more detail). Increasing the temperature reduces the yield strength of halite, as does the application of differential pressure, although increasing the confining pressure seems to have a much smaller effect (Jenyon, 1986c). The presence of free water (brine) also reduces the yield strength.
47

The creep mechanisms and processes involve the movement of dislocations (imperfections in the [salt] crystal lattice) through the crystal, dominated by cross-slip and/or climb controlled dislocation creep mechanisms (Fig. 6). Dislocations raise the energy of a crystal lattice and the process of dislocation movement is driven by the stress field and the crystal lattice trying to achieve its lowest energy level. It leads to lattice preferred orientations, dislocation substructures, subgrain formation and dynamic recrystallisation (see review of Carter & Hansen, 1983; Franssen & Spiers, 1990 and refer White 1976, 1977; Bell & Etheridge, 1973, 1976; Nicolas & Poirier, 1976 and Urai et al., 1986a for further details of intragranular/crystal deformation and recrystallisation processes).
It is important to note that crystal plastic deformation or dynamic recrystallisation mechanisms do not necessarily involve interstitial fluids, although natural salt bodies do contain trace amounts of brine. These remain from the formation of the salt beds, either as inclusions or as films on grain/crystal boundaries. Crystal plastic deformation processes are influenced by the presence of intracrystalline (inclusions) and interstitial water that causes hydrolytic weakening and leads to low temperature plasticity (e.g. Griggs, 1967; Sibson, 1977; Liu et al., 2002). Studies have shown that when trace brine is present, the creep of the salt can be significantly affected (refer 4.2.1 and 4.2.2 below).
Consequently, if caverns are developed in a salt body and the internal pressures are not kept high enough, differential pressures exist. The result of this natural process will be for the salt in the surrounding walls to very slowly creep/flow into the void and close the cavern. If left untouched (and with no water incursions), salt will creep into an unbreached cavern until the differential pressures are equal, with salt creep rates primarily influenced by:
• cavern depth and overburden characteristics – pressure and temperature gradients
• internal cavern pressure - where the difference between the natural lithostatic pressure and the cavern is high (low pressure in the cavern), then creep is accelerated relative to high cavern pressures.
• cavern shape
• salt properties – variations in crystal size and moisture content
This void closure phenomenon is well known in salt mines and brinefields and led to problems in some in some of the earlier salt cavern gas storage projects (sections 2.2.7.2 & 9.3 and Appendices 2&5). Cavern stability is dependent upon the composition of the salt, the geothermal gradient and overburden temperatures. At depths between 1000 and 2000 m there is an elastic-plastic transition zone. Salt creep above the transition zone occurs at slower rates and caverns are generally stable between depths of a few hundred metres and circa 2000 m (Warren, 2006). Below these depths caverns can show greater instability and large volume decreases through salt creep (Warren, 2006).
As with salt mines, solution mined caverns properly located, designed, constructed and operated above the lower depth limit can show remarkable stability, even when emptied of product as shown by the lenticular cavern in the Bryan Mound salt dome in Texas constructed in the 1950s (section 2.2.7). In contrast to the Bryan Mound example are the earliest purpose built gas storage caverns at the Eminence cavern storage facility (Mississippi, USA – refer Appendix 5). Here around 40% of the cavern volume was lost within two years of construction (Thoms & Gehle, 2000; Warren, 2006), and it illustrates how rapidly salt creep can occur with resultant loss of volume if operating conditions are not carefully controlled.
4.2.1 Creep behaviour of halite (rocksalt) in the temperature range 20-200ºC and natural
strain rates
Natural flow or steady state creep of rocksalt (halokinesis) generally occurs at (shallow) crustal levels where temperatures are relatively low, i.e. less than 150-200ºC (e.g. Heard, 1972; Jackson
48

& Talbot, 1986; van Keken et al., 1993). There are now many experimental studies to determine the deformation mechanisms and behaviour of a wide range of natural and synthetic salts under differing conditions (e.g. Carter & Hansen, 1983; Horseman & Handin, 1990 and see refs below).
The conditions investigated experimentally cover temperatures in the range 20ºC to 250ºC, strain -1rates in the range 10-4 to 10-10 s and confining pressures up to 15-70 MPa. At experimental flow
-1stresses approaching those in nature, i.e. below around 15 MPa and strain rates below 10-7 s , experiments show flow by dislocation creep (Carter & Hansen, 1983; Wawesik & Zeuch, 1986). Concerning the rate controlling mechanism it has been argued that the main rate controlling process at 20ºC to 200ºC is probably cross-slip of screw dislocations (Wawesik & Zeuch, 1986; Skrotzki & Haasen, 1986). On the other hand, observed subgrain development at 100ºC to 200ºC indicates that dislocation climb might be the rate controlling process in this range (Carter & Hansen, 1983). Creep at 50ºC to 200ºC may also be controlled by cross slip at high strain rates
-1(<10-7 to 10-9 s ) and by climb at lower strain rates (Horseman et al., 1993, Carter et al., 1993). The nature of the detailed rate controlling mechanism remains unclear, although most salts show similar creep behaviour in the range 20ºC to 200ºC (van Keken et al., 1993).
4.2.2 Original brine in salt deposits and its migration through and effects on the rheology
of salt bodies
In nature, minute amounts of original saturated brine (water) are found in rocksalt deposits, contained as either inclusions within the salt crystal lattices or along crystal/grain boundaries as films or in minor voids (refer Carter & Hanson, 1983). These minute amounts of fluid migrate gradually, under overburden or tectonic pressures, through the salt crystals and salt body. Studies on salt in the USA (“Project Salt Vault”) estimated brine inflow rates of 0.5 to 3.0 ml/day at monitored boreholes, which amounted to 2-10 litres per hole after about 20-30 years. The flow rates approached zero after those times (Bradshaw & McClain, 1971; Carter & Hanson, 1983).
The nature, shapes and migration paths of fluid inclusion ‘bubbles’ within rocksalt specimens subjected to temperature gradients in laboratory tests have been impressively demonstrated (e.g. Carter & Hanson, 1983; Urai et al., 1986). Studies and experiments have shown that even the minute quantities of inherent brine in a salt body may have profound effects on the rheology of salt. Water (brine) affects the mobility of dislocations within the crystal lattices, making it easier for them to move through the crystals. This affects significantly processes such as fluid-enhanced dynamic recrystallisation (Urai, 1983) and pressure solution creep or fluid enhanced grain boundary diffusional creep and grain boundary sliding accommodated by solution-precipitation.
Experiments on natural and synthetic salts, particularly finer grained salts, have shown that when trace amounts (typically � 0.05 wt%) of brine are present at crystal/grain boundaries, then in addition to the dislocation mechanisms outlined above, deformation can occur by fluid assisted grain boundary diffusional creep or pressure solution at natural strain rates (< 10-10 s-1; Urai et al., 1986b; Spiers et al., 1986, 1988, 1989, 1990; van Keken et al., 1993). Naturally deformed salts show microstructural evidence for the operation of solution-precipitation (Urai et al., 1986b, 1987) and pressure solution creep may indeed become dominant over dislocation mechanisms. However, most salt deformation seems to be dominated by intracrystalline dislocation mechanisms (see Carter & Hansen, 1983).
At higher strain rates the deformation mode is likely to be that of dislocation glide, whereas at low strain rates there is a transition to pressure solution by grain boundary diffusion with dynamic recrystallisation along the grain/crystal boundaries. Also, lattice diffusion can occur, with water molecules passing through the NaCl lattice, which may affect the dynamics of the dislocation mode of deformation (Jenyon, 1986c).
49

4.2.3 Salt glaciers, rainwater and deformation mechanisms
Several in situ field measurements have shown that the downhill flow of salt glaciers is episodic, showing accelerated flow after heavy rain. In dry seasons, the movement involves only daily thermal extension and contraction due to variations in air temperature (Talbot & Rogers, 1980; Schléder, & Urai, 2007). There is evidence that these daily variations create an extensive and penetrative crack system (Talbot & Aftabi, 2004), which in turn is able to conduct the rainwater into the salt glacier. During the upward transport of the rocksalt, dislocation climb controlled creep and solution-precipitation creep are the main deformation mechanisms. However, as the rocksalt reaches the surface, numerous bedding parallel shear zones develop, in which the deformation mechanism is solution-precipitation creep (non-conservative grain boundary migration and grain boundary sliding accommodated by solution-precipitation). This is related to the ingressing rainwater, although the process by which this conducted rainwater wets the whole shear zone is not entirely understood (Schléder, & Urai, 2007).
The mass transfer, necessary for the solution-precipitation process, could take place in either static fluid network or in migrating fluid. The episodic glacier flow may imply that the mass transport occurred in migrating undersaturated fluids. This is perhaps borne out by the presence of numerous air inclusions at grain boundaries and triple junctions, which could be interpreted as the result of dissolution by the ingress of rainwater.
It is not thought likely that rainwater (fresh undersaturated water) will penetrate to salt in the regions and at the depths being considered for gas storage in the UK. Nevertheless, it illustrates that water can cause major changes in the rheology and deformation mechanisms of salt. Consequently, care is required to ensure that no pathways exist (e.g. old boreholes and poorly cemented new wells) to allow undersaturated water (or brine from wet rockhead entering via poor borehole conditions) to interact with the halite beds in which the caverns are to be constructed.
4.3 GASES IN SALT FORMATIONS
Gases present naturally in salt sequences include methane (CH4), nitrogen (N), carbon dioxide (CO2) and hydrogen sulphide (sour gas - H2S), the origins of which have been the subject of debate. Most domal salts in Louisiana are classified ‘gassy’ (Hinkebein et al., 1995) and miners have long known about the dangers of gas within salt formations: several fatal accidents in conventional salt mines have been caused by outbursts of methane gas and associated saltfalls (Molinda, 1988; Hinkebein et al., 1995). In June 1980 methane gas exploded at a salt mine on Belle Isle, Louisiana, killing 3 miners and injuring 17 others (Golden, 1981). The source of the gas is generally believed related to the fact that many evaporite sequences contain organic rich layers, produced during what are effectively algal blooms (Warren, 2006). On burial, gases are produced from these layers by bacterial sulphate reduction at low temperatures and nonbiogenically by thermochemical sulphate reduction at higher temperatures. It is suggested that some thin impurity-rich salt beds interlayered with beds having some porosity and permeability (so called ‘carrier beds’) leak small amounts of volatiles, but much less efficiently than the thicker organic rich shale and mudstone interbeds. Furthermore, movement out of the salt is unlikely until a pathway is available, generally as a result of the salt having been dissolved, or intersected by human activity in the form of boreholes or mining operations (Warren, 2006). The migration of methane gas over long distances through major salt deposits in Portugal, Yemen and NE Brazil has also been postulated, facilitated by fractures (Terrinha et al., 1994; Davison et al., 1996a; – see also section 6.1.4). These studies should perhaps be urgently reviewed as they may indicate problems of tightness not previously recognised or that might not necessarily be anticipated in salt bodies.
In the USA, problems have been encountered at UFS facilities (notably those of the SPR), in terms of the product inventory and delivery of stored product. There have been instances where
50

the volume of gas held in storage has increased due to gas generated within the salt body and which then moved through the salt body into the storage cavern (Hinkebein et al., 1995; Neal & Magorian, 1997). Gas movement into salt caverns has been attributed to permeation through the salt either through
• Release of gas contained in pockets in the salt (at lithostatic pressure) during solution mining. The theory is that the gas is contained in pressured pockets in the salt, which is considered essentially impermeable and the primary mechanism of gas release is from dissolution of the salt as the ‘growing’ cavern intersects the gas pocket. The gas released is presumed to be transferred to the blanket oil or to oil stored above the brine during leaching operations. Under this mechanism, blanket oil could contain a significant amount of gas, which would then mix with oil later injected for storage. If the mechanism is of primary importance, then the main gasification of oil would take place during oil fill and presumably little additional gas transfer would occur following the cessation of leaching.
• Permeation of gas contained in pockets in the salt (at lithostatic pressure). Gas permeation might be through two mechanisms
o Stress induced permeability changes in salt surrounding caverns. Again, pockets of gas trapped in salt are intersected by zones of damaged salt around caverns that may arise during cavern construction/operation and which are caused by changes in the deviatoric stresses and pressures due to the cavern (void) formation (section 2.2.7.3.2.1). This may result in spalling of cavern walls in some cases (Hinkebein et al., 1995). This phenomenon has been observed in the Weeks Island mine where tracer gases have been injected in close proximity to the bulkhead and found to have moved through fractures in the salt that developed as a result of creep in the salt and the development of dilatant fractures in a disturbed rock zone around the bulkhead (Hinkebein et al., 1995)
o Along anomalous zones intersected by the cavern (AZ’s; Hinkebein et al., 1995; Neal & Magorian, 1997; – section 4.4).
Should AZ’s form the main ‘conduit’ then this problem is considered unlikely in the salt beds of the onshore UK. AZ’s are associated with shear zones developed during development of large salt diapirs and domes, which as noted in sections 5.3 and 11.2.7, are believed absent in onshore UK salt basins, although mild halokinesis may have occurred in the Weymouth area.
4.3.1 Gas in UK salt deposits
The Boulby Potash Mine in NE England has suffered from the presence of high-pressure gas in shaly parts of the potash, which have been sufficient to cause blowouts during mining operations (Corbett, 1996; http://www.mining-technology.com/projects/boulby/index.html). The presence of such gas in the Permian deposits of NE England should be of interest and perhaps of significance to any developers proposing to construct gas storage caverns. This would be both during the drilling and the cavern construction phases, when the brining process might encounter an unexpected pocket of high-pressure gas. It could conceivably also be of importance during cavern operation, if the facility was operated in brine compensated mode and there was ongoing leaching of the cavern during product cycling. A high-pressure pocket of gas might cause a blowout into the cavern as the intervening salt wall between the gas pocket and the cavern thins and cavern pressures change during retrieval of stored product.
4.4 ANOMALOUS ZONES
Anomalous zones (AZ’s), as the name suggests, are unexpected regions of salt of differing character. In the USA they have been shown to affect cavern shape and at some sites, the storage
51

operations for several reasons, often understood with hindsight (Neal & Magorian, 1997). They may be regions of more highly soluble salts (e.g. potash salts), fractured non salt interbeds, zones of sheared salt, or zones of older naturally leached salts (‘Black Salt’) which might contain pressurised brine or possibly gas (methane or nitrogen; Warren, 2006). AZ’s might develop in brinefields and some salt mines near intersections with poorly documented older boreholes or brine wells. They have led to problems in some of the caverns that make up the US Strategic Petroleum (oil) Reserves (SPR), notably at Bayou Choctaw, Louisiana. Here, oil in two caverns showed higher than permitted gas content, which meant it required treatment prior to draw down (Neal & Magorian, 1997). A possible correlation of gassy caverns and a shear zone that transects the salt dome was found and it is suggested that the shear zones permit gas migration. Similar shear zones exist in other domes hosting the SPR facilities at Bryan Mound (Texas) and the Weeks Island and West Hackberry facilities in Louisiana (Hinkebein et al., 1995; Neal & Magorian, 1997). Apparent correlation of shear zones and gassy caverns supports work elsewhere on gas associated with salt outbursts in conventional mining (Iannacchione et al., 1984; Neal & Magorian, 1997).
In the UK context, anomalous zones might only be relevant in identifying non salt interbeds and layers of more soluble potash salts within the Permian salt basin. Onshore, salt deposits considered for storage do not show the development of halokinetic features. So the potential for shear zones that developed in the large diapiric salt dome structures seen in America is considered negligible. It may, however, be a phenomenon that requires careful study if salt storage caverns are developed offshore in the large salt ridges and domes of, for example, the Southern North Sea and East Irish Sea areas (see DTI, 2006c).
4.5 PRESENCE OF GYPSUM AND/OR ANHYDRITE
The presence of gypsum has long been known to represent a serious geological hazard that can arise from:
• Dissolution (it dissolves rapidly, especially in flowing water) that may lead to cave systems and collapse with subsidence in overlying areas
• During burial, gypsum converts to anhydrite and is associated with a volume change, which represents an important process in the burial history and evolution of a sequence of marine evaporites. It is also an important process in the gradual uplift and erosion of sequences containing anhydrite, which may convert back into gypsum
Evaporite deposits often include gypsum (CaSO42H2O) and/or anhydrite (CaSO4). Given the above factors, determining the presence of one or both minerals in a sequence of shallow level evaporites could, therefore, be of importance when assessing any potential problems in a proposal to store gas in salt beds in which these minerals are present. Their presence may have a bearing upon the evolution of the evaporite sequence both during and post deposition. Phase changes could, for example, have caused local stresses that may have fractured adjacent rock and introduced a fracture system that requires study. However, for sequences that are deeply buried, the viscoplastic nature of the halite and the released brines are likely, over geological time, to cause infill of any fractures in the interbeds (section 4.6).
4.5.1 Dissolution of gypsum
Gypsum dissolves in flowing water about 100 times more rapidly than limestone, but only about one thousandth the rate of halite (Cooper, 1988). The rate is significantly less in more stagnant groundwaters where saturation is attained. The problem is well exemplified in the Ripon area of North Yorkshire where gypsum beds up to 30 m thick have been dissolved by subsurface dissolution (refer Cooper, 1986, 1988).
52

The problem was also discussed in relation to:
• the rapid flooding of a gypsum mine and the effect on not only the gypsum, but any associated anhydrite (which would rehydrate and expand – see 4.6.2 below) and shales and limestone interbeds
• Water abstraction from gypsum sequences or where there is hydrological continuity could affect either natural gypsum-water systems or flooded mine workings. This could include large scale pumping from underlying coalmines.
4.5.2 Gypsum/anhydrite transition
As gypsum is buried and the ambient temperature rises above 42-60°C, it converts (dehydrates) to anhydrite (often a nodular form). This occurs at depths of around 1000 m, but is variable and dependent upon the geothermal gradient, lithostatic pressure and pore brine salinity (Borchert & Muir, 1964; Warren, 2006). Intense solar heating in very arid areas can cause dehydration of gypsum to form bassanite/anhydrite at the surface, whilst in areas of high geothermal gradients (80-105°C – not a UK range) it may occur at depths of less than 200 – 250 m (Warren, 2006).
The transformations not only release solutions that can trigger a series of important changes in the adjacent halite and, if present, potash beds, but are accompanied by a volume change (Borchert & Muir, 1964). Each cubic metre of gypsum is replaced by 0.62 m3 of anhydrite and 0.486 m3 of CaSO4 saturated liquid is released. At 30°C, this volume of water can dissolve 0.081 m3 of halite or 0.54 m3 of carnellite. A bed of gypsum 5 m, 10 m or 20 m thick could convert to a bed 3.1 m, 6.2 m or 12.4 m thick (Borchert & Muir, 1964).
As rocks are uplifted and eroded away, the anhydrite beds at depth are returned to shallower levels and may remain largely unhydrated to within 100 m or so of ground level. What may happen is that the outer areas of the anhydrite body or beds may convert back to gypsum and protect an inner ‘sandwich’ of anhydrite. This could present problems if water were then to come into contact with the anhydrite. In the Ripon area, circulating groundwaters control the rehydration of anhydrite to gypsum, a transition that takes place at about 100 m depth (Cooper, 1986, 1988). As outlined above, this involves a forceful expansion of up to 60%, which can create extreme pressures and has been responsible for rock explosions and local uplifts in America (Brune, 1968; Cooper, 1988).
4.6 FRACTURES OF NON-HALITE INTERBEDS AND INFILLING HALITE
The presence of fractures in rocks associated with gas storage is an important issue in the assessment of gas tightness and the safety of an underground storage facility. As discussed elsewhere in this report, halite rarely fractures and over geological time behaves in a viscoplastic way, healing any fractures that might have developed. Howeve, fractures may develop in salt in the walls immediately around the cavern margins due to the opening of a void (cavern) and releasing of the confining pressures. This is sometimes associated with spalling or breakouts of the wall and generally only forms a narrow zone, perhaps a metre or two wide (Rokhar, 2005 and section 2.2.7.3.2.1).
Fractures in halite are rare, but have been described (Terrinha et al., 1994; Smith, 1996; Davison et al., 1996a&b: section 6.1.3). Fractures in more competent non-halite interbeds and also the enclosing mudstone sequences are common. They may represent more than one episode of fracture formation and infill and generally show infill with halite or other evaporitic minerals such as gypsum or anhydrite (e.g. Wilson & Evans, 1990 – Fig. 10a). Some of the halite (and gypsum) infilling fractures has a fibrous habit indicating precipitation from a brine, but is also present as clear and coloured crystals of the same nature as the enclosing halite bed and not obviously deposited from a brine. It is, therefore, pertinent to assess the origin and likely
53

presence of any fractures and infill in such sequences and the likelihood fractures will remain open.
Cracks and fractures in non-halite interbeds may develop in a number of ways. They may be sedimentary and early burial features such as dessication cracks in silty mudstone horizons, most likely introduced to the salt basin during floods and which subsequently dried out. Alternatively, the fractures may be related to movement. Halite beds, although they may fracture if the strain rate is high enough and/or depth of burial is shallow enough (i.e. low temperatures and confining pressures), will tend to deform plastically under increasing heat and pressure (burial). In salt domes salt beds maybe drawn out to as little as a thousandth of their original thickness without fracturing (Borchert & Muir, 1964). Non-halite interbeds, however, being more competent than the enclosing halite deposits will tend to fracture and develop cracks during any deformation induced as a result of either burial or tectonic processes and the accompanying movement of the enclosing halite. Infilling halite might be the result of one or two main processes:
(a) Infill of fractures by precipitation from brines
(b) Non-brine infill origins (and fractures)
4.6.1 Infill of fractures by precipitation from brines
The presence of fibrous infilling material is suggestive of either dissolution and recrystalisation of the evaporite, or precipitation from saturated brines that remain within the halite deposits. All salt contains brine to a lesser or greater degree, remaining during burial either as inclusions within the salt crystals or as films along crystal/grain boundaries (e.g. Sonnenfield, 1984; Spiers et al., 1988, 1990; Warren, 2006). The fracture infills might originate in a number of ways:
• At surface and during early burial, dessication cracks may be infilled with halite precipitated out from brine, which might be as a result of the re-establishment of the brine lake or saltpans, or its presence in the substrate.
• Hypersaline brines of both syngenetic (derived from the same body that precipitated the original crystals), or epigenetic (derived from a body of water that did not crystallise the deposit and which may be slightly or significantly younger than the precipitate) origin. Being hypersaline concentrated brine, they do not dissolve the original precipitate but move through the precipitate along intercalations, encountering cracks or voids in the non-halite beds in which halite (or other evaporitic material) may precipitate. In consequence, depending upon the volumes of brine moving through the system, voids, cracks and fractures in the non-halite beds maybe sealed. Hypersaline brine movement may occur as a result of:
o Gravitational instability allowing the brine to penetrate down, up or laterally into the precipitate (halite) body during its burial (e.g. Sonnenfield, 1984).
o Expulsion of the brine on burial due to increasing pressure, whereupon it migrates and precipitates salt elsewhere.
o Migration through the crystal lattices to areas/regions of lower pressure
• The dehydration of any interbedded gypsum to anhydrite above 42ºC or at depths of around 1000 m (dependent upon the geothermal gradient), may have two consequences: firstly, there is a volume change that could lead to fracturing of non-halite interbeds (section 4.5.2) and secondly, it will also introduce liquid into a salt deposit, which can cause some dissolution of the halite deposit and the formation of a brine solution (Borchert & Muir, 1964; Warren, 2006). This could give rise to fracture infilling halite and gypsum/anhydrite. The latter would depend upon the location to which the fluid migrates.
54

• Natural salt deposits contain small amounts of original saturated brine contained as either inclusions within the salt crystal lattices or along crystal/grain boundaries as films or in minor voids (section 4.2). These minor amounts of fluid migrate gradually, under overburden or tectonic pressures, through the salt crystals and salt body and could, therefore, potentially crystallise in cracks and voids in non-halite beds and seal fractures.
4.6.2 Non-brine infill origins (and fractures)
Some fracture infills may have arisen from processes other than precipitation. As halite deforms (plastically), more competent non-halite interbeds fracture and show pull-apart boudinage structures – joints and fractures (i.e. potential voids are created). Two sets of fractures may develop in the competent beds, more or less at right angles and perpendicular to bedding. The halite deforms by creep mechanisms, effectively flowing plastically around the boudinaged sections of competent materials, infilling fractures in the non-halite beds as they appear and propagate – akin to the process of extrusion. The resulting blocks of competent non-halite beds may be forced upwards or downwards into the enclosing halite deposits and may be rotated through any angle. Thin claystone/mudstone/evaporite rhythms may also be seen to break down into breccia-type deposits with angular fragments of competent material set in a halite matrix, all of which is achieved during, and as a result of, ductile flow of the halite.
It is also conceivable that under burial and increasing pressure, or due to some tectonic event causing an increase in pressure, some pressure solution of the salt might take place, similar to the process of fluid assisted grain boundary diffusional creep (section 4.2.1). If this occurs, small amounts of liquid might result and move along grain boundaries. The potential is for the salt solution to again migrate to, and crystallise in, cracks and voids in non-halite beds, potentially sealing fractures.
4.7 WET ROCKHEAD AND SUBSIDENCE IN ONSHORE UK SALTFIELDS
The issue of wet rockhead is important for many reasons. These include issues of stability, increased movement of brine, which itself has damaging effects on borehole materials (cement and steel casings) and the likelihood of further salt removal that could lead to potentially damaging ground subsidence. Wet rockhead conditions have led to problems of product containment at the Conway salt cavern facility in Kansas, USA (Ratigan et al., 2002 – section 9.3 & Appendix 5). Saltfields in England are affected by the development of wet rockhead and thus the phenomenon requires careful assessment during the geological characterisation of any potential storage site.
4.7.1 Definition and origin of wet rockhead
Salt beds occur in the subsurface but unless in hot dry climates (e.g. the Persian Gulf area of the Middle East, where salt glaciers or ‘volcanoes’ can occur – see e.g. Kent, 1979, 1987; Talbot, 1979; Talbot and Jarvis, 1984; Warren, 2006; Bruthans et al., 2006), generally do not crop out at the surface. The reason for this is dissolution by circulating groundwaters. The solubility of halite is one to three orders of magnitude higher than the solubility of either anhydrite or limestone under normal groundwater conditions (Anderson & Browns, 1999). The dissolution of rock salt, in the presence of unsaturated water, is essentially instantaneous relative to the time scale of the relevant transport mechanisms (molecular diffusion, free convection and forced convection). The rate of solid rock salt removal is therefore controlled by the diffusive and/or convective flux of sodium and chloride ions away from a halite-bearing formation (Davies, 1989).
Circulating groundwaters can thus dissolve salt, with the area of dissolution being associated with collapse breccias. These collapse breccias are formed from mudstones that originally overlay, or were interbedded with, the halite in a region where the salt would have cropped out
55

had it not been dissolved (Fig. 11). The base of the breccia is known as ‘wet rockhead’ and is usually marked by the presence of brines, which have long been pumped to the surface (see e.g. Earp & Taylor, 1986; Wilson & Evans, 1990). As solution proceeds and the salt is carried away as brine, it leaves behind insoluble inclusions from the salt beds as well as the beds of stratified mudstone. Some of these beds are more than 10 m thick and alternate with the salt layers. Thus a zone of residual material (solution residue) is created at the outcrop in the stratigraphical position of the salt/mudstone sequence. There is also piecemeal sagging, collapse and brecciation of the overlying bedded mudstones within the salt, which are inextricably mixed with residue deposits from the salt beds (sometimes referred to as autobreccia – Earp & Taylor, 1986; p.51). The result is that all stratification is lost. The estimated thickness of this solution residue deposit in the Winsford area of the Cheshire Basin is about 53 m. This is the sum of all the mudstone beds in the Northwich Halite, together with the insolubles in the rock salt, estimated at 5% of the salt thickness (a figure widely accepted as an approximate average for impurity in the salt of Cheshire: Earp & Taylor, 1986; pp 51 & 53). As indicated, associated with the removal of the salt and the collapse of interbedded mudstone layers is collapse of the overlying overburden strata, which can lead to a thick collapse breccia beneath the drift deposits that may or may not retain a gross overall stratigraphy but loses all internal structure (Fig. 11).
Numerous cored boreholes in the Cheshire area have proved broken and collapsed strata above the salt, and it is not uncommon for a cavity to exist at rockhead. The few observations of the upper surface of the salt suggest that it is very uneven and deeply furrowed by solution channels. Many old records refer to a layer of granular marl, taken to be an insoluble argillaceous residue from dissolved salt; by its nature it has rarely been recovered from cored boreholes (Dickinson, 1882, p.79; Earp & Taylor, 1986). Dickinson (1882, p.79) summarised information from brine-shaft sinkers who described the top of the salt in the following manner: ‘From what has been seen and is known of them, the spaces which a brine-run makes between the rockhead and the marlstone may be at first as thin as a sheet of paper, but the spaces become larger, and with the wearing away or solution of the rock-salt a peculiar structure of granular marl called ‘horse-beans’ ensues between the rockhead and the overlying bed of marlstone called the ‘flag’. In this granular structure freer course is afforded for the flow. Spaces, at first only the size of rat-holes, become so large that a man can enter, and they increase into large caverns, and ultimately the ground about them subsides’. The ‘horse-beans’ and brecciated strata, in conjunction with the rockhead voids, act as an aquifer for the brine. Man has exploited this brine layer for brine extraction, creating deepened and entrenched channel systems (see below).
Downdip beds lie at a sufficient depth below circulating groundwaters that their contact with the overlying beds is a normal stratigraphical one, not associated with natural brine and is known as a dry rock-head. Solution of salt, seepages of brine and resultant subsidences onshore UK are thus of geological origin and not the consequence of Man’s activity in the saltfield. However, Man’s extraction of the brine product has, in cases, accelerated their development and enhanced their effects.
Natural brine development is controlled by both the depth of the salt body and circulating groundwaters: the closer to the surface (and circulating groundwaters) the salt body is, the more susceptible to dissolution it becomes. Despite the fact that the most abundant (Triassic) salt beds in the UK would have had between two to three kilometres of (younger) strata overlying them, most UK saltfields are affected by wet rockhead conditions to varying extents. Solution of the buried salt beds is a result of uplift, tilting and erosion having removed the overlying Upper Triassic, Jurassic and possibly even Cretaceous cover to bring Triassic salt within the influence of mobile groundwater. This is likely to have occurred since at least Cainozoic times (c. 65 Ma) and certainly since end-glacial times, circa 10,000 years ago. The slow removal of salt by solution progressed in parallel with, and at about the same rate as, the general lowering of the land surface by erosion. Thus the process of dissolution has continued since such times and much as it does today (Earp & Taylor, 1986).
56

In late glacial times, when sealevel was unusually low, the solution rate in UK saltfields was probably accelerated temporarily as surface streams and most likely the brine seepages were rejuvenated. Conversely, during times of high sealevel the system would be sluggish with movement virtually ceasing over wide areas of rockhead. The modern-day UK conditions, where there has been no pumping, appear to be closer to the latter condition than the former (e.g. Earp & Taylor, 1986).
Away from present and past centres of artificial brine abstraction, the movement of brine and its replacement by freshwater is slow; the saturated brine layer protects the salt from further solution and there may be few records of subsidence (Earp & Taylor, 1986). Moreover, the routes over the ‘wet’ rockhead by which the brine moves appear to become stabilised for long periods, and so villages and churches with long histories of stability exist in areas of ‘wet’ rockhead.
Examples of the deepest recorded onshore instances of wet rockhead are in the Stockport-Knutsford district in Cheshire, where the salt ‘crops out’ against an undulating surface to the base of the collape breccia. This can vary between about 61 m (200 ft) and 122-152 m (400-500 feet) below present ground surface (Taylor et al., 1963). In the Chester-Winsford area, wet rockhead generally extends down to between 50 and 60 m. However, some brine channels adjacent to larger faults may be between 70 and 80 m below sea level, perhaps 100 m below ground level (Fig. 21 in Earl & Taylor, 1986). Collapse breccias overlying the top of the salt in the Winsford No. 1 Borehole indicates wet rockhead lies at a depth of 162.5 m (119.2 m below OD) with up to 12 m of salt may have been dissolved (Earp & Taylor, 1986; p.51). Wet rockhead may have been identified down to a depth of 180 m in other parts of Cheshire (Howell, 1984; Cooper, 2002). In NW England, wet rockhead is present in both the Preesall and Walney Island saltfields (Wilson & Evans, 1990; Rose & Dunham, 1979). An area of wet rockhead was mapped at Preesall, 0.5 km wide and extending to a depth of around 50-70 m below the base of the drift up to 0.75 km to the west of the Preesall Fault Zone (Wilson & Evans, 1990). The Walney Channel could be the site of a former brine run and an associated solution subsidence feature (Jackson et al., 1995). Offshore, beneath the East Irish Sea, wet rockhead may develop down to depths exceeding 220 m in for example well 110/9-1, and in the Calder and Morecambe fields where it is present in, for example, well 110/2a-8 (Jackson et al., 1987, 1997).
4.7.2 Effects of brine exploitation on the features developed at wet rockhead
The earliest exploitation of brine was from springs occurring where natural seepages reached the surface either within or outwith the saltfield. This had no effect upon the natural regime of slow solution and subsidence, as the brine would have run to waste in the rivers. However, the discovery of plentiful saturated brine at the rockhead transformed the industry (Sherlock, 1921). This was accompanied by extensive damage from subsidence, as the ensuing large-scale pumping of the rockhead brine (referred to as ‘wild brine’) greatly accelerated the solution of the salt surface. The phenomenon is well known in the Cheshire Basin (e.g. Taylor et al., 1963; Evans et al., 1968; Earp & Taylor, 1986). This was particularly so at the points of entry of fresh water, where the established pattern of natural brine movement in the vicinity was radically modified (e.g. Ward, 1900, pp. 246 – 247; Earp & Taylor, 1986) and where subsidence has created depressions, craters, and often linear features. The latter were known as ‘brine-runs’ by the early brine miners (Howell, 1984; Cooper, 2002) and are channels, cut in the salt surface by fresh water that replaced the extracted saturated brine. Crater subsidences (Evans et al., 1968, p. 145) tend to form in regions of thick Quaternary sands and their formation can be sudden and unexpected, resembling the ‘crowning-in’ of flooded salt mines at Northwich (Earp & Taylor. 1986). Repeated enlargements of the craters can occur, which fill with water and empty at each collapse. Examples are described from northwest of Winsford, occurring in a well-defined linear belt related to an underlying fault that may have also enhanced the amount of water entering the system. The volume of sand that had subsided must have exceeded 50 000 m3, indicating the size of the solution cavity at rockhead into which the waterlogged sands flowed. Evidence of direct
57

hydraulic connections between points along the brine-run is given by the simultaneous upward eruption of brine at one point along the belt with a new and sudden collapse half a mile upstream.
Examples of the linear features in the Cheshire Basin show maximum depths that average around 7.5 m to 10 m, with an overall width generally around 65 m to 75 m. They commonly exhibit a central flat-bottomed trough some 18 m to 22 m wide (Evans et al., 1968). They can form branching networks that are widened and deepened some distance away from the pumping stations, where the fresher water first came into contact with the salt and dissolution was most rapid and extensive (Evans et al., 1968; Earp & Taylor, 1986). Evidence in the Cheshire Basin is that some of these features show a strong linearity following the direction of strike and may, therefore, correspond to the subcrops of individual salt members at the ‘wet’ rockhead. The marl partings at rockhead are likely to form more resistant ‘interfluves’ between the dissolving edges of the salt layers (Earp & Taylor, 1986). Linear hollows may also follow fault-lines as shown by a group closely paralleling the King Street Fault between Warmingham and Crewe (Evans et al., 1968). The marls overlying the linear channel features collapsed, allowing more water to pass down and so intensified the cutting of channels and subsidence. Consequently, subsidence was not always close to the points of abstraction and often many kilometers away, such that the most distant parts of the induced brine streams are subjected to and exhibit the most active subsidence (Earp & Taylor, 1986).
4.7.3 Subsidence associated with salt mining activities and unrelated to wet rockhead
conditions
Subsidence associated with the extraction of brine unrelated to wet rockhead conditions can be significant and require costly remedial work. This was the case in Cheshire where brine was pumped from shallow mines that had flooded. This, in turn, led to the solution of roof pillars, catastrophic subsidence and damage at the surface. Natural brine pumping also led to unpredictable subsidence some kilometres from the point of extraction. Damage caused by this method of extraction led to the cessation of salt extraction in Worcestershire and Staffordshire in the early 1970s. Remedial work to infill and stabilise the flooded salt mines beneath Northwich has recently started and similar work is planned in the Worcestershire and Staffordshire areas (BGS, 2006a).
There are also examples of major collapse hollows and deep craters associated with old ICI brine wells and caverns in the Preesall saltfield (section 8.7.2.1.1; Fig. 5b; Jackson, 2005; refer also Wilson & Evans, 1990). The topic of problems of subsidence in saltfields not related to wet rockhead or linked to gas storage is of particular interest when assessing the potential risks posed to existing or future infrastructure (gas pipelines, compressor stations etc.) in areas under consideration for gas storage in salt caverns and is outlined further in section 8.7.2 (Fig. 5b-d).
58

5 Underground Gas Storage and areas most likely fordevelopment in Britain (including Northern Ireland)
In the light of Chapter 2 having described the main storage types, this chapter provides a brief review of the areas most likely to be considered for the development of UGS facilities onshore in Britain. UGS is only possible in certain geological strata or structures and these are present in a limited number of locations onshore in the UK. This section, therefore, briefly outlines the main hydrocarbon bearing/producing and salt bearing sedimentary basins, with a list of current operational gas storage facilities and applications to develop UGS (refer Table 1). Further details can be found in the BGS Salt and Oil & Gas factsheets (BGS, 2006a&b; http://www.mineralsuk.com/britmin/mpfsalt.pdf and http://www.mineralsuk.com/britmin/mpfoil _gas.pdf).
5.1 INTRODUCTION
There are a number of underground gas storage facilities currently operational or planned in the UK (refer Fig. 1), brief descriptions of each being provided in Appendix 3. In the UK, three quite different potential underground storage scenarios exist:
1. Pore storage – in depleted (or depleting) oil and gas reservoirs, involving injection of gas into the pore spaces of rocks that contained the oil or gas and formed the oil/gasfield
2. Construction of large voids either in:
a. salt caverns within
i. (thick) bedded salt sequences onshore Britain
ii. salt domes (offshore in southern North Sea or East Irish Sea) –not dealt with in this report
b. caverns/cavities in competent lithologies – not a option currently being investigated in the UK for natural gas, although the LPG storage caverns in the Chalk at Killingholme in N Lincolnshire show the success and potential of such facilities. However, compressed air storage in caverns might be possible and linked to renewable energy sources such as wind. Potential storage space could therefore be created in salt caverns (see 2 above)
3. Aquifer storage (pore storage similar to depleted oil/gasfields), but in structures that have not previously held hydrocarbons (either in commercial quantities or any at all).
Any development of aquifer storage will involve techniques similar to those in finding and developing oil/gasfields with the added requirement that additional work is required to prove the existence and performance of a caprock. However, the pressure on aquifers for supply of drinking water and the potential for contamination may make this option unlikely and is thus not considered as an option at this stage of the investigation for UK facilities
5.2 OIL AND GASFIELDS
Evidence of oil, both at surface and in mines and boreholes, are known in many areas of Britain. However, oil and gas have only been discovered and produced in commercial quantities from specific sedimentary basins onshore, where the required reservoir, caprock and, importantly, mature source rocks were deposited and where trapping structures now exist (Fig. 4a). Large areas of the UK are not prospective for oil and gas due to the absence or lack of one or more of
59

these features. The productive basins have been explored for about 100 years and are now at a mature stage of exploration. Nevertheless, they continue to attract interest and large areas are licensed for exploration (Fig. 12). With improving exploration technology modest onshore discoveries continue to be made.
The age of mature source and reservoir rocks, and the type of hydrocarbons found (oil or gas) varies, the most productive defining a number of ‘provinces’ or producing areas (Table 5). Many of these provinces are not wholly onshore with, for example, the Wessex and Weald basins extending offshore into the English Channel. Similarly, the West Lancashire Basin is the eastern, onshore margin of the more extensive East Irish Sea Basin, and the East Midlands Oil Province and Cleveland Basin link to the Southern North Sea Gas Basin. In Northern Ireland prospective Carboniferous and Permo-Triassic sequences occur beneath the Antrim basalts in the north east of the province. Exploration continues but no commercial discoveries have, to date, been made.
5.2.1 Midland Valley of Scotland
In 1937, Anglo American discovered the small Midlothian oilfield, which only produced small amounts for a few years that were refined at Purfleet in Essex. Within a few months, D’Arcy Exploration, the forerunner of BP, made a gas discovery at Cousland along the same structural trend as Dalkeith. BP later returned to the site and for a time produced gas for local use.
5.2.2 North West England
The Formby Oilfield, about 17 km NNW of Liverpool, was discovered by D’Arcy Exploration in the Spring of 1939. The occurrence of oil had long been known in the vicinity, but the oilfield proved difficult to locate, being sealed by superficial deposits. The oilfield, which probably results from seepage of oil from a deeper accumulation, produced almost 72,000 barrels of oil before being shut down in 1965. Elsewhere, the only other success in the region was the discovery by British Gas about 10 km east of Blackpool in 1990 of the still operational Elswick Gasfield.
5.2.3 East Midlands Oil Province – Carboniferous play
The East Midland oil province comprises a series of major Carboniferous rift basins, within which sequences containing important source and reservoir rocks were deposited during Namurian and Westphalian (late Carboniferous) times. Early exploration led to the oil discovery at Kelham in the 1920s, after which exploration continued into the 1930s as the need to ensure oil supplies during the Second World War grew. In June 1939, BP discovered the Eakring oilfield about 23 km NE of Nottingham, confirming the East Midlands as a major oil province. However, wartime censorship meant that no announcement was made until September 1944.
Historically, the East Midlands province, comprising Lincolnshire, Nottinghamshire and the northern part of Leicestershire, has been one of the most prospective areas for onshore oil and gas in Britain. It is an area that has been subjected to only minor folding or tilting and faulting in post-Mesozoic times, such that hydrocarbon accumulations emplaced in post-Carboniferous times have not been greatly disturbed.
Since the Eakring discovery in 1939, many further important discoveries have been and continue to be made, including Gainsborough/Beckingham, Welton, Saltfleetby and Keddington. However, many of the older fields such as Eakring, Bothamsall, Egmanton and Kelham Hills are now shut down due to exhaustion of recoverable reserves and increasing water production. One or two oil discoveries have yet to be developed, including those of Broughton and Brigg. The current trend is for small focussed operators to identify smaller satellite structures to the main producing fields.
60

Consequently large parts of the East Midlands have been and are currently licensed. Cumulative output of oil in the East Midlands is in excess of 6 million tonnes with the cumulative output from individual fields being in the range from a few thousand tonnes up to about 2 million tonnes.
5.2.3.1 ENHANCED OIL RECOVERY (EOR) OPERATIONS IN THE EAST MIDLANDS OIL PROVINCE
Two notable onshore UK pilot demonstration EOR injection projects, overseen by BP Petroleum Development Ltd in the early 1980s, are known in the East Midlands oilfield region and may ultimately have relevance to gas storage operations. They are notable for the reason of injection of CO2 and might provide useful background (in terms of the success or [reasons for] failure of individual processes) to any proposed schemes at these or closely related oilfields in the area.
A CO2 miscible flooding project was undertaken at the Egmanton Oilfield in Nottinghamshire (Bradley et al., 1982; Grist et al., 1982; Bardon et al., 1983). The project was eventually terminated in 1983 on the grounds of prohibitive costs and the low injectivity of the formation having extended the project framework beyond the planned schedule. In a second project, surfactant flooding was conducted in the Bothamsall oilfield (Grist et al., 1982; Cooper et al., 1985), in order to assess the feasibility of using low concentration surfactant to release oil held in the formation by capillary forces (refer Fig. 4c). Although practical experience was gained in the handling of such surfactants, no marked response was detected at the producing wells to enable clear conclusions to be made regarding the effectiveness of the process.
5.2.3.2 WESTPHALIAN SANDBODY DIMENSIONS OF THE SOUTHERN NORTH SEA, EASTERN AND
NORTHERN ENGLAND
Silesian (Namurian and Westphalian) sandstone and channel sandstone abundance and dimensions show systematic changes across the East Midlands, NE England and Southern North Sea (SNS), with sediment delivered to the basin from more than one direction (see Collinson et al., 1993). This is especially so in sequences of late Namurian and Westphalian A and B age, which form the major oil reservoirs of the East Midlands oil province. Depleting oil and gasfields in this region are being considered for conversion to gas storage facilities (refer Appendix 3) and a brief summary of their environment of deposition and dimensions is perhaps of use, providing background to reservoir characteristics input to modelling gas storage reservoirs (Figs 13&14).
The following is a brief review with more detail and provided in Appendix 7 following the review of different East Midlands oilfields. The East Midlands oil province lies within a major depositional basin: the Pennine Basin. This major depositional area existed in Britain during Dinantian and Silesian (Namurian and Westphalian) times and formed as a result of major crustal rifting processes. It lay to the north of the Wales–Brabant Massif and extended northwards towards the Southern Uplands of Scotland (Guion & Fielding, 1988; Collinson, 1988; Martinsen et al., 1995) and was gradually filled by enormous volumes of siliciclastic sediment (sandstones, conglomerates, siltstones, mudstones) and coals, which now form the Westphalian Coal Measures.
Within the Pennine Basin a number of smaller sub basins were formed and in which accumulated important source and reservoir rocks in central and northern England. The main reservoir rocks are of Silesian age, which onshore in the UK during Westphalian times, were in general, deposited across virtually the entire basin in a broad flat delta plain environment (see e.g. Fielding, 1984). Sediment patterns indicate that the sediment was introduced to the onshore UK coalfield areas from a northerly source through quite a narrow major channel feeder route located in the region of the present day Humber (Collinson et al., 1993). Some sediment was locally derived and supplied to the basin from the London Brabant Massif to the south in a narrow strip along the southern margin of the basin and the East Midland province. Within this
61

area of deposition, various Westphalian channel sizes are recognised and summarised in Fielding (1984), Guion et al. (1995) and Aitken et al. (1999):
• proximal/lacustrine delta – 1-10 km wide with lobate to sheet-like deposits generally < 8 m thick.
• Major channels – 10’s kilometres long, 1-20 km wide and typically 8-20 m thick
• Minor channels – up to 10 kilometre long, 10-1 km wide and typically 1-8 m thick
• Overbank deposits – elongate belts parallel to channels. Dimensions depend upon channel sizes, typically 1-8 m thick and 10’s m wide
• Crevasse splay – minor delta developments along main channel resulting from overbank flow. Circa 1 km wide and 0-1 m thick, thinning away from channel centre
A relationship exists between channel width and thickness (Figs 13&14), with the maximum width being around 30 km and maximum thickness being around 50 m (but up to 100 m where sandbodies are amalgamated). Additionally, the data indicate that 90% of channel sandbodies are less than 25 km wide, less than 40 m thick and generally, reservoir intervals greater than 30 m will extend for more than 10 km perpendicular to the palaeoflow direction (Aitken et al., 1999). There is also a 35% probability of penetrating a relatively poor reservoir zone within the main channel belt, due to fine-grained horizons. These are interpreted to be partial abandonment channel reaches. By their nature and origin, these are difficult to correlate and may form potential baffles of up to several hundred metres in extent within the channel sandstone reservoirs.
5.2.4 Wessex-Channel (including the Weald) Basin
This prospective basin covers the Weald and Wessex areas in southern Britain, across which, oil and gas occurrences have long been known. Prospective sequences also extend offshore beneath the English Channel. A number of oil seeps have been documented inland, but most occur along the Dorset coast, from near Osmington in Weymouth Bay to Durlston Head (Selley, 1992 and Chapter 3). They include the famous Mupe Bay oil seep and the occurrences of gas bubbling on the seabed between Durlston Head and Anvil Point. Many oil and gas seepages are also known from East Sussex, the first discovery of which was in a water well being excavated in 1836. Similar discoveries led to the formation of a company in 1902 to develop and supply the gas to local markets at Heathfield, Polegate and Eastbourne (refer Chapter 3).
These oil and gas seepages and occurrences provided the early impetus for exploration in the area. Though results were initially disappointing, it did lead to the discovery of the Kimmeridge oilfield in 1959, which is still producing today. Exploration has been ongoing since then and in the early 1970s led to the discovery of the giant Wytch Farm oilfield. Production from this field has dominated onshore oil output. Ten other oil and gasfields have subsequently been discovered in the Wessex-Channel Basin and many are now depleting. One depleting oilfield has been developed as a gas storage facility (Humbly Grove - refer Appendix 3), whilst others (e.g. Albury and Storrington), being currently considered for conversion to underground gas storage.
5.2.5 North East England (including the Cleveland Basin)
In 1937 BP and ICI drilled at Eskdale and tested gas from the Permian Upper Magnesian Limestone. The field was developed in 1960 and the gas fed into the town gas system in the Whitby area until it was shut down in 1967. Subsequently, a number of other gasfields have been discovered along an E-W structural trend. The gas originates from Carboniferous (Westphalian) Coal Measures and has been trapped in fractured Permian limestones to create the now closed Eskdale and Lockton gasfields and the still producing Malton, Kirby Misperton, Marishes and Pickering gasfields.
62

5.3 SALT BASINS
Salt (halite; sodium chloride, NaCl) is found in nature as solid rock salt (halite) or in solution as brine. The UK possesses important halite deposits, many of which were discovered during the search for coal in the late 1800s. Rock salt occurs in beds varying from a few centimetres to tens of metres in thickness, commonly associated with thin interbeds of mudstone, anhydrite and/or other evaporitic minerals. Individual salt beds and salt-dominated sequences may be hundreds of metres thick providing Britain with huge reserves of salt that is found in a number of areas and of differing ages (Fig. 1. Refer also to Mineral Planning Factsheet; BGS, 2006a [http://www.mineralsuk.com/britmin/mpfsalt.pdf]; Evans & Holloway, in press). There is no development of halokinetic structures in onshore UK salt basins, although some minor thickening of salt is noted into the core of the Weymouth Anticline, which might be related to early stages of salt movement during tectonism (section 11.2.7).
The most laterally extensive halite-bearing strata are of Permian age and lie concealed at depth beneath much of eastern England, from Teesside southwards through Yorkshire into northern Lincolnshire (Fig. 1). The halite beds form part of the Zechstein Group, which onshore represent the western margins of a large salt basin (the Zechstein Basin) that extended across the southern North Sea into Germany and Poland (refer Taylor, 1986; Ziegler, 1990) Within the Zechstein Group, halite formations are interbedded with thick dolomite, mudstone and anhydrite formations in five cycles (Z1-Z5). Each cycle represents a flooding of the southern Permian Basin from the north, followed by evaporation and drying out of the basin (Cameron et al., 1992). The halite beds thin rapidly westwards, but thicken and deepen to the east and south. The halite beds are east of the eastern limit of the predominantly carbonate sequence that lies along a roughly north-south line through central Yorkshire. These salt deposits have been exploited in two areas, referred to here as the Yorkshire and Teesside provinces.
Important rock salt deposits of Triassic age occur in NE England, NW England and the Cheshire, Stafford, Worcester, Somerset and Wessex basins (Fig. 1). The Triassic Mercia Mudstone Group (Mercia Mudstone Group) comprises a succession of mainly interbedded red-brown siltstone and mudstone, with gypsum or anhydrite and, in places, halite. Mercia Mudstone Group strata extend eastwards from Northern Ireland, across England and continue, with different lithostratigraphical nomenclature, beneath the North Sea, the Netherlands, central Germany and Poland. They represent ancient desert sediments deposited in a semi-arid environment consisting mainly of flat, low-lying plains, which were frequently flooded by seawater. At the time of deposition there was significant differential subsidence in this vast area and the main Triassic salt deposits onshore arise from individual basins that subsided more rapidly than surrounding areas, producing thicker and cleaner halite deposits than found on the basin margins.
Further salt deposits of Permian and most significantly, Triassic age, are found in Northern Ireland (Fig. 1), as proved in the Larne No.1 and No.2 boreholes (Manning & Wilson, 1975; Penn, 1982; Mitchell, 2004; Evans et al., 2006). In these areas, interest is being shown in developing salt cavern storage facilities in these salts. Three main salts totalling around 300 m in thickness are of Triassic age and lateral equivalents have been mined by both pillar and stall and solution mining methods to the south in the Carrickfergus and Eden areas. A Permian salt bed 113 m thick near the top of the Permian succession has also been proved by the Larne No. 2 Borehole. However the extent of the Permian salt is poorly constrained having only been proved in the area of South and East Antrim, although it is known to be absent towards the southern edge of the Larne Basin as proved by the Newmill Borehole (Evans et al., 2006).
5.3.1 Non-halite interbeds in UK salt basins
The thickness and relative purity of the UK salt beds can initially be relatively rapidly assessed from geophysical well logs, examples of which are described from the major salt-bearing formations in Britain by Evans & Holloway (in press). The geophysical logs all reveal the
63

presence of generally thin non-halite interbeds within the Triassic salts. Of the main halite sequences that are likely to be suitable for gas storage (and which have undergone tests for this purpose), the Northwich Halite in the Cheshire Basin, the Preesall Halite in the Fylde area of NW England and the Dorset Halite succession in southern Britain all contain non-halite interbeds (Appendix 7, refer also Figs 54-57).
In the Cheshire Basin, the Northwich Halite contains non-halite interbeds that are generally on the metre scale and are more frequent in the upper half of the formation, but includes the ‘Thirty Foot Marl’ in the lower third of the succession (refer Figs 54&55). The Portland No. 1 well drilled in 2006 (Egdon, 2006a) reveals mudstone interbeds increase in number towards the base of the Dorset saliferous beds.
Two geophysically logged boreholes (one fully cored) drilled through the Preesall Halite during early 2004 for the Preesall investigations reveal generally thin mudstone and anhydrite interbeds are present in the western unworked area of the saltfield (Ratigan, 2005; Evans et al., 2005). Three more prominent zones of salt and non-salt interbeds 5 m, 6.19 m and 6.54 m thick were encountered, with the maximum individual non-salt bed thicknesses in these zones between 1.04 m and 1.76 m (Ratigan, 2005). Gamma ray logs from the older ICI brine wells and the Canatxx wells reveal a consistent halite stratigraphy that can be traced along the western boundary of the brinefield (Evans & Holloway, in press). An abnormally thick (17.5 m) mudstone is reported in a very old shaft in the east of the saltfield. However, the thick mudstone proving is at odds with sequences in surrounding boreholes and shafts and it is suggested that the records in the area, being very old and unsatisfactory, cast doubt on the accuracy of the logged sequences for that shaft (Wilson & Evans, 1990). The present information indicates that the Preesall Halite, the lateral equivalent of the Northwich Halite of the Cheshire Basin (Warrington et al., 1980; Wilson, 1990, 1993), contains fewer thick mudstone interbeds than the other Triassic salt fields in the UK and within the saltfield, the interbeds thin westwards into the basin (Evans & Holloway, in press). The salt is equivalent to thicker halite sequences offshore containing fewer mudstone interbeds (e.g. Jackson et al., 1987, 1995; Jackson & Johnson, 1996).
5.4 AQUIFERS
As mentioned above, although aquifer storage is successfully undertaken in a number of countries including France, it is not currently perceived as an immediate prospect in the UK. This is for a number of reasons, which primarily include the higher costs associated with developing such a facility when compared to other options. However, other issues, including how such facilities might be covered by current UK legislation and regulatory bodies, would require clarification and further input from, for example, the Environment Agency and Government.
As stated, however, aquifer storage facilities exist elsewhere at for example, Spandau, beneath Berlin and at various sites around Paris. For completeness, therefore, the likely areas in the UK that might in future be regarded as having potential are indicated in Figure 15. The figure shows the main aquifers at outcrop in the UK and the reader is referred to Allen et al. (1997) for further details on UK aquifers.
5.5 PREVIOUS INVESTIGATIONS INTO STORING GAS IN POROUS STRATA IN
THE UK ONSHORE AREA
In the early 1960s, the Gas Council’s London Research Station had begun exploring the possibilities at a number of onshore sites for the development and control of underground (town) gas storage in Great Britain (Johnson, 1962; Holloway et al., 2006). The plan was to identify geological structures with porous formations, which could be safely used to store town gas and initially was targeted at the Lower Greensand (Cretaceous age) in both the Winchester Anticline in Hampshire and the Cliffe Anticline on the borders of Essex and Kent. The vast majority of
64

sites were located outwith the main sedimentary and oil and gas producing basins, being on the London-Brabant Platform: an area of relatively shallow Variscan basement. All structures eventually tested were initially identified on gravimetric anomalies and drilled to establish the structural high. However, not all the wells reached the intended reservoir, as the purpose was to drill quickly and to establish the structure. A systematic search in the Midlands followed in an area SE of Birmingham between the towns of Cheltenham, Warwick, Northampton and Banbury. This lay near national pipelines but away from urban development. The Triassic Keuper Sandstone (now known as the Bromsgrove Sandstone), which pinches out at depth to the SE against the London Platform, was identified as the most likely reservoir horizon. Overlying Mercia Mudstone Group strata provided the seal.
Exploration ceased during the mid 1960s due to imports of LNG from Algeria and the gas discoveries in the North Sea. The location of the geological structures investigated is shown in Figure 1, brief descriptions of which follow.
5.5.1 Winchester Anticline
The Winchester Anticline in Hampshire was first drilled by the Gas Council (GC) and BP’s joint venture to explore for gas, in 1959. The first of five deep wells reached the Lias (TD5 at 1781m bgl) and the subsequent wells were terminated in the Purbeck-Wealden (TDs about 600m). The GC returned in 1962 to drill 30 wells to appraise the potential for gas storage. Several of these wells were drilled through the Chalk and Upper Greensand into the Gault.
5.5.2 Cliffe Anticline
In 1959, a series of 10 wells was drilled and geophysically logged by BP and Schlumberger on behalf of the GC, on the Cliffe Anticline, which crosses the Thames from Tilbury Marshes in Essex to Cliffe in Kent. Chalk crops out in the core of this anticline. Two of the wells were sites on the Essex coast and two were farther south. All wells penetrated the Lower Greensand, which was probably the target storage reservoir with the Gault appearing to offer potential as a cap rock (Johnson 1962). The southern two boreholes reached strata of probable Devonian age. These wells were part of the gas storage programme (Johnson 1962; p158) although they were drilled before it officially started in 1960.
Another shallower series of 20 wells was drilled and geophysically logged in 1961. Four of these are located on the Essex shore, although no geological reports exist for these boreholes. The majority of these wells terminated in the Lower Chalk and it is thought the location had not been completely investigated (Johnson, 1962).
5.5.3 Napton
Eight shallow wells were drilled at Napton in 1961. The area was considered unfavourable due to faulting (Johnson 1962).
5.5.4 Stow
About 31 wells were drilled near Stow-on-the-Wold, to appraise the potential for gas storage, in 1961. The target is assumed to have been the Keuper Sandstone. Not all the wells reached the Keuper Sandstone, which in this area, lies at about 100m below sea level.
5 TD = terminal depth (final depth) of the borehole
65

5.5.5 Chipping Norton
During 1962, 340 wells were drilled over a large area near Chipping Norton, with the aim of ‘structure proving for gas storage’. Cores were taken in the Keuper (Bromsgrove) Sandstone and in the Upper Coal Measures in GCN 1 well and it is, therefore, assumed these were the reservoir targets.
5.5.6 Brackley
Eighteen wells were drilled in 1963 in the vicinity of Brackley (NGR: SP53NE) for the purposes of ‘structure proving’ for gas storage. The wells spudded into Middle Jurassic strata and the target may have been the Keuper (Bromsgrove) Sandstone, although not many of the wells reached this stratigraphic level.
5.5.7 Huntingdon
Fourteen wells were drilled near Huntingdon in 1964. These mostly spudded into Oxford Clay and many reached Devonian and older rocks. The reservoir target was probably thin sandstones at the base of the thin Triassic sequence or basal Lias. These sandstones were not present in some of the wells because of overlap by Jurassic strata.
5.5.8 Nene
Two wells were drilled in 1964 by the GC, ‘proving underground structure’ near Raunds, Northamptonshire (NGR: SP97SE). One reached Carboniferous. The Keuper (Bromsgrove) Sandstone was the likely target reservoir.
5.5.9 Stamford
Fifty-two wells were drilled in 1964 near Stamford ‘to prove structure and sequence’.
5.5.10 Sarsden
About 10 wells were drilled near Sarsden (NGR: SP22SE) in 1965-1966, which were probably also for gas storage exploration. The intended Keuper (Bromsgrove) Sandstone is unconformable on Carboniferous strata at depths varying from 80-96m below sea level.
5.5.11 Whichford
Three wells were drilled at Whichford (NGR: SP33) ‘proving geological structure’ in 1964 and which were also part of the gas storage exploration. The intended reservoir was the Triassic Keuper (Bromsgrove) Sandstone overlying Carboniferous strata at about 150m below sea level.
5.6 CURRENT UGS FACILITIES AND APPLICATIONS IN ENGLAND
Current operational UGS facilities are in depleted oil and gas reservoirs and salt caverns onshore in England and are summarised individually in Appendix 3. They include Hatfield Moors (depleted gasfield), Humbly Grove (depleted oilfield), with salt cavern storage at Atwick/Hornsea, Holford, Hole House and at Saltholme and Wilton on Teesside (refer Fig. 1).
In addition to those operational facilities, there are a number of gas storage projects that are currently under development/construction or in the planning stage (see Fig. 1 and Table 1). The proposed facilities currently in the scoping, planning application and development stages are summarised individually in Appendix 3. Further details of the operational and proposed salt cavern storage sites may also be found in Evans & Holloway (in press).
66

As alluded to in the introduction to the report, most UGS applications in the UK are faced with strong local opposition and generally become involved in lengthy public inquiries. A major shift was, however, noted during the application to develop a salt cavern facility at Stublach in Cheshire (refer Appendix 3). A further important development in the planning applications for UGS facilities has been the move by Star Energy in late 2006. Having experienced what the Company believed to be unreasonable delays to its planning applications, in October 2006 the Company announced its intention to use the 1965 Gas Act for all of its UK onshore gas storage applications (Star Energy, 2006). The Company believes that the use of the 1965 Gas Act will provide a more certain timeline and cost for future gas storage planning applications, and to this end the Company anticipates submitting planning applications under the Gas Act in the first half of 2007 for Welton and Albury Phase 1, and for Gainsborough in the second half of 2007.
In addition, there are three schemes offshore in the East Irish Sea and Southern North Sea worthy of note at this stage:
• Kinsale Area Gasfields, offshore Ireland - the Kinsale Area gasfields are located off Cork in the south of Ireland. They comprise the Kinsale Head, Southwest Kinsale and Ballycotton Gas Fields and are owned and operated by Marathon. The Kinsale Head Gasfield was discovered in the Lower Cretaceous Greensand in 1971 and started production in 1978. The field is produced through two platforms, Alpha and Bravo, with Bravo production routed through the Alpha platform, co-mingled with the Alpha production and exported via a 24 inch pipeline to the onshore distribution system.
However, the gasfield depleted and following preparatory work in 2000, the Kinsale Gasfield became Ireland’s first seasonal production facility in 2001, when the southwest lobe of the Kinsale Field was converted for gas storage. The depleting reservoir is recharged during the summer months, with gas re-produced and delivered to the market in the winter months, when demand is higher.
• The ‘Gateway Gas Storage Project’ is a proposal to develop natural gas storage caverns at a depth of around 550 m below mean sea level (msl) in the thick Triassic halite offshore in the East Irish Sea Basin, approximately 30 km offshore to the SW of Barrow (Stag Energy, 2006, 2007). This proposal followed an announcement by the Secretary of State for Trade and Industry that, following a review to the DTI that concluded salt deposits suitable for gas storage development were present in the East Irish Sea and southern North Sea (Smith et al., 2005). The UK Government is keen to pursue the potential to develop such offshore sites to complement the requirement for gas infrastructure (DTI, 2006g).
• In December 2006, EnCore Oil plc announced that a subsidiary, Virgo Energy Limited (“Virgo”), had entered into an agreement with Star Energy Group plc (“Star Energy”) for Star Energy to farm into Virgo’s UKCS Block 43/8 Forbes field (Southern North Sea). As part of the deal Star Energy will undertake a feasibility study and a 3D seismic survey to determine the potential to use the Forbes field as a gas storage facility.
Developed initially by Hamilton Oil, the original gas in place was in the order of 100 bcf (2.8 Bcm) and the field produced approximately 48 bcf (1.36 Bcm) of gas, via a tie-back to the Esmond field, prior to abandonment. Preliminary studies undertaken by Star Energy indicate the field has potential for development as a high performance gas store with up to 50 bcf (1.42 Bcm) of working gas capacity. Importantly, the field has a reservoir of high quality, has cushion gas in place and is close to major infrastructure. Under the terms of the farm out agreement, Star Energy will undertake a feasibility studies and assign 50% of its interests in the Eskdale (PEDL 002) onshore licence to Virgo. The farm out agreement allows Star Energy to earn up to 50% of the Forbes licence and to become operator if the field is developed into a gas storage facility.
67

6 Faults, faulting and fractures in salt sequences and UK seismicity
This report clearly focuses on the concepts and geology of underground gas storage and problems that have arisen (or could arise) at UGS facilities. Faults and their movement histories are key controlling elements in fluid flow systems in sedimentary basins. To many, the presence of faults is seen as detrimental to a system that may be used to store injected gas. In terms of the safety and the gas tightness of any proposed storage site, faults could provide pathways to the surface for any gas held in storage or that has escaped from storage to an intermediate level intersected by faulting. However, faults do not necessarily reduce the effectiveness of a structure to retain oil and gas. Indeed, many oil and gasfields around the world have highly fractured or faulted reservoirs with closure and seal provided by one or more faults. Examples exist in oil/gasfields both offshore in the northern North Sea, where of the 250 or so hydrocarbon finds, 70% are in fault block traps (Spencer & Larsen, 1993), and onshore in the UK. The latter include Wytch Farm (the largest onshore field in Europe; Bowman et al., 1993; Hogg et al., 1999; Katterhorn & Pollard, 2001), Humbly Grove-Herriard oilfield (already a gas storage facility; Hancock & Mithern, 1987; Trueman, 2003; Star Energy, 2006) and the Saltfleetby Gasfield (Hodge, 2003; already a proposed site for gas storage).
The differing role of faults in the development of oil and gasfields is illustrated in the Wessex-Weald Basin in southern England. Oil migration from the main ‘kitchen area’ offshore in the Channel Basin into reservoirs in tilted fault blocks to the north of the Purbeck-Isle of Wight fault system requires that the faults acted as migration pathways. These must have been sealed over by the Upper Cretaceous at the time of maximum migration to prevent escape to the surface. The faults subsequently became sealing, perhaps due to the onset of compression during the ‘Tertiary’ basin inversion phase (e.g. Selley & Stoneley, 1987; Underhill & Stoneley, 1998). Clearly, the fact that these structures onshore the UK contain commercial accumulations of hydrocarbons attests to the fact that the faulting present has not prevented their retention over significant periods (millions of years) of geological time (section 3.1).
Determining the presence and sealing potential of faults or fractures in the sequences in which it is proposed to store gas, including the deformation of halite beds, is therefore of clear importance. Many factors have to be taken into account when assessing the sealing or leaking capacity of faults and fault systems and the gas tightness of the storage environment. This process includes modelling and assessing the performance and behaviour of faults under differing conditions. In depleting oil or gasfields this would include modelling the increase and cycling of pressure back up to original reservoir pressures and the impact this inflation would have on any faulted reservoir or caprock sequence. In salt caverns, it would also include modelling the presence of faulting in sequences enclosing the halite beds and the effect of cavern formation and gas injection to the stability of the fault.
Faults, associated rocks and seismic effects cover a huge range of topics and this section does not attempt to deal with them in detail. Rather it intends to provide some essential terminology and background to the processes that will be undertaken in order to assess faulting (and its consequences) in the sense of its importance to gas storage. If required, sources of information for further reading are indicated. It is also pertinent to review seismicity related to UK faults and its bearing on the safety of any such facilities developed.
68

6.1 FAULTS, FAULT TERMINOLOGY, SEALING POTENTIAL AND FAULTING
OF SEQUENCES CONTAINING HALITE
This section briefly outlines fault terminology and aims to aid understanding of the nature of deformation of halite in nature. In reading it, reference should be made to section 6.1 and the glossary, which includes a cartoon sketch diagram to illustrate faulting of strata and terminology.
6.1.1 Terminology
A ‘fault’ is defined as a fracture in rock, along which there has been a measurable amount of displacement. Faults are rarely simple planar units, but normally occur as a series of parallel or subparallel faults (forming an anastomosing network) along which movement has taken place to a greater or lesser extent and forming a fault or fracture zone. Only when a fault intersects the earth’s surface do we see a major downstep across the fault (rupture) and the ‘creation of space’. Faults may have had some movement during deposition, but have generally also moved after the sediments were deposited and rock layers (‘beds’) formed.
In the subsurface, therefore, movement on a fault surface displaces the stratigraphical units of the hanging-wall (downthrown fault block) relative to the footwall (upthrown fault block) past each other along the fault plane (Fig. 16 & Glossary). In the absence of any entrained material within the fault zone, if displacement on the fault juxtaposes impermeable units (e.g. shales; seals) against permeable (e.g. sandstones; potential reservoir) units, then this can seal faults to cross-fault hydrocarbon flow and hence control hydrocarbon trapping (Allan, 1989; Clarke et al.). Fault seal and juxtaposition of lithologies is discussed in more detail in section 6.1.2.
Although a fault can be a thin clean break between two rock masses (hanging and footwall fault blocks), during the process of faulting the rocks are commonly broken up to a greater or lesser extent, forming a zone of damaged strata along the fault. Such processes that operate within the fault zone during deformation are collectively referred to as fault-zone processes. As alluded to above, they can generate a gouge of material between faulted blocks referred to as fault rock or fault-related rock (Peacock et al., 2000). Such material can have lithological and petrophysical properties very different from those of the faulted blocks between which it resides and hence act as a further influence on the migration of hydrocarbons between faulted blocks. Dependent upon the hardness of the rocks and the depth of the faulting, various fault rocks are produced. At shallower levels (the brittle zone, where faulting results in seismic shearing), hard rocks are crushed and broken (cataclasis). The process forms fault breccias comprising angular fragments of varying size. Continued or more intense fault movement, perhaps with the entry of fluids into the fault zone, may further reduce the size of the rock fragments to rock flour or fault gouge. Shales, mudstones and clays will, due partly to the phyllosilicate minerals present, tend to deform more plastically, being drawn out and smeared along the fault during faulting. These minerals also more readily undergo recrystallisation during deformation, enhancing the plastic deformation of shales/mudstones/clays (section 6.1.2.1 below). At greater depths the rocks will deform by aseismic shearing (crystal plastic deformation processes) such that the rocks do not fracture, but develop in (wider) ductile shear zones (producing, for example, mylonites). The depths at which the brittle-ductile transition takes place are temperature, pressure and strain rate dependent but would typically be from c. 15 km depth (refer Sibson, 1977).
Most fault zones comprise a series of anastomosing faults, forming a branching network of intersecting faults. Modelling and observation of intersecting faults indicates the development of strongly dilational zones in the vicinity of fault intersections (Sanderson & Zhang, 1999; Zhang & Sanderson, 2001; Gartrell et al., 2004). These studies reveal that relatively large fracture apertures, and hence highly localised and enhanced fluid flow, can develop at intersections in fracture systems (McKenzie & Morgan, 1969; Andrews, 1989). Lithostatic pressure at depth in the Earth’s crust will resist voids opening so that finite deformation is likely to be accommodated on a fractal array of faults and fractures around the intersection of faults and fractures (King, 1983; Andrews, 1989). This introduces further potential for fractures and aperture connectivity
69

that must be assessed and taken into account and is only possible with the development of a well-constrained geological model.
Faults, therefore, generally have uneven rough surfaces and are associated with various rocks, resulting in the existence of small voids between the fragments and along which fluids may move. The fluids commonly precipitate (deposit) minerals (e.g. clay minerals, quartz or calcite) along the fault, which often leads to the cementation of the fault zone and closure of (or reduction in the size and connectivity of) the network of interconnected voids. Dependent upon the main mineral deposited along the fault plane, the cemented fault rock may be harder or softer than the enclosing unfaulted rock and thus be stronger or weaker respectively. Fault zones can, therefore, form fluid conduits if connected open fracture networks are present within a rock mass. The highest fluid flux potential will occur where and when fracture apertures, density and connectivity are greatest (Sibson, 1996; Cox et al., 2001). Alternatively, fault zones can form fluid barriers where the impermeable fault gouge forms during the shearing process (e.g. shale gouge, shale smear) or as a result of post deformational cementation (e.g. Knipe, 1992; Sibson, 1996).
The evolution of the fault and cement material can also be a complex process that occurs over considerable periods of geological time, with many fault zones showing evidence of more than one period of activity and cementation. It is known that some of the major basin-controlling faults in the UK have suffered repeated reactivation both in extension and compression (Chadwick, 1986, 1993; Chadwick & Evans, 2005). However, as described below, fault reactivation causing a direct rock rupture hazard at surface in these examples, or indeed any mapped fault at surface in the UK, is considered extremely unlikely: there is no evidence of any such faults having been active during historic times in the UK (see below).
From the above, it can be seen that fault zones will have varying degrees of porosity. This porosity, particularly at deeper levels, can be reduced by the circulation of fluids from which minerals are precipitated through processes such as seismic pumping (e.g. Sibson et al., 1975; Sibson, 1992). Alternatively, the presence of hydrocarbons in the system may help to maintain structural porosity and permeability (open fracture apertures) by restricting concentrations of hydrothermal fluids in the localised fracture system and thereby reducing the potential for mineral precipitation and fracture blockage to occur (Gartrell et al., 2004). Experiments have also shown that, in the absence of cementation, faults and fractures are very difficult to close to fluids due to natural fracture surface roughness (Gutierrez et al., 2000). In addition, partial filling of fractures by mineral cements can actually act to maintain structural permeability by holding open the fractures (e.g. Stowell et al., 2001; Gartrell et al., 2004). Fluid focussing at the fault intersection may also contribute to increased pore pressures in the fracture zone, which may enhance fracture activity.
6.1.2 Sealing or non sealing (‘leaky’) faults?
When faults undergo displacement, they change the rock volume and their own fluid transmissibility properties by:
• juxtaposing varying lithologies (and lithological properties) across the fault
• smearing impermeable/semi-impermeable fault rocks in the fault zones
• cataclastic grain-size reduction resulting from abrasion during deformation
• the development of a damage zone of smaller (sub seismic resolution) faults adjacent to the main fault which may or may not have additional, associated sealing properties
• ‘seismic pumping’ of diagenetic fluids and hydrocarbons through the system
The sealing capacity along a fault is not constant and leakage of hydrocarbons across a fault occurs when the buoyancy pressure exceeds the capillary entry pressure of the fault. This is not
70

necessarily confined to the crest of the structure or even to where the SGR value is lowest (Bretan et al., 2003). Generally, the relative cross-fault juxtaposition of potential reservoir and non-reservoir units across the fault determines fault-seal potential (e.g. Clarke et al., 2005a&b). A schematic illustration (Fig. 16) shows a cross-section of potential hydrocarbon traps (fault-blocks) resulting from normal faults that offset a sand-shale sequence. For traps represented by fault blocks and especially hangingwall traps, such as the left hand fault-block (Fig. 16), there is generally the requirement that hydrocarbons are sealed by faults against the neighbouring fault compartment (footwall block). Fault seal can arise from reservoir-non reservoir juxtaposition or development of fault rocks having high entry pressure between reservoir rocks. Potential hydrocarbon accumulations and sealing situations are classified into two main groups based on fault throw related to reservoir thickness (Fig. 16; Færseth, 2006):
• Self-separated, in which the reservoir is entirely separated from its continuation across the fault. If the reservoir is juxtaposed against shale across a fault, it results in a juxtaposition seal, which is likely to prevent leakage. If a fault juxtaposes reservoir A against reservoir B, a membrane seal along the fault is required to prevent leakage of hydrocarbons across the fault. In a fault rock, a membrane seal is a fault rock with high entry pressure (Watts, 1987b) developed as a result of shale smear, cementation or cataclasis.
• Self-juxtaposed, in which the reservoir is partially juxtaposed against itself across the fault and in which to prevent leakage, a membrane seal along the sand-sand juxtaposition is required. Reduced permeability across the fault may result from mechanical shearing with grain reorganization, grain size reduction, denser grain packing and diagenetic reactions as well as phyllosilicate smearing (e.g. Fisher & Knipe, 2001). Where a shale layer is offset by a fault with throw greater than the vertical thickness of the layer, a shale smear may be entrained into the fault zone (section 6.1.2.1). The shale that is situated stratigraphically between reservoir A and reservoir B represents a source layer with the potential to develop a smear along faults that cut the sedimentary sequence. If the smear forms a continuous and impermeable membrane, the smear can separate the two reservoir units in the footwall and hanging wall blocks that have been juxtaposed (Fig. 16 inset) and that, in the absence of shale smear, would be expected to be hydraulically connected across the fault surface.
Initially an analysis of the lithological juxtapositions (or the petrophysical properties of the lithologies) across a fault surface can be used to determine sealing capacity to cross-fault migration resulting from fault-block juxtaposition alone. However, a complex fault zone will have exhibited varying transmissibility values in three dimensions which will have changed with displacement through time. The understanding of fault seal generation is crucial, therefore, to the assessment of the migration and trapping of hydrocarbons and thus the role of faults in gas storage. The effectiveness of the seal depends upon the porosity and permeability characteristics of the fault zone, which are controlled by the microfabrics present, themselves controlled by a range of processes. Three broad classes of seal may be recognised (Knipe, 1992):
• collapse seals, where the permeability/porosity of the fault zone is reduced by pore volume decrease achieved by grain reorganisation produced by fracturing, grain deformation and dissolution and by grain boundary sliding
• cement seals, where the reduced flow across a fault is achieved by the precipitation of cementing minerals in and adjacent to the fault
• juxtaposition seals, generated by the coming together of lithologies with different sealing capacities. Juxtaposition relationships are inferred from the fault plane profiles. The nature of the fault gouge or fault rock developed is an important factor in controlling fault sealing capacity. This is partly assessed by quantitative fault seal analysis, which estimates the sand/shale composition of the gouge and empirically relates seal and gouge composition: sand-rich gouges tend to leak, shale-rich gouges tend to seal. As in the
71
scenario of caprocks (section 3.4), the entry pressures of the fault gouge and fault zone determine the effective sealing potential of the fault (membrane seal – see below).
6.1.2.1 FAULT ZONE PROCESSES – DEVELOPMENT OF SHALE GOUGE (SHALE GOUGE RATIOS; SGR)
As previously mentioned, there are many examples of faulted, hydrocarbon-bearing, sedimentary basins in which faults can seal hydrocarbons even in the presence of juxtaposed reservoir units. In these cases, fault seal is the result of one or a number of geological processes that operate within the fault zone (Clarke et al., 2005a&b).
Faulting of a major shale unit may also lead to argillaceous (shale) smearing to the development of ‘shale smear’. During faulting, shale deforms in a rather more ductile manner, being drawn out (and recrystallising) along the fault leading to the entrainment of clay-rich lithologies into the fault zone. This contributes to the development of a low permeability fault gouge that can act as a barrier to fluid flow, preventing leakage of hydrocarbons across or along faults (Fig 16). It is the primary example of a fault-zone process that contributes to fault-seal potential. Were normal faults offset sand-shale sequences, shale smear along faults is commonly invoked in hydrocarbon exploration as a likely membrane seal, assumed to prevent leakage across large faults and thereby to seal potential traps. This clearly occurs in many North Sea fields. It is also known that rock types other than shale, such as coal, siltstones and carbonates, may smear and thereby contribute to the development of a low permeability fault gouge (Færseth, 2006).
The importance of shale smear and its particular relevance to mixed arenaceous and argillaceous sequences that are generally found in hydrocarbon fields has meant that the process has attracted considerable research and attempts at numerical quantification. Factors that govern the development of an argillaceous smear within the fault zone are:
• the quantity, mineralogy and distribution of argillaceous source units within the faulted sequence
• the thicknesses of these argillaceous source units • the throw on the fault
With these input parameters and the dynamics of smear emplacement, numerous numerical models have been developed to quantify the quality of a resultant seal in terms of a dimensionless number that, when calibrated with appropriate analogue examples, can be used to express the likely sealing capacity of a fault cutting a sequence of known lithology. Of these numerical models, the Shale Gouge Ratio or SGR (Freeman et al., 1998; Fristad et al., 1997) is commonly employed for the analysis of fault seal (e.g. Freeman et al., 1998; Bretan et al., 2003). It is a measure of the proportion of argillaceous material within the fault zone and can be used to predict the height of hydrocarbon columns retained by the fauilt seal.
The prediction of smear continuity and the sealing capacity of the smear (SGR) is, therefore, of fundamental importance in assessing the prospectivity of hydrocarbon traps and the gas tightness of the trapping structure for gas storage. It is of vital importance when assessing the maximum hydrocarbon column height that can be supported by faults (i.e. the fault seal capacity) and thereby the size of the trap or effectiveness for gas storage purposes involving repressurisation of the reservoir and seals. It is now common place practise in the oil industry, using juxtaposition relationships and varying argillaceous smear and cataclasis in three-dimensional space, to build fault-zone models in oilfields that calculate, model and visualise fault-seal properties through time within a complex, three-dimensional fault setting. The resulting models can be combined with invasion percolation-driven flow-pathway modelling techniques to analyse the three-dimensional models for possible fault-controlled hydrocarbon accumulations and migration pathways (see e.g. Freeman et al., 1998; Clarke et al., 2005a&b).
72
6.1.3 Fault related leakage and hydrocarbon anomolies
Although many examples exist of faults being impermeable and providing seals in oil and gassfields, there are examples where faults appear to be permeable and nonsealing. A number of studies describe hydrocarbon concentrations increasing near faults (e.g. Fisher & Stevenson, 1973; Voytov et al., 1972; Reitsema et al., 1978; Abrams, 1992). Abrams (1992) described shallow cores from the Bering Sea that showed hydrocarbon concentrations within 75 m of a known fault and increasing towards the fault, due to passive hydrocarbon seepage. Studies in the Gulf of Mexico detected macroseepage up to several hundred metres away from fault scarps. This may have been partially due to leaky superficial and unconsolidated near surface sediments, a fracture system or sub seismic scale faulting that was undetected by high resolution seismic reflection profiles (Abrams, 1996).
Studies of the Pyrenees-Macedon fields in the Northern Carnarvon Basin, Australia reveal seismic amplitude anomalies and gas shows above the reservoir, indicating vertical leakage from the trap (Bailey et al., 2006). The studies also reveal the differing roles that faults can play and the need to characterise and model their performances effectively. Hydrodynamic analysis of pressure data indicate that faults separating the fields act as barriers to the migration of hydrocarbons and water, whilst faults within the Macedon Field do not. The reasons for hydrocarbon leakage and the difference in fault seal capacities are investigated using a number of approaches and analytical techniques. These include integrating field observations, analysis of pressure and stress data, the appraisal of caprock (standard mercury porosimetry measurements) and fault (SGR) membrane seal capacities, constraining geomechanical properties (top and fault seals) and wellbore-based fracture analysis. It has been found that the caprock seals are at a low risk of capillary failure, but vertical leakage is possible via dynamic failure along pre-existing faults and conductive fractures. Lateral leakage across the reservoir into different fault blocks is thought to arise by fault juxtapositions of porous reservoir rock types (so called ‘thief zone fault juxtapositions’). The difference in observed fault seal capacities between different faults is explained by a combination of the spatial distributions of SGR and buoyancy pressure.
There are also the recent studies of the Ketzin former aquifer gas storage site to the west of Berlin, where a gas chimney and amplitude anomalies are noted on seismic reflection data above a graben bounding fault. These features illustrate that gas has leaked to shallower levels via the fault (Juhlin et al., 2007 – Appendix 5).
6.1.4 Strain rates, deformation and faulting in and around halite beds
It is important to assess the possibility of faulting in halite and associated non salt interbeds that might be used for gas storage. Section 4.2.1 outlined the rheological behaviour of halite, illustrating that deformation of halite is commonly viscoplastic in nature with many people’s perception being that it ‘flows’. In actual fact it is not flow per se, but is described as creep achieved through crystal plastic deformation and/or pressure solution mechanisms (e.g. Jenyon, 1986a,b&c). Some studies have, however, suggested that long-range methane gas migration occurs through fractures in salt in the Algarve Basin, Portugal (Terrinha et al., 1994) and in the Sergipe-Alagoas Basin, NE Brazil. In the latter, faults are recorded in Aptian (early Cretaceous) age halite and sylvanite from the Petromisa Mine near Aracaju. The salt lies at a present depth of around 300 m, being overlain by Cretaceous strata. Coarse-grained halite has recrystallised along the fault plane and open fractures, filled with methane, are present in the mine (Davison, et al., 1996a). As stated previously (section 4.3), these studies should perhaps be urgently reviewed as they may indicate problems of tightness not previously recognised or that might not necessarily be anticipated.
Many examples exist of the interpretation of seismic reflection data that show faulting affecting only the top or base of a halite dominated succession; the faults apparently not having propagated through the halite body to displace the other enclosing boundary. The salt beds form a weak layer between the more competent (and harder) rocks and act as a detachment
73

(décollement) surface into which faults sole or die out. The salt is interpreted to have deformed in a ductile or plastic manner, effectively having ‘absorbed’ the faulting and isolating the deformation between the layers (e.g. Jenyon, 1986a&b; Stewart et al., 1996; Harvey & Stewart, 1998; Chadwick & Evans, 2005). This gives rise to an array of differing structures in the overburden such as rafts and ‘turtle structures’ (e.g. Vendeville & Jackson, 1992).
The Boulby Halite in the Teesside area is affected by the E-W trending and northerly downthrown Saltholme Fault and illustrates this situation. Displacement on the fault is about 50 m at the base of the halite, but there is little effect on the strata overlying the halite (Phillips in Smith, 1996). The changes in thickness and the textures of the halite in the vicinity (section 6.1.4.1) have been attributed to ductile flow of the halite as it absorbed most or all of the displacement of the Saltholme Fault (Smith, 1996). Similarly attributed to absorption of fault movements by the halite beds in the same area are the thickness variations in the halite in association with a steep reverse fault extending up from the underlying Seaham Formation into the Boulby Halite and dying out, and farther afield in the southern North Sea, strike slip faults deforming the base of the halite but not overlying strata (Woods, 1979; Jenyon, 1990).
The process of halite beds undergoing ductile deformation at a rate that readily kept pace with and absorbed (brittle) the faulting and graben formation that occurred in overlying sequences has been demonstrated in a study of well-preserved fault arrays in Canyonlands National Park, Utah (Moore & Schultz, 1999). Accumulated extensional strain across the closely spaced normal fault
-1arrays has been calculated at rates of approximately 1.5 to 2 cm/yr (or 10-14 to 10-13 s ). The authors suggested these rates are significantly below the rates of salt flow of >200 cm/yr (strain
–1rates of 10-11 to 10-9 s ) derived from salt glaciers (Talbot & Rogers, 1980; Talbot & Jarvis, 1984; Jackson et al., 1994). This they interpreted to indicate that salt flow and formation of reactive salt diapirs at depth beneath the grabens has accommodated the accumulated displacement and strain rates of the brittle faults (Moore & Schultz, 1999). The interpretation would appear to be supported by the strain rates for in-situ deformation of salt, which vary by
-1 -1over eight orders of magnitude from 10-8 s to 10-16 s (Jackson & Talbot, 1986). The more rapid rates are those of borehole and mine closures, the lower rates being typical of rates associated with diapiric growth (Anderson & Browns, 1992).
However, although commonly perceived as deforming plastically halite may suffer microfracturing (e.g. Munson et al., 1999 – section 2.2.7.3.2.1) and undergo brittle fracture and faulting under certain conditions (e.g. Davison et al., 1996a). Brittle failure of salt is reported in the Boulby Halite (Teesside; Smith, 1996 – section 6.1.4.2) and in the exposed top of a diapiric salt ridge in NW Yemen (Davison et al., 1996b).
The most likely instances when brittle failure might occur would be when the rock salt is:
• Exposed to high strain rates (Davison et al., 1996a), coupled with shallow depths (i.e. conditions of lower temperatures and confining pressures. This would appear to be the case in NW Yemen where the top of the salt diapir/ridge has broken surface and the salt has deformed under near-surface temperatures and pressures, which are considerably lower than at depths being considered at gas storage facility sites.
• Suffers rapid loss of confining pressures - for example during cavern formation, if cavern pressures are not kept high enough, the cavern walls will, as a result of horizontal stresses, develop microfractures weakening the halite which then suffers breakouts (spalling). In extreme cases, this might perhaps lead to the sudden release of confining pressure on a fault in the overlying strata that might propagate rapidly into the halite beds.
• When the salt beds are relatively thin and/or the faults define a major basin or intrabasinal structure
• Where the salt crystals containing impurities or inclusions lead to strain hardening and rupture of the salt
74

• Where the halite beds are thin and interlayered with mudstone or anhydrite beds
There may be other scenarios in which brittle failure could occur, but the ones detailed above are those most likely to lead to the rock salt suffering increased local stresses, strain hardening and ultimately to fracture and the propagation of a fault through the salt layer. The thinner the salt bed then the greater also the potential for this to occur.
Following the propagation and displacement on the fault, the rock salt, being viscoplastic, will over geological time and under normal lithostatic pressures undergo crystal plastic deformation and creep. The salt will effectively self-heal (anneal) and ‘repair’ any areas of fault damage. This will be driven by the natural tendancy to lower the (strain) energy held in the deformed salt crystals/grains, facilitated by the increased temperatures and pressures that accompany burial of salt beneath an overburden.
It is important to understand, therefore, that a fault possibly having connected through the salt bed(s) and having caused damage (fracturing) to the salt, may well, over geological time, have subsequently been ‘repaired’ by the naturally occurring creep of the salt.
6.1.4.1 LINEAR FABRIC AND GNEISSIC FOLIATIONS WITHIN HALITE BEDS
At the Preesall Inquiry much was made of a strongly lineated and foliated schistose/gneissic (?mylonitic) fabric found at certain intervals of the Preesall Halite in the fully cored Arm Hill borehole. It was observed on broken core surfaces (Fig. 10c) and was claimed by opposition groups to be slickensides resulting from faulting of the halite and such zones were thus considered a route for gas migration. A significant point is that slickenside structures can originate in processes other than during faulting, incuding during sedimentation. They are thus not diagnostic of brittle fault movements (Evans et al., 2005).
As described above, faults in salt exposed near the top of a salt diapir in NW Yemen have been noted and on which slickensides have had described within the salt. This has ocurred at shallow, near-surface levels and not at depths of 300-350 m or more, as at Preesall. Close inspection of the fabric in the Preesall Halite shows it to be elongate, flattened and subparallel halite crystals, giving an undulose schistose or gneissic (mylonitic) fabric and surface break to the core. The fabric is found in thin zones within more massive halite and an alternative interpretation was put forward by the Appellant. This was that the fabric might be unrelated to brittle processes, but represent fabrics arising from ductile flow of the halite, perhaps related to deformation of thin non-mudstone interbeds (Evans, 2005).
Smith (1996) described a fabric very similar to that noted in the Preesall Halite from cores of the Boulby Halite in a great number of boreholes on Teesside (Fig. 10b). There the fabric was found forming sheets ranging from a few millimetres to 3.8 m in thickness, which give rise to anastomosing networks around less deformed halite ‘pods’. They were interpreted as the flow lineated sheets, which were also closely associated with breccias of anhydrite. Both fabrics were interpreted as the result of ductile flow of the halite due to differential extension within the halite body and which acted as ‘glide planes’ (Smith, 1996). The precise mechanism by which the flow-lineated sheets in the Boulby Halite evolved is as yet unclear, but it seems likely that intracrystalline slip (dislocation creep) and pressure solution producing fluid films along crystal boundaries that was then reprecipitated were involved (Smith, 1996). The flow of the halite was probably driven by pressure gradients (Talbot et al, 1982; Smith, 1996).
Thin mylonitic zones (< 5 cm thick), comprising similar strong shape preferred orientation and foliation formed by elongate crystals are described from within naturally deformed extrusive Eocene-Oligocene rocksalt in salt diapirs of the Eyvanekey plateau and Garmsar hills (Schléder & Urai, 2007). These mylonite microstructures indicate deformation mechanisms of both solution-precipitation creep and grain boundary sliding accompanied by solution-precipitation. These were generated during emplacement of the salt diapir at shallow levels under differential
-1stresses between 1.4 and 2 MPa and strain rates of about 10-10 s (Schléder & Urai, 2007).
75

Until further work can be carried out, it seems likely that the fabric observed in the Preesall Halite in the Arm Hill borehole, with an obvious similarity to the linear flow fabrics described from the Boulby Halite, has similar origins. The concentration of such sheets of flow both at or near the top and base of the Boulby Halite and the thicker anhydrite/dolomite interbeds, probably represents a response to the greater rigidity of the interbeds and their effects in focussing and transmitting pressure to the halite (Smith, 1996). As indicated, such a relationship was tentatively suggested for the Preesall Halite examples (Evans, 2005), but is worthy of further study should further consideration of the Preesall Halite for gas storage purposes be likely.
6.1.4.2 FRACTURES AND FAULTS IN THE BOULBY HALITE, TEESSIDE
Fractures and faults are described in cores from the Boulby Halite at depths of approximately 390-425 m on Teesside (Smith, 1996). They are more readily identified when in close proximity to more competent and clearly fractured non-halite anhydrite and dolomitie interbeds (and salt with gneissic/schistose foliation) and as such, this appearance may be illusory (Smith, 1996). However, faults are present and their fault plane is observed. In addition to faults, the Boulby Halite in several of the cores contains pull-apart structures up to 100 mm across. There is, however, no evidence of any significant displacement on these structures.
The fractures and several of the faults contain, or are associated with, veins of colourless to amber granular and fibrous halite. Fibres in the latter are normally perpendicular to the walls of the veins. Some veins contain slightly curved fibres, indicating some movement of the walls of the veins during crystal growth. There is also evidence from the fibres of the episodic widening of some fractures and multiphase crystal growth (Smith, 1996).
6.2 UK SEISMICITY, SEISMOTECTONICS AND SEISMIC HAZARD
UGS facilities are planned in areas of the UK that have been subjected to shaking related to earthquakes that have occurred elsewhere in the UK, both on and offshore. It is appropriate, therefore, to provide a brief overview and assessment of UK earthquakes and from that, the potential danger from seismicity to UGS facilities in the UK. However, it emphasised that an overview of this type is insufficient and any assessment of seismic hazard will probably have to be done on a site-by-site basis.
Earthquakes occur due to movement on faults (planes of rupture in the earth’s crust), releasing energy (seismicity). Although seismicity risk in the UK is not of the same order of magnitude as that in, for example, Japan and California that lie close to plate boundaries, the UK nevertheless has a low to moderate seismicity. It is sufficiently high to pose a potential hazard to sensitive structures such as dams, chemical plants and nuclear facilities (Musson, 1997, 2003a&b). Between 300 and 400 earthquakes are detected annually in the UK, with only about 10% of them strong enough to be felt by people (Browitt & Musson, 1993). Occasionally, larger earthquakes occur, such as the Welsh border earthquake in 1980 (magnitude 5.4) and the 2007 Folkestone earthquake (magnitude 4.3). The areas over which the larger earthquakes are felt are often very large, as with the Dogger Bank (7/6/31), Lleyn Penninsular (19/7/84) and Roermund (Netherlands) events (Fig. 17). British earthquakes are not, however, generally perceived as presenting a hazard to life: in the period for which reliable records are available (since around 1580), only 12 fatalities can be associated with earthquakes (Musson, 2003a).
In order to quantify the effects, earthquake hazard must be distinguished from earthquake risk. Hazard is taken to be the likelihood of shaking of a certain strength taking place. Risk is the likelihood of actual damage resulting, taking into account the distribution and strength of buildings etc. The level of hazard is dependent upon the size of the earthquakes, their distribution within the crust and over time. In Britain, earthquake depths range from 2-20 kilometres, with the typical British earthquake occurring at depths of between 5 and 15 km. An earthquake occurring near the surface will have much more impact than one many kilometres deep (Browitt
76

& Musson, 1993): earthquake waves are twice as powerful on the surface than further down (Booth, 2007), because as seismic waves approach the surface they slow, becoming amplified and more destructive. It is noteworthy that the most damaging earthquake in the last 400 years (22nd April 1884 at Colchester), was not very large (4.6 ML), but was very shallow at about 2 kilometres (Browitt & Musson, 1993). As a consequence, underground structures stand up quite well because they are buried rather than on the surface, because as indicated above, seismic waves approach the surface they slow, becoming amplified and more destructive. Also surface waves (known as Rayleigh and Love waves) are generated by earthquakes, travelling along the earth’s surface and have a greater effect on buildings.
Further information on the subject of seismicity and earthquake hazard and risk assessment in the UK is available on the BGS website (http://www.earthquakes.bgs.ac.uk/hazard/Hazard_UK. htm), in Musson in Evans et al. (2005) and the various papers of Musson quoted below and reference lists therein.
6.2.1 Measurement of the magnitude or strength of an earthquake
The spatial location of any earthquake can be considered in three dimensions. The hypocentre (or focus point) is the source location of the earthquake (i.e where the slipping of the rocks along the fault begins). The point at the surface and generally marked on a map is the epicentre and lies directly above the hypocentre. The vertical distance from the hypocentre to the epicentre is the depth of the earthquake.
The magnitude of an earthquake is generally measured or referred to in terms of the Richter Scale, which is a way of measuring the amount of energy released during an earthquake. The Richter magnitude scale (or more correctly, local magnitude ML scale) is an attempt to give one value to the overall size of the earthquake. A single number is assigned to quantify the amount of seismic energy released by an earthquake. It is a base-10 logarithmic scale obtained by calculating the logarithm of the combined horizontal amplitude of the largest displacement of the waves from zero recorded on seismographs with adjustments included to compensate for the variation in the distance between the various seismographs and the epicentre of the earthquake. Measurements have no limits but because of the logarithmic basis of the scale, each whole number increase in magnitude represents a ten-fold increase in measured amplitude. In terms of energy, each whole number increase represents a 30-fold increase in energy release (and a 10-fold increase in the amplitude of ground displacement). Thus a magnitude 5 earthquake releases 30 times the energy of a magnitude 4 earthquake and 900 times the energy of a magnitude 3 earthquake (Musson, 1994).
The Modified Mercalli Scale is a subjective measure that describes how strong a shock was felt at a particular location in values ranging from I (not felt, except by very few under especially favourable conditions) to XII (damage total, lines of sight and level distorted, objects thrown upwards into the air).
It has long been realised that larger earthquakes occur less frequently than smaller earthquakes, the relationship being exponential, i.e. roughly ten times as many earthquakes larger than 4 ML
occur in a particular time period than do earthquakes larger than magnitude 5 ML. This holds true for UK earthquakes. The following conclusions about average recurrence in the UK can be drawn (Musson, 2003b):
• an earthquake of 3.7 ML or larger every 1 year
• an earthquake of 4.7 ML or larger every 10 years
• an earthquake of 5.6 ML or larger every 100 years.
77
Increasingly, an estimate of the size of an earthquake at any particular point is expressed as the strength of shaking or intensity at a particular place and is based on a number of things that may be found in an everyday environment (the extent of damage to buildings of different type, the reaction of people affected etc.). In Europe these observations are then related to the European Macroseismic Scale (EMS: refer Grünthal et al., 1998; http://www.gfz-potsdam.de/pb5/pb53/ projekt/ems/index.html), where 1 is not felt and 8 is very damaging.
A description of what happened is matched to the overall picture of the different descriptions in the scale as follows (further detail of the various grades and their meaning are given in Appendix 5):
• 3 - Felt by few
• 4 - Felt by many indoors, windows and doors rattle
• 5 - Felt by most indoors, small objects fall over
• 6 - People run out in alarm, slight damage to buildings (plaster cracks)
• 7 - Moderate damage to buildings (chimneys fall, cracks in walls)
The EMS-98 scale is one of a family of intensity scales that recognises the statistical nature of intensity, that is, that at any place a certain effect is likely to be observed in a proportion of cases only and whether that proportion is small or large is itself something that tells one about the strength of the shaking. Earlier scales often described only effects, with no quantities, implying that the same effect was universal on all such sensors when the intensity reached that value.
6.2.2 General background to seismicity in the UK
The following sections, based upon Musson (2005a, in Evans et al., 2005), outlines the seismic hazard in the UK context. Each region or site area considered for UGS would probably require an individual probabilistic seismic hazard assessment (PSHA).
It is perhaps appropriate to start with some words about seismic hazard in the UK in general, as common misconceptions exist. These are due to some misunderstanding of seismicity in the UK context and the extent to which issues relevant to seismic hazard in seismically active plate margin areas such as California and Japan have created expectations concerning procedures. These procedures are not always appropriate in less seismically active intraplate areas of the world, such as that in which the UK lies.
In places like California, approaches to seismic hazard are largely directed to consideration of individual faults. For a given site, the questioning would typically be along the lines of:
• Is this fault, which is near a site, active
• If not, what is the closest active fault to a site
• Is a site best avoided because it lies so close to the trace of an active fault that surface displacement may occur across it in a future earthquake?
Conventional definitions, largely developed in active tectonic areas, refer to any fault that has demonstrably moved in the past x years as active, where x is some large number extending certainly beyond historical times, usually back to the beginning of the Quaternary (c. 1.8 Ma). It is common practice to examine known faults one by one, compare them to this definition, and decide if they are active or not. The number that meets this criterion indicates the number of “active faults”.
By contrast, in the UK, which lies in a tectonically quiet intraplate setting and which has not suffered a surface rupturing fault during at least historical times, the concept of an “active fault” is unhelpful and probably inappropriate altogether (Musson, 2005a&b). In order to estimate the
78

number of “active faults” as defined above, the problem can be approached from the opposite direction. All earthquakes occur on faults and in mainland UK there are approximately 300-400 distinct epicentres. Therefore, there must be about this number of active faults in the UK, even though most cannot actually be recognised in the field. The distribution of faults at 5-15 km depth is generally poorly known because maps of faults occurring at the Earth’s surface are of limited use for precisely locating faults at depth.
In the case of major earthquakes worldwide, causative faults can be identified in one of a number of ways. In the first case, since major earthquakes require large structures to host them, the fault may already be well known. In the second case, the fault may be directly observable through surface rupture. Thirdly, the fault plane is often imaged by the distribution of aftershocks. Fourthly, waveform inversion can be applied to map not only the fault itself, but the distribution of rupture along it.
M
These methods are of limited application in the UK. It is impossible to not only identify any demonstrably active faults, but it is also extremely difficult to discern any relationship between the pattern of seismicity and local or regional geological structure. It has, to date, proved extremely difficult to reliably associate any British earthquakes with specific known faults. Even the two largest U.K. faults, suspected to be active, pose problems in attributing historical seismicity to them as distinct features. The typical British earthquake is small and occurs at depths of between 5 and 15 km and a typical damaging earthquake in the past has been around 5
L (ML = local or “Richter” magnitude) in magnitude (no onshore event is known to have exceeded 5.4 ML). Since the typical earthquake is small, its rupture dimensions are also small and what faulting occurs at these depths is usually poorly known. The hypocentre is likely to be located only to an accuracy of ± 5 km or so in three dimensions and within this crustal volume several faults may occur. Hence, looking at a map of faults that shows only their surface traces is of very limited use.
Consequently, it is thought very few British earthquakes have reliable fault attributions. Notable exceptions might be the 15 February 1865 Barrow earthquake(Musson, 1998), the 16 September 1985 Ardentinny earthquake (Redmayne & Musson, 1987) and the 22 September 2002 Dudley earthquake (Baptie et al., 2005). These three appear to be cases where named faults can be cited as causative features with some certainty. A few others exist, but not many.
This is typically the case in intraplate areas, due to the absence of significant tectonic deformation. At plate boundaries and other areas of active deformation, large-scale differential movement within the crust requires fault planes on which to accommodate this movement. Most large faults were originally created in this way. The rocks that comprise the British Isles have been subjected to various phases of orogenesis and active deformation in the past, leaving behind many fault structures which were once active but are now relict features. It is possible, however, that these faults could be reactivated in the context of the quite different tectonic circumstances that exist today.
6.2.3 Hazard from ground rupture and hazard assessment in the UK
The issue of hazard from ground rupture in the UK does not really arise. This is demonstrated in Figure 18, which shows all earthquakes > 3 ML with known depths in mainland UK and the Irish Sea, plotted by latitude and depth as a north-south cross section. The vertical bars show the extent of the fault rupture calculated from Wells & Coppersmith (1994), assuming that all ruptures are circular and that rupture length is the predicted value plus one standard deviation. None of the ruptures intersect the surface and very few even come close and this is with what can be considered a pessimistic model; Burton & Marrow (1989) predict much smaller ruptures for the same size of earthquake in Britain than are given by Wells & Coppersmith’s (1994) global regressions, which are primarily based on large magnitude earthquakes.
79

Not only are British earthquakes generally small, therefore, but the larger, more infrequent, events tend to be of deeper focus. This is illustrated in Figure 18, and is even clearer in Figure 19, which plots magnitude against depth for a slightly larger area than is covered in Figure 18. Only two events in the last 400 years are identified that are both >4 ML and have depths in the top 5 km of crust.
As mentioned above, the typical damaging British earthquake in the past has been around 5 ML
and such an earthquake requires movement on a fault no more than a few kilometres long. An earthquake of around 5.8 ML, similar to the 1992 Roermond earthquake in the southern Netherlands and which might be considered the typical scenario event for the UK (Musson, 2004a) can, from the relations of Wells & Coppersmith (1994), originate from 6 km of fault rupture. Faults large enough to host such an earthquake are rather common in the UK. Major fault structures are not required.
6.2.4 UK seismotectonics
A major report for Nuclear Electric (Chadwick et al., 1996) presented detailed maps of the deep subsurface structure of the UK and a seismotectonic model for the UK. The research indicated that the UK is divided into a set of generalised ‘seismotectonic zones’. Each of these zones has characteristic crustal structure and each is associated with seismicity, which at least in part, is explicable, although the correlation of deep structure with seismicity is not clear-cut. From this it is possible to make an assessment of both local source zones and also the probable hazard from individual faults that might be identified as relevant to site-specific studies.
Any correlation of individual bulk crustal properties (thickness, depth, heatflow etc.) with seismicity is too weak to be recognised and therefore, taken in isolation, bulk crustal properties do not appear to exert a strong seismotectonic influence in the current stress regime. However, major faults affecting the crust do appear to be of greater seismotectonic significance and show more obvious correlations with seismicity.
Major faults form important lines of weakness in the upper crust, very effectively taking up strain during crustal extension or shortening. In the UK context, on geological timescales the relatively low-angle thrust-faults have been of particular importance in this respect, having suffered compressional and extensional reactivations at various times in the past. These structures have controlled the location and development of sedimentary basins, many containing the oil and gasfields or halite beds being considered for gas storage purposes (refer Chadwick, 1986, 1993; Chadwick & Evans, 2006). However, the observed correlation of present seismicity with these features is by no means as clear-cut as might be expected. In the current regime representing rather low stress (calculated from in situ stress measurements in boreholes; Chadwick et al., 1996), cumulative accrual of strain appears to be very small, and such strain that does occur is not being strongly localised around or along these pre-existing zones of weakness.
The maximum horizontal compressive stress is oriented roughly NW-SE, which is probably attributable to 'ridge-push' from the North Atlantic mid-ocean ridge (Whittaker et al., 1989; Zoback, 1992). Earthquake focal mechanisms are thus dominantly strike-slip on near-vertical faults, indicating that, at seismogenic depths, the intermediate principal stress is vertical. Faults oriented north-south or east-west are most favourable to being reactivated under these conditions and might be considered as capable of reactivation. This applies not only to mapped faults with a surface expression, but also (really, even more so) to basement faults, which may have no surface expression.
However, the orientation of the orientation of the stress field and the observed lack of deformation in the sedimentary cover rocks over the last 10 million years or so, suggests that under the current stress regime, horizontal stress magnitudes are low and unable to readily (or effectively) reactivate and drive either thrust faults or normal faults. This contrasts markedly
80

with the situation 20-10 Ma ago. At that time much stronger compressive stresses existed, which were the result of Alpine continental collisions and these were sufficient to drive major fault reversals with basin shortening and structural inversion. This is revealed by important compressional structures in the Weald and Wessex basin areas of southern England (refer Chadwick, 1993; Chadwick & Evans, 2006).
The effects of post-glacial isostatic rebound may exert localised influences on seismicity, particularly in the northern UK, but are not considered to be a driving force of regional significance.
Most UK earthquakes, therefore, appear to arise as a consequence of minor interactions and adjustments ('jostling') between upper crustal blocks, giving predominantly strike-slip focal mechanisms. Some systematic correlations of seismicity with deep structure can be recognised. Earthquakes are associated with steep transcurrent faults and in a general way with major thrust-faults, which appear to be reactivated to some degree. Enhanced seismicity is associated with the apical areas between converging faults and in particular, with the intersections of major faults (where three or more upper crustal blocks interact).
The seismotectonic model for the UK shows the country to be divided into a set of generalised ‘seismotectonic zones’ (Fig. 20), and indicates that in the southern UK, seismicity is associated with distributed, dominantly strike-slip, reactivations of Variscan and Caledonian thrusts and other basement faults. Interactions between the Midlands Microcraton and surrounding adjacent structural blocks appear to be a cause of significant seismicity, with, in particular, the northward transmission of stress (and strain) along the Pennine Line, the effects penetrating well into southern Scotland. In northern Britain, seismicity appears to be mostly restricted to the major northeast-trending structures such as the Great Glen and Highland Boundary faults and, in particular, their intersections with the Moine Thrust.
6.2.5 UK seismic hazard
Certain seismotectonic zones of low seismicity may well remain low in activity. Other low seismicity zones, such as those in northern Scotland, northeast England, and, particularly, central southern England, have the capability to become more active. High seismicity zones of regional extent are likely to remain active at similar levels of seismicity. Some more restricted high seismicity areas, particularly those associated with a specific fault structure (such as around the Lleyn Peninsula) may become less active as strain is partitioned to other segments of the fault structure.
This is relevant to seismic hazard in different ways. At the most obvious level, it is clear that seismic hazard studies concerned with long exposure periods (such as those connected with nuclear waste repositories), will be acutely concerned with identifying areas not active now but which have an enhanced possibility of becoming active within the lifetime of the facility.
But even for seismic hazard studies for short-term hazard (i.e. for exposure times of 50-100 years) it may be considered that should such areas co-incide with likely areas of UGS applications, then they might merit special treatment. The timescale on which possible changes in seismicity could occur in the present stress field is most uncertain, but could range as low as a few tens of years, or within the lifespan of the average engineering facility (Chadwick et al., 1996). Of course, quantifying the probability of current low seismicity areas becoming enhanced is difficult and subjective. However, as long as the aim is for a reasonably conservative approach to seismic hazard evaluation, identifying the possible areas of concern is a priority. It could also be argued that the possibility of a "maverick" earthquake, i.e. a relatively large earthquake occurring unexpectedly in a low seismicity area, should be considered to be higher in an area identified as having a higher seismic capability than in one identified as fundamentally stable.
81

A map of earthquakes in the UK, taken from the BGS catalogue (Fig. 20a) illustrates that the spatial distribution of earthquakes is neither uniform nor random, nor is there a clear-cut correlation of deep structure with seismicity (Chadwick et al., 1996; Musson, 2003b).
As might be expected for Britain, the areas of highest hazard parallel the areas where earthquakes have been most common in the past (Fig. 20), but particularly those places where repeated earthquake activity has been highly localised - this localisation has a pronounced effect on the hazard calculations compared to areas where the seismicity, while high, is more diffuse and less repetitive. The zones where hazard is higher than average encompass the W Highlands of Scotland, an arc shaped zone running from Carlisle to Pembroke, NW Wales and W Cornwall. The places in the UK with lowest seismic hazard are Northern Ireland (especially the western counties) and outlying parts of Scotland, including the Orkneys and Outer Hebrides.
The actual values of hazard are not particularly high, since the predicted intensity for the higher zones is only 6 EMS (Musson, 2003b). In other words, even in areas of relatively high exposure to earthquakes in the UK, if a facility has a life of 50 years there is only a 10% chance that it will experience shaking equivalent to intensity 6. Moving briefly from hazard to risk, taking a guideline that probably less than 5% of buildings of normal construction (e.g. conventional brick houses) will be damaged in a place when the intensity there is 6, the probability of damage for a single house in 50 years is therefore less than 0.5% (Musson, 2003b).
In Scotland most earthquakes are concentrated on the west coast, between Ullapool and Dunoon, with the addition of centres of activity near the Great Glen at Inverness and Glen Spean, and a small area around Comrie, Perthshire, extending south to Stirling and Glasgow. The Outer Hebrides, the extreme north and most of the east of Scotland are virtually devoid of earthquakes. For the north-west of Scotland the absence of early written records, the small population, and the recent lack of recording instruments means that there may be a data gap; for instance, there are indications that an earthquake occurred in 1925, possibly near Ullapool, with magnitude probably about 3.5 ML, for which there are no first-hand reports. However, many other parts of Scotland, especially south of the Highland line, are quite well documented, at least since 1600, and therefore the lack of earthquakes is genuine.
Further south a similar irregularity is seen. An area drawn from Penzance to Holyhead, to Carlisle and then to Doncaster includes most English and Welsh earthquakes. The northeast of England appears to be very quiet, almost aseismic. The southeast has a higher rate of activity, with a number of earthquakes that seem to be "one-off" occurrences. The most notable example of these is the 1884 Colchester earthquake, a magnitude 4.6 ML event which was the most damaging British earthquake in at least the last 400 years, and yet which occurred in an area (Essex) otherwise more or less devoid of earthquakes from the earliest historical period up to the present day. There are also important centres of activity near Chichester and Dover. The former produced a swarm-like series of small, high-intensity earthquakes in the 1830s, was active again in 1963 and 1970. The latter is close to the recent Folkestone earthquake on 28th April 2007.
The Lake District Boundary Fault Zone (LDBFZ) is a complex feature on the western boundary of the Lake District, oriented mostly NNW-SSE. In its northern regions it is an anastamosing (braided and branching) structure, with one of its splays in the Furness peninsula, the Yarlside Fault, almost certainly the fault responsible for the small but damaging 1865 Barrow earthquake (Musson, 2005a). It is because this earthquake was small and very shallow (perhaps 1-2 km) that this association can be advanced with some confidence (Musson, 1998). Another small, shallow earthquake, the 17 November 1755 Whitehaven earthquake, occurred within the traces of the LDBFZ and must have been related to it. The much larger 11 August 1786 earthquake (5.0 ML), which had an epicentre offshore from Whitehaven, may also have been linked to the LDBFZ.
It has been suggested (Akhurst et al., 1998) that the Preesall Fault and the Formby Point Fault to the south may be structurally related to the (LDBFZ). Thus, given that the LDBFZ has been seismogenic (i.e. responsible for an earthquake - which is different from saying that it is “active”
82
in the sense that, say, the San Andreas Fault is active), it is possible that reactivation could in theory shift to one of the southern splays at some point in the future, but there is no evidence that this has taken place.
Offshore, there is significant activity in the English Channel (the likely source of the Folkestone earthquake) and off the coast of Humberside. Because only the larger events in these places are likely to be felt onshore, the catalogue in the pre-instrumented period is probably under-representative of the true rate of earthquake activity in these zones.
6.2.6 Summary
Seismic hazard assessment in the UK tends not to be a search for the nearest active fault, but proceeds on the basis that a damaging earthquake can effectively happen anywhere. However, based on historical experience, it is clear that some parts of the country are more prone than others. The geological reason for this variation is not very clear (Musson, 1996), but it is statistically certain that the distribution of earthquake epicentres across the UK is not random or even (Musson, 2000). Normal hazard assessment procedure is to take account of these regional variations to construct a probabilistic model of earthquake occurrence that can be used to assess the likelihood of any degree of ground shaking within a specified interval of time (Musson, 2004b; Musson & Winter, 1997).
In quantifying the level of hazard by conventional probabilistic methodology, however, some problems arise in attempting to interpret earthquake data in terms of geological structure and faults. As indicated above, in the U.K., not only is it impossible to identify any demonstrably active faults but it is also extremely difficult to discern any relationship between the pattern of seismicity and local or regional geological structure. It is suggested that, in intraplate areas such as the U.K., it is often inappropriate to attempt to model individual fault sources. There is no proof that any particular faults in the UK are active. Because an earthquake of moderate size can occur on a very short fault segment, it is impractical to restrict fault modelling to major features.
The UK, therefore, is seen as having low-moderate seismicity, with low levels of seismic hazard and risk, only really representing a problem for near surface and surface installations. Earthquakes in the UK are generally deep, typically occurring at depths of between 5 and 15 km and attributing any particular fault with an earthquake is extremely difficult, with only a handful thought likely to be seismogenic. The depth of UK earthquakes and the attenuation of seismic waves not just with distance from the epicentre but also depth means that the integrity of the structure deep under ground may not be affected, but that effects on surface and near surface infrastructure require to be taken into account. Deep underground facilities (the deepest currently anticipated being 2234 m in a depleted oil/gasfield and 2.1-2.3 km in a salt sequence – refer Table 1) are less than the typical depth of UK earthquakes. Deep facilities (more than a few tens to hundreds of metres) are, therefore, only at risk when they are actually cut by an active fault, which in the UK context with the history of seismicity relative to likely areas of gas storage, is considered unlikely
It has to be borne in mind, however, that low probability events do happen, for example, the Maharashtra earthquake of 1993 (Musson, 2003b). Assessing the hazard in this part of India in 1992, would have led to the conclusion that the probability of a damaging earthquake was extremely low. This would have been correct at that time, but unfortunately the following year the earthquake happened despite the very small probability. Seismic hazard assessment helps the engineer design safe facilities, but to be 100% safe would require designing every building against improbably large earthquakes occurring unexpectedly close to any given site almost irrespective of whether it were in a high activity zone or not.
In the UK, therefore, where sizeable earthquakes are historically rare, it may not be possible at this stage to quantify the probability of seismic hazards in any meaningful way. It may be more appropriate to deal with seismicity on a “what if” basis, where the consideration is “what would
83

happen if an earthquake of greater than a certain size were to occur”. Then, if the facility has been designed properly, illustrate that the consequences for safety would be insignificant, or at least manageable. It is possible to design surface and near-surface facilities to be able to withstand seismic hazards. Such design and construction is now undertaken for nuclear facilities in areas of high seismicity such as Japan, where no leaks of radiation have occurred as a result of earthquakes. In addition, Japan has an operational UGS facility at the depleted Sekihara gas field a few kilometres north of Minami-Nagaoka (Oshita, 2002) and is also constructing underground LPG storage facilities facilities (Takeshi et al., 2000; Yamamoto & Pruess, 2004). The main problems are caused by the collapse of structures that are not designed with earthquakes in mind. Examples of this in the UK were the damage seen at Colchester in 1884 and more recently the toppling of chimney pots in the 2007 Folkestone earthquake.
Each proposal to develop a UGS facility may, therefore, have to be dealt with on a site-by-site basis and it is likely that it would require not only a quantitative performance/safety assessment, but also preparation of a “safety case” that is based upon multiple quantitative and qualitative arguments supporting the hypothesis that gas storage will be safe. Such an approach is also now widely adopted in radioactive waste disposal programmes throughout the world (Metcalfe, 2007 pers comm.).
84

7 Methane storage in reservoir rocks - effects of (and on) microbial populations (Julie West, BGS)
As seen elsewhere in this report, methane storage underground in reservoir (porous) rocks and salt beds is a recognised technology. In the UK, porous reservoir rocks used or being considered for methane storage include Carboniferous sandstones, the Triassic Sherwood Sandstone, limestones and sandstones of the Middle and Upper Jurassic and sandstones of the early Cretaceous Purbeck Group. Methane is injected at depths between 450 m and 3 km, where temperatures will be above 35°C and the pressures greater than 70 bars. The composition of the methane will here be considered as consistent, being ‘pure’ and uncontaminated with other compounds.
This section is not a detailed literature review but briefly considers the effects of such injection on any deep subsurface ecosystem; biological influences on methane/rock interactions both in the reservoir itself and in cap rocks. Generally questions raised can be summarised:
1. Do microbes live in such deep reservoir rocks? 2. If so, what kinds of organism exist? 3. Can these organisms survive at such depths and could they survive the injection of methane? 4. If these microbes exist and can survive methane injection, what effects will they have on the
methane? 5. Could these effects be detrimental to the containment or could other substances be produced
as a result of microbial metabolism? 6. Can these effects be quantified?
7.1 THE MICROBIOLOGY OF THE DEEP SUBSURFACE
For any life to occur in any environment certain conditions for the synthesis of protoplasmic constituents and the liberation of energy necessary for life processes must exist. The synthesis of protoplasm requires water, a carbon source (organic or inorganic), nitrogen, phosphorus and sulphur, an energy source plus certain minerals (trace elements). The biochemical liberation of energy in the absence of light (as in a deep reservoir) requires:
• The presence of an electron donor such as oxidisable organic compounds or, in the case of chemolithotrophic organisms, oxidisable inorganic substances such as molecular hydrogen, ammonia, sulphide or ferrous ions
• The presence of an electron acceptor such as molecular oxygen, sulphate, nitrate, ferric compounds, carbon dioxide and simple organic compounds (McNabb & Dunlap, 1975)
Qualitatively, by this approach, it can be seen that most geological formations (including reservoirs) have the capacity to support at least a limited microbial population due to the presence of:
• Carbon sources - dissolved organic matter, carbonates, dissolved carbon dioxide • Electron donors - dissolved H2 and CH4 and Fe2+
• Electron acceptors - dissolved O2, SO42-, CO2 and NO3
However, the long-term stability of many carbon rich fossil fuels in the subsurface (including oil) prior to drilling does suggest that some biological factor is limiting (usually phosphorus) the growth of indigenous microbes on these resources whilst it remains unexploited. However, once the oil is tapped for commercial exploitation it then becomes available for microbial attack as
85

additional microbes, nutrients and energy supplies are introduced into the reservoir (Ehrlich, 1996). Thus it can be seen that the injection of methane into a reservoir should be viewed as yet another introduction of a potential carbon source and electron acceptor which can be used by those microbial groups whose biochemistry is capable of utilising the gas.
The deep subsurface is an extreme environment for life but it is not sterile. West & McKinley (2001) have shown that many different groups of microbe are found in a variety of geological environments, with total numbers approximately 105 to 106 organisms per ml groundwater. These include sulphate reducing bacteria, denitrifiers, iron bacteria and methanogens. Other work has indicated that complex ecosystems can live at depth in reservoirs (e.g. see references in Ehrlich, 1996). The deep subsurface can generate extreme conditions (pressure, heat) but Table 6 gives some examples of extreme conditions that individual microbial species can tolerate. Clearly, a reservoir environment of >35°C and 70 bars is not extreme. Indeed 35°C is an optimal growth temperature for many microbes.
7.2 THE CARBON CYCLE
The carbon atom, with its ability to be stable in a number of different oxidation states (-4 to +4) and its tendency to form stable covalent bonds, is very efficient at storing and releasing energy. The ability of carbon to absorb solar energy by forming reduced organic compounds and then release this chemical energy through oxidation reactions is the chemical basis of life on earth (Chapelle, 1993).
The pathways and mechanisms whereby oxidation and reduction reactions involving carbon occur are known as the carbon cycle. The central compound is carbon dioxide present either in the atmosphere as a gas, or in water as dissolved inorganic carbon species (CO2, HCO3
-, CO32-).
In terrestrial and near surface marine environments sunlight is available and carbon dioxide is reduced to carbohydrates via photosynthesis. The reduction of oxidised carbon in carbon dioxide to organic carbon releases free oxygen and results in aerobic conditions. Much of this organic carbon is aerobically oxidised via plant and animal respiration back to carbon dioxide.
A large amount of organic carbon produced by plant photosynthesis is cycled back to carbon dioxide by means of anaerobic oxidation. Anaerobic oxidation of carbon compounds occurs in many environments (such as soils, aquatic environments) and also in the deep subsurface (which would include potential reservoirs). In this overall process fermentative bacteria incompletely oxidise organic carbon producing organic acids, alcohols and molecular hydrogen. These simple reduced compounds are then completely oxidised by anaerobically respiring bacteria using mineral electron acceptors such as Fe(III) (by iron reducing bacteria), sulphate (by sulphate reducing bacteria) and carbon (by methanogens - refer Daniels et al., 1987). It should be noted that the interactions between sulphate reducing bacteria and methanogens are very complex and often methanogens are outcompeted by sulphate reducing bacteria because of the latters’s high affinity for these simple compounds (Ehrlich, 1996). Nevertheless, the cycling of carbon under anaerobic conditions requires a cooperative food chain of a variety of microbial groups to achieve complete oxidation. The activity of these different organisms will give rise to by-products such as methane and hydrogen sulphide, which can cause souring of oil reservoirs. Methane produced by methanogens in the subsurface subsequently diffuses into aerobic environments where oxidation by methanotrophs takes place. Biological anaerobic oxidation of methane is also possible. The methanotrophs thus play a crucial role in the return of methane to CO2 within the carbon cycle.
7.3 METHANOTROPHS
Methane can be used as a primary energy source by bacteria known as Methanotrophs. Some of these cannot use any other energy source (‘obligate’) whilst others are ‘facultative’ and can use other energy sources. Methane can also be oxidised by some yeasts and by some methanogenic
86

archaea. With the exception of these methanogens, most methanotrophs are aerobic although many are microaerophilic preferring lower oxygen availability for development. Additionally, there is some evidence of the existence of anaerobic methanotrophs, which are not methanogens. For more details on the biochemistry see references in Ehrlich (1996).
Methanotrophs are generally found at aerobic/anaerobic interfaces in soils and aquatic environments that are crossed by methane and also in coal and petroleum deposits (Ehrlich, 1996). Given the generally small amounts of methane trapped in geological structures compared to the global carbon cycle it is clear that oxidation of methane is the common fate of biogenic methane gas.
7.4 THE INFLUENCE OF METHANE ON MICROBIAL LIFE IN A RESERVOIR
ENVIRONMENT AND RESULTING CONSEQUENCES
As can be seen above, methane introduced into a reservoir can be regarded as a potential energy source for micro-organisms – particularly methanotrophs. The potential effects of enhanced microbial activity are:
1. Direct e.g. reduced volumes of methane, increased volumes of carbon dioxide 2. Indirect e.g. production of biomass with potential decrease in storage capacity; change in
geochemical conditions
These effects could influence overall containment especially production of biomass with resulting production of biofilms. Such biofilms could, in the worst case, physically ‘block’ off areas of the reservoir thus altering permeability. If gas migration occurred into overlying geology and aquifers then the effects would be the same. However, the effects may have wider implications. For example, production of carbon dioxide could acidify groundwaters with resulting mobility of certain toxic species such as heavy metals.
However, the consequences of methane injection on methanotroph activity will depend on the status of the reservoir itself – particularly whether aerobic/anaerobic interfaces are present. It is likely that methanotroph activity will be at very reduced levels in a completely anaerobic reservoir although the injection point should be regarded as potential interface. Thus effects may be quite localised. However, unless a pristine environment is selected where no drilling has taken place, the reservoir may have been subjected to previous geochemical and biochemical change and various organisms may have been introduced to the subsurface environment together with a variety of nutrients and energy sources from, for example, drilling fluids. Thus to evaluate the effects of the injection of methane it is important to first characterise the reservoir in terms of its basic geochemistry – particularly the existence of oxygen – and its existing capacity to support all microbial life. Once this baseline has been established then the subsequent changes to the ecosystem following methane injection can be evaluated.
In the first instance, such an assessment of the microbiology of the reservoir prior to injection can be achieved using a simplistic modelling approach (Baker et al., 1998). Nutrient and energy inventories of the solid (reservoir) and liquid (groundwaters) components in this environment (i.e. concentrations of species that can be used as nutrient and energy sources) would be used to calculate biomass. The approach assumes that all nutrients and energy are available for immediate use by organisms and thus it assumes a 'worst case' giving maximum biomass of the various groups of organism (including methanotrophs). It would also be possible to determine the useage of methane by methanotrophs with subsequent production of carbon dioxide. Limiting growth factors can also be established - it is possible that a nutrient and not an energy source may be controlling biomass. Following this basic evaluation it would then be possible to determine the maximum effects of methane injection on these populations. Following such basic calculations it would then be important to validate the results by performing basic microbiological analyses of the reservoir environment followed by laboratory experiments to
87

estimate the kinetics of nutrient/energy usage and by-product formation. Such experiments should be undertaken under realistic conditions using well-characterised materials.
7.5 CONCLUSIONS
• Microbes will exist in the deep subsurface reservoir. The environmental conditions produced at depth will not sterilise the rock. The ecosystem in the reservoir will depend on the geochemical conditions and the history of the environment. Indigenous microbial populations may have been joined by contaminant organisms and external nutrient and energy sources introduced during any drilling procedures. Thus injection of methane into the reservoir can be regarded as the introduction of yet another possible nutrient and energy source for microbial exploitation.
• In broad terms, if the storage reservoir is completely anaerobic then biological methane oxidation rates will be very low (although rates cannot be predicted). If oxygen is introduced into the system then oxidation rates will increase.
• The consequences of biologically catalysed methane oxidation on containment properties are complex and diverse. Simple modelling based on nutrient and energy inventories can give the maximum biomass and controlling factors on microbial growth in the environment. Estimates of maximum by-product generation can also be obtained by this approach. The results from these 'worst case' scenarios could then be constrained and validated by using experiments in realistic conditions.
88

8 Subsidence, ‘inflation’ and microseismic activity associated with oil and gas production, gas injection and underground storage in depleting fields and salt caverns
This section outlines briefly the relevant considerations and potential problems associated with injection and storage of natural gas in depleted oil/gasfields (pore storage). The concepts regarding the effects of subsidence and ‘inflation’ (during gas injection) on caprocks, existing structures (e.g. faults in the caprock sequence) and associated subsidence, being based upon mining engineering experience, are also applicable to cavern storage, at least in the initial assessment stage. Problems of subsidence at saltfields are briefly reviewed in the final section (8.7).
It is a simple fact that all engineering activities performed underground in rock result in a finite effect at the ground surface (Cuss et al., 2003). For example, groundwater is a major source of drinking water in the UK and is abstracted from numerous boreholes located throughout the country. The pumping and abstraction of drinking water from porous geological formations (aquifers) for public water supply purposes can and does produce small surface ground movements in many areas of the country. But for the most part they are so small that they go completely unnoticed by the public and have no deleterious effects on property or infrastructure.
With subsidence it is really the gradient of the subsidence that is the problem (Cuss 2007, pers comm.). A metre or so of subsidence at the surface isn't necessarily a problem if that metre is spread over say one or two kilometres. Where it becomes a problem is when even a few millimetres occurs over a very short distance (like a fault). Of course, it also depends on where more general subsidence over a wide area occurs, and over what timeframe. If it is in coastal regions, then this might lead to encroachment by the sea in some areas (see below). However, even here it is not always straight forward, because the subsidence rate must also be balanced against the net sediment input to the region (from river systems into estuaries or sediment transport along the coast). This might keep pace with the subsidence and prevent encroachment by the sea.
Subsidence associated with oil and gas production is a well-known phenomenon and one that nowadays is predictable and can be modelled, rather like when considering mining problems. Fluid production and declining reservoir (pore) pressures may lead to a ‘relaxation’ of the reservoir. This movement may propagate to the surface, being typically manifested as a bowl-shaped subsidence (depression) at the surface, centred over the oilfield. The production of oil and gas from underground reservoirs gives rise to detectable effects at the surface, the magnitude or severity of which depends on a number of factors, including:
(a) Depth, lateral extent and vertical thickness of the reservoir (b) Properties of the reservoir rock and of the adjoining rock formations (c) Fluid pressure changes within the pores of the rock caused by oil or gas production
and/or re-injection/withdrawal (d) Major structural geological features such as faults (e) Timescales of pressure variation and operation of the facility
Furthermore, during oil or gas production when ‘relaxation’ of the reservoir occurs or during the gas storage operations when the reservoir and caprock (or sequences overlying a salt cavern) are cyclically inflated and deflated, faults and fractures in the reservoir or cap rock may develop or be reactivated. Such faults and fractures can lead to increased or accelerated subsidence. They
89

are also the cause of microseismicity described below and could act as conduits for gas migration.
Over the years, numerous small onshore oilfields have been successfully exploited for oil and natural gas in the UK. Whilst the general experience gained in the operation of small onshore oil and gas fields here in the UK is positive and very few problems have been encountered, subsidence associated with production has occurred offshore and around the world. Well-documented cases stemming from oil production operations in the North Sea, North America and elsewhere demonstrate that, in unfavourable circumstances, oil and gas production can cause damaging reservoir subsidence (e.g. Allen, 1968; Hermansen et al., 2000). It is, therefore, important to examine the potential for damaging surface ground movements resulting from cyclical changes in reservoir pressure in the UK, but this will very much be site-specific. The factors common to most reported problems are (Cuss et al., 2003):
• thick (i.e. vertically extensive) reservoirs • the presence of weak and compressible porous rocks prone to irreversible (i.e. inelastic)
pore collapse • a substantial lowering of the reservoir pressure by oil and/or gas production with time
8.1 RESERVOIR SEISMICITY/MICROSEISMICITY, SUBSIDENCE ENGINEERING
AND SURFACE GROUND MOVEMENTS ASSOCIATED WITH THE
INJECTION OF FLUIDS AND/OR GAS
Underground withdrawal and injection of significant amounts of fluid or gas may modify (stress) the mechanical state of the porous (and eventually fractured?) strata involved (Fabriol, 1993). Materials, including rocks, when stressed (deformed) generate transient vibrations and emit acoustic signals (a phenomenon commonly termed microseismic activity or acoustic emission; AE) in the audible and sub-audible range. The study and analysis of such emissions can provide important information and data on the state of a gas storage reservoir during operation and degree of stability of the structure under study.
Generally, small-scale local modifications result, little altering the reservoir permeability and performance, and are not perceptible at the surface. Nevertheless, important effects have been noted in one or two specific cases and should be noted here. They are of two kinds:
• Surface effects – slow deformation related to reservoir compaction (withdrawal of e.g. fluids or gas) or inflation (re-injection of e.g. fluids or gas)
• Underground effects – reduction in permeability as a consequence of reservoir compaction, or induced seismicity due to sudden ruptures along pre-existing faults or weak joints caused by hydrocarbon production or the injection and withdrawal of gas
The possible damage and the seismic hazard related to induced seismicity resulting from the re-utilisation of old oil or gas reservoirs for fluid or gas storage must be taken into account and carefully assessed. This should be the case even if the abandoned reservoir has previously shown no anomalous behaviour (Fabriol, 1993).
The operation of a gas storage facility in a depleted oil/gasfield involves re-injecting gas into a depleted reservoir, which will increase the pore fluid pressure in the reservoir above the final operating pressures. The effect of re-injecting gas will be to decrease the effective stress acting on the reservoir rock and adjoining formations and this will actually decrease the possibility of future subsidence.
The operation of a salt cavern storage facility involves the creation of a large void in the salt body and the injection of gas. Should pressure in the void not be built up to compensate the overburden pressure, then creep of the salt is likely, as the overburden pressure effectively drives the salt to infill the lower pressure void by natural plastic deformation (creep – section 4.2). The process continues until the cavern and overburden pressures are equalized, or in the extreme
90

case, the void closes up. The process would most likely be associated with subsidence to some degree. Injection of gas will ‘jack-up’ or keep the void open. However, if the pressure is built up too high, such that it becomes greater than the overburden pressure, then it could potentially cause some uplift of the overburden. It might also exceed the fracture limit of the overburden rock, leading to fracturing in the caprock.
Subsidence above producing oil and gas reservoirs is a direct consequence of the reduction in pore fluid pressures in the reservoir rock and in adjoining formations that have direct hydraulic connection with the reservoir. In simple terms, surface ground movement due to oil or gas production can be separated into two components (Cuss et al., 2003):
• reversible elastic component – when de-pressuring the reservoir by an amount –�P leads to a lowering of the ground surface and repressurising the reservoir by an amount +�P
leads to an uplift of the surface which is of the same magnitude as the settlement.
• non-reversible inelastic component - associated with plastic deformation of the rocks and with phenomena such as fabric damage and pore-collapse that cannot be reversed by repressurising the reservoir.
The effect of re-injecting gas will be to decrease the time-averaged effective stress acting on the reservoir rock and adjoining formations. It is likely that this will actually decrease the possibility of future subsidence. A certain amount of uplift, the opposite of subsidence, will occur as the elastic component of stress is recovered during pressure cycling. The re-injection of fluids can prevent further ongoing ground movement associated with inelastic mechanisms and is widely used as a method of controlling oil field subsidence.
Surface ground movements associated with the reversible (elastic) component of rock deformation are rarely problematic. If the reservoir rocks and adjoining formations are moderately strong and, therefore, fairly incompressible, then the elastic strains and displacements associated with a reservoir pressure decline are usually quite small. The only exception is when the thickness (i.e. vertical extent) of the zone affected by the lowered fluid pressure is very large. In this situation, even though the elastic strains are quite small, the total displacement (i.e. the cumulative change in bed thickness over the affected zone) can be quite large.
Surface movements associated with the inelastic component of rock deformation can, under unfavourable circumstances, be much larger than those associated with the elastic component. Porous rocks subject to an increasing mean normal effective stress and declining pore fluid pressure may exhibit a “yield threshold”. When the effective stress exceeds this threshold, the rock becomes progressively more compressible as brittle phenomena such as grain crushing and pore collapse become more important. These processes can (dramatically) alter the properties of a reservoir rock/interval.
In terms of strength, clay rich rocks have strengths generally described as weak to very weak. Limestone and sandstone units range from weak to strong rocks.
There are two types of deformation that can occur within a hydrocarbon reservoir that can lead to surface deformations and strains:
• Consolidation of the intact part of the rock - can result in a lowering of the ground surface (subsidence). The porous rock is ‘work-hardened’ during inelastic volumetric deformation and possible deformation mechanisms include shear-enhanced compaction, plastic flow, grain crushing and pore collapse.
• Movement along faults - fault mechanics either create new faults in the reservoir or environmental/rock parameters cause the existing fault network to move.
91

8.2 DEFORMATION FROM PORE PRESSURE CYCLING
Geotechnical assessments of the reservoir and caprock successions are required to assess both natural (pre-existing) stresses within the succession and the effects of stresses resulting from the injection and withdrawal of gas (refer also section 3.4). The response of the rocks to these stresses requires careful determination, with measurements of their strength and an understanding of their deformation mechanisms.
8.2.1 Effective stress analysis using critical state concepts
In simple terms, if the mean effective stress during the gas storage cycle is less than the maximum value the rock has sustained over its entire geological history (i.e. the preconsolidation stress), then it is likely that the volumetric behaviour during pressure cycling will be largely elastic. If the mean effective stress during the storage cycle is greater than the preconsolidation stress, then the possibility that inelastic mechanisms might contribute to total deformation cannot be discounted.
Porous rocks that have undergone some form of diagenetic alteration leading to strengthening (e.g. cementation) usually exhibit a yield stress which is significantly larger than the value calculated from maximum burial depth (Cuss, 1999). The critical state approach can be used to determine what sort of deformation is expected within the stress conditions under consideration.
8.2.2 Transmission of pore pressure to the surrounding layers
Raising the pressure within the gas storage reservoir will result in the transmission of some pore fluid pressure to the beds immediately above and below the storage reservoir. Hydrocarbon reservoirs are normally associated with an overlying low permeability shale or clay caprock seal. This generally means that pore fluid pressure will not be modified significant distances from the gas reservoir. Because of low permeabilities in the sealing claystone caprock lithologies, pressure changes would be extremely slow in relation to the periodicity of the pressure variation due to storage.
8.2.3 Transmission of subsidence at depth to the surface
To estimate the amount of subsidence seen at depth transmitted to the ground surface, standard procedures adopted by the mining industry (Waltham, 1994) can be used (Cuss et al., 2003). This method calculates compression/extension, subsidence, ground strain and tilt. To calculate surface deformation, three parameters are required:
w – width of reservoir
�H – total change in reservoir thickness
z – depth of reservoir
8.3 FAULT REACTIVATION DUE TO SUBSIDENCE
It is a common observation that displacements associated with subsidence can become localized in faulted lithologies. Thus a fault may act as a boundary, which limits the lateral development of the subsidence trough. The displacements at such a boundary are focused on the fault plane. In effect, the movement on the fault is reactivated by the ground strains associated with subsidence.
If the fault cuts through all strata to the surface, its reactivation can cause a discontinuity in subsidence and strain profiles, which is sometimes apparent as a fault-scarp. This is a highly problematic and often damaging form of localised subsidence.
Oil and gas reservoirs are often present in tilted horst blocks bounded by faults with normal displacements. These faults may pass through the volume of rock affected by reservoir
92

subsidence. Whether or not these faults could play a role determining surface ground movements depends on the magnitude of the strains and the detailed mechanisms of strain transmission. If the strains are small and largely elastic then the faults might play a minimal role. If the strains are larger and inelastic mechanisms such as pore collapse, fracturing and bed separation are implicated, then the faults are likely to play a more important role. To fully appraise the consequences of gas injection on faults at any particular site requires detailed site characterization that includes the collection of information on rock and fault properties.
8.4 TENSILE DEFORMATION
The maximum pore-pressure within the reservoir will dictate whether tensile deformation is induced in the reservoir rocks. Hydrofractures occur under conditions of stress when pore fluid pressure at the caprock-reservoir interface reduces the minimum effective horizontal stress below zero to the tensile strength of the rock. For hydrofractures to develop in preference to shear fractures the conditions:
P=�3 +T and �1��3<4T
must be satisfied, where P is pore fluid pressure, �1 and �3 are maximum and minimum horizontal stresses respectively and T is the tensile strength of the cap-rock (Hubbert & Rubey, 1959; Sibson, 1995). Tensile strength is measured in units of force per unit area, which in the SI system is newtons per m2 (N/m2) or pascals (Pa), which in geological context will in all probability be in MPa. Pore fluid pressure can be estimated from the expected weight of the overburden, �3 from tectonic stresses and T from hydrofrac tests or laboratory experiments.
Natural gas reservoirs are generally found at discovery pressure gradients of between 5.4 and 11.8 kPa/m (0.78 to 1.6 psi/m). Katz & Coats (1968) found that no fracturing of the caprock occurred at or below gas pressures of 22.6 kPa/m (3.28 psi/m) of depth, suggesting that it could possibly happen at 33.9 kPa/m (4.92 psi/m) of depth, but that gas might open existing fractures at between 22.6 and 24.9 kPa/m (3.61 psi/m) of depth.
Therefore, to avoid leakage through the caprock, the applied overpressures must be below threshold displacement pressures and thus less than fracturing pressures. These values are higher than the maximum overpressures sustained during UGS. Thus, from a knowledge of the original reservoir pressures, displacement pressures (and thus fracturing pressures) and determination of rock properties, operating limits can be calculated for the facility, such that overpressures related to injected gas do not cause tensile failure of the reservoir or caprock.
Some American states (e.g. Indiana) stipulate a maximum wellhead injection pressure to ensure that the pressure during injection does not initiate new fractures or propagate existing fractures. The maximum wellhead pressure is calculated using the following formula:
Pmax = (0.8 psi/ft - (0.433 psi/ft (Sg)))d
Where: Pmax = Maximum injection pressure (psia).
Sg = Specific gravity of the injected fluid.
d = Depth to the top of the injection zone in feet.
(refer http://www.in.gov/legislative/iac/T03120/A00160.PDF)
8.5 RESERVOIR SEISMICITY/MICROSEISMICITY ASSOCIATED WITH
WITHDRAWAL OR INJECTION OF FLUIDS AND GAS
Examples of reservoir-induced seismicity (RIS) are frequent in the literature and cases of damaging earthquakes having been detected in and around oilfields that have produced for 10 years or more are known (Fabriol, 1993). RIS can occur either in cases of mass addition
93

(injection) or withdrawal and is similar to that in mining situations involving mass removal of rock and involve the same rock mechanics theory.
RIS is extremely variable and manifested in many ways:
• Magnitude – micro scale to damaging earthquakes
• Time between injection and onset of (micro)seismicity – from a few days to several years
• Distance from point of injection – from the vicinity to tens of km
Complexities increase when extraction and re-injection are carried out in the same reservoir simultaneously or delayed in time, as for oilfields where water, gas or steam are injected for enhanced oil recovery (EOR) purposes. The most common scenario is injection leading to an increase in pore pressure, which decreases the effective stress on pre-existing faults that might be close to failure. This allows accumulated shear stresses to release, causing movement on the fault plane. The injection of fluid may also trigger damaging earthquakes along faults that are moved to a critical state by the principal regional stress loading, making it important that the present day tectonic context is fully understood (Fabriol, 1993).
RIS is slightly different to hydraulic fracturing, where the high pressured fluid or gas opens up pre-existing fractures or joints or creates new small scale fractures, which propagate into the rock mass. A number of cases are reviewed below (refer Fabriol, 1993).
8.5.1 Injection of waste fluid – the Denver earthquakes
Between 1962 and 1966, around 625,000 m3 of contaminated waste water was injected in a deep well drilled at the Rocky Mountain Arsenal (RMA), NE of Denver, Colorado USA (Hsieh & Bredehoeft, 1981). Injection was at a depth of 3650 m into a highly fractured Precambrian Gneiss. Between 1962 and 1967 over 1500 earthquakes were recorded, with three major ones of magnitude 5 or more in 1967 and which shook the Denver area causing minor structural damage. Previously, the last event felt in the area had been in 1882. By the mid 1980s, the earthquake activity had all but died away. The causes were attributed to movements along the fractures in the gneiss triggered by the increase in pore pressure due to injection.
8.5.2 Injection of fluid for EOR – the Cogdell oilfield, Texas, USA
RIS is fairly common in cases of high-pressure waterflooding in an oil reservoir for EOR (Davis & Pennington, 1989). At Cogdell, saltwater injection was initiated in 1956, seven years after the field was discovered. Seismic activity was detected in 1974 in the closest town, some 20 km to the south of the field. The earthquake activity was related to the field and hypocentres were close to the injection depths. From 1956 to 1983, 114 Mcm of salt water were injected through 119 injection wells located around the perimeter of the field.
8.5.3 Injection of fluid for EOR – the Rangely oilfield, Colorado, USA
Again, an EOR related case but where specific seismic monitoring was carried out at the same time as pressure tests that were performed to map the pressure distribution in the Permian reservoir (Raleigh et al., 1976). Injection was into the main reservoir at 1700-2100 m depth and only one fault oriented NE-SW was known on the anticlinal structure. The field was developed in 1945, with waterflooding having commenced in 1957-1958, prior to establishing the monitoring network in 1962. Earthquakes were, however, reported before 1962 with unconfirmed reports of felt earthquakes prior to the fluid injection. Consequently, it is not possible to establish any correlation between the initiation of waterflooding and the onset of seismic activity at Rangely (Fabriol, 1993). Waterflooding increased the fluid pressure in the reservoir above the original 190 bars. Studies in the 1970s suggested that the critical fluid pressure above which earthquakes could be triggered was 257 bars (3730 psi). Fluid pressures
94

had reached 275 bars by the early 1970s, with more than 1500 minor seismic shocks recorded between 1963 and 1973 (Moran, 2007). Water pressures were then adjusted to maintain pressures below the critical pressure. Since 1963, 19 have had magnitudes between 2.5 and 4.7 on the Richter scale with the strongest, curiously, having been in 1995.
8.5.4 Exploitation of a geothermal field, The Geysers, California, USA
The geysers geothermal field is located 130 km N of San Francisco, with steam extracted straight from the reservoir (Oppenheimer, 1980). Steam is produced from over 200 wells penetrating the fractured reservoir at between 0.8 and 3 km depth across the field. Earthquakes have been known since 1969 and appear to be clustered in the production region, but occur randomly within the field, apparently not related to any through going fault system. It has been demonstrated that an increase in the number of earthquakes is related to an increase in geothermal production. Generally seismicity is very shallow, almost all is less than 5 km depth. There has been a volumetric contraction of the reservoir revealed by a subsidence rate of 3.4 cm/yr. The area of maximum subsidence coincides with the location of the maximum steam pressure decline in the reservoir. Two mechanisms remain plausible for inducing seismicity in the field:
• Volumetric contraction due to mass withdrawal may perturb the stress field, causing faulting in the reservoir rock
• Cementation of the fractures and fault surfaces leads to faulting rather than more ongoing aseismic slip in the rocks
8.5.5 Microseismicity induced within a gas storage reservoir, Germigny facility, Paris
Basin, France
This facility located in the Paris Basin in northern France (Fig. 21) represents one of the few published examples of a microseismicity survey in a gas storage facility (Deflandre et al., 1993). The reservoir for the Germigny facility is a sandstone present in an anticlinal structure at around 750 m below sea level. Injection commenced in 1983, with the gas in storage between 1400 Mcm at the end of the winter period and 2100 Mcm following refilling at the end of the autumn (injection is from March to November). The microseismic survey was conducted with three permanent geophones in a single injection well, clamped to the casing wall at differing depths (783, 815 and 905 m). Between November 1991 and April 1992, 27 microseismic events were recorded, but posed no danger to the facility or its operation (Fabriol, 1993). Microseismic events were correlated with pressure changes in the vicinity of the observation well at the top and bottom of the reservoir interval, but the mechanism was not thought to be related to any faults (which had not been detected by drilling or seismic reflection data). Instead, the cause of the microseismicity was attributed to the reduction of effective stress along planes of different lithologies in an unfaulted sedimentary sequence (Fabriol, 1993).
8.5.6 Microseismic monitoring within gas storage reservoirs, Pennsylvania State
University, USA
The Pennsylvania State University initiated a project on the optimisation of gas storage pressures in reservoirs in 1966 (Hardy et al., 1972a&b). Phase I of the project, which included analytical and model studies on cap and reservoir rocks, was directed towards the development of a criterion for establishment of optimum pressures in underground storage reservoirs and was completed in 1971. A PRCI monograph ("A Study to Evaluate the Stability of Underground Gas Storage Reservoirs") was published in 1972, with a conclusion that, from a rock mechanics point of view, optimum pressures in underground gas storage reservoirs where water containment is not a limiting factor could be of the order of those defined by the geostatic gradient (Hardy et al., 1972a).
95
Phase II of the project ("Feasibility of Utilizing Microseismic Techniques for the Evaluation of Underground Gas Storage Reservoir Stability") commenced in 1971 (Hardy et al., 1972b), with the main objective being the investigation, under field conditions, of the feasibility of using microseismic techniques to monitor the stability of gas storage reservoirs. Field studies associated with Phase II were carried out firstly at the Wharton Field site (Pennsylvania), primarily developing the monitoring equipment and field techniques. These were then employed in a detailed study at the Lenox Field (Michigan). The studies concluded that optimum storage pressures in underground gas storage reservoirs could be, at least, of the order of those defined by the geostatic gradient, with no mechanical rock failure (plastic deformation or fracturing) of the reservoir or cap rock (Hardy et al., 1972a&b).
The results obtained during Phases I and II of Project PR 12-43, led to additional microseismic studies being undertaken at a third underground storage site using refined techniques and experimental facilities. Phase III of the study ("Microseismic Monitoring of Storage Reservoirs": Project PR 12-75), involved a detailed five-year investigation (between January 1st 1975 and December 31st 1980) of the microseismic activity associated with the injection and withdrawal cycle of the New Haven underground gas storage reservoir (Hardy et al., 1972b; Hardy et al., 1981; Hardy & Mowray, 1981). The study, which would provide a complete documentation of a reservoir pressurized above discovery pressure, investigated the stability of underground gas storage reservoirs. The main objective was to establish suitable criterion for optimum pressurization based on the principles of rock mechanics. One of the most significant results of the study was the fact that over the reservoir pressure range studied (approximately 220-623 psi), the microseismic event rate was found to decrease with increasing pressure. This indicates that the structural stability of the New Haven reservoir increased with storage pressure (Hardy et al., 1981).
8.5.7 Reactivation or ‘opening’ of faults in the Salt Lake Oilfield, California
The Salt Lake Oilfield was largely abandoned but redeveloped by slant drilling during 1962, with the continuous production of oil, salt water and gas thereafter. Water has been re-injected into the field since 1980 and gas has been found to leak out of the oilfield and make its way to the surface (Appendix 5). It is believed that the 1985 and 1989 Fairfax gas leaks were the result of waste disposal or secondary recovery operations initiated by pressure injection of oilfield wastewater back into the fields. In addition to migration up old and poorly completed wells, increased pressures are thought also to periodically cause migration of gas along the Third Street Fault, allowing gas to escape to shallower levels and the surface (Hamilton & Meehan, 1992).
8.5.8 Discussion
It is worthy of note that the injection examples described above all concern water or fluid. This is fundamentally different to gas injection. Water is incompressible and therefore tends to hydraulically transfer pressure into the rock. Gases are compressible and transfer less pressure into the rock.
8.6 SUBSIDENCE ASSOCIATED WITH OIL AND GAS PRODUCTION AND GAS
STORAGE FACILITIES AT DEPLETED OIL/GASFIELDS
Again, this is a major topic in its own right, with several cases of subsidence documented during exploitation of oil and gas fields in for example the North Sea (e.g. Holloway et al. 1996) and which cannot be adequately dealt with in this report. It is the aim of this section, therefore, to highlight one or two examples to illustrate the potential for and amount of subsidence associated with oil and gas production experienced in some areas.
96

8.6.1 Los Angeles Basin in general
Subsidence associated with oil and gas production has been described from the Los Angeles Basin, where the subsidence area maybe up to twice the size of the oilfield itself (Khilyuk et al., 2000; see Chilingar & Endres, 2004). The scale of the potential problem is illustrated in the case of the Wilmington Oilfield, where subsidence reached approximately 8.5 metres before corrective action was taken by implementing a major water injection program (Chilingar & Endres, 2004). Historical measurement data regarding subsidence in the Playa del Rey/Venice oilfield areas reveal almost 0.6 m of subsidence from the time that oil production began in the 1920s up to 1970 (Chilingar & Endres, 2004). Subsidence associated with the Torrance-Redondo Oilfield has also caused major damage when in January 1988, waves overtopped the breakwater protecting the Redondo Beach King Harbour Boat Marina and surrounding commercial properties (Chilingar & Endres, 2004). Investigations following the disaster revealed that nearly 0.6 m of subsidence had occurred under the breakwater as a result of oil production beginning in 1943. However, accelerated subsidence had occurred from 1956, following increased oil production.
8.6.1.1 INGLEWOOD OILFIELD SUBSIDENCE
An incident at the Inglewood Oilfield reveals the potential problems and dangers that might be connected to oilfield subsidence if not monitored. The incident concerns the Baldwin Hills Dam in the south and west of the Inglewood Oilfield area of Los Angeles. In the late morning on December 14, 1963, the dam failed and the resultant flood of water caused massive damage to homes located below the dam and resulted in five deaths. The Inglewood Oilfield, discovered in September 1924, lies under the western half of the Baldwin Hills area. It covers about 4.9 km2
and in 1963 had more than 600 producing wells, with at the time, the nearest reported production at the time of the reservoir failure being from three wells within 213 m of the south rim (Chilingar & Endres, 2004). Despite this, no monitoring of the oilfield for subsidence was undertaken.
Investigations into the failure revealed ground movement that correlated directly with production from the Inglewood Oilfield (Chilingar & Endres, 2004). The area of subsidence was elliptical in shape and centred over the oilfield, about 805 m west of the reservoir: subsidence at the reservoir site was about 0.9 m, compared to nearly 3.4 m at the subsidence bowl, contributing to differential settlement across the dam of approximately 0.15 m. Also revealed, was a large strike-slip fault system (the Inglewood-Newport Beach Fault Zone) that ran through the area, with numerous faults branching off the main fault. Drilling records indicated many of these faults had been intersected in wells drilled across the area. The post-accident investigation suggested that some of these faults had been re-activated and caused rupturing of the asphaltic membrane used as a water seal over the floor of the dam.
8.6.2 Ekofisk Oilfield, North Sea
Subsidence is an ongoing phenomenon in oilfields of the North Sea, with the Ekofisk Oilfield in the Norwegian sector of the North Sea being a high profile example. In the mid-1980s it was discovered that the oilfield was suffering from an unexpected degree of subsidence that caused problems with the interconnected series of platforms. Detailed geological investigation revealed the problem was related to delayed compactional diagenesis of the Chalk Formation from which the oil is produced. Production of hydrocarbons meant that water replaced the oil and began to dissolve the Chalk, which was redeposited in a more compact, lower porosity configuration. Total subsidence was almost 6 metres and required that the platform legs were cut and all the interconnected platforms were jacked-up by this amount and new leg sections inserted.
97

8.7 SUBSIDENCE AND DAMAGE OCCURRING AT SALTFIELDS DURING SALT
EXTRACTION AND GAS STORAGE OPERATIONS
This section briefly outlines some of the problems encountered at operating saltfields (both dry mines and brine extraction) and during salt cavern gas storage operations. Examples of subsidence and damage resulting from poor operational procedures and observed subsidence rates are described, with further detail available in Appendix 2.
The impacts of mining and solution mining operations to man-made surface structures and other features are relatively well known and studied. The effects range from mild subsidence across wide areas to catastrophic failure and collapse of the overburden, resulting in the formation of a (often deep) crater at surface, as has occurred in salt workings in Europe and in the UK at the Preesall brinefield (Lancashire – refer Wilson & Evans, 1990; Jackson, 2005 – section 8.7.2.1.1 and Fig. 5b).
8.7.1 Subsidence occurring with salt cavern formation and overburden/caprock stability
As alluded to in section 2.2.7.3.3, all solution-mined caverns, be they brine extraction or gas storage caverns, converge as they very gradually shrink due to salt creep (Bérest & Brouard, 2003). This occurs until either the salt fills the void or confining pressures and cavern pressures are equalised, and is associated with varying degrees of subsidence as the salt moves into the void.
Elsewhere in the report (section 4.2), the ability of salt to deform either in a ductile (plastic) or brittle manner, depending on the temperature, stress state and strain rate is outlined. At temperatures expected for the salt-dissolution subsidence process, the primary creep (or ductile-deformation) mechanisms for rock salt are glide and solution precipitation (Urai et al., 1986b). If groundwater penetrates the subsiding salt mass, deformation by solution-precipitation creep is capable of producing strain rates that are orders of magnitude higher than are possible in relatively dry salt at the same stress states (Davies, 1989). Two basic types of subsidence exist (Anderson & Browns, 1992):
• very slow subsidence characterised by predominantly ductile deformation – salt creep • relatively rapid subsidence characterised by predominantly brittle deformation (Ege,
1979; Davies, 1989).
These two types of subsidence represent the end members of a continuous range of subsidence processes. The process of salt creep at depth into the cavern area can lead to closure of caverns that are not constructed or operated correctly (see Appendix 5). This process typically generates an upward-expanding zone of subsidence that is transferred to the surface with decreasing amplitude over a wide cone of influence. With time, the ground surface over an intact cavern will deform into a broad shallow depression (Warren, 2006), referred to as ‘bowl subsidence’ or ‘zone of draw’, a term originally used in coal mining to describe the distance on the surface to which the subsidence or creep extends beyond the underground workings (e.g. Thrush, 1968). It is, therefore, similar to ‘trough subsidence’ at the surface above ‘long wall’ or ‘room and pillar’ mining operations. This phenomenon is normal and predictable using fairly standard mining calculations and is more obvious above shallower storage caverns. It will occur over the entire footprint of an individual cavern projected vertically upwards to the ground surface and beyond into an area determined by what is termed the ‘angle of draw’ (e.g. Jeremic, 1985). For relatively flat-lying strata, this is commonly held to be c. 35º to the vertical. The greater the cavern depth, then the greater is the extent of the zone of subsidence beyond the limits of the undergound void. To illustrate, for a cavern developed at depths of 300 m to 600 m, the area within which subsidence could occur would extend between about 210 m and 420 m in all directions beyond the limit of the cavern projected vertically to the ground surface. However, it should be noted that the amount of subsidence that occurs is inversely related to depth, i.e. there is a depth below
98

which closure of an opening of a particular size or shape does not give rise to subsidence at surface.
Bowl subsidence does not, however, generally become a problem unless the roofspan is breached and the rate of subsidence increases (Warren, 2006). This can lead to brittle deformation and collapse of the overburden followed by ingress of water, perhaps further escalating the subsidence problems due to dissolution of the salt. Brittle deformation is characterized by an inverted-cone-shaped vertically migrating collapse cavity or chimney (refer Warren, 2006).
It has been suggested that in a brittle collapse zone, water ingress could lead to ongoing dissolution but facilitate relatively rapid creep of adjacent salts (as a result of the presence of water), back into the dissolution cavity. This could conceivably help to prevent the formation of large cavities and subsequent catastrophic collapse. A consequence would be more gradual subsidence, the horizontal extent of which would increase upwards as dissolution proceeded through time (Anderson & Browns, 1999).
For the case of developing a large cavern field the closure mechanics become more uniform. Once the width (of the field) becomes larger than the overburden thickness, large-scale stress arching effects in the overburden become less important All creep strains in the salt horizon are accommodated by direct downward movement of the overburden, with all ‘pillars’ (undissolved salt between caverns) carrying the full weight of the overburden (Mraz et al., 1991; Dusseault et al., 2001). This process will accelerate closure when compared to an isolated cavern, where some of the stress concentration (i.e. shear stress) is transferred farther from the cavern through the rigidity of the non-salt roof rocks above the cavern. If all other factors are equal, then an isolated cavern will close more slowly that a cavern group (Dusseault et al., 2001).
Measured land subsidence rates vary above salt caverns, due partly to the differing depths and operational procedures at any particular cavern. In the 1980s, measured subsidence rates over shallow caverns in the US SPR ranged up to 40-50 mm/yr at facilities in Texas and Louisianna (Warren, 2006). Deeper caverns, such as that at Tersanne in France (c. 1450 m below ground level), are associated with much lower rates of around 6-8 mm/yr. Since the late 1980s, most purpose built storage caverns have been filled and maintained at higher pressures than was the case in the 1970s-1980s. The result is that salt creep and resultant subsidence has been reduced (Thoms, 2000; Warren, 2006).
Ongoing and continuous monitoring/surveillance and reappraisal is required at most storage sites. However, understanding of the causes, rates and magnitudes of the subsidence permits site operations to continue in most cases.
8.7.1.1 OBSERVED AND CALCULATED RATES OF SUBSIDENCE ASSOCIATED WITH GAS STORAGE AND
BRINE CAVERNS
This section briefly details some observed and calculated rates of subsidence associated with gas storage and brine caverns.
8.7.1.1.1 Bryan Mound, Big Hill and West Hackberry SPR salt cavern storage facilities, USA
A series of cavern storage facilities have been constructed in salt domes of the Gulf Coast, USA including Bryan Mound, Big Hill and West Hackberry. All have been monitored for the effects of subsidence (Warren, 2006). Between 1982 and 1988, the subsidence rate at Bryan Mound was 24.4-36.6 mm/yr. This fell to between 6.1 and 24.4 mm/yr in the period 1988-1994 and 3.1-15.2 mm/yr from 1994-1999. The reduction in the subsidence rate by around 70% was related to increasing cavern pressures (Warren, 2006). At Big Hill, subsidence rates ranged from 6.1-15.2 mm/yr between 1989 and 1994, but reduced to 6.1-9.1 mm/yr between 1994 and 1999. The lower rates overall at Big Hill may, to some extent, be related to a thick (300 m+) brittle caprock overlying the salt dome (Linn & Culbert, 1999; Bauer, 1999; Warren, 2006).
99

In contrast, however, the West Hackberry storage facility is an example of extensive, major subsidence resulting from mainly salt creep closure of the SPR storage caverns below (Magorian et al., 1993; Neal & Magorian, 1997). Even following pressurisation, the subsidence rate remained high at 76.2 mm/yr (Warren, 2006), which although other causes of subsidence have been found to contribute, is mainly attributed to salt creep.
8.7.1.1.2 Example of predicted subsidence associated with proposed gas storage salt caverns in
the Preesall Saltfield, NW England
During the Canatxx application to develop salt caverns for gas storage, studies of the likely subsidence associated with cavern development and operation were undertaken by two cavern design experts (Dr J Ratigan & Prof K Fuenkajorn). In the design of a gas storage cavern, a pressure range is defined within which the caverns should operate at given depths and geostatic pressures. The upper (higher) pressure limit is designed to prevent overpressurization that could cause fracturing of the rocks. The lower operating pressure is designed to stop the inward movement of the cavern walls due to salt creep. Pressures for the operating caverns were anticipated to be in the range 25-75 bar (368-1103 psi), for 100 m diameter caverns, the tops of which are between 220-425 m below ground level (refer Table 1 in Heitmann, 2005). The subsidence estimates for these conditions were calculated using industry recognised modelling methods and covered a range of possible cavern sizes and designs. The subsidence rates derived were:
• An average rate of 0.2-0.3 mm per year, maximum being 0.5 mm (Dr J Ratigan) • An average rate of 0.4-0.8 mm per year, maximum being 1.4 mm (Prof Fuenkajorn)
For reasons not entirely clear, it was noted in the report by Hyder Consulting (2005) that Dr Ratigan considered cavern sizes that were generally smaller in size than those reviewed and modelled by Professor Fuenkajorn.
8.7.2 Problems of subsidence in saltfields not related to wet rockhead or linked to gas
storage
Problems of stability and subsidence have arisen when parts of the salt mass are extracted in a poorly managed way, or salt bodies with previous or ongoing drilling activities. This has led to disturbance and collapse of the caprock sequence(s), with cases of ingress of water that have led to enhanced salt dissolution and subsidence. The following far from exhaustive review summarises the problems that have been encountered in saltmine or brine field areas. It is emphasised that they are not as a result of operations associated with gas storage, but are merely presented to illustrate the problems that have been encountered by poor mining or operational practice or site characterisation, either when extracting salt or drilling in areas of previous salt extraction. A comprehensive review of the various failure mechanisms of the caprock sequence above saltmines or caverns experiencing problems and that lead to the development of ‘collapse chimney’s’ or pipes is provided by Warren (2006).
The surface effects of the events described here and in Appendix 2 (see Fig. 5b-d) are of particular interest when assessing the risks posed to existing or future infrastructure (gas pipelines, compressor stations etc.) in areas under consideration for gas storage in salt caverns.
8.7.2.1 PROBLEMS AT SALTMINES AND BRINE FIELDS
Appendix 2 details briefly the nature of problems encountered at saltmines and brinefields where catastrophic ground failure arose through poor mining and working practices. Examples found in Romania, Italy, Poland, France and the USA illustrate how poor mining and cavern development can lead to significant areas being affected by subsidence and collapse. They represent potential problems that could arise from inadequate site characterization and poorly managed solution
100

mining of a cavern or cavern field without due regard to, or control over, the shape, dimension or long-term geological stability of the resulting cavity/cavities.
In some countries large areas are now unstable and unusable, whilst in Kansas (USA), the collapse of brine caverns and formation of significant surface collapse hollows and craters has led to problems with and damage to surface infrastructure (Fig. 5c&d). The development of such features is of potential importance to sites being considered for gas storage where above ground gas pipelines would be present onsite. The extraction of brine from the eastern areas of the Preesall Saltfield in NW England reveals similar problems of surface subsidence and collapse structures and is outlined in the following section.
8.7.2.1.1 Subsidence associated with salt caverns related to former brining operations in the
Preesall Saltfield, NW England
ICI have for many decades extracted salt and brine from the Preesall Saltfield near Fleetwood, Lancashire. Many caverns were developed and the earlier examples are often associated with subsidence problems due to uncontrolled brining. In general, these collapse craters and subsidence features are located in the older (eastern) areas of the worked brinefield, where the brining operations were aimed at removing as much salt as possible. Often this removed the supporting and protective roof salt, causing damage to the overlying mudstones and leading to their collapse into the cavern with time. As a consequence, large subsidence hollows and collapse structures of varying size have developed, some of which are now the sites of deep craters and lakes (Fig. 5b and Wilson & Evans, 1990).
The later brine caverns were located further west along the western limit of the worked saltfield and appear more stable. A subsidence monitoring system was established by ICI, although it appears not to have been kept up to date. On abandonment, the cavities were filled with brine and wellheads were sealed, with the natural creep of the salt (and thus tendency for cavern walls to move in and close the cavern) left to equilibrate with the pressure of the brine in the caverns. This build-up in pressure due to salt creep is clearly illustrated by the brine geyser described in section 2.2.7.6.1.
The collapse chimney’s of course may provide pathways for the downward movement of water potentially adding to the dissolution of salt at depth. However, it is likely that below a certain depth, there is no groundwater circulation. Any waters that penetrate down below this depth will become saturated and may effectively protect the salt from further dissolution. The presence of such structures and the brine saturation levels would require careful study and monitoring to ensure activities elsewhere in the brindefield did not affect ground conditions, permitting movement of fresher waters and possible renewed salt dissolution for example.
8.7.2.2 PROBLEMS ASSOCIATED WITH OLD WELLS IN SALT BEARING SUCCESSIONS
Certain events in the USA and Algeria, whilst closely related to the previous section, are worthy of mention in their own right and highlight the problems of old oil and brine wells in areas of halite and old mine workings (Warren, 2006). An example of a mine intersecting an old well at the Winsford Mine in the Cheshire basin is also reported and all incidents (described in more detail in Appendix 2) are relevant to UK proposals. Again, the list of such examples in Appendix 2 is not exhaustive, merely illustrative. However, in all examples, old wells led to problems of water ingress and instability of a mine or areas of a brinefield. They illustrate the problems and dangers that can occur in areas as a result of inadequate site characterization and liaison with relevant authorities, in the process of defining positions of old abandoned oil or brine wells etc. Without rigorous/diligent site characterisation, they could present similar problems at UK UGS sites. The scenarios this might cover in the UK context could include:
• Old wells (including non brinewells) not properly capped and abandoned might provide pathways to depth for fresh or undersaturated water that has the potential to cause
101

unknown solution and thus cavity formation in the salt formation at around the level of proposed caverns
• A brine cavern being constructed and intersecting a previously unknown (and which might remain unknown until cavern pressure tests are conducted) well, leading to possible risk of communication or failure of the pressure test
• Previously unknown wells into the salt storage formation not intersecting the cavern, but that might, if the cavern is operated in brine compensated mode, ultimately be encountered or intersected as a result of unmonitored cavern enlargement during storage operations
The scenarios and examples described in Appendix 2 demonstrate the requirement for careful preparatory work that includes both checking of borehole siting records and detailed ground investigations.
8.7.2.3 PROBLEMS ASSOCIATED WITH NEW OIL EXPLORATION WELLS IN SALT BEARING
SUCCESSIONS AND FORMER MINED AREAS
An incident in America, involving the drilling of an oil exploration well in 1980 (described in more detail in Appendix 2), is of likely relevance to some UK proposals where salt beds occur within areas having hydrocarbon potential and in which exploration is possible in the future (e.g. the Cheshire Basin, NE England, Dorset). During the drilling of the well from a pontoon in a lake, an unused section of a salt mine was intersected around 350 m below lake level. This resulted in rapid flooding of the mine workings and emptying of the lake. It again illustrates the problems and dangers that can occur in areas as a result of inadequate site characterization and liaison with relevant authorities, in the process of defining positions of previous and abandoned mine workings. The scenarios this might cover in the UK context would include:
• the drilling of an exploration well in an area of gas storage caverns, especially if the well were to be deviated from the surface position some distance to the final depth location
• drilling a well in an area that might intersect old mine or brine cavern workings and with gas storage caverns close by. This could cause water ingress and a sudden collapse that might lead either to a chain reaction and rapid expansion of the affected area, or slower dissolution and cavity formation that then impacts upon the area of the storage caverns and ultimately their integrity and safety
Again, the examples demonstrate potential scenarios that illustrate the requirement for careful preparatory work that includes both checking of records and detailed ground investigations.
102

9 Incidents and casualties at underground hydrocarbon storage facilities
This section outlines documented problems encountered at UFS facilities and incidents of leakage of varying degrees of severity (Tables 7 – 11; see also Evans, in press). Appendix 5 provides more detailed descriptions of the cause and where possible, the resolution, of each event. In the main, reports of problems are from American and European sites. At this stage of the survey, no incidents have been found reported from Eastern Europe or Russia, although we expect them to have occurred.
The problems and incidents are dealt with by storage type (depleted reservoir, aquifer, salt cavern and abandoned mine) and country. Overall, 65 reports of instances of problems encountered at UFS facilities have been found. Of these, 27 have been at salt cavern facilities, 17 at aquifer and 16 at depleted oil/gasfields (Table 7). Escape or leakage of stored product appears most prevalent at salt cavern storage facilities, which are generally shallower than those in oil or gas reservoirs and as described in Chapter 2, differ considerably from facilities constructed at depleting/depleted oil and gasfield sites. Only 9 deaths related to UFS have been found reported in the literature, with around 62 injured and circa 6700 evacuated. However, the latter figure does not include figures from the village of Knoblauch, near Ketzin (west of Berlin) that was apparently permanently evacuated following one gas leak (see section 9.2 and Appendix 5). Of the reported deaths, 8 have occurred at salt cavern facilities and all of these have been in America (West Hackberry, Mont Belvieu, Brenham and Hutchinson). A ninth death was reported at the Ketzin gas storage facility during the 1960s (NJ Riley, pers comm., 2007). Indeed, 53 of the reported incidents have occurred in America, with California (12) and Illinois and Texas (10 each) having the highest number of incidents found. The 65 incidents have, however, been of varying cause, severity and nature, with some involving only minor problems that were quickly rectified and at no stage threatened failure of the facility or release of product.
9.1 DOCUMENTED INCIDENTS AT DEPLETED OIL AND GAS FIELD FACILITIES
As described in Chaper 2, underground gas storage operations were first undertaken at an operating gasfield in Welland County, Ontario (Canada) in 1915. The first gas storage facility in a depleted reservoir was built in 1916, using a gasfield in Zoar near Buffalo, New York (USA), and remains the oldest operational facility (WGC, 2006). Gas storage in depleted oil/gasfields now represents around 76% of the total number of UGS facilities (Plaat, 2004 & this volume; EIA, 2006).
This study has identified 16 documented problems and incidents at depleted oil and gas field facilities (Tables 7&8), with 3 of these cases (19%) having involved casualties or evacuees. No fatalities have been reported. Relative to today’s number of operational facilities (478), which are fewer in number than in recent history, this represents an incident rate of 3%, with 0.63% involving fatalities/casualties/evacuees (Tables 2,7&8). Fourteen (c. 88%) of the cases (Table 8) have occurred in America, of which, 11 (c. 69%) have been in California. In all, 5 people have been injured and around 83 people evacuated during reported incidents. All cases involve injection and storage of natural gas.
In terms of the main failure mechanisms or difficulties encountered at depleted oil/gasfield facilities, 2 scenarios with 5 incidents (c. 31%) apiece were associated with:
• failure of the well or casing (due to cracks, damage, corrosion or during repair/maintenance) at Fort Morgan, Colorado (State of Colorado, 2006) and 3 in California. In the latter, 2 were related to repairs of wells and 1 was due to damage
103

during an earthquake (Vector Magnetics, 2007). All 3 Californian well incidents were rectified by directional drilling of sidetracked wells, isolating and plugging the damaged sections (Appendix 5). The fifth case of problems with a well was an anomalous pressure rise in the annulus of a gas storage well at the Breitbrunn/Eggstatt Gasfield (Bavaria, Germany) in 2003 (Bary et al., 2002; Überer et al., 2004). The incident is not reported as having led to serious problems, with repairs to the well casing quickly and successfully undertaken (Überer et al., 2004).
• migration from the injection footprint, due effectively to overfilling at: (East) Whittier (Benson & Hepple, 2005), Epps (Coleman, 1992), Playa del Rey (Reigle, 1953; Chillingar & Endres, 2005) and Castaic and Honor Rancho (Khilyuk et al., 2000; Davis & Namson, 2004). At Playa del Rey, gas leaking from the reservoir into the adjoining Venice Beach accumulation was known since the earliest days of operation (Reigle, 1953; Chillingar & Endres, 2005). Gas migration to shallower levels was believed to be related, in part, to faulting of the caprock in the Castaic Hills & Honor Rancho, Playa del Rey cases and the El Segundo facility (Reigle, 1953; Khilyuk et al., 2000; Exploration Technologies Inc., 2000; SoCal, 2004; Chillingar & Endres, 2005).
Three incidents (18% of cases) were related to problems with above ground infrastructure at: McDonald Island, California (Delta Protection Commission, 1997), Playa del Rey (SoCal, 2004) and the Rough Storage facility, Southern North Sea (HSE, 2006; Centrica, 2006). The offshore Rough Gas Storage Field, about 31 km (20 miles) off Withernsea on the East Yorkshire coast, represents the one recorded incident in a depleting gasfield in the UK, on the 16th February 2006. An explosion and fire occurred on the Bravo 3B platform, which led to the evacuation of 31 workers, whilst 25 essential staff remained on the platform. Two workers suffered from burns and the effects of smoke inhalation and were treated in hospital. The cause of the accident appears to have been the catastrophic failure of a cooler unit and an explosion in that vicinity (HSE, 2006; Centrica, 2006 – Appendix 5).
9.1.1 California and the case of numerous old oilfields with migrating gas in an urban
environment and the impact on the perception of gas storage safety issues.
California provides 11 (c. 69%) of the UFS incidents at depleted oil/gasfield sites and c. 18.5% (12) of all (65) UFS incidents, somewhat distorting the statistics and is worthy of further appraisal. The region has been an area of intense hydrocarbon exploration and production since the latter part of the 19th and early part of the 20th centuries (Chilingar & Endres, 2005). Over 70 oilfields have been discovered in the Los Angeles Basin alone (Appendix 5) and many oil wells were drilled on these fields in very close proximity to one another (refer figs 22&23 and http://www.consrv.ca.gov/DOG/photo_gallery/historic_Mom/photo_01.htm). In the UK, there has been no drilling on the intensity seen in American urban environments at the turn of the 20th
Century, sites of which became heavily populated.
The depleted Playa del Rey (PDR) oilfield is one of 5 gas storage facilities that operated within a 64 km (40 mile) radius of the Los Angeles region until the late 1990s (Chilingar & Endres, 2005). Hundreds of oil wells were drilled from derricks that once blanketed the landscape (Fig. 22b). The majority of these oilfields are now abandoned, but the area has been left with a legacy of old, disused wells, the locations of which are often poorly known, but that now lie beneath densely populated urban areas.
The oilfields in the Los Angeles area provide numerous instances of potentially explosive methane gas seeping to the surface in heavily built-up areas, raising the possibility of a major incident (Hamilton & Meeham, 1992; Renwick & Sandidge, 2000; Gamache & Frost, 2003; Chilingar & Endres, 2005). The Fairfax and Belmont oilfield gas leaks are of particular interest when incidents at the gas storage facilities developed at the Montebello and PDR oilfields are considered. The problems associated with, and the failure to completely retain injected gas in the 5 storage facilities developed in depleted LA fields, could be explained by and be related to, the
104

rather unique geological environment represented by the Los Angeles area. The LA incidents may, therefore, not be typical of the likely problems encountered in depleting oil/gasfield storage elsewhere and may distort the gas storage safety figures.
Leakage problems in existing fields have been most vividly illustrated in incidents at, for example (Figs 22a,c&f & 23), Fairfax (1985, 1989, 1999 and again in 2003; Gamache & Frost, 2003; Chilingar & Endres, 2005), La Brea Tar Pits (associated with the Old Salt Lake and South Salt Lake oilfields respectively) and at a school site in Belmont (the Los Angeles City Oilfield). In March 1985, methane that had accumulated in the basement of the Ross Department Store ignited and caused an explosion that injured 23 people. Fires also broke out along surface cracks and fissures that developed nearby and burnt for days after the explosion (see Gamache & Frost, 2003). The escaping gas originated from the Old Salt Lake Oilfield lying immediately beneath the area and had migrated up along at least 2 wells and the Third Street Fault that reached surface beneath the department store. One of the wells was an old abandoned vertical well, but the second was a relatively modern inclined well that was found to have suffered corrosion below 366 m depth (Chilingar & Endres, 2005). A very similar gas leak incident occurred on February 7th 1989 across the street from the 1985 explosion (Chilingar & Endres, 2005). In January 2003, serious gas leakage problems were discovered in the vicinity of Allendale and Olympic Boulevard, in the Fairfax area. The gas had been leaking to the surface along abandoned and poorly completed wells (Chilingar & Endres, 2005). A leak was detected and a potentially major hazard averted in 1999 at the intersection of Wilshire and Curson streets just south of the La Brea Tar Pits above the South Salt Lake oilfield, (approximately 1.6 km from the Fairfax incidents).
Gas migration problems were also identified during the $200-million Belmont High School development, in Northwest downtown Los Angeles (Fig. 23b). Construction was halted by the discovery of high levels of methane in the soil across the site. Geological investigations revealed the gas originated from the underlying Los Angeles Oilfield, with a fault below the school site thought likely to have provided a pathway to the surface. Archival photos of the area circa 1890 also show hills blanketed by oil derricks, the majority of sites of which are not documented and are now covered by homes, business premises and the site of the school (Fig. 23c&d). A decision to abandon work on the school was taken in January 2000, although pressure to recommence work remains.
These incidents were all related to the presence of old corroded wells, many of which were drilled before official records were kept and over which high density housing (largely apartment buildings) had been developed (Chilingar & Endres, 2005). Other contributory factors included blocked ventilation wells and ongoing oil and gas production involving waste disposal or secondary recovery operations increasing reservoir pressures (Hamilton & Meehan, 1992; Chilingar & Endres, 2005). Increased pressures had driven the gas out of the storage reservoir and up old wells with poorly completed or corroding and deteriorating steel casings and cements. The overpressuring also caused the periodic ‘opening’ of the Third Street Fault, further exacerbating the situation (Hamilton & Meehan, 1992).
9.1.2 Gas leaks at the Montebello and Playa del Rey converted oilfield gas storage
facilities
The Montebello and PDR oilfields in the Los Angeles area were discovered many decades ago and during production, hundreds of unregulated (or unmonitored) oil/gas wells were drilled, the majority of which are now abandoned (Fig. 22b&e). Many of these wells were drilled before today’s rigorous drilling and completion standards were implemented or applied (Chilingar & Endres, 2005). Following production, the oilfields were converted to gas storage facilities.
In the case of Montebello, gas had been injected at a depth of around 2286 m and was subsequently found to be leaking to the surface along old wells, again, many of which were drilled in the 1930s (Chilingar & Endres, 2005). Investigations have revealed that the old well
105
casings and cements are unable to cope with the increased pressures, allowing high-pressure gas to enter the old wells and migrate to shallower depths but not to the surface (Benson & Hepple, 2005). The problems encountered led to the facility being closed in 2003 (Chilingar & Endres, 2005; EIA, 2006).
The PDR Oilfield was discovered in 1929 and is developed in the western Los Angeles Basin, about 17.5 km WSW of downtown Los Angeles. Between 200 and 300 operational or abandoned oil/gas wells have been drilled across the field, although the precise total is unknown, with areas once densely covered by oil derricks (Fig. 22b). The field comprises two accumulations separated by a NW-SE trending ridge of basement (Mesozoic) rocks referred to as the Santa Monica or Catalina Schist (Fig. 24): a northwestern ‘Ocean Front’ or ‘Venice Beach’ accumulation and a southeastern accumulation, known as PDR that extends north of the Ballona Creek (Eggleston, 1948; Landes et al., 1960; Barnds, 1968). The field quickly depleted and in 1942, as part of the wartime effort, it was converted for use as a gas storage facility, full-scale operations commencing in June 1943 (Barnds, 1968). PDR has continued to be used as a storage facility and since 1945 has been operated by Southern California Gas (SoCal). Investigations have revealed that gas has, since the earliest days of operation, leaked from the reservoir both into the adjoining Venice Beach accumulation and also upwards to surface via faults, old wells and intermediate ‘collection zones’ (Reigle, 1953; Chillingar & Endres, 2005).
The PDR area has been the focus of attention since the 1990s as land in the Venice, Ballona Creek and PDR region, immediately overlying the PDR oilfield is being considered for major urban development (e.g. Davis & Namson, 2000; Chilingar & Endres, 2005). However, there are numerous documented instances of gas leaking to the surface at PDR, with gas seen bubbling up in waters of the Marina and Ballona Creek/Channel, in shallow lakes alongside old well casings (Fig. 22d), and in standing water following heavy rains (Chilingar & Endres, 2005). Analyses of the gases from the Ballona Creek and other leaks indicate that it is seeping up from deep underground with estimates for the rate of gas loss due to uncontrolled migration and/or seepage into the atmosphere put at around 2.8 Mcm per year (Tek, 2001; http://www.saveballona.org/ expert.html).
The change of land use has led to problems, with the PDR area the centre of a major ongoing battle to prevent the development of a large housing project over the oilfield. When excavations began for the actual construction of the housing development, it was discovered that wells, abandoned as recently as 1993 to make way for the housing development, were found to be leaking (Chilingar & Endres, 2005). In each case, homes were constructed over the old wells after minimal efforts were taken in an attempt to reseal the wells. There have also been attempts to install a membrane to try and stop the migration of gas into buildings. Further problems are posed by some of the larger buildings. These require the driving of piles up to 15 m down through the poorly consolidated river terrace and wetland marsh sediments into solid rock and that provide further potential gas migration pathways.
Opposition groups to the Playa Vista development have alluded to the Fairfax and Belmont gas seepage incidents, highlighting the problems of old wells and possible unmapped faults in the area, as valid reasons for the abandonment of the project. The Playa Vista development and associated problems clearly highlight the difficulties encountered with urban encroachment into oil and gas fields, not just within the Los Angeles Basin, but anywhere with historical oil production (Chilingar & Endres, 2005).
9.1.3 Hydrocarbon exploration well, Hatfield Moors, England
Although not a gas storage incident, the Hatfield Moors gas well explosion and fire has some relevance, as the depleted gasfield has, since 2000, become one of the UK’s few operational gas storage fields (Ward et al., 2003). The Hatfield Moors Gasfield was discovered by accident in December 1981, when the Hatfield Moors No.1 exploration well unexpectedly encountered gas in a Westphalian sandstone reservoir at around 425 m below ordnance datum (OD). This led to a
106

major gas escape that ignited with the ensuing blaze destroying the drilling rig. There were no casualties, but fire was not brought completely under control until 38 days after the initial explosion, by which time around 28.3 Mcm of gas had been consumed in the fire (Ward et al., 2003).
9.1.4 Summary/discussion
As alluded to, underground fuel storage facilities in California account for 11 of the documented problems in this category. California represents a special area for a number of reasons:
• It is a highly petroliferous area, developed in (relative to the UK) young (Cainozoic) sedimentary rocks
• It is an area of ongoing seismic activity. The area is undergoing compression related to plate tectonics, which is associated with transpressional tectonic forces. This has resulted in the formation of many anticlinal traps with numerous surface rupturing faults that have contributed to fracturing of strata over of large areas
• It has a long history of (often unregulated) oil exploration dating back to the late 1800s, with many thousands of wells having been drilled across the State, often of very high density
• As a consequence, the locations of many wells are not known accurately, with many not known at all. Also, many of the older wells now have no, or at best old and deteriorating, well completions (casings and cement)
Consequently, California provides a high number of incidents associated with UGS and distorts the data. Whilst data provide important information on problems encountered and modes of failure of UGS infrastructure for planning and risk assessment, many of the problems and geological factors encountered in California would not necessarily be applicable or relevant to assessment of UGS in the UK situation.
9.2 DOCUMENTED CASES OF PROBLEMS OR INCIDENTS AT AQUIFER
FACILITIES
Underground gas storage operations in an aquifer were first undertaken in 1946 at a site in Kentucky, USA (Chabrelie et al., 1998; Favret, 2003) and there are currently about 80 operational aquifer storage facilities in the world today. Most of these are in the United States, the former Soviet Union, France, Germany and Italy.
This study has identified 17 documented problems and incidents at aquifer storage facilities (Tables 7&9). Two incidents (c. 12% overall), both in Europe provide the only fatality, casualties and evacuees at aquifer storage sites: Ketzin and Spandau, both on the outskirts of Berlin in Germany. Relative to today’s number of operational facilities (80), which are fewer in number than in recent history, the 17 reported incidents represents an incident rate of c. 21%, with cases involving fatalities/casualties representing 2.5% (Tables 2, 7&9). All involve injection and storage of natural gas, with 12 (c. 71%) having occurred in the USA, of which, 8 (c. 47%) have been in Illinois (Buschbach & Bond, 1974; Coleman et al., 1977; Perry, 2005). To date, 5 documented incidents (c. 29%) have occurred in Europe (at Stenlille in Denmark, Chémery in France and Spandau, Frankenthal and Ketzin in Germany).
Two incidents in Europe resulted in the reporting of the only fatality, casualties and evacuees at aquifer storage sites. Sketchy reports exist for an incident, at Ketzin around 25 km west of Berlin in Germany (refer Appendix 5). During the 1960s, town gas was being stored underground in an aquifer, when leakage led to the seemingly permanent evacuation of the village of Knoblauch (New Energy News, 2007; Kanter, 2007; MyDeltaQuest). These reports mention that leakage of carbon monoxide (CO) was also associated with the leak (MyDeltaQuest), which is believed to
107

have led to 1 fatality as a result of CO having come up an old well into a house. The well was repaired and sealed following the incident (N.J. Riley pers comm., 2007) and natural gas continued to be stored in the anticlinal structure from the 1970s until 2000, when the facility closed, leaving only cushion gas in the aquifer. The stored gas was thought to have been escaping through the cap rock, perhaps aided by the presence of faults, as a gas chimney is associated with one important fault zone in the crest of the structure (see e.g. Juhlin et al., 2007).
A second incident occurred at Spandau, in the western suburbs of Berlin (Germany) on April 23rd 2004 (Associated Press, 2004; Berliner Zeitung, 2004a,b&c). At about 9.40-9.45 am, an explosion destroyed part of the wellhead of a monitoring well (B5). This allowed the escape of gas that ignited, resulting in a flame about 30 m high. The gas escaped for about a day before it was brought under control. The explosion destroyed a tanker truck and damaged several buildings at the gas storage site, leaving 9 injured, 3 seriously. It led to the evacuation of around 500 people within 1 km of the site (F. May, pers. comm., 2004). Although maintenance work was being carried out, involving H2O2 treatment of the well following winter operation at the time, the cause of the incident is unclear (F. May, pers. comm., 2004). Work on the contents gauges at the facility was also ongoing at the time and failure of a seal is thought to be a possibility. At no time was the stored gas inventory in danger (GASAG, 2004).
Problems with, or failure of, the well or casing (due to cracks, damage, corrosion or during repair/maintenance), was involved in 3 (c. 18%) of the documented cases. Two have been in Europe, at Stenlille, Denmark (well casing - Laier & Øbro, 2004 & this volume) and at Chemery, France (during routine maintenance of a well completion and replacement of a filter - NAWPC, 1999; IAVWOPSG, 2005). The third was at Leroy, Wyoming (USA), where gas leakage was linked to corroded casing and overpressuring of the aquifer (Katz & Tek, 1981; Araktingi et al., 1984; Nelson et al., 2005). At a facility in Northern Indiana, the reservoir/structure leaked gas (Buschbach & Bond, 1974; Perry, 2005). Unlike some of the leaking fields that utilize shallow gas capture through shallow wells before the gas can reach the surface, this field (at approximately 457 m) was deemed too shallow for this type of procedure and was abandoned (Kent Perry, 2007 pers comm.).
In terms of the difficulties encountered at other facilities, problems with the cap rock provided the main ‘failure’ mechanism and all such leakages occurred at facilities in the USA. It was found that in 9 (c. 53%) of the cases, gas had migrated to shallower levels due mainly to the predicted caprock not having been gas tight. In 3 (c. 18%) of those cases, faulting of the caprock is also thought likely to have been a contributary factor in the migration of the product from the reservoir (Jones & Drozd, 1983; Jones & Pirkle, 2004; Morgan, 2004).
9.3 DOCUMENTED CASES OF PROBLEMS OR INCIDENTS AT SALT CAVERN
GAS STORAGE FACILITIES
Large underground salt caverns provide secure environments for the containment of materials that do not cause dissolution of salt. As outlined in Chapter 2, salt caverns have been used for the storage of a range of materials including liquid (oil, liquified petroleum gas [LPG] and NGL’s), gaseous hydrocarbons and hydrogen. However, this study has found evidence for 27 reported problems at salt storage facilities. Relative to today’s number of operational facilities (66), which are fewer in number than in recent history, the 27 reported incidents represents an incident rate of c. 41%, with cases involving fatalities/casualties (5) representing 7.6% (Tables 2, 7&10).
In terms of the main failure mechanisms or difficulties encountered at salt cavern storage facilities, problems with, or failure of, the well or casing (due to cracks, damage, corrosion or during repair/maintenance), was involved in 11 (c. 41%) of the 27 documented cases (Tables 7&10). Of these, 4 (c. 15%) well-related incidents (Hutchison, Brenham, Mont Belvieu and West Hackberry) led to 8 fatalities (Fig. 25). Failure of above ground infrastructure was involved in 5 (c. 19%) of the incidents (valve, pipes, wellhead or compressor units). They represent the highest
108

rate of failure of this nature in all storage facility types and resulted in 3 fatalities at Brenham. Three facilities were brined but never commissioned, one at Bayou Choctaw (Louisiana) failed due to uncontrolled leaching. Problems were encountered at the Clovelly and Napoleanville (Louisiana) sites, due to insufficient site characterization, with the caverns being built too close to the edge of a salt dome and encountered ‘host rock’ in the cavern walls (Neal & Magorian, 1997).
Large volume losses occurred in caverns at 3 facilities (c. 11%): Eminence, Louisiana (Allen, 1972), Kiel in Germany (Coates et al., 1981; Bérest & Brouard, 2003) and Tersanne in France (Thoms & Gehle, 2000; Bérest & Brouard, 2003). The Eminence facility operated for over 10 years, but the loss of cavern capacity due to having operated at pressures too low to maintain cavern walls, appears to have led to its closure in the early 1980s. However, operations appear to have resumed, with cavern volume having been regained by further brining operations (Warren, 2006). The Tersanne facility, one of a number of caverns operated by Gaz de France in southeast France, remains operational having also recovered much of the original volume loss (Thoms & Gehle, 2000; Warren, 2006). Kiel has continued operating, storing town gas since 1971 (Padró & Putsche, 1999).
Two incidents involving storage of LPG, at Brenham, Texas (NTSB, 1993a&b, 2006; Thoms & Gehle, 2000; Gruhn, 2003) and Petal, Mississippi (AEA, 2005), arose from overfilling of the caverns and must again be deemed the result of human error. Both were operated in brine compensated mode, which if poorly monitored and controlled, can lead to further undetected enlargement of the cavern and inaccuracies in storage volumes. A third incident where a propane storage facility was operated in brine compensated mode occurred at Mineola, East Texas (USA) in 1995 led to a release of propane and an explosion followed by a fire (Gebhardt et al., 1996; Bérest & Brouard, 2003; Warren, 2006). Here, communication between 2 caverns resulted from the injection of brine during each cavern emptying-filling cycle, which dissolved the salt wall between the 2 caverns, causing structural weakness and ultimately failure (refer Appendix 5). The accident was, therefore, the result of human error on at least two counts. Firstly, enlargement of the caverns and a narrowing of the intervening salt wall by the injected brine went unnoticed. Secondly, one cavern was held at much lower pressure than the adjoining one, which resulted in pressure induced failure of the thinned intervening cavern wall (Bérest & Brouard, 2003; Warren, 2006).
A number of cavern storage sites exist in and around Conway (Kansas, USA) storing NGL’s, some of which have operated since 1951 (Ratigan et al., 2002). One NGL storage facility in the area has experienced sustained leakage of product from caverns, possibly since 1956. NGL’s and gas have been encountered in both storage wells and domestic wells on at least 6 separate occasions between 1980 and 1981. In December 2000, NGL’s were encountered in a newly drilled well at the site (Ratigan et al., 2002). Investigations have shown that large parts of the Conway area are affected by salt dissolution (wet rockhead). This has led to the development of collapse breccias forming voids with wells losing circulation at the top of the salt and into which hydrocarbons have migrated (Ratigan et al., 2002). Investigations into the leaks and possible remedial action are ongoing.
9.3.1 Discussion
Two cases of problems encountered at salt cavern facilities (Clovelly and Napoleanville, Louisiana) were due to insufficient site characterization, with the caverns having been built too close to the edge of a salt dome such that there was not enough salt ‘buffer’. In terms of the UK, this is not really an issue onshore, as there are no halokinetic structures. However, it would have similarities where a previously unknown large fault, producing an offset of the bedded salt deposits, might be close by a proposed facility, with the potential to intersect or impact on the cavern walls. Over much of the workable salt beds area onshore in the UK (mostly the Cheshire Basin, but including Wyre in Lancashire), exposure of rocks at surface is often poor, with thick
109
glacial drift deposits blanketing the bedrock (solid) geology. A lack of exposure and also subsurface information in terms of boreholes and/or seismic reflection data, mean that surface geology is not, therefore, always well constrained. It is possible that site characterization (subsurface mapping etc. using high resolution seismic reflection data for example) may not yet have been adequately undertaken and that possible faulting of an area is as yet poorly constrained or even unrecognized.
Consequently, it might be expected that detailed site characterization would be required to adequately delineate not only the extent of the salt body (and structures affecting it) in which gas storage is proposed, but also its physical properties. This could include acquisition of seismic reflection data of high enough quality (resolution) to image the main structure and any faults present.
The Clovelly and Napoleanville examples could have more relevance in the offshore environment, where thick Zechstein and Triassic salt deposits occur. The offshore area is not the subject of this report, but is worthy of note as the Government is considering the prospects for offshore UGS, that would include salt cavern facilities. In the East Irish Sea and particularly the Southern North Sea, halokinesis has given rise to large salt structures (pillows, domes and walls) that could offer sites for storage caverns. The Government is currently considering the feasibility of such schemes and revisions that would be required to current legislation related to storing gas in offshore areas (Smith at al., 2005; DTI, 2006c&d, 2007).
9.4 DOCUMENTED INCIDENTS AT ABANDONED MINE FACILITIES
Few hydrocarbon storage facilities exist in abandoned mines (Table 2), with 4 documented problems and incidents at abandoned mine storage facilities having been identified. Together with an incident that occurred at what is described as an unlined rock cavern facility, this category of storage represents about 8% of overall UFS incidents (Tables 7&11). Of the 2 facilities where natural gas was being stored in abandoned coalmine workings (Leyden, Colorado - Raven Ridge Resources, 1998 and Anderlues in southern Belgium - Piessons & Dusar, 2003), problems with leakage through the caprock or overburden was encountered. Leyden ceased operations in 2001 and was converted for water storage, whilst at Anderlues, gas storage operations began in 1980 but ceased in 2000, due to connectivity with shallower mine levels, and leakage through the caprock.
A third facility, at Weeks Island, Louisiana, was developed in an old salt mine, storing crude oil as part of the American Strategic Petroleum Reserve (SPR). The facility experienced problems associated with wet rockhead and sinkhole formation that ultimately caused the withdrawal of the stored oil and its closure (Neal & Magorian, 1997; Warren, 2006).
A fourth facility at Crossville (Illinois) is believed to have been a former coalmine, storing propane at a depth of around 60 m. The facility experienced leakage to surface over most of its 30-year life (Pirkle, 1986, Pirkle & Price, 1986, Jones & Burtell, 1994). In 1981-1982 investigations revealed that product escaped from storage via the mineshaft and one of the mine drifts (tunnels). Migration within the overburden was pressure driven along faults, fractures and joints (Pirkle, 1986; Pirkle & Price, 1986; Pirkle & Jones, 2004).
Brief details exist of a product release incident on 24 August 1973 at what was described as an ‘unlined underground cavity’ at the Ravensworth Propane Storage Facility (Berest, 1989; N Riley, HSE pers com 2007). The facility is presently operated by Washington Gas Light Company and believed to be in Virginia, USA. The propane was stored in an unlined underground cavity (which is inferred to be a salt cavern, although this has not been confirmed), around 130m below ground level with a capacity of approximately 50,000 m3. Cavern operations continued whilst water was injected in the vicinity of the well in an attempt to stem the emissions. The latter point would indicate that the storage rock is not in fact salt.
110

9.5 FREQUENCY RATES OF NATURAL GAS STORAGE INCIDENTS AND
INCIDENT FREQUENCIES FROM OTHER STUDIES
This study has described problems at 65 UFS sites, however, a lack of information relating to many of the 65 problems described above means that at this stage, information on the number of wells at any one site, the years of operation/downtime or exact opening/closure date is not available. It is, therefore, difficult to determine the incident rates relative to ‘storage experience’, either as the total operational hours of gas storage against number of incidents, or the total operational well hours against the number of incidents.
A report by the Ohio Environmental Council (2006), attempted such estimates during an assessment of the potential for underground storage of CO2 (Lippman & Benson, 2003; Perry, 2005). These figures are, however, related to US storage facilities and are not worldwide figures. The report states that such experience amounts to in excess of 10,000 facility years and demonstrates that operational engineered storage systems can contain methane with release rates of 10-4 to 10-6 per year.
A recent review of documented data from the 1970s onwards, which only identified 17 accidents associated with fugitive gas emissions from natural gas storage facilities, provides operational figures incorporating facilities outside the USA (Papanikolau et al., 2006). The review of incidents, whilst more restricted than in this report, is nevertheless useful. It provided the cumulative operative years of natural gas storage sites, which were calculated to be 20,271 years with well operations to be 791,547 well-years. Of the incidents identified, 1 occurred during maintenance of surface equipment and was not included in the natural gas storage leakage frequency calculation. The remaining 16 were associated with underground causes (principally, well failures).
The incident frequencies associated with these facilities were then calculated, showing:
• The frequency of a major incident from a natural gas storage facility was 8.39x10⁻⁴
/site/yr, or once every 1,192 years of site operation.
• The frequency of a major incident from a natural gas storage well was 2.02x10⁻⁵ /well/yr, or once every 49,505 years of well operation.
These results were compared with a smaller sample European study (MARCOGAZ; Joffre & LePrince, 2002), where the accident frequency from well failure was calculated as 5.1x10⁻⁵
accident/well/yr (see section 9.5.1). By comparison, a study of blowouts from oil and gas reservoirs offshore revealed a production blowout frequency of 5x10⁻⁵ per well/yr, or a major gas release from a well once every 20,000 well-years (Holand & Holland, 1997; Papanikolau et al., 2006).
9.5.1 The MARCOGAZ European UGS Study
In 1998, an ad hoc working group was established by MARCOGAZ to exchange information on UGS operations. This work was essentially dedicated to the survey of the consequences of some EC Directives:
• The COMAH Directive (Control of Major Accidents Hazards involving dangerous substances) or SEVESO II Directive (Dir. 96/82 of 12/9/1986) to be applied by Member States from February 1999
• The Water Framework Directive (Directive 2000/60/CE of 23/10/2000) establishing a new policy in the field of water and replacing the existing Groundwater Directive 80/68 of 17/12/1979).
111

At a meeting in 2000 with the participation of 8 companies involved in UGS activity (DISTRIGAS, DONG, ENAGAS, ENI-AGIP, Gaz de France, ÖMV, RUHRGAS and TRANSCO), it was decided to establish a database for major accidents on UGS facilities based upon the COMAH Directive, namely, that “The scope of the COMAH Directive concerns some industrial activities using dangerous substances. Natural gas is one of these substances so that UGS and LNG terminals are concerned with the COMAH Directive regarding two thresholds, which correspond to 50 t and 200 t of natural gas.” The purpose of the database was to “help to prove to the public and to national authorities the high safety level of UGS, to dissipate fears of people bordering of UGS sites and to contribute to reducing the requirements of authorities by implementing the SEVESO II Directive in each national Law system.”
The database was established (Joffre & LePrince, 2002) and contains information from each company involved in the UGS Working Group. The accidents included in this database were selected using the criteria defining major accidents and given in Annex VI of the COMAH Directive. The criteria can be summarized as follows:
1. Fire, explosion or accidental discharge involving at least 10 tons of natural gas (5% of 200 tons).
2. One death or, • injuries inside establishment or,
• 1 injury outside establishment or,
• housing damaged or made unavailable outside establishment or, • evacuation or confining of people for more than 2 hours (persons x hours <=
500) or, • interruption of drinking water, electricity, gas or telephone supply for more
than 2 hours (persons x hours <= 1000) 3. Effects on environment
a. permanent damage: 0.5 ha of a protected area or10 ha of a larger area
b. significant damage: 1 ha of a groundwater aquifer10 km or more along a river
1 ha or more of a lake
2 ha or more of a coastal area or sea
4. Material damage a. More than 2 Million Ecu inside establishment b. More than 0.5 Million Ecu outside establishment
5. Transboundary damage
In total, 7 companies responded covering 7 European countries (Table 12; DISTRIGAS, DONG, ENAGAS, ENI-AGIP, Gaz de France, ÖMV, RUHRGAS), with 11 reports of major accidents produced from 3 of the 7 participating companies. Four of the 7 companies, therefore, had no major accident despite the fact that 1 of these 4 has a very important set of UGS sites. Furthermore, only short report forms were returned by 2 companies (due to loss of information from older incidents), which meant that only limited information is available for some incidents, thereby limiting analysis.
The scope of the database for UGS is concerned with all parts of the infrastructure at storage plants, i.e. wells, compressors, treatment & measuring facilities and pipework systems that have led to any particular incident. The breakdown of the information collected during the MARCOGAZ
survey of European UGS incidents to 2000 is provided in Table 13 (after Joffre & LePrince, 2002).
At the time, the 7 companies participating in the UGS MARCOGAZ survey were operating 42 UGS sites with 845 wells (corresponding to 77% of UGS wells in EU at the time), with a total of
112

970 cumulated years of operation at these sites (Table 12). The calculated average number of cumulated years of operations for the wells at these sites is 100,155 (based upon half the number of wells over the entire life of the sites, which is thus thought to be a minimum.
The survey results revealed:
• 6 accidents occurred due to surface processes over a cumulative period of 970 years, the probability for major accidents on surface facilities of UGS sites was thus calculated at 6x10⁻³ accident/year/site
• 5 accidents occurred due to wells over a cumulative period of 100,155 years, the probability for major accidents on wells of UGS sites was thus calculated at 5x10⁻⁵
accident/year/well • 1 accident occurred that resulted in severe injury due to well problems over a cumulated
period of 100,155 years, the probability of major accidents resulting in severe injury on wells was thus calculated at 1x10⁻⁵ accident/year/well
The main conclusions of the MARCOGAZ European UGS study (Joffre & LePrince, 2002) were:
• The frequency (i.e. number of accidents divided by the number of operative sites) was about the same during the 1970s and the 1980s, but about half that during the 1990s. This was interpreted as indicating that the safety level of UGS facilities improved due to increased experience and the additional measures taken by operators following these events
• The major hazards leading to accidents on UGS facilities arise from surface processes (P = 6x10⁻³ accident/year/site) with no accident resulting in severe injury reported. Safety measures for surface processes are, therefore, related to a regulatory framework that has now operated in each Member State for a long time
• For wells, despite one accident resulting in severe injury, the probability is much lower (P � 5x10⁻⁵ accident/year/well for all types of accidents and P = 1x10⁻⁵ accident/year/well for accidents with injury)
• The frequency of all types (wells and surface process) had decreased by about half during the last 10 years
• Except for 2 accidents causing injuries, all other cases of accidents were classified “major accident” because of the release of gas or material damage inside the UGS facility
• No death inside or outside the UGS facilities were reported • No injuries outside the UGS facilties were reported • No material damage outside the UGS sites was reported
The MARCOGAZ European UGS study represents an important, but limited source of information. It claims there have been no deaths inside or ouside a UGS facility, yet does not contain reference to the Ketzin incident during which there are reports of 1 fatality (NJ Riley, 2007 pers comm. - section 9.2 and Appendix 5).
9.5.1.1 RELATIONSHIP OF THIS STUDY TO THE MARCOGAZ SURVEY
This study has presented evidence of 12 incidents in Europe relating to UFS between the 1960s and 2006: 1 at a coalmine, 2 at depleted fields, 5 in aquifer facilities and 4 at salt cavern storage facilities (Tables 7-11). However, the responses of 7 gas storage operators (Joffre & LePrince, 2002) suggests that there is evidence of a number of other incidents (Table 12). Precise details are not readily available, but 11 incidents of varying severity to 1998 were reported, i.e. predating the Spandau (2004), Breitbrunn/Eggstatt (2003) and Rough (2006) incidents and involving natural gas (7), oil (3) and solid (1) storage. This would imply there are at least 2 incidents not widely reported or included in this study. Reported casualties from these 11 incidents numbered 4, one serious, with no deaths. The suspected causes were related to human error (3) or
113

plant/equipment (8). In all cases, the immediate source of the accident was either problems with wells (5) or surface process (6: Joffre & LePrince, 2002).
Except for 2 accidents causing injuries, all other cases of accidents in the MARCOGAZ study (Joffre & Le Prince, 2002), were only classified as a “major accident” because of release of gas or material damage inside the facility. Importantly, of those incidents reported, no injuries or material damage occurred outside the storage facilities. Importantly, therefore, neither the MARCOGAZ nor the Papanikolau et al. (2006) studies appear to have identified or reported the apparent death at Ketzin (Germany) in the 1960s.
Failure of the well as the main cause of product release is supported by a smaller study of fugitive gas emissions from natural gas storage facilities (Papanikolau et al., 2006). It was also noted that in both the USA and Europe the incidents of well failures were similar in the 1970s and 1980s but decreased significantly in the 1990s. This decrease is interpreted as being due to improved technology, better operational practices and regulatory improvements (Papanikolau et al., 2006). It may just be, however, that there has also not been time for the faults or problems with younger wells to surface.
9.5.2 Incidents known by the Risques du Sol et du Sous-sol Directorate
Storage of gas underground is undertaken on the outskirts of Paris and BGS has been advised of a conversation between Dr N Riley (HSE) and Mr M Ghoreychi (Directeur des Risques du Sol et du Sous-sol). The conversation at an INERIS seminar on 9th May, 2007, related to reports of a number of leaks from storage at one or more of these facilities, some of which have involved the loss of very large quantities of gas. Mention is made of the gas having leaked from shallow ‘caverns’ at 80 metres depth near Versailles.
The details are very sketchy and efforts to contact Mr Ghorechyi have, to date, proved unsuccessful. However, the report of ‘caverns’ would imply salt caverns at very shallow depths, or perhaps lined rock caverns. However, preliminary consulations of French 1:50,000 scale geological maps for the Paris-Versailles region indicate that whilst gypsum is present in the Paris Basin, there is no mention of halite beds. This is borne out by Ziegler (1990). Furthermore, the depths seem too shallow for salt cavern storage (given the potential for wet rockhead development etc.) and mention is made of the leakage having been controlled by water injection, which again would seem highly unlikely in a salt-bearing sequence.
The likelihood is that the leakage occurred from storage facilities developed in relatively shallow aquifers (probably with poor caprock lithologies), like the nearby Beynes gas storage facility, operated by Gaz de France. This is situated 25 km east of Versailles, in open farmed countryside and is surrounded by several small villages. It consists of 2 underground storage reservoirs, the Beynes Superieur (commissioned in 1956) and the Beynes Profond (commissioned in 1975), both of which are aquifers, at somewhat greater depths of 405 m and 740 m respectively (http://www.ieagreen.org.uk/nov69.html). It is not clear if the leakages mentioned were reported in the MARCOGAZ survey (previous section). Because of this, the late awareness of the incidents and the sketchy details available, these reports are not included in the database of reported incidents (sections 9.1-9.4).
Gas losses might be expected in shallow aquifer storage due to the increased pressures on the caprock, which may not perform aswell as one in an oil or gasfield. However, this does not mean that the gas would necessarily reach the surface or pose a hazard, as witnessed by the examples from Indiana, where leakage is monitored and controlled and which, to date, do not appear to have led to any reported casualties.
114

9.5.3 Summary and discussion
This study has identified only 65 documented incidents or problems related to UFS facilities, with reported totals of only 9 deaths, around 62 injured and circa 6700 evacuees (not including the evacuated village of Knoblauch, near Berlin). As detailed above, 8 of the fatalities have been sustained at UFS (not just UGS) in salt caverns or abandoned salt mines with up to 3 deaths at individual sites. A ninth fatality appears to have been linked to leakage of gas and CO at an aquifer storage facility in the 1960s. Of the incidents related to underground storage of hydrocarbons described here, 15 were accompanied by an explosion and/or fire, 10 at salt cavern facilities (Table 7). It is noted that these figures probably represent a minimum as there are no statistics from Russian or East European facilities (where it is thought likely that there have been incidents, but that they have not been reported or found during this study). However, given the sensitive nature of the topic and people’s fear of UGS, it is surprising that if they have occurred that they have not been more widely reported. Major accidents with casualty rates are regularly reported from other areas of the energy supply sector (Chapter 10) and one would think that UFS would be no different in attracting public attention or press reports, which would then have been reported in the literature.
The majority of problems have occurred at salt cavern storage facilities (27), where 9 have led to fatalities, injuries or the evacuation of people and 10 have been accompanied by an explosion and/or fire. Eight of the 9 reported deaths at UFS facilities have occurred at 4 salt cavern storage incidents and involved storage of various hydrocarbons, not just natural gas. In all cases the salt cavern(s) did not fail, although the Mineola (USA) incident that led to release of propane and an explosion arguably involved failure of the caverns (in that there was catastrophic communication between caverns). In actual fact the failure is ultimately attributable to human (operational) error in that the amount of ongoing leaching of the caverns during the brine compensated storage operations that led to the thinning of the intervening saltwall was not recognised. All other causes have been related to human error, poor management or operational practices, utilisation of existing and inappropriate brine caverns, poor forward planning, a lack of due diligence by the storage company or operator, or a combination of these factors (see also Warren, 2006). It should be noted that the earliest salt cavern storage sites utilised old brine caverns not ideally designed and engineered for gas storage. The first purpose-designed and engineered gas storage caverns were not constructed until the early 1970s. Technology and understanding of salt rheology and cavern design has increased significantly since those early days of cavern design and construction.
The second highest rate of incidents is found in aquifer storage facilities (17), which are associated with 1 reported fatality from incidents at aquifer storage facilities, with only one other incident (Spandau) having resulted in injuries (9), all onsite. Following the leak at the Ketzin facility in the 1960s, the village of Knoblauch near Berlin (the then DDR) was evacuated, apparently permanently (MyDeltaQuest). Depleted oil and gas fields provide the most widely developed type of facility, with about 478 in operation, mostly in the USA. The 16 incidents found at these storage sites have, to date, led to only 5 injured with no reported incidents involving deaths. Hopper (2004) is correct to state (when discussing catastrophic loss of stored product) “In every case, however, a salt cavern storage facility was the culprit, not a depleted reservoir or aquifer gas storage facility”. However, he is describing single point (catastrophic) failures at salt cavern facilities and the statement could be misleading, as Tables 2 and 7 document stored product (fuel) loss and casualties at depleted reservoir, aquifer and abandoned mine fuel storage facilities related to causes other than single point catastrophic failure.
Closer examination of the statistics shows that 53 of the 65 incidents and problems with UFS have occurred in the USA (Table 7). Of these, 12 have been in California, with 10 each in Texas and Illinois, where in the latter, 9 have been associated with pore storage (the other was leakage of propane from an abandoned mine). California provides a very different environment to that of the UK in a number of significant respects. Firstly there are many more poorly located wells
115

stemming from a long history of relatively unregulated oil exploration. Secondly, it is a tectonically very active area, with present day seismic activity and major faults causing surface ground rupture. Many of the oilfields are compressional features formed during Cainozoic times with associated faulting of the reservoir and caprock units causing ongoing leakage from the reservoirs and in one case, fracturing of a well. By comparison, the UK lies in a seismically inactive intracratonic area, where the possibility of any fault reactivation causing a direct rock rupture hazard at surface anywhere in the UK is all but negligible. Such an event has not happened since historical times (and perhaps since Quaternary times, up to 1.8 Ma) and known larger UK earthquakes have depths considerably in excess of their rupture dimensions (Musson in Evans et al., 2005 – section 6.2).
Old and abandoned wells represent a major source of potential leakage in any UGS environment, which is particularly so in the Californian oilfields, especially in the Los Angeles region (e.g. Chilingar & Endres, 2005). Steel well casings and cement deteriorate over time, resulting in shoe leaks and loss of bonding in the annular cement, permitting gas to enter the well and leak to the surface. Due to poor construction practices and deterioration over time, old wells are especially prone to the development of leaks. However, even when plugged in accordance with contemporary government regulations, most abandoned oil and gas wells eventually develop leaks, with failure rates of 10% known in recently plugged wells in California due to the use of inferior materials by contractors during well abandonment (Miyasaki, in press). But even modern up-to-date cements do not guarantee success, with failure rates of 10-15% documented (Marlow, 1989; Chilingar & Endres, 2005; Miyasaki, in press), and the figure may be as high as 60% in some areas (Miyasaki, in press). A further problem exists with completed oil/gas wells in depleting fields. These wells have generally been operating in a declining pressure regime as the field becomes depleted. Re-injecting gas back into the reservoir raises the pressures on the existing completions and casings, providing the potential for failure, which may be exacerbated if injection and withdrawal cycles are rapid. Old well completions have, therefore, to be the focus of detailed pressure and sample tests before the facility is fully commissioned. Understanding these failures requires knowledge of the history, nature and purpose of the wells, the brining methods (if related to brine caverns) and the ultimate operation of the wells, particularly in salt caverns.
From the reviews of each incident above and in Appendix 5, it is clear that in the vast majority of cases, the incident or problem experienced at any particular facility has not been the result of a direct failure of the geology. The exceptions, where the geology has apparently been linked to the failure are:
• one salt cavern facility, where connection of caverns occurred (Mineola, USA), although human error was ultimately behind this failure
• a case where a gas storage well in California appears to have been crushed due to faulting (in a seismically active area, with little similarity to the UK environment)
• in a number of aquifer storage sites, mainly in Illinois (USA), where the caprock was not gas tight and may have also been affected by faulting. In these examples, human error seems more appropriate in that gas tightness of the caprock was not established. Aquifer storage is not, however, a type of storage facility currently under review in the UK
• and in a number of depleted oil/gasfield storage sites, mainly in California (USA), where the cap rock was not gas tight and may have also been affected by faulting. Again, these occurred in oilfields developed decades ago in a seismically active area, where fault rupture at surface is known on faults that are described as active, which is not the case in the UK. Again, human error seems more appropriate in that ‘leaky’ structures were put into use for storage purposes
Instead, in incidents most relevant to UK developments, poor engineering practices, a lax regulatory regime and mismanagement appear to have been the main factors in release of stored
116

product. Most of the main UGS incidents have occurred in the USA, where regulations and well records have not been carefully controlled or maintained. There has been failure of either the man-made infrastructure (well casings, cement, pipes, valves, flanges, compressors etc.), or human error, which has included overfilling of caverns, inadvertent intrusion and poor site characterisation including not establishing the gas tightness of the cap rock. The causes, scale, and severity of the accidents are also extremely variable and have in some cases been the result of a combination of these factors. Problems have also arisen from (extreme) natural events (seismic activity).
The main question is, therefore, to what extent can these UGS facilities be made safer? Moss Bluff, as in most currently operating salt cavern facilities, had only 1 well for injection and withdrawal (Hopper, 2004). A single well system does not generally cause a problem until a wellhead or valve failure occurs and a gas leak and fire ensues. Moss Bluff typified this when high pressure gas was vented and burnt at such high temperatures that it was impossible to reach the remaining gas stored and contain the leak and fire. A future requirement and safety mechanism, especially useful when the cavern is full and fully pressured, may be for a back up well or wells remote from the other, which would permit safe withdrawal of the stored gas and prevent most of it from being lost in a fire. Costs generally dictate that salt cavern developers rarely incorporate such ‘redundancy’ (Hopper, 2004).
In contrast to salt cavern storage, depleted reservoir storage typically has a number of wells used for injection/withdrawal purposes. There are also likely to be a number of former exploration and production wells across the oil/gasfield. In the worst-case scenario of a well being lost or damaged at a depleted reservoir, then these wells provide effective ‘inbuilt’ back-up wells capable of withdrawing (to safe levels) the remaining gas in store, and then for only as long as it would take to cap the well in question (Hopper, 2004). Gas loss would be limited in depleted reservoirs as storage wells are easier to cap if they were to blow out and drain only a limited area of the reservoir. Also releases are likely to be somewhat slower due to the physical constraints of the gas being ‘produced’ from pore spaces.
The aspects of gas release and flux rates for differing storage scenarios are investigated in the accompanying Quintessa report (Watson et al., 2007).
117

10 Incidents and casualties in the oil and gasproduction/supply chain and petrochemical industries
Chapter 9 reports a number of incidents of varying severity have occurred at UFS facilities. Tragically as noted, a small number (5) of these have involved accidents that have left 9 dead (Table 7). However, fatalities have occurred in other sectors of the oil and gas industry and energy supply chain, and it is estimated that during the period 1970-1985, 25% of the fatalities in severe accidents worldwide have been in the energy sector (Fritzsche, 1992; Hirschberg et al., 2004). This section, therefore, aims to provide an assessment of the relative numbers of casualties elsewhere in the energy supply chain, including exploration, extraction and refining, transport to and from a refinery, end user incidents including regional and domestic supply/delivery and industrial accidents in the petrochemicals industry (Tables 15-20; summarised in Table 14). Such figures permit a comparison between, and help put into perspective, the casualty figures resulting from the UFS sectors.
The following brief account of casualty figures from published worldwide major accident statistics in the oil and gas production, transport (pipeline, train, tanker) and supply sector for the period 1969-1996 (Table 14) is based upon Hirschberg et al. (1998, 2004) and Papadakis (1999). It should be noted that in their studies, incidents qualified when there were 5+ deaths, 10+ injuries or 200+ evacuees. Additional sources provide data concerning incidents post-dating 1996 (see references in Tables). The list of casualties in Table 14 is, therefore, neither exhaustive nor full, but is a minimum that represents the more severe accidents for which figures are available.
For this reason, statistics relating to hazardous liquid and (domestic) gas supply (distribution) pipeline incidents published by the USA and UK governments (respectively, Tables 15; http://ops.dot.gov/stats/stats.htm and 16; http://www.hse.gov.uk/gas/domestic/statistics.htm) are also presented for the period 1986-2005. These data are shown independently to the figures in Table 14, not only because there could be some duplication in the numbers if added together, but in order to maintain the integrity of different data sources and to illustrate individual countries and types of pipeline incidents. In addition, figures are also summarised for significant petro-chemical plant incidents, hydrocarbon related railroad accidents in the USA and above ground storage vessels that have involved death or injury (refer http://www.ntsb.gov/).
10.1 CASUALTY STATISTICS IN OTHER AREAS OF THE ENERGY SUPPLY
CHAIN
Worldwide casualty figures arising from areas of the energy chain, involving the production and supply of oil, gas and LPG is illustrated in Table 17. It shows that in total, there have been at least 21,629 fatalities, 46,606 injuries and 1,341,533 people evacuated during incidents. The highest fatality rates have occurred in the oil sector, with over 15,695 deaths of which at least 13,000 occurred during the transport to the refinery and in the regional distribution stages. These are, therefore the most risk-prone stages in the oil chain, where higher oil consumption leads to a greater number of severe accidents resulting in fatalities (Hirschberg et al., 2004). Three major accidents occurred in 1980, 1982 and 1987 (Hirschberg et al., 1998) and illustrate the significantly higher number of casualties arising at individual incidents elsewhere in the energy supply chain. The first in January 1980 resulted from a well blowout off the Nigerian coast, causing the most number injured during one oil related event (3,000, plus 180 dead). The second in 1982 was caused by the collision of a Soviet fuel truck with another vehicle in Afghanistan, which led to 2,700 fatalities (including Soviet soldiers and Afghan civilians, though not as a
118

result of acts of war). The third occurred off the coast of Mindoro in the Philippines, with 3,000 fatalities.
In the gas supply chain, the yearly number of LPG and natural gas severe accidents increased significantly after 1970 and then showed a general decrease after 1980-1984. The worst years in terms of the number of fatalities were 1984 and 1989 for LPG and 1978 and 1982 for natural gas (Hirschberg et al., 1998). The stages in which the greatest number of casualties occurred are (Table 17): ‘long distance transport’, ‘local distribution’ and ‘regional distribution’ for natural gas and ‘regional distribution’ for LPG.
Casualties in the LPG sector totalled around 3,700 dead, 21,120 injured and almost 1 million evacuated. Over 53% of fatalities involving LPG occurred during the regional distribution stage (transport by road or rail tankers, pipelines or by ship – Table 17). The dominant cause was impact failure (Hirschberg et al., 2004). Two of the (then) world’s largest industrial accidents involved LPG (Hirschberg et al., 1998). The first occurred on November 19th 1984 in San Juan Ixhuatepec in Mexico, when about 500 were killed, 7,231 injured and 200,000 were evacuated following the leakage of LPG from a storage vessel, which then ignited. The ensuing explosion and fire destroyed 50 of the 54 storage vessels in the depot (Hirschberg et al., 1998). The second major incident occurred on 4th June 1989 when around 600 people were killed and at least 755 were injured by a massive explosion and fire when sparks from a passing train ignited a gas cloud from a leaking pipeline nearby, which was carrying 30% gasoline and 70% LPG between Asha and Ulfa in Siberia, Russia. An LPG related incident at Mississauga (Canada) on November 11th 1979 led to the evacuation of around 220,000 people due, in part at least, to the presence of chlorine in the rail tanker fire.
Casualties arising from the production and transport of natural gas amount to over 2,230 dead, 5,210 injured and 105,011 evacuated (Table 17), 40,000 of which were related to a major leak at La Venta, Mexico in 1982 (Hirschberg et al., 1998). For the period 1969-1996, nearly 72% of the severe accidents in the gas chain occurred during transport by pipeline, with about 21% involving pipelines caused by mechanical failures and 24% by impact failures (Hirschberg et al., 1998, 2004).
The regional distribution phase represents the most hazardous stage in all three energy sources, with at least 9,356 fatalities, 24,209 injured and 685,741 evacuees. The two worst disasters associated with the supply of natural gas, are those on December 2nd 1984 at Tbilisi in Georgia, where around 100 died, and April 8th 1970 at Osaka in Japan, where a similar number of fatalities occurred (Hirschberg et al., 1998). Casualties in the gas sector totalled around 2,223 dead, 5,210 injured and around 105,000 evacuated. Nearly 72% of the accidents in the natural gas sector occurred during the transport by pipeline
Three individual gas pipeline and supply incidents illustrate the significant damage that can occur and that more people have been killed in each incident than in all UGS incidents combined. The first incident relates to a large explosion along the El Paso natural gas pipeline, near the Pecos River at Carlsbad in southeastern New Mexico (Fig. 25; NTSB, 2003; Koper et al., 2003). Early in the morning of Saturday, August 19th 2000, 12 campers, including 5 children, were killed when the pipeline ruptured and exploded (registering 4 on the Richter Scale – Koper et al., 2003), creating a crater 26 m long, 14 m wide and 6 m deep (NTSB, 2003). The fire burned for an hour at temperatures of up to 1150ºC, before being extinguished and rescue workers could eventually approach the site, when they found 12 people who had been camped near the bridge carrying the pipeline over the river, around 205 m (675 feet) from the explosion site (NTSB, 2003). All 12 eventually died of the injuries sustained and two nearby steel suspension bridges for gas pipelines crossing the river were extensively damaged during the incident, which remains one of the deadliest in American history (Koper et al., 2003).
The second incident relates to a gas explosion on the 21st October 1971 at a shopping centre in Clarkston, near Glasgow, Scotland in which 22 people died and 143 were injured, including
119
some on a passing bus (KAMEDO, 2000; Watson, 2003). The gas leak led to Scotland’s biggest gas supply explosion despite a 6 day search during which gas workers failed to locate and fix a leak. The incident was exacerbated by the collapse of a car park into the shopping centre.
A third major gas pipeline explosion is of importance, providing significant information on casualties and damage zones (Hazards Intelligence, 2005; GDF, 2006). On July 30th 2004, a major natural gas pipeline, one metre in diameter and carrying “high calorific value gas” exploded in Ghislenghien, near Ath in Belgium (30 kms southwest of Brussels), killing 24 people and leaving over 120 injured, some critically. The pipeline is one of a parallel pair, carrying gas from the Belgian port of Zeebrugge to northern France and is operated by Fluxys, the Belgian gas pipeline operator. A second pipeline carrying “low calorific value gas” was not affected by the explosion (Hazards Intelligence, 2005).
Reports suggest that a gas leak was reported to fire fighters at about 08:30 local time and the explosions, which were heard several miles away, occurred at around 09:00 sending a wall of flame into the air. The explosions and fire destroyed 2 factories in the industrial park and melted or burned everything within a 400 m radius, leaving a large crater between the 2 factories (Fig. 26). Fire fighters attempting to establish a security perimeter around the site were among those killed. Of those killed, 22 were within 200 m of the release. Bodies and debris were thrown 100 m into surrounding fields. Investigations revealed that the pipeline had been damaged by a ground compaction machine during construction work, during which time the pipeline was being operated at reduced pressure. When the pressure was later restored to normal, the pipeline, scored by the teeth of the machine, failed (GDF, 2006).
Most recently in the UK, the major incident at the Buncefield storage depot in Hertfordshire illustrates the inherent dangers of fuel storage, in this case at an above ground tank facility (Powell, 2006a&b). On Sunday 11th December 2005 the oil depot, owned by Total UK Limited and Texaco, was rocked by a series of explosions, reported to be the largest of their kind in peacetime Europe (measuring 2.4 on the Richter Scale: BGS, 2005), which were followed by a major fire (Fig. 27). Although there were no fatalities, 43 people were injured and around 2000 people evacuated as the explosions and fire destroyed the site and caused serious damage to commercial and residential properties in the vicinity. The likely cause of the incident is thought to have been ignition of escaping petroleum vapour as a tank was overfilled (Powell, 2006a&b). It is widely acknowledged that, as at Flixborough in 1974 (HSE, 1975), had the incident happened during the week rather than in the early hours of a weekend, then the number of casualties would have been far higher, with numerous deaths likely.
The American Office of Pipeline Safety (refer http://ops.dot.gov/stats/stats.htm) provide statistics for reported incidents and casualties involving both hazardous liquids and gas supply in the period 1986-2006[part] (Table 15). These show there were 4,731 reported incidents involving gas transmission and distribution pipelines, which left 405 dead and 1,706 injured. The highest death and injury rates (344 and 1,461 respectively) are attributed to distribution lines, that is, low-pressure pipelines that take gas to cities, towns and houses. A further 3,679 incidents were associated with hazardous liquid pipelines and resulted in 44 dead and 272 injured.
In the UK for the same period (Table 16), there were 2,903 gas supply incidents (mainly domestic) that left 153 dead and 927 injured. A further 576 were killed and 3,346 injured as a result of carbon monoxide (CO) poisoning.
Casualty figures for significant petrochemical plant accidents between 1963 and 2002 reveal 3,674 dead, 303,340 injured and 7,200 evacuees (Table 18). Whilst the Union Carbide accident at Bhopal, India in December 1984 caused the majority of the deaths (3,500) and injuries (over 300,000), the remaining figures are again far greater than those associated with UFS. Casualty figures for 17 significant American railroad accidents associated with hydrocarbons in the period 1995-2004 reveal 9 dead, 5,441 injured and 10,452 evacuated (Table 19) – one more fatality, some 5380 more injured and 3752 more evacuated than have been reported in all UGS incidents. One major incident near San Carlos in Spain, which caused over 200 fatalities, resulted from an
120

accident involving a lorry transporting propylene (Hirschberg et al., 1998). For the period 1951-2003, Persson & Lönnermark (2004), Clark et al (2001) and Ash (2006) detail incidents at above ground storage tank (or vessel) facilities that have killed at least 778, injured 426 and led to more than 7000 evacuees (Tables 14 & 20). One incident alone on 2 November, 1994 at Dronka in Egypt, resulted in 469 fatalities. Here a release of liquid (aviation) fuel from a depot of 8 storage tanks occurred during a rainstorm, thought to be the result of lightning. The blazing fuel flowed into the village where the majority of the deaths occurred (Clark et al., 2001).
10.2 DISCUSSION
As detailed in Chapter 9, 65 cases of problems or incidents at UFS facilities have been found as a result of UFS since UGS was first undertaken in 1915. Only 5 of the 65 incidents led to the 9 people reported killed during UFS storage. However, figures show that many industrial activities involve dangerous substances and have the potential to cause accidents giving rise to both serious injury to people and/or damage to property and the environment.
Oil and gas exploration, production and energy supply are no different. Incidents, involving casualty figures on a scale that dwarf UFS figures, can and will occur at all stages from production, during transport, storage and ultimately, use (Table 7). Any one of many incidents elsewhere in the energy supply chain has resulted in significantly more deaths than the combined total associated with UFS to date. Many of these incidents have occurred with infrastructure and facilities (major terminals, refineries and above ground storage facilities) that have been allowed to develop in close proximity to cities, major towns or centres of population. There is, therefore, a need to put casualty rates at UFS (and UGS) sites into perspective and gain better public understanding of the technology and levels of risk associated with UFS.
It is also worth re-iterating that natural pathways and mechanisms exist whereby hydrocarbon liquids and gases present in petroleum reservoirs do in fact reach the earth’s surface (refer Chapter 3). Petroleum leakage to the surface is presently occurring in at least 126 of the 370 petroleum-bearing basins worldwide (Clarke & Cleverly, 1991). Oil and gas seeps occur in the North Sea and there are at least 173 occurrences of surface petroleum seepages and impregnations in Great Britain, many onshore (Selley, 1992). However, although hydrocarbons can and will slowly migrate by diffusion through cap rocks that is driven by buoyancy or chemical potential gradients, the presence of commercial accumulations of hydrocarbons proves the efficiency of the trapping structure over long periods (millions of years) of geological time. This is important in the context assessing the development of depleting oil and gas fields for gas storage purposes over extremely short periods of time that may be at most 100 years, with most estimated to be up to 50 years. The reader is referred to the accompanying report by Quintessa to assess the flux rates and volumes from various UK UGS scenarios to see the very small rates and volumes likely in all but the failure of a well (Watson et al., 2007).
121

11 The Main Risk Analysis/Assessment Framework and Methods
The preceding chapters outline the various methods for UGS, previous problems encountered at UFS sites and the potential areas for UGS development in the UK. This chapter attempts to summarise the various risks identified or threats posed by UGS and provide a basis for the assessment of the risks during appraisal of future UGS/UFS applications in the UK. The nature of UGS, in that boreholes are required to inject gas at depth in both depleted oil/gasfields and salt caverns means that significant overlap in the various identified risks set out in Appendix 6 is found. These are simplified and summarised in this chapter.
As suggested previously, risk analysis and assessment requires identification of the main hazards. The following, therefore, summarises the main hazards and risks associated with UGS as found from the review of previous incidents and reported in the literature.
11.1 GENERAL CONDITIONS COMMON TO ALL UFS TYPES
There are certain categories of risk and hazard that are common to depleted oil/gasfield, aquifer or salt cavern storage facilities. They include:
• The well bore and immediate vicinity
• Leakage due to inadequate cap rock characterization
• The facility operating at pressures higher than the rock units have previously experienced. Except for depleted oil and gasfields, which in the UK would not normally be operated at pressures exceeding the original reservoir pressure (BS 1998a), one of the main risks and causes of leakage is due to the operation of underground aquifer and salt cavern gas storage facilities at pressures greater than the rock has previously experienced (overpressures or ‘delta’ pressures). This is related to maximising the working gas volume to attain higher delivery rates as well as achieving a greater return on investment
• Inaccurate inventories of stored or injected product – overfilling etc.
• Poor operational, maintenance or legislative procedures
11.1.1 The well bore and immediate vicinity
Experience from previous incidents at underground fuel storage facilities suggests that the biggest risks in both depleted oil/gasfield facilities and salt cavern storage arise from well problems (Fig. 28):
• Breaks/faults in the casing, joints or defective or poor quality cementing of casings, leading to
� leakage through new or ageing injection well completions
� leakage up abandoned wells
• Inadequate site characterization that would not detect the presence of unknown wells, with ageing completions that might penetrate to depths that would intesect either
o the storage horizon,
o a shallower level collector zone into which any gas escaping from storage might migrate to and collect in
122

• During re-entry, repair or maintenance work on wells
• Inconsistent or inadequate monitoring of injection wells
• New oil or gas exploration wells drilled in poorly characterized/investigated areas and intersecting old mines, brine workings or existing facilities
11.2 ADDITIONAL SALT CAVERN RELEASE SCENARIOS
In addition to the potential problems with wells in both the depleted oil/gasfields and salt cavern storage facilities, a number of other potential problems are associated with the need to ensure cavern integrity and gas tightness.
The principal factors that contribute to the instability, breaching and collapse of solution mined salt caverns with the potential to release the stored product are (e.g. DeVries et al., 2002, 2005; Warren, 2006):
• Salt creep – section 4.2
• Uncontrolled leaching, both:
o during cavern construction
o during cavern operation (when operating in brine compensated mode)
• Presence of anomalous zones (higher solubility or porosity) in what has been assumed to be homogenous salt. This includes leaky interbeds or nonhomogeneous zones
• Salt body too shallow and affected by wet rockhead conditions (circulating groundwaters) – present in the UK and has been found to have caused problems and leakage of NGL’s at the Conway NGL storage facility in Kansas and is described further in Appendix 5 (Ratigan et al., 2002)
• Inadvertent intrusion
• Release though the cavern seal
• Release of stored product through cracks in the cavern wall
• Partial cavern roof collapses, leading to thinning of the ‘protective’ cavern roof salt
• Collapse of internal ledges or benches formed by non salt interbeds
• Potential for gas to be (naturally) present in the salt beds
• Gas (or air) absorbing concentrated brine present in the sump and being highly corrosive and damaging to the steel well casings
11.2.1 Uncontrolled leaching
Uncontrolled leaching operations might lead to problems with cavern construction, producing unstable or poorly shaped and inefficient voids for gas storage. Problems might occur if, for example, more soluble evaporitic horizons (e.g. potash) are present within the bedded salt, unexpectedly thick non-halite interbeds are present or wet rockhead is developed (e.g. Myers et al., 1972). The presence of thick potash or wet rockhead could conceivably give rise to uncontrolled leaching leading to quicker than expected horizontal dissolution of the salt. This would be a similar situation to the intentional solution mining technique described by Myers et al. (1972). The brining operations have injection and production wells that are some distance apart with brining operations dependent upon the development of solution channel labrynths between the wells. In the context of salt caverns for gas storage, the development of solution channels could lead to problems of communication between adjacent caverns, or if two caverns are being brined simultaneously, connection and over enlargement.
123
Uncontrolled leaching could also lead to unnoticed dissolution of the roof salt, which would be thinner than expected, or even absent. Potentially dangerous conditions could then arise, including collapse of the cavern roof and ultimately overlying strata, producing a surface subsidence crater as occurred during the development of a cavern facility at Bayou Choctaw, Louisiana and in Kansas (see Fig. 5c&d; also Coates et al., 1981; Neal & Magorian, 1997).
There are also recorded problems (refer section 9.3 and Appendix 5) of uncontrolled leaching having arisen during brine compensated gas storage operations, whereby caverns become enlarged giving rise to amongst other things, problems of quantifying the amount of product present (Brenham, Texas; NTSB (1993a&b, 2006); Thoms & Gehle (2000); Bérest & Brouard (2003)), thinning of salt walls between caverns (e.g. Mineola, East Texas; Warren, 2006) and the intersection of the sides of a salt dome. The latter led to the abandonment of the mined cavity before it was commissioned (Napoleanville, Louisiana; Neal & Magorian, 1997).
11.2.2 Inadvertent intrusion
The inadvertent intrusion scenario involves an exploratory well for oil or minerals that penetrates a hypothetical gas storage cavern. If the blowout-prevention system of the well failed, it could permit stored gas from the cavern to escape to the surface, leading to a release of gas and possible explosion/jet flame.
Of slightly different nature but related to this scenario are:
• Previous drilling in salt-prone sequences leading to developing caverns intersecting old wells
• New gas storage wells in areas of former mined salt as certain events in the USA where wells have intersected old mining cavities have illustrated (Warren, 2006 and section 4.8)
• Storage in abandoned salt mines with previously unknown or incorrectly located old wells where, for example, water intrusion can cause failure of the cavern seal and release of gas to surface (similar to the problem in Cheshire during active salt mining – section 4.8.2)
11.2.3 Release through the cavern seal
This scenario involves the failure of the seal that keeps gas within the cavern, permitting the release of stored gas to the well bore and thence to the surface, either directly or via pathways in shallower horizons. However, rather than the ‘static’ situation of sealed waste repositories, certain scenarios and settings might present more risk during continued operation of the storage cavern during injection and withdrawal cycles.
Well casings are generally steel and with time these tend to deteriorate (corrode) due of the presence of brine, which ultimately leads to failure of the well casing. Initially this will be close to the top of the cavern, but in the long term, the well casing is likely to fail at shallower depths. If left fully pressured for long periods, the pressure in the cavern could, due to the combined effects of the addition of heat from the surrounding salt and salt creep, potentially increase. If the cavern pressure were to reach a high enough value then the cavern seal might fail if the plug cracks and the salt around the seal dissolves, or by some other means. Gas could then move up the well bore towards the ground surface as the pressure in the cavern is reduced to the hydrostatic value.
It should be noted that at the Huntorf salt cavern CAES facility, even fiberglass reinforced plastic (FRP) casing, which replaced the original 13� inch steel production casing in the 1980s, has experienced corrosion (Bary et al., 2002). Corrosion avoidance measures there have included injection of dry air between steel and the FRP casings. It was found that brine in the cavern sump area became highly concentrated and was readily absorbed by the compressed air. The air
124

became highly corrosive and when released, it quickly caused dmage to the steel casings, which were replaced at least once before the RFP casing was installed.
While ascending the borehole, gas from the cavern could also move laterally into adjoining formations if the well casing has failed. Well casing, generally being made of ordinary steel, presents a high probability that it would suffer damage when exposed to groundwater containing brine over time. Two possible cases might be considered under this scenario:
(1) the casing fails at the depth of the cavern (at or near the cavern roof) and gas is released to a deep aquifer
(2) the casing fails at a shallow depth and releases gas to a near-surface aquifer.
In terms of the storage of gas, the potential for this leakage route to occur could be increased as a result of the cyclic pressuring and depressuring of the cavern. If minimum pressures are not strictly monitored, then it could lead to weakening of the salt in the cavern roof around the well. Cracks or fractures could develop in the salt and degradation of the seal formed between the salt and well could also occur, through which gas might escape and enter the well string and thence reach the surface.
11.2.4 Release of stored product through cracks in the cavern wall
Cracks in the salt cavern walls that might develop if minimum pressures in the cavern are not maintained, with the result that the salt dilates (microfractures and spalls), releasing gas into the surrounding salt cavern walls and roof. Such a damaged zone could then intersect non salt interbeds and permit transport of the gas away from the cavern. The damage might also develop during pressurization of the cavern or because of the combined effects of thermal heating and salt creep. The volume of gas released would be a function of the pressure in the cavern, the volume of the cracks, and the crack pressure. Depending on the pressure in the cracks, they could self-heal after the release as a result of additional salt creep, but repressurization of the cavern could also lead to reopening of the cracks.
11.2.5 Release of gas through leaky interbeds or nonhomogeneous zones
In this scenario, the cavern is assumed to intersect a leaky interbed or heterogeneity that allows communication with the outside environment. As the cavern pressure rises because of injection and/or thermal effects/salt creep, gas could be expelled into the interbed where it might be transported laterally under existing pressure or chemical gradients.
11.2.6 Partial cavern roof fall
Loss of cavern integrity through a partial roof fall coupled with failure of the cavern seal could release gas. If the collapse is not noticed, then the release might be in a series of short pulses separated by periods of low to no discharge when the pressure in the cavern is increasing because of injection or (less likely) salt creep. A partial roof fall coupled with a release through leaky interbeds or nonhomogeneous zones of higher permeability material would manifest itself as a long slow release.
Cyclical pressuring and depressuring of the gas in the cavern could, if minimum pressures are not strictly monitored, lead to fracturing and collapse of the cavern roof and walls. Collapse of the roof would pose an immediate threat not only to the cavern seal at the entry of the well bore string, but also the well string within the cavern.
11.2.7 Collapse of internal ledges or benches formed by non salt interbeds
In terms of UK gas storage this scenario potentially represents a threat in onshore areas where bedded salt is being considered for cavern development. Many caverns in the USA are
125

constructed in massive salt domes formed during salt movement (halokinesis). This gives rise to salt that is both very thick and generally very uniform in nature. Caverns, however, are also constructed in thick-bedded salt (halite) sequences, which contain interbedded non-salt layers of varying thickness. In the UK context only offshore, in for example, the Southern North Sea and East Irish Sea areas, halokinetic features are developed. Onshore in the UK the halite is of the bedded type, although in the Portland area, some minor halokinesis may have occurred, where the Triassic halites appear to thicken slightly into the core of the Weymouth Anticline (Appendix 3, Fig. 57; see Chadwick & Evans, 2005). Solution mining of such bedded salt deposits requires that careful characterization of the salt body has been undertaken to ensure that the existence, nature and extent of the non salt interbeds are known. This should help ensure that the brining process does not leave benches or ledges of thicker units protruding into the cavern and through which the well strings have to pass. Clearly, collapse of such benches into the cavern could damage the well string and possibly lead to a major incident if the cavern had been commissioned before the collapse occurred.
It is possible to manage such benches or ledges by a controlled collapse, but the resulting debris will fall into the sump at the base of the cavern, reducing both its effective volume and impacting on the storage volume.
11.2.8 Potential for gas to be (naturally) present in the salt beds
Gas has been encountered in salt beds or formations both in the UK and USA. It has led to blowouts in mines and has led, in instances in the USA, to problems of verifying product inventory where the volume of gas held in storage has increased. Gas generated within the salt body has moved through the salt into the storage cavern along anomalous zones (AZ’s; Neal & Magorian, 1997). Gas is known in the Boulby Potash Mine in NE England (section 4.3.1) and may be of relevance to salt cavern development in Permian salts.
11.3 SPECIFIC TO DEPLETED OIL/GASFIELDS - DRIVE MECHANISM
Of potential importance and specific to oil/gasfield storage scenarios is the drive mechanism during production. Depletion drive in gasfields would leave the pore spaces largely filled with gas, whereas water drive would result in water invasion into the reservoir. Storage in the latter scenario would require greater injection pressures in order to drive the water out of the pore spaces. This could increase the risk of overpressuring the area surrounding the borehole and cause fracturing of the reservoir rock. Similarly, injection and storage in depleted oilfields, with oil remaining in the pore spaces (+/- water invasion), might require greater pressures than injection and storage in gasfields.
11.4 RISK ASSESSMENT PARAMETERS FOR CONSIDERATION IN RISK
ANALYSIS/ASSESSMENT OF UK SCENARIOS
In terms of the UK and as described above, 2 main types of storage have immediate potential:
• Depleted oil and gasfields
• Salt caverns in bedded salt
To assist in the assessment by Quintessa of the risk of storage, release and flux rates of product to the surface in either scenario, a list of parameters relevant to a proposed site was prepared and includes the general stratigraphy, any faulting present and the number of deep boreholes of differing depth within 1, 3 and 11 km of the proposed site area etc. These summaries are provided for both storage scenarios relevant to various areas of the UK. The details may be found in Appendix 7.
126

11.4.1 Risk assessment and modelling of UK scenarios
Based upon the results presented in this report and their experience in underground CO2 storage, Quintessa compared the main leakage scenarios with a series of features, events and processes (FEPs) developed for CO2 storage studies and developed a series of FEPs relevant to UGS and in the UK context (Watson et al., 2007). Then Quintessa undertook the risk assessment and calculations for gas releases from potential UK UGS facility scenarios.
The FEP analysis provided a systematic framework for identifying issues that are relevant to the overall safety of the gas storage site, but also ruled out less important issues at an early stage. Based on the outcome from the FEP analysis and the scenario selection, the main features and events were identified (Watson et al., 2007). From these, Quintessa then ran models for the 2 basic storage scenarios currently being considered in the UK, and within each of these categories two end member states were considered, namely:
• Salt caverns
o Low permeability (K) geosphere – storage horizon mainly overlain by low permeability mudstones and other salt beds
o Mixed permeability (K) geosphere – storage horizon overlain by mudstones and Jurassic and Cretaceous rocks
• Depleted oil and/or gasfields
o Low permeability (K) geosphere – storage horizon mainly overlain by low permeability mudstones plus or minus salt beds
o Mixed permeability (K) geosphere – storage horizon overlain by a relatively thin caprock of mudstones succeeded by mixed permeabilty sequence of Jurassic and Cretaceous mudstones, sandstones, limestones and chalk.
For the depleted oil and gas system the Quintessa report deals only with a mixed-K geosphere model. A low-K geosphere is not dealt with explicitly because the range of fluxes calculated for the mixed-K geosphere would bracket those for the low-K geosphere. This is because a wide-range of low-K formation thicknesses are considered in the calculations for the mixed-K geosphere. Instead, the main difference between the two geospheres is that potentially there will be different pathways for gas migration, details of which are considered and discussed in more detail in the Quintessa report (Watson et al., 2007).
11.4.2 Mitigation
The area of mitigation is a wide-ranging subject that cannot be adequately covered here. The section therefore highlights a few major points and areas that might be considered as an initial starting point for any studies or design.
In the event of an incident and a leak (or worse) occurring, then systems should be in place to bring the situation back under control as soon and as safely as possible. Methods for mitigating and remediating risks caused by leakage of gas from the primary storage reservoir should be developed and might include (in no particular order):
• Lowering storage pressures within the storage reservoir or cavern, to
o Prevent leakage or damage to the cap rock
o Improve immediate safety and allow considered approach for ensuing stages
o Permit the design of remote secondary wells, or (with more risk involved) the drilling of new access wells to enable safe access to, and withdrawal of the stored product remaining
127
• In the event that leakage has occurred, gas that has accumulated in shallow traps can be pumped out to prevent further migration and surface releases (as seen at a number of the Illinois aquifer storage facilities)
• Monitoring of injection/production/abandoned wells to detect damage or leakage – perhaps involving a regular sonar logging run
• Repair of leaking injection/production/abandoned wells
• For salt caverns, performing regular sonar scans to accurately map the cavern walls and monitor closure – tools are now developed to run in the cavern even when the cavern contains gas
• Extreme case scenario – facility abandoned by either
o Withdrawal of the remaining stored gas
o Being left to burn out (an extreme case, but has occurred e.g. at Moss Bluff, Texas)
o All injection/withdrawal wells plugged, following strict guidelines/regulations
• In the case of salt cavern storage facilities and as discussed by Hopper (2004), the installation, during cavern construction, of a remote second well system that would allow safe draw down of the stored product in the event of an incident. This would carry its own risks, however, in that it represents an additional intrusion of the reservoir or salt cavity and potential pathway back to the surface
• On abandonment, closure and monitoring of salt cavern stability and internal pressure to prevent overpressuring and possible failure of he walls or roof rock and the wellhead/valves
• On abandonment of depleted fields (or aquifers, if ever developed), withdrawal of injected stored gas to below cushion gas levels, as undertaken in some decommissioned facilities (e.g Ketzin)
128

12 Summary and Conclusions
From this report and many others cited herein, it is clear that a number of factors are critical to the successful safe design and construction of UGS storage facilities, including:
• The site provides strata deep enough for safe and economically viable storage of gas under high pressures
• Development of UGS requires that the site is adequately characterized, geologically
o For pore storage this requires adequate knowledge of the storage area, based upon
� Accurate depth maps of the reservoir horizon
� Accurate thickness (isopach) maps of the reservoir horizon
� Superficial deposits mapped
• Nature of the deposits – presence of any potential ‘collector zones’ (higher porosity layers)
• Their distribution across the proposed area
• Their thickness or the depth to rockhead
� Knowledge of any faulting across the structure/storage area
� Producing a sedimentary model for both the reservoir and caprock lithologies to provide information on
• Porosity and permeability
o distribution across the area
o distribution vertically through the reservoir
• Thickness and extent of storage reservoir
• Interconnection or isolation of sandbodies
� Caprock integrity
• Thickness and distribution
• Geological structure – including presence of faults in reservoir or caprock
• Lithology
• Physical properties (porosity, permeability, pore entry pressures etc.)
• Mechanical properties (e.g. strength)
o Salt caverns require similar geological characterisation and adequate knowledge of the porposed site area
� The thickness, depth and extent of the salt beds
� The thickness, depth and extent of the caprock sequence and its suitability
• Lithological heterogeneity
• Presence or absence of fractures
129

o Open or infilled
o What mineral – studies of fractures may show several stages of development and differing types of infilling material
• Rock mechanical properties
� Superficial deposits are mapped
• Nature of the deposits – presence of any potential ‘collector zones’ (higher porosity layers)
• Their distribution across the proposed area
• Their relationship to any development of wet rockhead
• Their thickness or the depth to rockhead
� The sedimentary environment that will permit understanding of
• The presence and nature/distribution/thickness of non salt interbeds
• The presence and nature of more soluble evaporite beds
• Lateral changes in sedimentary facies
� The geological structure, including the likely presence of faulting in overlying sequences and whether, for example, large faults define the margins of the saltfield
• That the facility is designed and operated with sufficient safety measures to ensure the storage reservoir or salt cavern cannot be inadvertently or otherwise overpressured
• Proper design, construction, monitoring and maintenance of injection/withdrawal wells
• Abandoned wells in and around the proposed storage area must be accurately located and previous completions checked for integrity and gas tightness.
Clearly all the above can only be obtained through detailed site characterisation and geological investigations. In depleting oil and gasfields, much of this work will have been undertaken during the exploration and production phases when such detailed knowledge of the reservoir and structure is required to maximise production. For aquifers, most of the investigations required to discover and develop oil/gasfields has to be undertaken. For this reason aquifer storage sites are generally more costly to develop.
Developing salt cavern storage facilities requires detailed geological investigations in order to prove the depth, thickness, extent and purity of the salt beds in which it is proposed to develop the caverns. Boreholes have to be drilled to provide samples of the halite for in situ and laboratory tests to gain information of the strength and mechanical properties. However, there is a ‘Catch 22’ situation. Ideal cavern storage sites are safer when few boreholes penetrate the cap rock and salt succession. This is perhaps also true for depleted fields, although possibly less so in that releases will be somewhat slower due to the physical constraints of the gas being ‘produced’ from pore spaces. Therefore, careful design and planning of boreholes is required to generate the least number of borehole penetrations that could form a route back to the surface for any gas that might escape from the salt cavern. Ideally, site characterisation would involve non-invasive investigative techniques such as seismic reflection data (perhaps a 3D cube) to aid building up a 3D model of the subsurface structure and distribution of the salt beds. Seismic data (perhaps acquired with high frequency sources), tied to geophysically logged boreholes, would offer the greatest potential to image any faulting that might affect the proposed storage site.
130

A review of casualty figures from other areas of the energy supply chain, including above ground storage vessels, allows those figures associated with UGS/UFS to be compared with other storage environments and energy supply sectors in order to assess the conclusions of Bérest et al. (2001) and Bérest & Brouard (2003). These authors state that “salt caverns provide one of the safest answers to the problem of storing large amounts of hydrocarbons”. Pore storage facilities are associated with even lower incident rates. Even in urban areas such as Los Angeles Chillingar & Endres (2005) concluded “…Underground gas storage, oil and gas production can be conducted safely if proper procedures are followed. After recognition of the existing problem, proper safe operating procedures can be easily developed”...
Whilst it is acknowleged that the figures reported here probably represent a minimum (i.e not all incidents have been found, or were reported), the figures collated during this work indicate that UGS has extremely low incident and casualty numbers when compared to these other areas. The results from 2 smaller studies on the safety of UGS undertaken for both the natural gas storage industry and researchers in the field of the underground storage of CO2, support the results of this study. Casualty rates several orders of magnitude greater are reported from other sections of the energy supply chain and which individually, have often resulted in more deaths than those of not just UGS, but all combined UFS described here. This includes fatalities arising from the supply of domestic gas in the UK.
Contrary to public belief, UGS is regarded by other sectors of industry and research as having an excellent health, safety and environmental record (Lippman & Benson, 2003; Imbus & Christopher, 2005). Even in the infamous Hutchinson incident, it would appear that it was not failure of the cavern, but human error and poor operational and safety controls that led to the leak, resulting in the explosions, fires and 2 fatalities.
131

Appendix 1 Gas migration rates – hydrocarbon-bearing basins
Source Area Nature Source depth Flux Flow/seepage
rates rates
Effective Diffusion
rate
Migration
velocities
calculated
Clayton & Dando (1996)
N Sea 1 (Block 15/25 Biogenic gas (Tertiary seds)
440 L/m2/yr 0.14-0.6 L/hr
Hovland & Sommerville (1985)
N Sea 2 (Ekofisk area - – over 100000m2
890 L/m2/yr 1000 L/hr
Dando et al. (1994) N Sea 3 (Kattegat coast, Denmark –– over area of 1700 m2
Biogenic gas (Emsian)
> 1000 m 520 L/m2/yr 0.15-21.8 L/hr
Hovland & Sommerville (1985)
Norwegian N Sea Deep seated thermogenic source
24 m3/day
Krooss & Leythaeuser Russian rock salt 88.5 m3/km2/yr 2.8x10⁻¹⁰ m2/sec (1996) (Antonov et al.,
1958)
US Shales (Smith et 1737 m 1.9 m3/km2/yr 6.9 x 10⁻¹¹ m2/sec al., 1971) (overburden)
150 (seal) 1 m3/km2/yr 5.4 x 10⁻¹² m2/sec
1590 6.9 x 10⁻¹⁰ m2/sec (overburden)
shale (Nesterov & Ushantinskij, 1972)
0.16 m3/km2/yr 3 x10-12 m2/sec
Leythaeuser et al., Harlingen gas field 390 m 3.7 m3/km2/yr 21.0 x 10⁻¹⁰ m2/sec 1982 (Neths)
Krooss et al., 1992a&b)
Nelson & Simmons (1992)
Montel et al., (1993) Claystone, 550m 10 m3/km2/yr
Nesterov & Total diffuse gas loss shale 680 m3/yr Ushatinskij (1972) – 17x109 m3 over 25
my
Kettel (1996) Munsterland Basin B2/4 2.91 x10⁴
m3/km2/x200000 yrs
B2/5 2.91 x10⁴
m3/km2/x200000 yrs
B2/6 2.57 x10⁴
m3/km2/x200000 yrs
B2/7 5.60 x10⁴
m3/km2/x200000 yrs
B2/8 1.52 x10⁴
m3/km2/x200000 yrs
Lower Saxony Basin 1 9.30 x10⁵
m3/km2/x10 my
7 3.73 x10³
m3/km2/x10 my
10 1.19 x10²
m3/km2/x10 my
13 1.12 x10⁵
m3/km2/x10 my
18 5.60 x10⁴
m3/km2/x10 my
19 1.30 x10⁵
m3/km2/x10 my
31 6.51 x10⁵
m3/km2/x10 my
32 6.51 x10⁷
m3/km2/x10 my
33 5.40 x10⁷
132

m3/km2/x10 my
34 4.34 x10⁷
m3/km2/x10 my
Upper Rhine Graben 5 1.15 x10³
m3/km2/x10000 yrs
8 1.00 x10²
m3/km2/x10000 yrs
9 5.00 x10²
m3/km2/x10000 yrs
10 8.00 x10²
m3/km2/x10000 yrs
11 1.15 x10³
m3/km2/x10000 yrs
61 1.00 x10³
m3/km2/x10000 yrs
62 2.00 x10³
m3/km2/x10000 yrs
64 1.60 x10³
m3/km2/x10000 yrs
65 1.00 x10³
m3/km2/x10000 yrs
Arp (1992) Patrick Draw 1576 m (5200 ft) 76-305 m/yr (250-Oilfield, Wyoming 1000 ft/yr)
Araktangi et al. Leroy Storage Field, 305 m/yr (1000 (1982) Wyoming ft/yr)
133

Appendix 2 Problems and subsidence experienced at saltmines and brine caverns – i.e. not associated with gas storage
Section 4.8 briefly introduced problems that had been encountered at salt and brinefields that were not related to wet rockhead or linked to gas storage operations, but that could have a bearing on how saltfields may be developed for cavern gas storage. The nature of problems encountered at salt mines and brinefields where catastrophic ground failure arose either from poor working practices, or problems that occurred of old oil and brine wells in areas of halite and old mine workings are briefly outlined (see Warren, 2006). The examples are relevant to proposals for UK gas storage in salt caverns. They illustrate the problems and dangers that can occur in areas when brining operations are poorly controlled, or site characterization and defining the positions of old abandoned oil or brine wells and liaison with relevant authorities has been inadequate.
Problems in saltmines and brine caverns, including old brinewells
Ocnele Mari Brinefield, Romania
An incident at a salt mine in Romania producing salt by solution mining, though not directly linked to gas storage caverns is worthy of note. It represents a potential problem that could arise if uncontrolled or poorly managed solution mining of a cavern without due regard to, or control over, the shape, dimensions or long term geological stability of the resulting cavity. As such, consideration is briefly given to the problem at the Romanian Ocnele Mari field 2 (http://www.saltinfo.com/Romania.htm).
The brine field has been worked over the period 1961 to 1993, with old caverns left brine-filled. Over-mining caused the development of a huge cavern, reaching around 250 m in diameter, with a volume of about 3.7 Mcm, and a corresponding surface area of about 10ha (http://www.saltinfo.com/Romania.htm). This was created by the inadvertent dissolution of pillars separating adjoining caverns (http://www.solutionmining.org/smri.cfm?a=cms,c,33). Although mining operations at the cavern location ceased in 1993, some caverns have subsequently collapsed, leading to subsidence of the ground above. There are very real fears of total collapse of the remaining caverns, destroying 22 homes on top of the cavern and releasing up to one million cubic meters of brine. This would flood of the Sarat River valley for many kilometres and put hundreds, perhaps thousands, of residents in the river valley at risk.
In 1991 SOCON (a German company specialising in cavern sonar imaging) and Romanian hydrogeologists independently undertook investigations and evaluations of the situation in Ocnele Mari. Their aims were to determine the risk factors and how to stabilise the field and thus prevent the collapse of the remaining caverns. Two opposing opinions emerged on the action to be taken to stabilise the cavern field. SMRI reported in 2001 that the problem could still be stabilised if immediate remedial action based on backfilling were taken. The situation progressed, with a partial collapse of the field occurring in the summer of 2001. In November 2001, the total collapse of the remaining caverns was regarded as ‘imminent’.
The problems at Ocnele Mari would not have arisen if normal ‘best practice’ mining engineering principles had been employed in its development (http://www.saltinfo.com/Romania.htm).
134

Old Belvedere Spinello, Italy
The Old Belvedere Spinello brinefield in southern Italy was originally operated via brine wells interconnected by hydraulic fractures. The area exhibits subsidence effects ranging from sinkholes to bowl subsidence and landslides. A major collapse occurred, caused by the salt solution mining process, which went unnoticed. Solution mining of the salt beds had apparently migrated undetected away from the brinewells some considerable distance updip within the salt formation, to where a large cavern had been dissolved out, previously. This cavity lay below the toe of a hill and when a sinkhole developed, the hillside collapsed and caused major flooding. Solution mining is now undertaken in a new area of the brinefield using a number of sonar monitored salt caverns accessed by single wells (Warren, 2006).
Brinefield and mine collapse, Krakow, Poland
A former salt mining region, centred on Krakow in southern Poland has mined Miocene age salts since the 13th century. Two main problem sites exist, at Barycz and Lezkowice (Warren, 2006). The Barycz mine covers an area of 1 km2, being 2 km wide at its maximum. The salt formation is flat lying around 30 m thick and 230-280 m below ground level. Solution mining was first carried out in 1923. At Lezkowice, the salt dips steeply and occurs as little as 40 m below the surface. Salt was solution mined to a depth of more than 450 m. Both sites are covered by 15-20 m of unconsolidated Quaternary sands, gravels and peat.
At its height, the Barycz brinefield had more than 900 solution wells about 50 m apart. Total production was equivalent to a 3 m thick unit across the whole site. Significant ground subsidence occurred from the outset, with 10-30 cm noted in the period 1926-1934 and 33 sinkholes up to 27 m across and 27 m deep forming between 1923 and 1993. The land surface is now pock marked by stagnant brine filled subsidence cones and sinkholes often centred on abandoned wells (Warren, 2006).
Depletion of the Barycz brinefield meant operations were moved to the Lezkowice site in 1968, where exploitation was carried out using brinewells sited 35 m apart. Operations were meant to be controlled and regulated to avoid the problems encountered at the Barycz brinefield. However, this never happened and operations went unchecked for 20 years until the brinefield was shut down in 1988. By then, numerous cavities had joined and subsidence problems were being encountered, with two areas where it was more than 80 cm and a maximum of 1.2 m. In an attempt to reduce its impact, local industrial waste material was injected into some of the cavities.
Gellenoncourt saltworks, France
On March 4th 1998, a sinkhole measuring 50 m across and 40 m deep was induced above two brine caverns in the Gellenoncourt saltfield near Lorraine in France, opened in 1967. Collapse was triggered to prevent future uncontrolled ground collapse (Warren, 2006). Two brine caverns, each designed with a substantial salt roof to protect the overlying Triassic marls, formed part of a field of caverns. In 1971 the two caverns unexpectedly joined and although brine extraction was stopped, cross-flowing brines flowing into another producing well continued to leach the two caverns. By 1982, the salt roofs to the two caverns had been dissolved away. Between 1982 and 1992 no further upward growth of the cavern occurred. However, a 25 m thick section of the marls fell in, stopping only because of an interbedded dolomite bed that prevented further collapse of the strata and propagation of the cavity to surface.
Retsof Mine, New York State, USA
The Retsof mine covered an area of 24 km2 and was the largest working saltmine in the USA. It had been in operation since 1885 (Warren, 2006). The problems at the Retsof mine began in March 1994 with a magnitude 3.6 earthquake caused by the (catastrophic) collapse of a small pillar and panel section of the mine. This was accompanied by collapse at the surface of an area 180 m by 180 m and 10 m deep. A month later an adjacent mine room collapsed, forming a
135

second crater. Collapses were accompanied by influx of brine, flooding of the entire mine within weeks and causing the loss of the entire mine operation. Associated aquifer drawdown led to inadequate water supply for months following the collapse, with some wells drying up altogether.
Brinefield subsidence, Windsor, Ontario
In 1954, subsidence, followed by collapse, destroyed part of the infrastructure of an active salt works near Windsor, Ontario (Warren, 2006). The first well was drilled in 1902 with intensive exploitation commencing in 1922, with 25 wells drilled between 1922 and 1953. Prior to the collapse, an area around 300 m across and 40 cm deep had subsided in the preceding 5 years. The collapse in February 1954 occurred over a 9 hour period and destroyed most of the surface plant.
Sinkholes at Cargill, Kansas
A number of sinkholes appeared in the 1950s and 1970s around brinewells and salt caverns near Hutchinson, Kansas (see Fig. 5c&d and http://www.kgs.ku.edu/Hydro/Hutch/Subsidence/index. html). The area has had numerous wells extracting brine from bedded Permian salts around 105 m thick, some 130 m below surface (Walters, 1978; Warren, 2006). Several collapses have been noteworthy, including the Cargill collapse sink in 1974, which formed above a breached salt cavern. Within four hours of starting, it was 60 m across. After three days, it had formed a circular depression 90 m across and nearly 15 m deep. The sinkhole developed in an area that was part of an active brinefield at the time and included both operating and abandoned wells. A number of railway lines had been built on the brinefield and the sinkhole developed beneath the junction of three lines, leaving them suspended across the crater (Fig. 5c&d). A further large sinkhole is developed in the area to the immediately to the north of the salt (refer Fig. 5d). Within the sinkhole area, was an old well drilled in 1908, which was plugged and abandoned in 1929. Earlier uncontrolled brine extraction in the region since as early as 1888 contributed to the collapse and new regulations now require all caverns to retain a 12 m thick salt roof to protect the overburden.
Sinkholes in the Detroit River
In 1971, several sinkholes developed in and around Hennepin Point near the Detroit River, some 10 km downstream from the Windsor collapse (Warren, 2006). Production of brinefield salt began in 1943 and the sinkholes resulted from 30 years of solution mining at depths of more than 320 m, using poorly completed or protected wells. Salt cavities quickly coalesced to form larger cavities. The largest cavity was created from two caverns and ground subsidence was noted in 1960. Subsidence was constant until 1967 after which it accelerated until the first collapse crater formed in February 1971. Its subsidence history closely mirrors that of Windsor, with a second larger crater formed in May 1971.
Sinkhole at Bayou Choctaw Dome, Louisiana, USA
A brine well in the Bayou Choctaw salt dome collapsed during brine production in 1954 as a result of loss of the salt roof above a growing cavern. A sinkhole formed at the site, into which a rig collapsed. Eventually a lake 210 m in diameter developed.
Grand Saline sinkhole, Texas
A sinkhole appeared at surface within the city of Grand Saline, Texas in 1976. It developed at the site of a former brine well that produced brine between 1924-1949 from the Grand Saline salt dome, the top of which was only 60 m below ground level. A sinkhole 15 m in diameter developed, causing the collapse of a sewer.
Winsford Mine, Cheshire
Salt mining at the Winsford Mine commenced in 1844, although the mine was closed between 1892 and 1928 (BGS, 2006). Since 1928 it has been the major source of rock salt in the UK.
136

Extraction is by room and pillar mining and is currently from the Bottom Bed of the Northwich Halite Formation at a depth of about 140 m. The salt is extracted from galleries 8 m high and 20 m wide. Pillars are 20 m x 20 m, which gives an extraction rate of 75%. Formerly, drill and blast methods were used for salt extraction. However, since 2002 a continuous mining machine has been used to extract the top ‘lift’ of 4.5 m, with either bench blasting or a continuous machine being used for the bottom 3.5 m. The mine is dry and stable and room and pillar mining creates little or no surface subsidence.
However, the intersection of a borehole in 1968 caused serious flooding of the mine and as a result, protection barriers of 75 m are now left around boreholes (BGS, 2006a).
Examples of problems associated with old (non brine) wells in salt bearing successions
Again, the list of examples in this Appendix is not exhaustive, merely illustrative.
Wink Sink, Winkler County, west Texas, USA
The Wink Sink oil well is an example of problems with a well arising from drilling through thick salt beds. The incident at Wink Sink, Winkler County, west Texas, centred on an abandoned oil well within the giant Hendrick Oilfield (Warren, 2006). The oilwell had been drilled and completed to industry standards of the time in the late 1920s and had produced oil from 1928 to 1951. It was finally plugged in 1964.
The incident involved the development of a sink or subsidence crater, which first formed in June 1980, centred on the abandoned well. Within 24 hours the sink was around 110 m wide and within 3 days was 34 m deep. Investigations found that the collapse was the result of an underlying solution cavity that had developed in Permian halite beds 400 m below. It had migrated upwards by successive roof failures until it eventually breached the land surface.
The process of dissolution, cavity growth and resultant chimney collapse were accelerated by drilling and inappropriate well management practices in the immediate area of the well in the early part of the 20th Century. Several factors and events were clear:
• Use of fresh water drilling fluid at the time
• Nitro-glycerine had been used to straighten the hole
• Casing too short to isolate aquifers, permitting fresh water into the borehole surrounds
• Poor cementing of the well failing to seal adequately the salt beds behind the casing, thereby opening a vertical pathway for movement of undersaturated brine up or down the borehole surrounds
• Inappropriate cement for basal section of the borehole in saline conditions.
• Corrosion of the casing and cement by salt water
• Possible fracturing of original cement during later workover, re-entry and plugging operations.
• Removal of some critical casing during the final plugging and abandonment of the well in 1964, which would have permitted movement of water up or down the borehole surrounds.
• The absence of cement plugs or linings to the well below a certain depth during operation would also have allowed movement of water up or down the borehole
• The pumping of large amounts of brine water between 1928 and 1951, would have caused significant cross flow of undersaturated water and further assisted corrosion of the casing and dissolution of the salt.
137

Drilling, completion and plugging procedures therefore, combined to create a conduit that enabled fresh water to circulate more effectively in the vicinity of the borehole and thereby dissolve salt. Once dissolution and cavity formation was sufficient, roof collapse into the cavity occurred. The Wink Sink collapse thus illustrates the importance of (Warren, 2006):
• Appropriate well design specifications
• Reliable maintenance during well life
• Need for adequate plugging and abandonment procedures specifically designed for wells passing through salt or salt prone intervals.
Panning Sink, Barton County, Kansas, USA
The Panning Sink formed in April 1959 as a result of subsidence and collapse around a saltwater disposal well, abandoned the previous January because of uncontrolled wellhead tilting. The suspect well (Panning 11a) was originally drilled as an oil well in 1938 and penetrated the Permian Hutchinson salt about 200 m below ground. It was drilled using freshwater which caused the dissolution of the salts, with the result that the cavity thus formed was not cemented in behind the casing. The borehole was converted to a saltwater disposal well between 1946 and 1958, further dissolving the salt behind the casing and leading to roof falls and upward migration of the collapse chimney. Eventually, the cavern reached ground level, forming a 90-metre wide water-filled sinkhole in about 12 hours, which continued to gradually widen over the next few days.
Gorham oilfield, Russell County, Kansas, USA
The largely depleted giant Gorham Oilfield, produced from around 1,397 oil wells, is the site of slow ongoing subsidence above salt dissolution zones in the Wellington Salt, which is equivalent to the Permian Hutchinson Salt, described elsewhere in this report. A number of wells drilled in the period 1936-1937 that pass through the salt are now plugged and abandoned. However, corroded casing has been left in these holes above, within and below the salt, permitting unsaturated water to flow up and down some of the boreholes, dissolving large volumes of salt. Subsidence was also aided by disposal of waste oilfield brines that were reinjected when under saturated with respect to halite.
Lake Peigneur, Louisiana, USA
Lake Peigneur is a natural water-filled depression approximately 2.4 km in diameter located on top of the Jefferson Island salt dome in the low-lying Gulf Coast area of Louisiana. The Jefferson Island salt mine works are nearby.
On November 20th 1980, a sinkhole started to develop during drilling of an oilwell from a pontoon in the lake. The oilwell intersected an unused section of the salt mine around 350 m below lake level. Within 12 hours the lake had drained, leaving a collapse sinkhole 0.91 km2 in area. The surface entry hole in the floor of the lake quickly grew to a half-mile wide crater. Fifty personnel were working underground in various areas of the mine at the time and were safely brought to the surface. In the days following, the surrounding sediments collapsed into the crater, sealing the hole. The waters of the Gulf of Mexico refilled the depression and restored the lake.
This episode illustrates how quickly incidents can arise and how human error (in the form of a lack of due diligence, forward planning and communication between various private and government authorities) once again contributed to a major accident (Warren, 2006). It also demonstrates how quickly potential leakage could occur following a breach in a cavern roof in any shallow storage facility filled with low density and mobile fluids.
Haoud Berkaoui Oilfield, Algeria
In October 1986 a crater around 200 m in diameter and 75 m deep appeared in the Haoud Berkaoui Oilfield in Algeria. It continued to expand and reached around 230 m by 600 m across,
138

at a growth rate of about 1 m per year. The collapse is centred on two oil wells drilled in the 1970s, one of which was abandoned due to well stability problems, with no casing near the bottom of the well and just below an evaporite sequence. The absence of casing, properly cemented inplace, allowed water to percolate into surrounding salts. A second well, drilled in 1979, was located 80 m away and completed successfully. However, in March 1981 the lining of the second well fractured due to cavity formation in the salt, with the creation of the large crater, as a result.
As with the Wink Sink, the loss of the wells again shows the need to plan abandonment of wells in a salt bed, especially if the salt is a seal to a regional artesian system (Warren, 2006).
139

Appendix 3 Descriptions of current operational UK UGS facilities and proposed schemes at the planning or development stage
The following are summaries of various oil or gas field gas storage facilities/operations in the UK.
Currently operational UGS facilities
Depleted Oil and gasfield facilities
Rough Gasfield, (offshore, Southern North Sea) – also Appendix 5
The Rough gasfield storage facility is about 31 km (20 miles) off Withernsea on the East Yorkshire coast, in the southern North Sea. It was originally developed in October 1975 to produce natural gas from the (Early Permian) Rotliegend sandstone reservoir, at around 2750 m (circa 9,000 feet) below the seabed, forming the Rough field.
The gasfield was converted to Britain’s biggest offshore gas storage facility in 1985, since when it has been used to store gas under pressure in the depleted Rotliegend reservoir, providing seasonal gas storage capability (Stuart, 1991). It can supply around 10% of Britain's peak demand for gas and currently represents 80% of the UK’s gas storage volume. In November 2002, the Rough offshore gas storage facility, linked pipeline and onshore processing plant at Easington in Yorkshire was acquired by Centrica.
Hatfield Moors and Hatfield West (onshore)
The Hatfield Moors gasfield was discovered accidentally (leading to a blow out and fire) during drilling of the Hatfield Moors No.1 exploration well in South Yorkshire in December 1981 (Ward et al., 2003). It was followed by the discovery of the small Hatfield West gasfield in 1983. Gas was encountered at a depth of 484 m (1587 feet) in the Westphalian B Oaks Rock Sandstone Formation. Gas was previously unknown at this stratigraphic level, apart from mine gas, despite the many coal and several oil boreholes that had already penetrated the shallow formation in this area.
Production at the fields commenced in 1986, with both presently 100 per cent owned and operated by Edinburgh Oil and Gas (EOG). Gas was initially supplied to the local Belton Brickworks, although this contract terminated in June 2000.
Devised in 1996, a plan was agreed with Scottish Power in 1998 to use the depleting Hatfield Moors field as a gas storage facility. A 25-year storage contract was agreed and the gasfield was converted to a gas storage facility during 2000. Under the agreement Scottish Power have exclusive rights to inject, store and withdraw gas. EOG receives revenues based upon the storage capacity of the reservoir and for the provision of reservoir management services to Scottish Power.
Although the technique is widely used in France, Germany and the US, Hatfield Moors represents the first onshore UK facility of its kind. Gas from the National Transmission System is compressed before being injected into the porous layers of sandstone circa 1,450 feet underground for storage. The reservoir can store up to 121.8 Mcm (4.3 bcf) of gas at any one time, providing enough gas to meet the peak demands of 250,000 domestic customers.
Some of the gas stored at Hatfield Moors is also used for electricity generation at Scottish Power’s gas-fired power stations. Before gas can be returned to the network for delivery to
140

customer, it must be reduced to the appropriate pressure. A 12 km pipeline provides the link between the storage facility and National Grid Gas’s Transmission System.
The Hatfield West field also has potential for conversion to use as a gas storage facility.
Humbly Grove, Hampshire (onshore)
The Humbly Grove oilfield in Hampshire was one of the largest onshore oilfields in the UK. However, as production declined, Star Energy proposed to develop it as a gas storage facility when they announced the major new underground gas storage scheme in early 2003 (received by Hampshire County Council, May 2003: www.hants.gov.uk/decisions/decisions-docs/030910-regunct-R0909111823.html). Having gained planning permission in 2003, work commenced on the site in February 2004 to construct a c. 283 Mcm (10 Bcf) gas storage facility (Fig. 29). The facility was completed in February 2005 and commenced operation on November 4th 2005. The gas injection will also re-pressurise the main oil reservoir, which is the Great Oolite (Middle Jurassic in age) at around 982 m below Ordnance Datum (OD), which will also extend the life of the field from less than 10 years to around 20 years.
The facility required the construction of a pipeline 27 km long and 24 inches in diameter to link the oilfield to the national gas transmission system (NTS) at Barton Stacey near Andover. An additional processing plant has been constructed, together with the installation of compression equipment to pump the gas into the gas store from the NTS and to return the gas back to the NTS after processing.
Salt Cavern Storage facilities
The following are summaries of salt cavern gas storage facilities/operations onshore in the UK (refer Fig. 1):
Holford, Cheshire (Triassic salt)
A former brine production cavern (H 165) in the (Triassic) Northwich Halite Member in the Holford Brinefield, Cheshire, was converted by ICI in 1984 into a gas storage cavern. It was originally leased to Transco, providing diurnal storage and operation has since been transferred to IneosChlor who operate the facility for gas trading.
After the cavern was refilled following a required 10-year inspection, operations resumed in November 2006.
Hole House, Cheshire (Triassic salt)
The Hole House facility, west of the village of Warmingham near Crewe, Cheshire is a gas storage facility developed in the Triassic Northwich Halite Member of the Warmingham Brinefield, which is owned and operated by British Salt. Permissions and consents were originally granted to Aquila Energy Limited in 1995. Commercial operations began in February 2001. The facility was acquired by EDF Trading Limited in October 2002, since when it has been operated by EDF’s subsidiary company Energy Merchant Gas Storage (UK) Limited (Beutal & Black, 2005). It is linked to the National Grid gas transmission system.
Phase I of the project saw the construction of two cavities, each of approximately 30 Mcm (c. 150GWh) and a gas processing plant, which became operational in March 2003. The caverns have been designed to provide a highly flexibile facility, capable of supplying ‘peak gas’. British Salt use the brine produced during the cavern washing process. The salt is up to 230 m thick and the tops of the caverns are at about 300-400 m depth, slightly shallower than at the Holford and Byley sites (Beutal & Black, 2005). Gas can be delivered at a rate of 2.8 Mcm per day and injected at 5.6 Mcm per day (UK Gas Report, 2005). Phase II saw two additional salt cavities constructed, providing a further 30 Mcm (150 GWh) storage, and an upgrade of the gas processing plant with gas again delivered at 2.8 Mcmd and injected at 5.6 Mcmd. EDF commissioned the first of these two cavities before the end of 2006, and expect to complete the second by the end of 2008 (UK Gas Report, 2005).
141

Hornsea (Atwick – Permian salt)
The Hornsea gas storage facility in East Yorkshire was granted planning permission in 1973 and built originally by British Gas Corporation (refer Dean, 1978, 1985). It became operational in 1979, providing storage and peak-shaving supply to the NTS. The facility was bought by US energy company Dynergy in 2001 and sold the following year to the current owners and operators SSE Hornsea Ltd - part of Scottish & Southern Energy plc (UK Energy Report, 2005).
The facility comprises a central processing area and nine salt cavities leached into the main salt of the Fordon Evaporites (Z2) at depths of between circa 1720 km and 1820 m below the surface (Beutal & Black, 2005). Wellhead spacings are >400 m and the size and volume of the caverns is variable due to variations in the thickness of the salt, with the facility providing a total of around 325 Mcm of gas storage space. Gas can be injected at circa 2 Mcmd and withdrawn at up to 18.5 Mcmd (UK Energy Report, 2005).
Teesside – Billingham (Saltholme) and Wilton (Permian salt)
The Teesside Saltfield in south Durham is formed by the (Middle or Main) Boulby Halite Formation (Z3) which overlies the Billingham Main Anhydrite. Salt was extracted at Greatham by controlled brine pumping from around 1822 until at least 1969. As early as 1959, the Northern Gas Board used a solution-mined cavity to store town gas (Notholt & Highley, 1973). More than 100 small brine production caverns were created by ICI to the north of the River Tees at Saltholme and south of the river at Wilton. Some of these have been converted and used for storing light hydrocarbons and the various fluids and gases associated with oil refining since 1960.
In the Teesside area, the top of the Boulby Halite lies at depths of between 274 m and 366 m, deepening eastwards and offshore to over 650 m and is up to 45 m thick (Notholt & Highley, 1973). At least 4 caverns at Saltholme, owned by IneosChlor and leased to Northern Gas Networks (NGN), are owned by IneosChlor & operated by NGN for natural gas. Development and storage commenced 1959-1983, with cavern volumes of 10,000 m3 – 30,000 m3 (providing a total net cavern volume of 0.08 Mcm).
SABIC (formerly IneosChlor//Huntsman) have informed this report that there also exists at Saltholme, 18 ex ICI caverns that are in operation for storage purposes (Table 1). There are a further 9 redundent caverns. Development started in the 1950s with storage having commenced 1965-1982. They include 1 ‘dry’ cavity storing nitrogen, 17 ‘wet’ storage cavities containing hydrocarbons ranging from hydrogen to crude oil. In addition, 9 redundant storage cavities, 75 redundant brine wells/cavities (that have never used for storage) and 5 in service brine wells also exist. Injection and withdrawal rates are not available.
Further caverns in both the Saltholme and Wilton brinefields have, for many years, been used to store other liquids and gases such as nitrogen (SembCorp to store BOC nitrogen) and hydrogen (refer Table 1).
Current Applications and Proposals for UGS onshore
A number of applications for both depleted oil and gasfields and salt cavern gas storage facilities are currently at varying stages of the planning application process, or are now in the construction phase. These are briefly outlined below.
Applications to convert depleted oil and gasfields to gas storage
Caythorpe
Caythorpe Gas Storage Limited (CGSL), a subsidiary of Warwick Energy Limited, has applied for permission to build the surface facilities required to convert the existing gas field at Caythorpe into a gas storage facility. This permission has been requested from East Riding of
142

Yorkshire Council under the Town and Country Planning Act 1990. Permission to store gas in the underground gas reservoir has also been requested separately from the DTI under the Gas Act 1965 (http://www.warwickenergy.com/gas.htm).
The Caythorpe gasfield lies around 5.5 km west of Bridlington in East Yorkshire between the villages of Rudston and Boynton. The field was discovered in 1987 and commenced production in 1992. As with many of the gas fields in NE England, the reservoir is Permian dolomites. Initially, gas after processing was exported to the Natioanl Grid system, but since 1997 and the installation of a small power station on the site, power has been generated and exported offsite. Warwick Energy acquired the field in 2001 and commenced producing from an additional gas-bearing horizon in 2002. The current facilities comprise one producing well, a gas processing plant and a 9 MW power station, together with a low pressure pipeline which links the site to the nearby gas grid. To date, field operations have been without incident.
The Caythorpe Gas field is located in Licence area PL 234 in Yorkshire, which expires in 2017. To date, two wells have been drilled to define a single geological structure with fault-dip closure. The first well (C-1) was drilled by the original operator, Kelt UK Limited (Kelt) in 1987, on the edge of the accumulation. The second (C-2) was also drilled by Kelt in 1989 from the same surface location, but the borehole was deviated up to 44º to a crestal location to the west of C-1 (IEA, 1999). Two gas-bearing reservoirs of Permian age have been tested: one in the Kirkham Abbey (Dolomite) Formation (KAF - Permian Zechstein dolomitic and oolitic limestones) at 1748 m BOD; and the other in the Rotliegend sandstone formation at 1829 m BOD. The Rotliegend is a regionally-extensive formation and it is the main producing reservoir in many of the offshore gas fields in the southern sector of the UK North Sea. Over 30 m of core was collected from the Rotliegend in wells C-1 and C-2, providing detailed information on the reservoir characteristics. The reservoir consists of two sections, with the upper part having the better reservoir properties (permeability more than 100 mD) than the lower section (20 mD). No core was collected from the KAF (IEA, 1999).
The initial reservoir pressures were determined from the Repeat Formation Tester (RFT) tool data, with values obtained for the Rotliegend of 2,969 psia, and 2,835 psia for the KAF (IEA, 1999). The KAF was tested for 30 hours in well C-2 at up to 8 Million Standard Cubic Feet per Day (MMscfd) from a 13m interval. The reservoir is a tight dolomite with production from a natural fracture system. The gas had an H2S content of around 5 parts per million (ppm). Two separate production tests were completed in the Rotliegend in well C-2. A lower section near the gas-water contact (GWC) was tested at 1.0 MMscfd for 4 hours from a 3 m interval. The section near the top of the reservoir was subsequently put on extended test from a 3 m interval at rates up to 10 MMscfd. The Rotliegend gas has no reported H2S content. Well log interpretation and core analysis indicates an average porosity of 15% for the KAF and 18% for the Rotliegend and average water saturation of 40% for the KAF and 31% for the Rotliegend.
The Rotliegend has an original GWC at 1870 m BOD with a mapped closure of approximately 213 acres or 86 ha (IEA, 1999). No detailed map of the KAF has been made publicly available.
The field was originally explored, developed and produced by Kelt from 1983 to February 1997. Gas production has been from the Rotliegend reservoir alone, with well C-2 being the only producing well in the field. The KAF reservoir is isolated by the well completion. The well produced at rates up to 10 MMscfd mainly during the winter months. It has required two sand clean-out jobs to assist production performance, no other production problem issues being reported. Produced condensate has averaged around 5 Bbl/MMscf.
The field was shut-in from March 1996 until November 1997, during which time IEUKL secured the transfer of the licence and then obtained local planning and DTI approval for revisions to the development plan to allow onsite power generation. That plan included producing the reservoirs to a lower abandonment pressure than proposed originally due to the new surface production configuration that could operate to a lower pressure (60 psig versus 295 psig). The project approval covers power generation operations up to 2009. IEUKL operated and produced the field
143

at rates up to l.78 MMscfd from December 1997, with flowing wellhead pressures between 400 and 980 psig.
Production from the field has now declined, however, and the good reservoir properties in the KAF (c. 1748 m to 2090 m depth) and Permian Rotliegend (Leman equivalent) sands (c. 1829 m to 2135 m depth) mean that gas storage represents a viable future for the gasfield. Development would require a site extension to accommodate the additional gas processing facilities and compressors for the gas storage project. In addition, a further six wells would be required and these would be located at a separate site nearby. A new 4.4 km high pressure pipeline would also be needed, laid in the same pipeline corridor as the existing low pressure line, connected to the National Transmission System. The existing low-pressure line will be retained to provide fuel for the power generation facilities. A new pipeline will connect the storage facility and the new wellsite.
Studies indicate that the gas field has a total usable storage capacity of 210-212 Mcm (7.5 Bscf) offering the potential for short term withdrawal and injection rates of up to 8.5 Mcm/d (300 Mscf/d) or the capability of producing an average 4.7 Mcm/day (167 Mscf/d) over a 45 day period (http://www.warwickenergy.com/reservoir.htm). The redevelopment plan would extend operations on the site for an estimated 25 further years.
The hazardous substances consent application was accompanied by a full Environmental Statement (ES) for the proposed development, which drew upon the results of a number of environmental and technical surveys and studies commissioned by CGSL. A public meeting for the project was held in June 2005, at which concerns were expressed by some local residents about possible safety issues. The planning application for the surface facilities for the scheme was considered at a meeting of the planning committee of East Riding of Yorkshire Council on 22 June 2006, at which the committee rejected their planning officer’s recommendations that the application be approved, citing amongst other things, safety reasons and the lack of national need. Warwick/CGSL immediately stated their intention to appeal the decision and a public inquiry is due to commence on 24 April 2007 (Malcolm Wicks, Minister of State [Science & Innovation], Department of Trade and Industry (now Department for Business, Enterprise and Regulatory Reform): http://www.theyworkforyou.com/wrans/?id=2007-01-25b.110513.h).
Welton
The Welton oilfield was discovered in 1981, although oil exploration has taken place in the area since the 1950’s and has produced oil (and associated gas) since 1984. Production has now reached the mature stage as reservoir pressures and oil production declines. The main trap is provided by an anticlinal structure with fault closure to the east. The main reservoir is provided by late Namurian to early Westphalian channel and interchannel sandstones deposited in a large delta system. The depth to the main reservoir interval in the crest of the anticline is mapped at circa 1360 m below sea level. Oil density is 36° API and initial reservoir pressure was 2230 psi. Porosities and permeabilities lie in the range 9.5-12.5 % and 1-500 mD respectively (Rothwell & Quinn, 1987).
The proposals involve the construction of a 24” (609.6 mm) diameter steel pipeline, mainly located underground, from an existing national gas pipeline system near Holton cum Beckering (to the north of Wragby) which will link to the existing Star Energy Gathering Centre to the northeast of Reepham, and southeast of Sudbrooke. At the Gathering Centre the gas would be pumped into the existing depleted underground oil reservoir during periods of low gas demand, where under pressure it would assist in the recovery of the residual oil resources, but would also act as a substantial gas storage facility (refer Table 1). The stored gas would be reintroduced back into the national system during periods of high demand.
West Lindsey District Council at an Extraordinary Meeting of the Council on 27th May 2004 resolved to recommend “that Lincolnshire County Council be strongly urged not to grant planning permission”, citing public safety fears as the main point of concern. Subsequently,
144

County Council planners recommended planning permission be granted for the proposal, subject to certain conditions. No major concerns, in relation to the project were expressed by, the Environment Agency, English Nature or the Health and Safety Executive. However, at a meeting on 22 February 2006, Lincolnshire County planning committee concluded that planning application “was minded to be refused”, citing local fears over health and safety and claiming the proposals would represent an intensification of industrial development in open countryside, contrary to planning policy. The recommendation was that the proposal be called in for consideration and determination only after a Public Inquiry.
Star Energy immediately stated that they will appeal the decision to the Office of the Deputy Prime Minister believing that the company has grounds for appeal due to the fact the council's planning officers' report recommended approval of the project. It seems likely, therefore, that the situation will be resolved either at a Public Inquiry at some point in the future, or that the application will test the provisions of 1966 Gas Act in securing the relevant permissions to develop the gas storage facility.
Saltfleetby
The Saltfleetby Gas-condensate field is located on the East Lincolnshire coast between the Welton Oilfield of the Midlands oil province and the offshore gasfields of the southern North Sea (SNS). It was discovered in 1996 and commenced production in 1999. In January 2006, Wingas Storage (UK) Ltd (WSUKL) submitted a planning application to Lincolnshire County Council to convert the producing Saltfleetby Gasfield on the east Lincolnshire coast to a gas storage facility. The gasfield has been producing gas and associated condensate since December 1999 and is now reaching the mature stage of production, with reservoir pressures and gas production declining. The suitable geological conditions (reservoir and trap) mean that it is now being considered for conversion to use as an underground gas storage (UGS) facility.
The crest of the structure is mapped at circa 2234 m below sea level, with the trap being mainly the result of four-way dip closure, although faults provide seal and closure in a number of areas (Hodge, 2005). The reservoir rocks are late Namurian to early Westphalian channel and interchannel sandstones deposited in a large delta system. Initial reservoir pressure was 3566 psia, with a present day pressure gradient of 0.112 psi/ft. Porosities and permeabilities lie in the range 9.5-12.5 % and 1-10 mD respectively.
Gainsborough/Beckingham
Star Energy acquired the Gainsborough-Beckingham Oilfield in the East Midlands as part of its purchase of Pentex in July 2005 and is looking into its potential use for gas storage. Preliminary subsurface and development studies have been carried out and these indicate that the field is suitable for use as a gas storage facility with the potential to provide a seasonal storage capacity of 227 – 240 Mcm (8 – 8.5 bcf), with a deliverability of 3.5 Mcmd.
The Gainsborough-Beckingham Oilfield comprises a number of distinct accumulations, due mainly to the lateral and vertical (stacked) distribution of reservoir sandstones at a depth of approximately 1375 m. The Gainsborough section of the field was discovered in 1959, with production also having commenced in 1959. The Beckingham portion of the field was discovered and commenced production in 1964. A closely associated field, Beckingham West, was discovered in 1985 and commenced production in 1986. The reservoir rocks are late Namurian to early Westphalian channel and interchannel sandstones deposited in a large delta system.
Oil gravity at Beckingham West is 35.64° API, with original reservoir pressures in Beckingham of around 1400 psi (Gair et al., 1980).
In addition to the Gainsborough Oilfield, Star Energy is also undertaking further studies of other fields in the Pentex portfolio (many of which are in the East Midlands), to assess their suitability as potential gas storage reservoirs.
145

Albury
The Albury oil and gasfield in the Weald Basin, southern England, was discovered in 1987 and commenced production in 1994. It is currently operated by Star Energy, producing gas, which is used to generate electricity on site from two 1MW generators.
Albury is one of a number of depleting oil and gasfields in southern England operated by Star Energy and which, following Humbly Grove, are under consideration for conversion to storage facilities. Lower Cretaceous glauconitic sands and limestones of the Lower Purbeck Beds form the reservoir rock, present in tilted fault blocks at around 625 m below sea level (Trueman, 2003). Oil density is 31° API, initial reservoir pressure was 1100 psi and porosities and permeabilities are of the order of 25.3 % and 1067 mD respectively.
Development at Albury is anticipated to take place in two phases, with the projected completion of the facility somewhere around 2010.
In May 2006 Star Energy announced an agreement to purchase Edinburgh Oil and Gas's 37.5% share of the Albury gas field and its 25% share of the Storrington oilfield. The acquisition, which is subject to regulatory approval, will now give Star Energy 100% ownership of both fields.
On the 26th July 2007, Star Energy Group plc submitted its preliminary submission for a Storage Authorisation Order for its Albury Phase 1 gas storage project to the Department for Business, Enterprise & Regulatory Reform (Star Energy, 2007).
The application is for permission to store up to 8.2 bcf (billion cubic feet) of natural gas in the existing, partially depleted Albury gas reservoir.
Bletchingley
The Bletchingly gas discovery, lies along the northern boundary of the Weald Basin in southern England, to the south of the Palmer’s Wood oilfield in acreage operated by Star Energy. Gas was discovered in 1965 with the drilling of three exploration wells, flowing at a rate of 4 million cubic feet per day (Mcf/d)/0.113 million cubic metres per day (Mcm/d) from Jurassic (Corallian) limestones. Recoverable reserves at the time were estimated at 2.4 bcf/68 Mcm (Huxley, 1983).
The gasfield is formed by Upper Jurassic Corallian Limestone present in a faulted dome at around 930-1143 m below sea level (Trueman, 2003). Initial reservoir pressure is not available but porosities and permeabilities lie in the range 10 % and < 1 mD respectively.
The discovery and immediate license acreage in which the discovery lies, are currently under evaluation by Star Energy for their suitability to provide a gas storage facility, with storage potential currently estimated to be up to 900 Mcm. If the results are successful and planning is approved, it could be operational by 2009.
Storrington
The Storrington Oilfield lies in the Weald Basin, southern England and is operated by Star Energy. The reservoir rock is formed by sequences (limestones +/- sandstones) of the Great Oolite Group, present within tilted fault blocks at around 1152 m below sea level (Trueman, 2003). Oil density is 39.04° API, initial reservoir pressure was 1758 psi and porosities and permeabilities lie in the range 13 (6-26)% and 5 (0.1-2000) mD respectively.
Applications and plans to develop salt caverns for gas storage
Byley Cheshire (Triassic salt)
The Byley gas storage scheme is being developed in the Triassic Northwich Halite Member, around the Drakelow Lane area that lies towards the southern end of the Holford Brinefield, owned by IneosChlor. It is also referred to as the Holford storage scheme. Planning consent was not granted when Scottish Power originally applied in 2002. Scottish Power appealed the
146

decision, which led to a Public Inquiry in late 2002. Following the Inspector’s decision and after an intervention in the national interest by the then Deputy Prime Minister John Prescott, consent was granted in May 2004. It was confirmed after a legal challenge against the intervention failed in December 2004, and work commenced clearing and preparing the site in March 2005. In July 2005 Scottish Power sold their rights to Eon UK for around £96 million. In August 2005 work on the infrastructure commenced and Eon began the brining process for the caverns in the summer of 2006. The facility will be connected to the national transmission system (NTS) by a 4 km long pipeline.
IneosChlor will undertake the solution mining, with Eon leasing the caverns and owning/operating the infrastructure. The plans are for eight cavities, with wellhead spacings of 280 m, providing a storage capacity of around 170 Mcm, with a deliverability of 16 Mcmd (emptying in around 10 days) and injectability of 8 Mcmd (filling in 20 days). Phase 1 cavern washing commenced in summer 2006 and will provide about half the space (4 caverns) and estimated completion is by 2008. Estimated completion of the second phase (and full capacity achieved), is by 2010 (UK Gas Report, 2005). Cavern tops will be between 630 m and 730 m below ground (Beutal & Black, 2005) and it is noted that latest designs indicate the base of the caverns are likely to be at the level of the ‘Thirty Foot Marl’, which will form the cavern ‘sump’. Earlier designs had indicated that the ‘Thirty Foot Marl’ would lie at a level between half to two thirds of the way up the caverns (e.g. Beutal, 2002).
Stublach, Cheshire (Triassic salt)
The Stublach gas storage facility is located in the Holford Brinefield between Drakelow Lane and Lach Dennis. The site is about 2 km from Byley. The proposal to develop the Stublach facility, comprising 28 caverns in the Northwich Halite, will provide around 540 Mcm capacity. The cavities will be bell-shaped, approximately 100 metres in height, with their tops at around 550 metres depth.
INEOS Enterprises Limited submitted the planning application to Cheshire County Council in December 2005. Following a council meeting, planning permission was granted in June 2006 (Cheshire Council, 2006), subject to the Government not ‘calling it in’ (requiring further consultation and Public Inquiry). In July 2006 the DTI (now DBERR) “confirmed that whilst recognising that each case must be decided on its own merits, the Energy Markets Unit of the DTI believes that new gas storage projects would be invaluable from an energy policy perspective”. In December 2006, the Government confirmed that it would not be calling for an Inquiry signalling the go ahead for development. Hazardous substance consent was also granted. The project is thus fully consented and development can commence. The statements by Council members following the meeting said that “As far as [the Council] are concerned this application is a very difficult thing to refuse on local grounds”……“Byley was a long time ago and things are now vastly different.”…….“Members felt that the need for gas storage had been more clearly identified than when considering the Byley application……“And today felt that that national need was more important than all other planning considerations.” However, Council Members also resolved that should planning permission be granted, a legal agreement be entered into with the applicant and that over 80 stringent planning conditions would be required.
In late August 2007, it was announced that Gaz de France had signed an agreement with Ineos Enterprises for the commercial development of the proposed salt cavern storage facility (GDF, 2007). INEOS will continue to be involved in the development of the facility, which will involve the construction of up to 28 caverns by solution mining. The brine will be used for industrial purposes. The first phase of the Stublach gas storage facility remains on track to commence cavity development in 2009, with commissioning of the first caverns anticipated in 2013 and the remaining caverns developed through to 2018. The Group will operate the infrastructure under a 30 year lease agreement running until 2037.
147

Preesall/Wyre, Lancashire (Triassic salt)
Canatxx Gas Storage Ltd is planning to develop a salt cavern storage facility in the Preesall Halite of the Lancashire saltfield, which was worked by both mining and solution mining until the final brine extraction operation closed in 1993 (Landless, 1979; Wilson & Evans, 1993; BGS, 2006). In 2003, Canatxx submitted a planning application to develop up to 24 caverns, providing storage space for between 1200 and 1700 Mcm of gas, in the unworked Preesall Halite to the west of the existing brinefield beneath areas of the River Wyre Estuary. Pre-existing salt cavities arising from the brine extraction process have already been used by ICI for the storage of hazardous materials. Limitations exist on large-scale development of any sort due to the salt coming to crop in the east and south and by large areas of new housing in areas of unworked halite to the north of the brinefield.
The unworked halite is between 140 m and 240 m thick and the top of the caverns will be at depths between 220 and 425 m (refer Heitmann, 2005). Caverns, the heights of which will be variable and dependent upon local geological conditions, will be accessed via S-shaped deviated wells from clusters of wellheads located elsewhere in the saltfield. The facility has an anticipated operational life of 25 years and will be connected to the National Transmission System by a pipeline, with deliverability estimated at as much as 114 Mcmd.
The planning application received strong opposition, both from the local planning authority and local residents and in December 2004, Lancashire County Council voted to oppose the scheme. The application went to a Public Inquiry that ran from October 2005 to May 2006, when the number of cavities was reduced to 20 providing storage capacity for up to 1600 Mcm (c. 1.2 million tonnes: Heitmann, 2005; Humphries & Barrett, 2005).
On 17th October 2007 following the Inspector’s report, Hazel Blears, Secretary of State for Communities and Local Government, announced that the Government was dismissing the Canatxx appeal and refusing Planning Permission and Hazardous Substances Consent for development of a natural gas storage facility. The plans have been rejected mainly on the grounds of the impact on the local environment and on safety issues (http://www.gnn.gov.uk/Content/Detail.asp?ReleaseID=323317&NewsArea ID=2).
Isle of Portland, Dorset (Triassic salt)
In April 2005, Egdon Resources announced plans to develop a high deliverability salt cavern storage facility in Triassic salts beneath the Isle of Portland in Dorset. In February 2005 Portland Gas Limited was established as a wholly owned subsidiary of Egdon Resources. Portland Gas signed an agreement with Portland Port Limited in April 2005 to lease a 5 ha ‘brownfield site’ at the former naval base HMS Osprey for a period of up to 90 years.
Work began, with German cavern design experts KBB, on a feasibility study on the potential capacity and operating parameters for gas storage facility in the Triassic salts of the Weymouth and Portland area. A seismic reflection line was acquired in May 2005 and an exploration well (Portland No.1) was drilled and completed in June 2006. This proved the presence and thickness of the Triassic saliferous beds (Egdon, 2006a). Initial estimates were that the storage facility would have potential to provide up to 10% of the UK gas demand on a typical winter day and provide a storage facility for 1% of the UK annual consumption. Initially, the storage facility was planned for development in three phases of six caverns. Each phase would bring a working storage volume of 330 Mcm. The project has been designed with gas export capabilities to the national gas grid increasing from 18 to 54 Mcmd through the three phases. In September 2006 a technical feasibility study confirmed the potential for cavern storage over an area of approximately 20 km2. The revised plans had 14 cavities storing up to 1000 Mcm of natural gas. The injection and withdrawal rates of 20 Mcmd would permit the filling and emptying of the entire storage volume in 50 days (Egdon, 2006b). The caverns will be at depths greater than 2100 m and up to 100 m high (refer Fig. 57). The plans are that they will be operated in brine
148

compensated mode i.e. brine will be stored and used to compensate gas injection and withdrawal in the caverns (Egdon, 2007a).
As a result of the feasibility study, the Environmental Statement, planning and pipeline construction authorization applications were submitted in March 2007 (Egdon, 2007a). Six planning applications were submitted and included that for a brine well site at Stafford Farm, near West Stafford, adjacent to the pipeline. This will be used to store the brine used to compensate gas injection and withdrawal in the caverns. A separate pipeline will run to Portland from the site. If planning approval is granted during 2007, it is anticipated that initial storage capacity would be available during the winter of 2011, with full capacity being available during 2013 (Egdon, 2006b, 2007a).
King Street, Cheshire (Triassic salt)
NPL Estates, through its wholly-owned subsidiary King Street Energy Ltd, is proposing to develop a salt cavern gas storage facility near Rudheath in Cheshire (NPL, 2007). The site will be to the north of other proposed sites at Byley, Holford and Stublach (refer Fig. 1).
The proposed site, known as the King Street development, was formerly part of the operational Holford brinefield and has an existing planning consent for brining and underground waste disposal. It is proposed to store gas in underground cavities leached in the salt layer some 400m below the surface. The area is underlain by a thick salt layer (the Northwich Halite), which coupled with the overlying marl, is anticipated to make conditions possible for gas storage. The site will require further detailed geological investigation involving drilling and other exploration activities.
To develop the facility, NPL is proposing to construct nine cavities, each with a volume of 400,000 m3. It is reported that up to 216 Mcm of gas will be stored in total, of which up to 126 Mcm will be working gas during normal operations. The supporting gas processing facility will be located on the former Associated Octel Site on the northern edge of the Holford brinefield near Lostock Gralam. The site extends to about 16 acres (16.5 ha) and is remote from the local community. Once completed the wellheads will be secured in small compounds and fully screened from the surrounding area.
NPL proposes to construct a twin pipeline system between the Mersey Estuary and the King Street site to supply leaching water and to discharge the weak brine. Other gas storage projects in the district take water from the local rivers and pass the brine to process users. However, the rivers have little remaining abstraction capacity and there is no scope for local companies to process more brine for some time to come. The pipeline system will include pumping stations at both ends of the pipeline and one at approximately the halfway point. These facilities will be largely underground. There will be a need for an intermediate storage tank system at the King Street end to provide a buffer between the brining and pipeline operations.
North/South Aldbrough (Permian Salt)
Plans for an underground gas storage facility to the south of Scottish and Southern Energy’s (SSE’s) Hornsea (Atwick) gas storage site, at Aldbrough in East Yorkshire have been ongoing since 1997. At that time, two separate planning applications were submitted, one by British Gas at Aldbrough North (six caverns) and a second by Intergen at Aldbrough South (three caverns). Both applications were rejected, due to strong local objections and a further application was also refused precipitating, in 1999, the first Public Inquiry to be held into the planning and siting of such facilities (Beutal & Black, 2005). The Inquiry resulted in the Government granting permission to both BG and Intergen to proceed with plans to develop the two facilities.
In 2001 ownership of Aldbrough North passed to Dynergy with its acquisition of BG assets, which they then sold to SSE in 2002. In 2003 Intergen sold Aldbrough South to Statoil. The new owners combined the two projects in late 2003. The joint venture, estimated to cost £225 million, will generate a total storage capacity of around 420 Mcm, with SSE owning 280 Mcm storage
149

space and Statoil 140 Mcm. Injectability is thought likely to be around 20 Mcmd and deliverability circa 40 Mcmd (UK Energy Report, 2005).
Site work commenced in March 2004 and leaching of the first of the nine planned caverns began in March 2005. Cavern tops will be between 1800-1900 m below ground, with the first five caverns expected to be ready for commercial use around October 2007. The remaining four are likely to be completed by 2009 (UK Energy Report, 2005). The plant will be operated remotely.
North of Aldbrough (Permian Salt)
In mid January 2007, E.ON UK submitted a planning application to build underground gas storage facility to the north of Aldbrough in East Yorkshire. During 2006, E.ON had carried out geological investigations to confirm the area’s suitability for the facility.
The proposed facility is reported to provide a total working gas capacity of 420 million standard cubic metres of gas. The planning application was submitted to East Riding of Yorkshire Council with, it was hoped, a decision on the proposals reached by mid 2007. To date, there has been no announcement made on any decisions.
If the scheme is approved, construction is expected to start late in 2007 with the first phase operational in 2010. Completion of all work is planned by 2013.
Northern Ireland (Triassic and Permian salts)
Interest is being shown in the potential for developing salt cavern storage facilities in salts of both Triassic and Permian age in the Larne Basin, Northern Ireland. As described elsewhere in the report, the main salts are of Triassic age and have been proved in the Larne 1 and 2 boreholes (Penn, 1981; Mitchell, 2004).
On 24th July 2007, Egdon Resources Plc announced that a wholly owned subsidiary, Portland Gas NI Limited was being granted an exploration licence from The Crown Estate to evaluate the suitability of the Permian salt sequence, below Larne Lough, County Antrim, Northern Ireland to create caverns to store natural gas (Egdon 2007b). The salt sequence was proved by the Larne No.2 borehole, drilled in 1981. Close to the docks in Larne, this borehole proved a 113 metre thick sequence of salt near the top of the Permian sequence, at a depth of 1688 metres. During October 2007, Portland Gas NI Ltd plans to undertake a seismic reflection survey, which it is hoped will confirm the extent and suitability of the salt sequence proved in the old borehole, for the possible development of gas storage caverns.
150

Appendix 4 Seismicity - Earthquake magnitude/EMS-98 intensity comparison.
Earthquake magnitude/EMS-98 intensity comparison
Magnitude
(Richter)
Intensity Description
1.0 – 2.9 I I – Not felt
Not felt, even under the most favourable circumstances
3.0 – 3.9 II – III
II – scarcely felt
Vibration is felt only by individual people at rest in houses, especially on upper floors of buildings
III – Weak
The vibration is weak and is felt indoors by a few people. People at rest feel a swaying or light trembling
4.0 – 4.9 IV – V
IV – Largely observed
The earthquake is felt indoors by many people, outdoors by very few. A few people are awakened. The level of vibration is not frightening. Windows, doors and dishes rattle. Hanging objects swing
V – Strong
The earthquake is felt indoors by most, outdoors by few. Many sleeping people awake. A few run outdoors. Buildings tremble throughout. Hanging objects swing considerably. China and glasses clatter together. The vibration is strong. Top-heavy objects topple over. Doors and windows swing open or shut.
5.0 – 5.9 VI – VII
VI – Slightly damaging
Felt by most indoors and by many outdoors. Many people in buildings are frightened and run outdoors. Small objects fall. Slight damage to many ordinary buildings e.g. fine cracks in plaster and small pieces of plaster fall.
VII – Damaging
Most people are frightened and run outdoors. Furniture is shifted and objects fall from shelves in large numbers. Many ordinary buildings suffer moderate damage: small cracks in walls; partial collapse of chimneys.
6.0 – 6.9 VII – IX
VIII – Heavily damaging
Furniture may be overturned. Many ordinary buildings suffer damage: chimneys fall; large cracks appear in walls and a few buildings may partially collapse
IX – Destructive
Monuments and columns fall or are twisted. Many ordinary buildings partially collapse and a few collapse completely.
7.0 and higher X or higher
X – Very destructive
Many ordinary buildings collapse
XI – Devastating
Many ordinary buildings collapse
XII – Completely devastating
Practically all structures above and below ground are heavily damaged or destroyed.
151

Appendix 5 Underground Fuel Storage Incidents
Appendix 5 provides a review of underground fuel storage incidents found and described in Evans (in press) following a review of available literature and articles published on the internet (world-wide web). From this work the information and tables in Chapter 9 have been compiled.
European salt cavern storage incidents leading to cavern closure
The following descriptions summarise European examples of gas leaks at salt cavern facilities and instances of cavern closure arising from instability and volume loss, where no gas/product leakage occurred.
Teutschenthal, East Germany
At Bad Lauchstädt near Teutschenthal, to the SW of the city of Halle, Germany, an underground gas storage facility was developed in a salt cavern within the Zechstein (Permian) Stassfurt Rock Salt (Katzung et al., 1988). The facility lies in an area of sparsely populated countryside. Hereabouts halokinesis has led to markedly variable salt thicknesses with large salt pillows formed (Fig. 30). Overlying the Zechstein salt is up to 400 metres of ‘Bunter’ (Triassic) sandstones (the Volpriehausen Sandstone) and a thin Quaternary cover, comprising Pleistocene sands and gravels with marly till. The salt cavern, used to store ethylene, was located in the region of thicker salt and was approximately 150 m high, the top being at circa 550 m below ground and the base at just below 700 m.
On March 29th 1988, approximately one hour prior to the eruptions seen at surface, a rapid loss of pressure in the salt cavern was detected. The first eruption and release of a mixture of ethylene and water occurred about 50 m away from well #5. It was followed by several more in parallel rows that formed a 2 km long NW trending line of eruptions (Fig. 30). At the same time, major vent sites also developed about 250 m south of well No.5, in the vicinity of well No.6. The ventings of ethylene continued for several days, decreasing in intensity until the pressure in the cavern had reduced and between 60% and 80% of the product had escaped. The migrating ethylene/water mix once near surface caused doming of the ground, leading to cracks in buildings and tilting of concrete road slabs. Circular and elongated craters and fissures developed as the mix escaped to the air.
An area of approximately 8 km2 was evacuated whilst the situation was monitored, however, it was decided not to evacuate parts of Teutschental town. Investigations revealed that the cavern remained intact throughout the incident and that there had been no failure of the well casing at that level (Katzung et al., 1988). Ethylene was found in a drinking water well close by, which suggested leakage into an aquifer at depths of between 100 and 140 m. A faulty well casing connection at 111.8 m was subsequently found, which had permitted ethylene to migrate into the lower part of the Volpriehausen Sandstone aquifer, which is overlain by an impermeable horizon. From here the escaping ethylene, migrated laterally up-dip to the WNW until it encountered a reverse fault. This formed a vertical barrier and effectively ponded the ethylene, which then continued to migrate upwards to the NW. Eventually it breached the overlying caprock and escaped into the upper part of the Triassic Volpriehausen Formation aquifer. It migrated rapidly through this, laterally to the base of the Pleistocene deposits, aided it would seem by ‘linear zones of disruption’ (faults?) within the aquifer. Continued inflow and rising pressures caused doming of the Pleistocene deposits until finally confining pressures were exceeded and the mixture of water, ethylene and entrained boulder clay broke through to the ground surface, creating a linear series of both circular and elongated craters (Fig. 30).
152

Tersanne, France
Between November 1968 and February 1970, a pear-shaped cavern, referred to as Te02 (Bérest & Brouard, 2003), was leached in salt deposits at Tersanne in SE France (Fig. 21). This represented the first such storage facility in France (Thoms & Gehle, 2000). The top of the cavern was at a depth of about 1395 m, with the bottom at approximately 1500 m, although significant insolubles collected at the bottom of the cavern, such that the effective base of ‘free’ cavern space was at a depth of around 1470 m. The initial usable volume was 91,000 m3 +/-2700 m3 (Bérest & Brouard, 2003). Dewatering and filling of the cavern commenced in May 1970 and was completed by November 1970. The cavern operated for nine years, during which time the average pressures were high, but operation of the cavern meant frequent and significant pressure variations (Bérest & Brouard, 2003). Such operating conditions resulted in a 30-35% volume reduction by July 1979.
The facility is still operational (operators; Gaz de France: http://www.igu.org/html/wgc2006/ WOC2database/Excel/Report_Tab_Summary_UGS_Key_Data_2006_in_operation_english.xls) and has recovered much of the volume loss (Thoms & Gehle, 2000; Warren, 2006). Presently, Gaz de France operate other salt cavern storage facilities at depths of 1400 m in the same salt deposits of the Tersanne area. Around 14 storage wells/caverns are in operation, with gas stored at pressures of between 80 and 240 bar and providing 204 mcm3 working gas volume.
Kiel, Germany
A gas storage cavern (Kiel 101) was leached out in impure halite deposits (haselgebirge facies) of Permian age at depths between 1305 m and 1400 m at Kiel in Germany (Fig. 31; Coates et al., 1981). The high insolubles content of the halite meant that of the initial 68 000 m3 volume, the effective volume was reduced to less than 60% of the total (c. 40,800 m3). Pumping to remove brine from the cavern commenced in November 1967 and roof breaks were noted after only 5 days (Bérest & Brouard, 2003). Useable cavern volume then stood at around 36,600 m3, but after 35 days operation, sonar scans indicated had fallen by around 12% (down to 32,100 m3). A further volume loss of 6% (1900 m3) occurred over the next 5 months (Bérest & Brouard, 2003).
The cavern was operated at between 80-100 bar pressure until at least 1971 and is believed to have been one of the caverns used to store town gas (60% - 65% hydrogen) since 1971 (Padró & Putsche, 1999; Leighty et al., 2003).
Viriat, France
Sketchy details of an incident at a salt cavern storing ethylene have been obtained (AEA, 2005; Nigel Riley, HSE 2005 pers com). The incident in September 1986, apparently related to rupture on a compressor unit that released a gas cloud. No further details are available.
American and Canadian salt cavern storage incidents
In the USA, solution-mined salt caverns have, for many years, been used for storage by the petrochemical industry. More recently they have been used for the storage of natural gas and liquefied petroleum gases (propane and butane). Figures released by the Energy Information Administration (http://tonto.eia.doe.gov/dnav/ng/ng_stor_cap_dcu_nus_a.htm) show that the US operates the highest number of UGS facilities, with 394 (although 37 were classified as marginal at the end of 2005 – that is no injections or withdrawals, or withdrawals only were made; EIA, 2006). This figure compares with 410 underground natural gas storage facilities in operation in 1998 and a peak figure of 418 operational sites in 2001. Of these 30 (c. 7%) were salt cavern facilities. By 2003, there were 391 underground natural gas storage facilities. Of these, salt caverns constituted 8% of the total.
Two types of salt deposits of three different ages occur in the USA and Canada (Fig. 25), namely bedded salt and salt domes. The former occur in layers in a number of basins across the USA and
153

into Canada, bounded on the top and bottom by (often impermeable) competent rock formations. In Canada salt was deposited during Devonian times in the Western Canada Sedimentary Basin, forming the Lotsberg and Prairie evaporite formations. These have been extensively exploited, as have the most wide spread bedded salts in the USA, which are of Permian age. These deposits contain significant quantities of impurities and are interbedded with variously impermeable anhydrite, shale, and dolomite beds. The Middle Jurassic Louann Salt (e.g. Seni & Jackson, 1983) is a thick bedded, homogenous halite deposited from hypersaline waters that developed in restricted marine basins across much of the area of the present day Gulf of Mexico, including onshore Texas, Louisiana and Mississippi (Jackson & Seni, 1983; Seni & Jackson, 1983; Wescott & Hood, 1994). These basins developed during late Triassic-Early Jurassic rifting, as the North American Plate drifted away from the African and South American plates.
The Louann Salt reaches thicknesses in excess of 1500 m in the basin centre and forms the second type of salt deposit; halokinetic structures that include salt domes, diapirs and walls. These structures are most abundant in the East Texas and Gulf Coast area. The salt first moved during the early period of basin formation (Jurassic-Early Cretaceous) and continued to move at different times thereafter.
American incidents involving storage facilities constructed in Mid-Jurassic Louann salts of the
American Gulf Coast area
Eminence, Louisiana (USA)
Located in Covington County, Mississippi, the Eminence salt dome represents a large salt piercement structure, the top of which lies at about 745 m below ground level (Halbouty, 1979). Strictly, the Eminence facility is not associated with any release of gas, but is included here as it experienced loss of volume due to salt creep, which led to its closure.
In 1970, following extensive studies, Transcontinental Gas Pipe Line Corporation selected the Eminence Salt Dome, as the location for the first solution-mined salt cavern facility constructed specifically for the storage of natural gas in the USA (Allen, 1972). The site was chosen because the dome was near to Transco’s natural gas pipeline, the salt was relatively shallow, there was a ready supply of freshwater with which to leach the salt and the Wilcox Sands provided an aquifer for brine disposal (Fig. 32).
Two caverns between 1740 m and 2050 m apart, each with capacities of just over 1,100,000 bbl, were constructed using solution wells, which were spudded in August and November 1968. Leaching operations were completed by January 1969. A further two caverns followed, to provide a storage volume of 251.8 Mcm (Coates et al., 1981).
The caverns, each served by a single well, were operated “brine free”, i.e. no brine was present in the cavern, natural gas being injected into the caverns under pressure. Gas is withdrawn from the caverns due to the pressure, not by pumping brine into the cavern. Maximum operating storage pressure was around 27.2 MPa (3,950 psi), although the well casing and shoe assembly was tested to 5000 psi, whilst wellhead equipment with 34.5 MPa (5,000 psi) working pressure was installed. Minimum operating pressures were around 6.9 MPa (1000 psi).
In 1970, cavern tops were at around 1725 m and the bases at about 2000m. By 1972 the cavity bottom in cavern No.1 had risen by around 46 m, with a total closure of 40% of the initial volume in just two years (Baar, 1977; Bérest & Brouard, 2003).
The facility operated for over 10 years, but the loss of cavern capacity appeared to lead to its closure in the early 1980s. However, it is reported that volume was regained and the facility is currently in operation (Warren, 2006). The cause of the volume loss was due to having operated at pressures too low to maintain cavern walls.
154
Petal City, Mississippi (USA)
The Petal City gas storage facility is located near Petal City in Forrest County, Mississippi (Fig. 25; EIA, 1995). Petal Gas Storage LLC (a subsidiary of GulfTerra Energy Partners, LP) operated the facility in 2004, with a contract to provide Southern Natural Gas with storage space. The facility, with interconnectors to the Tennessee Gas Pipeline, Gulf South Pipeline and Hattiesburg Gas Storage facility, comprises at least 7 caverns providing up to 83.2 Mcm of high-deliverability natural gas storage and 35,400 horsepower of compression (Energy Pipeline News, 2001, 2004). The top of the salt is around 530 m below ground level (Halbouty, 1979) and the caverns have been used to store natural gas for over 30 years, operating in brine compensated mode (gas is injected/withdrawn as brine is removed/replaced).
On the 25th August 1974, liquefied butane gas was being pumped into the cavern with displaced brine moved to an open pond for storage. A miscalculation in the cavern volume amounting to 2190 tonnes (circa 106 US gallons), led to the cavern being overfilled, although the amount that eventually escaped is not known. As the gas replaced the brine in the well, pressure was lost, allowing high velocity escape of butane, which quickly formed a flammable cloud 2 kms (1.25 miles) in diameter (AEA, 2005).
Sometime after the release of butane, there was a small explosion and a fire, which caused convection and mixing of the cloud and air column. This led to a second explosion, some 240 m – 305 m above the ground, which damaged houses up to 275 m away and shattered windows up to 11 kms away (AEA, 2005). The fire burnt for 5 hours before the well was controlled by pumping brine into it and closing the valves. In all, 24 people were injured and around 3000 evacuated during the incident (Hirschberg et al., 1998; AEA, 2005).
West Hackberry, Louisiana (USA)
Located near Lake Charles in southern Louisiana, the West Hackberry salt dome (Fig. 25) was known as early as 1902. The top of the dome is at around 545 m below ground level (Halbouty, 1979). The salt deposits provided brine for the local chemical industry and in 1977, a number of the resulting caverns were acquired by the US Department of Energy (DOE) for the SPR. The first crude oil delivered to the SPR on July 21, 1977 was stored at the West Hackberry storage site, which now has 22 caverns capable of providing 219 mmbbl storage space.
On September 21st 1978, during work on one of the wells servicing the Number 6 cavity (it was serviced by more than one well in order to speed up operations), there was a sudden release of an estimated 72,000 bbl of oil, which caught fire, killing one of the crew. The oil geyser continued until the cavern had depressurised (Bérest & Brouard, 2003). A DOE report into the accident (1980) concluded that it arose as a result of work to repair a leak in the outer casing of the well completion and to reinforce wellhead equipment. This involved the withdrawal of an inner pipe and installation of a packer to seal off the cavern. During the work, however, the packer moved and was then pushed to the surface by the pressure of the oil. This led to the sudden and violent release of the cavern contents. The release and the associated oil geyser, continued until the pressure reached zero.
The investigation and safety reports concluded that any future work of this nature should be done when cavern pressures are lower and the wellhead pressure is zero. The incident serves to illustrate that the highest risks at cavern storage facilities result from special activities, rather than during normal operations (Bérest & Brouard, 2003).
Mont Belvieu (aka Barbers Hill), Chambers County, Texas (USA)
The Mont Belvieu gas storage facility is closely linked to the Barbers Hill oilfield discovered in April 1916 and developed in association with a salt dome near Mont Belvieu, approximately 48 kms northeast of Houston (Fig. 25). The salt dome has served as an underground storage facility in more recent years, with around 150 solution-mined caverns constructed to store liquid propane gas for the area’s numerous refineries.
155

The salt dome has a diameter of approximately 1600 m (1 mile), arising from mobilisation of the Jurassic Louann Salt at depth. It has led to an oval-shaped area up to 14 metres above the surrounding land level and caused radial faulting of the rocks pierced by the salt dome (Fig. 33). In 1955 Warren Petroleum Company commenced construction of underground storage caverns and a gas terminal. Twenty-six caverns with a capacity of 43 mmbbls of LPG (a mix of propane and ethane) were built making it the largest such facility for LPG in North America. Today, many other companies operate similar facilities in the area. Up to 150 active solution-mined caverns now store between 75 and 300 mmbbls of hydrocarbon products, making this, the world's largest storage site for petrochemicals and volatile hydrocarbons.
On September 17th 1980, a drop in pressure was recorded in one of the cavities holding the LPG, due to an underground leak in which the LPG gasified. It is believed that almost 28.3 Mcm (1 billion cubic feet) of an ethane-propane mix was lost from one of the caverns (Pirkle, 1986; Bérest et al., 2001). The cause of the initial leak was traced to a hole in the corroded casing of a well, dating from 1958, within the caprock overlying the salt at a depth of around 550 m (Pirkle, 1986; Bérest et al., 2001). The low-density propane and ethane rose through the cement outside the casing and then through porous rocks, faults and joints, accumulating in reservoirs at depths of 60 m – 120 m at pressures near the fracture pressure of the strata. Additionally, the gases migrated to the near surface and were found in a water-bearing sand 10 m thick beneath the town of Mt Belvieu. Relief wells were drilled into the high-pressure reservoirs at 60 m – 120 m and the gases flared off. The gas mixture migrated into the foundations of a house in the area and on October 3rd ignited when a spark from an electrical appliance (believed to be a dishwasher) triggered an explosion. In the days following, gas escapes appeared elsewhere, forcing 75 families from their homes for almost six months.
To relieve gas accumulations in the near surface, water-bearing sands, approximately 500 wells were drilled. In addition, the shallow sand was purged with nitrogen with shallow wells serving both as injection points and extraction points. As part of the post-incident remedial work and ongoing monitoring, over 100 monitor wells were installed on the operator’s property. These wells have been regularly monitored both around each storage cavern and around the property perimeter to provide early detection of any similar product release.
The 1980 explosion was followed by numerous other gas related incidents in the area over the years. In October 1984, several million dollars damage to property was caused after a further fire and explosion at the storage complex. This was followed by another explosion and fire in November 1985. On this occasion, two people were killed and the town's entire population of more than 2,000 residents were evacuated.
Prompted by these incidents, more than 200 homeowners and several churches within 240 m – 250 m of an underground storage well accepted buyouts as part of an eventual settlement with a nine-member industry consortium.
Other incidents related to the gas storage operations in the area include: an ethylene leak that closed Texas (route) 146 running through the town; a pipeline rupture that led to a gas leak and explosion in December 2000, which destroyed a home and released a large gas cloud 15 m into the air. There were reports the explosion caused several minor injuries, the evacuation of about 40 homes and the diversion of airplane flights around the area. There are also sketchy reports of explosions at two underground storage wells that burned for 43 days, and a major fire at Warren Petroleum Company when two workers were killed with many acres of land scorched.
Salt Dome Storage Field, Mississippi, USA
Sketchy reports exist of gas leakage at a salt dome storage facility in Mississippi in the early to mid 1980s (Pirkle, 1986; Pirkle & Jones, 2004), though the exact date and location is not known. The salt dome is likely to have been formed from the Louann Salt of Jurassic age.
A leak was suspected in one of the four storage caverns via a well. In order to identify the source of the leak, a grid of soil gas samples was taken from around the suspect storage well from
156
depths of circa 1 m for analysis of any hydrocarbons present. A clear hydrocarbon soil gas anomaly was observed largely within 3 m – 4.5 m of the well bore, with some annomalies up to 15 m away. Both the molecular and isotopic compositions of the anomalous surface soil gases were found to be identical to the composition of the stored product. The leak of the well resulted from poor cement jobs at the time of casing installation. The well was shut in and repairs undertaken (Pirkle, 1986; Pirkle & Jones, 2004).
Similar surveys around the other three storage wells were conducted. Two wells exhibited no evidence of hydrocarbon leakage, whilst around the third an area of approximately 38 m diameter was found where hydrocarbon concentrations in the soil gas at a depth of 1 – 1.5 m were 15% by volume. Again the molecular and isotopic composition of these soil gases was identical to the stored product. The leakage was attributed to poor cementation when the casing was installed. The operator immediately undertook remedial work, emptying the well and repairing the leak (Pirkle, 1986; Pirkle & Jones, 2004).
Mineola, Houston, East Texas
An incident, involving a blow-out and fire, occurred at an underground LPG (propane) salt dome storage facility operated by Suburban Propane near Mineola, East Texas, around 145 km east of Dallas (Fig. 25; Gebhardt et al., 1996; Bérest & Brouard, 2003; Warren, 2006). The exact date of the incident is slightly confused, with an incident in 1993 described on the WCO website (http://www.wildwell.com/Firefighting/ff_na4.htm) that makes reference to the novel use of coiled tubing in this well capping operation, as also referred to in Gebhardt et al. (1996). However, identical events and circumstances are described and attributed to the same authors (Gebhardt et al., 1996; Bérest & Brouard, 2003) relating to an incident in 1995 (Warren, 2006).
The facility utilised two salt caverns serviced by two wells, which were originally drilled as oil exploration and producing wells in the 1950s. Subsequently, the wells were used to inject water to leach the caverns after which they acted as the injection and withdrawal wells for the storage facility. The caverns, constructed in the Jurassic Louann Salt, extend from 360 m to 750 m below ground level (1200-2500 ft), with production string casing set at 483 m and tubing string to 732 m. Hydrostatic pressure at the bottom of the tubing string was 1,040 psi (Gebhardt et al., 1996).
Initially, it was thought that work on a storage well had caused fracturing of the salt, allowing communication between the two caverns. Further investigations revealed the incident had arisen because the storage facility was operated in brine compensation mode. This meant that new brine was introduced during each withdrawal of product, which had dissolved the salt, enlarging the caverns and narrowing of the salt wall between them until it was too thin to prevent the caverns from connecting. At the time of the incident there was circa 13 million gallons stored in one cavern, whilst the adjacent cavern was brine filled and undergoing a mechanical integrity test, involving cyclical injection and pressurisation with nitrogen. These operations and pressure variations caused failure of the salt wall, allowing the stored propane to flow into the adjacent cavern under test. This created a pressure build-up that ultimately caused a leak via the well casing that went undetected, allowing the stored propane to escape (Bérest & Brouard, 2003; Warren, 2006).
The propane migrated through the overburden via shallow sandy soil horizons reaching the surface in a halo extending up to 30 m from the well, where it found an ignition source. The fire burned with heavy black smoke. Around 15 m away from the product withdrawal, a water well that had been used during cavern leaching operations also ignited and burned during the incident. The water well provided a route to the surface for the propane that had collected in a shallow sand.
Extinction of the fire was not considered an option due to the likelihood of further unpredictable build-ups and re-ignition of the escaped propane. The situation was eventually brought under control using innovative kill techniques employing coiled tubing (Gebhardt et al., 1996).
157

Brenham, Texas (USA)
The Brenham salt dome, known since around 1915, lies on the Washington-Austin county border in Texas (Fig. 25), with the top of the salt occurring at around 350 m below ground level (Halbouty, 1979). The Wesley storage facility near Brenham, Texas, is an unmanned 52 acre site that in 1992 was owned and operated remotely from Tulsa, Oklahoma by an affiliate of the Seminole Pipeline Company; MAPCO Natural Gas Liquids Inc. (MNGL). The site was subject to a major incident in April 1992.
The cavern at the centre of the incident is around 810 m below ground level with a height of at least 50 m (Bérest & Brouard, 2003). Caverns at this facility were storing LPG and being operated in brine compensation mode. The brine was stored in two above ground ponds and it was found there had been some enlargement of the cavern due to the use of undersaturated brine. Wellheads were equipped with shut-down valves. The National Transportation Safety Board investigated the incident (NTSB, 1993a) and found a sequence of events and failures of procedures that led to the release of product and a series of explosions and a fire. Early in the morning of April 7th, 1992 operations to inject LPG into a cavern commenced. Ultimately, these operations led to a blast that registered 4+ on the Richter Scale in Houston (Thoms & Gehle, 2000) and was heard 160 kms away and felt 258 kms away. The blast left 3 people dead, 23 others injured, destroyed 26 homes within 1.5 miles of the explosion and damaged a further 33 homes. The ensuing fire scorched an area of 0.74 km2 (8 million square feet; NTSB, 1993a&b, 2006; Thoms & Gehle, 2000; Gruhn, 2003).
The NTSB investigation found that the explosion was caused when the storage cavern was overfilled with liquefied gas that pushed its way to the surface, pouring into an adjoining brine pit. Two valves in a brine sensing line were closed at the time of the accident, preventing sensors from detecting the increased pressure as the gas moved up the main pipeline. The valves had probably been shut during a maintenance review several weeks before the accident. No backup system was in place to allow for human error. Once above ground, the LPG vaporized rapidly and being heavier than air, formed a low-lying cloud several hundred metres long and 6 m – 9 m deep. A spark of unknown origin, but most likely from a passing car, triggered the explosion.
MNGL and the parent company (Seminole) were found to have failed to incorporate fail-safe features in the facility's wellhead safety system. The cause of the overfilling was the inadequacy of procedures for managing cavern storage. The company believed the cavern to be holding 288,000 barrels (circa 45,800 m3) of liquid. However, the safety audit following the explosion suggested that the figure was nearer to 332,000 barrels (circa 52,500 m3). The cavern was therefore filled beyond its capacity. Other contributory factors found were the lack of federal and state regulations governing the design and operation of underground storage systems and inadequate emergency response procedures.
Following the explosion, the LPG storage cavern passed a mechanical integrity test (Thoms & Gehle, 2000) and the operator applied to re-open the facility with an increased capacity. Almost two years after the blast, permission was refused and the Texas Railroad Commission, which regulates the oil and gas industry for the state, ordered that the facility be shut down permanently. The company fought the closure, losing several appeals and the site now operates as a pump station for pipelines. The cavern is empty.
A lawsuit brought by victims of the blast eventually resulted in a jury award of $5.4 million in compensatory damages and $138 million in punitive damages.
Stratton Ridge, Freeport, Texas (USA)
The Stratton Ridge salt dome in Brazoria County near Freeport, Texas (Fig. 25), was discovered in 1913. It represents a typical Gulf Coast salt dome (Applin, 1925), the top of which is at around 381 m (1250 ft) below ground level (Halbouty, 1979).
158

Caverns in the salt dome have been used to store LPG/NGL’s for many years (Halbouty, 1979). These include the caverns referred to as the Stratton Ridge Facilities, which in 2004 were owned by Dow Hydrocarbon & Resources, who were leasing them to Kinder Morgan Energy Partners L.P for gas storage purposes. The facility has a combined capacity of 334.1 Mcm of natural gas, working natural gas capacity of 153 Mcm and a peak day deliverability of up to 11.3 Mcm per day (http://www.kindermorgan.com/investor/kmp_2004_annual_report_financials.pdf).
In the early 1990s, a salt cavern was commissioned as a natural gas storage facility at the Stratton Ridge salt dome. However, the cavern had to be abandoned when, during testing, it failed a mechanical integrity test, having leaked gas whilst being pressured up for storage (Hopper, 2004).
Magnolia, Grand Bayou, south Louisiana (USA)
The Magnolia salt dome is located in a sparsely populated area at Napoleonville, about two miles from Grand Bayou, south Louisiana (Fig. 25). In 2003, a cavern gas storage facility was constructed in the dome, operated by Entergy Koch/Gulf South (http://www.txgt.com/sec/Pipelines%2010K%2012-31-05%20FINAL.pdf; Hopper, 2004). On Christmas Eve/Day 2003, only six weeks after operations began at the facility, around 30 people were forced from their homes by a natural gas leak that led to the release of about 9.9 Mcm of gas in a matter of hours.
Investigations revealed that the gas escaped from a crack in the casing of a well near the top of a cavern, some 440 m (1,450 ft) below the surface. It was eventually plugged at a point below the crack and four other wells were drilled in the area to monitor and control the release of leaked gas that was bubbling up from underground.
Moss Bluff, Texas (USA)
The Moss Bluff salt dome, located in Liberty County about 64 km (40 miles) northeast of Houston Texas (Fig. 25), was known as long ago as 1926 (Halbouty, 1979). It is a typical Gulf coast salt dome with the development of a rim syncline. The top of the salt lies at around 330 m below ground level and the base at depths greater than 3 km (Fig. 34).
The development of the salt dome has led to the region being dotted with man-made caverns and represents one of the world’s largest storage sites for hydrocarbons. The Moss Bluff gas storage facility, comprising three separate underground caverns in a 640-acre site, is operated by Duke Energy Gas Transmission and represents an important component in the regional production, storage and shipping of natural gas. An onsite compressor station pumps natural gas into and out of the caverns through wellhead assemblies on each of the caverns. There are related facilities for the transport and/or storage of hydrocarbons and pipework for natural gas, freshwater and salt water (brine). The operation of the caverns is brine compensated (brine is withdrawn from the cavern as gas is injected).
In August 2004, an incident occurred at cavern nos.1, the top of which is approximately 760 m below ground level and is circa 427 m high. For several days prior to the incident, cavern number 1 was operating in “de-brining mode” when brine was being brought to the surface and pumped to a surface holding pond (Duke Energy, 2004;http://www.solutionmining.org/cmsFiles/ Files/MossBluff_Part1ExecSum_&_IncidentDescrp.pdf). At the same time compressed gas was being injected into the cavern. Monitoring of brine-gas levels before the incident indicated that the brine/gas interface at the time was at 1132 m, some way from the bottom of the well string.
At just after 4 am on 19th August 2004, a leak in a pipe led to a sudden gas release from cavern Nos.1. The resultant explosion and fire caused the closure of roads and forced dozens of residents from their homes within a 1.6 km (c. 1 mile) radius, although no one was reported injured. A valve that could possibly have been used to turn off the flow of gas was inaccessible due to the heat of the fire. It was reported 1 person was present inside the facility at the time of the blast and was able to escape. A second explosion occurred the following day and the
159

evacuation zone was expanded to 4.8 km (c. 3 miles), with local press reports suggesting the total number evacuated to be around 360. The fire remained above ground throughout the incident and for safety reasons was allowed to burn itself out. It was eventually extinguished 6� days later at 9:15 p.m. on August 25th, when a blowout prevention valve was successful installed. During this incident, the safety and integrity of the two other storage chambers at the facility was never threatened.
Detailed investigations by Duke Energy and consultants subsequently revealed a series of events responsible for the uncontrolled gas release and resultant fire (Duke Energy, 2004; http://www.solutionmining.org/cmsFiles/Files/MossBluff_Part1ExecSum_&_IncidentDescrp. pdf). There was an initial separation and breach of the 8 5/8-inch well string inside the cavern at, or above, the 1135 m level. The reason for this breach remains unknown, as the affected materials could not be recovered from the cavern. However, records indicated that, only 10 days prior to the incident, the well string showed no signs of a separation. The breach permitted high pressure gas to displace the brine in the well, enter the well string, reach the surface and flow into the 8-inch above ground brine pipework. The emergency shutdown (ESD) system in place on the 8-inch brine pipework, a short distance from the wellhead assembly was designed to close on the detection of a change in pressure, flow and/or composition. The ESD operated properly. However, the sudden surge of flow acted like a “water hammer” and caused the 8-inch pipework between the wellhead and the ESD valve to rupture. This failure occurred at a location in the pipework that had suffered a general loss of wall thickness due to internal corrosion. The extent of the internal corrosion of the brine pipework was not anticipated due to the relatively short period of time it had been in service (installed and tested in 2000). The incident was prolonged when the extreme heat of the fire blew off the entire wellhead assembly early on Friday, 20th August. For about 28 seconds the fire appeared to have been extinguished, but gas escaping through the 20-inch production casing re-ignited and burned until it was extinguished finally on the 25th August.
The investigations concluded that the operating procedures were adequate and followed appropriately. Valve positions were confirmed and found to be correct. A thorough review of operator logs and employee interviews revealed no evidence for procedural or human error that contributed to the incident.
Odessa, Texas, USA
Natural gas liquids are stored underground in caverns at the Huntsman Polymer site in Odessa, Texas. Although not finally confirmed, this is likely to be in salt caverns engineered in one of the many salt domes in the Texas area. According to a single report, more than 100t of natural gas liquids escaped on 16 March 2004, due to a faulty gasket. The remaining gas was flared off, with no injuries reported (Hazardous Cargo Bulletin, June 2004).
American incidents involving storage facilities constructed in Permian salts
Salt deposits of Permian age are found across central America and have long been used for brine extraction and the construction of cavern storage facilities. More than 600 solution mined salt caverns exist in Kansas alone, many of which are used for the storage of natural gas liquids (NGL’s) and refined liquid products. In Kansas, the salts form the Hutchinson Salt Member of the Wellington Formation, separating the Lower and Upper Wellington shales (refer Figs 25&35). The Hutchinson Salt Member can be up to 215 m thick and in general, occurs as a series of distinct salt beds with interbedded mudstones and anhydrites. The Permian Ninnescah Shale between 61 m and 84 m thick conformably overlies the Wellington Formation. Permian strata are overlain by the unconsolidated Equus Beds of Pleistocene age up to 100 m thick, which form the local freshwater aquifer for much of south-central Kansas.
Leakage of stored product is reported from two cavern storage facilities developed in the Hutchinson Salt Member in Kansas.
160

Conway Underground East facility, Conway, McPherson County, Kansas (USA)
The Conway area in McPherson County, Kansas, has around 300 active and plugged & abandoned storage caverns. Some have been used for storage since 1951, when the National Cooperative Refinery Association commenced operations west of the town of McPherson. Other storage fields were developed around the town of Conway during the 1950’s, 1960’s and 1970’s (Ratigan et al., 2002).
The Hutchinson Salt Member in the Conway district dips westwards and is typically 61 – 183 m (200 – 600 ft) thick. To the east dissolution of the salt has occurred and resulted in a zone of wet rock head, with collapse breccia formed from the overlying Upper Wellington Shale. Across this zone of wet rockhead, wells encounter a loss of circulation at the top of the salt, indicating voids and in which hydrocarbons have been recorded as recently as December 2000 (Ratigan et al., 2002). The overlying Ninnescah Shale is between 61 m and 84 m thick. The unconsolidated Pleistocene deposits (Equus Beds) do not, however, extend beneath the Conway Underground East facility; the western edge of the aquifer lies circa 1 km to the east of the site.
Records show that natural gas liquids (NGL’s) and gas has been escaping from cavern facilities in the Conway area since 1956 (Ratigan et al., 2002). NGL’s and gas have been encountered in both storage wells and domestic wells in and around Conway itself on at least six separate occasions between 1980 and 1981. The leaks and presence of propane and hydrocarbons in local groundwater led to several storage operators purchasing around 30 homes and relocating the occupants. At the time, Kansas Department of Health and Environment also required investigations to discover the origin of the leaking propane gas.
One of the most recent incidents occurred at the Williams Midstream Natural Gas Liquids’ Conway Underground East Storage facility. Storage of jet fuel for a nearby air force base began at the site in 1959, with extension of the facility in 1974 when operated by Home Petroleum. Williams acquired the facility in 1987 and in December 2000, NGL’s were encountered in a newly drilled well at the site. Investigations into their presence indicated that large areas of the storage facility, particularly the north-central part, lie in the area affected by salt dissolution (wet rockhead). Up to 10 m of the upper salt bed is now missing, with collapse breccias forming voids into which hydrocarbons have migrated (Ratigan et al., 2002). Further occurrences of NGL’s have been encountered in two shallow groundwater monitoring wells and investigations during 2002-2003, that included soil gas sampling, were ongoing to assess how and by what route the NGL’s and gas present in the area of wet rockhead could migrate upwards into the local aquifer. The results have yet to be made widely available.
Hutchinson – aka Yaggy, Kansas (USA)
The town of Hutchinson, with a population of around 44,000, lies around 11 km (7 miles) SE of the Yaggy Storage Field (Figs. 25&35), and provides the location for perhaps the most publicised and notorious UGS incident. The area is underlain by the Hutchinson Salt Member, which has been mined and extracted at Hutchinson since the 1880s and in which caverns had been created for storage purposes. At the time of the incident, the Yaggy storage facility played a key role in the supply of gas in central Kansas and was thus of national importance. It was one of 30 “hubs” in the USA national gas distribution system and one of 27 such cavern storage fields in the USA. The incident has been extensively reviewed elsewhere and so will only be outlined here, with emphasis on the history of the facility to illustrate the background to the disaster.
The Yaggy field was originally developed in the early 1980s to hold propane. The storage caverns were formed by salt dissolution using brine wells, drilled to depths between 152 m and 274 m in the lower parts of the Lower Permian Hutchinson Salt Member of the Wellington Formation (Fig. 35). The top of each cavern was located about 12 m below the top of the salt layer to ensure an adequate caprock that would not fracture or leak and the wells were lined with steel casing into the salt. The Wellington Shale Formation is overlain by the Ninnescah Shale, both of which dip to the west and northwest and form the bedrock to 15 m or more of the sands
161

and gravels of the Equus Beds. These unconsolidated deposits underlie (Fig. 35) and provide the municipal water supply for the city of Hutchinson, and the city of Wichita to the east.
Decreasing financial viability eventually led to the closure of the propane storage operations in the late 1980s. The wells were cased into the salt and later plugged by partially filling them with concrete. In the early 1990’s, Kansas Gas Service, a subsidiary of ONEOK of Tulsa (Oklahoma), acquired the facility and converted it to natural gas storage. The existing caverns were re-commissioned, which required drilling out the old plugged wells, whilst further wells were drilled to solution mine additional caverns.
Mention is made of the Yaggy Storage Field consisting of 98 caverns in the Hutchinson Salt Member at depths greater than 150 m. It appears that at the time of the 2001 incident, the facility had about 70 wells, of which 62 were active gas storage caverns, at depths greater than 152 m. More than 20 new wells had been drilled and were being used to create new caverns for expansion of the facility (Allison, 2001a). The wells, with 90-120 m spacing, are located on a grid. A group of wells are connected at the surface via pipes and manifolds, allowing gas to be injected or withdrawn into all the caverns in the group simultaneously. The capacity of the Yaggy field was circa 90.6 Mcm (c. 3.2 Bcf) of natural gas at around 600 psi.
The incident at Hutchinson occurred on the morning of January 17th, 2001, when monitoring equipment registered a pressure drop in well S-1, which connected to a cavern being filled. The cavern could hold 1.7 Mcm of gas at an operating pressure of about 4.65 MPa (675 psi). This could, however, range from 3.8 to 4.7 MPa (550 to 684 psi). Later that morning a gas explosion occurred in downtown Hutchinson, around 11 km (7 miles) away and was followed by a series of gas and brine geysers, up to 9 m high, erupting about 3.2 km (2 miles = c. 9 miles from the storage site) to the east along the outskirts of Hutchinson (Fig. 35). The following day (18th
January), a gas explosion at the Big Chief Mobile Home Park killed 2 and injured another (Fig. 35). The city promptly ordered the evacuation of hundreds of premises: many not returning to their homes and businesses until the end of March 2001.
An investigation into the incident led by the Kansas Geological Survey (e.g. Allison, 2001a&b), found the leak was the result of a large curved slice in the casing of the S-1 well at a depth of 181.4 m, just below the top of the salt and 56 m above the top of the salt cavern. The damage to the casing resulted from the re-drilling of the old cemented well when re-opening the former propane salt cavern storage facility. Furthermore, ONEOK computer operators in Tulsa had overloaded the storage field caverns with natural gas, causing the initial leak. For at least 3 days the casing leak allowed natural gas at high pressure to escape and migrate upwards through the well cement and fractures in rocks above the salt. On reaching a permeable zone formed by a thin bed of micro-fractured dolomite near the contact between the Wellington Formation and the overlying Ninnescah Shale at around 128 m, the gas was trapped by overlying gypsum beds, preventing further vertical movement. The dolomite was fractured in the crest of a low-amplitude, asymmetric, northwesterly plunging anticlinal structure and the pressure of the escaping gas induced parting along the pre-existing fracture system. The gas migrated laterally southeastwards up-dip along the crest of the anticline towards Hutchinson, where it ultimately encountered old abandoned and forgotten brinewells that provided pathways to the surface (Allison, 2001a; Nissen et al., 2003 & 2004).
Geological investigations of the area suggest that the fractures in the dolomites were related to deep seated fractures that caused faulting in the overlying strata. These fractures then appear to have permitted undersaturated water to penetrate down and dissolve the Hutchinson salt, causing variations in thickness of the halite beds. Faulting in strata overlying the halite beds is greatest where dissolution has taken place and the edge of this dissolution zone trends NW close to the crest of the anticlinal structure. The dissolution of the halite appears to have locally enhanced structural relief, which led to further stresses, fracturing and preferred zones of weakness in the overburden, providing pathways for gas migration along the trend of the anticline (Watney et al.,
162

2003a; Nissen et al., 2004b). Shut in tests on vent and relief wells following the incident revealed that with reduced gas pressures, fracture apertures were reduced and closed as pore pressures declined.
Basic volumetrics of the fracture cluster were calculated (Watney et al., 2003b):
• Length – 14 km (8 miles)
• Width – 300 m (1000 ft)
• Height – 0.9 m (3 ft)
• Porosity – 2%
• Fracture volume – 78,000 m3 (2.8 Mcf)
• Estimated volume of gas released – 4.04 Mscm (143 Mscf) = 99,109 m3 (3.5 Mcf) at 4.14 MPa (600 psi), 12°C (54°F)
Other storage facilities exist around Hutchinson and provide some useful information on storage pressure gradients. In late 1996 to 1997, Western Resources Inc. who operated a hydrocarbon storage well facility to the west of Hutchinson, submitted requests to the Kansas Department of Health and Environment (KDHE) to increase the maximum storage pressure gradient at their facility. KDHE regulate gas storage operations and operated a ‘rule of thumb’ that the maximum storage pressure gradient at such facilities in the Hutchinson area was limited to 0.75 psi/foot of depth. This was in order to prevent fracturing of the salt deposit. Following tests on rock cores, Western Resources Inc. requested increasing the pressure from 0.75 psi/foot of depth to a pressure gradient of 0.88 psi/foot of depth, which was actually close to the average fracture pressure gradient of 0.89 psi/foot of depth. One rock sample actually had a fracture pressure gradient of 0.72 psi.foot of depth (KDHE, 1997).
The original downtown explosion site was related to a mineral water well in a basement that had provided mineralized waters for a hotel spa. The second explosion occurred at the site of an old abandoned brinewell. Images of a blazing well in the ruins of a building are available on the Kansas Geological Survey website (http://www.kgs.ku.edu/Hydro/Hutch/CUDD/2nd/set01.html). The same was found to be true for the numerous gas and brine geysers to the east of the city and the explosion at the Big Chief trailer park. When drilled, most old brine wells were only cased down through the shallow Quaternary “Equus beds” aquifer. The deeper parts of the wells were open-hole and thus provided ready pathways for the gas to escape to the surface. As many as 160 old brinewells are thought to exist in the Hutchinson area, either buried purposely or by subsequent development. It is unlikely that the well casings of these wells, if they exist, are sufficiently gas tight to prevent gas escapes and would present problems if future leaks were to occur.
Following the operations to trace and deal with the January leak incident, a second event occurred around six months later on the afternoon of Sunday, July 7, when one of the vent wells (Deep Drilled Vent well 64) suddenly started venting gas at high pressure (Allison, 2001c). The following day, the flare was reported at about 4 m in height and a pressure of 2.3 MPa (330 psi). Mechanical modifications to the surface pipework were made with the result that the flare reached an estimated 9 m - 30 to 12 m in height by Monday evening. Pressures had dropped to only 0.04 MPa (6 psi) by the following Wednesday; when the well was temporarily shut in. However, the pressures then increased quickly again.
Three possible causes for the flare-up were identified (Allison, 2001c):
• formation or near-well-bore damage – this is caused by the flow of water and gas through the near-well-bore environment. The permeability of the rock near to the well is reduced by the plugging the rock with fine materials, chemical alteration, or by changes in relative permeability as the volume of gas drops relative to the volume of water. Such “damage” routinely occur in oil and gasfield wells and is readily corrected.
163
• segmented pockets or fractures of gas remained - when the gas first entered Hutchinson it was under sufficiently high pressure that it may have forced open previously closed fractures in the rock layers or pushed its way into areas of ‘tight rocks’, i.e. less permeable rocks. As pressures dropped, it is possible that some fractures would have closed up again, isolating small amounts of gas in separate pockets, which over time, could have worked their way back into the main accumulation and into the vent well.
• another source of gas besides the Yaggy field exists – a scenario thought to be unlikely as well DDV 64 sits in the midst of a swarm of vent wells and it is hard to project a new source of gas that would affect only this one well.
The causes of the resurgence of gas were still being investigated in late 2001/early 2002. However, the results of this investigation, although it is likely that they have been published, have not been found during this study.
The incident in 2001 was not the first time that there had been problems with a cavern and well at the Hutchinson storage facility. On September 14, 1998, a shale shelf collapsed inside the field’s K-6 cavern, trapping a gamma-ray neutron instrument that had been used for monitoring purposes. Downhole video surveys revealed the casing on the verge of collapse at about 183 m, with the camera unable to go below 205 m, due to the blockage. In October 1998, a plan was established to remove gas from the cavern over the winter. In the spring of 1999, the radioactive tool was buried under 1.2 m of concrete and the cavern’s main pipe was relined with bonding cement to block any possible leaks. The cavern is still monitored for radiation leaks.
Elk City Oklahoma, USA
Brief mention is made of an apparent incident at a salt cavern storage site in Oklahoma (Katz, 1974). If it proves to have some foundation, then it is likely to have been at a facility developed in Permian salts, which extend across Oklahoma and into Kansas, in the same basin as those salts found at Hutchinson. At the time, the incident was reported in the Elk City newspaper with mention of 30 ton boulders being thrown in the air and landing in a field. Katz (1974) concluded this “is the kind of event to be avoided.” No other details are readily available.
Salt Block Storage Well, Goodyear, Arizona, USA
Again, sketchy reports exist for gas leakage at a salt cavern storage facility in Arizona (Pirkle, 1986; Microseeps), though the exact date and location and depth of storage is not known. The salts are likely to have been Permian in age.
Propane was stored in salt caverns in an area of salt referred to as the Luke Salt near Goodyear, Arizona. At some point in the storage operations, the well casing in one of these caverns developed a corrosion hole and lost ‘several million cubic feet’ (perhaps 0.5 to 0.85 Mcm) of propane into the surrounding and overlying strata at a depth of a few hundred metres. The propane accumulated in strata just above the water table at a depth of approximately 92 m and was found in several open water wells in the area.
Three relief wells were sunk to the top of the water table to remove the propane from the formation, with the rate of escape to the atmosphere found to be influenced by daily fluctuations of barometric pressure (Pirkle, 1986; Microseeps).
Canadian cavern storage incident
Fort Saskatchewan, Alberta
As previously alluded to, the Saskatchewan Power Corporation constructed the first salt cavern designed specifically for the storage of natural gas at Melville, Saskatchewan, Canada. It was constructed in the Mid Devonian Prairie Evaporite salt formation at a depth of circa 1128 m (3,700 feet) with a capacity of 290,000 bbl, and came into service during 1963.
164

Fort Saskatchewan, Alberta lies in the Interior Plains area of Canada, in the Western Canada sedimentary basin (Fig. 25). Within the basin clastics, redbeds, carbonates and important salt and potash deposits of Lower to Middle Devonian age were deposited unconformably upon Precambrian or lower Palaeozoic rocks (Meijer Drees, 1994; Hamilton & Olsen, 1994). These sediments form the Elk Point Group and accumulated in topographic basins, separated by highlands, some areas of which remained emergent until late Middle Devonian times.
The salt beds form two distinct types and define the Upper and Lower subdivisions of the Elk Point Group. The Upper Elk Point contains the Prairie Evaporite salt formation, being up to 200 m thick and by far the most extensive deposit (Fig. 36). It does, however, vary in purity within the basin. Salt also occurs as three separate and very pure deposits within the Lower Elk Point: the Lower Lotsberg, Upper Lotsberg and Cold Lake salt formations. These salts are more restricted in area but can also attain considerable thickness.
In 2001 BP Canada Energy Company were operating a natural gas liquids (NGL) plant located about 6 kilometres northeast of the City of Fort Saskatchewan, near Edmonton, Alberta. NGL products have many uses in the petrochemical industry and were being stored on site in underground caverns and delivered through pipelines to a number of locations in Alberta, eastern Canada, and the United States. The facility represents an important part of the Alberta NGL pipeline network.
An incident occurred between August 26th and September 3rd, 2001, when fire broke out at one of the ethane wells (Fig. 36), connecting to Cavern 103. The cavern was constructed in the Lotsberg Salt Formation at a depth of about 1850 m and had been used to store NGL’s for 25 years. Cavern capacity was circa 0.127 Mcm and at the time of the incident, there were approximately 0.076 Mcm of ethane in the cavern.
Fires and black smoke were visible up to 50 kms away, but the incident was contained entirely within the plant site and although it caused breathing difficulties for some locals, was said to have presented no danger to the public. An investigation by the Alberta Energy and Utilities Board (EUB, 2002) found that early on August 26th 2001, ethane was being pumped up well 103 by displacing the ethane in the storage cavern with brine injected into the cavern via well 103A. Just after 7:00 am the cavern 103 gas detector relayed an alarm to the main control room at the Fort Saskatchewan site, with a vapour cloud observed in the area above cavern 103 facilities. Cavern 103 was shut in, with well 103 opened to a pipeline to reduce the ethane leak. However, this action failed to reduce the release rate.
The flames spread to the second well and the fire burned for over a week. This was largely for safety reasons, to allow the pressure in the gas cavern to reduce. By August 28th, heavy black smoke from the well fires was significantly less due to a combination of the ongoing fire control efforts and the reduced gas flow as the ethane storage cavern depressurised. On August 29, it was possible to close a connecting valve between the two wellheads, greatly limiting the fire at the both wells.
Investigations found that the leak had occurred due to failure on the exterior surface of the forged elbow on the line connecting the two wellheads. The growing ethane vapour cloud ignited sometime after 9 am, was ignited when it came into contact with overhead power lines located within the site. An explosion and fire ensued. The site was evacuated with no injuries to plant or emergency service personnel. In total, it is estimated that about 14,500 m3 of ethane product was lost during the 8 days of the incident. In the weeks immediately afterwards, most of the plant and pipeline operations returned to normal, except for those involving the wells, pipelines, and the ethane storage cavern associated with the incident.
The magnitude of the change in operating pressure of cavern 103 and the speed of the pressure change that occurred may have caused damage to the cavern, with indications that cavern 103
165

now shows some signs of communication with an adjacent cavern. The ethane storage cavern 103 remains out of operation and will do so until the EUB grant approval to resume operations.
Salt cavern construction ‘problems’.
A number of proposed storage facilities have developed difficulties during development and prior to completion. These are briefly reviewed in the context of potential problems that might be faced when developing storage facilities in the UK.
Cavern 7, Bayou Choctaw, Baton Rouge, Louisianna
In 1954, during operations to develop a cavern for storage in the salt dome at Bayou Choctaw, uncontrolled leaching operations led to the collapse of overburden into the developing cavern number 7 (Coates et al., 1981; Neal & Magorian, 1997). A 245 m diameter lake formed and a further cavern (number 4) continues to be monitored following the incident due to fears of collapse due to possible faults in the cap rock (Neal & Magorian, 1997).
Napoleanville and Clovelly
Problems have arisen in caverns constructed too close to the edges of the Napoleanville and Clovelly salt domes in southern Louisiana and have resulted in cavern integrity and pressure maintenance problems. This has meant that a number of caverns could not be commissioned (Neal & Magorian, 1997).
At Clovelly, cavern leaching in the salt overhang meant there was not a sufficient thickness of salt to act as a barrier (Fig. 37). At Napoleanville, shale layers were encountered in some caverns, indicating the salt dome edge and enclosing rocks had been encountered, with insufficient buffer salt remaining (Neal & Magorian, 1997).
Both incidents point to inadequate site characterisation prior to commencing development and brining operations.
Aquifer gas storage incidents - Europe
Spandau, western suburb of Berlin
Gas is stored approximately 800 m underground in an aquifer facility beneath the western suburbs of Berlin at Spandau (Fig. 30). Up to 6 Mcm of gas can be stored, enough to supply all Berlin households for a year.
At about 9.40-9.45 am on April 23rd 2004, a gas explosion occurred at one of the GASAG
Gasspeicher Berlin well sites (Associated Press, 2004; Berliner Zeitung, 2004a,b&c). The incident appears to have occurred at a station where gas is pumped from underground storage to what are understood to have been road tankers. The explosion destroyed the wellhead of a monitoring(?) well and gas escaped and ignited, resulting in a flame about 30 m in height. The gas escaped for about a day before the well was successfully capped. Associated Press (April 23rd, 2004) reported that the incident injured nine workers, three seriously, destroyed a tanker and caused damage to several buildings, forcing the evacuation of around 500 residents in a 1 km radius (F. May, pers. comm., 2004; Associated Press, April 23rd, 2004). Indications are that the explosion occurred either as a result of maintenance work following winter operations (involving H2O2 treatment of the well - F. May, pers. comm., 2004), a defective seal, or work on the store’s contents gauges, which began to leak. In any case, the incident appears to have resulted from the failure of above ground infrastructure and at no time was the stored gas inventory in danger (GASAG’s web site, 2004: http://www.gasag.de/de/privatkunden/index.html).
Stenlille, Denmark
166

An underground gas storage facility in an aquifer was established in 1989 at Stenlille, approximately 70 km SW of Copenhagen in Denmark and operated by the state-owned Danish Oil and Gas Company (DONG; Laier & Øbro, 2004 & in press). In that area, salt movements in the Zechstein deposits have caused gentle doming of the overlying Late Triassic Gassum Sandstone Formation some 1500 m below ground. The clay-dominated Lower Jurassic Fjerritslev Formation forms a cap rock some 300 m thick. Natural gas is injected into the Gassum Sandstone Formation with the structure having an estimated capacity of 3 Bcm.
A minor gas escape occurred during one drilling operation in 1995. Gas bubbles were observed at the surface at the drilling site and an increase in gas concentration was found in the Palaeocene aquifer 130 m below ground (Laier & Øbro, 2004 & in press). No increases in gas concentration were detected in shallower level aquifers. The gas escape was due to a hole in the casing and was quickly remedied, with methane levels in the Palaeocene aquifer declining significantly since. Pressure and groundwater monitoring measures have detected no gas leakage from the underground storage site during normal operation.
Chémery, France
France, in addition to salt cavern gas storage facilities, has a number of aquifer storage facilities including that at Chémery, 120 miles SW of Paris (Fig. 21). Operated by Gaz de France, it is one of the largest in Europe and was commissioned in 1968. It stores gas piped in from the North Sea at depths greater than 1120 m (GDF, 1996). At the time of the incident, the aquifer storage facility had a capacity of around 6.8 billion cubic metres (Bcm) of gas at 130 bar (13 MPa/1886 psi).
On the 25th September 1989, a leak began during routine maintenance of a well completion and replacement of a filter at a depth of around 1106 m (3630 ft). Gas escaping at a rate of 0.15 Mcm/hr (5.2 million cubic ft per hour), the noise of which exceeded 120 decibels, led to the development of a gas cloud that rose around 7600 m (25,000 ft) into the air and caused the diversion of aircraft from a nearby airport (NAWPC, 1999; IAVWOPSG, 2005).
27
During the gas leak, power lines were shut down and no explosion occurred. A safety zone was established and the public kept informed of developments. The leak was finally plugged on the
th September (IAVWOPSG, 2005). The incident was reviewed and guidelines drawn up for future maintenance procedures.
Frankenthal, West Germany
In the late 1970s and early 1980s, Saar-Ferngas operated an underground natural gas storage facility at Frankenthal, West Germany (Fig. 30). Reports of an incident involving the escape of gas from the facility are vague, with reference to large underground tanks and ‘underground chambers in soft rock and sand layers’ (AEA, 2005). That said it appears that some 16 Mcm of natural gas was being stored at a depth of around 680 m and 70 bar (7 MPa/1015 psi), in what is in fact an aquifer storage facility.
The incident was triggered on 30th September 1980 when drilling operations, close by the facility, encountered gas that immediately started to escape. Water and mud were pumped into the well in an attempt to stop the escaping gas but proved unsuccessful. The leak was eventually halted when a 14 tonne valve was fitted to an underground pipe, with the incident finally being brought under control on the 16th October. Indications are that the drilling activities had damaged an existing pipe to the underground ‘storage chamber’.
Fortunately, the escaping gas never caught fire, but the value of the gas losses at the time were estimated at 10 m DM or 5 million dollars (AEA, 2005).
Ketzin, Berlin, Germany
The Ketzin gas storage facility is a former gas storage site around 25 km west of Berlin operated by UGS Mittenwalde (Fig. 30; Juhlin et al., 2007). It is developed in the Northeast German
167
Basin, part of a Permian basin system that extends from the east of England and the North Sea across Denmark, the Netherlands and northern Germany to Poland (Ziegler, 1990). As in the Southern North Sea, thick sequences of Zechstein salt were deposited, following which a thick series of sandstones and mudstones were deposited during Triassic and Jurassic times. Salt flowage has resulted in a series of pillows, walls and diapers, resulting in deformation of the overlying Mesozoic overburden that has formed a system of anticlines and synclines (Kossow, et al., 2000; Förster et al., 2006; Juhlin et al., 2007).
The Ketzin site lies on the eastern part of a double anticline, the Roskow-Ketzin Anticline (Juhlin et al, 2007), which is formed above an elongated NNE-SSW trending salt pillow developed at a depth of 1500-2000 m. The anticline developed during several phases of salt movement and (Juhlin et al., 2007). Lower Cretaceous rocks were eroded from the crestal regions at around 106 Ma.
Saline aquifers of Lower Jurassic age at between 250 and 400 m below ground are present in the Ketzin anticline and were used for storage of first town gas in the 1960s and between the 1970s and 2000, for natural gas (Juhlin et al., 2007). The operator (UGS Mittenwalde) suggests that the maximum utilization of the facility was n 1999. In 2004, the site was abandoned and the (aquifer) resevoir pressure was lowered to approximately 17 bar below hydrostatic pressure (Juhlin et al., 2007). Faulting affects the crest of the anticlinal structure, with a 600-800 m wide E-W striking central graben fault zone (CGFZ) in the crestal region. Faulting in the CGFZ extends down to Triassic levels and the bounding faults have about 30 m of downthrow, but faulting appears to die out quickly in the overlying Rupelian clays of Cainozoic (Tertiary) age (Juhlin et al., 2007). Although the facility has closed, some infrastructure from the facility still remains and deeper aquifers in the lithologicaly heterogeneous Stuttgart Formation of Upper Triassic age are being considered for CO2 storage purposes (refer Juhlin et al., 2007).
Reports suggest that during the 1960s, the injected and stored town gas migrated out of the reservoir and ultimately found its way to the surface, causing the (permanent) evacuation of the nearby village of Knoblauch (New Energy News, 2007; MyDeltaQuest). There is mention that leakage of carbon monoxide (CO) was also associated with the leak (MyDeltaQuest). It would appear that during this incident, 1 person was killed when CO came up an old well into a house, following which the well was repaired and sealed (N.J. Riley pers comm., 2007). As mentioned above, gas storage continued until 2000 (Juhlin et al., 2007). Recent seismic reflection studies reveal amplitude anomalies in the aquifer units on seismic reflection data, indicating that remnant (cushion or residual) gas remains in some aquifer units near the crest of the structure. Amplitude anomalies and a gas chimney about 1 km long and 100 m wide has been observed on seismic reflection data acquired over the southwestern, east-west striking main fault of the CGFZ. This indicates that the stored or remnant gas either has been or is presently migrating out of the reservoir formations (Juhlin et al., 2007).
Aquifer gas storage incidents - America
Leroy Storage Facility, Uinta County, Wyoming, USA
The Leroy gas storage field is located in Uinta County, Wyoming, approximately 100 miles NE of Salt Lake City and in the period 1973-mid 1980s, was operated by Mountain Fuel Supply Company (Araktingi et al., 1984; Nelson et al., 2005). Early hydrocarbon exploration had defined an anticlinal structure (Fig. 38) bounded on its western side by a fault (Araktingi, et al., 1984). An exploration well, drilled in 1951 (Leroy #3), proved two potential coarse-grained sandstone reservoir units in the Triassic lower Thaynes Formation at a depth of roughly 900 m below ground level (circa 1161 m above sea level). These sandstones were re-examined for gas storage purposes in 1969. Shales, siltstones and anhydrite in the middle Thaynes Formation provided the cap rock for the storage reservoir (Araktingi et al., 1984; Nelson et al., 2005). The initial sandstone aquifer pressure was 1500 psig (103 bar/10.3 Mpa) and testing of the structure commenced in October 1970.
168

Further appraisal continued with the injection of around 56.6 Mcm of gas during August 1972. Approval for the facility followed in November 1972, with further wells completed in 1973, increasing capacity to around 99.1 Mcm. However, on reaching 104 Mcm and a reservoir pressure of 1740 psia (120 bar/12 Mpa), gas began escaping from around the surface casing of well number 3.
Investigations revealed that the gas leakage originated from a corroded well casing in the adjacent Leroy Well 4 at a depth of 415 m within the Twin Creek Limestone, through which it then migrated to the Leroy #3 well. The gas then migrated up the old Number 3 well to the surface (Araktingi et al., 1984). Repairs were attempted but were unsuccessful and the Leroy Well 4 was eventually plugged and abandoned in 1974 (Araktingi et al., 1984).
In 1974 the estimated stored gas volume ranged between 100 and 110 Mcm, with a pressure close to the original 1500 psig (103 bar/10.3 MPa). During 1975 this was increased to 1830 psig (127 bar/12.7 MPa), around 330 psi (22.6 bar/2.3 MPa) above the original aquifer pressure with circa 246 Mcm of gas stored. During 1978 a surface survey revealed natural gas bubbling in a creek and pond above the storage reservoir site. Several gas tracer surveys were carried out between 1979 and 1981 and proved the gas to be leaking from the aquifer and reaching the surface, sometimes within 9 days of injection (Araktingi et al., 1984; Nelson et al., 2005).
Some of the gas bubbling was observed to be dependent on the storage reservoir operations, stopping altogether during the summer when the reservoir was flooded and did not contain gas. However, elsewhere the gas bubbling was observed to be independent of the storage reservoir operations, which indicated that some of the leaking gas was migrating to a shallow gas collection zone from which seepage to the surface then occurred. Modelling suggested that the second phase of gas migration had started during 1975-76 and that over a period of 130 months storage, a total of circa 17 Mcm of gas had escaped.
Following analysis of the results, it was decided in 1981 that gas loss from the storage reservoir could not be eliminated, but that by limiting the maximum pressure in the reservoir, the leakage rate could be controlled (Araktingi et al., 1984).
The experience at the Leroy facility perfectly represents the problems encountered in aquifer storage reservoirs. These facilities require gas injection at pressures higher than the initial value to displace water from the pores, with gas leakage at the Leroy facility apparently related to a pressure triggered hydraulic seal failure in the middle Thaynes Formation which formed the reservoir cap rock (Katz and Tek, 1981).
The Coalville and Chalk Creek gas storage facilities, Utah, USA
Questar operates two underground sandstone-reservoir gas storage units for peak load demands at Chalk Creek Canyon and Coalville (Morgan, 2004). Gas is stored in porous and permeable Cretaceous sandstone beds; the reservoir unit at Chalk Creek being a sandstone bed in the Kelvin Formation around 550 m below ground, and at Coalville it is the Longwall Sandstone of the lower Frontier Formation around 730 m below ground (Fig. 39). The trap at both storage units is formed by faults and sealed by overlying impermeable shale.
Drilling at the Chalk Creek gas storage unit began in 1960 and in 1973 at the Coalville gas storage unit. Leakage from the reservoirs is indicated by soil gas surveys across the storage fields: reservoir gas is present in the overlying successions, with at least some of the leakage, from the storage fields and from the Pineview Oilfield to the east, linked to faults (Jones & Drozd, 1983).
Pleasant Creek Gas Storage, California, USA
The Pleasant Creek Gas Storage facility is located in the Sacramento Basin of California, to the west of Sacramento (Fig. 40). The storage reservoir horizon is found in a shallow stratigraphic trap at the top of Cretaceous sequences at a depth of 760 m below ground (Hunter, 1955?). Shallow soil gas surveys (circa 10 m depth) across the storage field in the period 1972-1976
169

indicated that the natural gas had leaked upwards from the reservoir (Jones & Drozd, 1983; Jones & Pirkle: http://www.eti-geochemistry.com/FinalVersion1.10.htm).
Gas storage facilities in Illinois and Indiana, USA
During the 1970s, more than 16.4 Bcm of natural gas was stored in underground reservoirs at 37 localities in Illinois (Buschbach & Bond, 1974). The numbers currently stand at 29, of which 18 are aquifer storage (EIA, 2006: http://www.eia.doe.gov/pub/oil_gas/natural_gas/feature_articles/ 2006/ngstorage/ngstorage.pdf). The facilities were operated by a number of operators and constructed in rocks varying from Cambrian to Carboniferous in age, although the majority of the storage volume was in sandstone aquifers of Cambrian and Ordovician age. A number experienced problems and ultimately closed (Fig 41). All were aquifer storage facilities and suffered leaks due to inadequately sealing caprock and problems due to faulting. One further facility at Crescent City in Iroquois County was tested by the Northern Illinois Gas Company during 1967 and was reported as inactive in 1974 (Buschbach & Bond, 1974). Another aquifer storage facility in Indiana was abandoned because the reservoir proved too shallow (Buschbach & Bond, 1974; Perry, 2006). Details are sketchy, but it appears a number of water wells were affected by the intrusion of natural gas that had migrated out of the shallow storage reservoir.
Illinois has around 650 oilfields, located in the Illinois Basin, an elongate intracratonic basin (failed rift) developed mostly in central and southern Illinois, southwestern Indiana, and western Kentucky (Collinson et al., 1988; Kolata & Wilson, 1991). The basin extends about 600 km northwest to southeast and 320 km northeast to southwest, with the greatest thickness of sedimentary fill developed in southern Illinois and western Kentucky, where a maximum of 7,000 m of Cambrian to Permian strata are proved. Hydrocarbons are encountered and stored in a number of reservoir units, which include (Fig. 41): the Cambrian Mount Simon, Eau Claire, Galesville, and Ironton Sandstones, the Lower Ordovician Gunter and New Richmond Sandstones and the Middle Ordovician St. Peter Sandstone. The latter is overlain by the thick, impermeable, regionally extensive, Maquoketa Shale Group, which serves as a major aquiclude (Young, 1992a&b).
Herscher, Kankakee County
A doubly plunging, N-S trending asymmetric Herscher Anticline was delineated by over 100 structure test wells drilled in 1952 by the Natural Gas Storage Company of Illinois (Buschbach & Bond, 1974). Both the Galesville and Mt Simon sandstones are developed as reservoirs. The Ironton Formation, 38 m of sandstone and dolomite, is the caprock to the Galesville Sandstone, itself around 30 m thick at a depth of 533 m. The Mt Simon Sandstone is around 760 m thick at a depth of 747 m, although gas is only stored in the uppermost part and in the Elmhurst Sandstone Member of the overlying Eau Claire Formation (Buschbach & Bond, 1974). The caprock to this reservoir is provided by 60 m of shale and dolomite of the Lombard Member of the Eau Claire Formation.
Injection of gas into the Galesville Sandstone commenced in April 1953 but within 6 weeks, 33 shallow water wells began to bubble gas and injection was stopped (Buschbach & Bond, 1974). The cause of the leakage was not determined with certainty and in 1956 wells were drilled into the reservoir to remove water from the periphery of the gas bubble, to be re-injected back into overlying formations. This enabled regulation and control of pressures in overlying formations, which with the recycling of gas that escaped into the Galena and St Peter sandstones, allowed successful gas injection and storage without significantly raising the pressure in the Galesville Sandstone (Buschbach & Bond, 1974; Coleman et al., 1977).
170

Testing of the Mt Simon Sandstone commenced in 1957 and storage began late in 1957, with no leakage detected from the lower reservoir (Buschbach & Bond, 1974).
Manlove (aka Mahomet), Champaign County
The Manlove facility in the NW of Champaign County was developed by Peoples Gas Light and Coke Company in the elongate, N-S trending, La Salle Anticline, around 11 km long and 9.6 km wide (Buschbach & Bond, 1974). Storage was initially attempted in 1961 in the St Peter Sandstone but was discontinued when it was discovered to the south of the crest of the structure that gas had migrated up into glacial drift deposits (Buschbach & Bond, 1974; Coleman et al., 1977). Shallow vent wells were drilled in the area of leakage to prevent the accumulation of gas but despite tests on the structure and the wells, the reason for the leakage was never discovered.
Tests on the Galesville Sandstone reservoir commenced in 1963, but gas was found to migrate up into the St Peter Sandstone and tests were discontinued. At the same time, the Mt Simon Sandstone, which lies at around 1200 m below ground, was appraised and found to be suitable for storage purposes, with 30 m of shaly beds in the overlying Eau Claire Formation providing an adequate seal. Injection of gas commenced in 1964 and the facility was operational in 1966 (Buschbach & Bond, 1974).
Pontiac, Livingston County
Northern Illinois Gas Company began preliminary investigations in 1963 on a N-S trending anticlinal structure 8 km long and 4.8 km wide in the Pontiac area. The Mt Simon Sandstone, more than 600 m thick, provides the reservoir at around 900 m below ground. The caprock is formed by around 40 m of shale and thin dolomite lenses forming the Lombard Member of the Eau Claire Formation (Buschbach & Bond, 1974). However, an intervening shaley, silty sandstone circa 15 m thick provides an incomplete seal, lowering the effectiveness of the facility. Gas was first injected into the Mt Simon Sandstone in 1966 and the facility was operational by 1969, but inactive by 1974 (Buschbach & Bond, 1974).
The higher St Peter Sandstone was also tested for storage potential in 1970 but the caprock could not be guaranteed and any further tests ceased in 1974.
Sciota, McDonough County
Several oil test wells were drilled in the Sciota area, indicating the presence of an anticlinal structure. Tests by Central Illinois Public Service Company in 1971 confirmed the Sciota structure as a NNW-SSE trending anticline in which the Mt Simon Sandstone forms the reservoir at depths of around 800 m. The caprock is provided by 90 m of shaley and sandy dolomites interbedded with shales of the Eau Claire Formation (Buschbach & Bond, 1974).
Testing and injection of about 0.6 Mcm of gas continued in the period 1971-1972 and the facility was abandoned by 1974 (Buschbach & Bond, 1974).
Troy Grove, La Salle County
Between 1957 and 1958, Northern Illinois Gas Company tested a structure in the Troy Grove area. Again tests proved the presence of an anticline 8 km long and 4.8 km wide within the La Salle Anticlinal belt. At least four faults with up to 55 m throw displace the anticline. Within it the Mt Simon Sandstone reservoir is at depths in excess of 430 m, with around 55 m of shale and siltstone in the upper part of the Eau Claire Formation providing the caprock (Buschbach & Bond, 1974).
Gas was first injected in 1958 and the facility was operational in 1959, with gas known to migrate from the Mt Simon reservoir up into sandstones within the lower and upper levels of the Eau Claire Formation since the early development of the reservoir. This resulted in a pressure build up in the overlying strata, which was controlled by withdrawing gas from these zones and reinjecting at depth (Buschbach & Bond, 1974; Hunt, 2004). Until recently, it was thought that the sequences overlying the Eau Claire caprock had prevented the gas from migrating into
171

shallower sequences, however, a certain amount of gas has been found to reached the surface (Hunt, 2004).
Waverley, Morgan County
An anticlinal structure was known in the vicinity of Jacksonville in the early 1920s and later drilling found oil and gas shows in the structure (Buschbach & Bond, 1974). The structure is domal with three reservoir horizons present: the Ironton-Galesville reservoir circa 10 m thick and 1070 m deep (caprock provided by the Davis Member, circa 21 m thick), the St Peter Sandstone 76m – 90 m thick and 550 m deep, and subsidiary sandstones within the Galena group that generally provides the caprock to the St Peter reservoir. In the early 1950s, Panhandle Eastern Pipeline Company acquired storage rights and began injecting gas into the St Peter Sandstone in 1954, with the facility fully operational in 1961. Injection into the underlying Ironton-Galesville reservoir commenced in 1968.
Gas was found to migrate from the St Peter reservoir through the caprock of limestone, dolomite and thin shale beds of the Joachim Formation and the Platteville and groups into the porous zones of the Galena Group. Further migration appeared to be halted by 60 m of shale in the Maquoketa Group overlying the Galena Group, and the gas was either recycled into the St Peter reservoir or produced (Buschbach & Bond, 1974).
Brookville, Ogle County
Between 1963 and 1964, tests were carried out on the Mt Simon Sandstone in a NW-SE trending anticlinal structure with around 40 m of closure at reservoir level circa 320 m below ground. Around 70 m of the Eau Claire Formation form the caprock and though tests were inconclusive, indications were that communication existed between the Mt Simon, Eau Claire, Galesville and Ironton formations (Buschbach & Bond, 1974). Communication with overlying sandstones was confirmed between November 1964 and July 1965, when 25.3 Mcm of gas were injected into the Mt Simon reservoir. Faulting of the reservoir was seen as the most likely cause of gas migration and the project was abandoned in 1966 (Buschbach & Bond, 1974).
Leaf River, Ogle County
Between 1968 and 1969, the Leaf River reservoir sandstone was tested in a WNW-trending faulted anticline with around 25 m closure and in which, the caprock was expected to be provided by the Eau Claire Formation (Buschbach & Bond, 1974). The reservoir lies about 250 m below ground. Around 10.9 Mcm (348 m ft3) of gas was injected with leakage from the reservoir proved by rising water levels in observation wells completed in porous zones above the caprock. Leakage was most likely due to faulting and the project was abandoned in 1971 (Buschbach & Bond, 1974).
Unlined rock cavern, abandoned salt and coal mine gas storage incidents
Weeks Island, Louisianna
The Weeks Island salt mine, excavated in the Weeks Island salt dome formed from the Jurassic Louann Salt around the Gulf Coast, is located around 30 km SE of Jefferson Island. The facility formed part of America’s Strategic Petroleum Reserve (SPR) and utilised abandoned room and pillar caverns around 150-220 m below sea level at the Morton Salt Company mine site (Warren, 2006). The top of the salt dome is less than 40 m below sea level (Fig. 42). The mine was purchased from the mining company in the 1970s and was thus not a custom built or designed facility for storing hydrocarbons (Warren, 2006). Following oil fill (1980-1982) the facility stored around 72.5 mmbbls of crude oil.
In 1990-1991, a sinkhole formed over the edge of a salt mine that by May 1992 was 10 m across and 10 m deep (Fig. 42), with a second smaller sinkhole also discovered over the edge of the mine in early 1995 (Neal & Magorian, 1997; Warren, 2006). The sinkholes resulted from a series of geological, hydrological and mining factors, specifically, the mine geometry and excavation-
172

induced stresses had placed the mine periphery in tension and led to crack development in the overlying strata, perhaps as early as 1970 (Neal & Magorian, 1997). The cracks permitted undersaturated brine to penetrate downwards, which eventually reached the SPR mine workings, dissolving the top of the salt, creating a void, which ultimately caused the collapse of overlying strata.
The 1990-1991 sinkhole was eventually stabilised by the injection of saturated brine directly into the crevasse beneath the sinkhole. This was followed by construction of a freeze wall around the sinkhole to arrest groundwater flow, prior to the stored crude oil being withdrawn (Neal & Magorian, 1997). Investigations revealed that there had been an earlier leak of groundwater into the mine in 1978, adjacent to the sinkhole that had been arrested at the time by injection of cement grout into the flowpath (Warren, 2006). The stored crude oil was withdrawn, leaving around 1.47 mmbbls in the facility, which was plugged and abandoned post-1999 (Warren, 2006).
Leyden, Arvada, Jefferson County, Colorado
The Leyden coalmine is located near Arvada, Colorado some 14 miles NW of Denver and has been described by Raven Ridge Resources (1998). It lies 250 m east of the Leyden Hogback, a N-S trending monoclinal structure on the western margin of the Denver Basin (Fig. 43). Cropping out along the monocline are near vertical Upper Cretaceous strata including the Pierre Shale, the coal-bearing Laramie Formation and the Fox Hills Formation. To the east in the region of the mine, the dip of the strata reduces to near horizontal over a distance of circa 366 m, such that the coal seams lie at between 244 m and 260 m below ground level. The mine occupies an area approximately three miles wide and two miles long. Up to 6 million tons of subituminous coals were mined by room and pillar method from the A and B seams, which occur in the lower 61 m of the Laramie Formation (Fig. 43), which otherwise comprises a series of water saturated shales and sandstones providing the seal to the gas held in the old workings.
In 1960 permission was granted to inject and store natural gas in the mines. This facility was run by the Public Service Company (PSCo) of Colorado, and latterly Xcel Energy, to support its natural gas distribution and delivery operations in the Front Range area of Colorado. It represented the only underground natural gas storage facility made from an abandoned coal mine in the United States, until it ceased operating in 2001. During operation, up to 99.1 Mcm of gas were stored at pressures of between 170 and 250 psi. The pressures were too high and led to loss of gas, which it is alleged, the company were aware of from an early stage.
In the 1990s studies indicated that natural gas had leaked through coal seams and sandstone, and into underground water, generating a plume of gas above the coal mine. PSCo subsequently lost a court case that included the award of $278,000 in punitive damages. During the case, it emerged that PSCo knew of gas leakage from a well only a few years after the facility opened, and of cracking and leakage in the majority of other wells. Gas had also been discovered bubbling up in a number of wells.
Due to the encroaching residential and commercial development in the surrounding areas PSCo announced in early 2000 that they intended to close the facility, the plan being to flood the gas storage facility, creating a major underground reservoir capable of supplying the city of Arvada. Decommissioning of the facility commenced during 2001 and in November 2003 Xcel Energy started flooding the underground caverns with the process planned for completion by 2005. Again no reports of progress were found at the time of this study.
Crossville Storage Cavern (abandoned mine), Crossville, Illinois, USA
The Crossville Storage Cavern in Crossville, Illinois, represents what was described as ‘a shallow cavern’ constructed to a depth of around approximately 60 m and which experienced some leakage over most of its 30-year life (Pirkle, 1986, Pirkle and Price, 1986, Jones and Burtell, 1994). In fact it appears to be an old shallow mine, with a series of drifts (tunnels) that
173

operated as a storage facility for a period of 20 years prior to 1981 when investigations into gas release were initiated (Pirkle & Jones, 2004).
Leakage from the shaft was suspected, but leakage from one or more of the cavern drifts was possible. Between 1981 and 1982, in order to determine, monitor and locate the gas leakage point, an array of up to 450 shallow wells 3 to 4 m deep was constructed as part of a soil gas monitoring project. The cavern was refilled with propane to its original pressure and following recharge propane was observed within the observation test holes within 15 days. An area of contamination 185 m in diameter was detected, which was not symmetrical about the shaft. However, the propane background made it difficult to be certain the product reappearing at the surface came directly out of the reservoir during the sampling time period. In 1982 nitrogen and a helium tracer were also injected, with a helium spot detected around the shaft during the first day. Within 15 days helium had also reached ground surface and the peripheral areas of the earlier hydrocarbon spot. Helium leakage was also found at the end of one of the drifts (Pirkle & Jones, 2004).
Following the helium injection test, it was concluded that cavern leakage was quite rapid and largely associated with the cavern shaft. Within the overburden migration was pressure driven having occurred along faults, fractures and joints (Pirkle, 1986; Pirkle & Price, 1986; Pirkle & Jones, 2004). It was also found that the propane in the near surface sediments migrated into the atmosphere as a function of diurnal changes in barometric pressure (Pirkle, 1986; Pirkle & Jones, 2004).
Anderlues, Belgium
The Anderlues coalmine is located in the Hainaut coalfield of southern Belgium (Piessons and Dusar, 2003). It was operational between 1857 and 1969, after which it was closed down, although the drainage facility was maintained. Gas storage operations began in 1980, with gas stored at low pressures (0.35 MPa) between 600 and 1100 m depth. However, operations ceased in 2000 due to connectivity with shallower mine levels through which gas escaped to overlying strata, highly costly maintenance work on shafts and the high adsorption levels of the gas onto the coal seams (Piessons and Dusar, 2003).
Ravensworth, Virginia, USA
Brief details exist of a product release incident on 24 August 1973 at what was described as an ‘unlined underground cavity’ at the Ravensworth Propane Storage Facility (Berest, 1989; N Riley, HSE pers com 2007). The facility is presently operated by Washington Gas Light Company and believed to be in Virginia, USA.
The propane was stored in an unlined underground cavity, around 130m below ground level with a capacity of approximately 50,000 m3. Cavern storage operations continued whilst water was injected in the vicinity of the well in an attempt to stem and alleviate the emissions.
At the present time, there are three different underground gas storage facilities in operation in Virginia. Two of the facilities store natural gas; the Early Grove Gas Storage Field utilizes a depleted gas field, whilst the Saltville Storage Field uses salt caverns. The third, Washington Gas Light Co.’s underground storage facility, stores liquefied petroleum gas in a rock cavern, indicating it to be different to salt cavern and from the White Paper citation, is likely to be an abandoned coal mine (EPA, 1998; http://www.epa.gov/cmop/pdf/own001.pdf).
Depleted oil or gasfields and converted oil or gasfield gas storage incidents
This section deals with two types of leakage associated with depleting/depleted oil and gasfields:
• Mature or depleted fields with old infrastructure
• Depleting/depleted fields converted to gas storage facilities
174

The distinction is drawn because old fields not associated with gas storage can represent hazards, providing pathways to the surface for remaining gas. In the second instance, the fields can be old or examples where production has ceased relatively recently and in which gas storage is currently ongoing or proposed.
Los Angeles Oilfields, California (USA), including Playa del Rey
Oilfields of the Los Angeles area
The Los Angeles region has been an area of intense hydrocarbon exploration and production since the latter part of the 19th Century (Chilingar & Endres, 2005). Over 70 oilfields have been discovered, most of them in the early part of the 20th Century, with hundreds of oil wells having been drilled from derricks that once blanketed the landscape. The majority of these oilfields are now abandoned, but the area has been left with a legacy of old wells, the locations of which are often poorly known, but that now lie beneath densely populated urban areas (Figs 22&23).
The Los Angeles basin is a deep, sediment filled structural depression with recent alluvial deposits overlying older Cenozoic (Tertiary) age sedimentary rocks, with major through-going fault zones (Fig. 44). It was formed during rifting that commenced in early Miocene times, forming a series of basins and basement highs, the latter comprising the Catalina Schists and granites (Fig. 24). These basement rocks were a source of the Puente and “Repetto” Formations, which form a thick sequence of coarse clastic sediments unconformably overlying the basement rocks and deposited by late Miocene and early Pliocene fan systems. The sedimentary rocks have been uplifted, tilted, and folded by compressive movements between the North American and Pacific plates to produce structures that have trapped and accumulated oil and gas, resulting in numerous oil and gas fields within the basin (Fig. 44).
Oilfields in the Los Angeles area provide numerous instances of potentially explosive methane gas seeping to the surface and raising the possibility of a major incident. This problem has been most vividly illustrated at, for example, Fairfax and La Brea Tar Pits (the Old Salt Lake Oilfield), Belmont (the Los Angeles City Oilfield) and Ballona Wetlands (aka Playa Vista) lying above the Playa del Rey Oilfield (Hamilton & Meeham, 1992; Renwick & Sandidge, 2000; Chilingar & Endres, 2005).
The majority of gas leaks and explosions have been linked to the failure to accurately locate corroded old wells that now leak and with faults that provide the escaping gas with pathways to the surface. Problems were worsened by injection of wastewater at Fairfax and with gas for enhanced oil recovery in the South Salt Lake Oilfield near Fairfax (Hamilton & Meeham, 1992; Renwick & Sandidge, 2000; Chilingar & Endres, 2005).
Salt Lake Oilfield leading to the Fairfax and Belmont gas leaks
The danger of gas seeping to the surface from the Los Angeles oilfields was demonstrated at Fairfax, LA, in March 1985, and again in 1989 (Fig. 22a). The area overlies part of the Salt Lake Oilfield, which was once developed by more than 400 wells. The field was largely abandoned but redeveloped by slant drilling during 1962, with the continuous production of oil, salt water and gas thereafter. Water has been re-injected into the field since 1980. In March 1985, methane that had accumulated in the basement of the Ross Department Store ignited and caused an explosion that injured 23 people. Fires also broke out along surface cracks and fissures that developed nearby. The escaping gas originated from the oilfield lying immediately beneath the area and had migrated up along at least two wells and the Third Street Fault that reached surface beneath the department store. One of the wells was an old abandoned vertical well, but the second was a relatively modern inclined well that was found to have suffered corrosion below 366 m depth (Chilingar & Endres, 2005). The gas had leaked to the surface via a shallow ‘collector zone’ at around 15 m and continued to emerge through the pavement and surrounding
175

areas and burned for many days after the explosion. High levels of gas were also found at a nearby school.
A very similar gas leak incident occurred on February 7th 1989 across the street from the 1985 explosion (Chilingar & Endres, 2005). The causes were found to be old corroded wells, blocked ventilation wells and ongoing oil and gas production. Quick actions and safety measures prevented a repeat of the 1985 fire and explosion. It is believed that the 1985 and 1989 Fairfax gas leaks were the result of waste disposal or secondary recovery operations initiated by pressure injection of oilfield wastewater back into the fields (Hamilton & Meehan, 1992). This has led to increased pressures, driving the gas out and up old wells with poorly completed or corroding and deteriorating steel casings and cements. It is suggested that increased pressures also periodically cause migration along the Third Street Fault, further exacerbating the situation (Hamilton & Meehan, 1992).
A further leak and potential major hazard was detected in 1999 at the intersection of Wilshire and Curson streets just south of the La Brea Tar Pits, (which are about 1.6 km from the Fairfax incidents). Again, it was found that high-density commercial buildings had been developed in an area with old abandoned wells, requiring the installation of specialised ventilation equipment to prevent the build up and explosion of gas (Chilingar & Endres, 2005).
Further gas migration problems were identified during the $200-million Belmont High School development, in Northwest downtown Los Angeles (Fig. 23b). Conceived in 1985 and dogged by trouble and delay, building finally commenced in 1997, but was halted by the discovery of high levels of methane in the soil across the site. The gas originated from the underlying Los Angeles Oilfield and controversy raged over whether the school could be safely completed or not. Geological investigations revealed the presence of a fault below the school site that might provide a pathway to the surface and district officials questioned the completion of the project as planned. Archival photos of the area circa 1890 show hills blanketed by oil derricks, the majority of sites of which are not documented and are now covered by homes, business premises and the site of the school (Fig. 23). A decision to cease further building and abandon work on the school was taken in January 2000, although pressure remains to recommence work.
In 2001 operations commenced to inject gas under elevated pressures into the producing reservoir of the South Salt Lake Oilfield (Fig. 44) in order to enhance oil recovery. However, in January 2003, serious gas leakage problems were discovered near the Fairfax area in the vicinity of Allendale and Olympic Boulevard. The gas had been leaking to the surface along abandoned and poorly completed wells drilled before official records were kept. Consequently, the existence and abandonment status of many of these wells was unknown and high-density housing (largely apartment buildings) had been developed over them (Chilingar & Endres, 2005).
Gas leaks at the Montebello and Playa del Rey oilfields
The Fairfax and Belmont gas leaks are of particular interest when incidents at the Montebello and Playa del Rey (PDR) oilfields gas storage facilities are considered. Again, Montebello and PDR represent oilfields with a long history of oil and gas exploration and production, which has included the drilling decades ago of hundreds of unregulated (or monitored) operational or abandoned oil/gas wells (Fig. 22b&e). Many of these wells were drilled before today’s rigorous drilling and completion standards were implemented or applied (Chilingar & Endres, 2005).
In the case of Montebello, gas had been injected at a depth of around 2286 m and was subsequently found to be leaking to the surface along old wells, again, many of which were drilled in the 1930s (Chilingar & Endres, 2005). Investigations have revealed that the old well casings and cements are unable to cope with the increased pressures, allowing high-pressure gas to enter the old wells and migrate to shallower depths but not to the surface (Benson & Hepple, 2005). The problems encountered meant that the facility was eventually closed in 2003 (Chilingar & Endres, 2005; EIA, 2006).
176

The PDR Oilfield, is developed in the western Los Angeles Basin, about 17.6 km (11 miles) west-southwest of downtown Los Angeles, circa five miles south of the Santa Monica Mountains and five miles north of Palos Verde Peninsula hills to the south (Fig. 44). The discovery well for the PDR Oilfield was drilled in 1929 by the Ohio Oil Company and by the end of 1930, 141 wells had been drilled in the area (Barnds, 1968). Fifty more were drilled between 1934 and 1935, with the result areas became densely covered with oil derricks (Fig. 22b) and the precise total of operational or abandoned oil/gas wells across the field being unknown, but somewhere between 200 and 300 (Fig. 22e). The PDR Oilfield quickly depleted and in 1942, as part of the wartime effort, it was converted for use as a gas storage facility, full-scale operations having commenced in June 1943 (Barnds, 1968). PDR continued to be used as a storage facility and since 1945 has been operated by Southern California Gas (SoCalGas). The storage field is presently operated through 54 directionally drilled wells, of which 25 are injection/withdrawal wells used to inject and extract gas, 8 are liquid (primarily water) removal wells, three are lateral migration wells to control gas movement, and 18 are observation wells used to monitor pressure and liquid saturation.
The PDR oilfield lies on the western shelf of the Los Angeles Basin (Figs 24&44), between the Newport and Inglewood Fault Zone to the east and the Palos Verdes Fault offshore to the west (Wright, 1991). Many active faults are known within 80 km (50 miles) of PDR, including the Charnock Fault to the east of the oilfield (Biddle, 1991). The PDR Oilfield comprises two accumulations separated by a NW-SE trending ridge of basement (Mesozoic - Jurassic?) rocks referred to as the Santa Monica or Catalina Schist: a northwestern ‘Ocean Front’ or ‘Venice Beach’ accumulation and a southeastern accumulation, known as PDR that extends north of the Ballona Creek (Eggleston, 1948; Landes et al., 1960; Barnds, 1968). The Venice section of the field produces from the sandstones of the “Reppetto Formation” (Pliocene), and a basal schist conglomerate (Topanga Formation) of Miocene age (Fig. 24), plus or minus fractured basement (Landes et al., 1960). Production in the PDR area is mainly from the basal zone only at around 1830 m below ground (SoCal, 2004), but oil has been encountered at higher levels in Lower Pliocene deposits (Barnds, 1968).
Within the oilfield, small scale faulting of the basal schist conglomerate and Puente Formation is known (Wright, 1991). More recently, a north-south linear trend (518 m long and 61 m wide) of high methane concentrations has led to the suggestion that a downwest fault (the Lincoln Boulevard Fault) exists in the potential storage area (Exploration Technologies, 2000). The fault has been linked to the substantial leaks of methane from the gas reservoir, which would be intersected at around 1830 m and would provide a permeable vertical migration pathway to the near surface, where it is trapped in the shallow gravel beds. However, the existence of the fault has been questioned (Davis & Namson, 2000).
The PDR area has been the focus of attention since the 1990s as land in the Venice, Ballona Creek and PDR areas, overlying the PDR oilfield is being considered for major urban development (e.g. Chilingar & Endres, 2005). The depleted oilfield is one of five gas storage facilities within a 64 km (40 mile) radius operated in the Los Angeles region. There are numerous documented instances of gas leaking to the surface at PDR, with leaks and surface seepage documented in 11 wells in the general PDR and MDR area (SoCal, 2004). Gas is also seen bubbling up in waters of the Marina and Ballona Creek/Channel and following heavy rains, in standing water (Chilingar & Endres, 2005). Some wells lie in shallow lakes and gas is seen bubbling up alongside old well casings (Fig. 22d). Analyses of the gases from the Ballona Creek and other leaks indicate that it is seeping up from deep underground.
The change of land use has inevitably led to problems, with the Playa Del Rey area the centre of a major ongoing battle to prevent the development of a large housing project over the oilfield. When excavations began for the actual construction of the housing development, it was discovered that wells, abandoned as recently as 1993 to make way for the housing development, were found to be leaking (Chilingar & Endres, 2005). In each case, homes were constructed over
177

the old wells after minimal efforts were taken in an attempt to reseal the wells. There have also been efforts to install a membrane in an attempt to stop the migration of gas into buildings.
Investigations revealed that gas has leaked from the reservoir, both into the adjoining Venice accumulation and also upwards since the earliest days of operation (Reigle, 1953; Chillingar & Endres, 2005). In the latter case, the gas migrates to an intermediate sandstone horizon (Pico Sand) between 610 m and 915 m below surface (Fig. 22f). From here it finds its way into the “50 foot gravel zone” (Los Angeles riverbed deposits) via fractures and old abandoned and capped wells that have cracked or corroded casings and cements and thence to the surface. Within the gravel zone, flow rates may be as high as 20-30 litres per minute (Chillingar & Endres, 2005). Estimates for the rate of gas loss due to uncontrolled migration and/or seepage into the atmosphere from the Playa del Rey oilfield are put at approximately 2.8 Mcm per year (Tek, 2001; http://www.saveballona.org/expert.html).
Opponents to the Playa Vista development have also cited corporate reports from the 1950s, indicating that millions of cubic feet of gas had disappeared. Furthermore, the driving of piles for some of the larger buildings up to 15 m down through the poorly consolidated river terrace and wetland marsh sediments into solid rock could provide more pathways for the migration of gas. Opposition groups have, therefore, allude to the Fairfax and Belmont incidents, highlighting the problems of gas seepages and perceived danger of explosion, with old wells and possible unknown faults in the area, as reason for the abandonment of any further development. Consequently, the problems associated with the PDR gas storage facility are not so much with previous high profile leaks and explosive incidents at the site, but with potential disasters. The Playa Vista development and associated problems clearly highlight the difficulties encountered with urban encroachment into areas historically reserved for oil and gas field operations, not just within the Los Angeles Basin, but anywhere with historical oil production (Chilingar & Endres, 2005).
Playa del Rey gas storage incident
There is one documented incident of a rapid escape of stored natural gas at the SoCal storage complex in PDR. This occurred at about 6:10 am on the morning of 2nd April 2003, when a mechanical valve failure led to a 25-minute venting of gas mixed with some accumulated oil, that left cars, streets and homes coated with a brown residue (Peterson & Marquez, 2003; http://www.saveballona.org/gasoilmist.html). Local residents described a loud rushing noise and a geyser rising up to 30 m into the air. SoCalGas described the incident as the first of its kind in the 60-year operating history and resulted from the triggering of a safety mechanism that vented gas following the breakdown of a compressor.
East Whittier Gas Storage Facility, California
The East Whittier oilfield, lying to the ESE of the Montebello Oilfield in eastern California (Fig. 44) was discovered in 1917 and converted to a gas storage facility in 1952. The facility was operated by SoCalGas, with additional wells drilled and operated for the purpose of gas storage and withdrawal. Although no surface leaks were reported for the East Whittier facility, it was found during the 1970s that the storage gas had migrated out of the original storage area within the SoCalGas lease area, into an adjoining lease and was being produced and sold by another company (Benson & Hepple, 2005). The injection of gas ceased in about 1986, with gas injection facilities dismantled and removed from the site in 1992. SoCalGas continued withdrawal of gas until final closure and abandonment of the site accompanied closure of their Montebello storage facility in 2003 (Benson & Hepple, 2005; EIA, 2006).
El Segundo, California
The El Segundo Oilfield, located southwest of Los Angeles, represents a faulted anticlinal trap, with two distinct accumulations separated by a northwest trending zone of faulting (Eggleston, 1948; Landes et al, 1960; Khilyuk et al., 2000). The first well was drilled to the east of the faulted fracture zone in 1935 and produced oil from the Miocene Basal Schist Conglomerate
178

(refer Fig. 24) at a depth of around 915 m (Khilyuk et al., 2000). Production from the western part of the field began in 1937 from fractured Basement Schist at around 2210 m (Landes et al., 1960). Sixty-six wells were drilled in the development of the El Segundo field with a wide variation in production from adjacent wells (Eggleston, 1948; Landes et al, 1960).
In the early 1970s, gas was stored in the depleted oilfield, however, gas detected in a nearby housing development that was under construction indicated that the gas had migrated out of the reservoir. Construction was halted and a passive venting scheme was installed in an attempt to prevent the dangerous build-up of gases and a decision taken to close the storage facility (Khilyuk et al., 2000).
Castaic Hills and Honor Rancho oilfields, California
The Castaic Hills and Honor Rancho oilfields are two of a cluster of oilfields located to the east of Ventura in Los Angeles County, California. Both are depleted oilfields that were converted to gas storage fields and are operated currently by SoCalGas (Figs 22c&45). It is noteworthy that several hundred exploratory and development wells have been drilled in the Honor Rancho field, adjacent oil fields and the surrounding area (Davis & Namson, 2004).
The Castaic Hills and Honor Rancho gas storage fields are located in the eastern portion of the Ventura basin; a highly deformed Tertiary age marine basin within the Transverse Ranges of southern California (Davis & Namson, 2004). The major through going San Gabriel fault is present circa 1 km to the northeast of the storage field, separating the mostly marine eastern Ventura Basin on the west from the mostly nonmarine Soledad Basin to the east. The deepest part of the eastern Ventura basin occurs just west of the storage field. Nonmarine Saugus Formation (Quaternary age) crop out at surface. To the SW, lie the Castaic Junction and Newhall Potrero oil fields, traps for which are late Pliocene and Quaternary anticlines along the southwest margin of the eastern Ventura basin.
The Honor Rancho Storage Field, located in Valencia, near the intersection of Interstate Highway 5 and State Highway 126 in the northwest part of Los Angeles County (Fig. 45a), was known as the Southeast Area of the Honor Rancho Oil Field (Davis & Namson, 2000). The field was discovered by ChevronTexaco in May 1956, when oil and gas was encountered in a series of sandstones (including the Wayside 13 sand) at depth of approximately 2.5-3 km below ground level (Fig. 45b). The Wayside 13 sand is the basal unit of a sequence of deepwater shale and turbidite sands forming the shale dominated upper Miocene to lower Pliocene Towsley Formation (Davis & Namson, 2004). The up-dip seal is provided by a down-to-the-north syndepositional normal fault (active during Towsley deposition), with the Towsley Formation faulted against the Wayside 13 sand. However, the nature and exact location of the east and west lateral seals are less well known. Initial reservoir pressures were 4411 psig. Between 1956 and 1975, ChevronTexaco drilled 23 further wells on the field. Structurally, the field lies in the footwall block of the east-west trending Honor Rancho thrust of late Pliocene and Quaternary age and is underlain by a further concealed reverse fault (F-1), from which the Honor Rancho structure arises (Davis & Namson, 2004). The Honor Rancho thrust fault and F-1 reverse fault intersect the San Gabriel fault just to the east of the storage field and probably continue westward as blind faults beneath the north side of the Ventura basin to connect with the San Cayetano fault system.
In 1975, SoCalGas acquired the Southeast Area of the Honor Rancho Oil Field from ChevronTexaco and converted the field for gas storage in the Wayside 13 sand. It was renamed the Honor Rancho Storage Field with 38 wells presently completed to the storage zone: 23 combination injection-withdrawal wells, 8 withdrawal-only wells and 7 oil wells equipped with gas lift (the WEZU-13A is completed outside the storage zone, and WEZU-C4 is currently plugged-back and idle; Davis & Namson, 2004). All of the wells acquired from ChevronTexaco were reworked and 17 combination injection-withdrawal wells were drilled by SoCalGas. Each well is equipped with a wellhead safety shutdown system and lateral pipework that can be used to kill the well remotely.
179

The Castaic Hills Oilfield lies just to the west of the Honor Rancho Oilfield, having similar structural position and reservoir characteristics. After depletion, it was used for gas injection. However, production of gas from the Honor Rancho and Tapia fields with similar chemistry to that of the injected gas at Castaic, indicated that gas was migrating out of the storage reservoir and eastwards into producing reservoirs of the Honor Rancho and Tapia fields at shallower depths (refer Fig. 45). Dying oak trees along the surface trace of faults indicated that gas was then migrating to surface via faults (Khilyuk et al., 2000). There are no reports found of any adverse impact on humans thus far.
McDonald Island, Stockton, San Joaquin County, California
The McDonald Island gas storage facility is a depleted gasfield operated by Pacific Gas and Electric (PG&E) some 360 miles north of the Los Angeles storage sites described above (Fig. 22c). The facility is the largest of PG&E’s underground gas storage fields, providing approximately 25% of available gas supply during cold winter weather in the PG&E service area (Menconi & Sanders, 2006). Onsite there are above ground gas processing, compression and metering facilities used during the injection and withdrawal of gas from the gas storage facility.
Discovered in 1936 by the Standard Oil Company, the McDonald Island Gasfield produced gas from an early Eocene (Cainozoic) sand, the top of which was at 1670 m below ground level (Lee, 1968). The field is a relatively simple NNW-trending faulted anticline and initial wellhead pressures were 2,086 psig. Five further wells were drilled and the field produced from 1937 to February 1958, by which time the pressure had declined to 450 psig. Thereafter, five further wells were drilled and the field was converted to gas storage purposes, with the field rights transferred to PG&E on December 11th 1958 (Lee, 1968). The field is currently operational with a storage capacity of around 3.34 Bcm (Habel, 2005).
Reports are limited, but there have been two cases of explosions and fire at the facility. The first incident occurred in 1974 with the resultant fire consuming an estimated 0.42 Mcm of natural gas over a 19-day period (San Joaquin County, 1992).
The second explosion occurred on 1st October 1993 and was heard up to twenty miles away. The incident resulted from an explosion in a moisture extractor, where natural gas is processed prior to injection and after withdrawal from storage. Debris from the incident was thrown up to one-mile and caused damage to property, cars and boats over that distance (Delta Protection Commission, 1997). The incident resulted in a 40% production loss and caused site damage of US$2 million and third party damage of US$50,000. The ensuing fires were extinguished by the facility's automated fire-extinguishing system.
Search for oil at UGS facility, southern Illinois (USA)
Sketchy court reports exist of an explosion and fire that occurred on February 7th, 1997, at an oil well drilling site located over an underground gas storage field in southern Illinois. According to the plaintiffs in a court case, Petco Petroleum Company (Petco) began drilling Orville Mills Well No. 6 well site (owned by the defendant Bergman Petroleum) in the search for oil. The claim was that no inspection was carried out at the well site before drilling began to ensure site safety. Later inspections revealed that the well was unsafe, but the drilling was not stopped. Natural gas migrated through the sandstone in the area, and on February 7, 1997, gas erupted from the well, resulting in an explosion and fire. The three employee plaintiffs were all injured in the explosion and they argued that the explosion occurred because the defendants:
• failed to follow applicable safety regulations
• failed to have a working blowout preventer at the site to seal the well
• failed to correct unsafe drilling practices at the site
• directed Petco employees to continue drilling in spite of a known and imminently dangerous situation.
180

The case was dismissed as the plaintiffs did not allege facts sufficient to raise a duty on the part of defendants to keep the job site safe and show sufficient violation of that duty.
Epps Gasfield, Louisiana, USA
The Epps Gas Storage Facility, operated by Trunkline Gas Company, is a converted gas field located in what were originally defined as two different fields; Epps and South Epps in the East and West Carroll Parishes of northeastern Louisiana (Coleman, 1992). The Epps Gas Field was discovered in 1928 and between 1928 and 1973, produced gas from the Monroe Gas Rock at a depth of approximately 700 m. The Monroe Gas Rock (MGR) in northeastern Louisiana represents the last stage of Mesozoic carbonate platform development in the north-central Gulf province (Washington, 2006). Another gas field, also producing from the Monroe Gas Rock, was discovered southwest of the original field in 1954. This field, known as South Epps, produced until 1972 Depletion of both fields led to gas production ceasing in 1973, when Trunkline Gas Company converted both fields to gas storage facilities. Injection of storage gas commenced in 1979 and between 1984 and 1987, 11 production wells were drilled in the west that by 1989 had produced over 56.6 Mcm of gas.
However, geochemical fingerprinting of the gases in the field(s) demonstrated that chemical and isotopic composition of the gas in some of the western wells had, over time, changed from that of native gas to that of storage gas. This meant that a majority of the gas produced in the western area was not native gas, but storage gas, which had migrated into the western area (Coleman, 1992). Following further studies in 1990, the boundaries of the storage area were redefined to include these producing wells and thus protect the integrity of the storage project. The facility remains operational (EIA, 2006).
Rough Gasfield, southern North Sea, UK Sector
On the 16th February 2006, an explosion followed by the outbreak of fire occurred on the Bravo 3B platform of the Rough gas storage facility in the southern North Sea (Centrica, 2006). The storage facility is about 31km (20 miles) off Withernsea on the East Yorkshire coast and was originally developed in October 1975, as the Rough Gasfield, to produce natural gas from the Permian Rotleigend sandstone reservoir at around 2750 m below the seabed.
The explosion occurred at approximately 10.30 in the morning, which led to the evacuation of 31 of the workers, including two who suffered burns and smoke inhalation and were treated in hospital. Twenty-five essential staff remained on the platform, whilst the fire was put out. Production on both the Bravo and Alpha platforms was halted whilst the Bravo platform was depressurised and made operationally safe. The shutdown caused wholesale prices to rise by 40%, however, these quickly fell back again as more details emerged. The incident is under investigation by the HSE and HSL, with final details of the cause of the explosion and fire yet to be released. However, the HSE released a safety alert in May 2006 (HSE, 2006) advising the incident leading to the explosion involved the catastrophic failure of a shell and tube heat exchanger (cooler unit) seemingly in close operation with one of the four glycol dehydration units (refer Centrica, 2006).
Fort Morgan, Morgan County, Colorado, USA
Colorado Interstate Gas Company (CIG), part of El Paso Corporation and operators of the Fort Morgan Storage Field in Morgan County, Colorado, announced that a well leak had occurred at its storage facility on Sunday 22nd October 2006. It led to a partial shutdown of operations, pending further investigations. The plant was shut down for a week after the leak, but was back online by the 9th November (State of Colorado, 2006; http://tonto.eia.doe.gov/oog/info/ngw/ ngupdate.asp).
The field, one of five in the Rocky Mountain division, covers an area of around 3,220 acres (1303 ha) and was originally discovered in 1954. In 1966, following 10-12 years of production, it was converted for storage purposes, with 34 wells used to store almost 424.8 Mcm of natural
181

gas. The gas storage field plays an important role supplying homes, schools, businesses, hospitals and power plants with natural gas in both Fort Morgan and along the Front Range.
Reports that water and gas were bubbling to the surface were received by both CIG and El Paso at about 12:30 pm on October 22nd 2006. Surrounding roads were immediately closed, with investigations into the leak beginning early on October 23rd, with a systematic testing of wells to determine where the gas was leaking. Methane was leaking into an aquifer and it was feared that it could enter houses with well water and find an ignition source. Thirteen families in houses using water wells within a 1600 m radius of the leak were evacuated and put into local motel accommodation. By the following Thursday, residents of all but the two houses closest to the well were allowed back into their homes, with the two remaining families still in motels on 9th
November.
Initial investigations revealed that the source of the leak was at a depth of about 1600 m in well No. 26, located in the middle of the field. The leaking gas migrated up the well and vented to the surface, via an intermediate level, in two general areas to the southwest and southeast of the plant. Following the leak, well pressures were monitored twice a day, results of which indicated no other well leaks. Currently no information is available as to how the leak was plugged.
Breitbrunn/Eggstatt, Bavaria, Germany
The Breitbrunn/Eggstatt Gasfield in Bavaria, Germany, was discovered in 1975 and produced from four sandstone reservoirs via four vertical wells. Production ceased in 1993 following which, the uppermost reservoir was converted to gas storage with the drilling of 6 horizontal wells that together, doubled the storage capacity to 1.085 Bcm [38.3 Bcf] (Bary et al., 2002; Rohler et al., 2004). Two deeper reservoirs were ultimately converted for gas storage to increase storage capacity as gas demand grew during the winter months.
During 2003, an anomalous pressure was noted in the Breitbrun 21 gas storage well that indicated a leak in the borehole completion (Überer et al., 2004). In order to investigate and locate the potential leakage point, fibre optic temperature measurements were performed in June and October 2003. These measurements showed a significant temperature anomaly at a depth of 586 m, which was caused by a leak in the borehole string. According to the tubing list a pipe joint is located at this depth (Überer et al., 2004). The leak was repaired using a sealing sleeve, demonstrating a process that offers potential for companies operating gas and gas storage wells elsewhere.
Bammel Oilfield, Texas (USA) and Hatfield Moors Gasfield, South Yorkshire (UK)
Although not strictly gas storage incidents, the Bammel Oilfield (Texas) and Hatfield Moors Gasfield (South Yorkshire) provide examples of major well blowouts at operating fields that have subsequently been converted to successful gas storage facilities.
Between 1942 and 1945 a spectacular blowout occurred from a casing leak in an oil and gas well at the Bammel Field, Harris County, Texas. In the mid 1960s after depletion of the oil and gas reserves, the Bammel Field, which lies to the NW of Houston, was converted to an underground natural gas storage field. It presently represents one of the largest underground reservoir storage fields in North America, being strategically located on the HPL system in Houston in close proximity to the Katy Hub. As a result of the leak, the surrounding fresh water aquifers were badly polluted by oil and gas from the well. The incident served as a scapegoat for most of the reported cases of petroleum contamination in water wells in northern Harris County (LeBlanc & Jones, 2004).
The Hatfield Moors Gasfield was discovered accidentally in December 1981 when drilling the Hatfield Moors No.1 exploration well. The hole had reached a depth of 424 m (1587 feet) in the Westphalian B Oaks Rock sandstone formation, when during operations to change a drill bit, there was a major gas escape that ignited. There were no casualties, but the ensuing blaze
182

destroyed the drilling rig, and the fire was not brought completely under control until 38 days after the initial explosion, by which time around 28.3 Mcm of gas had been consumed in the fire (Ward et al., 2003). Gas had not previously been known in the Oaks Rock in the many coal and several oil boreholes that had already penetrated this shallow formation in this area. Hatfield Moors was successfully developed and produced gas for a number of years before being converted to a gas storage facility in 2000 (Ward et al., 2003).
Gas storage well damaged during earthquake and drilling activities
A specialist drilling firm, Vector Magnetics (http://www.vectormagnetics.com/casehistories.pdf), record instances of damage to gas storage wells in Southern California that required correction by sidetracked wells. Unfortunately, the precise locations of the incidents have not been ascertained, but they are noteworthy as having been associated with UGS.
The first instance involves a directionally drilled gas storage well in which collapse of casing and tubing across a sand/shale boundary below circa 2135 m had been caused by an earthquake (Fig. 46a&b). Safe abandonment of the well following retrieval of the pipe string and cementation was achieved by sidetracking out of the well and re-entering below the collapsed section of well.
The second instance of damage to a gas storage well occurred during work to repair a casing shoe leak when a gas utility inadvertently sidetracked out of the 5� inch casing of a gas injection/withdrawal well (Fig. 46c). The damage to the well servicing a gas storage reservoir at around 3100 m, occurred at a depth of 2255 m. A number of attempts to re-enter the casing proved unsuccessful. The problem was rectified by a sidetracked well out of the original casing at around 730 m, drilled to intersect the 5� inch casing at 3021 m. The operation then required milling of the well casing and cementing a nine metre section for abandonment, above the level of re-entry, with the newly deviated well completed as the replacement well (Fig. 46c).
The third instance of damage and repair to a gas storage well, again involved a gas utility inadvertently sidetracking through the corroded casing of the storage well that was servicing a reservoir at around 2470 m. In this case, the initial damage occurred at circa 1250 m during routine work-over and casing patch operations (Fig. 46d). Subsequent attempts to re-enter the casing only deepened the sidetrack and resulted in the loss of a drill collar fish tool. The old well casing was by-passed by directional drilling of a new well that re-entered at around 1335 m, following which the old well could be safely plugged and abandoned.
183

Appendix 6 Risk Assessment - considerations
WELL PROBLEMS
In general, well problems will primarily involve the following:
o breaks/faults in the casing, joints or defective or poor quality cementing of casings, leading to
� leakage through new or ageing injection well completions
� leakage up abandoned wells
o presence of unknown wells arising from inadequate site characterization
o during re-entry to, or repair and maintenance work on wells
o Inconsistent or inadequate monitoring of injection wells, groundwater in overlying formations and leakage from abandoned wells.
o Leakage due to inadequate cap rock characterization
o The facility operating at pressures higher than the rock units have previously experienced. In the UK, depleted oil and gasfields, would not normally be operated at pressures above the original reservoir pressure (BS 1998a). Elsewhere one of the main risks and causes of leakage is due to operation of underground aquifer and salt cavern gas storage facilities at pressures greater than the rock has previously experienced (overpressures or ‘delta’ pressures). This is related to maximising the working gas volume and to attaining higher delivery rates as well as achieving a greater return on investment.
o Inaccurate inventories of stored or injected product
Risk Assessment – failure mechanisms relating to geology
With reference to geological matters, the following would probably be of immediate relevance in the UK context (many such failure mechanisms, outlined for salt caverns but not specific to salt, would also be relevant to the assessment of pore storage options):
SALT CAVERNS
Three principle factors contribute to the breaching and collapse of solution mined salt caverns (cavities):
• salt creep
• uncontrolled leaching
• presence of anomalous zones in what had been assumed to be homogenous salt – including non-halite interbeds
Salt cavern release scenarios, include:
o use of old brine cavities for gas storage (NE England, Cheshire)
� not designed for storage
184

� uncontrolled leaching/brining
• often a lack of roof salt and/or unstable roof – potentia for collapse
• cavern enlargement – breakthroughs, caverns coalesce
• cavern and well seal – see below
� no monitoring of abandoned caverns for subsidence or cavern shape
o inadvertent intrusion - new wells, not necessarily associated with the storage scheme
� could lead to unexpected, sudden release of product
� introduced fluids
• drilling fluids
o not suitable for salt
o less saline water – brining possible
• groundwaters – if well has not been properly cased etc.
o inadvertent intrusion – unknown or poorly sited/located old existing wells, not associated with the storage scheme, intersected by developing cavern
o inadvertent over enlargement of the cavern by brining (uncontrolled brining)
� during construction – can be monitored
� during operation – if brine compensation mode is used for cycling product (undersaturated brine pumped in can dissolve salt, enlarging the cavern – American usage/incidents)
o development of solution channels between
� wells
• brining wells (during cavern construction)
• injection wells – most likely when operating in brine compensated mode
� caverns
• pre-existing – due to uncontrolled leaching
o at time of original brining
o during storage operations when using brine compensated mode
• developing caverns
o unidentified geological boundary (?fault/fracture)
o more soluble (e.g. potash) horizons
• during gas storage – when operated in brine compensated mode
o inadvertent over-pressurisation of the storage facility
� not knowing volume of injected gas
• initially
• during injection
� equipment failure
185

• valves
• pipework
• meters
• compressors
• safety monitoring systems
� leads to fracturing of rock
• salt
• more competent interbeds
� escape of product
o inadvertent de-pressurisation below minimum operating pressures
� during operations
� during maintenance
� equipment failure (representative major accident scenarios need to be addressed in the COMAH Safety Report)
• wells
o casing – corrosion/fractures/holes
o cements
• valves
• flanges
• pipework
o corrosion
o inadvertent damage
• meters
� escape of product
� damage to
• cavern walls – microfracturing and spalling of walls
• cavern roof
• well seal at top of cavern
o failure of the cavern seal or existing/new well completions
� failure of the cavern seal
• caused during brining operations – well shoe and casing
• after cavern commissioned
o increased pressure from salt creep (and temperature)
o lowering of cavern pressure
� damage to
• cavern walls – microfracturing and spalling of walls
• cavern roof
186

o well seal at top of cavern
o too low an operating pressure
� damage to
• cavern walls – microfracturing and spalling of walls
• cavern roof
o too great a depth (>2000m?)
� unstable caverns
� increased creep
� increased volume loss/decrease
� failure of the well completion(s)
• between cement and formation/borehole sidewall (rock)
• between cement & casing
o outer cement fill
o well plug
• through casing
o fracture/damage
o corrosion
• through fractures in outer cement
• through cement plug
o deterioration
o fractures
o diffusion
• due to damage during maintenance and repair - redrilling
o Development of ledges/benches within the cavern during brining and cavern construction process
� Caused by presence of thicker non-halite beds in the bedded salt sequence
• results from poor initial characterization of the salt sequence and/or brining process
� leads to ‘compartmentalisation’ of the cavern
• cavern performance not as predicted/anticipated
� could lead to collapse of shelves/benches formed by thicker non salt interbeds, leading to damage to
• cavern floor
• cavern walls
• well string, causing
o damage to injection/withdrawal wells
o failure of the cavern seal
187

• unforeseen change in the dynamics and operation of the cavern
o Development of ‘anomalous zones’ in salt (Warren 2006)
� Unexpected zones/regions of highly soluble salts (e.g. potash salts)
� Zones of much older natural leaching (eg ‘black salt’) could contain
• pressurised brine or
• gas (methane or nitrogen)
� present the same problems in operational salt mines
o diffusion
� interbeds
� cement
• well plug
• borehole – cement boundary
• borehole wall – cement boundary
o release of material/gas through
� cracks,
� leaky interbeds,
� nonhomogeneous zones of higher impermeability
� along fault planes
• known
• unknown
o dissolution of the roof/walls of the cavern due to groundwater ingress
� wet rockhead conditions
� through other means – ingress ie at deeper levels
• along leaky interbeds
o distant new/old wells intersecting nonhomogeneous zones of higher permeability at shallower levels
o fractures
• new/old wells intersecting the salt body elsewhere
o leakge pathway
o causing solution channels and pathways (e.g. Myers et al., 1972)
o geochemical
� groundwater ingress
• water into gypsum/anhydrite bearing rock
• water into salt beds
� geochemical alteration
• gypsum-anhydrite
o input or removal of water to the system
188

o Volume change effects – cracks etc to associated interbeds?
� interaction of pressured (dry) gas with
• cavern wall beds
o salt
o other evaporites
o non salt interbeds – drying effects (cracks)
o caverns connect with other large voids
� other brine caverns (known or unknown) too close and when
• operating pressures to high
• Operating in brine compensated mode, leading to further solution of the cavern walls and hence intervening salt wall failure
� pre-existing salt mine areas - known or unknown/long forgotten, i.e. old workings, the full extent of which are not known or were never accurately recorded
� old collapsed brine caverns (e.g. Preesall)
� pockets of gas in the salt body during
• operation in brine compensated mode – injected brine causes further unnoticed dissolution of the salt beds
• during cavern formation – unexpected, potential damage to
o cavern walls/roof
o hanging pipestring
o partial cavern roof/wall falls – various causes
� poorly constructed
• too little roof salt thickness left
• too wide a cavern – unsupported roof
• operating pressure too low
o microfractures and spalling of cavern walls
o simple collapse
o fault development
o reactivation of a fault in the cap rock
� hydraulically induced
� injection cycling – expansion/contraction
� geochemical alteration (gypsum-anhydrite)
� gas drying out rock – less likely due to the roof salt, unless it is breached/too thin
o precipitation of cementing materials/bacterialogical activity
� inside well
189

� changes to operation characteristics of injection/withdrawal wells – leads to change operating conditions without appropriate precautions/research into effects
Pore storage (depleted oil/gasfield) release scenarios. Will include many of the anticipated
scenarios detailed for cavern storage but would also include others, such as:
o Macroseepage mechanisms
� failure of the old exploration, development and producing well completion(s)
• between cement and formation/borehole sidewall (rock)
• between cement & casing
o outer cement fill
o well plug
• through casing
o fracture/damage
o corrosion
• through fractures in outer cement
• through cement plug
o fractures
o diffusion
• due to damage during maintenance and repair – redrilling of wells
o release of material/gas through leaky interbeds, or nonhomogeneous zones of higher impermeability such as along fault planes
o inadvertent over pressurisation of the storage facility
o failure of the caprock
� membrane seals
� hydraulic seals
� geochemical alteration
• gypsum-anhydrite
o input or removal of water to the system
o Volume change effects – cracks etc to associated interbeds?
• gas does not generally react chemically with the reservoir or cap rock
• H2S – reaction with cement in well completions, both
o Abandoned wells
o Working wells
� injected gas drying out shale caprock
o reactivation of a fault in the cap rock
� hydraulically induced
190

� injection cycling – expansion/contraction of the storage unit
� geochemical alteration – volume changes (gypsum-anhydrite??)
� gas drying out rock
o diffusion
� caprock
� cement
• well plug
• borehole – cement boundary
• borehole wall – cement boundary
o naturally over pressured layers (rare onshore)
o damage to reservoir formation
� mechanical - rock structure
� precipitation of cementing materials/bacterialogical activity
• closes pore spaces and reduces permeabilities
• reservoir performance changes around injection/withdrawal wells – leads to change in the operating conditions without appropriate precautions/research into effects
o overfilling (inadvertent)
� migration away from injection footprint
• stays in same structure
• leaks out
o into adjacent structure (spill point)
o or out of the structure via
� faults
� wells
� through caprock if overfilling causes overpressuring
� diffusion – lateral perhaps due to overpressuring driving migration
• not having fully characterized the storage structure
o faulting
o spill point not accurately defined
• not knowing the volume of gas injected
o failure of the caprock
� membrane seals
� hydraulic seals
� geochemical alteration (e.g. gypsum-anhydrite transition, rock alteration due to interaction with injected gases)
� gas drying out rock – fracturing/cracking
191

o reactivation of a fault in the cap rock
� hydraulically induced
� injection cycling – expansion/contraction
� geochemical alteration (gypsum-anhydrite??)
� gas drying out rock
• knowledge, consideration and modeling of the drive mechanism during production and effects on gas injection pressures and reservoir rock – potential for fracturing
o gasfields
� depletion drive
� water drive – may result in higher injection pressures
� combination – may result in higher injection pressures
o oilfields
� depletion drive
� water drive – may result in higher injection pressures
� combination – may result in higher injection pressures
� residual oil in pore spaces – may result in higher injection pressures than for residual gas in pores for gasfields
Pore storage (aquifer) release scenarios
Aquifers have not previously having held commercial volumes of hydrocarbons and are therefore ‘untested’. When compared to converting oil/gasfiels to gas storage, aquifer storage includes a number of unknowns that would require adequate research if such facilities are to be considered in the future. They are not likely to be high on the UK ‘agenda’ due to increased costs that include determining these uncertainties over the formation and structure. Potential additional risks would incude:
o overpressuring of the aquifer and seal – gas injection requires higher pressures than original in reservoir and
� to have to displace water from pores
� area has not previously held hydrocarbons
� seal has not had to deal with such pressures
o inadvertent over pressurisation of the storage facility
� damage to seal
� damage to reservoir
o overfilling (inadvertent)
� migration away from injection footprint
• stays in same structure
• leaks out
o into adjacent structure (spill point)
o or out of the structure via
� faults
192

� wells
� through caprock if overfilling causes overpressuring
� diffusion – lateral due to structure not having been accurately defined
• not having fully characterized the structure
o faulting
o spill point not accurately defined
• not knowing the volume of gas injected
o failure of the caprock
� membrane seals
� hydraulic seals
� geochemical alteration (e.g. gypsum-anhydrite transition, rock alteration due to interaction with injected gases)
� gas drying out rock – leading to fracturing/cracking and potential pathways
o reactivation of a fault in the cap rock
� hydraulically induced
� injection cycling – expansion/contraction
� geochemical alteration (gypsum-anhydrite??)
� gas drying out rock
o naturally over pressured layers (rare or absent onshore)
193

Appendix 7 Risk Assessment - parameters forconsideration in risk analysis/assessment of UK scenarios
The following represent the general parameters considered during the assessment of potential leakage routes and the construction of modles for the calculation of gas release and flux rates undertaken by Quintessa (Watson et al., 2007).
Depleted oil & gasfields
East Midlands
General geological sequence in areas of main potential:
4 Scenarios:
General dip – gently to east
1. Overlain by Chalk (Saltfleetby scenario – Fig. 47)
• Upper Cretaceous Chalk – 0-550 m (> 550 m at Saltfleetby) • Lower Cretaceous lsts, clays and ssts – c. 35-45 m • Upper Jurassic
i. Ancholme Clay Group – Kimmeridge Clay, Oxford Clay & Kellaways Beds + West Walton Beds (shelly siltstone) – mainly calcareous and silty mudstones – 75-245 m thick
ii. Redbourne Group – Cornbrash (thin = c. 5 m thick) • Middle Jurassic – 48-58 m thick
i. Redbourne Group – including Great Oolite and Inferior Oolite 1. mainly limestones and sandstones, including Great Oolite and
Inferior Oolite – nearest crop c. 34 km up-dip to west 2. Lincs Limestone – nearest crop c. 41-41.5 km up-dip to west
a. Top c. 25 m oolite • Lower Jurassic – Lias Group – 130-215m thick
i. Mainly mudstones, some ironstones • Penarth Group – c. 12-15 m thick
i. Mudstones, and interbedded shales and limestones • Mercia Mudstone Group – c. 250-300 m thick
i. Mainly mudstones ii. Sitltones and fine-grained sandstones in part
iii. Evaporitic in parts • Sherwood Sandstone Group – 300-450 m thick
i. Reddish brown sandstones • Permian – 215-590 m series of interbedded limestone, mudstone and evaporites
i. Staintondale & Eskdale groups – 36-98 m 1. 4-11 m evaporites including anhydrite
ii. Teesside Group – 43-91 m 1. Boulby Halite (host salt for caverns on Teesside, NE England) – 0-
25 m 2. Billingham Anhydrite – 3-6 m 3. Brotherton Formation (‘Upper Magnesian Limestone’) 40-60 m
iii. Aislaby Group – 55-160 m
194

1. Fordon Evaporites (host salt for caverns at Atwick/Hornsea, NE England) – 10-90 m
2. Kirkham Abbey Formation 60-70 m iv. Don Group – 80-220, but may reach up to 270 m in east
1. Hayton Anhydrite 65-150 m, thinning southwestwards 2. Cadeby Formation 8-15 m 3. Marl Slate 2-3 m
v. Basal Permian sands – 10-40 m • Carboniferous - > 740 m
i. Coal Measures – 495-740 m 1. Upper Coal Measures – 0-175 m thick 2. Middle Coal Measures – 275-330 m thick 3. Lower Coal Measures – 220-236 m
ii. Millstone Grit (Namurian) – up to 247 m proved (c. 25 m at Saltfleetby) iii. Dinantian – limestones >10 m
• Faulting i. Some at reservoir level and Westphalian and pre Upper Magnesian
Limestone (Permian) 1. up to 100m displacement 2. 20-60 m average displacement
ii. Minor in overburden (below seismic resolution) and not penetrating to reservoir level
iii. None to surface (none mapped and/or below seismic/mapping resolution) • Main gas storage reservoir – late Westphalian B ‘Oaks Rock Sandstone’ at c. 425
m below Ordance Datum (OD) in crest of anticlinal trap i. Area of gasfield = 2857 acres
ii. 7.6-27.4 m thick iii. Porosity – 9.5-12.5% iv. Permeability – 1-10 mD v. Original reservoir pressure – c. 3566 psig (24.6 MPa or 246 bar)
• Borehole density – 18 exploration/development wells to the reservoir horizon, including horizontal wells
i. 11 km square – circa 642 1. 67 greater than 50 m 2. 24 greater than 100 m 3. 574 less than 50 m 4. 618 less than 100 m
ii. 3 km buffer – circa 482 boreholes in 81 km2
1. 44 greater than 50 m 2. 23 greater than 100 m 3. 400 less than 50 m 4. 458 less than 100 m
iii. 1 km buffer – 206 boreholes in 42 km2
1. 23 greater than 50 m 2. 19 greater than 100 m 3. 183 less than 50 m 4. 187 less than 100 m
• Series of basal Westphalian channel sands i. Deposited in a major fluvio-deltaic system across much of northern
England, giving general ascending sequence 1. Pro-delta submarine fans – isolated sandstone bodies within
mudstone dominated sequences 2. Delta front deposits – feeder channels to the submarine fans
195

3. Lower delta plain channels -4. Upper delta plain
• Fields within 3 km – 1 (Keddington Oilfield) • Nearest major town/city – Louth c. 6.5 kms to WSW, Grimsby c. 18 kms to NNW
2. Chalk absent at crop (Welton scenario – Fig. 48) – Jurassic or Triassic
• General dip - gently dip to east • Jurassic (at crop)
i. Upper Jurassic 1. Ancholme Clay Group –
a. Oxford Clay – thin or absent b. Kellaways Formation – c. 16 m thick
2. Redbourne Group - Cornbrash (limestone – thin c. 5 m thick) ii. Middle Jurassic
1. Redbourne Group - including Great Oolite and Inferior Oolite a. Blisworth Clay – c. 7 m thick b. Blisworth Limestone – 8-9 m thick c. Rutland Formation (Upper Estuarine Series) – 6 m thick d. Lincs Limestone Formation – c. 50 m – nearest crop c. 6.8
km to west e. Top 25 m oolite
iii. Lower Jurassic – Lias Group – 195-200 m thick 1. Middle Lias Marlstone Rock – c. 3 m thick (110-113 m) 2. Hydraulic Limestone at base c. 6 m thick (290-296 m)
• Triassic – nearest crop to field 17.5-18 km to west
i. Penarth Group – c. 13 m thick ii. Mercia Mudstone Group – c. 280 m thick (319-599 m) - 17.5-18 km to
west
iii. Sherwood Sandstone Group – c. 260 m (599-860 m) thick• Permian –
i. Upper Marls – 57 m thick ii. Brotherton Formation (‘Upper Magnesian Limestone’) – c. 27 m thick
iii. Middle Marl – c. 43 m thick iv. Cadeby Formation (‘Lower Magnesian Limestone’) – c. 16 m thick v. Lower Marl – c. 46 m thick
vi. Basal Sand – c. 25 m thick • Carboniferous – c. 540 m (1074-1616 m approx.)
i. Upper Coal Measures – c. 170 m thick ii. Middle Coal Measures - c. 165 m thick
iii. Lower Coal Measures – c. 209 m thick iv. Late Namurian/early Westphalian – 22-90 m (1616-1638 m in B3) v. Dinantian – c. 12 m
• Reservoir – series of switching, low sinuosity fluvio-deltaic channels and associated overbank environments – perhaps 3 different units at Welton (Rothwell & Quinn, 1987). However, Star Energy have reinterpreted the sandstones and their depositional environment (submitted in their application to Lincolnshire County Council to convert Welton to gas storage facility)
i. IV = 5-21 m (porosity 9-21%; permeability 5-100 mD) ii. III = 10-23 m (porosity 9-22%; permeability 10-500 mD)
iii. I = 7-57 m (porosity 9-21%; permeability 1-30 mD) iv. Original reservoir pressure – 2230 psig (15.4 MPa or 154 bar)
• Oil gravity/density - 36° API • Faulting
196

i. Some of reservoir and Westphalian and pre Upper Magnesian Limestone (Permian)
ii. Some of overburden, but not penetrating to reservoir level iii. None to surface (mapped and/or below seismic/mapping resolution)
• Borehole density – �54 exploration/development wells, majority being from 3 well sites/platforms
i. 11 km square – circa 642 1. 81 greater than 50 m 2. 60 greater than 100 m 3. 555 less than 50 m 4. 575 less than 100 m
ii. 3 km buffer – circa 468 in 3 km buffer = c. 63 km2
1. 76 greater than 50 m 2. 59 greater than 100 m 3. 406 less than 50 m 4. 423 less than 100 m
iii. 1 km buffer – 210 boreholes in 30 km2
1. 67 greater than 50 m 2. 54 greater than 100 m 3. 157 less than 50 m 4. 170 less than 100 m
• Fields within 3 km – 3 • Nearest major town/city – Lincoln c. 5.5-6 kms to west • Water injection has supported production since 1986/7
3. Chalk absent at crop (Gainsborough-Beckingham scenario – Fig. 49)
• Drift – c. < 10 m thick • Jurassic – thin in most easterly areas (< 20 m thick) or (mostly) absent at crop • Triassic – c. 480 m (eroded thickness in west)-550 m thick in east
i. Mercia Mudstone Group – at crop over majority of the field – c. 170-270 m thick
ii. Sherwood Sandstone Group – nearest crop = 4 km to west – c. 280 m thick
• Permian – c. 225-250 m thick i. Upper Marls –c. 43 m thick
ii. Brotherton Formation (‘Upper Magnesian Limestone’) – c. 24 m thick iii. Middle Marl – c. 39 m thick iv. Cadeby Formation (‘Lower Magnesian Limestone’) – c. 76 m thick v. Lower Marl – c. 50 m thick
vi. Basal Sand – c. 10-15 m thick • Westphalian – c. 640-675 m thick
i. Series of coals, mudstones and sandstones • Namurian – c. > 70 m thick • Faulting
i. Some of reservoir and Westphalian and pre Permian ii. None to surface at oilfield (mapped and/or below seismic/mapping
resolution) iii. Nearest mapped at crop on east edge of Sherwood Sandstone Group – 1.7-
4.5 km away• Reservoirs –
i. Main = series of basal Westphalian channel sands – c. < 40-45 m thick ii. Other
197

1. (younger) minor channel sands in Coal Measures sequence 2. late Namurian sandstones
• Porosity – c. 15 % (Egmanton data) • Permeability – 1-10 (av. 3) mD (Egmanton data) • Original reservoir pressure – c. 1400 psi (9.7 MPa or 97 bar) • Oil gravity/density – 35.64° API• Borehole density –
i. 11 km square – circa 560 – though unrepresentative totals – depth not assigned in database – 156 boreholes
1. 154 greater than 50 m 2. 152 greater than 100 m 3. 400 less than 50 m 4. 405 less than 100 m
ii. 3 km buffer – circa 553 in 3 km buffer = c. 140 km2 – though unrepresentative totals – depth not assigned in borehole database – c. 155 boreholes
1. 151 greater than 50 m 2. 149 greater than 100 m 3. 398 less than 50 m 4. 400 less than 100 m
iii. 1 km buffer – 362 boreholes in 50 km2 - slightly unrepresentative totals – depth not assigned in database –c. 96 boreholes
1. 150 greater than 50 m 2. 148 greater than 100 m 3. 212 less than 50 m 4. 214 less than 100 m
• Fields within 3 km – Gainsborough-Beckingham Oilfield - series of closely associated structures, although connectivity between one or more is not known
• Nearest major town/city – Gainsborough – developed above the oilfield
Hatfield Moors scenario – note, at Hatfield Moors storage facility, reservoir is at 425 m below
OD:
• Drift – c. < 10 m thick • Triassic - > 245 m thick • Sherwood Sandstone Group - > 245 m thick • Permian – c. 170-175 m thick
o Upper Marls –c. 37 m thick o Brotherton Formation (‘Upper Magnesian Limestone’) – c. 20 m thick o Middle Marl – c. 45 m thick o Cadeby Formation (‘Lower Magnesian Limestone’) – c. 50 m thick o Lower Marl – c. 1.5-5 m thick o Basal Sand – may be absent
• Westphalian – c. 705 m thick � Series of coals, mudstones and sandstones � Main reservoir – Oaks Rock Sst – c. 425 m below OD
• Channel sands in braided stream environment, being typically between 3 m and <10 m deep
• Fluvial system around 5-10 km wide flowing to SW • Namurian – c. > 710 m thick • Faulting
� Some at reservoir and Westphalian and pre Permian levels
198

� Mapped at surface at oilfield (NW-SE) and in subsurface from seismic reflection data (mainly NE-SW)
• Hatfield Fault (NE-SW) - downthrow circa 25-60 m • Trap – tilted anticlinal fault block • Main gas storage reservoir – late Westphalian B ‘Oaks Rock Sandstone’ at c. 425
m below OD in crest of anticlinal trap o 7.6-27.4 m thick o Porosity – 17.2-25.6% o Permeability – 21-1100 mD o Original reservoir pressure – c. 650 psi (4.5 MPa or 45 bar), c.600 psi in
Hatfield West (Ward et al., 2003) • General Westphalian channel dimension data for the East Midalnds oil province -
refer Figs 13&14 and Appendix 3 • Borehole density - �6 exploration and development wells to reservoir horizon
i. 11 km square – circa 756 1. 37 greater than 50 m 2. 26 greater than 100 m 3. 719 less than 50 m 4. 730 less than 100 m
ii. 3 km buffer – circa 600 in 3 km buffer = c. 99 km2
1. 34 greater than 50 m 2. 24 greater than 100 m 3. 566 less than 50 m 4. 576 less than 100 m
iii. 1 km buffer – 144 boreholes in 30 km2
1. 12 greater than 50 m 2. 7 greater than 100 m 3. 132 less than 50 m 4. 137 less than 100 m
• Fields within 3 km – 1 (Hatfield West), accumulations separated by NE-SW Hatfield Fault
• Nearest major town/city – Doncaster – c. 5 kms to W
Westphalian sandbodies – dimensions and depositional setting in the southern North Sea,
eastern and northern England
A major depositional basin, the Pennine Basin, existed in Britain during Silesian times (Namurian and Westphalian), formed as a result of major crustal rifting processes in mainly Dinantian and early Namurian times. The Pennine Basin, within which a number of smaller sub basins were formed, lay to the north of the Wales–Brabant Massif and extended northwards towards the Southern Uplands of Scotland (Guion & Fielding, 1988; Collinson, 1988; Martinsen et al., 1995) and was gradually filled by enormous volumes of siliciclastic sediment (sandstones, conglomerates, siltstones, mudstones) and coals, which now form the Westphalian Coal Measures. The dominant source of this sediment, supplying by far the greatest volumes to the area throughout the Carboniferous, lay to the north. The SNS basin represented the eastern extension of this major depocentre to which several sources supplied sediment with a diminishing number of channels penetrating the basin centre with time. The sediment patterns indicate that sediment was introduced to the onshore UK coalfield areas from a northerly source lying to the north of the concealed and residually buoyant Market Weighton Block, and through quite a narrow major channel feeder route located in the region of the present day Humber (Collinson et al., 1993). Some sediment was locally derived and supplied to the basin from the London Brabant Massif to the south in a narrow strip along the southern margin of the basin.
199

Many studies have been published on Westphalian channel dimensions, but these tend to be specific papers dealing with specific channels. Fewer papers (e.g. Guion & Fielding, 1988; Collinson et al., 1993; Rippon, 1996) deal with the broader picture. In general, Westphalian sediments onshore in the UK were deposited across virtually the entire basin in a broad flat delta plain environment (see e.g. Fielding, 1984). Initial sedimentation in early Westphalian A times took place in a shallow water delta/lower delta plain setting (Fig. 14), where delta lobes built out across the basin into a body of water 10-50 m deep. The deltas were fed by major low sinuosity distributary channel belts across the lower delta plain area and delta fronts were wave-influenced, locally, having been reworked to form elongate shoreline deposits after abandonment of the delta lobes. Major distributary channels were the main pathway of sediment dispersal across the delta plain and these fed a hierachy of low energy, low gradient minor distributary channels and crevasse (splay) systems, depositing sediment in shallow lakes. Major distributary channels deposited elongate sand bodies, whilst interdistributary bays and lakes were infilled by crevasse splays/deltas and overbank deposits (Guion & Fielding, 1988). During Westphalian A times, the lower delta plain /shallow water delta environment gradually changed such that by mid Westphalian A times, the majority of sedimentation across the basin was in an upper delta plain environment that continued to Upper Westphalian B times (Guion & Fielding, 1988). In late Westphalian B times there was probably a brief return to lower delta plain environments. This change from lower to upper delta plain environment is reflected in the upward transition from broad, coarse-grained, low sinuosity channel belts to more sinuous, narrow, finer-grained major distributary channels.
As alluded to, the majority of the Westphalian A and B rocks were deposited in an upper delta plain environment, generally isolated from marine processes. Major distributary channels of variable sinuosity forming sandy channel belts mostly up to 5 km wide, were the main pathway for sediment dispersal (Fielding, 1984, 1986; Guion & Fielding, 1988). There was regular switching of major distributaries, often within narrow belts. Channel dimensions are described in more detail in section 5.2.3.2.
Within the Westphalian sequences, the vast majority of sandstone channels are of fluvial origin (deposited in a large river system). A study of Carboniferous sequences in wells both onshore and offshore in the SNS reveals (Fig. 13) that the thickest channel sandstone bodies (35-40 m) are over 10 km wide, whilst most of the thinner sandstone bodies (<10 m) are likely to have widths of 100 m or less (Collinson et al., 1993; Guion et al., 1995; Aitken et al., 1999). It is perhaps significant that almost all of the sandbodies over 20 m in thickness were thought to have been deposited as multi storey units. As indicated above, the Westphalian A succession is sandstone rich, whilst the Westphalian B is a relatively sand-poor interval. Sandstone channel thicknesses increase again in Westphalian C/D times. Very often channel sandstone architecture indicates broader channels in early Wesphalian A times, becoming with time narrower and stacked either vertically or diagonally, during late Wesphalian A and B times. The presence of such thicker and elongate sand bodies parallel to faults indicates some sort of structural control on the location of the channels that were funnelled into structural lows across the delta plain (Fielding, 1984).
Within many stratigraphic intervals, channel sandbodies show gradual reductions in thickness across three domains. This represents a passage not only outwards from the sedimentation (channel belt) axis, but also from north to south as lesser volumes of sediment were transported to more distal areas at the delta front. In such areas the gradient was lower and the channel systems split into distributary networks of smaller channels of decreasing size. Clearly, sedimentation/channel axes were controlled by underlying structures. Where an increase in the proportion of individual channels sandbodies in the sequence occurs, this can lead to an increase in the probability of stacking, the creation of multi storey sandbodies and thus greater thicknesses of sandstone (Bridge & Leeder, 1979; Collinson et al., 1993). Within the depositional systems, systematic downstream changes of channel dimensions are the result of the existence of distributary channel networks across the delta.
200

A relationship exists between channel width and thickness (Fig 13), with the maximum width being around 30 km and maximum thickness being 40-50 m (but up to 100 m where sandbodies are amalgamated). Additionally, the data illustrate that 90% of channel sandbodies are less than 25 km wide and less than 40 m thick and that generally, reservoir intervals greater than 30 m will extend for more than 10 km perpendicular to the palaeoflow direction (Aitken et al., 1999). There is also a 35% probability of penetrating a relatively poor reservoir zone within the main channel belt, due to fine grained horizons interpreted to be partial abandonment channel reaches. By their nature and origin, these are difficult to correlate and may form potential baffles of up to several hundred metres in extent within the channel sandstone reservoirs.
Channel sandstones comprising the late Westphalian B Oaks Rock reservoir in the Hatfield Moors gas storage facility have been cored extensively and channel parameters deduced (Ward et al., 2003). Typically, the Oaks Rock reservoir thickness is between 14 m and 26 m thick, with individual channel sands indicate that internal channels were < 10 m deep and more generally around 3 m deep. From outcrop work on Upper Carboniferous (Namurian and Westphalian) sequences (Aitken et al., 1999; Hampson et al., 1999), these dimensions would suggest an overall channel thickness of around 30 m and a width of 5-10 km (Ward et al., 2003).
Westphalian channel settings and sizes are summarised in Fielding (1984), Guion et al. (1995) and Aitken et al. (1999) and are (Fig. 14):
• proximal/lacustrine delta – 1-10 km wide with lobate to sheet-like deposits generally < 8 m thick.
• Major channels – 10’s kilometres long, 1-20 km wide and typically 8-20 m thick
• Minor channels – up to 10 kilometre long, 10-1 km wide and typically 1-8 m thick
• Overbank deposits – elongate belts parallel to channels. Dimensions depend upon channel sizes, typically 1-8 m thick and 10’s m wide
• Crevasse splay – minor delta developments along main channel resulting from overbank flow. Circa 1 km wide and 0-1 m thick, thinning away from channel centre
NE England
1. General geological sequence in areas of main potential Caythorpe scenario (Fig. 50):
• Upper Cretaceous Chalk – c. 225-230 m thick • Lower Cretaceous - c. 21 m • Jurassic
o Kimmeridge Clay – c. 310-415 m thick o Corallian – c. 50-65 m thick o Kellaways & Estuarine series – 275-285 m thick o Lias Group – 120-205 m
• Triassic – 485-700 m thick o Penarth group – c. 6-7 m thick o Mercia Mudstone Group – c. 30-280 m thick o Sherwood Sandstone Group – c. 145-324 m thick
• Permian – total 500-525 m thick � Staintondale & Eskdale groups (Upper marls, anhydrites & halites) – c.
35-95 m thick � Brotherton Formation (‘Upper Magnesian Limestone’) – c. 40-75 m
thick � Middle Marls, anhydrites & halites – c. 92-440 m thick � Cadeby Formation (‘Lower Magnesian Limestone’) – c. 10-15 m thick
201

� Lower Marl – c. 3-5 m thick � Basal Sand (Upper Rotliegend) – c. 18-35 m thick
o Carboniferous (Westphallian ‘A’) – > 153 m • Faulting –
o Close to E-W trending Vale of Pickering-Flamborough Head Fault Zone (Kirby & Swallow, 1987)
� Likely at reservoir level � Some apparent in the Chalk and to surface
o Present in one borehole faulting Sherwood Sandstone Group against late Zechstein at c. 1672 m depth
o Appear to stop at base Chalk on seismic reflection data – but may be present as sub seismic resolution faults in the field
• Borehole density – minimum of 2 exploration/development wells (C-1 & C-2) to the reservoir horizon. C-2 deviated strongly (42º) to west of C-1
� 11 km square – circa 168 • 33 greater than 50 m • 3 greater than 100 m • 132 less than 50 m • 162 less than 100 m
� 3 km buffer – circa 68 boreholes in 56 km2
• 15 greater than 50 m • 3 greater than 100 m • 52 less than 50 m • 64 less than 100 m
� 1 km buffer – 13 boreholes in 42 km2
• 2 greater than 50 m • 2 greater than 100 m • 11 less than 50 m • 11 less than 100 m
• Reservoir(s) o Kirkham Abbey Formation – (dolomitic) oolitic lsts - shelf deposits – from c.
1748 m - 2090 m depth � Porosity – average porosity of 15% (IEA, 1999), mainly network of fine
fractures and vuggy dolomitic porosity � Permeability - bulk rock low – may be fissure dominated � Average water saturation of 40% � Original reservoir pressure - 2,835 psia (19.6 MPa or 196 bar) � Gas had an H2S content of around 5 parts per million (ppm) � Tested for 30 hours in well C-2 at up to 8 Million Standard Cubic Feet
per Day (MMscfd) from a 13 m o Early Permian Rotliegend (Leman Sandstone equivalent) sands? – c. 1829 m -
2135 m depth � Environment of deposition – regionally extensive basin margin deposits
and representing dune sands� 2 sections to reservoir interval –
• upper – best properties c. 100 mD. On extended test from a 3 m interval near the top of the reservoir tested at rates up to 10 MMscfd
• lower – less favourable properties c. 20 mD. Tested at 1.0 MMscfd for 4 hours from a 3 m interval
� Porosity – av 18 % (10-24 for Southern North Sea fields) � Permeability – 20-100 mD (1-1000, av 30 mD for Southern North Sea
fields)
202

� Average water saturation of 31% � Original reservoir pressure – 2,969 psia (20.5 MPa or 205 bar) � Gas production form Rotliegend reservoir(s) only (IEA, 1999) � Rotliegend gas has no reported H2S content � mapped closure is approximately 213 acres for the Rotliegend
• Fields within 3 km - none
2. General geological sequence in areas of main potential Kirby Misperton-Marishes scenario (Fig. 50):
o Upper Cretaceous Chalk – absent, but present at crop c. 4-11.5 km to SE o Lower Cretaceous - absent, but present at crop c. 4-11.5 km to SE o Jurassic – total thickness c. 630-935 m
� Kimmeridge Clay – at crop c. 85-300 m thick � Corallian – c. 15-50 m thick � Oxford Clay – c. 50-55 m thick � Kellaways & Estuarine Series – c. 120-190 m thick � Lias Group – c. 60-380 m
o Triassic – c. 325-465 m thick � Penarth Group – c. 10 m thick � Mercia Mudstone Group – c. 160-190 m thick � Sherwood Sandstone Group – c. 150-265 m thick
o Permian – total c. 375-430 m thick • Upper marls, anhydrites & halites – c. 60-70 m thick • Upper Magnesian Limestone – c. 15-27 m thick • Middle Marls, anhydrites & halites – c. 290-330 m thick • Lower Magnesian Limestone – c. 25-35 m thick • Lower Marl – c. 3-5 m thick • Basal Sand – c. 3-5 m thick
o Carboniferous (Namurian) – > 125 mo Faulting –
� Close to E-W trending Vale of Pickering-Flamborough Head Fault Zone (Kirby & Swallow, 1987) – faults mapped at crop c. 2.5-6 km to south
• Likely at reservoir level • Present at crop faulting Kimmeridge Clay against limestones of
the Corallian Group – c. 10-50 m throw. � Mapped at surface
o Borehole density – 2 to 3 exploration/development wells to reservoir horizon � 11 km square – c. 178
• 33 greater than 50 m • 3 greater than 100 m • 132 less than 50 m • 162 less than 100 m
� 3 km buffer – circa 100 boreholes in 63 km2
• 10 greater than 50 m • 9 greater than 100 m • 89 less than 50 m • 90 less than 100 m
� 1 km buffer – 20 boreholes in 42 km2
• 5 greater than 50 m • 4 greater than 100 m • 15 less than 50 m • 16 less than 100 m
203

o Reservoir(s) � Kirkham Abbey Fm - (dolomitic) oolitic lsts shelf deposits
• Porosity - low (< 5%), mainly network of fine fractures and vuggy dolomitic porosity
• Permeability - bulk rock low - fissure dominated? • Original reservoir pressure – not available • Depth c. 1556 m below OD
� Early Permian Rotliegend (Leman equiv.) sands secondary reservoir? • Environment of deposition – basin margin deposits = dune sands • Porosity – 10-24 (av 15) % (based upon Southern N Sea fields) • Permeability – 1-1000 (av 30) mD based upon Southern N Sea
fields) • Depth c. 1591 m below OD • Original reservoir pressure – not known
� Namurian clastic delta (Fraser & Gawthorpe, 2003) – Follifoot Grits, but little information available
• Depth c. 1593 m below OD o Fields within 3 km – 1 o Nearest major town/city – Bridlington c. 5 kms to E
Southern Britain
Humbly Grove scenario scenario – northern Weald Basin – Figs 51&52
General geological sequence in areas of main potential:
• One of a cluster of 4 closures and associated fields • Main reservoir - Great Oolite Limestone (Bathonian; Middle Jurassic) - 2 distinct upper
and lower units separated by permeability barrier • Original reservoir pressure – 1480 psi (10.2 MPa or 102 bar) • Porosity – av. 18%, range 6-28% • Permeability - 20-2000 mD (zone 1) and 0.5-2 mD (zone 2) • Oil gravity/density - 39° API • Faulting – E-W trending horst block, fault bounded to north and south • Faults affect
o Reservoir and caprock sequences o Appear to stop at base Chalk but may be present as sub seismic resolution faults
in the field • Borehole density - �13 deviated wells drilled between Mar 1985 & May 1986 from 3
sites, 3 others (2 horizontal from existing wells) between 1994-1996. Further wells drilled for conversion to gas storage between 2003-05
� 11 km distance – circa 2200 • 230 greater than 50 m • 95 greater than 100 m • 2058 less than 50 m • 2190 less than 100 m
� 3 km buffer – circa 264 boreholes in 170 km2
• 67 greater than 50 m • 32 greater than 100 m • 197 less than 50 m • 230 less than 100 m
� 1 km buffer – 65 boreholes in 65 km2
• 33 greater than 50 m • 20 greater than 100 m
204

• 32 less than 50 m • 44 less than 100 m
• Fields within 3 km – 2 = satellite structure (Herriard and Hesters Copse) • Nearest major town/city – Basingstoke (4 km to NW), Aldershot (10 km) and Guildford
(20 km) to E
Storrington scenario – southern Weald Basin – Fig. 51
• Cretaceous – o U Cretaceous Chalk – thin or absent at crop o Lower Cretaceous – c. 486 m thick
� Lower Greensand – c. 35 m thick � Weald Clay – c. 195-200 m thick � Wealden Group – c. 250-440 m thick
• Incl. Weald Clay – c. 195-200 m thick o Jurassic – c. 1500 m
� Purbeck – c. 175 m � Portland – c. 44 m � Kimmeridge Clay – c. 394 m � Corallian – c. 143 m � Oxford Clay – c. 153 m � Kellaways Beds – c. 14 m � Great Oolite Group – c. 86 m � Fullers Earth – c. 59 m � Inferior Oolite – c. 228 m � Lias – c. 215 m
o Triassic - > 105 m � Penarth Group – c. 14 m � Mercia Mudstone Group - > 91 m
• Trap – northerly tilted fault block – down-south fault defines southern margin of field – c. 45-50 m throw
• Faults affect reservoir and (Jurassic) caprock sequences • Reservoir – Great Oolite Group (Middle Jurassic) • Original reservoir pressure – 1758 psi (12.1 MPa or 121 bar) • Porosity – av. 13%, range 6-26% • Permeability – av. 5, range 0.1-2000 mD • Oil gravity/density – 39.04° API • Borehole density – �6 exploration and development wells
� 11 km distance – circa 527 • 103 greater than 50 m • 31 greater than 100 m • 426 less than 50 m • 499 less than 100 m
� 3 km buffer – circa 339 boreholes in 88 km2
• 65 greater than 50 m • 18 greater than 100 m • 276 less than 50 m • 325 less than 100 m
� 1 km buffer – 48 boreholes in 24 km2
• 10 greater than 50 m • 6 greater than 100 m • 42 less than 50 m • 46 less than 100 m
205

• Fields within 3 km – none • Nearest major town/city – Chichester c. 17 km to SW, Horsham c. 14.5 km to NE
NW England
Elswick gasfield scenario – Fig. 53
General geological sequence in areas of main potential:
• Triassic o Mercia Mudstone Group – c. 320 m o Sherwood Sandstone Group
� Above silicified zone – c. 315-320 m � Below silicified zone – c. 205-210 m
• Permian o Manchester Marls – 190-195 m o Collyhurst Sandstone (reservoir; IEA, 1999) – c. 550-560 m (at c. 1015 m BOD)
� Porosity – c. 5.6% � Permeability - < 1 mD � Water saturation – c. 60% � Reservoir stimulation undertaken in 1993 - retested for 80 hours at 0.2
MMscfd from a 29 m interval. • Carboniferous - > 20 m • Faulting/Structure
o Faulted anticline in graben bounded by two N-S faults o Faults mapped at surface affecting Mercia Mudstone Group - however, area
heavily drift covered and actual surface locations may be subject to revision o Area of closure circa 997 acres (IEA, 1999) o intragrabenal faulting in crestal area (1-3 km2) – penetrate reservoir and to surface
• Borehole density – at least 1 exploration and development well to reservoir horizon � 11 km buffer
– circa 280 boreholes • 18 greater than 50 m • 13 greater than 100 m • 262 less than 50 m • 267 less than 100 m
� 3 km buffer – circa 84 boreholes in 72 km2
• 9 greater than 50 m • 7 greater than 100 m • 75 less than 50 m • 77 less than 100 m
� 1 km buffer – 65 boreholes in 20 km2
• 2 greater than 50 m • 2 greater than 100 m • 13 less than 50 m • 13 less than 100 m
• Reservoir – Permian Collyhurst Sandstone – often conglomeritic and pebbly, generally tight (IEA, 1999), top mapped at around 1015 m BOD (IEA, 1999)
• Original reservoir pressure – 1685 psia • Fields within 3 km – none • Nearest major town/city – Blackpool c. 6 km to W, Kirkham c. 2.5 km to S, Preston c. 10
km to SE
206

Salt cavern scenarios
Cheshire Basin (Fig. 54)
General geological sequence in areas of main potential:
• Drift – variable and often thick (c. <5-92 m, averaging 20-45 m thick), with rockhead in places below sea level and known to be between 30 and 60 m below sea level in some areas. Includes:
o Alluvial – river and estuarine alluvium o peat o glacial
� boulder clay � sand, gravel and laminated clays
• Jurassic o Calcareous Liassic mudstones – up to 130 m thick o only present in southern Cheshire Basin around Wem, Jurassic not present in
North around Byley
• Mercia Mudstone Group o Brooks Mill Mudstone Formation – variable thickness preserved and not present
in the north around Byley developments o Wilkesley Halite Member – variable thickness (up to c. 100m) and variably
affected by wet rockhead conditions – sometimes represented by collapse breccia o Wych Byley Mudstone members – up to 580 m thick.
� Tight silty claystone � Some halite as recrystallised ‘clusters’ � King Street Fault intersected in the mudstones by boreholes drilled in
1980s. Fault plane found to (Buetal, 2002): • cause no loss of drilling mud circulation • no indication of the fault in behaviour of the drilling equipment • be indistinguishable from adjacent (country) rock
o Northwich Halite Member – up to 290 m thick � Intermittent marl (mudstone) and salt-bearing marl interbeds � Up to 10.8 m thick (‘30 Foot’ Marl) � Typically contain a certain amount of swelling clays
o Bollin Mudstone Member – 260-460 m thick � Tight silty claystone � Some halite as recrystallised ‘clusters’
o Tarporley Siltstone Formation – approximately 20-250 m thick • Sherwood Sandstone Group
o Helsby Sandstone Formation – approximately 20-200 m thick o Wilmslow Sandstone Formation – c. 200-425 m thick
• Wet Rockhead (refer Fig. 11) – variable but extends from around 60 m to 122-155 m, extreme local incidents of perhaps 180 m are reported (Howell, 1984; Cooper, 2002)
o ‘Brine runs’ and subsidence features – � Linear and branching
• 0.5-1.5 km long • 7.5-10 m deep • 65-75 m wide
� Circular/crater • Faulting
207

o Down-west Wem-Red Rock basin bounding fault to east (c. 14.5-17 km) o Down-east King Street Fault to west (c. 0.5-2 km) o Little other faulting known in proposed area
• Borehole density (based upon Byley – but likely to be unrepresentative – depth not assigned in database – 103 confidential ICI boreholes at Holford Brinefield; depth likely to be >100 m)
� 11 km distance – 1438 boreholes (unrepresentative – depth not assigned in database – 103 confidential ICI boreholes at Holford Brinefield; depth likely to be >100 m)
• 74 greater than 50 m (unrepresentative – depth not assigned in database – 103 confidential ICI boreholes at Holford Brinefield; depth likely to be >100 m)
• 29 greater than 100 m (unrepresentative – depth not assigned in database – 103 confidential ICI boreholes at Holford Brinefield; depth likely to be >100 m)
• 1364 less than 50 m - unrepresentative due to confidential boreholes
• 1408 less than 100 m - unrepresentative due to confidential boreholes
� 5 km buffer – circa 794 boreholes in 81 km2
• 22 greater than 50 m (unrepresentative – depth not assigned in database – 102 confidential ICI boreholes at Holford Brinefield; depth likely to be >100 m)
• 12 greater than 100 m (unrepresentative – depth not assigned in database – 102 confidential ICI boreholes at Holford Brinefield; depth likely to be >100 m)
• 772 less than 50 m • 781 less than 100 m
� 3 km buffer – circa 247 boreholes in 36 km2
• 3 greater than 50 m (unrepresentative – depth not assigned in database – 102 confidential ICI boreholes at Holford Brinefield; depth likely to be >100 m)
• 3 greater than 100 m (unrepresentative – depth not assigned in database – 102 confidential ICI boreholes at Holford Brinefield; depth likely to be >100 m)
• 3 less than 50 m - unrepresentative due to confidential boreholes • 3 less than 100 m - unrepresentative due to confidential boreholes
� 1 km buffer – 2 boreholes in 1 km2
• 0 greater than 50 m • 0 greater than 100 m • 2 less than 50 m • 2 less than 100 m
• Oil/gasfields within 3 km – none • Other salt cavern facilities within 3 km – 1 operational, 2 planned • Nearest major town/city – Northwich (NW), Winsford (SW) & Middlewich (S) c. 0.5-7
km from general area of proposed sites
Byley (Beutal, 2002) – Figs 54&55:
• c. 2.5 km south of Holford Brinefield caverns • Eight caverns in Northwich Halite • Depths of between 630-730 m below ground level • Up to 180 m of salt above top of caverns
208
• Maximum cavern height 100 m • Maximum cavern diameter 90 m • Operating pressures of between 35 and 105 bar (3.5/10.5 MPa or 508/1523 psi) • Spacing between wellheads – 280 m • 300 m or more of Triassic Bollin Mudstone below the Northwich Halite • Contains compacted intermittent marls, including 30 Foot Marl in lower third of salt
sequence (Figs 54&55) • Marl beds in salt
o Not soluble o become soft, crumble and fall down to base of cavern during solution mining
• no indications of wet rockhead conditions within 1.5 kms • King Street Fault – no evidence for water circulation or connection between differing
structural levels
Holford
• Same geological conditions as per Byley, but taking into account the different depths to Northwich Halite
• Cavern depths c. 370-440 m below ground level
Stublach:
• 2 kms from Byley site • Same geological conditions as per Byley, but taking into account the different depths to
Northwich Halite • Caverns in Northwich Halite • Bell shaped • About 100 m in height • Top of caverns c. 500-550 m below ground • 28 caverns in a 475 hectare (4.75 km2) site
Nearest major town/city to Byley, Holford and Stublach facilities - Northwich (NW), Winsford (SW) & Middlewich (S) c. 0.5-7 km from general area of proposed sites
Hole House (Fig. 55) – Warmingham Brinefield
• Same geological conditions as per Byley, but taking into account the different depths to Northwich Halite
• Cavern depths c. 300-400 m below ground level • Faulting – down-east King Street Fault to east c. 1 km • Borehole density – Warmingham saltfield close by – c. 0.5 km to east
� 11 km distance – c. 655 • 56 greater than 50 m (unrepresentative – depth not assigned in
database – confidential ICI boreholes at Warmingham Brinefield; depth likely to be >100 m)
• 42 greater than 100 m (unrepresentative – depth not assigned in database –confidential ICI boreholes at Warmingham Brinefield; depth likely to be >100 m)
• 598 less than 50 m - unrepresentative due to confidential boreholes • 613 less than 100 m - unrepresentative due to confidential
boreholes � 3 km buffer – circa 100 boreholes in 36 km2
209

• 6 greater than 50 m (unrepresentative – depth not assigned in database –confidential ICI boreholes at Warmingham Brinefield; depth likely to be >100 m)
• 5 greater than 100 m (unrepresentative – depth not assigned in database –confidential ICI boreholes at Warmingham Brinefield; depth likely to be >100 m)
• 93 less than 50 m - unrepresentative due to confidential boreholes • 95 less than 100 m - unrepresentative due to confidential boreholes
� 1 km buffer – 19 boreholes in 1 km2 – all confidential and thus depths not known
NW England
Preesall – Fig. 56
General geological sequence in areas of main potential:
• Mercia Mudstone Group (greater than 800 m thick) o glacial drift deposits – variable thicknesses between o Possible halite solution breccia (=Wilkesley Halite – variable thickness max of a
few metres thick, if present) o Breckles Mudstone and Coat Walls Mudstone members (=Wych Byley Mudstone
Fm) – 200-360 m thick in total. � Tight silty mudstones and claystones � Some halite as recrystallised ‘clusters’ � Infilled fractures – halite and gypsum (refer Fig. 10a)
o Preesall Halite Member – 200 to approximately 500 m thick � Thinner to east over worked part of brinefield, being 100-130 m thick in
east against Preesall Fault Zone � Intermittent marl (mudstone) and salt-bearing marl interbeds – in region of
development. These are generally only thin mudstone and anhydrite interbeds are present, but
• three more prominent zones of salt and non-salt interbeds 5 m, 6.19 m and 6.54 m thick were encountered
• with the maximum individual non-salt bed thicknesses in these zones between 1.04 m and 1.76 m
� Marl interbeds thicken slightly to east against the Preesall Fault, circa 1-1.5 km away
• Thin partings up to 2.1 m thick, accounting for only 7 m thickness (12-13%) in a total thickness of 180 + m on western edge of brinefield.
• ‘anecdotal’ evidence of individual bed being circa 17.5 m thick in old (poorly documented) mineshaft records
o Thornton Mudstone Member – average 113 m thick o Singleton and Hambleton Mudstone formations (=Bollin Mudstone & Tarporley
Siltstone Fm) – up to 311 m and 37 m thick respectively � Contains two halite beds
• Mythop Halite – c. 0-50 m • Rossall Halite – c. 0-11 m
� Tight silty claystone/mudstone � Some halite as recrystallised ‘clusters’
• Sherwood Sandstone Group – thought to be greater than 500 m thick • Faulting – 2 main graben bounding faults, some intragraben faulting, more to the south
(Fig. 56a) than to the north (Fig. 56b)
210

• Borehole density – borehole data not fully representative –– confidential ICI boreholes at Preesall Brinefield & depth not assigned in database (depth likely to be >100 m):
� 11 km distance – c. 710 boreholes • 150 greater than 50 m • 142 greater than 100 m • 559 less than 50 m • 567 less than 100 m
� 3 km buffer – circa 395 boreholes in 36 km2
• 142 greater than 50 m • 136 greater than 100 m • 253 less than 50 m • 259 less than 100 m
� 1 km buffer – 155 boreholes in 16 km2
• 124 greater than 50 m • 123 greater than 100 m • 31 less than 50 m • 32 less than 100 m
• Oil/gasfields within 3 km – none • Other salt cavern storage facilities within 3 km – none • Other brine cavities – within 1 km • Brine cavern collapse structures – between 0.5 and 2 km to the east
Typical cavern information:
• Proposal for up to 20 (24 originally) caverns in Preesall Halite (equivalent of Northwich Halite in the Cheshire Basin)
• Depths to top of caverns of between 220-425 m below ground level • Probable maximum cavern height 55-290 m • Up to 50 m of salt above top of caverns • Salt thickness below cavern: 20% of max radius of cavern • Likely maximum cavern diameter: 100 m • Minimum salt pillar between caverns: 150 m (3 times cavern radius) • Distance of cavern from significant fault: 150 m (3x cavern radius) • Operating pressures of between
o Minimum – 25 bar (2.5 MPa or 363 psi) i.e. above 30% of the vertical component of overburden pressure
o Maximum - 75 bar (7.5 MPa or 1088 psi) i.e. below 83% of the vertical component of overburden pressure
• Subsidence estimates o Average rate of 0.2-0.3 mm per year, max being 0.5 mm (Ratigan) o Average rate of 0.4-0.8 mm per year, max being 1.4 mm (Kittitep)
• c. 460 m or more of Triassic Thornton Mudstone Member (113 m), Singleton (181-311 m) and Hambleton Mudstone (37 m) formations below the Preesall Halite
• Contains intermittent interbedded marls that to east may become thicker • Marl beds in salt not soluble • Wet rockhead conditions exist circa 1 km to east of site • Two main basin bounding faults juxtaposing
o impermeable strata over most of their lengths – may have salt associated with fault planes?
o To the east, the Preesall Fault Zone juxtaposes Sherwood Sandstone Group against Mercia Mudstone Group, some 2 kms from potential storage site.
o downthrow on Preesall Fault Zone is estimated to be greater than 500 m o Intervening ground has
211

� Old wells � Brine caverns - numerous � Wet rockhead conditions (in east) – subsidence hollows
o To west, Burn Naze Fault within 500 m. Throw is circa 400 m in south • Possible cavern spacing – 230 m between well head and well head • Oil/gasfields within 3 km – none • Nearest major town/city – Fleetwood (2 km to W) & Blackpool (c. 7 km to SW), Preesall
c. 2 km to E
Wessex Basin, southern England
Portland scenario - Fig. 57:
• Jurassic strata c. 820 m thick o Upper Jurassic – thin/absent o Middle Jurassic – 260 m plus
� Forest Marble – 35-40 m thick near top � Frome Clay and Fullers Earth – c. 210 m thick � Inferior Oolite – 5-10 m thick at base
o Lower Jurassic (Liassic) – c. 555-560 m thick � Bridport Sands (potential reservoir horizon) at top – 90-95 m thick � Thornecombe Sands and Junction Bed – c. 55 m thick (367-441 m) � Remainder mainly shales and clays
• Penarth Group – 50-55 m thick (818-869 m) o Limestone at top – c. 25 m thick
• Mercia Mudstone Group – total thickness of c. 1275 m o Upper mudstone unit c. 430 m o Saliferous beds
� Top c. 2000 m � Main halite (“S7”)
• Top – c. 2360 m below ground level • c. 135-140 m thick
� Mudstone interbeds increase towards base of saliferous beds • Sherwood Sandstone – c. 300 m • General gentle southerly dip to the succession from the Weymouth Anticline, axis being
1-2 km north of proposed Portland site • Faulting – present in ‘basement rocks’ beneath the salt beds and Mesozoic ‘cover rocks’.
Have probably evolved separately and only the main controlling Abbottsbury-Ridgeway Fault system shows any connection following faulting and tectonic thinning of the salt beds (salt weld – refer Stewart et al., 1996, Harvey & Stewart, 1998; Chadwick & Evans, 2005)
• Series of relatively small faults mapped at surface in core of the Weymouth Anticline, major Abbotsbury-Ridgeway Fault mapped between 5 and 11 km to the north of the proposed storage area
• Borehole density � 11 km distance – c. 1200 boreholes
• 83 greater than 50 m • 28 greater than 100 m • 1115 less than 50 m • 1171 less than 100 m
� 3 km buffer – circa 583 boreholes in c. 81 km2
• 22 greater than 50 m • 0 greater than 100 m
212

• 561 less than 50 m • 583 less than 100 m
� 1 km buffer – 537 boreholes in c. 64 km2
• 20 greater than 50 m • 0 greater than 100 m • 517 less than 50 m • 537 less than 100 m
• Cavern/operational details o Top of target cavern salt interval c. 2100-2365 m o Top of caverns – c. 2400 m o Cavern salt interval c. 135 m o Salt roof – c. 35 m o Cavern height – 100 m, comprising
� 80 m ‘useable’ height � 20 m sump
o Cavern bases – c. 2500 m o Cavern widths – 90 m o Number of caverns – 14-18 o Cavern spacing not known o Area of salt identified – c. 20 km2
o Operating pressures of between 130 and 350 bar (13/35 MPa or 1886/5076 psi) o Proposal is to operate in brine compensated mode (Egdon, 2007a) o Storage volume of each cavern – c. 70.8 Mcm (2.5 bcf) o One brine injection/withdrawal well o One gas injection/withdrawal well o Oil/gasfields within 3 km – none o Other Salt cavern storage facilities within 3 km – none
• Oil/gasfields within 3 km – none • Nearest major town/city – Weymouth < 2 km to N & NW
NE England
Hornsea and Aldbrough scenarios (Fig. 58)
Permian salts
• Operating pressures between 120 and 270 bar (Buetal, 2002) • Depth to top salt for caverns E England
o Atwick/Hornsea – 1730-1830 m o Aldbrough - 1800-1900 m o Saltholme - circa 340-420 m o Wilton – circa 650-680 m
General geological succession at Atwick/Hornsea:
• Drift – c. 20-30 m • Chalk – c. 500 m • Lower Liassic clays & thin limestones – 40-45 m • Rhaetic (hard shales) – 20-25 m • Mercia Mudstone Group – 285-295 m
o Micaceous sandstone at base – 12 m
213

• Sherwood Sandstone Group – 545-550 m o Lower Bunter shale at base – c.75 m
• Zechstein (total thickness of 530 m) o Anhydrites, salts and mudstones – c.100 m o Brotherton Formation (Upper Magnesian Limestone) – 70-75 m o Fordon Evaporites (storage interval) – 1665-1900 m (range). Lithologically
variable with westerly thinning and loss of halite not reaching rockhead (Gaunt et al., 1992; Gaunt, 1994; Berridge & Pattison, 1994)
� More easterly succession – thick basinward facies, deposited on basinal slope of underlying EZ2 carbonates (Kirkham Abbey Formation). Contains mainly halite with anhydrite dominating the thin upper and lower parts
� Westerly, thinner transgressive facies from the Kingston upon Hull region westwards, halite disappearing by the Goole, Doncaster Isle of Axholme area
• lowermost 8 m in the Risby borehole being massive anhydrite, containing layers of anhydritic dolomite and thin red silty mudstone
• rest of sequence 41 m thick, comprising halite with layers up to 3 m thick of anhydrite, dolomitic mudstone and some thin bituminous dolomitic limestone
• Grimsby-Patrington area, Fordon evaporites are 20-80 m thick, dominantly halite with some associated interbedded anhydrite. Thinning to 10-25 m thick in southwest of region, and passing laterally into thin red mudstones and siltstones with minor anhydrite. But few details available.
• To north into the North Allerton district, the Fordon Evaporites again thin and show lithological change laterally towards the Permian crop line, with loss of the halite units (Smith, 1994; Frost, 1998)
o Lower Magnesian Limestone – 85-90 m • Rotliegend (sandstone) – 25-30 m • Carboniferous (firm-hard coarse sst) - >8.5 m • Faulting – none mapped at surface • Boreholes
� 11 km distance – c. 295 boreholes • 35 greater than 50 m • 9 greater than 100 m • 258 less than 50 m • 286 less than 100 m
� 3 km buffer – circa 93 boreholes in 35 km2
• 17 greater than 50 m • 4 greater than 100 m • 76 less than 50 m • 89 less than 100 m
� 1 km buffer – circa 48 boreholes in 16 km2
• 8 greater than 50 m • 4 greater than 100 m • 40 less than 50 m • 44 less than 100 m
• Top of target cavern salt interval c. 1720-1820 m • Cavern salt interval c. 135 m • Maximum cavity diameter/height – c. 90 m and 90 m
214

• Salt above cavity/below cavity – 40 m (including 10 m anhydrite)/40 m • Number of caverns – 14-18 • Spacing between wellheads - > 400 m • Operating pressures of between 120 and 270 bar (12/27 MPa or 1741/3916 psi) • Oil/gasfields within 3 km – none • Nearest major town/city – Hornsea c. 2.5 km to S, Hull c. 17 km to SW (updip)
General geological succession at Aldbrough same as Atwick
• Boreholes slightly different: � 11 km distance – c. 633 boreholes
• 34 greater than 50 m • 6 greater than 100 m • 603 less than 50 m • 631 less than 100 m
� 3 km buffer – circa 30 boreholes in 21 km2
• 0 greater than 50 m • 0 greater than 100 m • 30 less than 50 m • 30 less than 100 m
� 1 km buffer – circa 1-5 boreholes in 9 km2
• 0 greater than 50 m • 0 greater than 100 m • 1-5 less than 50 m • 0 less than 100 m
• Nearest major town/city – Hornsea c. 8 km to N, Hull c. 11.5 km to SW (updip)
Wilton and Saltholme scenarios
General geological succession Wilton (Kirkleatham Bh):
• Lower Jurassic at crop – c. 125-150 m • Triassic – c. 475 m thick
o Penarth Group – c. 15-20 m thick o Mercia Mudstone Group – c. 250-255 m thick o Sherwood Sandstone Group – c. 205-210 m thick
• Permian – c. 355 m thick o Upper marls, anhydrites - c. 67 m thick o Main (Boulby) halite (host salt for caverns on Teesside, NE England) – c. 50 m
thick o Permian Magnesian Limestone – c. 230 m thick
• Carboniferous – > 177 m • Faulting – some faults mapped at surface within 3-4 km of Wilton facilities • Operating pressures: not known • Boreholes
o 11 km distance – circa 6500 within 11 km of general area likely • 209 greater than 50 m • 119 greater than 100 m • 6303 less than 50 m • 6393 less than 100 m
o 3 km buffer – circa 1530 boreholes in 3 km of general area likely • 33 greater than 50 m • 15 greater than 100 m • 1497 less than 50 m
215

• 1515 less than 100 m o 1 km buffer – circa 3294 boreholes in 1 km of the general area likely
• 121 greater than 50 m • 83 greater than 100 m • 3173 less than 50 m • 3211 less than 100 m
• Nearest major town/city – Teesside (Middlesbrough) developed above and around the Saltholme site, and c. 2 km to W of Wilton site
General geological succession Saltholme (Kirkleatham Bh) - refer Wilton area
• Sherwood Sandstone Group and thin Mercia Mudstone Group at crop• Faulting –
o some faults mapped at surface within 4.5-8.5 km N of likely Saltholme area o some faults mapped at surface within 4.5 km W of likely Saltholme area o some faults mapped at surface within 7-8.5 km S of likely Saltholme area
• Boreholes o 11 km distance – circa 7650 within 11 km of general area likely
• 231 greater than 50 m • 132 greater than 100 m • 7417 less than 50 m • 7516 less than 100 m
o 3 km buffer – circa 4287 boreholes in 3 km of general area likely • 146 greater than 50 m • 99 greater than 100 m • 4141 less than 50 m • 4188 less than 100 m
o 1 km buffer – circa 2142 boreholes in 1 km of the general area likely • 109 greater than 50 m • 75 greater than 100 m • 2033 less than 50 m • 2067 less than 100 m
216

Appendix 8 Brief description of the presence of H2S in oilfields, the process of drilling an exploration well/injection well and unlined rock caverns
This Appendix provides a brief summary of the presence and dangers of H2S, the process of drilling a standard hydrocarbon exploration and production (or injection) well and the casing programs often undertaken. For more detailed information visit http://www.oilandgas.org.uk/issues/storyofoil/exploration-02.htm and http://www.glossary.oil field.slb.com/. There is also more detail relating to unlined rock caverns and storage of hydrocarbons.
Presence of H2S in oilfields
Oil and natural gas are the products of the thermal conversion of decayed organic matter (called kerogen) trapped in sedimentary rocks. Methane (CH4) is the main component of natural gas, comprising 70 to 90%, while other gaseous hydrocarbons, butane, propane, and ethane, account for up to 20%. Naturally occurring contaminants present in natural gas and which have to be removed at natural gas processing facilities, include water vapour, sand, oxygen, carbon dioxide, nitrogen, hydrogen sulphide (H2S) and rare gases such as helium and neon. High-sulphur kerogens release H2S during decomposition, which stays trapped within the oil and gas deposits and is frequently encountered in oilfields, often to high levels, as in west Texas (Schlumberger, 2007).
During oil exploration and production, H2S may enter drilling muds from subsurface formations and is also generated by sulphate-reducing bacteria in stored muds. Other sources of natural H2S emissions are volcanoes and geothermal sources such as hot springs. Natural gas, or any other gas mixture which contains significant amounts of H2S, is generally termed ‘sour’ if there are more than 5.7 milligrams of H2S per cubic meter of natural gas. This is equivalent to approximately 4 ppm by volume (http://www.naturalgas.org/naturalgas/processing_ng.asp). Although the terms ‘acid gas’ and ‘sour gas’ are often used interchangeably, a sour gas is any gas that contains H2S in significant amounts, whereas an acid gas is any gas that contains significant amounts of acidic gases such as CO2 or SO2. CO2 by itself, therefore, is an acid gas but it is not a sour gas.
The H2S is removed (‘scrubbed’) from the sour gas by a process commonly referred to as ‘sweetening’ at what are termed desulphurization plants. Removal of H2S is normally done by absorption in an amine solution, while other methods include carbonate processes, solid bed absorbents (including solid desiccants like iron sponges) and physical absorption. The ‘amine process’ (also called the Girdler process) is used in 95% of US gas sweetening operations (http://www.naturalgas.org/naturalgas/processing_ng.asp). In this process, sour gas is passed through a tower containing the amine solution, which has an affinity for sulphur and which absorbs it. Two main amine solutions are used: monoethanolamine (MEA) and diethanolamine (DEA). The emerging gas is virtually free of sulphur compounds and the H2S can be removed from the amine solution, allowing it to be reused to treat more sour gas.
The presence of H2S in an oilfield and, if exposed to the gas during oil and gas production, its possible impacts on human health, is a potential concern for potential UGS operators. H2S is a toxic, colourless gas that is odourless at high concentrations but has a smell of rotten eggs in low concentrations. Because H2S is heavier than air, it tends to accumulate in low-lying areas. It is an extremely poisonous gas and a few seconds of exposure in concentrations of anywhere between 750 and 10,000 ppm can prove lethal to people and animals. However, the effect of H2S depends
217

on duration, frequency and intensity of exposure and the susceptibility of the individual (Schlumberger, 2007: http://www.glossary.oilfield.slb.com/Display.cfm?Term=hydrogen%20 sulfide). Research conducted at the University of Southern California Medical Facility has established nervous system damage can occur even at concentrations in air as low as 1 ppm (Chilingar & Endres, 2005).
H2S is hazardous to rig workers and is also corrosive, causing sulphide stress-corrosion cracking of metals, which may require costly special production equipment such as stainless steel tubing. A recent study concluded that H2S “will eventually destroy the integrity of both the steel and cement relied upon to prevent gas migration, including abandonments performed to the current standards of the DOGGR [Division of Oil, Gas and Geothermal Resources]. The corrosive conditions of hydrogen sulphide are well known, and have defied engineering solutions.” (Chilingar & Endres, 2005). Whilst this may be an extreme conclusion, it highlights the importance of proper procedures and monitoring of the presence and effects of H2S on plant and infrastructure. H2S is a recognised problem, with established procedures to mitigate it.
Effects of H2S
H2S variously acts as an irritant or an asphyxiant, depending of the concentration of the gas and the length of exposure. The primary route by which humans are affected is inhalation, although it also affects the eyes. Essentially, H2S blocks cellular respiration, resulting in cellular anoxia, a state in which the cells do not receive oxygen and die. The human body detoxifies H2S by oxidizing it into sulphate or thiosulphate by haemoglobin-bound oxygen in the blood or by liver enzymes (Knight & Presnell, 2005; Skrtic, 2006). Lethal toxicity occurs when H2S is present in concentrations high enough to overwhelm the body’s detoxification capacity.
Some scientific references have reported exposure to concentrations of H2S as low as one part per million can affect the central nervous system, resulting in neuropsychological effects (e.g. Chilingar & Endres, 2005), however, there is not scientific consensus on this point (UNEP6: http://www.uneptie.org/pc/apell/disasters/china_well/china.htm#impacts). At levels up to 100 to 150 ppm, H2S is a tissue irritant, causing Keratoconjunctivitis (combined inflammation of the cornea and conjunctiva), respiratory irritation with lachrymation (tears) and coughing. Skin irritation is also a common symptom. Instantaneous loss of consciousness, rapid apnea (slowed or temporarily arrested breathing) and death may result from acute exposure to levels above 1,000 ppm (Knight & Presnell, 2005; Skrtic, 2006).
The non-lethal effects can be summarized as:
• neurological –symptoms including dizziness, vertigo, agitation, confusion, headache, tremors, nausea, vomiting, convulsions, dilated pupils, and unconsciousness,
• pulmonary – symptoms including cough, chest tightness, dyspnea (shortness of breath), cyanosis (turning blue from lack of oxygen), haemoptysis (spitting or coughing up blood), pulmonary oedema (fluid in the lungs), and apnea with secondary cardiac effects (Snyder et al., 1995).
Incident at Gasfield, Chongquing, China
An incident in China illustrates the potentially deadly effects of H2S release during production from a gasfield. The disaster took place at the Chuandongbei gas field in Gao Qiao town in the north eastern part of Chongqing province. The incident involved a gas well blowout, which occurred at 10:00 pm on Tuesday, 23 December 2003 and resulted in the release of natural gas and H2S. According to press reports, the accident occurred as a drilling team was working on the 400 meter deep well and sent toxic fumes (sour gas - a high concentration of natural gas and H2S) shooting 30 metres out of a failed well (UNEP: http://www.uneptie.org/pc/apell/disasters/
UNEP: United Nations Environment Programme
218
6

china_well/china.htm#impacts).
The China Daily newspaper described the tragedy as “the worst of its kind in China’s history”. “The poisonous gas hovering in the air made an area of 25 square kilometres a death zone, as many villagers were intoxicated by the fumes in their sleep”. Worst hit was the village of Xiaoyang next to the gas well, where 90% of the residents were killed, “many having died in their sleep or were too old to escape” (WSWS, 2003).
The incident was reported in Lloyd's Casualty Week for 23rd Jan 2003 as follows: “officers investigating a gas leak which killed 243 people in western China have arrested three oil company workers on suspicion of dismantling safety features and mishandling drilling equipment......one of China's worst industrial accidents.....the investigation has forced the resignation of a vice president of state owned China National Petroleum Corporation. .......The accident sent a deadly cloud of poisonous hydrogen sulphide over nearby villages in a poor mountainous area. Villagers died in their sleep or were struck down while trying to flee. More than 9,000 people were treated for injuries and 60,000 were forced to evacuate the area. Hospitals reported...... 396 were still being treated for injuries, several of them in critical condition.”
Many factors appear to have led to the release, most related to human error and poor operational and maintenance procedures, including operation under health and safety regulations that were far less stringent than those established in the UK. The differences in approach to the issues of health and safety in industrial activities is further is illustrated by China’s extremely poor record of coalmine disasters, but the incident nevertheless highlights the importance of awareness of the problem and correct planning.
The question arises as to how the consequences of an incident could be reduced. A gas well blowout represents an uncontrolled flow of gas, oil, or other well fluids from a wellbore (borehole) into the atmosphere. A blowout usually results from a combination of factors, such as human error and equipment failure. If, for any reason, blowout prevention procedures built into all modern wells drilled during oil and gas exploration and production fail, UNEP suggest the best action to reduce the impact is to immediately ignite the well. The ignition converts the H2S to sulphur dioxide, which disperses more effectively as the heat carries it upwards, resulting in lower concentrations at ground level. However, even if all prevention procedures are taken, there is no ‘zero risk’ in industrial operations and emergency planning for accidents should be in place, UNEP having suggested the following actions to reduce the impacts of potential accidents and blowouts:
• Keep people away from the source of the “accident”. Normally the population should be at a “safe” distance such that if an accident takes place, the distance itself will mean that the public do not receive a lethal dose. In this specific accident the population was as close as 50 metres to the site, which increased the number of people affected
• Respond to people in a quick and efficient way - how the first response to the accident is handled will determine the potential consequences
• Be prepared for the accident, which does not appear to have been the case in the case of the Chuandongbei incident
Drilling of exploration wells, casing and tubing
A drilling platform provides storage for the drilling equipment, the base from which the drilling is done and generates onsite power for the drilling operations. A drilling derrick rises above the drill floor, housing hoisting equipment that raises or lowers a drillstring. The latter comprises 30-foot (c. 10 m) lengths of drill pipe screwed together. At the bottom of the drillstring, drill collars (heavy pipe-sections) maybe screwed on to provide added weight to a drill bit, which can vary in size and type. The drill bit is rotated either by turning the whole drillstring ("rotary drilling") or by using a downhole turbine that rotates as drilling fluid is pumped through it. As the well is
219

drilled to the length of the drillstring, a new section of drill pipe is screwed onto the top of the drillstring and drilling recommences.
The action of the drill bit grinds up the rock into small chips of rock (“cuttings”). Drilling fluid (also called “mud”), which is mainly water-based, is pumped continuously down the drillstring while drilling. This acts as a lubricant and washes up the rock cuttings, which are brought to the surface by the circulating drilling fluid outside the drill pipe. The rock cuttings are used to determine the nature and the age of the rock types being drilled, and in exploration, the presence of hydrocarbons. Most importantly, however, the drilling fluids balance the pressure of fluids in the rock formations below to prevent blowouts caused by hitting pockets or layers of higher pressure. If the borehole is to go through halite (salt) beds then a drilling fluid that will not cause dissolution of the salt is used and is commonly a brine solution.
If laboratory tests are needed on potential reservoir or caprock, a solid core of rock can be drilled using a special hollow drilling bit of the same lengths as that of the normal drill pipe. Each length of core retrieved requires the entire drillstring to be pulled out of the well and then reinserted. Coring, therefore, represents an expensive operation, generally only undertaken when neccesary.
Important information on the type of rock drilled and the fluids it contains can be obtained either while actually drilling, or after drilling and before running casing. Electronic measuring devices (geophysical logging tools) are lowered into the well - either while drilling (as part of the drillstring) or after drilling on “wireline”, permitting various types of measurement that give indications of rock type and porosity and the presence of oil or gas. Other devices measure wellbore (borehole) diameter, dip of strata and the direction of the hole. Cores of rock from the borehole (side)walls can also be taken from deep underground.
After the hole is drilled to a given depth, a steel pipe (casing) slightly smaller than the hole is placed down the hole and is secured with cement. The casing provides structural integrity to the newly drilled wellbore in addition to isolating potentially dangerous high pressure or chemically differing zones from each other and from the surface. In salt beds, casing can be inserted from above to below the top of the salt. This protects the upper salt beds as drilling continues into the underlying formations with fluids that might otherwise dissolve the salt.
Once the zones are safely isolated and the formation protected by the casing, the well can be drilled deeper with a smaller bit and also then cased with a smaller size casing. It is not uncommon for modern wells to have between two and five sets of progressively smaller hole sizes, each cemented with casing.
Well completions - casing and casing string
All wells, including those drilled for producing water or hydrocarbons, at least when first drilled have openhole sections, but may be completed in a number of ways. Rarely, where no freshwater zones exist or the borehole remains in a stable condition after drilling (i.e. suffers no collapse or breakouts), the geology allows openhole completion. More usually, something has to be placed down the borehole, either during or immediately after drilling, to isolate zones and stabilise the borehole, preventing collapse. This may range from as little as a packer on production tubing above an openhole completion, to casing with or without a system of mechanical filtering elements outside a perforated pipe section. There are also what are known as "intelligent" completions, comprising a fully automated measurement and control system that optimises reservoir management without requiring human intervention.
Casing in its simplest form is large-diameter steel pipe, generally in sections around 13 m (40 ft) length with a threaded connection at each end. It is available in a range of material grades and sizes, internal diameters of which typically range from 4" to 30". It is lowered into an open hole borehole (wellbore) and cemented in place in order to stabilize the wellbore. The operation during which the casing is put into the wellbore is commonly called "running pipe." The casing
220

forms a major structural component of the wellbore and as indicated, is run to serve several important functions:
• To prevent the formation wall from caving into the wellbore • To protect fresh-water formations • To isolate a zone of lost returns (drilling cuttings and fluids) • To isolate formations with significantly different pressure gradients • To prevent the flow or crossflow of formation fluids • To provide a means of maintaining control of formation fluids and pressure as the well is
drilled • To provide a means of securing surface pressure control equipment and downhole
production equipment, such as the drilling blowout preventer (BOP) or production packer
Casing is assembled as a series of casing joints to form a casing string of the required length and specification for the wellbore in which it is installed. Most casing joints are manufactured with male threads on each end and are joined together by short-length casing couplings with female threads, known as collars. Casing joints may also be fabricated with male threads on one end and female threads on the other.
Casing is usually manufactured from plain carbon steel that is heat-treated to varying strengths but may be specially fabricated of stainless steel, aluminium, titanium, fibreglass and other materials. As well as being designed to withstand a variety of forces such as collapse, burst, and tensile failure, it also is designed to withstand the deleterious effects of fluids such as chemically aggressive brines. Casing may also be protected by injection of corrosion inhibitors down the well.
The annular space between all casing strings is usually left fluid filled although many are cemented back to the surface, or back to a sufficient level to ensure a fluid seal between the casing and the borehole and pressure integrity throughout the system.
The bottom of the casing string comprises a short assembly, known as the casing shoe, which is typically manufactured from a heavy steel collar and profiled cement interior, screwed to the bottom of the casing string. The rounded profile helps guide the casing string past any ledges or obstructions that would prevent the string from being correctly located in the wellbore.
Most oilfield casing is of approximately the same chemistry (typically steel), and differs only in strength, which is determined by the heat treatment applied. A system for the identification and categorization of the strength of casing materials exists, which is important to consider when, for example, the presence of H2S is anticipated. In general, the higher the yield strength, the more susceptible the casing is to sulphide stress cracking. Therefore, the well designer may not be able to use casing with strength as high as might be preferred (refer Schlumberger: http://www.glossary.oilfield.slb.com/Display.cfm?Term=casing%20grade).
Coiled tubing
Coiled tubing is a continuous, jointless, high-pressure-rated hollow steel cylinder. Production tubing traditionally was made up of jointed sections of pipe, similar to the string of pipe used for drilling, but coiled tubing is now more generally used in this application. It is transported to the wellsite on a reel holding up to 7,000 metres. Special equipment is used to insert the tubing through the wellhead into the wellbore. This method is considerably quicker and more efficient than joining sections of pipe.
Further detail on unlined rock caverns
Section 2.2.8.4.2 discussed the concepts of unlined rock caverns and the deployment of water curtains to provide product containment. The basics were discussed and this section provides further detail on the storage technology, particularly the depths of the caverns and the pressures
221
required and developed. Examples are also described where fault zones and leakage pathways exist and have been sealed to provide tightness.
The maximum pressure in the cavern that does not lead to leakage is referred to as the critical gas pressure and is the pressure that defines the capacity of any particular storage facility. The critical gas pressure and gas storage capacity is dependent upon groundwater pressure and cavern depth. To maintain high water pressure in the surrounding rocks, the storage cavern is located either at a sufficient depth and relies upon containment either by the hydraulic gradient and pressure or by the additional installation of a ‘water curtain’ (Fig. 7; e.g. Liang & Lindblom, 1995; Yamamoto & Pruess, 2004).
To illustrate how the depth of the cavern plays an important role in increasing the groundwater pressure surrounding storage caverns and thus increasing critical gas pressure and gas storage capacity, Liang & Lindblom (1994) calculated pressures for a four cavern configuration under a 10 MPa (1450 psi) water curtain pressure scenario. As the depths of the cavern increases from 200 m to 800 m below groundwater level, then the critical gas pressure increases from 6.45 MPa (936 psi) to 9.97 MPa (1446 psi) and from 8.18 MPa (1186 psi) to 9.99 MPa (1449 psi), for roof curtain and roof and wall curtain scenarios, respectively.
In LRC’s, the presence of highly heterogeneous ‘conductive’ media such as fractured rock and fault zones, could form local flow paths, permitting the escape of stored product (gas), with an unsaturated fault zone connected to the storage cavern having the potential to quickly lead to a gas blowout. However, their presence does not preclude safe storage and to eliminate such zones, treatments such as pre/post grouting or additional water-curtain boreholes would be essential. Even partially saturated zones may retard or prevent gas leakage hence the critical need to ensure that water saturation of the rock surrounding the cavern is maintained. Investigations and simulations suggest that even if the water curtain were suddenly impaired by an accident, the gas plume does not quickly migrate to the ground surface, but would take several months (Yamamoto & Pruess, 2004).
Containment of product may, however, rely on the country rock being impermeable, although this is generally not the case. An example of a facility using this principle is one constructed in crystalline rock (granodiorite) of the Bohemain Massif at Háje, 113 km (70 miles) SW of Prague in the Czech Republic. In 1998, the facility became one of the first commercial natural gas cavern storage facilities constructed in crystalline rock (RWE, 2005). Five injection wells control the gas storage operations and the facility is formed by a series of unlined tunnels excavated at a depth of around 960 m with cross sectional areas of between 12 and 15 m2 and a total length of 45 km, providing a gas capacity of 620,000 m3. The tunnels were left unlined except for areas of high water infiltration through cracks in the rock massif, which were sealed by grouting. Permanent bracing was constructed only in places where there was a risk of tunnel collapse. Grouting was performed in the area of boreholes and concrete plugs in order to increase the rock impermeability. The system uses a water curtain to prevent gas migration out of the cavern into the the cracks and fissures in the host rock, with water collected in a basal sump area.
Following construction, natural gas was first pumped into the underground storage in January, 1998 to perform gas equipment and pressure seal tests, following which, the facility was commissioned on July 14, 1998. A local seismic network with seven stations was installed to monitor both local and regional seismic effects in the underground gas storage area. Over 300 seismic events were recorded during construction and activity continues (Málek et al., 2000; Málek & Brokesova, 2003). Epicentres are very shallow (0.3-1.9 km), are parallel to a major fault in the area and may be related to old mining activity and rising groundwater levels that aid release of seismic energy. The safety of the gas storage facility has not been affected, but plans to increase storage pressures may increase the risk of further seismic events. A grid of gas detectors has also been installed, monitoring ground methane levels.
On a similar note, research has been undertaken into the potential for development of a Refrigerated-Mined Rock Cavern Technology (RMRCT) for storage of natural gas in granitic
222

rock in the northeast U.S (CAES Development Co., 2004). The concept involves mining voids deep in unfractured crystalline rock and storing natural gas by chilling and compressing it to reduce the storage space required. Considerable technical risk is associated with a facility of this type, some of which relates to unknowns associated with large-scale cyclic internal pressurisation of a mined cavern in hard rock.
223

Glossary
Alluvium: sediment deposited by the action of rivers
Anastomosing: of streams, branching and rejoining irregularly to produce a net like pattern. Often used when describing fault zones and their internal structure of smaller faults
Anhydrite: mineral, CaSO4, forms rock
Antithetic: a lesser fault with opposite dip and downthrow to a related major fault
API: The American Petroleum Institute gravity, or API gravity, is a measure of how heavy or light a petroleum liquid is compared to water. API gravity is thus a measure of the relative density of a petroleum liquid and the density of water, but it is used to compare the relative densities of petroleum liquids. Although mathematically API gravity has no units, it is nevertheless referred to as being in “degrees”. API gravity is graduated in degrees on a hydrometer and was designed so that most values would fall between 10 and 70 API gravity degrees.
Apical: belonging to an apex; situated at the tip; hence ~ly
Archaea: the archaea or archaebacteria are a major group of single-celled microorganisms. Like bacteria, archaealack nuclei. Archaea were originally found in extreme environments but have since been found in all habitats.
Archaean: refers to a period of Proterozoic (PreCambrian) time (> 545 Ma before present)
Aquiclude: an impermeable bed within an aquifer
Aquifer: a water-bearing layer/rock (geological formation) containing sufficient saturated material to be consideredeconomical in the supply of water.
Arenaceous rocks: a group of detrital sedimentary rocks, typically sandstones
Argillaceous rocks: a group of detrital sedimentary rocks, commonly clays, shales, mudstones, siltstones and marls
Bituminous: impregnated with bitumen, a naturally occurring hydrocarbon mineral ranging in consistency from athick liquid to a solid (asphalt). Subitiminous is of lower bitumen content
Borehole: a hole drilled down into the rock from which samples or cores can be taken, or measurements of the rockscan be made
Boudinage: (French boudin, ‘sausage’) refers to a structure arising from tensional forces, usually involvingstretching of a competent bed parallel to the bedding plane
Breccia: a coarse to very coarse grained sedimentary rock, or referring to rock fragments, caused by either faultingor collapse of intact beds (above say dissolving salt beds within the circulating groundwater zone)
Brinefield: an area of (concealed/underground) salt mined by solution processes
Cataclasis: the process of mechanical fracture or break-up of rocks, usually associated with faulting
Clastics (clastic rocks): rocks built up of fragments of pre-existing rocks which have been produced by the processof weathering and erosion and in general transported to a point of deposition. Typically arenaceous rocks,conglomerates, breccias etc.
Competent: referring to a rock layer which, during folding, flexes without appreciable flow or internal shear andultimately likely to fracture
Condensate: A low-density, high-API gravity liquid hydrocarbon phase that generally occurs in association withnatural gas. Its presence as a liquid phase depends on temperature and pressure conditions in the reservoir.
Conformable: describes a continuous series of geological strata, without any break in sediment deposition.
Cretaceous: the geological period immediately after the Jurassic
Crust: the uppermost part of the lithosphere. In the UK context we refer only to ‘continental’ crust, which comprises relatively low density rocks of acid-intermediate composition, typically 30 km thick, overlying denser mantle rocks of ultramafic (ultrabasic) composition. The base of the crust (the crust/mantle boundary) is termed the Mohorovicic discontinuity (Moho)
224

Dessication: referring to drying out, usually referring to dessication cracks that develop in mudstones or evaporitic sequences. These rocks were originally deposited under water and the cracks are produced by the evaporation of the water and rapid drying up of the surface of the deposit
Downthrow: the downward movement of a fault block (or beds) along a fault surface
Drift: unconsolidated superficial deposit
Erosion: the weathering and removal of rock at surface
Evaporite: a sediment resulting from the evaporation of enclosed or partly enclosed saline water. Most evaporites are derived from bodies of sea water. Typically evaporitic sequences show are rhythmically bedded and full sequences may contain mixtures of potash and magnesium salts, rock salt (halite), gypsum or anhydrite and calcite and dolomite.
Fault: a planar discontinuity representing a fracture or shear-surface between blocks of rock (containing beds or layers) within the earth, across which rocks show relative displacement. Refer cartoon sketch below for other main fault terminology included in the glossary. Faults can exist on a range of scales with lengths from a few centimetres to tens of hundreds of kilometres. From a seismotectonic viewpoint, we are interested in larger faults, many kilometres in length and penetrating to mid or lower crustal depths (several kilometres), which may have fault surface areas of many hundreds of km2. Faults are categorised according to the nature of displacement across them. Thus normal faults are characterised by displacement of the hangingwall-block, down the fault surface and are commonly produced during crustal extension. Strike-slip (transcurrent) faults are characterised by components of horizontal displacement of the hangingwall-block, along the fault surface. Reverse faults are characterised by displacement of the hangingwall-block, up the fault surface and are commonly produced during crustal compression.
Fault zone: tabular region containing many parallel or anastomosing faults.
Fm: stratigraphic nomenclature, abbreviation for formation. A geologic formation is a formally named rock stratum or geological unit. Formations are lithostratigraphic units which are defined by primary lithology.
Gas hydrates: gas hydrates, also called clathrates, are crystalline solids which look like ice, and which occur when water molecules form a cage-like structure around smaller 'guest molecules'. Water crystallizes in the cubic system in clathrates, rather than in the hexagonal structure of normal ice. The most common guest molecules are methane, ethane, propane, isobutane, normal butane, nitrogen, carbon dioxide and hydrogen sulfide, of which methane occurs most abundantly in natural hydrates.
Graben: structural term for a downthrown block between normal faults.
Halite: salt mineral, NaCl, rock forming
Halokinetic: referring to the process whereby salt beds are disturbed and structures formed by the movement of salt under gravitational forces (halokinesis), including salt swells, pillows, diapirs, domes, stocks and walls
225
Hangingwall/ Footwall block: forming the downthrown (hangingwall) and upthrown (footwall) sides of faults
“Haselgebirge” (facies): halite crystals set in mudstone, forming a rock intermediate between halite and mudstone.
Horst Block: an upfaulted area between two parallel, but opposite downthrowing faults
Hydrostatic pressure: the ‘normal’ or hydrostatic pressure to be expected in pore water at any depth is the pressure in a column of water extending from this depth to the surface. Thus the hydrostatic pore pressure will be about 0.4 times the lithostatic or rock pressure if a mean density for the rock column is 2.5 g/cc. Pore pressures greater than hydrostatic can be generated in a variety of ways, including compaction of sediments by rapid burial or tectonic processes and dehydration of mineral assemblages during metamorphism.
Intensity: measurement of strength of shaking produced by an earthquake at a certain location. Intensity is determined from effects on people, human structures and the natural environment
Intracrystalline slip: related to ductile deformation of rocks and is the movement of crystal lattice defects (dislocations) through a crystal to produce shape changes in the crystal and ultimately solid rock. Requires high temperatures and geological time frames. Dislocations may glide along or climb through a crystal lattice.
Jurassic: the geological period immediately after the Triassic
Lithosphere: the outermost shell of the Earth comprising the crust and the uppermost mantle. Made up of internally rigid, but mobile blocks known as ‘plates’ (as in ‘plate tectonics’). Typically 125 km thick beneath the UK, the base of the lithosphere is a thermomechanical boundary, corresponding to the onset of partial melting and a corresponding rapid decrease in viscosity.
Lithostatic (rock) pressure: the hydrostatic pressure generated at a depth below the ground surface due solely to the weight of overlying rocks of mean density in that interval.
LNG: abbreviation for Liquefied Natural Gas; is natural gas that has been processed to remove impurities or valuable components that could cause difficulty downstream and then condensed into a liquid at almost atmospheric pressure by cooling to approximately -163 degrees Celsius. LNG is transported by specially designed cryogenic ships and cryogenic road tankers; and stored in specially designed tanks.
Lower crust: lowermost part of the crust typically between �18 km and �30 km depth. Mechanically rather weak and probably characterised by ductile (aseismic) deformation in the current stress regime
LPG: abbreviation for Liquid Petroleum Gas; a mixture of hydrocarbon gases, which is a gas at atmospheric pressure and normal ambient temperatures, but can be liquefied when moderate pressure is applied, or when the temperature is sufficiently reduced
Lst: common abbreviation for limestone, a sedimentary rock
Ma: abbreviation for millions of years ago
Magnitude: energy scale used for earthquakes, measuring the energy released at the source of the earthquake. Determined from measurements on seismographs. A number of measurement scales are available, including the Richter Scale
Marl: claystone, slightly calcareous and/or silty
Mercia Mudstone Group: common abbreviation for Mercia Mudstone Group, part of the Triassic succession
Mudstone: claystone
Mylonite (zones): narrow planar zones of high strain in which deformation is intense relative to the adjacent (parent) rock and a fine-grained fault rock has been produced either by cataclasis, recrystallisation or both. Original usage was for rocks in which deformation was solely of a cataclastic nature, with no accompanying recrystallisation. Now more widely recognised that the grain size reduction in the fault rock has been by dynamic recrystallisation proceseses, with the rocks sometimes referred to as blastomylonites
Natural gas: a mixture of hydrocarbon and small quantities of non-hydrocarbons, primarily methane, that exists either in the gaseous phase or is in solution in crude oil in natural underground reservoirs, and which is gaseous at atmospheric conditions of pressure and temperature
NGL: abbreviation for Natural Gas Liquids, hydrocarbons that exist in a reservoir as constituents of natural gas but which are recovered as liquids in separators, field facilities or gas-processing plants
Outcrop: the area where a particular geological strata occurs at the surface.
Packer: A device that can be run into a wellbore with a smaller initial outside diameter that then expands externally to seal the wellbore. Packers employ flexible, elastomeric elements that expand. The two most common forms are the production or test packer and the inflatable packer. The expansion of the former may be accomplished by squeezing the elastomeric elements (roughly doughnut shaped) between two plates, forcing the sides to bulge
226

outward. In the latter, expansion is accomplished by pumping a fluid into a bladder (in much the same fashion as a balloon), but having more robust construction. Production or test packers may be set in cased holes and inflatable packers are used in open or cased holes. They may be run on wireline, pipe or coiled tubing. Some packers are designed to be removable, while others are permanent. Permanent packers are constructed of materials that are easy to drill or mill out.
Permeability: the intrinsic capacity of a geological material to transmit fluids. Linked to porosity.
Permian: the geological period immediately before the Triassic
Phyllosilicate: referring to a group of layer-lattice minerals, most commonly micas making up shales (micaceous)
Porosity: the percentage of the total volume of rock or soil that consists of pore space. Linked to permeability.
Post-sedimentary: having taken place after the sedimentation of a bed
Post-Triassic: having taken place after the Triassic period
Prospectivity: the term used to describe a geographical region, a country, a geological basin, a particular area or structure within a basin as attractive for hydrocarbon exploration by reason of its [technical] attributes (having the likely petroleum requirements of source, reservoir, cap rock and favourable trapping structures). It may also ultimately include legal and fiscal aspects that would contribute towards determining if an area were prospective.
psi, psia & psig: units of pressure describing the pressure resulting from one pound force applied to an area of one square inch (= lbf/sq in). psi is the abbreviation for pounds per square inch (or more accurately, pound-force per square inch), describing a pressure measured with respect to atmospheric pressure (the gauge reading is adjusted to zero at the surrounding atmospheric pressure). psia is the abbreviation for pounds(force) per square inch absolute, describing an absolute pressure per square inch that starts from a perfect vacuum (space) – it is gauge pressure plus barometric or atmospheric pressure (thus psia is affected by weather conditions). A good frame of reference is at sea level there is 14.7 psia. psig is the abbreviation for pounds(force) per square inch gauge, describing a unit of pressure relative to atmospheric pressure at sea level. Thus if a pressure gauge is calibrated to read zero in space, then at sea level on Earth it would read 14.7 psi. Thus a reading of 30 psig on a tyre gauge, represents an absolute pressure of 44.7 psi. psi is often used incorrectly instead of psig.
Quaternary: youngest age of earth’s history, including the period of the ice age to now
Rheology: the study of the deformation and flow of matter under an applied stress
Rockhead: top of a geological formation at base of drift deposits
Seismic reflection data: data imaging the subsurface, acquired by recording sound waves reflected from rock layers in the subsurface. Measured and generally displayed in time
Sedimentary cover: young, relatively soft, relatively undeformed layered rocks, resting upon the crystalline upper crust. Often preserved within sedimentary basins, which can be several kilometres thick
Sedimentation: the act of depositing sediment to form beds and eventually rock
Shear-zone: a general term for a (roughly planar) surface or zone within the earth characterised by lateral (shear) displacements on either side. Similar to a fault, but generally showing ductile deformation of material along the shear-surface, whereas faults show brittle forms of deformation along the fault surface. Many faults are believed to pass downwards into shear-zones; deep in the crust the two terms become synonymous.
Siliciclastic: Silica-based sediments that are derived from weathered (broken down) pre-existing rocks, transported elsewhere and redeposited to form another rock (clastics). Examples of common siliciclastic sedimentary rocks include quartzitic conglomerate, sandstone, siltstone and shale. Other non-silica based rocks (including carbonates) can also be broken down and reworked to form other types of clastic sedimentary rocks.
Sole or soling out: the flattening or decrease in angle of a fault towards horizontal with depth. Often in the context of faults flattening out into salts, shale or evaporite deposits as the deformaton is taken up in a ductile manner.
Solid rock: the rocks below the drift (Quaternary) deposits
Sherwood Sandstone Group: common abbreviation for Sherwood Sandstone Group, part of the Triassic succession
Sst: common abbreviation for sandstone, a sedimentary (clastic) rock
Strain/strain rate: Strain is the ratio of a change of length to an initial length and thus has no dimension. A strain is generally expressed as a percentage change or as a fractional change. Thus if a line initially 10 cm long is shortened to 8 cm long, the change in length is 2 cm and the strain (shortening) is 0.2 (no units) or 20 percent (no units). The
- -1dimensions of strain rate are [T 1] and thus strain rate might be expressed as 10-5sec . If the example of shortening -1by 20% takes place in one year (3.1536 x 10⁷ sec), then the strain rate is 0.2/(3.1536 x 107) = 6.3 x 10⁻⁹sec (Hobbs
et al., 1976).
227

Subcrop: a subsurface outcrop, such as where a geological strata intersects a subsurface plane.
Surfactant: a substance, e.g. a detergent, which has the effect of altering the interfacial tension of water and other liquids or solids
Syncline: rocks bent in a down fold, the opposite of an anticline
Synsedimentary: an action that took place during sedimentation, e.g. faulting of an area during sedimentation
Tectonic: subsurface movements caused by forces in the earth’s interior
Tectonic thinning: having been thinned by a tectonic structure, generally a fault
Terrane: a term used to characterise a crustal or lithospheric block which has experienced a distinct geological (i.e. stratigraphic, faunal, structural, metamorphic, igneous etc) history with respect to adjacent terranes, with which it is in present tectonic contact. The tectonic contacts are fault-zones or shear-zones which may have very large displacements. The term was originally used in the American literature to characterise very far-travelled, exotic or 'suspect' terranes within the circum-Pacific cordilleras
Thrust-fault: low-angle fault (commonly dipping between 20° - 35°), characterised by reverse displacements in the geological past. Can penetrate to lower crustal depths when they constitute fundamental lines of crustal weakness.
Transcurrent fault: steeply-dipping to vertical fault-structure characterised by strike-slip displacements in the geological past
Triassic: a geological period, including the time of sedimentation of the Mercia Mudstone Group, containing major salt beds such as the Preesall and Northwich halites of NW England and the CheshireBasin respectively
Upper crust: the strong ‘brittle’ part of the crust typically at depths less than �18 km. As defined here, does not include the sedimentary cover
Vadose: the vadose zone, also termed the unsaturated zone, is the portion of Earth between the land surface and the zone of saturation, or top of the water table ("vadose" is Latin for "shallow")
Vuggy: relating to pore space that is within rock and that is significantly larger than grains, crystals or pore spaces beteen grains. Generally produced by dissolution amd is thus most often referred to in carbonate rocks (limestone chalk etc)
Wet/dry rockhead: wet rockhead is an area where the halite beds rise towards the surface and are progressively dissolved by groundwater. Thus there is a belt where only part of the halite sequence is preserved and across which the halite is overlain by collapse breccias of the overlying mudstones. Dry rockhead is the area of halite beneath the surface, which is not affected by groundwaters where a complete sequence is preserved
228

References
Most of the references listed below are held in the Library of the British Geological Survey at Keyworth, Nottingham. Copies of the references may be purchased from the Library subject to the current copyright legislation.
ÅBERG B. 1977. Prevention of gas leakage from unlined reservoirs in rocks. In: Proceedings
International Symposium on Storage in Excavated Rock Caverns, Stockholm, Sweden, 1977, 399-413.
ÅBERG B. 1989. Pressure distribution around stationary gas bubbles in water-saturated rock fractures. In: Proceedings International Conference on Storage of Gases in Rock Caverns, Trondheim, Norway, 1989, 77-86.
ABRAMS, M.A. 1992. Geophysical and geochemical evidence for subsurface hydrocarbon leakage in the Bering Sea, Alaska. Marine & Petroleum Geology, 9, 208-221.
ABRAMS, M.A. 1996. Chapter 1: Distribution of Subsurface Hydrocarbon Seepage in Near Surface Marine Sediments. In: SCUMACHER, D. & ABRAMS, M.A. (eds), Hydrocarbon Migration and Its Near-Surface Expression, AAPG Memoir, 66, 1-14.
ADCOCK, C.M. 1963. Natural Gas in Britain: results achieved in retrospect. Gas World, 23 February, 1963, 266-268.
AEA, 2005. MHIDAS references relating to a: List of known accidents that have occurred in underground storages (salt leached, aquifers and depleted fields) for natural gas or LPG. Report by AEA Technology Environment for the Health & Safety Executive, Dec 2005.
AITKEN, J.F., QUIRK, D.G. & GUION, P.D. 1999. Regional correlation of Westphalian sandbodies onshore UK: implications for reservoirs in the Southern North Sea. In: FLEET, A.J. & BOLDY, S.A.R. (eds), Petroleum Geology of Northwest Europe: Proceedings of the 5
th Conference,
Published by Geological Society, London, 747-756.
AITKENHEAD, N, BRIDGE, D MCC, RILEY, N J, and KIMBELL, S F. 1992. Geology of the country around Garstang. Memoir of the British Geological Survey, Sheet 67 (England and Wales), 120 pp.
AKGÜN, H. 1997. An assessment of borehole sealing performance in a salt environment. Environmental Geology, 31, 34-41.
AKHURST, M.C., BARNES, R.P., CHADWICK, R.A., MILLWARD, D., NORTON, M.G., MADDOCK, R.H., KIMBELL, G.S. AND MILODOWSKI, A.E., 1998. Structural evolution of the Lake District Boundary Fault Zone in west Cumbria, UK. Proceedings of the Yorkshire Geological Society, 52, 139-158.
ALBRECHT, H. & HUNTSCHE, U. 1980. Gegirgsmechanische Aspekte bei der Endlagerung radioactiver Abfälle in Salzdiapiren unter besonderer Berücksichtigung der Fliesseverhaltens von Steinsalz. Fortschritte der Mineralogie, 58, 212-247.
ALLEN, D.R. 1968. Physical changes of reservoir properties caused by subsidence and repressurizing operations, Wilmington Field, California", Journal of Petroleum Technology, 23-29.
ALLEN, D.J., BREWERTON, L.J., COLEBY, L.M., GIBBS, B.R., LEWIS, M.A., MACDONALD, A.M., WAGSTAFF, S.J. & WILLIAMS, A.T. 1997. The physical properties of major aquifers in England
229

and Wales. British Geological Survey Technical Report WD/97/34, 312 pp. Environment Agency R&D Publication 8.
ALLEN, K. 1972. Eminence Dome – Natural Gas Storage in salt comes of age. Journal of
Petroleum Technology, 24, 1299-1301.
ALLAN, U.S. 1989. Model for hydrocarbon migration and entrapment within faulted structures. Bulletin American Association Petroleum Geologists, 73, 803-811.
ALLISON, M. L. 2001a. Hutchinson, Kansas: A Geologic Detective Story. Geotimes, American Geological Institute, October, 2001.
ALLISON, M. L. 2001b. Natural gas explosions in Hutchinson, Kansas: unraveling a geologic mystery (abs), Geological Society of America Abstracts with Programs, 33, 6, p132.
ALLISON, M. L, 2001c. The Hutchinson Gas Explosions: Unraveling a Geologic Mystery, Kansas Bar Association, 26th Annual KBA/KIOGA Oil and Gas Law Conference, 1, p3-1 to 3-29.
ALLISON, M. L, BHATTACHARYA, S., BUCHANAN, R., BYRNES, A., NISSEN, S., WATNEY, L., XIA, J. & YOUNG, D. 2003. Natural gas explosions in Hutchinson, Kansas: response to a geologic mystery. Paper No. 2-1, Session No. 2 Natural Gas Explosions in Hutchinson, Kansas, The Geological Society of America, North-Central Section – 37th Annual General Meeting (March 24-25, 2003) Kansas City, Missouri.
ANDERSON N.L. & BROWNS, R. J. 1992. Dissolution and deformation of rock salt, Stettler area, southeastern Alberta. Canadian Journal of Exploration Geophysics, 28, 128-136.
ANDREWS, D.J. 1989. Mechanics of fault junctions. Journal of Geophysical Research 94, (B7), 9389–9397.
ANTANOV, P.L., GLADYSHEWA, G.A. & KOSLOW, W.P. 1958. The diffusion of hydrocarbons through rock sal. Zeitschrift für angewandte Geologie, 8, 387-388.
API, 1994. Design of solution-mined underground storage practices. American Petroleum
Institute Recommended Practice 1114, Washington DC.
APPLIN, P.L. 1925. The Stratton Ridge salt dome, Brazoria County, Texas. Bulletin American
Association Petroleum Geologists, 9, 1-34.
ARAKTINGI, R.E, BENEFIELD, M.E., BESSENYEI, Z., COATS, K.H. & TEK, M.R. 1984. Leroy Storage Facility, Uinta County, Wyoming: A Case History of Gas-Migration Control. Journal of
Petroleum Technology, 36, 132-140.
ARP, G.K. 1992. An integrated interpretation of the origin of the Patrick Draw Oilfield sage anomaly. Bulletin American Association of Petroleum Geologists, 76(3), 301-306.
ASH, J. W. 2006. Mitigation of the catastrophic failure of the primary containment in the bulk storage industry, 10 pp (http://www.ljmu.ac.uk/BLT/BUE_Docs/ash.pdf).
ASSOCIATED PRESS, 2004. Gas explosion in Berlin injures three. April 23, 2004.
BAAR, C.A. 1977. Applied salt-rock mechanics, 1. In: Developments in Geotechnical Engineering. 16-A, 143-147. Elsevier Science, Amsterdam.
BAILEY W.R., UNDERSCHULTZ, J., DEWHURST, D.N.; KOVACK, G., MILDREN, S. & RAVEN, M. 2006. Multi-disciplinary approach to fault and top seal appraisal; Pyrenees-Macedon oil and gas fields, Exmouth Sub-basin, Australian Northwest Shelf. Marine and Petroleum Geology, 23, 241-259.
BAKER, S. J., WEST, J.M., METCALFE, R., NOY, D.J. YOSHIDA, H. & AOKI, K. 1998. A biological assessment of the Tono site, Japan. Journal of Contaminant Hydrology, 35, 331-340.
230

BAPTIE, B., 2002. Seismogenesis and state of stress in the UK from observations of seismicity. SECED Newsletter, 16, 8-9.
BAPTIE, B., OTTEMOLLER, L., SARGEANT, S., FORD, G. & O'MONGAIN, A., 2005. The Dudley earthquake of 2002: A moderate sized earthquake in the UK. Tectonophysics, 401, 1-22.
BARDON, C., WOODHEAD, I.A & GRIST, D.M. 1982? Enhanced oil recovery from the Egmanton Oilfield by Carbon Dioxide miscible flooding. Source not known.
BARNDS, R.M. 1968. Playa del Rey Oilfield, Los Angeles County, California: natural gas storage. In: BEEBE, B.W. & CURTIS, B.F. (eds), Natural Gases of North America: a symposium
in two volumes. American Association of Petroleum Geologists, Memoir 9, Volume One, 169-173.
BARY, A. CROTOGINO, F., PREVEDEL, B., BERGER, H., BROWN, K., FRANTZ, J., SAWYER, W., HENZELL, M., MOHMEYER, K-U., REN, N-K., STILES, K & XIONG, H. 2002. Storing Natural Gas Underground. Oilfield Review, Summer 2002, 11 pp (http://www.slb.com/media/services/ resources/oilfieldreview/ors02/sum02/p2_17.pdf).
BAUER, S. 1999. Analysis of subsidence data for the Bryan Mound site, Texas. Sandia Report, SAND99-1739, Sandia National Laboratories.
BEAUHEIM, R.L. & ROBERTS, R.M. 2002. Hydrology and hydraulic properties of a bedded evaporite formation. Journal of Hydrology, 259, 66-88.
BECKMAN, K.L. & DETERMEYER, P.L. 1997. Natural gas storage: historical development and expected evolution. Gas Tips- Gas Research Institute, 3(2), 13-22.
BELL, T.H. & ETHERIDGE, M.A. 1973. Microstructure of mylonites and their descriptive terminology. Lithos, 6, 337-348.
BELL, T.H. & ETHERIDGE, M.A. 1976. Deformation and recrystallization of quartz in a mylonite zone, central Australia, Tectonophysics, 32, 235–267.
BENSON, S. & HEPPLE, R. 2005. Chapter 28: Prospects for early detection and options for remediation of leakage from CO2 storage Projects. In: THOMAS, D.C. & BENSON, S.M. (eds), Carbon Dioxide Capture for Storage in Deep Geologic Formations, Volume 2, Elsevier Limited, 1189-1203.
BÉREST, P. 1989. Accidents of Underground Oil and Gas Storages-Case Histories and Prevention. In: NILSEN, B. & OLSEN, J. (eds.), Proceedings International Conference Storage
Gases in Rock Caverns, Tronheim, Norway. Balkema, Rotterdam p.289.
BÉREST, P. & BROUARD, B. 2003. Safety of Salt Caverns Used for Underground Gas Storage. Oil & Gas Science and Technology, 58, 361-384.
BÉREST, P., BROUARD, B. & J.G. DURUP 2000. Shut-in pressure tests: Case studies. Proceedings
2000 SMRI Fall Meeting.
BÉREST, P., B. BROUARD, & J.G. DURUP 2001. Tightness Tests in Salt Cavern Wells. Oil & Gas
Science and Technology, 56, 451-469.
BERG, R.R. 1975. Capiliary pressure in stratigraphic traps. Bulletin American Association of
Petroleum Geologists, 59, 939-956.
BERLINER ZEITUNG. 2004a. 30 Meter hohe Stichflamme aus dem Gaslager. 24.04.2004, p.21
BERLINER ZEITUNG. 2004b. Bauarbeitern geht es nach Gas-Unfall besser. 08.05.2004, p.24
BERLINER ZEITUNG. 2004c. Chemikalie löste Gasexplosion aus. 03.08.2004, p.28
BERRIDGE, N.G. & PATTISON, J. 1994. Geology of the country around Grimsby and Patrington (Sheets 81 and 82 and 90 and 89). Memoirs Geological Survey, England and Wales.
231

BEUTAL, T. 2002. Assessment of geological and geotechnical site suitability. Evidence presented to the Byley Gas Storage Project Public Inquiry, Document APP/P4/1, 17 pp (part of the evidence presented by CROTOGINO, F.: Project Design (Underground Section), Document APP/P4, 28 pp).
BEUTAL, T. & BLACK, S. 2005. Salt deposits and gas cavern storage in the UK with a case study of salt exploration from Cheshire. Oil & Gas European Magazine, 1, 31-35.
BEVAN, T.G. 1985. A reinterpretation of fault systems in the Upper Cretaceous rocks of the Dorset coast, England. Proceedings of the Geologists’ Association, 96, 337-342.
BGS, 2006a. Mineral Planning Factsheet – Salt. British Geological Survey, for the Office of the Deputy Prime Minister, 7 pp.
BGS, 2006b. Mineral Planning Factsheet – Oil and Gas. British Geological Survey, for the Office of the Deputy Prime Minister, 16 pp.
BIDDLE, K.T. 1991. The Los Angeles Basin: an overview. In: BIDDLE, K.T. (ed), Active Margin Basins, American Association Petroleum Geologists Memoir, 52, 5-24.
BOCKRIS, J.O. & REDDY, A.K.N. 1970. Modern electro-chenistry, 1, New York Plenum, 622 pp.
BOOTH, D. 2007. In: FOSTER, P. (reporter) Kent shaken and stirred but it could have been worse,
say seismologists. The Times, Monday April 30 2007, p.6.
BOWMAN, M.B.J., MCCLURE, N.M. & WILKINSON, D.W. 1993. Wytch Farm oilfield: deterministic reservoir description of the Triassic Sherwood Sandstone. In: PARKER, J.R. (ed),
thPetroleum Geology of Northwest Europe: Proceedings of the 4 Conference, Geological Society London, 1513-1517.
BRADLEY, J.E., CLYNE, P., COMBE, J. & BARDON, C. 1982. Egmanton CO2 Pilot Injection Project. 2nd
European Symposium – Enhanced oil Recovery. Paris, 8-10 November 1982, 14 pp.
BRADSHAW, R.L. & MCCLAIN, W.C. 1971. Project Salt Vault: A demonstration of disposal of high activity solidified wastes in underground salt mines. Oak Ridge National Laboratory, ORNL-4555.
BRASSOW, C.L. 2001. Use of solution mined salt caverns for the disposal of non-hazardous oil and gas (NOW) waste. The 8
th International Petroleum Environmental Conference, Houston,
Texas, November 6-9, 2001 (http://ipec.utulsa.edu/Conf2001/brasso2_131.pdf).
BRETAN, P.G., YIELDING, G. & JONES, H. 2003. Using calibrated shale gouge ratio to estimate hydrocarbon column heights. Bulletin American Association of Petroleum Geologists, 87(3), 397-413.
BREUNESE, J.N., VAN EIJS, R.M.H.E, DE MEER, S. & KROON, I.C. 2003. Observation and prediction of the relation between salt creep and land subsidence in solution mining: The Barradeel Case. Solution Mining Research Institute Fall 2003 Conference, 5-8 October, Chester, United Kingdom.
BRIDGE, G. & LEEDER, M.R. 1979. A simulation model of alluvial stratigraphy. Sedimentology, 26, 617-644.
BROWITT, C.A. & MUSSON, R,M.W. 1993. Earthquake hazards and risks: Is Britain immune? Earthwise 3 (September), 34-35.
BROWN, A. 2000. Evaluation of possible gas microseepage mechanisms. Bulletin American
Association Petroleum Geologists, 84 (11), 1775-1789.
BRUNE, G. 1965. Anhydrite and gypsum problems in engineering geology. Engineering Geology
(Sacremento), 2, 26-33.
232

BRUNSTROM, R. G. W. 1963. Recently discovered oilfields in Britain. World Petroleum
Congress. Frankfurt. Section I, paper 49, 11-20.
BRUTHANS J., FILIPPI M., GERL M., ZARE M., MELKOVÁ J., PAZDUR A., BOSÁK P. 2006. Holocene marine terraces on two salt diapirs in Persian Gulf (Iran): age, depositional history and uplift rates. Journal Quaternary Science, 21(8), 843-857.
BSI 1998a. BS EN 1918-2: Gas supply systems – underground gas storage – Part 2: Functional recommendations for storage in oil and gas fields. British Standards Institution, London, 11 pp.
BSI 1998b. BS EN 1918-1: Gas supply systems – underground gas storage – Part 1: Functional recommendations for storage in aquifers. British Standards Institution, London, 13 pp.
BSI 1998c. BS EN 1918-3: Gas supply systems – underground gas storage – Part 3: Functional recommendations for storage in solution-mined caverns. British Standards Institution, London, 16 pp.
BURTON, P.W. & MARROW, P.C., 1989. Seismic hazard and earthquake source parameters in the North Sea. In: GREGERSEN, S. AND BASHAM, P.W. (Eds), Earthquakes at North-Atlantic passive
margins: Neotectonics and postglacial rebound. Kluwer, Kluwer, 633-664.
BURTON, P.W., MUSSON, R.M.W. & NEILSON, G., 1984. Macroseismic report on historical British earthquakes IV: Lancashire and Yorkshire, BGS Global Seismology Report, 2 vols.
BUSCHBACH, T.C. & BOND, D.C. 1974. Underground Storage of Natural Gas in Illinois – 1973. Illinois Petroleum 101, Illinois State Geological Survey, Department of Registration and Education, Urbana, Illinois, 71 pp. (http://www.isgs.uiuc.edu/pttc/Illinois%20petroleum/IP101% 20Underground%20Storage%20of%20Natural%20Gas%20in%20Illinois--1973.pdf).
BYRNES, A.P. 1997. Report to M.H. Cochran, Kansas Department of Health and Environment, on the fracture pressure of rocksalt around Hutchinson, 13 pp (http://www.kgs.ku.edu/Hydro/ Hutch/GasStorage/apr_19_97.pdf).
CAES Development Co. 2004. CAES Monitoring to Support RMRCT. In conjunction with BAUER, S.J, & LEE, M., Report by CAES Development Co. and Sandia National Laboratories for DOE Contract DE-FC26-01NT40868, 29 pp (http://www.netl.doe.gov/technologies/oil-gas/publications/Storage/Final_41296.pdf)
CAILLET, G. 1993. The caprock of the Snorre Field, Norway: a possible leakage by hydraulic fracturing. Marine and Petroleum Geology, 10, 42-50.
CALLENDER, A.B. 2006. Ponte Vista development hazard analysis. Letter to Mr Carnachan February 21 2006. In: Appendix IV.D-1 Hazard Analysis, 7 pp (http://www.pontevista.com/deir/ TechnicalAppendicesVolume2/AppendixIVD1HazardsAnalysis.pdf).
CAMERON, T.D.J., CROSBY, A., BALSON, P.S. JEFFREY, D.H., LOTT, G.K., BULAT, J. & HARRISON, D.J. 1992. United Kingdom Offshore Regional Report: The Geology of the Southern
North Sea. London, HMSO for the British Geological Survey.
CAMP DRESSER & MCKEE, 2001. 12. Earth/Geology Technical Report. Technical Report LAX
Master Plan EIS/EIR. Prepared for: Los Angeles World Airports, U.S. Department of Transportation Federal Aviation Administration Prepared by: Camp Dresser & McKee Inc. January 2001, 47 pp.
CAPPEL, A. & B. MIYASAKI. 2004. Flaws in regulatory oversight and review of Underground Natural Gas Storage: financial liability and lessons learned from recent US incidents and disasters. Abstract from ‘The Future Development and Requirements for Underground Gas Storage in the UK and Europe’. Geological Society London Conference, Aberdeen, October 19-
th20 2004 (Convened by EVANS, D.J., CHADWICK, R.A. & ROWLEY, W.J.).
CARTER, N.L., HANDIN, J., RUSSEL, J.E. & HORSEMAN, S.T. 1993. Rheology of rocksalt. Journal
Structural Geology, 15 (9/10), 1257-1271.
233

CARTER, N.L. & HANSEN, F.D. 1983. Creep of rocksalt. Tectonophysics, 92, 275-333.
CASTLE, J.W., BRUCE, D.A., BRAME, S.E., BROOKS, D.A., FALTA, R.W. & MURDOCH, C. 2004. Design and Feasibility of Creating Gas-Storage Caverns by Using Acid to Dissolve Carbonate Rock Formations. SPE Paper 91436, SPE Eastern Regional Meeting, 15-17 September 2004, Charleston WV, USA.
CELIA, M.A., BACHU, S., NORDBOTTEN, J.M. KAVETSKI, D. & GASDA, S. 2006. A risk assessment tool to quantify CO2 leakage potential through wells in mature sedimentary basins. In: RØKKE, N.A., BOLLAND, O., O'BRIEN, D., INGOLF EIDE, L., GALE, J., HAUG, G., HAUGAN, B.E., RIIS, T. & SUNDSET, T. (eds), The 8th International Conference on Greenhouse Gas
Control Technologies, 19th – 22nd June, Trondheim, Norway, Elsevier, Abstracts volume, 6pp.
CENTRICA, 2006. Interim report on Rough Incident. Centrica Storage Ltd Media and Press
Release, 24 April, 2006 (http://www.centrica-sl.co.uk/Files/Interim_Recovery_Report_20060424 .pdf).
CHABRELIE, M-F., DUSSAUD, M.B., BOURGAS, D. & HUGOUT, B. 1998. Underground Gas Storage: Technological Innovations for Increased Efficiency. Presented at the 17th Congress of the World Energy Council held in Houston, Texas, USA, September.
CHAPELLE, F. 1993. Groundwater Microbiology and Geochemistry, John Wiley and Sons, New York, USA.
CHADWICK, R.A. 1986. Extension tectonics in the Wessex Basin, southern England. Journal of
the Geological Society, London, 143, 465-488.
CHADWICK, R.A. 1993. Aspects of basin inversion in southern Britain. Journal of the Geological
Society, London, 150, 311-322.
CHADWICK, R.A. & EVANS, D.J. 2005. A Seismic Atlas of Southern Britain. British Geological
Survey, Occassional Publication No. 7, 193pp.
CHADWICK, R.A., PHARAOH, T.C., WILLIAMSON, J.P. & MUSSON, R.M.W., 1996. Seismotectonics of the UK. BGS Technical Report.
CHAN, K.S., MUNSON, D.E., FOSSUM, A.F. & BODNER, S.R. 1998a. A Constitutive Model for Representing Coupled Creep, Fracture, and Healing in Rock Salt, Proceedings 4th Conference
on the Mechanical Behavior of Salt, Transactions Technical Publications, Clausthal-Zellerfeld, Germany, 221-234.
CHAN, K.S., BODNER, S.R. & MUNSON, 1998b. D.E. Recovery and Healing of Damage in WIPP Salt, International Journal Damage Mechanics, 7, 143-166.
CHANG, J.L. & CHENG-CHUNG, L. 2006. A study of storage tank accidents. Journal of Loss
Prevention in the Process Industries, 19(1), 51-59 (http://www.sciencedirect.com/science?_ob= PublicationURL&_tockey=%23TOC%235255%232006%23999809998%23608326%23FLA%2 3&_cdi=5255&_pubType=J&view=c&_auth=y&_acct=C000050221&_version=1&_urlVersion =0&_userid=10&md5=1db35b0654ba48b22f4b2b5e216a8517).
CHEUNG, K.Y.C., CHEUNG, S.T.H., NAVIN DE SILVA, R.G., JUVONEN, M.P.T., SINGH, R. AND
WOO, J.J. 2003. Large-scale Energy Storage Systems. Imperial College Research Report, ISE2 2002/2003 (http://www.doc.ic.ac.uk/~mpj01/ise2grp/energystorage_report/storage.html).
CHESHIRE COUNCIL, 2006. Major Scheme To Store Gas In Salt Cavities Given The Go Ahead. Cheshire County Council News Release, 20 June 2006, Ref 212/06 (http://www.cheshire.gov.uk/NR/exeres/2CE02F3E-F2D4-420D-818C-6944F16173B,frameless. htm?PageVersion=PRINTERFRIENDLY).
CHILINGAR, G.V & ENDRES, B. 2005. Environmental hazards posed by the Los Angeles Basin urban oilfields: an historical perspective of lessons learned. Environmental Geology, 47, 302-317.
234

CLARK, S.O., DEAVES, D.M., LINES, I.G. & HENSON, L.C. 2001. Effects of secondary
containment on source term modelling. Report prepared by WS Atkins Consultants Ltd. for the Health and Safety Executive. Contract Research Report 324/2001, 139 pp, (http://www.hse.gov.uk/research /crr_pdf/2001/crr01324.pdf).
CLARKE, R.H. & CLEVERLEY, R.W. 1991. Petroleum seepage and post-accumulation migration. In: ENGLAND, W.A. & FLEET, A.J. (eds), Petroleum Migration, Geological Society Special Publication, 59, 265-271.
CLARKE, S.M., BURLEY, S.D. & WILLIAMS, G.D. 2005a. A three-dimensional approach to fault seal analysis: fault-block juxtaposition & argillaceous smear modelling. Basin Research, 17, 269–288.
CLARKE, S.M., BURLEY, S.D. & WILLIAMS, G.D. 2005b. Faulting, fault-zone processes & hydrocarbon flow in three dimensional basinmodels (http://www.bdrg.esci.keele.ac.uk/ smcresearch.htm#top).
CLAYTON, C.J. & DANDO, P.R. 1996. Chapter 13: Comparison of Seepage and Seal Leakage Rates. In: SCUMACHER, D. & ABRAMS, M.A. (eds), Hydrocarbon Migration and Its Near-Surface Expression, AAPG Memoir, 66, 169-171.
COATES, G.K., G.K., LEE, C.A., MCCLAIN, W.C. & SENSENY, P.E. 1981. Failure of man-made cavities in salt and surface subsidence due to sulfur mining. Topical report RSI-0131, Submitted to Strategic Petroleum Reserve, Geotechnical Division, Sandia National Laboratories, Albuquerque, NM 87185, 136pp.
COLEMAN, D.C., MEENTS, W.F., LIU, C-LI & KEOGH, R.A. 1977. Isotopic Identification of
Leakage Gas from Underground Storage Reservoirs – A Progress Report. Illinois Petroleum 111, Illinois State Geological Survey, Department of Registration and Education, Urbana, Illinois, 10 pp.
COLEMAN, D.D. 1992. The use of geochemical fingerprinting to identify migrated gas at the Epps underground aquifer. Society Petroleum Engineers, SPE Paper Number 24926-MS, 10 pp.
COLLINSON, C., SARGENT, M.L. & JENNINGS, J.R. 1988. Chapter 14: Illinois Basin region. In:
SLOSS, L. L., (ed.) The Geology of North America, v. D-2, Sedimentary Cover—North American
Craton: U.S.: Decade of North American Geology: Geological Society of America, 383–426.
COLLINSON, J D. 1988. Controls on Namurian sedimentation in the Central Province basins of northern England. In: BESLY, B, & KELLING, G (eds), Sedimentation in a synorogenic basin
complex: the Upper Carboniferous of northwest Europe. Blackie: London and Glasgow, 85–100.
COLLINSON, J.D., JONES, C.M., BLACKBOURN, G.A., BESLY, B.M, ARCHARD, G.M. & MCMAHON, A.H. 1993. Carboniferous depositional systems of the Southern North Sea. In: PARKER, J.R. (ed), Petroleum Geology of Northwest Europe: Proceedings of the 4
th Conference.
Geological Society, London, 677-687.
CONOCOPHILLIPS, 2004. LPG Caverns. (http://www.conocophillips.co.uk/fuels/lpg/lpgcavern .htm).
COOPER, A.H. 1986. Subsidence and foundering of caused by the dissolution of Permian gypsum in the Rippon and Bedale areas, North Yorkshire. In: HARWOOD, G.M. & SMITH, D.B. (eds), The
English Zechstein and Related Topics. Geological Society London Special Publication, 22, 127-139.
COOPER, A.H. 1988. Subsidence resulting from the dissolution of Permian gypsum in the Ripon area: its relevance to mining and water abstraction. In: BELL, F.G., CULSHAW, M.G., CRIPPS, J.C. & LOVELL, M.A. (eds), Engineering geology of Underground Movements, Geological Society Engineering Geology Special Publication, 5, 387-390.
235

COOPER, A.H. 2002. Halite karst geohazards (natural and man-made) in the United Kingdom. Environmental Geology, 42, 505-512.
COOPER, M.N., SOUTHWORTH, R.A., WALSH, D.M. AND MORGAN, J.C. 1985. Field experience in the Bothamsall Surfactant Flood Project, SPE 13990, presented at Offshore Europe Conference, Aberdeen, 10-13 September, 1985.
CORBETT, G.R. 1996. The Development of a Coal Mine Portable Microseismic Monitoring
System for the Study of Rock Gas Outbursts in the Sydney Coal Field, Nova Scotia. MSc Thesis submitted to Department of Mining and Metallurgical Engineering, McGill University, Montreal, March 1996, 194 pp.
COSENZA P. & GHOREYCHI M. 1996. Coupling between mechanical behaviour and transfer phenomena in salt. Proc. 3
rd Conference Mechanical Behaviour of Salt, Palaiseau, September
1993. Transactions Technical Publication, Clausthal-Zellerfeld, Germany, 285–307.
COWLEY, R. & O’BRIEN G.W. 2000. Identification and interpretation of leaking hydrocarbons using seismic data: a comparative montage of examples from the major fields in Australia’s north west shelf and Gippsland Basin. The 2000 Australian Petroleum Production and
Exploration Association Limited (APPEA) Conference, Brisbane, 7-10 May 2000. APPEA Journal, 40 (1), 121-150.
COX, S.F. 1995. Faulting processes at high fluid pressures: An example of fault-valve behavior from the Wattle Gully Fault, Victoria, Australia. Journal of Geophysical Research, 100, 841– 859.
COX, S.F., KNACKSTEDT, M.A. & BRAUN, J. 2001. Principles of structural control on permeability and fluid flow in hydrothermal systems. Society of Economic Geologists Reviews,
14, 1–24.
CROSSLEY, N.G. 1998. Sonar surveys used in gas-storage cavern analysis. Oil & Gas Journal, May 4, 98-108.
CROTOGINO, F., MOHMEYER, K-U. AND SCHARF, R. 2001. Huntorf CAES: More than 20 years of successful operation. Paper presented at Spring 2001 Meeting, Orlando, Florida, USA, 15-18th
April 2001. (AKE2003H03c_Crotogino_ea_HuntorfCAES_CompressedAirEnergyStorage.pdf).
CUSS, R.J. (1999). An experimental investigation of the mechanical behaviour of sandstones with
reference to borehole stability. Ph.D. thesis, Manchester, UK, University of Manchester.
CUSS, R.J., HORSEMAN, S.T. & HOBBS, P.R.N. 2003. Assessment of surface movement due to the operation of gas storage at Humbly Grove, Hampshire. British Geological Survey (Urban
Geoscience & Geological Hazards Programme), Commercial in Confidence Commissioned
Report CR/03/264, 37 pp.
DALE, T. & HURTADO, L.D. 1997. WIPP air-intake shaft disturbed rock zone study. Proceedings. th
4 Conference Mechanical Behaviour of Salt. Montréal, June 1996. Transactions Technical Publication, Clausthal-Zellerfeld, Germany.
DANDO, P.R., O’HARA, SCHUSTER, U., TAYLOR, L.J. CLAYTON, C.J., BAYLIS, S. & LAIER, T. 1994. Gas seepage from a carbonate-cemented sandstone on the Kattegat coast of Denmark. Marine and Petroleum Geology, 11, 182-189.
DANIELS, L., BELAY, N., RAJAGOPAL, B. S. & WEIMER, P. J. 1987. Bacterial methanogenesis and growth from CO2 with elemental iron as the sole source of electrons. Science, 237, 509–511.
DAVIDSON, M. (in press). Underground gas storage project at Welton Oilfield, Lincolnshire: local perspectives and responses to planning, environmental and community safety issues. Geological Society London, Special Publication.
236

DAVIES, P.B. 1989. Assessing deep-seated subsidence hazards at radioactive waste respository sites in bedded salt. In: JOHNSON, A.M., BURNHAM, C.W., ALLEN, C.A. & MUELHLBERGER, W. (eds). R.H. Jans Memorial Volume, Engineering Geology, 27, 467-487.
DAVIS, T.L. & NAMSON, J.S. 2000. An Evaluation of the Subsurface of the Playa Vista Project Site and Adjacent Area, Los Angeles, CA, Report prepared for Playa Capital Company, LLC, November 16, 2000, Davis and Namson, Consulting Geologists.
DAVIS, T.L. & NAMSON, J.S. 2004. Role of faults in California oilfields: PTTC field trip August
19, 2004. Davis and Namson Consulting Geologists, 3916 Foothill Blvd., Suite B La Crescenta, CA 91214 USA (http://www.davisnamson.com/downloads/PTTC_Field Trip_19Aug04_Final _LoRes.pdf).
DAVIS, D.S. & PENNINGTON, W.D. 1989. Induced seismic deformation in the Cogdell Oilfield of West Texas. Bulletin of Seismological Society America, 79, 1477-1494.
DAVISON, I. ALSOP, G.I. & BLUNDELL, D.J. 1996a. Salt tectonics: some aspects of deformation mechanisms. In: ALSOP, G.I., BLUNDELL, D.J. & DAVISON, I. (eds), Salt Tectonics, Geological Society Special Publication, 100, 1-10.
DAVISON, I. BOSENCE, D., ALSOP, G.I. AL-AAWAH, M.H. 1996b. Deformation and sedimentation around active Miocene salt diapirs on the Tihama Plain, northwest Yemen. In: ALSOP, G.I., BLUNDELL, D.J. & DAVISON, I. (eds), Salt Tectonics, Geological Society Special Publication, 100, 23-39.
DAWSON, C. 1897. Discovery of a large supply of ‘natural gas’ at Waldron, Sussex. Nature, 57, 150-151.
DAWSON, C. 1898. On the discovery of natural gas in East Sussex. Quarterly Journal of the
Geological Society, London, LIV, 564-572.
DAWSON, D.M. & BROOKS. B.J. 1999, The Esso Longford Gas Plant Explosion Report of the
Longford Royal Commission, Government Printer for the State of Victoria.
DEAN, F. 1978. Salt cavity storage. Gas Engineering and Management, Sept 1978. 291-304.
DEAN, F. 1985. The Hornsea salt cavity storage installation. Gas Engineering and Management, Jan 1985. 14, 20-26.
DELTA PROTECTION COMMISSION, 1997. Background report on utilities and infrastructure. A Report to the Delta Protection Commission. 52 pp. (http://72.14.203.104/search?q=cache: LZqGWtzB6rEJ:www.delta.ca.gov/bkgreports/dpcuiocr.PDF+mcdonald+island+pacific+gas+% 26+Electric+explosion&hl=en&gl=uk&ct=clnk&cd=43).
DEFLANDRE, J.P., LAURENT, J. & BLONDIN, E. 1993. Use of permanent geophones for microseismic surveying of a gas storage reservoir. 55th EAEG Meeting, Stavanger, Norway, June 1993.
DEVRIES, K.L., MELLEGARD, K.D. & CALLAHAN, G.D. 2002. Salt Damage Criterion: Proof-of-Concept Research. RESPEC final report 30 September 2000 – 29 September 2002 for United States Department of Energy National Energy Technology Laboratory. Topical Report RSI-1675 DE-FC26-00NT41026, 188 pp. (http://www.osti.gov/energycitations/servlets/purl/818210-GUXuPL/native/818210.PDF).
DEVRIES, K.L., MELLEGARD, K.D., CALLAHAN, G.D. & GOODMAN, W.M. 2005. Cavern roof stability for natural gas storage in bedded salt. RESPEC final report 26 September 2002 – 31 March 2005 for United States Department of Energy National Energy Technology Laboratory. Topical Report RSI-1829 DE-FG26-02NT41651, 191 pp. (http://www.netl.doe.gov/technologies/ oil-gas/publications/Storage/41651_FinalReport.pdf).
237

DICKINSON, J. 1882. Pp. 52 - 117 in Reports of the Inspectors of Mines to Her Majesty’s Secretary of State for the Year 1881. London.
DOE (US Department of Energy), 1980. OSC Strategic Petroleum West Hackberry Oil Storage Cavern Fire and Spill After Action Report.
DOWNEY, M.W. 1984. Evaluating seals for hydrocarbon accumulations. Bulletin American Association of Petroleum Geologists, 68, 1752-1763.
DOYLE, J. 2002. Riding the Dragon: Royal Dutch Shell & the Fossil Fire. Environmental Health Fund, Common Courage Press, Boston, Massaschusetts, 351 pp. (http://www.shellfacts.com/toc. exrpt.html).
DREWRY, S.D. 1995. Los Angeles Basin Province. In: DUNKEL, C.A & PIPER, K.A (eds), National Assessment of United States Oil and Gas Resources. Report to U.S. Department of the Interior Minerals Management Service Pacific OCS Region Office of Resource Evaluation. Carmarillo, CA. 207 pp.
DTI, 2004. Review of electrical energy storage technologies and systems and of their potential
for the UK. Report by EA Technology for the DTI, Contract Number DG/DTI/00055/00/00, URN NUMBER 04/1876, 34 pp (http://www.dti.gov.uk/files/file15185.pdf).
DTI, 2005. Secretary of State’s first report to Parliament on security of gas and electricity supply in Great Britain. July 2005, 29 pp.
DTI, 2006a. Understanding gas supply this winter. Department of Trade and Industry, January 2006, 21pp.
DTI, 2006b. The Energy Challenge: Energy Review Report 2006. Department of Trade and Industry, July 2006, 216 pp.
DTI, 2006c. Undersea salt caverns to help boost UK gas supply. Department of Trade and Industry, Thursday January 12, 2006 (http://www.gnn.gov.uk/content/detail.asp?NavigatedFrom Search=True&NewsAreaID=2&ReleaseID=184001).
DTI, 2006d. Offshore Natural Gas Storage and Liquefied Natural Gas Import Structure: improving the regulatory framework for offshore natural gas storage and offshore LNG unloading – a consultation. An Energy Review Consultation, November 2006, 622007-09-27.
DTI, 2007. Meeting the Energy Challenge: A White Paper on Energy. Department of Trade and Industry, May 2007, 343 pp.
DUKE ENERGY, 2004. Moss Bluff Cavern #1. Well control incident report, August 19, 2004. 68pp. (http://www.solutionmining.org/smri.cfm?a=cms,c,65).
DUSSEAULT, M.B., BACHU, S. & DAVIDSON, B.C. 2001. Carbon Dioxide Sequestration Potential in Salt So Solution Caverns in Alberta, Canada. Solution Mining Research Institute, Fall 2001 Technical Meeting Albuquerque, New Mexico, USA, October 7-10, 13 pp.
EARP, J.R. & TAYLOR, B.J. 1986. The geology of the country around Chester and Winsford. Memoir of the British Geological Survey, Sheet 109, 120 pp.
EBUKANSON, E.J. & KINGHORN, R.R.F. 1985. Kerogen facies in the major Jurassic mudrock formations of southern England and the implication of the depositional environments of their precursors. Journal of Petroleum Geology, 8, 435-462.
EBUKANSON, E.J. & KINGHORN, R.R.F. 1986a. Maturity of organic matter in the Jurassic of southern England and its relation to the burial history of the sedoiments. Journal of Petroleum
Geology, 9, 259-280.
EBUKANSON, E.J. & KINGHORN, R.R.F. 1986b. Oil and gas accumulations and their possible source rocks in southern England. Journal of Petroleum Geology, 9, 413-428.
238
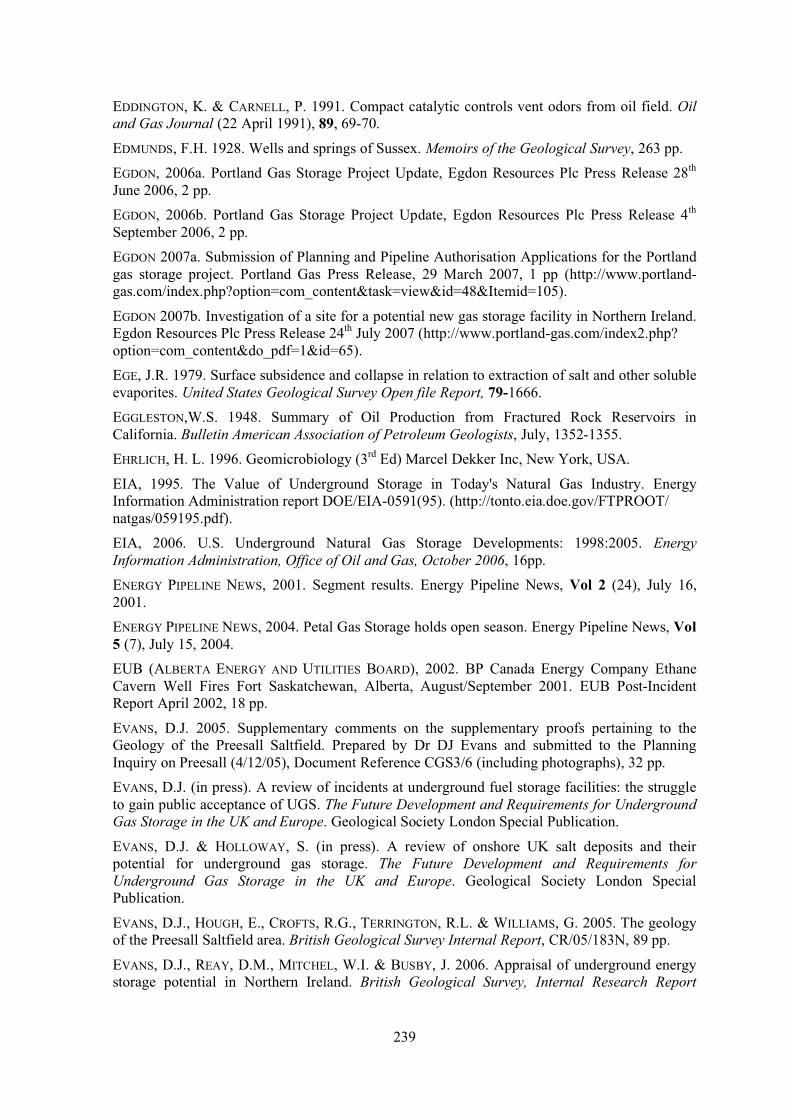
EDDINGTON, K. & CARNELL, P. 1991. Compact catalytic controls vent odors from oil field. Oil
and Gas Journal (22 April 1991), 89, 69-70.
EDMUNDS, F.H. 1928. Wells and springs of Sussex. Memoirs of the Geological Survey, 263 pp.
EGDON, 2006a. Portland Gas Storage Project Update, Egdon Resources Plc Press Release 28th
June 2006, 2 pp.
EGDON, 2006b. Portland Gas Storage Project Update, Egdon Resources Plc Press Release 4th
September 2006, 2 pp.
EGDON 2007a. Submission of Planning and Pipeline Authorisation Applications for the Portland gas storage project. Portland Gas Press Release, 29 March 2007, 1 pp (http://www.portland-gas.com/index.php?option=com_content&task=view&id=48&Itemid=105).
EGDON 2007b. Investigation of a site for a potential new gas storage facility in Northern Ireland. Egdon Resources Plc Press Release 24th July 2007 (http://www.portland-gas.com/index2.php? option=com_content&do_pdf=1&id=65).
EGE, J.R. 1979. Surface subsidence and collapse in relation to extraction of salt and other soluble evaporites. United States Geological Survey Open file Report, 79-1666.
EGGLESTON,W.S. 1948. Summary of Oil Production from Fractured Rock Reservoirs in California. Bulletin American Association of Petroleum Geologists, July, 1352-1355.
EHRLICH, H. L. 1996. Geomicrobiology (3rd Ed) Marcel Dekker Inc, New York, USA.
EIA, 1995. The Value of Underground Storage in Today's Natural Gas Industry. Energy Information Administration report DOE/EIA-0591(95). (http://tonto.eia.doe.gov/FTPROOT/ natgas/059195.pdf).
EIA, 2006. U.S. Underground Natural Gas Storage Developments: 1998:2005. Energy
Information Administration, Office of Oil and Gas, October 2006, 16pp.
ENERGY PIPELINE NEWS, 2001. Segment results. Energy Pipeline News, Vol 2 (24), July 16, 2001.
ENERGY PIPELINE NEWS, 2004. Petal Gas Storage holds open season. Energy Pipeline News, Vol
5 (7), July 15, 2004.
EUB (ALBERTA ENERGY AND UTILITIES BOARD), 2002. BP Canada Energy Company Ethane Cavern Well Fires Fort Saskatchewan, Alberta, August/September 2001. EUB Post-Incident Report April 2002, 18 pp.
EVANS, D.J. 2005. Supplementary comments on the supplementary proofs pertaining to the Geology of the Preesall Saltfield. Prepared by Dr DJ Evans and submitted to the Planning Inquiry on Preesall (4/12/05), Document Reference CGS3/6 (including photographs), 32 pp.
EVANS, D.J. (in press). A review of incidents at underground fuel storage facilities: the struggle to gain public acceptance of UGS. The Future Development and Requirements for Underground
Gas Storage in the UK and Europe. Geological Society London Special Publication.
EVANS, D.J. & HOLLOWAY, S. (in press). A review of onshore UK salt deposits and their potential for underground gas storage. The Future Development and Requirements for
Underground Gas Storage in the UK and Europe. Geological Society London Special Publication.
EVANS, D.J., HOUGH, E., CROFTS, R.G., TERRINGTON, R.L. & WILLIAMS, G. 2005. The geology of the Preesall Saltfield area. British Geological Survey Internal Report, CR/05/183N, 89 pp.
EVANS, D.J., REAY, D.M., MITCHEL, W.I. & BUSBY, J. 2006. Appraisal of underground energy storage potential in Northern Ireland. British Geological Survey, Internal Research Report
239

IR/06/095, prepared for the Department of Enterprise, Trade and Investment (DETI), Northern Ireland, 171 pp.
EVANS, J., JENKINS, D. & GLUYAS, J. 1998. The Kimmeridge Bay oilfield: an enigma demystified. In: UNDERHILL, J.R. & STONELEY, R. (eds), Development, Evolution and Petroleum
Geology of the Wessex Basin, Geological Society, London, Special Publications, 133, 407-413.
EVANS, W.B., WILSON, A.A., TAYLOR, B.J. & PRICE, D. 1968. Geology of the country around Macclesfield, Congleton, Crewe and Middlewich (Sheet 110). Memoirs Geological Survey,
Great Britain.
FABRIOL, H. 1993. AREA 3: Evaluation of safety and stability problems. 6. Prefeasibility of microseismic monitoring. Draft Report Bureau de Recherches Géologiques et Minières, Orleans, France, November 1993, 35 pp.
FÆRSETH, R.B. 2006. Shale smear along large faults: continuity of smear and the fault seal capacity. Journal Geological Society, London, 163, 741-751.
FAVREZ, F. 2003. Up-to-date researches and future trends in underground gas storage facilities: a state of the art review. NATO Advance Research Workshop, “Security of Natural Gas Supply through Transit Countries”, Tbilisi, Georgia, 22-24 May, 2003.
FIELDING, C.R. 1984. A coal depositional model for the Durham Coal Measures of NE England. Journal of the Geological Society, London, 141, 919-931.
FIELDING, C.R. 1986. Fluvial channel and overbank deposits from the Westphalian of the Durham Coalfield, NE England. Sedimentology, 33, 119-140.
FISHER, P.J. & STEVENSON, A.J. 1973. Natural hydrocarbon seeps along the northern shelf of the Santa Barbara Basin, California. Offshore Technology Conference, OTC-1738, 159-166.
FISHER, Q.J. & KNIPE, R.J. 2001. The permeability of faults within siliciclastic petroleum reservoirs of the North Sea and Norwegian Continental Shelf. Marine and Petroleum Geology, 18, 1063-1081.
FÖRSTER, A., NORDEN, B., ZINCK-JØRGENSEN, K., FRYKMAN, P., KULENKAMPFF, J., SPANGENBERG, E., ERZINGER, J., ZIMMER, M., KOPP, J., BORM, G., JUHLIN, C., COSMA, C.G. & HURTER, S. 2006. Baseline characterization of the CO2SINK geological storage site at Ketzin, Germany. Environmental Geosiences, 13, 145-161.
FRANSSEN, R.C.M.W. & SPIERS, C.J. 1990. Deformation of polycrystalline salt in compression and shear at 250-350ºC. In: KNIPE, R.J. & RUTTER, E.H. (eds), Deformation Mechanisms,
Rheology and Tectonics. Geological Society Special Publication, 45, 201-213.
FRASER, A.J. & GAWTHORPE, R.L. 1990. Tectono-stratigraphic development and hydrocarbon habitat of the Carboniferous in northern England. In: HARDMAN, R.F.P. & BROOKS, J (eds),
Tectonic Events Responsible for Britain’s Oil and Gas Reserves, Geological Society London Special Publication, 55, 49-86.
FRASER, A.J. & GAWTHORPE, R.L. 2003. An Atlas of Carboniferous Basin Evolution in Northern England. Geological Society, London, Memoir, 28, 79 pp.
FRASER, A.J., NASH, D.F., STEELE, R.P. & EBDON, C.C. 1990. A regional assessment of the intra-Carboniferous play of northern England. In: BROOKS, J. (ed.), Classic Petroleum
Provinces. Geological Society London Special Publication, 50, 417-440.
FREEMAN, B., YIELDING, G., NEEDHAM, D.T. & BADLEY, M.E. 1998. Fault seal prediction: the gouge ratio method. In: COWARD, M.P., DALTABAN, T.S. & JOHNSON, H. (eds.) Structural
Geology In Reservoir Characterisation. Geological Society London, Special Publication, 127
19-25.
240

FRISTAD, T., GOTH, A., YEILDING, G. & FREEMAN, B. 1997. Quantitative fault seal prediction: a case study from Oseberg Sud. In MOLLER, P. & KOESTLER, A.G. (eds.) Hydrocarbon Seals:
Importance for Exploration & Production. NPF Special Pub., 7, 107-124.
FRITSCHE, A.F. Editorial, severe accidents: can they occur only in the nuclear production of electricity? Risk Analysis, 12, 327-329.
FROST, D.V. 1998. Geology of the country around Northallerton. Memoir British Geological Survey, England and Wales, Sheet 42, HMSO, London.
GAIR, D.J. GRIST, D.M. & MITCHELL, R.W. 1980. The East Midlands Additional Oil Project. European Offshore Petroleum Conference & Exhibition, London, October 21-24 1980, SPE paper 195, 487-495.
GAMES K.P. 2001. Evidence of shallow gas above the Connemara oil accumulation, Block 26/28, Porcupine Basin. In: SHANNON, P.M., HAUGHTON, P.D.W. & CORCORAN, D.V. (eds), The
Petroleum Exploration of Ireland’s Offshore Basins. Geological Society, London, Special Publications, 188, 361-373.
GARTRELL, A.P., ZHANG, Y., LISK M. & DEWHURST, D. 2003. Enhanced hydrocarbon leakage at fault intersections: an example from the Timor Sea, Northwest Shelf, Australia. Journal of
Geochemical Exploration, 78-79, 361–365.
GARTRELL, A.P., ZHANG, Y., LISK M. & DEWHURST, D. 2004. Fault intersections as critical hydrocarbon leakage zones: integrated field study and numerical modelling of an example from the Timor Sea, Australia. Marine and Petroleum Geology, 21(9), 1165-1179.
GASAG, 2004. Gasexplosion am Brandensteinweg in Spandau (http://www.gasag.de/de/ privatkunden/index.html)
GAUNT, G.D. 1994. Geology of the country around Kingston upon Hull and Brigg (Sheets 80 and 89). Memoirs Geological Survey, England and Wales.
GAUNT, G.D., FLETCHER, T.P. & WOOD, C.J. 1992. Geology of the country around Goole, Doncaster and the Isle of Axholme (Sheets 79 and 88). Memoirs Geological Survey, England
and Wales.
GDF, 1996. Safe, Environmentally Sound Underground Storage Solutions. Gaz de France, Research and Development Division, Underground Storage Department, 20 pp.
GDF, 2006. Mechanical damage: how big is the problem? A European perspective. Mechanical Damage Workshop: February 29th-1st March, 2006. Dr. Mures Zarea, Gaz de France R&D Division (http://primis.phmsa.dot.gov/rd/mtgs/022806/17_RemarksZarea.pdf).
GDF, 2007. Gaz de France to Develop Large Gas Storage Facility in England. Gaz de France Press Release, Tuesday 28 August 2007(http://www.oilvoice.com/Gaz_de_France_to_Develop_ Large_Gas_Storage_Facility_in_Engla/10561.htm).
GEBHARDT, F., EBY, D. & BARNETT, D. 1996. Novel coiled tubing application controls large LPG storage well fire. World Oil, 217 (6), 43-46.
GEOL. SOC., 1985. Photographic Feature: Liquified petroleum gas caverns at South Killingholme. Quarterly Journal of Engineering Geology & Hydrogeology, 18, pp ii-iv.
GLENDINNING, I. 1981. Compressed air storage. Physics in Technology, 12, 103-110.
GLENNIE, K.W. Chapter 3: Early Permian – Rotliegend. In: GLENNIE, K.W. (ed), Introduction to nd
the Petroleum Geology of the North Sea, 2 Edition. Blackwell Scientific Publications, 63-85.
GOLDEN, F. 1981. Hideaways for Nuclear Waste. Time, Monday March 16 1981, 2 pp (http://www.time.com/time/magazine/article/0,9171,922475-1,00.html).
241

GOODALL, D.C. 1986. Containement of gas in rock caverns. PhD Thesis, Department of Civil Engineering, Unioversity of California, Berkeley.
GOODALL, D.C., ÅBERG B. & BREKKE, T.L. 1988. Fundamentals of gas containment in unlined rock caverns. Rock Mechanics & Rock Engineering, 21(4), 235-258.
GRIGGS, D.T. 1967. Hydrolitic weakening of quartz and other silicates. Geophysical Journal
Royal Astronomical Society, 14, 19-31.
GRIST, D.M., MUSGRAVE, F. & MITCHELL, R.W. 1982. The East Midlands Oil Project Two Years On. Paper EOR 297 presented at European Petroleum Conference, London, 25-28 October, 1982.
GRUHN, P.E. 2003. Avoid disasters for automation's future: Could this happen to you? InTech Article (http://www.isa.org/InTechTemplate.cfm?Section=Article_Index&template=/Content Management/ContentDisplay.cfm&ContentID=27816).
GRUNAU, H.R. 1987. A worldwide look at the caprock problem. Journal of Petroleum Geology, 103, 245-266.
GUION, P.D. & FIELDING, C.R. 1988. Westphalian A and B sedimentation in the Pennine Basin, UK. In: BESLY, B.M. & KELLING, G. (eds) Sedimentation in a synorogenic basin complex: the
Upper Carboniferous of northwest Europe, Blackie, Glasgow and London, 153-177.
GUTIERREZ, M., ØINO, L.E. & NYGÅRD, R. 2000. Stress dependent permeability of a de-mineralised fracture in shale, Marine and Petroleum Geology, 17, 895–907.
HABEL, R. 2005. The Status of Natural Gas Development in Northern California. PTTC
(Petroleum Technology Transfer Council) Workshop, Gas Field Technology: Solutions from the
Field, Sacramento, California April 28, 2005 (http://www.pttc.org/solutions/sol_2005/547.htm).
HALBOUTY, M. T. 1979. Salt Domes: Gulf region, United States and Mexico. 2nd Edition. Gulf Publishing Company Book Division, Houston, Texas. 561 pp.
HAMILTON, D.H & MEEHAN, R.L. 1992. Cause of the 1985 Ross Store Explosion and Other Gas Ventings, Fairfax District, Los Angeles. Engineering Geology Practice in Southern California, Association of Engineering Geologists, Special Publication No. 4, 1992 (http://www.stanford.edu/~meehan/class/ce2942001/rosspaper.htm).
HAMILTON, W.N. & OLSEN, R.A. (1994). Mineral Resources of the Western Canada Sedimentary Basin. In: MOSSOP, G.D. & SHETSON, I. (eds), Geological Atlas of the Western
Canada Sedimentary Basin, Canadian Society of Petroleum Geologists and Alberta Research Council, Calgary, Alberta, (http://www.ags.gov.ab.ca/publications/ATLAS_WWW/ATLAS.shtml).
HANCOCK, F.R.P & MITHERN, D.P.1987. The geology of the Humbly Grove Oilfield, Hampshire, UK. In: BROOKS, J. & GLENNIE, K.W. (eds), Petroleum Geology of North West
Europe, Graham & Trotman, 161-170.
HARDY, H.R. JR. ET AL. 1972a. A Study to Evaluate the Stability of Underground Gas Storage Reservoirs. PRCI (Pipeline Research Council International, Inc.) Report, Project Number PR-12-43, Catalogue Number L19724e, Pennsylvania State University, 426 pp.
HARDY, H.R. JR., KIMBLE, E.J. JR., KHAIR, A.W., KIM, R.Y., MOWREY, G.L., COMEAU, J., BECK, L.A. & GOPWANI, M.V. 1972b. Feasibility of Utilizing Microseismic Techniques for the Evaluation of Underground Gas Storage Reservoir Stability. PRCI (Pipeline Research Council International, Inc.) Report, Project Number PR-12-43, Catalogue Number L19725e, Pennsylvania State University, 276 pp.
HARDY, H.R. JR. & MOWREY, G.L. 1981. A Microseismic Study of an Underground Natural Gas Storage Reservoir Volume 2 - Compilation of Field Data, Analysis, and Results. PRCI (Pipeline
242

Research Council International, Inc.) Report, Project Number PR-12-75, Catalogue Number L51397e, Pennsylvania State University, 396 pp.
HARDY, H.R. JR., MOWREY, G.L. & KIMBLE, E.J. JR. 1981. A Microseismic Study of an Underground Natural Gas Storage Reservoir Volume 1 - Instrumentation and Data Analysis Techniques, and Field Site Details. PRCI (Pipeline Research Council International, Inc.) Report, Project Number PR-12-75, Catalogue Number L51396e, Pennsylvania State University, 370 pp.
HARVEY, M.J. & STEWART, S.A. 1998. Influence of salt on the Channel Basin. In: UNDERHILL, J.R. (ed), Development, Evolution and Petroleum Geology of the Wessex Basin, Geological Society, London, Special Publication, 133, 241-266.
HAUG, B. 2005. The Iowa stored energy plant: a project review and update. Powerpoint presentation, Iowa Association of Municipal Utilities, May 2005. (file:///C:/Documents%20and %20Settings/dje/Local%20Settings/Temporary%20Internet%20Files/Content.IE5/OJ98L9ZC/35 1,9,The Alabama CAES plant).
HAWKES, P.W., FRASER, A.J. & EINCHCOMB, C.C.G. 1998. The tectonostratigraphic development and exploration history of the Weald and Wessex Basins, southern England. In:
UNDERHILL, J.R. & STONELEY, R. (eds), Development, Evolution and Petroleum Geology of the
Wessex Basin, Geological Society, London, Special Publications, 133, 39-65.
HAZARDS INTELLIGENCE, 2005. Gas Pipeline Explosion at Ghislenghien, Belgium. HInt Dossier: http://www.saunalahti.fi/ility/Dossiers/Dossier%20Ghislenghien.htm
HEARD, H.C. 1972. Steady-state flow in polycrystalline halite at pressure of 2 kilobars. In: HEARD, H.C., BORG, I.Y., CARTER, N.L. & RALEIGH, C.B. (eds), Flow and Fracture of Rocks. American Geophysical Union, Geophysical Monograph, 16, 191-210.
HEGGLAND, R. 1997. Detection of gas migration from a deep source by the use of exploration 3D seismic data. Marine Geology, Vol. 137, 41-47.
HEGGLAND, R. and NYGAARD, E., 1998, Shale intrusions and associated surface expressions -examples from Nigerian and Norwegian deepwater areas, Proceedings of Offshore Technology
Conference (OTC), Houston, 4 - 7 May 1998, Vol. 1, 111 - 124.
HEGGLAND, R., 2005, Using gas chimneys in seal integrity analysis, A discussion based on case histories, AAPG Hedberg Volume "Evaluating the Hydrocarbon Sealing Potential of Faults and
Caprocks".
HEITMANN, N. 2005. Proof of Evidence: Solution Mining – Appendix 6: Drilling Program for Fleetwood Storage Wells. Canatxx Gas Storage Preesall Gas Storage Project, Document
Number CGS/4/2, 53 pp, plus Appendices volume.
HERMANSEN, H., LANDA, G.H., SYLTE, J.E. & THOMAS L.K. 2000. Experiences after 10 years of waterflooding the Ekofisk Field, Norway. Journal of Petroleum Science and Engineering, 26,
11–18.
HINKEBEIN, T.E., BAUER, S.J., EHGARTNER, B.L., LINN, J.K., NEAL, J.T., TODD, J.L., KUHLMAN, P.S., GNIADY, C.T. & GILES, H.N. 1995. Gas intrusion into SPR caverns. Albuquerque NM: Sandia Laboratories. Report SAND94-0023, 128 pp, (http://www.osti.gov/energycitations/ servlets/purl/206492-3f3rvB/webviewable/206492.pdf)
HIRSCHBERG, S., SPIEKERMAN, G. & DONES, R. 1998. Severe accidents in the energy sector: first edition. Project GaBE: Comprehensive Assessment of Energy Systems, for the Swiss Federal
Office of Energy, Report Number PSI Bericht Nr. 98-16, Paul Scherrer Institute, Villigen, Switzerland, November 1998.
HIRSCHBERG, S., BURGHERR, P., SPIEKERMAN, G. & DONES, R. 1998. Severe accidents in the energy sector: comparative perspective. Journal of Hazardous Materials, 111, 57-65.
243

HIRST, C. 1985. The last days of the first commercial gas find. Petroleum Review, June 1985, 24-25.
HOBBS, B.E., MEANS, W.D. & WILLIAMS, P.F. 1976. An Outline of Structural Geology. Wiley International Edition, John Wiley & Sons, Inc., 571 pp.
HODGE, T. 2003. The Saltfleetby Field, Block L 47/16, Licence PEDL 005, Onshore UK. In: GLUYAS, J.G. & HITCHENS, H.M. (eds), United Kingdom Oil and Gas Fields, Commemorative
Millenium Volume, Geological Society, London, Memoir, 20, 911-919.
HOGG, A.J.C., EVANS, I.J., HARRISON, P.F., MELING, T. SMITH, G.S., THOMPSON, S.D. & WATTS, G.F.T. 1999. Reservoir management of the Wytch Farm Oil Field, Dorset, UK: providing options for growth into later field life. In: FLEET, A.J. & BOLDY, S.A.R. (eds),
thPetroleum Geology of Northwest Europe: Proceedings of the 5 Conference, Geological Society London, 1157-1172.
HOLAND, P. & HOLLAND, P. 1997. Offshore blowouts – causes and controls. Gulf Publishing Company, 176 pp.
HOLLOWAY, S., KIRK, K., SMITH, N. & EVANS, D.J. 2006. The potential for CO2 storage from RWE Npower’s Tilbury power station. British Geological Survey Commissioned Report series
CR/06/229, 54 pp.
HOLLOWAY, S., ROCHELLE, C.A., BATEMAN, K., PEARCE, J.M., BAILY, H.E., METCALFE, R., CZERNICHOWSKI-LAURIOL, I., SANJUAN, B., BARBIER, J., FABRIOL, H., SUMMERFIELD, I.R., LINDEBERG, E., SCHWARZKOPF, T., PUTTER, J., KRUMBECK, M., MOLLER, H., GAIDA, K.A., KAARSTAD, O., BERGER, B. HEEDERIK, J.P., VAN DER MEER, L.G.H., VAN DER STRAATEN, R., ELEWAUT, E., KOELEWIJN, D., COX, H., HARRISON, R. & DOHERTY, P. 1996: The Underground
Disposal of Carbon Dioxide. Final Report of Joule II Project No. CT92-0031.
HOLST, K. 2005. Iowa stored energy plant: status report, 2005. California Energy Commission Powerpoint presentation, February, 2005. (http://www.energy.ca.gov/pier/notices/2005-02-24_workshop/09%20Kent%20Holst-IOWA%20presentation.pdf).
HOPPER, J.M. 2004. Gas storage and single-point failure. Natural Gas, Hart Energy Publishing, LP, 4545 Post Oak Place, Ste. 210, Houston, 4 pp.
HORSEMAN, S. T. & HANDIN, J. 1990. Triaxial compression tests on rocksalt at temperatures from 50ºC to 200ºC and strain rates from 10-4 to 10-9/s. Geophysical Monographs, American
Geophysical Union, 56, 103-110.
HORSEMAN, S. T., RUSSEL, J.E., HARDIN, J. & CARTER, N.L. 1993. Slow experimental deformation of Avery Island Salt. In: KAKINHANA, H., HARDY JR., H.R., TOSHI, T. & TOYOKURA, K. (eds), Proceedings Seventh International Symposium on Salt, April 6-9 1992, Kyoto, Japan. Elsevier, Amsterdam, Vol. 1, 67-74.
HOVLAND, M. 2002. On the self-sealing nature of marine seeps. Continental Shelf Research, Vol. 22, 2387-2394.
HOVLAND, M. & JUDD A.G. 1988. Seabed Pockmarks and Seepages. Graham and Trotman, London, 293 pp.
HOVLAND, M. and SUMMERVILLE, J.H. 1985. Characteristics of two natural gas seepages in the North Sea. Marine and Petroleum Geology, 2, 319-326.
HOWELL, F.T. 1984. Salt karst of the Cheshire Basin, England. In: CASTANY G, GROBA E, ROMIJN E (eds) Hydrogeology of karstic terranes. International Association Hydrogeologists, International Contributions to Hydrogeology, 1, 252–254.
HOVORKA, S.D. 2000. Characterization of Bedded Salt for Storage Caverns — A Case Study from the Midland Basin, Texas. Bureau of Economic Geology, University of Austin, Texas, Geological Circular, GC0001, 80 pp.
244

HSE, 1975. ‘The Flixborough Disaster: Report of the Court of Inquiry’, Health and Safety Executive, H MSO, ISBN 0113610750, 1975.
HSE, 1985. ‘The Abbeystead explosion: a report of the investigation by the Health and Safety Executive into the explosion on 23 May 1984 at the valve house of the Lune/Wyre Water Transfer Scheme at Abbeystead’, ISBN: 0118837958.
HSE, 2001. Press Release E161:01 - 18 September 2001: HSE announces accelerated gas mains replacement programme.
HSE, 2006. Catastrophic failure of shell and tube production cooler. Health and Safety Executive Offshore safety alert 01/2006 Issue date May 2006 (http://www.hse.gov.uk/offshore/alerts/sa_01 _06.htm).
HSIEH, P.A. & BREDEHOEFT, J.D. 1981. A reservoir analysis of the Denver Earthquakes: a case of induced seismicity. Journal of Geophysical Research, 86, 903-920.
HUBBERT, M. K., 1953, Entrapment of petroleum under hydrodynamic conditions: Bulletin
American Association Petroleum Geologists, 37, 1954-2026.
HUBBERT, M.K. & RUBEY, W.W. 1959. Role of fluid pressure in mechanics of overthrust faulting: 1 - Mechanics of fluid-filled porous solids and its application to overthrust faulting. Bulletin Geological Society America, 70, 115-166.
HUGOUT B. 1988. Mechanical behavior of salt cavities - in situ tests - model for calculating the cavity volume evolution. Proceedings 2
nd Conference Mechanical Behaviour of Salt, Hannover,
September 1984, Transactions Technical Pulication, Clausthal-Zellerfeld, Germany, 291-310.
HUMPHRIES, M. & BARRETT, J. 2005. Opening remarks on behalf of the Appellant. Proposed natural gas storage facility, Preesall Saltfield. Application for Planning Permission and Hazardous Substance Consent for the storage of Natural Gas, Preesall Saltfield. Appeal by Canatxx Gas Storage Limited. Document Number CGS/0/4, 50 pp.
HUNT, I.L. 2004. Factors of gas migration within the Mt Simon and Eau Claire formations in the underground gas storage field at Troy Grove, Illinois. Geological Society of America, 2004
Denver Annual Meeting (November 7–10, 2004) Denver, Colorado, Paper No. 148-14.
HUNT, J.M. 1979. Petroleum geochemistry and geology: San Francisco. W.H. Freeman, 617 pp.
HUSEYNEV, D.A. and GULIYEV, I.S. 2004. Mud volcanic natural phenomenon in the South Caspian Basin: geology, fluid dynamics and environmental impact. Environmental Geology, 46(8), 1012-1023.
HYDER CONSULTING, 2005. Proposed Natural Gas Storage Facility, Preesall Salt Field, Lancashire: clarification of potential for gas migration and consequences of subsidence. Report by Hyder (2005) Consulting (UK) Ltd to Canatxx Gas Storage Ltd, 5th October 2005, 16 pp.
IAVWOPSG, 2005. Accidental release of toxic chemicals into the atmosphere. International Airways Volcano Watch Operations Group (IAVWOPSG), Second Meeting, Lima, Peru, 26 to 30 September 2005. International Civil Aviation Organization Working Paper (IAVWOPSG/2-WP18), 6pp. (http://www.icao.int/anb/iavwopsg/meetings/iavwopsg2/wp/WP18.pdf).
IANNACCHIONE, A.T., GRAU, R.H. III, SAINATO, A., KOHLER, T.M. & SCHATZEL, S.J. 1984. Assessement of methane hazards in an anomalous zone of a Gulf Coast salt dome. Washington DC: US Bureau of Mines Report of Investigations No. RI-8861, 26 pp.
IEA (1999). Pre-Effective Amendment to Registration Statement of a Foreign Private Issuer for Securities Offered Pursuant to a Transaction - Form F-3. SEC form prepared by Gaffney, Cline & Associates Ltd for Independent Energy Holdings plc. (IEUKL), SEA File F-3/A On 9/8/99 EX-99. Filed On 9/8/99, SEC File 333-85719, Accession Number 899243-99-1923 (http://64.233.169.104/search?q=cache:RMu6ZGmidGwJ:www.secinfo.com/dRE54.61Sc.6.htm +elswick+porosity+and+permeability&hl=en&ct=clnk&cd=11&gl=uk&lr=lang_en).
245

IMBUS, S. & CRISTOPHER, C. 2005. Key findings, technology gaps and the path forward. In: THOMAS, D.C. & BENSON, S.M. (eds), Carbon Dioxide Capture for Storage in Deep Geologic
Formations, Volume 2, Elsevier Limited, 1317-1321.
JACKSON, D.I., MULHOLLAND, P. & JONES, S.M. & WARRINGTON, G. 1987. The geological framework of the East Irish Sea Basin. In: BROOKS, J & GLENNIE, K (eds) Petroleum Geology of North West Europe. Graham & Trotman, 191-203.
JACKSON, D.I., JACKSON, A.A., WINGFIELD, R.T.R., BARNES, R.P. & ARTHUR, M.J. 1995. The
geology of the Irish Sea. British Geological Survey, United Kingdom Offshore Regional Report, HMSO, London.
JACKSON, D.I. & JOHNSON, H. 1996. Lithostratigraphic nomenclature of the Triassic, Permian and Carboniferous of the UK offshore East Irish Sea Basin. British Geological Survey.
JACKSON, D.I. & MULHOLLAND, P. 1993. Tectonic and stratigraphic aspects of the East Irish Sea Basin and adjacent areas: contrasts in their post-Carboniferous structural styles. In: PARKER, J.R. (ed.), Petroleum Geology of Northwest Europe: Proceedings of the 4
th Conference Geological
Society, London, 791-808.
JACKSON, D.I., MULHOLAND, P., JONES, S.M. & WARRINGTON, G. 1987. The geological framework of the East Irish Sea Basin. In: BROOKS, J. & GLENNIE, K.W. (eds) Petroleum
Geology of North West Europe. Graham & Trotman, London, 191-203.
JACKSON, D.S. 2005. Geology and related matters. Proof of Evidence submitted to the Canatxx Gas Storage Public Inquiry, Documents J/1/5 and J/3/1, September 2005.
JACKSON, I., 2004. Britain beneath our feet, Occasional Publication. British Geological Survey.
JACKSON, M.P.A. & SENI, S.J. 1983. Geometry and evolution of salt structures in a marginal rift basin of the Gulf of Mexico, east Texas. Geology, 11, 131-135.
JACKSON M.P.A. & TALBOT, C.J. 1986. External shapes, strain rates and dynamics of salt structures. Bulletin American Geological Society America, 97, 305-323.
JACKSON, M. P. A., VENDEVILLE, B. C., & SCHULTZ-ELA, D. D. 1994. Structural dynamics of salt systems. Annual Review of Earth and Planetary Sciences, 22, p. 93–117.
JACOBY, C.H. 1974. Solution mining of evaporites. In: APLAN, F.F. (ed) Solution Mining
Symposium: New York, American Institute of Mining, Metallurgy and Petroleum Engineering, 165-171.
JAFFE, W., LOCKYER, R. & HOWCROFT, A. 1997. The Abbeystead Explosion Disaster. Annals of
Burns and Fire Disasters, Vol. 10(3), 6pp.
JENYON, M.K. 1986a. Some consequences of faulting in the presence of a rock salt interval. Journal of Petroleum Geology, 9, 29-52.
JENYON, M.K. 1986b. Salt Tectonics. Elsevier Applied Science Publishers Ltd.: Barking. ISBN 1 85166 015 1.
JENYON, M.K. 1986c. Salt with a pinch of water. Nature, 324, 515-516.
JENYON, M.K. 1990. Oil and Gas Traps: aspects of their seismostratigraphy, morphology and
development. Wiley; Chichester, New York, 398 pp.
JEREMIC, M.L. 1985. Strata mechanics in Coal Mining. Taylor & Francis (ISBN 9061915562), 568 pp.
JNC, 2000. H12: Project to Establish the Scientific and Technical Basis for HLW in Japan. Report in 5 volumes. JNC TN1410 2000-004.
JOFFRE, G-H. & LEPRINCE, A. 2002. Database for major accidents on underground gas storage
facilities. Marcogaz Report; DES.ST-GHJ/TLA-2000.00023, 6 pp. (http://marcogaz.org/
246

information/index_info3.htm).
JOHNSON, C. 1962. Gas reservoirs in British porous rock structures. Journal of the Institution of
Gas Engineers, 2, 159-178.
JONES, V.T, AND S.G. BURTELL, 1994, Offshore Sniffer Survey: High Island Area, Gulf of Mexico. Presented AAPG Hedberg Research Conference, Near-Surface Expression of Hydrocarbon Migration, Vancouver, British Columbia, Canada, April 24-28, 1994.
JONES, V.T. & DROZD, R.J. 1983. Predictions of Oil and Gas Potential by Near-Surface Geochemistry. Bulletin American Association of Petroleum Geologists, 67, 932-952.
JONES, V.T & PIRKLE, R.J. 2004: http://www.eti-geochemistry.com/FinalVersion1.10.htm
JUDD, A., DAVIES, G., WILSON, J., HOLMES, R., BARON, G. & BRYDEN, I. 1997. Contributions to atmospheric methane by natural seepages on the UK Continental Shelf. Marine Geology, 137, 165-189.
JUHLIN, C., GIESE, R., ZINCK-JØRGENSEN, K., COSMA, C., KAZEMEINI, H., JUHOJUNTTI, N., LÜTH, S., NORDEN, B. & FÖRSTER, A. 2007. 3D baseline seismics at Ketzin, Germany: The CO2SINK project. Geophysics, 72, B121-B135.
KAMEDO, 2000. Thirty-five years of disaster medicine studies: experience from KAMEDO’s operations 1963-1998. Socialstyrelsen, The National board of Health and Welfare, Sweden, Elanders Gotab. 140pp. (http://www.socialstyrelsen.se/NR/rdonlyres/EFDCB785-DE88-48EC-BDC6-FD604DC573DD/1901/0000081.pdf).
KANSAS GEOLOGICAL SURVEY, 2001. Survey Responds to Hutchinson Natural Gas Explosion. The Geologic Record, Spring 2001, Kansas Geological Survey, Volume 7.2. (http://www.kgs.ku.edu/Publications/GeoRecord/2001/vol7.2/Page1.html).
KANTER, J. 2007. New technology would store carbon underground. International Herald
Tribune, August 6 2007, 2 pp (http://www.iht.com/articles/2007/08/06/business/carbon.php).
KATTERHORN, S.A. & POLLARD, D.D. 2001. Integrating 3-D seismic data, field analogs and mechanical models in the analysis of segmented normal faults in the Wytch Farm oil field, southern England, United Kingdom. Bulletin American Association of Petroleum Geologists, 85, 1183-1210.
KATZ, D.L. 1974. Outlook for Underground Storage. In: COOGAN, A.H. (ed), Fourth Symposium
on Salt, Volume Two. The Northern Ohio Geological Society Inc., Cleveland, Ohio, 252-258.
KATZ, D.L. 1999. Containment of gas in storage fields. In: Gas Storage Reprint No. 50, Society Petroleum Engineers. Society Petroleum Engineers, Reprint Series, 50, 28-33.
KATZ, D.L. & COATS, K.H. 1968. Underground storage of fluids. Urich’s Books, Ann Arbor, Michigan, USA.
KATZ, D.L. & TEK, M. R. 1981. Overview of Underground Storage of Natural Gas. Journal of
Petroleum Geology, 33, 943-951.
KATZUNG, G., KRULL, P. & KÜHN, F. 1996. The Disaster of the UGS-Probe "Lauchstädt 5" in the Year of 1988 - effects and geological circumstances. Zeitschrift für Angewandte Geologie, vol 42 (see: http://www.kgs.ku.edu/Hydro/Hutch/GasStorage/other.html).
KDHE, 1997. Letter from J.J. O’Connell, Kansas Department of Health and Environment (KDHE) to Dr L.C. Gerhard, Director, Kansas Geological Survey, January 22, 1997, 2 pp (http://www.kgs.ku.edu/Hydro/Hutch/GasStorage/jan_22_97.pdf).
KENT, P. E. 1979. The emergent Hormuz salt plugs of southern Iran. Journal of Petroleum
Geology, 2, 117–144
247

KENT, P. E. 1987. Island salt plugs in the Middle East and their tectonic implications. In: LERCHE, I. & O’BRIEN, J. J. (eds), Dynamical Geology of salt and related structures. Academic, New York, 3–37.
KETTEL, D. 1996. A Method for Processing Adsorbed Methane Stable Isotope Data from Near Surface Based Fractionation. In: SCUMACHER, D. & ABRAMS, M.A. (eds), Hydrocarbon Migration and Its Near-Surface Expression, AAPG Memoir, 66, 319-336.
KHILYUK, L.E., CHILINGAR, G.V., ROBERTSON, J.O. JR. & ENDRES, B. 2000. Gas Migration: events preceding earthquakes. Gulf Publishing Company, Houston, Texas, 400 pp.
KING, G. 1983. The accommodation of large strains in the upper lithosphere of the earth and other solids by self-similar fault systems: the Geometrical origin of b-value, Pure and Applied
Geophysics, 121, 761–815.
KIRBY, G.A., AITKENHEAD, N., BAILY, H.E., CHADWICK, R.A., EVANS, D.J., HOLLIDAY, D.W.H., HOLLOWAY, S., HULBERT, A.G. & SMITH, N.J.P. 2000. The Structure and Evolution of
the Craven Basin and adjacent areas. Subsurface Memoir of the British Geological Survey, 130 pp.
KIRBY, G. A. & SWALLOW, P. W. 1987. Tectonism and Sedimentation in the Flamborough Head Region of North-East England. Proceedings of the Yorkshire Geological Society, 46, 301–309.
KLUSMAN, R.W. 1993. Soil gas and related methods for natural resource exploitation. John Wiley & Sons, Chichester, UK and New York, 483 pp.
KNEPPER, G.A. & CUTHBERT, J.F. 1979. Gas storage problems and detection methods, 54th
Annual Fall Technical Conference and Exhibition of the Society of Petroleum Engineers of
AIME, Paper No. 8412.
KNIGHT, L.D. & PRESNELL, S.E. 2005. Death by Sewer Gas: Case Report of a Double Fatality and Review of the Literature. American Journal of Forensic Medicine & Pathology, 26(2):181-185.
KNIPE, R.J. 1992. Faulting processes and fault seal. In: LARSEN, R.M., BREKKE, B.T. & TELLERAS, E. (eds), Structural and tectonic modelling and its application to petroleum geology, Norwegian Petroleum Society (NPF) Special Publication 1 (1992), 325–342.
KNIPE, R.J. 1997. Juxtaposition and seal diagrams to help analyze fault seals in hydrocarbon reservoirs. Bulletin American Association Petroleum Geologists, 81, 187-195.
KNOTT, T. 2003. With a pinch of salt. Offshore Engineer, December 2003 (http://www.oilonline. com/news/features/oe/20031203.With_a_p.13001.asp).
KOLATA, D.R. & WILSON, W.J. 1991. Tectonic history of the Illinois Basin. In: LEIGHTON, D.R., KOLATA, D.D., OLTZ, D.F. & EIDEL, J.J. (eds), Interior Cratonic Basins, Memoir American Association Petroleum Geologists, 51, 263-286.
KOPER, K.D., WALLACE, T.C. & ASTER, R.C. 2003. Seismic recordings of the Carlsbad, New Mexico, pipeline explosion of 19 August 2000. Bulletin of the Seismological Society of America, 93(4), 1427-1432.
KOSSOW, D., KRAWCZYK, C., MCCANN, T., STRECKER, M., & NEGENDANK, J.F.W. 2000. Style and evolution of salt pillows and related structures in the northern part of the Northeast German Basin. International Journal of Earth Sciences, 89, 652-664.
KROOSS, B.M. & LEYTHAEUSER, D. 1996. Chapter 14: Molecular Diffusion of Hydrocarbons in Sedimentary Rocks and Role in Gas Migration. In: SCUMACHER, D. & ABRAMS, M.A. (eds), Hydrocarbon Migration and Its Near-Surface Expression, AAPG Memoir, 66, 173-183.
248

KROOSS, B.M., LEYTHAEUSER, D. & SCHAEFER, R.G. 1992a The quantification of diffusive hydrocarbon losses through caprocks of natural gas reservoirs – a reevaluation. Bulletin
American Association of Petroleum Geologists, 76(3), 403-406.
KROOSS, B.M., LEYTHAEUSER, D. & SCHAEFER, R.G. 1992b. The quantification of diffusive hydrocarbon losses through caprocks of natural gas reservoirs – a reevaluation: reply. Bulletin
American Association of Petroleum Geologists, 76(11), 1842-1846.
LAHERRÈRE, J. 1997. Distribution and evolution of “recovery factor”. IEA Oil Reserves
Conference, Paris, France, November 11, 1997. (http://dieoff.org/page183.pdf).
LAIER, T. & ØBRO, H. 2004. Environmental and safety monitoring of the underground gas storage facility at Stenlille, Denmark. Abstract from ‘The Future Development and Requirements for Underground Gas Storage in the UK and Europe’. Geological Society London Conference,
thAberdeen, October 19-20 2004 (Convened by EVANS, D.J., CHADWICK, R.A. & ROWLEY, W.J.).
LAIER, T. & ØBRO, H. (in press). Environmental and safety monitoring of the underground gas storage facility at Stenlille, Denmark. Underground Gas Storage in the UK. Geological Society London, Special Publication.
LAILLE, J-P., COULOMB, C. & TEK, M.R. 1986. Underground storage in Cerville-Velaine, France: A case history in conversion and inert gas injection as cushion substitute. Society of
Petroleum Engineers, SPE-15588.
LAILLE, J-P., MOLINARD, J-E., & WENTS, A. 1988. Inert gas injection as part of the cushion of the underground storage of Saint-Clair-Sur-Epte, France. Society of Petroleum Engineers, SPE-17740, 343–352.
LANDES, K.K., AMORUSO, J.J., CHARLESWORTH, L.J. HEANY, F. & LESPERANCE, P.J. 1960. Petroleum resources in basement rocks. Bulletin of the American Association of Petroleum
Geologists, 44(10), 1682-1691.
LEBLANC, R. JR, & JONES, V.T. III. 2004. Assessment of Casing Leaks from Wells in Oil and Gas Fields and Gas Storage Fields to Determine Environmental Hazards in Areas of Urban Development. Abstract: AAPG Conference Session Ground Water Issues: Resource,
Exploration, Exploitation, and Remediation (DEG).
LEE, C.A. 1968. McDonald Island Gas Storage Field, San Joaquin County, California. In: BEEBE, W. & CURTIS, B.F. (eds), Natural Gases of North America, American Association of Petroleum Geologists, Tulsa, Oklahoma, Memoir 9 (Volume 1), 102-103.
LEES, G.M. & COX, P.T. 1937. The geological basis of the present search for oil in Great Britain. Quarterly Journal of the Geological Society, 93, 156-194.
LEES, G.M. &TAITT, M.C. 1946. The geological results of the search for oil fields in Great Britain. Quarterly Journal of the Geological Society, 101, 255-317.
LEIGHTY, W.C., HIRATA, M., O’HASHI, K., ASAHI, H., BENOIT, J. & KEITH G. 2003. Large
Renewables - Hydrogen Energy Systems: Gathering and Transmission Pipelines for Windpower
and other Diffuse, Dispersed Sources. World Gas Conference 2003, Tokyo, 1-5 June.
LEITH, T.L., KAARSTAD, I., CONNAN, J., PIERRON, J. & CAILLET, G. 1993. Recognition of caprock leakage in the Snorre Field, Norwegian North Sea. Marine and Petroleum Geology, 10, 29-41.
LEITH, W. 2001. Geologic and Engineering Constraints on the Feasibility of Clandestine Nuclear Testing by Decoupling in Large Underground Cavities. Department of the Interior U.S.
Geological Survey, Open file report 01-28, 56pp.
LEITH, W. 2001. Geologic and Engineeering Constraints on the Feasibility of Clandestine Nuclear Testing by Decoupling in Large Underground Caverns. U.S. Geological Survey Open
249

File Report 01-28, 56pp (This report can be downloaded from the USGS Eastern Region Publications web site: http://geology.usgs.gov/open-file/2001.html or the USGS Eastern Region Earth Surface Processes Publications web site: http://geology.er.usgs.gov/eespteam/EESPT_PUB .html).
LENOIR, E.M. & DAVENPORT, J.A. 1993. A survey of vapor cloud explosions: second update. Process Safety Progress, 12(1), 12-33.
LEYTHAUSER, D., SCHAEFER, R.G. & YÜKLER, A. 1982. Role of diffusion in the primary migration of hydrocarbons. Bulletin American Association Petroleum Geologists, 66, 408-429.
LIANG, J. & LINDBLOM, U. 1995. Analysis of gas storage capacity in unlined rock caverns. Rock
Mechanics and Rock Engineering, 27(3), 115-134.
LINDBLOM, U. 1989a. The development of hydrocarbon storage in hard rock caverns. In: Proceedings International Conference on Storage of Gases in Rock Caverns, Trondheim, Norway, 1989, 85-97.
LINDBLOM, U. 1989b. The performance of water curtains surrounding rock caverns used for gas storage. International Journal Rock Mechanics and Mining Science, Geomechanics Abstracts, 26(1), 85-97.
LINK, W.K. 1952. Significance of oil and gas seeps in world exploration. Bulletin American
Association Petroleum Geologists, 36, 1505-1539.
LINN, J.K. & CULBERT, J. 1999. Experience in underground storage of crude oil in salt. Special
Publication 90, Geo-Inst. ASCE, p. 810.
LIPPMANN, M.J. & BENSON, S.M. 2003. Relevance of Underground Natural Gas Storage to Geologic Sequestration of Carbon Dioxide. Department of Energy’s Information Bridge,
http://www.osti.gov/dublincore/ecd/servlets/purl/813565-MVm7Ve/native/813565.pdf U T, U.S. Government Printing Office (GPO) on line.
LIU, J., WALTER, M. & WEBER, K. 2002. Fluid-enhanced low-temperature plasticity of calcite marble: Microstructures and mechanisms. Geology, 30, 787–790.
LOKHORST, Ad. (editor) 1997. Atlas of the composition and isotope ratios of natural gases in northwest European gasfields. Final Report for work funded in part by the European Commission in the framework of the JOULE Programme Sub-programme Advanced Fuel Technologies: Earth Sciences and PECO Program. September 6 1997. Contract Number JOU2-CT93-0295 and ERBCIPD-CT94-0502.
LUX, K-H., HOU, A. & DUSTERLOH, U. 1998. Some New Aspect in Modelling of Salt Cavern Behaviour and Safety Analysis, Proceedings Solution Mining Research Institute Fall Meeting
1998, Rome, Italy, SMRI Deerfield, IL, 361-389.
MACALISTER, T. 2005. Report: Buncefield a one-off. Guardian Tuesday December 13, 2005.
MACGREGOR, D.S. 1993. Relationship between seepage, tectonics and subsurface petroleum reserves. Marine and Petroleum Geology, 10, 606-619.
MAGORIAN, T.R., HARDING, R.S. JR, & WALKER, C. Jr. 1993. Big Hill seismic studies. In: NEAL, J.T., MAGORIAN, T.R., THOMS, R.L., AUTIN, W.J., HARDING, R.S. & WALKER, C.W. (Eds), Anomalous zones in Gulf Coast salt domes with special reference to Big Hill, TX, and Weeks
Island, LA. Albuquerque, NM: Sandia National Laboratories. Report SAND92-2283, 65 pp.
MAHGEREFTEH, H. & ATTI, O. An Analysis of the Gas Pipeline Explosion at Ghislenghien, Belgium.
MÁLEK, J. & BROKESOVA, J. 2003. Seismic event location in the vicinity of the underground gas storage Háje-Príbram. Acta Montana, 22 (129), 65-73.
250

MÁLEK, J., BROZ, M. & CIZ, R. 2000. Localisation method of the seismic induced events at Príbram seismic network. Acta Montana, 16, 117-124.
MANNING, P. I. AND WILSON, H. E. 1975. The stratigraphy of the Larne Borehole, County Antrim. Bulletin of the Geological Survey of Great Britain, 50, 1-50.
MARLOW, 1989. Cement bonding characteristics in gas wells. Journal Petrolroleum Technology, 41(11), 1146–1153.
MARSH, 2003. The 100 largest losses 1972-2001: large property damage losses in the hydrocarbon-chemical industries – 20th Edition (Edited by COCO, J.C). Marsh’s Risk Consulting Practise, 56 pp.
MARTINSEN, O J. 1993. Namurian (late Carboniferous) depostional systems of the Craven– Askrigg area, northern England: implications for sequence stratigraphic models. In: POSAMENTIER, H W, SUMMERHAYES, C P, HAQ, B U, AND ALLEN, G P (eds). Stratigraphy and
facies associations in a sequence stratigraphic framework International Association of Sedimentologists, Special Publication, 18, 247–281.
MAVROMATIS, M.G. 2004. A Disaster Just Waiting To Explode. Disclosurewatch: The Latest In Real Estate Disclosure News. Property I.D. publication.
MCKENZIE, D.P. & MORGAN, W.J. 1969. Evolution of triple junctions. Nature, 224, 125–133.
MCNABB, J. F. & DUNLOP, W. J. 1975. Groundwater, 13, 33-34.
MEIJER DREES, N.C. (1994). Devonian Elk Point Group of the Western Canada Sedimentary Basin. In: MOSSOP, G.D. & SHETSON, I. (eds), Geological Atlas of the Western Canada Sedimentary Basin, Canadian Society of Petroleum Geologists and Alberta Research Council, Calgary, Alberta, URL http://www.ags.gov.ab.ca/publications/ATLAS_WWW/ATLAS.shtml
MELHEM, G.A., KALELKAR, A.S., SARAF, S. & OZOG, H. 2005. Managing LNG Risks:separating the facts from the myths. IoMosaic Corporation, Houston, Texas, 25pp(http://archives1.iomosaic.com/whitepapers/Managing%20LNG%20Risks.pdf).
MENCONI, M. & SANDERS, D.E. 2006. Pacific Gas and Electric (PG&E) Line 57C ReliabilityProject. California State Lands Commission Draft Report for Pacific Gas and Electric Company,California Gas Transmission. 40pp (http://www.slc.ca.gov/division_pages/DEPM/DEPM_Programs_and_Reports/PG&E_Line57C_MND/1.0%20Project%20Overview.doc).
MEYERS, J. E., NOAH, C. G. & GRIES, J.C. 1972. Viability of sonar techniques applied to measurement of brine well cavities; an evaluation. Department of Geology, Wichita State
University, #4310-50, Subcontract No. 3687, Union Carbide Corporation (see http://www.kgs.ku.edu/Hydro/Hutch/SaltMining/index.html).
MICROSEEPS. Salt Block Storage Well Goodyear, AZ. Accessed at: http://www.microseeps.com/ pdf/carbon_sequestration_exp.pdf
MILNER, H.B. 1922. The geology of the country around Heathfield, Sussex. Proceedings of the
Geologists Association, xxxiii, p. 142.
MISRA, B.R., FOH, S.E., SHIKARI, Y.A., BERRY, R.M. & LABAUNE, F. 1988. The use of inert base gas in underground natural gas storage. Society of Petroleum Engineers, SPE-17741.
MITCHELL, W. I. (ed.), 2004. The Geology of Northern Ireland – Our natural foundation. Belfast; Geological Survey of Northern Ireland, 318 pp.
MIYAZAKI, M. (in press). Well Integrity: An Overlooked Source of Risk and Liability for Underground Natural Gas Storage - Lessons Learned from Incidents in the United States.
251

MOLINDA, G.M. 1988. Investigations of methane occurrence and outbursts in the Cote Blanche domal salt mine, Louisiana. Washington, DC: US Bureau of Mines, Report of Investigations, RI-9186, 21 pp.
MONTEL, F., CAILLET, G., PUCHEAU A. & CALTAGIRONE, J.P. 1993. Diffusion model for predicting reservoir gas losses. Marine & Petroleum Geology, 10, 51-57.
MOORE, J.M. & SCHULTZ, R.A. 1999 Processes of faulting in jointed rocks of Canyonlands National Park, Utah. Geological Society of America Bulletin, 111, 808-822.
MORAN, R. 2007. Earthquakes at Rangely, Colorado. ES 767, Tectonics, Emporia State University (http://www.emporia.edu/earthsci/student/moran4/index.htm).
MORGAN, C.D. 2004. Turn up the thermostat and turn on the shower….what if we all do it at the same time? Utah Geological Survey, Survey Notes, 36(3) July 2004, 4-5.
MRAZ, D.Z. & DUSSEAULT, M.B. 1983. Method of correlation of laboratory tests with in situ conditions. Proceedings, VI International Symposium on Salt, Toronto, Ontario, V.II, 259-268.
MUNSON D.E., CHAN, K.S. & FOSSUM, A. DO. F. 1999. Fracture and healing of rock salt related
to salt caverns. Solution Mining Research Institute, Spring Meeting April 14-16, 1999, Las Vegas, Nevada, 24 pp, (http://www.osti.gov/bridge/servlets/purl/4232-jvRTcd/webviewable/ 4232.pdf).
MUSSON, R.M.W. 1996. The seismicity of the British Isles. Annali di Geofisica, 39, 463-469.
MUSSON, R.M.W. 1997. Seismic hazard studies in the UK: Source specification problems of intraplate seismicity. Natural Hazards, 15, 105-119.
MUSSON, R.M.W. 1998. The Barrow-in-Furness earthquake of 15 February 1865: Liquefaction from a very small magnitude event. Pure and Applied Geophysics, 152, 733-745.
MUSSON, R.M.W. 2000. Evaluation of seismic hazard source models. In: LAPAJNE, J. AND
VIDRIH, R. (Eds), Seismicity modelling in seismic hazard mapping. Slovenian Geophysical Survey, 53-66.
MUSSON, R.M.W. 2003a. Fatalities in British Earthquakes. Astronomy & Geophysics, 44(1), 1.14-1.16.
MUSSON, R.M.W. 2003b. Seismicity and earthquake hazard in the UK (http://www.earthquakes.bgs.ac.uk/hazard/Hazard_UK.htm).
MUSSON, R.M.W. 2004a. Design earthquakes in the UK. Bulletin of Earthquake Engineering, 2,
101-112.
MUSSON, R.M.W. 2004b. An intensity hazard map for the UK. ESC XXIX General Assembly, 155. Potsdam.
MUSSON, R.M.W. 2005a. Appendix 5: Seismicity report. In: EVANS, D.J., HOUGH, E., CROFTS, R.G., TERRINGTON, R.L. & WILLIAMS, G. 2005, The geology of the Preesall Saltfield area. British Geological Survey Internal Report, CR/05/183N, 89 pp.
MUSSON, R.M.W. 2005b. Faulting and hazard in low seismicity areas. In: OECD (Ed), Stability and buffering capacity of the geosphere for long-term isolation of radioactive waste. Nuclear Energy Agency, Nuclear Energy Agency, 61-66
MUSSON, R.M.W. & WINTER, P.W., 1996. Seismic hazard of the UK. AEA Technology Report.
MUSSON, R.M.W. & WINTER, P.W., 1997. Seismic hazard maps for the UK. Natural Hazards, 14, 141-154.
MYDELTAQUEST. New technology would store carbon underground. (http://www.mydeltaquest.com/english/archive-New-technology-would-store-carbon-underground).
252

NAWPC, 1999. Chapter 10, service area: Volcanic Ash and Other Airborne Hazardous Materials. In: National Aviation Weather Program Council, Office of the Federal Coordinator for Meteorology, National Aviation Weather Initiatives, FCM-P34-1999, Washington, D.C.
NEAL, J.T. & MAGORIAN, T.R. 1997. Geologic site characterization (GSC) principles derived from storage and mining projects in salt, with application to environmental surety. Environmental Geology, 29(3/4), February 1997, 165-175.
NELSON, C.R., EVANS, J.M., SORENSEN, J.A. STEADMAN, E.N. & HARJUU, J.A. 2005. Factors affecting the potential for CO2 leakage from geologic sinks. Plains CO2 Reduction (PCOR) Partnership, Practical, Environmentally Sound CO2 Sequestration. University of North Dakota, October 2005.
NELSON, E.B. (editor) 1990. Well Cementing. Developments in Petroleum Science, 28, Elsevier, Amsterdam, Netherlands.
NELSON, J.S. & SIMMONS, E.C. 1992. The quantification of diffusive hydrocarbon losses through caprocks of natural gas reservoirs – a reevaluation: discussion. Bulletin American Association of
Petroleum Geologists, 76(11), 1839-1841.
NELSON, J.S. & SIMMONS, E.C. 1995. Diffusion of Methane and Ethane through the reservoir caprock: implications for the timing and duration of catagenesis. Bulletin American Association
of Petroleum Geologists, 79(7), 1064-1074.
NESTEROV, I.L. & USHANTINSKIJ, I.N. 1972. Sealing properties of shales aboe petroleum and natural gas accumulations in Mesozoic sediments of the West Siberian plain. Zeitschrift für
angewandte Geologie, 18, 548-555.
NEW ENERGY NEWS, 2007. Big Co2 storage trial. Thursday August 9th, 2007 (http://newenergynews.blogspot.com/2007/08/big-new-co2-storage-trial.html).
NICOL, J. 2001. Have Australia's major hazard facilities learnt from the Longford disaster? An evaluation of the impact of the 1998 ESSO Longford explosion on the petrochemical industry in 2001. Institution of Engineers, Australia, 2001, 55 pp.
NICOLAS, A. & POIRIER, J.P. 1976. Crystalline Plasticity and Solid State Flow in Metamorphic
Rocks. Wiley, London, 444 pp.
NISSEN, S.E., WATNEY, W.L., BHATTACHARYA, S., BYRNES, A.P. & YOUNG, D. 2004a. Geologic Factors Controlling Natural Gas Migration from the Yaggy Underground Gas Storage Site, Kansas. Abstract, Bulletin American Association Petroleum Geologists, 88(13).
NISSEN, S.E., WATNEY, W.L., BHATTACHARYA, S., BYRNES, A.P. & YOUNG, D. 2004b. Geologic Factors Controlling Natural Gas distribution related to the January 2001 gas explosions in Hutchinson, Kansas. Poster display, American Association Petroleum Geologists 2004 – 3 posters (http://www.kgs.ku.edu/PRS/publication/2004/AAPG/NG_Migration/index.html).
NISSEN, S.E., WATNEY, W.L. & XIA, J. 2003. Natural gas explosions in Hutchinson, Kansas: detecting gas with high-resolution seismic data. Paper No. 2-4, Session No. 2 Natural Gas
Explosions in Hutchinson, Kansas, The Geological Society of America, North-Central Section – 37th Annual General Meeting (March 24-25, 2003) Kansas City, Missouri.
NORDGARD BOLAS, H.M. & HERMANRUD, C. 2003. Hydrocarbon leakage processes and trap retention capacities offshore Norway. Petroleum Geoscience, 9, 321-332.
NORTON ENERGY, 2001. Norton Energy Storage Receives Ohio Power Siting Board Approval for Construction of 2700 MW Compressed Air Energy Storage Facility. Norton Energy Press Release, May 21, 2001 (http://www.caes.net/nortpres.html).
NPL, 2007. Proposed gas storage, King Street, Cheshire. NPL Estates press release 2007 (http://www.nplestates.com/NPLGroup/KingStreetEnergy/tabid/213/Default.aspx).
253

NTSB (NATIONAL TRANSPORTATION SAFETY BOARD), 1993a. Highly volatile liquids Release from Underground Storage Cavern and Explosion, Mapco Natural Gas Liquids Inc., Brenham Texas, April 7, 1992, NTSB/PAR-93/01, PB93-916502.
NTSB (NATIONAL TRANSPORTATION SAFETY BOARD), 1993b. Safety recommendation letter, December 15, 1993, to G.L. Briese from C.W. Vogt, NTSB, Washington DC (http://www.ntsb.gov/Recs/letters/1993/P93_23.pdf).
NTSB (NATIONAL TRANSPORTATION SAFETY BOARD), 2003. Natural Gas Pipeline Rupture and Fire Near Carlsbad, New Mexico, August 19, 2000. Pipeline Accident Report, National
Transportation Safety Board, Washington, D.C., NTSB/PAR-03/01, 66pp.
NTSB (NATIONAL TRANSPORTATION SAFETY BOARD), 2006. Supervisory Control and Data Acquisition (SCADA) in Liquid Pipelines. Safety Study NTSB/SS-05/02, PB2005-917005, Washington, DC.
OHIO ENVIRONMENTAL COUNCIL. 2006. Promoting integrated gasification and combined cycle power generation and carbon capture and storage. Report prepared by the Ohio Environmental Council for the Clean Air Task Force State Climate Collaborative, 52 pp, (http://www.catf.us/ projects/state_climate/measures/IGCC-CCS%20Measures%20Nov2006.pdf).
OLDENBURG, C.M. 2002. Carbon Dioxide as Cushion Gas for Natural Gas Storage. Department of Energy Contract No. DE-AC03-76SF00098, Earth Sciences Division 90-1116, Lawrence Berkeley National Laboratory Berkeley CA 94720: (http://www.osti.gov/energycitations/ servlets/purl/808925-SE4ruG/808925.PDF), 22pp.
OLDENBURG, C.M. 2006. Joule-Thomson cooling due to CO injection into natural gas 2
reservoirs. Proceedings, TOUGH Symposium May 15–17, 2006, Lawrence Berkeley National Laboratory, Berkeley, California, 6 pp (http://www-esd.lbl.gov/TOUGHsymposium/pdf/ Oldenburg_CO2.pdf).
OLDENBURG, C.M. & BENSON, S.M. 2002. CO2 injection for enhanced gas production and carbon sequestration. Society of Petroleum Engineers, SPE-74367, February 2002.
OLDENBURG, C.M., BENSON, S.M. & PRUESS, K. 2001. Process modeling of CO2 injection into natural gas reservoirs for carbon sequestration and enhanced gas recovery. Energy & Fuels, 15, 293–298.
OPPENHEIMER, D.H. 1980. Extensional tectonics at the Geysers Geothermal Area, California. Journal of Geophysical Research, 91, 11.436-11.476.
OSHITA, T. 2002. Utilization of depleted gas/oil reservoirs. Sekiyu Gijutsu Kyokaishi, 67(6), 538-546 (http://cat.inist.fr/?aModele=afficheN&cpsidt=14615904).
PADRÓ, C.E.G. & PUTSCHE, V. 1999. Survey of the Economics of Hydrogen Technologies. National Renewable Energy Laboratory (NREL), Technical Report, NREL/TP-570-27079, Golden, Colorado 80401-3393, 57 pp.
PAPADAKIS, G.A. 1999. Major hazard pipelines: a comparative study of onshore transmission accidents. Journal of Loss Prevention in the Process Industries, 12, 91-107.
PAPANIKOLAU, N., LAU, B.M.L., HOBBS, W.A. & GALE, J. 2006. Safe storage of CO2: experience from the natural gas storage industry. In: RØKKE, N.A., BOLLAND, O., O'BRIEN, D., EIDE, L. I., GALE, J., HAUG, G., HAUGAN, B.E., RIIS, T. & SUNDSET, T. (eds), The 8th
International Conference on Greenhouse Gas Control Technologies, 19th – 22nd June, Trondheim, Norway, Elsevier, Abstracts volume, 6pp.
PEACOCK, D.C.P., KNIPE, R.J. & SANDERSON, D.J. 2000. Glossary of normal faults. Journal of
Structural Geology, 22, 297-305.
PEARCE, F. 1985. Blowing the roof off Abbeystead. New Scientist, 106, p. 28-32, 23rd May 1985.
254

PEARSON, R. 1903. The discovery of natural gas in Sussex: Heathfield district. Transactions of
the Institute of Mining Engineers, LXVI (26), 494-507.
PENN, I. E. 1981. Larne No. 2 Geological well completion report. Report of the Institute of
Geological Sciences, 81/6. Keyworth.
PENN, I.E., CHADWICK, R.A., HOLLOWAY, S., ROBERTS, G., PHARAOH, T.C., ALLSOP, J.M., HULBERT, A.G. & BURNS, I.M. 1987. Principal features of the hydrocarbon prospectivity of the Wessex-Channel Basin, UK. In: BROOKS, J. & GLENNIE, K.W. (eds), Petroleum Geology of
North West Europe, Graham & Trotman, London, 109-118.
PERRY, K.F. 2005. Chapter 9: Natural gas storage industry experience and technology: potential application to CO2 geological storage. In: THOMAS, D.C. & BENSON, S.M. (eds), Carbon Dioxide
Capture for Storage in Deep Geologic Formations, Volume 2, Elsevier Limited, 815-825.
PERSSON, H. & LÖNNERMARK, A. 2004. Tank fires: Review of incidents 1951-2003. SP Fire Technology, BRANDFORSK Project 513-021 SP Report 2004:14, SP Swedish National Testing and Research Institute, Borås, Sweden, 80pp.
PETERSON, L. & MARQUEZ, J. 2003. Gas-oil mist spews over neighbourhood. The Daily Breeze, April 3rd, at website: http://www.saveballona.org/gasoilmist.html.
PFEIFLE, T.W., DEVRIES, K.L. & NIELAND, J.D. 1998. Damage –induced permeability enhancement of natural rock salt with implications for cavern storage. Proceedings. SMRI Spring
Meeting, New Orleans, 260-289.
PFEIFLE, T.W. & HURTADO, L.H. 2000. Effect of pore pressure on damage accumulation in salt. In: GEERTMAN R.M. (ed), Proceedings. 8
th World Salt Symposium, Elsevier, I, 307-312.
PIESSENS, K. & DUSAR, M. 2003. CO2 sequestration in abandoned coalmines. Proceedings of the International Coal bed Methane Symposium, May 5-9, Tuscaloosa, Alabama. Paper No. 346.
PIRKLE, R.J., 1986. Proceedings of the American Gas Association Meeting, Chicago, IL, April 1986.
PIRKLE, R.J. & JONES, V.T. 2004? Applications of Petroleum Exploration and Environmental
Geochemistry to Carbon Sequestration. http://www.eti-geochemistry.com/FinalVersion1.10.htm.
PIRKLE, R. J. & PRICE, V. 1986. Leak Detection and Monitoring, Paper presented at: The Conference on Hazardous Materials in the Environment, Atlantic City, NJ, June 1986.
PLAAT, H. 2004. What is the best functionality for my UGS? Abstract and presentation from ‘The Future Development and Requirements for Underground Gas Storage in the UK and Europe’. Geological Society London Conference, Aberdeen, October 19-20
th 2004 (Convened by
EVANS, D.J., CHADWICK, R.A. & ROWLEY, W.J.).
PLAAT, H. (in press). Underground gas storage – why and how. Geological Society London,
Special Publication.
POWELL, T. 2006a. The Buncefield Investigation: progress report. Report prepared for the Buncefield Major Incident Investigation by the Health and Safety Executive (HSE) and the Environment Agency (EA), 2nd February, 2006, 30pp. (http://www.buncefieldinvestigation.gov. uk/report.pdf).
POWELL, T. 2006b. The Buncefield Investigation: third progress report. Report prepared for the Buncefield Major Incident Investigation by the Health and Safety Executive (HSE) and the Environment Agency (EA), 10th May, 2006, 28pp.
PRESTON, D. 1980. Gas eruptions taper off. Geotimes, October 1980, 18-20.
PTTC, 2004. Seals – a critical element to successful exploration and production Petroleum Technology Transfer Council (http://pttc.org/workshop_summaries/405.htm).
255

RALEIGH, C.B., HEALY, J.H. & BREDEHOEFT, J.D. 1976. An experiment in earthquake control at Rangely, Colorado. Science, 191, 1230-1237 (26th March 1976).
RAMSAY, J.G. 1980. The crack-seal mechanism of rock deformation. Nature, 284, 135–139.
RAVEN RIDGE RESOURCES, 1998. Gas storage at the abandoned Leyden Coalmine near Denver, Colorado. Report prepared under work assignment 3-1 of the US Environmental Protection Act Contract 68-W5-0018 by Raven Ridge Resources, Incorporated and Penn, Stuart and Eskridge. 12pp.
RATIGAN, J.L., MCCLAIN, A., NICHOLS, J. & HOFFINE, S. 2002. Fugitive NGL at the Williams Midstream Natural Gas Liquids Conway Underground Storage Facility – Geologic and Hydrogeological Studies, Cavern Well Testing and NGL Recovery. Technical Paper, Solution Mining Research Institute Spring 2002 Meeting, 28 April – 1 May, Banff, Alberta, Canada.
REDMAYNE, D.W. & MUSSON, R.M.W., 1987. The Dunoon earthquake of 16 September 1985. BGS Global Seismology Report.
REEVES, J.W. 1948. Surface problems in the search for oil in Sussex. Proceedings of the
Geologists’ Association, 59, 234-269.
REITSEMA, R.H., LINBERG, F.A. & KALTENBACK, A.J. 1978. Light hydrocarbons in Gulf of Mexico water: sources and relation to structural highs. Journal of Geochemical Exploration, 10, 139-151.
REMSON, D.R. DOMMERS, O.B. & JESSEN, F.W. 1966. Techniques for developing predetermined shaped cavities in solution mining. In: RAU, J.L. (ed), Second Symposium on Salt: Cleveland, OH, Northern Ohio Geological Society, 297-310.
RENWICK, E.S. & SANDIDGE, C. 2000. Making old oil fields safe for commercial and residential development. Environmental issues for the oil & gas industry. Strategic Research Institute, Texas, 26 pp.
RICHTER-BERNBERG, G. 1987. Deformation within salt bodies. In: LERCHE, I. & O’BRIEN, J.J. (eds), Dynamical geology of salt and related structures. Academic Press Inc., 39-75.
RIEGLE, J.R. 1953. Gas Storage in the Playa Del Rey Oil Field. In: Summary of Operations,
California Oil Fields, State of California Division of Oil and Gas, San Francisco, Calififornia, 39(2), 17-33.
RIPPON, J.H. 1996. Sand body orientation, palaeoslope analysis and basin fill implications in the Westphalian A-C of Great Britain. Journal of the Geological Society, London, 153, 881-900.
RITE (Research Institute for Innovative Technology of the Earth), 2005. The outline of CO2
Geological Storage Project, R&D Activities, CO2 Sequestration Research Group, RITE Today, 8-10.
ROHLER, H., BORNEMANN, T., DARQUIN, A. & RASMUS, J. 2004. The Use of Real-Time and Time-Lapse Logging-While-Drilling Images for Geosteering and Formation Evaluation in the Breitbrunn Field, Bavaria, Germany. SPE Drilling & Completion, 19 (Sept), 133-138 (http://www.spe.org/elibinfo/eJournal_Papers/spe/2004/EDC/09/00089016/00089016.htm).
ROKHAR, R.B. 2005. Canatxx Gas Storage Ltd, Preesall Saltfield Gas Storage Project: Proof of Evidence - Rock Mechanics and Related Matters. http://www.lancscc.gov.uk/environment/ policyanddevelopment/canatxx/Supplement%20Evidence/R%20Rohkar/R%20R%20Proof%20( v1-0%200022260662).pdf
ROTHENBURG, L., DUSSEAULT, M.B. & MRAZ, D.Z. 1999. Steady-state creep of salt in mines follows a power-law exponent of 3.0, based on a reanalysis of published data and mine simulation. Proceedings Mecasalt 99, Bucharest, Romania.
256

ROTHWELL, N.R. & P. QUINN. 1987. The Welton Oilfield. In: BROOKS, J. & GLENNIE, K. (eds), Petroleum Geology of North West Europe, Graham & Trotman, 181-189.
RWE, 2005. Háje underground gas storage facility. RWE Transgas (http://www.rwe-transgas.cz/transgas.en/operation/gas_storage/haje.html).
SALES, J.K. 1996. Seal Strength vs. Trap Closure - A Fundamental Control on the Distribution of Oil and Gas. In: Surdam, R.C. (ed), Seals, Traps and Petroleum System. American Association Petroleum Geologists Memoir, 67, 57-83.
SANDERSON, D.J. & ZHANG, X. 1999. Critical stress localization of flow associated with deformation of well-fractured rock masses, with implications for mineral deposits. In: MCCAFFREY, K.J.W., LONERGAN L. & WILKINSON, J.J. (eds), Fractures, Fluid Flow and
Mineralization. Geological Society, London, Special Publication, 155, 69–81.
SANDIA, 2001. Solution to some of country's energy woes might be little more than hot air. http://www.sandia.gov/LabNews/LN04-06-01/key4-06-01_stories.html
SAN JOAQUIN COUNTY, 1992. San Joaquin County Wide General Plan 2010. Volume III, Section IV Resources, Part B Extractive Resources, 12pp (http://www.co.san-joaquin.ca.us/commdev/ cgi-bin/cdyn.exe/handouts-planning_GP-V3-IV-B?grp=handouts-planning&obj=GP-V3-IV-B).
SAUNDERS, D.F., BURSON, K.R. & THOMPSON, C.K. 1999. Model for hydrocarbon seepage and near-surface alterations. Bulletin American Association Petroleum Geologists, 83, 170-184.
SCHABER, C., MAZZA, P. & HAMMERSCHLAG, R. 2004. Utility-scale storage of renewable energy. Electricity Journal, 17(6), 21-29.
SCHERER, G.W. CELIA, M.A., PRE´VOST, J-H, BACHU, S., BRUANT, R., DUGUID, A., FULLER, R., GASDA, S.E., RADONJIC, M. & VICHIT-VADAKAN, W. 2005. Chapter 10: Leakage of CO2
Through Abandoned Wells: Role of Corrosion of Cement. In: THOMAS, D.C. & BENSON, S.M. (eds), Carbon Dioxide Capture for Storage in Deep Geologic Formations, Volume 2, Elsevier Limited, 827-848.
SCHLEDER, Z. & URAI, J.L. 2007. Deformation and recrystallization mechanisms in mylonitic shear zones in naturally deformed extrusive Eocene-Oligocene rocksalt from Eyvanekey plateau and Garmsar hills (central Iran). Journal Structural Geology, 29, 241-255.
SCHROOT, B.M. and R.T.E. SCHÜTTENHELM, 2003a. Expressions of shallow gas in the Netherlands North Sea. Netherlands Journal of Geosciences, 82(1), 91-105.
SCHROOT, B.M. and R.T.E. SCHÜTTENHELM, 2003b. Shallow gas and gas seepage: expressions on seismic and other acoustic data from the Netherlands North Sea. Journal of Geochemical
Exploration, 4061, 1-5.
SELLEY, R.C. 1992. Petroleum seepages and impregnations in Great Britain. Marine and
Petroleum Geology, 9, 3, 226-244.
SELLEY, R.C. & Stoneley, R. 1987. Petroleum habitat in south Dorset. In: BROOKS, J. & GLENNIE, K.W. (eds), Petroleum Geology of North West Europe, Graham & Trotman, London, 139-148.
SENI, S. J., AND JACKSON, M. P. A., 1983. Evolution of Salt Structures, East Texas Diapir Province, Part 1: Sedimentary Record of Halokinesis. Bulletin American Association Petroleum
Geologists, 67, 1219-1244.
SENI, S.J., HOVORKA, S.D. & MULLICAN, W.F., III. 1995. Technical aspects of occurrence of salt in Texas. In: MULLICAN, W.F. III, (ed.), Suitability of Solution-Mined Caverns for Oil and Gas
Waste Disposal, Conference Proceedings, Bureau of Economic Geology, University of Austin, Texas, 1–18.
257

SERATA, S., 1984, Relationship between mine openings and solution caverns in salt, in Mining
Science and Technology, 1, Elsevier, Amsterdam, 123-135.
SHI, J.Q. & DURUCAN, S. 2005. CO2 storage in caverns and mines. Oil & Gas Science and
Technology, 60, 569-571.
SHOCK, D.A. 1985. Solution mining of soluble salts – its scope and its future. In: SCHLITT, W.J. (ed) Salt and Brines ’85, New York American Insitute of Mining, Metallurgy and Petroleum Engineering, 1-10.
SIBSON R.H. 1977. Fault rocks and fault mechanisms. Journal of the Geological Society,
London, 133, 191-213.
SIBSON R.H. 1992. Implication of fault-valve behaviour for rupture nucleation and recurrence. Tectonophysics, 211, 283-293.
SIBSON, R., H. 1995. Selective fault reactivation during basin inversion: potential for fluid redistribution through fault-valve action. In: BUCHANAN, J.G. & BUCHANAN, P.G. (eds), Basin
Inversion. Special Publication Geological Society London, 88, 3-19.
SIBSON, R.H. 1996. Structural permeability of fluid-driven fault-fracture meshes. Journal of
Structural Geology, 18, 1031–1042.
SIBSON R H., MOORE J. M. M., RANKIN A. H. 1975. Seismic pumping--a hydrothermal fluid transport mechanism. Journal of the Geological Society, London, 131, 653-659.
SKROTZKI, W. & HAASEN, P. 1988. The role of cross slip in the steady state creep of salt. In: HARDY, H.R. & LANGER, M. (eds), The Mechanical Behaviur of Salt: Proceedings of the Second
Conference. Trans Tech Publications, Claustahal-Zellerfield, 69-81.
SKRTIC, L. 2006. Hydrogen Sulfide, Oil and Gas, and People’s Health. Master’s of Science Dissertation, Energy and Resources Group University of California, Berkeley, May 2006, 77 pp (http://erg.berkeley.edu/erg/people/Lana%20Skrtic%20%20Masters%20Paper%20H2S%20and %20Health.pdf).
SMITH, D.B. 1994. Geology of the country around Sunderland. Memoir British Geological Survey, England and Wales, Sheet 21, HMSO, London.
SMITH, D.B. 1996. Deformation in late late Permian Boulby Halite (EZ3Na) in Teesside, NE England. In: ALSOP, G.I., BLUNDELL, D.J. & DAVISON, I. (eds), Salt Tectonics, Geological Society Special Publication, 100, 77-87.
SMITH, J., ERDMAN, J.G. & MORRIS, D.A. 1971. Migration, accumulation and retention of petroleum in the earth. Proceedings of the 8
th World Petroleum Congress, Moscow, 2, 13-26.
SMITH, N.J.P. EVANS, D.J. & ANDREWS, I.J. 2005. The geology of gas storage in offshore salt caverns. BGS Confidential Report to the Department of Trade and Industry, No. GC05/11, 74pp.
SNYDER, J.W., et al. 1995. Occupational Fatality and Persistent Neurological Sequelae After Mass Exposure to Hydrogen Sulfide. American Journal of Emergency Medicine, 13(2), 199-203.
SOCAL, 2004. Southern California Gas Company’s application to value and sell surplus property at Playa Del Rey and Marina Del Rey. Document a.99-05-029 draft Environmental Impact Report.
SONNENFIELD, P. 1984. Brines and evaporites. Orlando, California, Academic Press, 613 pp.
SPENCER, A.M. & LARSEN, V.B. 1990. Fault traps in the Northern North Sea. In: HARDMAN, R.F.P. & BROOKS, J. (eds), Tectonic Events Responsible for Britain’s Oil and Gas Reserves. Geological Society Special Publication, 55, 281-298.
SPIERS, C.J., PEACH, C.J., BRZESOWSKY, R.H., SCHUTJENS, P.M.T.M., LIEZENBERG, J.L. & ZWART, H.J. 1989. Long-term rheological and transport properties of dry and wet salt rocks.
258

Nuclear Science and Technology, EUR 11848 EN. Office for Official Publications of the European Communities, Luxembourg.
SPIERS, C.J., SCHUTJENS, P.M.T.M., BRZESOWSKY, R.H., PEACH, C.J., LIEZENBERG, J.L. & ZWART, H.J. 1990. Experimental determination of constitutive parameters governing creep of rocksalt by pressure solution. In: KNIPE, R.J. & RUTTER, E.H. (eds), Deformation Mechanisms,
Rheology and Tectonics. Geological Society Special Publication, 45, 215-227.
SPIERS, C.J., URAI, J.L. & LISTER, G.S. 1988. The effect of brine (inherent or added) on rheology and deformation mechanisms in salt rock. In: HARDY, H.R. & LANGER, M. (eds), The
Mechanical Behaviur of Salt: Proceedings of the Second Conference. Trans Tech Publications, Claustahal-Zellerfield, 89-102.
SPIERS, C.J., URAI, J.L., LISTER, G.S., BOLAND, J.N. & ZWART, H.J. 1986. The influence and fluid-rock interaction on the rheology of salt rock. Nuclear Science and Technology, EUR 10399
EN. Office for Official Publications of the European Communities, Luxembourg.
STAG ENERGY, 2006. Press statement: Irish Sea offshore LNG import terminal and gas storage project will improve security of gas supply for the UK and Ireland. 22nd February 2006.
STAG ENERGY, 2007. Gateway Gas Storage Project Environmental Impact Consultation
Document. A report prepared for Gateway Storage Co. Ltd. by Rudall Blanchard Associates Ltd. 42 pp (http://www.stagenergy.com/News/Gateway_Environmental_Statement_April_07.pdf).
STAR ENERGY, 2006. Gas Storage Update: Press Release 18th October 2006 (http://www.starenergy.co.uk/fileadmin/pdfs/Gas_Storage_Press_Release_18_10_06.pdf).
STAR ENERGY, 2007. Albury Phase 1 Gas Storage Project. Press Release Star Energy Group plc., 26th July 2007 (http://www.starenergy.co.uk/fileadmin/pdfs/Albury_Phase_1_press_release_26_ July07__2_.pdf).
STATE OF COLORADO, 2006. Staff Report, November 27, 2006. State of Colorado Oil & Gas
Conservation Commission, 31 pp (http://www.oil-gas.state.co.us/Staff_Reports/2006/ November%202006%20SR.pdf).
STATOIL, 2004. Milestones 2004: research and development highlights (hydrocarbon leakage). Annual Milestone Series (http://www.statoil.no/statoilcom/technology/svg03268.nsf/ Attachments/Milestones+2004/$FILE/Milestones_2004.pdf).
STEWART, S.A. HARVEY, M.J., OTTO, S.C. & WESTON, P.J. 1996. Influence of salt on fault geometry: examples from the UK salt basins. In: ALSOP, G.I., BLUNDELL, D.J. & DAVISON, I. (eds), Salt Tectonics, Geological Society London Special Publication, 100, 175-202.
Stoneley,
STOWELL, J.F.W., LAUBACH, S.E. & OLSON, J.E. 2001. Effect of modern state of stress on flow-controlling fractures: a misleading paradigm in need of revision. In: ELSWORTH, D., TINUCCI, J.P. & HEASLEY, K.A. (eds), Rock mechanics in the national interest; proceedings of the 38th US
rock mechanics symposium, Balkema, Washington, DC (2001).
STUART, I.A. 1991. The Rough Gas Storage Field, Blocks 47/3d, 47/8b, UK North Sea. In: ABBOTTS, I.L. (ed), United Kingdom Oil and Gas Fields, 25 years Commemorative Volume. Geological Society Memoir, 14, 477-484.
STRAHAN, A. 1920. Special reports on the mineral resources of Great Britain: Volume VII –
Mineral oil, Kimmeridge oilshale, lignites, jets, cannel coals, natural gas, England and Wales.
Memoirs of the Geological Survey, 2nd Edition, HMSO, 117 pp.
TAKESHI, O., KENJI, S. & KOJIRO, B. 2000. Summary of a system of hydraulic contained underground cavern for liquefied petroleum gas storage. Proceedings of the Symposium on
Underground Space, 7, 271-277 (http://sciencelinks.jp/j-east/article/200214/000020021402 A0195782.php).
259

TALBOT, C.J. 1979. Fold trains in a glacier of salt in southern Iran. Journal Structural Geology, 1, 159-181.
TALBOT, C.J., AFTABI, P., 2004. Geology and models of salt extrusion at Qom Kuh, central Iran. Journal of the Geological Society, London, 161, 321-334.
TALBOT, C.J., JARVIS, R.J. 1984. Age, budget and dynamics of an active salt extrusion in Iran. Journal Structural Geology, 6, 521-530.
TALBOT, C. J., & ROGERS, E. A. 1980. Seasonal movements in a salt glacier in Iran. Science, 208, 395–397.
TALBOT, C. J., TULLY, C.P. & WOODS, P.J.E. 1982. The structural geology of the Boulby (Potash) Mine, Cleveland, United Kingdom. Tectonophysics, 85, 167-204.
TAYLOR, B.J., PRICE, R.H. & TROTTER, F.M. 1963. Geology of the country around Stockport and
Knutsford. Geological Survey of Great Britain Memoir, England and Wales, Sheet 98.
TEDESCO, S.A. 1995. Anomaly shifts indicate rapid surface seep rates. Oil and Gas Journal, 97
(13), 69-72.
TEK, M.R. 2001. http://www.saveballona.org/expert.html
TERRINHA, P., RIBEIRO, A. & COWARD, M.P. 1994 (abstract). Mesoscopic structures in a salt wall. The Loule salt wall diapir, Algarve Basin, south Portugal. Salt Tectonics, Geological
Society meeting, 14-15th September 1994.
THE TIMES, 2007. Kent shaken and stirred, but it could have been worse, say seismologists. The
Times, Monday 30th April, p 6.
THOMS, R.L. & GEHLE, R.M. 2000. A brief history of salt cavern use (keynote paper). In: GEERTMAN, R.M. (ed), Proceedings of 8
th World Salt Symposium, part 1, Elsevier B.V., 207-
214.
THRUSH, P.W. 1968. A Dictionary of Mining, Mineral and Related Terms. US Bureau of Mines, US Government Printing Office, 1576 pp.
TOMASKO, D., ELCOCK, D., VEIL, J. & CAUDLE, D. 1997. Risk Analysis for disposing nonhazardous oil field wastes in salt caverns. Report prepared for U.S. Department of Energy Office of Fossil Energy Under Contract W-31-109-ENG-38, Argonne National Laboratory, University of Chicago, Argonne, Il., 68 pp (http://www.ead.anl.gov/pub/doc/saltrisk.pdf).
TROTTER, J. T., THOMPSON, D. M. T. & PATERSON, T. J. M. 1985. First Mined Underground Storage in Great Britain. Tunnelling 85. Institution Mining Metallurgy, London.
TRUEMAN, S. 2003. The Humbly Grove, Herriard, Storrington, Singleton, Stockbridge, Goodworth, Horndean, Palmers Wood, Bletchingley and Albury Fields, Hampshire, Surrey and Sussex, UK onshore. In: GLUYAS, J.G. & HITCHENS, H.M. (eds), United Kingdom Oil and Gas
Fields, Commemorative Millenium Volume, Geological Society, London, Memoir, 20, 929-941.
ÜBERER W., GROSSWIG, ST. & HURTIG, E. 2004. Detection and sealing of a tubing leakage at the underground gas storage well Breitbrunn 21. Erdöl, Erdgas, Kohle, 120(11), 379-385.
UNDERHILL, J.R. & STONELEY, R. 1998. Introduction to the development, evolution and petroleum geology of the Wessex Basin. In: UNDERHILL, J.R. & STONELEY, R. (eds), Development, Evolution and Petroleum Geology of the Wessex Basin, Geological Society, London, Special Publications, 133, 1-18.
URAI, J.L. 1983. Water-assisted dynamic recrystallisation and weakening in polycrystalline bischovite. Tectonophysics, 96, 125-157.
260

URAI, J.L., MEANS, W.D. & LISTER, G.S. 1986a. Dynamic recrystallisation of minerals. In: HEARD, H.C. (ed), Mineral and Rock Deformation (Laboratory Studies), Geophysical
Monograph of the American Geophysical Union, 161–200.
URAI, J.L., SPIERS, C.J., PEACH, C.J., FRANSSEN, R.C.M.W. & LIEZENBERG, J.L. 1987. Deformation mechanisms operating in naturally deformed halite rocks as deduced from microstructural observations. Geologie en Mijnbouw, 66, 165-176.
URAI, J.L. SPIERS. C.J. ZWART. H.J. & LISTER, G.S. 1986b. Weakening of rock salt by water during long-term creep. Nature, 324. 554-557.
US DOE. 1980. Economic feasibility of inert cushions in underground gas storage. US Department of Energy report, DOE/FE/33008-1, September 1980.
VAN DER LINDEN, S. 2006. Bulk energy storage potential in the USA, current developments and future prospects. ECOS 2004 - 17th International Conference on Efficiency, Costs, Optimization,
Simulation, and Environmental Impact of Energy on Process Systems. Energy, 31, 3446-3457 (http://www.sciencedirect.com/science?_ob=ArticleURL&_udi=B6V2S-4K2SK38-1&_user=1001893&_coverDate=12%2F31%2F2006&_rdoc=1&_fmt=&_orig=search&_sort=d &view=c&_acct=C000027978&_version=1&_urlVersion=0&_userid=1001893&md5=dbbf672 b18f7c366e58ca6efe5e1370c).
VAN KEKEN, P.E., SPIERS, C.J., VAN DEN BERG, A.P. & MUYZERT, E.J. 1993. The effective viscosity of rocksalt: implementation of steady-state creep laws in numerical models of salt diapirism. Tectonophysics, 225, 457-476.
VASQUES M. & TENGBORG, P. 2001. Lined rock cavern: new developments for gas storage in lined rock caverns. Presentation at The Global Gas Village; The Case for Underground Gas
Storage in Europe, ENERGYWISE, Paris 17 & 18 May 2001.
VECTOR MAGNETICS. Case Histories. (http://www.vectormagnetics.com/ casehistories.pdf)
VEIL, J.A., SMITH, K.P., TOMASKO, D., ELCOCK, D., BLUNT, D.L. & WILIAMS, G.P. 1998. Disposal of NORM – contaminated oil field wastes in salt caverns. Report prepared for the U.S.
Department of Energy, Office of Fossil Energy, Contract W-31-109-Eng-38. Argonne National Laboratory, 68 pp.
VENDEVILLE, B.C. & JACKSON, M.P.A. 1992. The rise of diapirs during thin-skinned extension: Marine and Petroleum Geology, 9, 331-353.
VENDRIG, M., SPOUGE, J., BIRD, A., DAYCOCK, J. & JOHNSEN, O. 2003. Risk Analysis of the Geological Sequestration of Carbon Dioxide. DNV Consulting report to the Department of Trade and Industry, DTI/Pub URN 03/1320, 92 pp (http://www.dti.gov.uk/files/file18859.pdf).
VIK, E., HEUM, O.R. & AMALIKSEN, K.G. 1991. Leakage from deep reservoirs: possiblemechanisms and relationship to shallow gas in the Halten bank area, mid-Norwegian Shelf. In: ENGLAND, W.A. & FLEET, A.J. (eds), Petroleum Migration, Geological Society London Special Publication, 59, p. 273.
VOYTOV, G.I., GRECHUKHINA, R.G. & LEBEDEV, V.S. 1972. Chemical and isotopic composition of gas and water in southern Dagestan. Geochemistry, 205, 1217-1220.
WALLNER, M. 1988. Frac-pressure risk for cavities in rock salt. In Hardy, H.R. Jr & Langer, M. (eds) Proceedings of the Second Conference on Mechanical Behaviour of Salt, September 24-28 1988, Hanover, Federal Republic of Germany, 645-658.
WALTERS, R. F. 1978. Land subsidence in central Kansas related to salt dissolution. Bulletin
Kansas Geological Survey, 214.
WALTHAM, A.C. 1994. Foundations of Engineering Geology. Glasgow, Blackie Academic & Professional, 88 pp.
261

WARD, J., CHAN, A. & RAMSAY, B. 2003. The Hatfield Moors and Hatfield West Gas (Storage) Fields, South Yorkshire. In: GLUYAS, J.G. & HITCHENS, H.M. (eds), United Kingdom Oil and
Gasfields, Commemorative Millennium Volume, Geological Society, London, Memoir, 20, 905-910.
WARD, T. 1900. The subsidence in and around the town of Northwich in Cheshire. Transactions
Institute Mining Erzg.,, 19, 241 - 264.
WARREN, J.K. 2006. Evaporites: Sediments, Resources and Hydrocarbons. Springer-Verlag, Berlin, 1035 pp.
WARRINGTON, G., AUDLEY-CHARLES, M.G, ELLIOTT, R.E, EVANS, W.B., IVIMEY-COOK, H.C., KENT, P.E., ROBINSON, P.L., SHOTTON, F.W. & TAYLOR, F.M. 1980. A correlation of Triassic
rocks in the British Isles. Special Report of the Geological Society, London, 13, 78 pp.
WASHINGTON, P.A. 2006. Morphology of the Monroe Gas Rock: a small carbonate platform sitting atop a foundered late Cretaceous shelf surface. Geological Society of America, South-
Central Section–40th Annual Meeting (6–7 March 2006) Norman, Oklahoma, Paper No. 8-6.
WATNEY, W.L., NISSEN, S.E., BHATTACHARYA, S., AND YOUNG, D., 2003a. Evaluation of the Role of Evaporite Karst in the Hutchinson, Kansas Gas Explosions, January 17 and 18, 2001. In: JOHNSON, K. S.; AND NEAL, J. T. (eds), Evaporite karst and engineering/environmental problems
in the United States. Oklahoma Geological Survey Circular, 109, p. 119-147.
WATNEY, W.L., BYRNES, A.P., BHATTACHARYA, S., NISSEN, S.E., & ANDERSON, A.K. 2003b. Natural gas explosions in Hutchinson, Kansas: geologic factors. Presentation to North-Central GSA, March 24, 2003 - updated August 20, 2004 (http://www.kgs.ku.edu/Hydro/Hutch/GSA_ Watney_updated082004.pdf).
WATSON, J. 2003. Lasers throw new light on deadly gas leaks. Scotsman on Sunday, August 17th
2003 (http://scotlandonsunday.scotsman.com/scotland.cfm?id=902522003).
WATSON, S.P., METCALFE, R. & BOND, A. 2007. Scoping calculations for releases from potential UK UGS facilities: contribution to a BGS project for the HSE. Report prepared for Health and
Safety Executive. Quintessa Report, Document Number QRS-1363A-1, Version 1, August 2007, 80 pp.
WATTS, N.L. 1987a. Theoretical aspects of cap rock and fault seal for single- and two-phase columns. Bulletin American Association of Petroleum Geologists, 76, 638-650.
WATTS, N.L. 1987b. Theoretical aspects of cap-rock and fault seals for single- and two-phase hydrocarbon columns. Marine and Petroleum Geology, 4, 274-307.
WAWERSIK, W.R. & ZEUCH, D.H. 1986. Modelling and mechanistic interpretation of creep of rock salt below 200ºC. Tectonophysics, 121, 125-152.
WELLS, D.L. & COPPERSMITH, K.J., 1994. New empirical relationships among magnitude, rupture length, rupture width, rupture area, and surface displacement. Bulletin of the
Seismological Society of America, 84, 974-1002.
WESCOTT, W.A. & HOOD, W.C. 1994. Hydrocarbon generation and migration routes in the East Texas Basin. Bulletin American Association of Petroleum Geologists, 78, 287-307.
WGC, 2006. http://www.igu.org/html/wgc2006/WOC2database/Excel/Report_Tab_Summary_ UGS_Key_Data_2006_in_operation_english.xls
WEST, J. M. & MCKINLEY, I. G. 2001. The geomicrobiology of radioactive waste disposal. Encyclopaedia of Environmental Microbiology (Ed G. Bitton), John Wiley and Sons, New York, USA.
WHITE, S.H. 1976. The Effects of Strain on the Microstructures, Fabrics, and Deformation Mechanisms in Quartzites. Philosophical Transactions of the Royal Society of London. Series A,
262

Mathematical and Physical Sciences, 283, No. 1312, A Discussion on Natural Strain and Geological Structure (Oct. 12, 1976), 69-86.
WHITE, S.H. 1977. Geological significance of recovery and recrystallization processes in quartz. Tectonophysics, 39, 143-170.
WHITTAKER, A., BRERETON, N.R., EVANS, C.J. & LONG, R.E., 1989. Seismotectonics and crustal stress in Great Britain. In: GREGERSEN, S. AND BASHAM, P.W. (Eds), Earthquakes at North-
Atlantic passive margins: Neotectonics and postglacial rebound. Kluwer, Kluwer, 663-664.
WILLETT, H. 1875. 13th
Report of the Sub-Wealden Exploration Group.
WILLIAMS, A. (ed). 1994. Methane emissions: report of a Working Group appointed by the Watt Committee on Energy. Watt Committee Report, 28, 171 pp.
WILSON, A. A. 1990. The Mercia Mudstone Group (Trias) of the East Irish Sea Basin. Proceedings of the Yorkshire Geological Society, 48(1), 1-22.
WILSON, A. A. 1993. The Mercia Mudstone Group (Trias) of the Cheshire Basin. Proceedings of
the Yorkshire Geological Society, 49(3), 171-188.
WILSON, A.A., BRANDON, A. & JOHNSON, E.W. 1989. Abbeystead: geological context of the Wyresdale Tunnel methane explosion. British Geological Survey Onshore Geology Series, Technical Report No. WA/89/30, 32 pp.
WILSON, A.A. & EVANS, W.B. 1990. Geology of the country around Blackpool. British Geological Survey Memoir, England and Wales, Sheet 66, HMSO, London.
WOODS P. J. E. 1979. The geology of Boulby Mine. Economic Geology, 74; 409-418.
WOODWARD, H.B. 1903. Notes on the occurrence of natural gas at Heathfield, Sussex. Transactions of the Institute of Mining Engineers, LXV (25), 717-723.
WRIGHT, T.L. 1991. Structural geology and tectonic evolution of the Los Angeles Basin. In: BIDDLE, K.T. (ed), Active Margin Basins, American Association Petroleum Geologists Memoir, 52, 35-134.
WSWS, 2003. Gas explosion turns Chinese villages into “a death zone”. World Socialist Web Site 31 Dec 2003 (http://www.wsws.org/articles/2003/dec2003/chin-d31.shtml).
XIONG, H., ROBINSON, B. & FOH, S. 2001. Using an expert system to diagnose formation damage mechanisms and design stimulation treatments for gas storage wells. Paper SPE 72374,
SPE Eastern Regional Meeting, Ohio, USA, October 17-19th, 2001.
YAMAMOTO, H & PRUESS, K. 2004. Numerical Simulations of Leakage from Underground LPG Storage Caverns. A report to the Taisei Corporation, Japan, and the U. S. Department of Energy, Contract no. DE-AC03-76SF00098, 84 pp (http://repositories.cdlib.org/cgi/viewcontent.cgi? article=2676&context=lbnl).
YEAGER, V., BEHENNA, F., BLAUCH, M. & FOH, S. 1998. Investigation of Storage-Well Damage Mechanisms. Gas Research Institute (GRI), Report Nos. GRI-98/019 (http://www.netl.doe.gov/ publications/proceedings/97/97ng/ng97_pdf/NG9-2.PDF).
YOUNG, H.L. 1992a. Summary of ground water hydrology of the Cambrian-Ordovician aquifer system in the northern Midwest, United States, U.S. Geological Survey, Professional Paper,
1405-A, 55p.
YOUNG, H.L. 1992b. Hydrogeology of the Cambrian-Ordovician aquifer system in the northern Midwest, United States, U.S. Geological Survey, Professional Paper, 1405-B, 99 pp.
ZHANG, X. & SANDERSON, D.J. 2001. Evaluation of instability in fractured rock masses using numerical analysis methods: Effects of fracture geometry and loading direction, Journal of
Geophysical Research, 106 (B11), 26671–26687.
263

ZIEGLER, P.A. 1990. Geological Atlas of Western and Central Europe. Shell International Petroleum Maatschappij B.V.
ZOBACK, M.L., 1992. First- and second-order patterns of stress in the lithosphere: The World Stress Map Project. Journal of Geophysical Research, 97, 11703-11728.
264

An appraisal of Underground Gas Storage technologies and incidents, for the development of risk assessment methodology. Sustainable and Renewable Energy Programme Open Report OR/07/023
Volume Two – Figures and Tables


Contents
LIST OF FIGURES
Figure 1. Distribution of the main halite bearing basins in Britain and the location of operational and proposed underground gas storage sites (based upon BGS 2006a).
Also shown the anticlinal structure sites (Ŷ) investigated in the late 1950’s to early 1960s by the Gas Council for underground storage of town gas. 1
Figure 2. Anticipated UK gas demand and declining production rates (after DTI, 2006a). 2
Figure 3. The main mechanisms leading to the choking/blocking of pore spaces that cause damage to, and loss of performance in, reservoir rocks and gas storage wells (after Bary et al., 2002 and courtesy of Schlumberger). 2
Figure 4. Schematic diagram illustrating the concepts of underground gas storage in depleting oil/gasfield (pore), salt cavern and abandoned mine scenarios. a) typical anticlinal traps for oil and gas b) microscope view of sandstone reservoir, c) cartoon illustrating injection of gas into pore spaces from which oil has migrated, or displacing residual oil in pore spaces, thereby enhancing oil recovery, d) the various types of salt bodies in which salt cavern might be constructed (note: the concept of injection and storage of gas in aquifers is the same as in parts a-c, with the exception that the pore spaces are filled with saline water, rather than oil), e) solution mining process for a salt cavern, f) abandoned coal mine storage (based upon Leyden Mine, Canada; after Raven Ridge Resources, 1998). 3
Figure 5. Photographs of salt brining related incidents and features. a) Brine gusher from ICI well BW 124 at Preesall, near Fleetwood, Lancashire, b) collapse crater associated with previous salt brining activities in the Preesall Saltfield (from Jackson, 2005; reproduced by permission of D.S. & M.J. Jackson), c&d) photograph and map of south sinkhole developed at Cargill, Kansas, November 12, 1974 showing development and loss of infrastructure (railway lines) above location of brine well/cavern (from Walters, 1978 and courtesy of Kansas Geological Survey). 4
Figure 6. Sketch diagrams of the nature and result of dislocations within crystal lattices and how they form one of a series of processes leading to deformation, creep and ultimately recrystallisation of materials. a-f) illustration of slip of the crystal lattice as a dislocation moves through on a slip plane (forming an extra half plane), with ultimately the whole slipped by one unit after the dislocation has traversed the whole crystal, g) sketch 3D block diagram to illustrate the process in a-f, showing the position in part e, with the italicised A-F points being roughly equivalent positions, h&i) similar 3D diagram to indicate the slipped area within a crystal and the deformation induced in the crystal lattice, j) development of microfractures in salt grain/crystal. ı1 is the principal stress direction (after Munson et al., 1999). 5
Figure 7. Concept of underground LPG storage caverns with water curtains preventing the release and migration of stored product (gas), after Yamamoto & Pruess (2004). 6
i

Figure 8. Photograph, location map and sketch section showing the Chalk cavern storage facility at Killingholme. Photograph is of one mined gallery, with the sketch section detailing the geology, Chalk stratigraphy, storage horizon and mining technique of an upper and lower ‘bench’, as described in the text (far left of line drawing). Line drawing reproduced by permission of the Geological Society; photograph by permission of David Lee Photography Ltd., Barton upon Humber and the Geological Society, London. 6
Figure 9 Diagramatic representation of the proposed Norton CAES plant at Norton, Ohio (black and white image reproduced by permission Sandia and CAES Development Company LLC: http://www.caes.net/cycle.html). 7
Figure 10. Fractures in halite sequences and linear schistose (possibly mylonitic) fabrics developed in UK halite beds. a) gypsum filled veins representing two sets of infilled fractures in the Breckells Mudstones (caprock) at Preesall (NW England, from Wilson & Evans, 1990), b) strongly flow lineated Boulby Halite on subconcordant core break from depth of 336.7 m (after Smith, 1996; courtesy of the Geological Society, London). Scale bar 10 cm, c) linear crystal fabric that has developed on the curved surface of a break in the core in Preesall Halite (depth 538 m). The break and linear features in the halite has been interpreted by some as slickensides related to brittle faulting in the halite, but may be a ductile flow fabric similar to part b (photograph courtesy of Canatxx Gas Storage Ltd). 7
Figure 11. Development of wet rockhead. 8
Figure 12. Prospective onshore sedimentary basins and significant oil and gas fields. Licence areas also show areas of Coalbed methane prospectivity (source: BGS
2006b). 8
Figure 13. Westphalian channel width/thickness data (after Aitken et al., 1999). 9
Figure 14. Westphalian depositional environments, with typical sand channel forms and dimensions (based upon Fielding, 1984; Guion et al., 1995; Aitken et al., 1999). 9
Figure 15. Major aquifers cropping out in England and Wales (courtesy of Jennifer Cunningham, BGS Wallingford). Also shown, the relationship of major aquifers to the onshore oil and gasfields. 10
Figure 16. Schematic illustration of faulted sand-shale sequence and terminology of fault offsets and sealing configurations referred to in the text (after Færseth, 2006). Where reservoir A and reservoir B are juxtaposed across faults, the shale interval stratigraphically between the two reservoir units may be smeared along the fault to form a seal that hydraulically separates the sandstones. 10
Figure 17. Sketch map of the felt area of the Dogger Bank (7/6/31), Lleyn Peninsular (19/7/84) and Roermund (Netherlands, 13/4/92) earthquakes (from Browitt & Musson, 1993). 11
Figure 18. Cross section of UK seismicity from south to north plotted by latitude and depth, showing probable maximum vertical extent of ruptures for all earthquakes with magnitude > 3 ML with known depths in mainland UK and the Irish Sea. Refer section 6.2 of main report for description of earthquake magnitudes (ML). 11
Figure 19. Numbers of UK earthquakes classed by magnitude and depth. 11
ii

Figure 20. UK seismicity maps (from Musson, 2003b: http://www.earthquakes.bgs.ac.uk/hazard/Hazard_UK.htm). a) earthquakes in the UK, b) tectonic sketch map of the UK, c) EMS intensity hazard map for the UK. 12
Figure 21. Location of French UGS sites referred to in the text and details of the Tersanne cavern dimensions prior to and following salt creep (after Bérest & Brouard, 2003). 12
Figure 22. Details of Californian oilfields. a) cross section of the leakage scenario at the Fairfax Oilfield (after Hamilton & Meehan, 1992), b) skyline of oil derricks at the Playa del Rey Oilfield (after Seaver Center for Western History Research, Los Angeles County Museum of Natural History), c) general location map of depleted gasfields and gas storage sites in California and referred to in the text, d) gas bubbling up old leaking well in shallow water pond, Playa del Rey (courtesy Jeanette Vosberg, Save Ballona Wetlands – see http://saveballona.org/techpages/well.html), e) map of the Playa del Rey and Venice Beach oilfields with known well locations, f) schematic section of Playa del Rey Oilfield showing gas leakage paths. 13
Figure 23. Illustrations of former heavily drilled areas of Los Angeles that are now densely populated urban areas. a) view of oil derricks associated with the Los Angeles City Oilfield (.c 1890; courtesy of Lena Tabilio and the California Division of Oil, Gas and Geothermal Resources (http://www.consrv.ca.gov/index/siteMap.htm#doggr), b) map of the Belmont School area, where construction stopped due to the underlying LA City Oilfield, c) Los Angeles City Oilfield at the corner of Glendale Boulevard and Rockwood Street, circa 1900 (Photo courtesy of the Seaver Center for Western History Research, Los Angeles County Museum of Natural History, www.nhm.org), and d) Los Angeles City Oilfield at the corner of Glendale Boulevard and Rockwood Street, October 2002 (from Gamache & Frost, 2003; courtesy of the California History Room, California State Library, Sacramento, California (www.library.ca.gov/calhist/index.html). 14
Figure 24. Stratigraphy of the Los Angeles area, structure contour map (at near top basement) of the Venice Beach and Playa del Rey oilfields and cross section of the Playa del Rey Oilfield (based upon Wright, 1991). 14
Figure 25. Major salt basins of the North America, including the main salt domes referred to in the text. Also shown, images of the major gas release incidents at Hutchinson (downtown fire, courtesy Chief Forbes, Hutchinson Fire Brigade; gas geyser, CUDD Drilling and Shannon Pope of RPC Inc), Moss Bluff (after Dave Ryan, Beaumont Enterprises http://www.thefortressweb.com), Brenham (courtesy of NTSB, 1993), Fort Saskatchewan (after Liz Nayowski, Fort Saskatchewan Record: http://www.chem.queensu.ca/chembook/articles/ 15
Figure 26. The Ghislenghien gas pipeline explosion (images courtesy Emergency Management: http://www.emergency-management.net/gaspipeline2004.htm). a) location map, b) the fire following the explosion, c ) view of the general site showing the burned area and d) the crater and exposed pipeline. 16
Figure 27. The 2005 Buncefield above ground storage incident (after Powell 2006a&b). a) aerial view of the site prior to the incident, b) the incident from the
iii

air, c) aerial view of damage to storage vessels, d) map illustrating the proximity of the storage depot to surrounding industrial and domestic buildings. 16
Figure 28. Schematic illustration of possible leakage pathways through an abandoned well: a) between casing and cement, b) between cement plug and casing, c) through the cement pore space due to cement degradation, d) through well casing as a result of corrosion, e) through fractures in cement, f) between cement and rock. (Figure from Scherer et al., 2005; reproduced from Environmental Geology, by permission of ©Springer Verlag). 17
Figure 29 Humbly Grove gas storage facility (courtesy Star Energy). a) site clearance (Feb 2004) and b and c) completed facility (Feb 2005). 17
Figure 30. Details of the Teutschental (West Germany) site and ethylene escape (based upon Katzkung et al., 1996). a) structure contour map on top Zechstein halite, b) SW-NE cross section across the Lauchstädt structure and storage site area, c) and d) photographs of venting sites, from which a mixture of ethylene and water erupted, e) location map for UGS sites in Germany and referred to in text. Photographs reproduced by permission of E. Schweizerbart Science Publishers: http://www.schweizerbart.de/). 18
Figure 31. Detail of the Kiel storage cavern in Germany, illustrating volume loss due to insolubles, roof collapse and salt creep (after Bérest & Brouard, 2003). 19
Figure 32. Details of the Eminence salt dome and storage facility (based upon Allen, 1972). a) cross-section of the salt dome with depth of caverns, b) detail of the depths and shapes of the four caverns constructed at Eminence c) illustration of the extent of salt creep and decrease in cavern size. 19
Figure 33. Details of the Mont Belvieu salt dome and storage facility a) structure contour map on the top of the Frio Sands showing area of salt piercement (after Halbouty, 1979), b) cross-section of the salt dome. 20
Figure 34. Details of the Moss Bluff salt dome and storage facility a) structure contour map on the top of the Frio Sands showing area of salt piercement (after Halbouty, 1979), b) cross-section of the salt dome illustrating the depth of the cavern and shape. 20
Figure 35. Details of the Hutchinson incident. (a) location map illustrating the site of the storage facility circa 11 km (7 miles) NW of the town of Hutchinson (b) WNW-ESE cross section showing the stratigraphy and structure of the area and the route taken by the gas from the storage cavern to the town (after Kansas Geological Survey). Images shown courtesy of Chief Forbes, Hutchinson Fire Department; Kansas Geological Survey; CUDD Drilling and Shannon Pope of RPC Inc. 21
Figure 36. Setting of the Fort Saskatchewan cavern storage facility, Canada. a) sketch cross section of the area, b) cross section of the cavern an infra-structure (after EUB, 2002). 22
Figure 37. Sketch section through the Napoleanville salt dome illustrating the situation when shale layers were encountered indicating that due to poor site characterisation, the sidewalls of the salt dome/stock had been intersected during brining operations (after Neal & Magorian, 1997). 22
iv

Figure 38. Stratigraphy, cross-section and leakage paths from the Leroy Gas Storage Facility, Wyoming (after Araktingi et al., 1984). 23
Figure 39. Stratigraphy and structural detail of the Coalville and Chalk Creek gas (aquifer) storage facilities, Utah, USA (after Morgan, 2004). 23
Figure 40. Cross-section of the Pleasant Creek gas (aquifer) storage facility in California (after Jones & Drozd, 1983). Also shown the soil-gas profiles showing leakage of the aquifer caprock. 24
Figure 41. Stratigraphy of Illinois aquifer sandstones and location of the main gas storage sites having experienced difficulties, see Appendix 5 (after Collinson et al., 1988; Kolata & Wilson, 1991). 24
Figure 42. Structural contour map of the Weeks Island salt dome, Louisiana, illustrating the sites of the two sink holes in relation to the extent of salt mine workings (after Warren, 2006). 25
Figure 43. Detail of the Leyden Mine gas storage site, Colorado (after Raven Ridge Resources, 1998). 25
Figure 44. Map of the oilfields and main tectonic features in the Los Angeles Basin. a) Oilfields based upon Camp Dresser & McKee (2001) and Wright (1991), faults based upon Wright (1991) and Biddle (1991), b) oil derricks along the ocean frontat Playa del Rey (after Seaver Center for Western History Research, Los Angeles County Museum of Natural History), c) gas bubbles emerging from old oil well in lagoon at Playa Vista, Playa del Rey oilfield (courtesy Jeanette Vosberg, Save Ballona Wetlands - see http://saveballona.org/techpages/well.html). 26
Figure 45. Castaic and Honor Rancho gas storage facilities. a) Location map, b) cross section of the Honor Rancho Oilfield (after Davis & Namson, 2004). 27
Figure 46. Sketch diagrams showing problems with and the repair of gas storage wells in California (after Vector Magnetics: http://www.vectormagnetics.com/ 28
Figure 47. Sketch section illustrating the geological conditions likely to represent the ‘Saltfleetby scenario’ (based upon Hodge, 2003). 29
Figure 48. Sketch section illustrating the geological conditions likely to represent the ‘Welton scenario’ (based upon Rothwell & Quinn, 1987). 29
Figure 49. Sketch section illustrating the geological conditions likely to represent the ‘Gainsborough-Beckingham scenario’ (based upon Brunstrom, 1963; Fraser & Gawthorpe, 1990, 2003). 30
Figure 50. Sketch section illustrating the geological conditions likely to represent the ‘NE England scenarios’ (e.g. Caythorpe and Kirby Misperton gasfields – based upon Kirby & Swallow, 1987). 30
Figure 51. Sketch section illustrating the geological conditions likely to represent the ‘Weald Basin scenarios’ (e.g. Humbly Grove and Storrington – based upon Hancock & Mithern, 1987). 31
Figure 52. Generalised stratigraphy for the Humbly Grove and northern Weald area. Abbreviations: Lst –limestone; Sst – sandstone; Siltst - siltstone. 32
Figure 53. Sketch section illustrating the geological conditions likely to represent the ‘NW England (Elswick) scenario’ (based upon Aitkenhead et al., 1992). 33
v

Figure 54. Sketch section illustrating the geological conditions likely to represent the ‘Cheshire Basin scenario’ – relating to the Byley, Hole House, King Street and Stublach sites. 33
Figure 55. Sketch section illustrating the geological conditions likely to represent the ‘Byley and Hole House scenarios’. 34
Figure 56. Sketch section illustrating the geological conditions likely to represent the ‘Preesall saltfield scenario’. a) the southern areas of the saltfield (more intragrabenal faults), b) the northern areas of the saltfield (fewer intragrabenal faults). 35
Figure 57. General setting of the Dorset Halite in the region of the proposed salt cavern storage facility beneath the Weymouth-Isle of Portland area. a) Line illustration of the thickening of the (Dorset) halite of the Wessex Basin in the Weymouth Anticline, based upon depth converted seismic reflection data (Chadwick & Evans, 2005), b) sketch of the level of proposed gas storage caverns and layout (after Egdon, 2006a). 36
Figure 58. Sketch section illustrating the geological conditions likely to represent the ‘NE England Permian scenario’ (e.g. Hornsea/Atwick, Aldbrough). 37
vi

LIST OF TABLES
Table 1 (following page). Summary of operational and planned underground gasstorage facilities in Britain. Note: information regarding the caverns operationalin the Teesside area and the product stored has been in part supplied by SABIC,whose assistance is gratefully acknowledged. This represents our most up to dateinformation on the various caverns and stored products. However, more detailmight become available with time. 39
Table 2. Number of underground natural gas storage facilities, working volumes anddeliverability, both worldwide and in the USA (based upon IGU, 2003; Favret,2003; Plaat, 2004 & this volume; EIA, 2006). 41
Table 3. Calculated diffusive fluxes for the McClave Field (Nelson & Simmons,1995) 42
Table 4. Calculated methane losses for a 1737 m and a 39.6 m thick caprock (Smith etal., 1971) 42
Table 5. Summary of the main hydrocarbon province characteristics and significantdiscoveries onshore UK. 43
Table 6. Tolerance of microbes to extreme environments (West & McKinley, 2001).43
Table 7. Summary of main processes leading to leakage from and failure ofunderground hydrocarbon storage facilities. 44
Table 8. Summary of documented incidents or problems reported at undergroundhydrocarbon storage facilities developed in depleting oil/gasfields, some of whichhave led to leakage and/or failure. 45
Table 9. Summary of documented incidents or problems reported at undergroundhydrocarbon storage facilities developed in aquifers, some of which have led toleakage and/or failure. 46
Table 10 (next page). Summary of documented incidents or problems reported atunderground hydrocarbon storage facilities developed in salt caverns, some ofwhich have led to leakage and/or failure. 48
Table 11. Summary of documented incidents or problems reported at undergroundhydrocarbon storage facilities developed in abandoned mines, some of whichhave led to leakage and/or failure. 49
Table 12. Details of operating European UGS sites in MARCOGAZ survey ofEuropean UGS incidents to 2000 (from Joffre & LePrince, 2002). 51
Table 13. Breakdown of the information collected during the MARCOGAZ survey ofEuropean UGS incidents to 2000 (from Joffre & LePrince, 2002). 51
Table 14. Summary of main casualty figures from various oil, gas and petrochemicalincidents in the USA and rest of the world. Figures relating to Office PipelineSafety (OPS) and HSE for domestic gas supplies partly duplicate those pipelinefigures in the USA summarised in Tables 15 & 16, which were the majorincidents covered in NTSB reports. 52
vii

Table 15. American OPS statistics for reported incidents and casualties involving both hazardous liquids and gas supply for the period 1986-2006(part) – refer http://ops.dot.gov/stats/stats.htm). 53
Table 16. UK gas safety statistics illustrating known incidents relating to supply and use of flammable gas for the period 1986-2005 and which resulted in fatalities/injuries (based upon published Health & Safety Executive figures). The cause of incidents resulting in death or injury and which were not known (or related to suicide) are not included here. Note: the HSE fatalities refer to the gas distribution system and use of gas and not the transmission system. 54
Table 17. Summary of casualty figures for varying stages of the energy chain. Based largely upon the ENSAD (severe accidents) database for oil, gas and LPG production and supply for the period 1969-1996 (from Hirschberg et al., 1998). 55
Table 18 . Significant petrochemical plant accidents involving death or injury. 56
Table 19. Significant American hydrocarbon related railroad accidents/incidents involving death or injury (based upon NTSB figures refer website). 57
Table 20. Above ground storage tank incidents between 1951-2003 resulting in fatalities and/or casualties (based upon Persson & Lönnermark, 2004 but including Clark et al., 2001). 58
viii

Larne
Lough
Figures
LPG Chalk cavern storage - operational
- planned
Hatfield Moors/
Albury
0 100 km
Saltholme &
Killingholme
Hole House
LARNE
N
58°N
52°N
50°N
6°W 4°W 2°W 0°
54°N
BrackleyStow
Whichford
Sarsden
Cliffe
Chipping Norton
Napton
Nene
Huntingdon
Winchester
Stamford
Depleted oil/gasfield - operational
Depleted oil/gasfield - planned
Salt cavern storage - planned
Salt cavern storage - operational
Gas discovery (not developed)
Triassic saltfields
Permian saltfield
Welton
Saltfleetby
Humbly Grove
Caythorpe
Hatfield West
Bletchingley
Storrington
Preesall
Portland
Wilton, Teesside
Byley/Holford,
King Street & Stublach
(Holford Brinefield)
Holford H-165
Point of Ayre
Gateway
Storage
Gainsborough
Hornsea/Atwick
Aldbrough, Aldbrough North
(Warmingham Brinefield)
BASIN
CHESHIRE BASIN
NORTH & SOUTH STAFFORDSHIRE BASINS
WORCESTER BASIN
SOMERSET BASIN
WESSEX BASIN
BGS©NERC. All rights reserved
Figure 1. Distribution of the main halite bearing basins in Britain and the
location of operational and proposed underground gas storage sites (based upon
BGS 2006a). Also shown the anticlinal structure sites (Ŷ) investigated in the late
1950’s to early 1960s by the Gas Council for underground storage of town gas.
1

140
120
100
80
60
40
20
0
Gas
prod
uctio
n (b
cm)
Increasing need for storage?
Anticipated UK gas demand
Growing gap = imports
2004 2006 2008 2010 2012 2014 2016 2018 2020
Years
Proven reserves Unproven reserves
On-stream Under development Probable Possible
After DTI, BGS©NERC. All rights reserved
Figure 2. Anticipated UK gas demand and declining production rates (after DTI,
2006a).
precipitates
Bacteria Hydrocarbon
residues
Particulates Inorganic
Caprock
Reservoir Sand grains
After Schlumberger BGS©NERC. All rights reserved
Figure 3. The main mechanisms leading to the choking/blocking of pore spaces
that cause damage to, and loss of performance in, reservoir rocks and gas
storage wells (after Bary et al., 2002 and courtesy of Schlumberger).
2

Oil
Gas cap
Spill point
Oil
450-2500 m
a
Close-up (microscope)
b&c
Water-filled permeable reservoir rock
Water-filled permeable reservoir rock
Seal or cap-rock
Seal or cap-rock view in parts
Injection/withdrawal well
Pore spaces
Sand grains
b
c
-growths)
saturation
Oil-filled pore space
oil produced)
film on grain
Sand grain (+/- over
Injected gas
Residual
Permeable pathways (water/ gas filled after
Sand grain
Residual oil
d America + GB offshore? USA & GB (onshore) USA + GB?
Domal salt Thin bedded salt
f
g
c. 240-?1000 m
(GB)
c. 240-2400 m
(GB)
Gas cap
solution mining
Gas injection, continued
solution mining mining
complete
Compressed
brine
Storage operations
Drilling borehole
Metres (above sl)
Surface workings
Surface
Main coal seam
1750
1700
1650
Gravels
1600
1550
1500
1450
Shales & sandstones
‘B’ seam
injection
Brine return
Initial borehole
cement casing
Brine return
Sump
insolubles
e Construction of sump developed cavern
Cavern near completion
Hanging tubing
Few 00’s-000’s m
Thick bedded salt
Start of Solution gas displaces
Salt
Shaft No.2
Shaft No.1 Shaft No.3
Air shaft
‘A’ seam
Raw water
Bottom of
Top of
Salt ‘roof’
Blanket level
Partially
Salt
BGS©NERC. All rights reserved
Figure 4. Schematic diagram illustrating the concepts of underground gas storage in depleting
oil/gasfield (pore), salt cavern and abandoned mine scenarios. a) typical anticlinal traps for oil
and gas b) microscope view of sandstone reservoir, c) cartoon illustrating injection of gas into
pore spaces from which oil has migrated, or displacing residual oil in pore spaces, thereby
enhancing oil recovery, d) the various types of salt bodies in which salt cavern might be
constructed (note: the concept of injection and storage of gas in aquifers is the same as in parts a-
c, with the exception that the pore spaces are filled with saline water, rather than oil), e) solution
mining process for a salt cavern, f) abandoned coal mine storage (based upon Leyden Mine,
Canada; after Raven Ridge Resources, 1998).
3
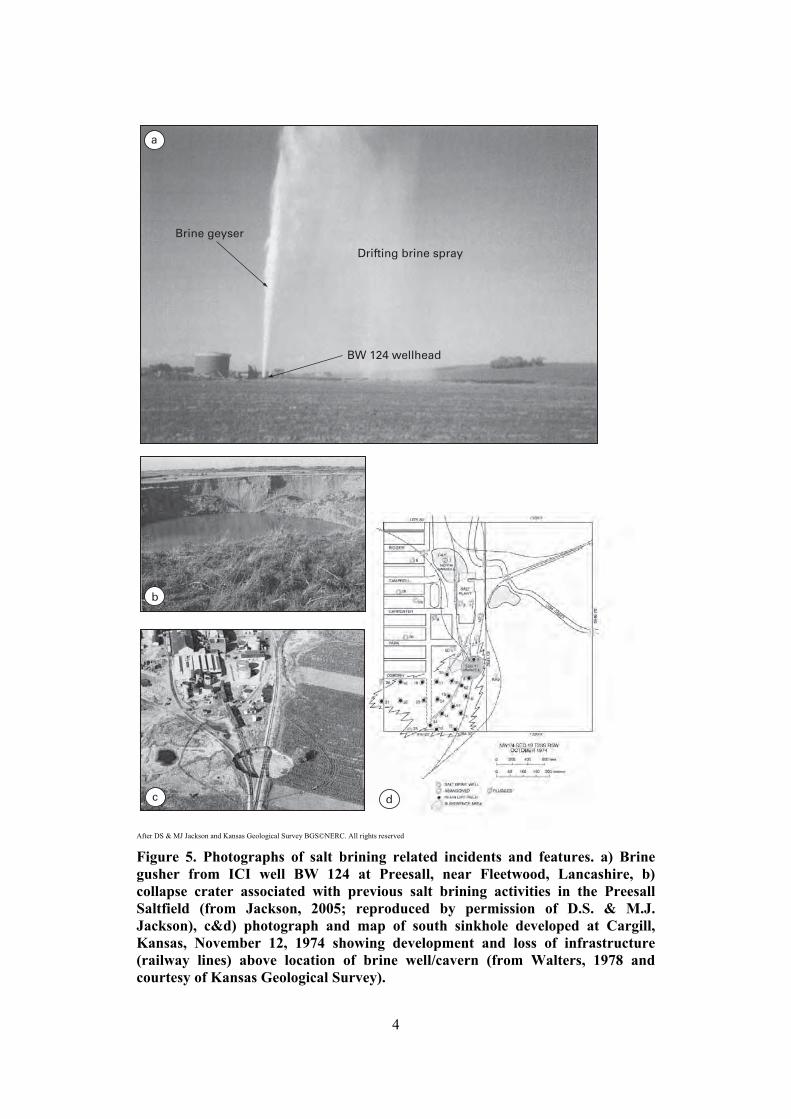
Brine geyser
a
b
c d
After DS & MJ Jackson and Kansas Geological Survey BGS©NERC. All rights reserved
Drifting brine spray
BW 124 wellhead
Figure 5. Photographs of salt brining related incidents and features. a) Brine
gusher from ICI well BW 124 at Preesall, near Fleetwood, Lancashire, b)
collapse crater associated with previous salt brining activities in the Preesall
Saltfield (from Jackson, 2005; reproduced by permission of D.S. & M.J.
Jackson), c&d) photograph and map of south sinkhole developed at Cargill,
Kansas, November 12, 1974 showing development and loss of infrastructure
(railway lines) above location of brine well/cavern (from Walters, 1978 and
courtesy of Kansas Geological Survey).
4

5
SlipPlane
Un-slipped
Slipped crystal
Extra half plane
a b c
d e f
g
i
Crystal lattice, with atoms
Crystal lattice, with atoms
j
Extra half planeSlipped areaof slip plane
Slip plane
Dislocation line
A
B
CD
E
F
A B
CD
EF
h
Slippedarea
Dislocation
Slip plane
Slippedarea
Extra half plane
1
2 = 32 = 3
1
Cleavage crack orgrain boundary crack
Partly after Munson et al. BGS©NERC. All rights reserved
Figure 6. Sketch diagrams of the nature and result of dislocations within crystal
lattices and how they form one of a series of processes leading to deformation,
creep and ultimately recrystallisation of materials. a-f) illustration of slip of the
crystal lattice as a dislocation moves through on a slip plane (forming an extra
half plane), with ultimately the whole slipped by one unit after the dislocation
has traversed the whole crystal, g) sketch 3D block diagram to illustrate the
process in a-f, showing the position in part e, with the italicised A-F points being
roughly equivalent positions, h&i) similar 3D diagram to indicate the slipped
area within a crystal and the deformation induced in the crystal lattice, j)
development of microfractures in salt grain/crystal. ı1 is the principal stress
direction (after Munson et al., 1999).

Plug
OutletInlet
Drainage
Liquid LPG
Vapour LPG
Groundwater level
Water curtain
Water bed
Water collection point
Groundwater pressure
Water satu
rated
After Yamamoto & Pruess BGS©NERC. All rights reserved
Figure 7. Concept of underground LPG storage caverns with water curtains
preventing the release and migration of stored product (gas), after Yamamoto &
Pruess (2004).
NKingston upon Hull
Humber Bridge
LPG caverns
site
by roadheader
Flint bands
Grasby Marl Grasby
Marl
blasting
Scunthorpe
Grimsby
0 8 16 km
Humber
After Geological Society, London BGS©NERC. All rights reserved
Top heading after trimming
Bottom bench sidewall after
Figure 8. Photograph, location map and sketch section showing the Chalk cavern
storage facility at Killingholme. Photograph is of one mined gallery, with the
sketch section detailing the geology, Chalk stratigraphy, storage horizon and
mining technique of an upper and lower ‘bench’, as described in the text (far left
of line drawing). Line drawing reproduced by permission of the Geological
Society; photograph by permission of David Lee Photography Ltd., Barton upon
Humber and the Geological Society, London.
6

After Sandia and CAES Development Company LLC BGS©NERC. All rights reserved
Figure 9 Diagramatic representation of the proposed Norton CAES plant at
Norton, Ohio (black and white image reproduced by permission Sandia and
CAES Development Company LLC: http://www.caes.net/cycle.html).
After Canatxx Gas Storage Ltd, and Geological Society, London BGS©NERC. All rights reserved
Figure 10. Fractures in halite sequences and linear schistose (possibly mylonitic)
fabrics developed in UK halite beds. a) gypsum filled veins representing two sets
of infilled fractures in the Breckells Mudstones (caprock) at Preesall (NW
England, from Wilson & Evans, 1990), b) strongly flow lineated Boulby Halite on
subconcordant core break from depth of 336.7 m (after Smith, 1996; courtesy of
the Geological Society, London). Scale bar 10 cm, c) linear crystal fabric that has
developed on the curved surface of a break in the core in Preesall Halite (depth
538 m). The break and linear features in the halite has been interpreted by some
as slickensides related to brittle faulting in the halite, but may be a ductile flow
fabric similar to part b (photograph courtesy of Canatxx Gas Storage Ltd).
7

Solution
Depth (m)
residue Collapsed strata
Subcrop of Halite
Mobile
Dry rockhead
+50
OD
-50
-100
-150
-200 Not to scale horizontally
Mudstone bedsHalite
Halite
Glacial drift
groundwater Wet rockhead
BGS©NERC. All rights reserved
Figure 11. Development of wet rockhead.
BGS©NERC. All rights reserved
Figure 12. Prospective onshore sedimentary basins and significant oil and gas
fields. Licence areas also show areas of Coalbed methane prospectivity (source:
BGS 2006b).
8

After Aitken et al BGS©NERC. All rights reserved
Figure 13. Westphalian channel width/thickness data (after Aitken et al., 1999).
a 20 km
Outer minor delta /
major crevasse
Siltstone dominated
deposits
Minor crevasse
Distal crevasse splays/ minor deltas
Coarse-grained
overbank depositsMedial crevasse
splay / minor delta
Major distributary
Outer minor delta /
Pass
ive
lake
mar
gin
Outer minor delta / Outer minor delta /
floor
Coarse-grained overbank deposits
overbank claystones
Proximal
channel
overbank
channel
Major distributary channel
channel
overbank claystones
Swamp
overbank claystones overbank claystones
Anoxic lake
b WESTPHALIAN CHANNEL / SANDBODY DIMENSIONS
PROXIMAL LACUSTRINE DELTA 0-8m
Lobate to sheet-like deposits
DISTAL LACUSTRINE generally <8m thick
DELTA 1-10m
MAJOR CHANNEL1 to
20 km
MINOR CHANNEL10 m to
1 km
OVERBANK
CREVASSE SPLAY
from channel
8-20m
0-1m
Typically
10’s of km
Up to 10 km
10’s m
Elongate belts parallel to channel. Dimensions
depend on channel size
Typically 1-8m
Typically 1-8m
Thins away
~1 km
(after Guion et al 1995; Aitken et al, 1999)
After Fielding,, Guion et al.; Aitken et al. BGS©NERC. All rights reserved
Figure 14. Westphalian depositional environments, with typical sand channel
forms and dimensions (based upon Fielding, 1984; Guion et al., 1995; Aitken et
al., 1999).
9
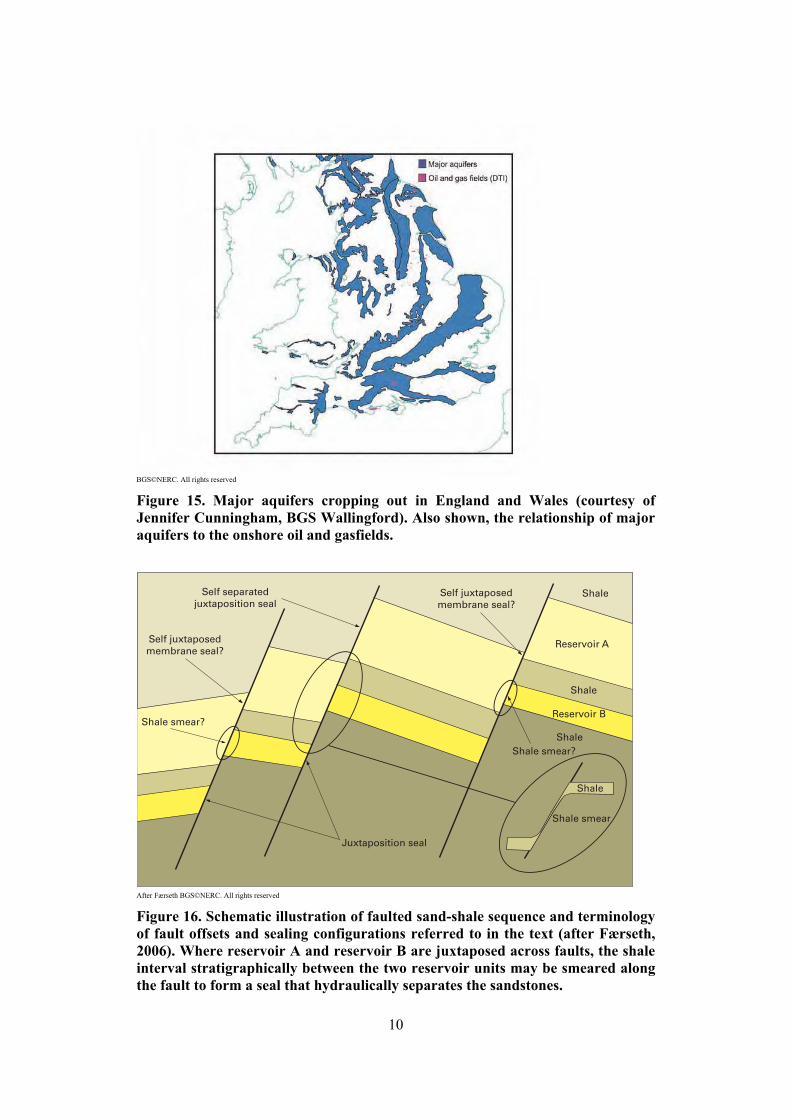
BGS©NERC. All rights reserved
Figure 15. Major aquifers cropping out in England and Wales (courtesy of
Jennifer Cunningham, BGS Wallingford). Also shown, the relationship of major
aquifers to the onshore oil and gasfields.
Shale smear
Shale
Shale
Shale
Shale juxtaposition seal
membrane seal?
membrane seal?
Shale smear?
Shale smear?
Reservoir A
Reservoir B
Juxtaposition seal
Self separated
Self juxtaposed
Self juxtaposed
After Færseth BGS©NERC. All rights reserved
Figure 16. Schematic illustration of faulted sand-shale sequence and terminology
of fault offsets and sealing configurations referred to in the text (after Færseth,
2006). Where reservoir A and reservoir B are juxtaposed across faults, the shale
interval stratigraphically between the two reservoir units may be smeared along
the fault to form a seal that hydraulically separates the sandstones.
10

Dogger Bank
Epicentres
KEY
Lleyn Peninsula
Roermond
BGS©NERC. All rights reserved
Figure 17. Sketch map of the felt area of the Dogger Bank (7/6/31), Lleyn
Peninsular (19/7/84) and Roermund (Netherlands, 13/4/92) earthquakes (from
Browitt & Musson, 1993).
0
-5
-10
-15
Dept
h (k
m)
-20
-25
-30
49 50 51 52 53 54
Latitude
55 56 57 5958
BGS©NERC. All rights reserved
Figure 18. Cross section of UK seismicity from south to north plotted by latitude
and depth, showing probable maximum vertical extent of ruptures for all
earthquakes with magnitude > 3 ML with known depths in mainland UK and the
Irish Sea. Refer section 6.2 of main report for description of earthquake
magnitudes (ML).
7.0
6.0
5.0
4.0
3.0Frequency
Depth (km) Magnitude
2.0
1.0
0.0
0
2.8 3.2
3.6 4.0
4.4 4.8
5.2 5.6
6.05 10
15 20
25 30
BGS©NERC. All rights reserved
Figure 19. Numbers of UK earthquakes classed by magnitude and depth.
11

-9 -8 -7 -6 -5 -4 -3 -2 -1 0 1 2 362 62
61 61
60 60 Passive
Moine -10 -5 0 5margin thrust
Great Glen
EMS
6-75-5.94-4.93-3.92-2.9Below 2
INTENSITIESAbove 7
KEY 59 59 Hebridean Fault
Craton Metamorphic Caledonides
58 58
57 57 Highland Boundary
Fault
56 56 Southern Uplands
Fault
Zone of Iapetus 55 55Suture55 55
Non-metamorphic Caledonides54 54
53 53
52 52 Variscan Front
51 51
50 50 Variscides 50 50
49 49-9 -8 -7 -6 -5 -4 -3 -2 -1 0 1 2 3 -10 -5 0 5
a b c BGS©NERC. All rights reserved
Figure 20. UK seismicity maps (from Musson, 2003b:
http://www.earthquakes.bgs.ac.uk/hazard/Hazard_UK.htm).
a) earthquakes in the UK, b) tectonic sketch map of the UK,
c) EMS intensity hazard map for the UK.
Gourney
St Clair
St Illiers
Beynes (aquifer)
Germigny (aquifer)
Soings
CHEMERY
Céré-la-Ronde
Etrez
TERSANNE
Manosque
Cerville
LACQ
Izaute
Lussagnet
UGS storage facility
storage
Aquifer storage
English Channel
Bay of Biscay
30 30 metres0
1400
1500
1450
Dept
h (m
)
100 km0
Salt cavern
Viriat
Tersanne cavern
January 1980
February 1970
Partly after Bérest & Brouard BGS©NERC. All rights reserved
Figure 21. Location of French UGS sites referred to in the text and details of the
Tersanne cavern dimensions prior to and following salt creep (after Bérest &
Brouard, 2003).
12

13
After Hamilton & Meehan and Seaver Center for Western History Research, Los Angeles County Museum of Natural History and saveballonawetlands BGS©NERC. Allrights reserved
Figure 22. Details of Californian oilfields. a) cross section of the leakage scenario
at the Fairfax Oilfield (after Hamilton & Meehan, 1992), b) skyline of oil
derricks at the Playa del Rey Oilfield (after Seaver Center for Western History
Research, Los Angeles County Museum of Natural History), c) general location
map of depleted gasfields and gas storage sites in California and referred to in
the text, d) gas bubbling up old leaking well in shallow water pond, Playa del Rey
(courtesy Jeanette Vosberg, Save Ballona Wetlands.
See http://saveballona.org/techpages/well.html), e) map of the Playa del Rey
and Venice Beach oilfields with known well locations, f) schematic section of
Playa del Rey Oilfield showing gas leakage paths.
Marker A
Marker A
Marker B
500
1000
1500
‘Pico Sands’
50’ gravel (aquifer)
TOPANGA GROUP -schist conglomerate Cement shoe leak
Cement plug leak
Hig
h p
ress
ure
Wellhead venting & leakage
Corrosionleakage
0 m
‘PICO FM’
SAN PEDRO FM
‘REPETTOFORMATION’
PUENTEFORMATION’
Playa Vista leakage pathsPlaya Vista - old well (2004)
Playa del Rey oilfield - old wellsFairfax oilfield - fault leakage
a b
c d
e
f
PACIFICOCEAN
Gas bubbles
Old casing
Playa del Rey
McDonald
Island
Castaic &
Honor Rancho
Aliso Canyon
Goleta
Lodi
Wild Goose
Los Medanos
Pleasant Creek
California storage sites
PACIFICOCEAN
500
Dept
h (m
) bel
ow O
D
OD OD
1000
Approximate baseof Pleistocene
Fire 1985,gas escapeFire 1985,
gas escape
3RD
ST
RE
ET
FAU
LT
Perforated wellinterval forproduction
Perforated wellinterval for disposal
(Facilities referred toin report underlined)
Playa del Rey Oilfield
0 1 2 km
Venice
Beach
Playa del Rey
Mar
ina
del
Rey
12
3
1. SoCal 12. SoCal 23. SoCal 3
Old well
5TH
STRE
ETFA
ULT

Silverlake Blvd.
Glendale Blvd.
Pasad
ena F
wy
Hollywood FreewayBeverly Blvd.
Vermont
Ave.
Alva
rado
St.
Wilshire Blvd.
Dodger Stadium
L.A. City Oil Field (shaded), with theMiddle School
Commonwealth Elementary School
Belmont Learning Complex
Old Belmont High School
Elementary School
3rd Street
a
c d
b
incomplete Belmont Learning Centre
Virgil
Union Avenue
After California Division of Oil, Gas and Geothermal Resources, Seaver Center for Western History Research, Los Angeles County Museum of Natural History California History Room, California State Library, Sacramento, California BGS©NERC. All rights reserved
Figure 23. Illustrations of former heavily drilled areas of Los Angeles that are
now densely populated urban areas. a) view of oil derricks associated with the
Los Angeles City Oilfield (.c 1890; courtesy of Lena Tabilio and the California
Division of Oil, Gas and Geothermal Resources.
(http://www.consrv.ca.gov/index/siteMap.htm#doggr), b) map of the Belmont
School area, where construction stopped due to the underlying LA City Oilfield,
c) Los Angeles City Oilfield at the corner of Glendale Boulevard and Rockwood
Street, circa 1900 (Photo courtesy of the Seaver Center for Western History
Research, Los Angeles County Museum of Natural History, www.nhm.org), and
d) Los Angeles City Oilfield at the corner of Glendale Boulevard and Rockwood
Street, October 2002 (from Gamache & Frost, 2003; courtesy of the California
History Room, California State Library, Sacramento, California
(www.library.ca.gov/calhist/index.html).
1650
1750
1800
1800
1800
1800
1900
2100
2000
2200
1900 2300 2400
1900
1700
areas
Monica
Bay
0
1800
Basem
ent r
idge
Playa del Rey Inglewood WSW ENE
sea level
2
4
6
PICO FM
0 5 km
Age
NE
OG
EN
E
MIO
CE
NE
P
LIO
CE
NE
ME
SO
ZO
IC
CE
NO
ZO
IC
E
Late
Mid
dle
Stratigraphical Nomenclature
‘PICO FM’ FERNANDO
(LA HABRA FM)
Dept
h (k
m)
N
Limits of productive
Santa
1 km
Playa del Rey Oilfield
Contours at 50 m intervals
Venice Beach Oilfield
Santa Monica Bay
REPETTO FM
Catalina Schist
Catalina Schist
TOPANGA GROUP
PUENTE FORMATION
PUENTE FORMATION
QU
AT
ER
NA
RY
PLE
ISTO
CE
NE
JU
RA
SS
IC-
CR
ETA
CE
OU
S
Late
Ear
ly
‘REPETTO FM’
PUENTE FORMATION
TOPANGA GROUP
Schist congl.
FORMATION
(SAN PEDRO FM)
Catalina Schist
‘Nodular Shale’
After Wright BGS©NERC. All rights reserved
Figure 24. Stratigraphy of the Los Angeles area, structure contour map (at near
top basement) of the Venice Beach and Playa del Rey oilfields and cross section
of the Playa del Rey Oilfield (based upon Wright, 1991).
14

TEXAS
COLORADO KANSAS
NEW MEXICO OKLAHOMA
MISS.
LO. ALAB.
Houston
MANITOBA
CANADAUSA
deposits
deposits
deposits
Major salt deposits
USA MEXICO
ILLINOIS
VIRGINIA
Moss Bluff
Brenham
Mont Belvieu,
Eminence
Stratton Ridge & Bryan Mound
Petal City
McIntosh
Magnolia
Mineola
Brenham
Section of pipe blown out of crater
Workers
SASKATCHEWAN ALBERTA
MONTANA
UTAH
N DAKOTA
Devonian salt
Permian salt
Jurassic salt
in North America
Barber’s Hill
West Hackberry
Weeks Island
Hutchinson (akaYaggy)
(2001)
Moss Bluff (2004)
Fort Saskatchewan
(2001)
(1992)
Carlsbad pipeline explosion (2000)
After Hutchinson Fire Brigade, CUDD Drilling and Shannon Pope of RPC Inc, Dave Ryan, NTSB and Liz Nayowski, Fort Saskatchewan Record BGS©NERC. All rights reserved
Figure 25. Major salt basins of the North America, including the main salt domes referred to in
the text. Also shown, images of the major gas release incidents at Hutchinson (downtown fire,
courtesy Chief Forbes, Hutchinson Fire Brigade; gas geyser, CUDD Drilling and Shannon Pope
of RPC Inc), Moss Bluff (after Dave Ryan, Beaumont Enterprises http://www.thefortressweb.com),
Brenham (courtesy of NTSB, 1993), Fort Saskatchewan (after Liz Nayowski, Fort Saskatchewan
Record: http://www.chem.queensu.ca/chembook/articles/ethane_fire_in_fort_saskatchewan.htm),
night time image of the Carlsbad pipeline incident which caused a crater 15.5 m by 34.5 m,
bridge towers (estimated 10 m high) arrowed for scale (courtesy of NTSB, 2003).
15

ba
c d
After Emergency Management BGS©NERC. All rights reserved
Figure 26. The Ghislenghien gas pipeline explosion (images courtesy Emergency
Management: http://www.emergency-management.net/gaspipeline2004.htm). a)
location map, b) the fire following the explosion, c ) view of the general site
showing the burned area and d) the crater and exposed pipeline.
The oil depot,
built-up areas and Hemel Hempstead
Unit)
M1a c
Area of main fire badly damaged by heat during the fire
b 0 1 kmd
showing proximity to the surrounding
(Photographs from Powell (2006a) and courtesy of the Chiltern Air Support
Looking NNE
Looking south
in part (b) Northgate building
(OS topography © Crown Copyright)
After Chiltern Air Support Unit BGS©NERC. All rights reserved
Figure 27. The 2005 Buncefield above ground storage incident (after Powell
2006a&b). a) aerial view of the site prior to the incident, b) the incident from the
air, c) aerial view of damage to storage vessels, d) map illustrating the proximity
of the storage depot to surrounding industrial and domestic buildings.
16

a
b
c
d
e
f
Cement
Cement fill
Well casing
wall plug Formation
rock
By permission of ©Springer Verlag BGS©NERC. All rights reserved
Figure 28. Schematic illustration of possible leakage pathways through an
abandoned well: a) between casing and cement, b) between cement plug and
casing, c) through the cement pore space due to cement degradation, d) through
well casing as a result of corrosion, e) through fractures in cement, f) between
cement and rock. (Figure from Scherer et al., 2005; reproduced from
Environmental Geology, by permission of ©Springer Verlag).
a b c After Star Energy BGS©NERC. All rights reserved
Figure 29 Humbly Grove gas storage facility (courtesy Star Energy). a) site
clearance (Feb 2004) and b and c) completed facility (Feb 2005).
17

100 km
Spandau
Dortmund Berlin
Leipzig
Frankfurt
Hamburg SEA
FRANCE
AUSTRIA
POLAND
HOLLAND
CZECH REPUBLIC
SWITZERLAND
BELGIUM
Munich LUXEMBOURG
b
e
a c
d
Line of ventings
A
SW Lt51 Lt54 Lt6 Lt7
A’
NE
0
1.0
0.5
Dept
h (k
m)
0 0.5 1 km A
A’
Lt5 Lt7
Lt8 Lt6
Lt54
Lt4
Lt1
Lt50
Lt51
700
600
500
500
600
400
400
350
350
dolomites salts
Middle (Bunter)
N
Frankenthal
(aquifer?)
Teutschental
(salt cavern)
(aquifer)
Ketzin
(aquifer)
NORTH
ITALY
Lt5 (250 m N of A-A’)
Rotliegend
High in Rotliegend
Reverse fault in Rotliegend
Teutschental
Lt101
Zechstein Zechstein
Lower (Bunter) Sandstone Sandstone Venting sites
Photographs by permission E. Schweizerbart Science Publishers BGS©NERC. All rights reserved
Figure 30. Details of the Teutschental (West Germany) site and ethylene escape
(based upon Katzkung et al., 1996). a) structure contour map on top Zechstein
halite, b) SW-NE cross section across the Lauchstädt structure and storage site
area, c) and d) photographs of venting sites, from which a mixture of ethylene
and water erupted, e) location map for UGS sites in Germany and referred to in
text. Photographs reproduced by permission of E. Schweizerbart Science
Publishers: http://www.schweizerbart.de/).
18

0 10 20 30 40 50 60 metres
1300
Metres
1350
1400
Haselgeberge salt (22% mudstone)
133/8’’ 95/8’’
to roof collapse & salt creep
Insolubles from
Volume loss due
Rocksalt washing process
After Bérest & Brouard BGS©NERC. All rights reserved
Figure 31. Detail of the Kiel storage cavern in Germany, illustrating volume loss
due to insolubles, roof collapse and salt creep (after Bérest & Brouard, 2003).
1700
1800
1900
2000
20 0 20 metres
c
Surface
Sea level
-500m
-1000m
-1500m
-2000m
-2500m
-3000m
-3500m
-4000m
SOLUTION
SOLUTION
BRINE
DISPOSAL
WELL
-4500ma
CE
OU
S
CA
INO
ZO
IC
Depth (m)
1675
1900
1800
1700
NE SW
1899 m 1902 m
1871 m
1808 m
b
June 1972
January 1970
WELL NO.2
WELL NO.1 FRESHWATER
WELL NO.1
FRESHWATER
WELL No.2
Water sands
CR
ETA
Part b
Rocksalt
CAVERN
No.1
CAVERN
No.2
CAVERN
No.3
CAVERN
No.4
Cap rock
Wilcox Sands
Top Wilcox
After Allen BGS©NERC. All rights reserved
Figure 32. Details of the Eminence salt dome and storage facility (based upon
Allen, 1972). a) cross-section of the salt dome with depth of caverns, b) detail of
the depths and shapes of the four caverns constructed at Eminence c) illustration
of the extent of salt creep and decrease in cavern size.
19

Axis of rim syncline
0 2 km
piercement
(based upon
Liberty Co.Chambers Co.
1
3
2
0
Dept
h (k
m) b
elow
GL
2000
1750
2200
2000
1750
20002100
Harris Co.
2000
2100
2100
2100
Salt
Contours (m) on top Frio Sands Halbouty, 1979)
Frio Sands
Louann Salt
Cap rock
After Halbouty BGS©NERC. All rights reserved
Figure 33. Details of the Mont Belvieu salt dome and storage facility a) structure
contour map on the top of the Frio Sands showing area of salt piercement (after
Halbouty, 1979), b) cross-section of the salt dome.
2200
2000
2200
1500
0 2 km
a
b c. 760 m
c. 1187 m
c. 427 m
1
3
2
0
Axis of rim syncline
piercement
Liberty Co.Chambers Co.
Dept
h (k
m) b
elow
GL
2200
Frio
San
ds
Louann Salt
Salt
Contours (m) on top Frio Sands (based upon Halbouty, 1979)
Cap rock
After Halbouty BGS©NERC. All rights reserved
Figure 34. Details of the Moss Bluff salt dome and storage facility a) structure
contour map on the top of the Frio Sands showing area of salt piercement (after
Halbouty, 1979), b) cross-section of the salt dome illustrating the depth of the
cavern and shape.
20

WNW ESE Gas storage
site city limits
Brine wells
explosion site
Downtown explosion
site
solution mine
cavern
Chase Group
Equus Beds aquifer
Quaternary -alluvium
G Gas-bearing layer
dolomites
PE
RM
IAN
0
150
300
Appr
oxim
ate
dept
h (m
)
1 km0
1 mile01 km0
Nickerson 22S/5W
23S/6W
22S/6W
23S/7W
22S/7W
64
Other well Explosion site
Gas leak Geyser
Hutchinson
storage site
a
Arkansas River
S-1
b
Study area
G
G
Ninnescah Shale
Old brine well
Arkansas R i v e r
Atchison Topeka and Santa Fe Railroad
Downtown explosion
site
eastern town limits
Western Hutchinson
Trailer
Salt
Salt storage Hutchinson salt
U Wellington Shale
Lr Wellington Shale
Fractured
DDV
Key: Vent well - gas Vent well - dry
Yaggy gas
Trailer park scene - eastern town limits Well S1 site
Railway line geyser -
After Hutchinson Fire Department, Kansas Geological Survey, CUDD Drilling and Shannon Pope of RPC Inc) BGS©NERC. All rights reserved
Figure 35. Details of the Hutchinson incident. (a) location map illustrating the
site of the storage facility circa 11 km (7 miles) NW of the town of Hutchinson (b)
WNW-ESE cross section showing the stratigraphy and structure of the area and
the route taken by the gas from the storage cavern to the town (after Kansas
Geological Survey). Images shown courtesy of Chief Forbes, Hutchinson Fire
Department; Kansas Geological Survey; K a n s a s D e p a r t m e n t o f H e a l t h
a n d E n v i r o n m e n t , CUDD Drilling and Shannon Pope of RPC Inc.
21

SW NE metres Rocky Mountain
Edmonton
Calgary A
BCanadian Shield
FOLD
ED
UP
PE
R C
RE
TAC
EO
US
CAMBRIAN
foothills
Edmonton
MIDDLE
PRECAMBRIAN
1500
Sea level
-1500
-2000
connecting line Emergency shutdown
valve Emergency shutdown
valve
pipelines & process
facilities Surface casing
Brine string
Master valve Master
valveponds
Casing pipe
1850 m below
surface
BRINE
ETHANE 100m
3
Cement
Beaverhill
Up
per
Contact
Cold
Emestina
Basal
Beds
Winnipegosis
Evaporite
Mid
dle
EM
SIA
N
EIF
ELI
AN
G
IVE
TIA
N
‘Gran
ite Wash’
CARBONIFEROUS LOWER CRETACEOUS
LAK
EG
RO
UP
Salt
UPPER CRETACEOUS
TERTIARY
UPPER DEVONIAN
DEVONIAN
Failure point in
WELL 103 WELL 103A
To/from To/from brine
Volume 125 000 m(total cavern volume)
Lotsberg Salt Formation
Southern Alberta-southern Saskatchewan
Lake South River
Rapids
Lake
Lake Fm Lotsberg
Salt
Red
Prairie
DE
VO
NIA
N
ELK
PO
INT
GR
OU
P
Low
er
Low
er
BE
AV
ER
HIL
L
Peac
e R
iver
Arc
h
After EUB BGS©NERC. All rights reserved
Figure 36. Setting of the Fort Saskatchewan cavern storage facility, Canada. a)
sketch cross section of the area, b) cross section of the cavern an infra-structure
(after EUB, 2002).
Pliestocene sand & clay
Pliocene sand & clay
Cavern
Underlying Miocene shale
0
300
600
900
1200
1500
Dept
h be
low
gro
und
leve
l (m
)
NW SE
‘Sump’
Texas Brine
(well)
Freshwater sands, clay & coal
Lafayette Gravel
Caprock
‘Goliad’ Sand & Gravel
Salt
After Neal & Magorian BGS©NERC. All rights reserved
Figure 37. Sketch section through the Napoleanville salt dome illustrating the
situation when shale layers were encountered indicating that due to poor site
characterisation, the sidewalls of the salt dome/stock had been intersected during
brining operations (after Neal & Magorian, 1997).
22

LE
R
LE
R Approximate depth above sea level (m)
1800
CA
INO
ZO
IC
PE
RM
IAN
1200
600
B
A
B
A
Thaynes Sst
KNIGHT
TWIN CREEK
NUGGET
OY
#3
OY
#4
JUR
AS
SIC
T
RIA
SS
IC
Surface gas leakage site
Shallow gas collection zone
1975-1981 leakage route
1973 leakage route
reservoir
THAYNES FORMATION
WOODSIDE
DUNWOODY
After Araktingi et al BGS©NERC. All rights reserved
Figure 38. Stratigraphy, cross-section and leakage paths from the Leroy Gas
Storage Facility, Wyoming (after Araktingi et al., 1984).
Met
han
e
60
40
20
0
Propane, Butane (ppm)
78760
600
400
200
0
Met
hane
(ppm
)
5320 11758
Coalville Gas Chalk Creek Gas Storage Structure Storage Structure
300
600 900
1200 1500
1800
2100
sea level
W E
KfuKfc
Kfu?
Ka
Kk
Kk
Kk
Kfc
Kk?
KfuKfu
Kfc
Kfc
Kk
Kfu
Coal
ville
diapir Gas storage
Chal
k Cr
eek
Storage well Storage well
Klw
Kfsc
Ka Klw
KfscKfsc
TD:1128 m TD: 945 m
Heig
ht a
bove
sea
leve
l (m
)
Ka
Upper Cretaceous; Kfu Kfc Chalk Creek Mbr Kfsc Klw
Kk
ELKHORN
THRUST
Web
er R
iver
?Jurassic
horizon (Klw)
Gas storage horizon
T.D: 1174 m
Key:
Upper Frontier Fm
Spring Canyon Mbr Longwall Sandstone
Ka Aspen Shale
Lower Cretaceous; Kelvin Formation 0 3 km
After Morgan BGS©NERC. All rights reserved
Figure 39. Stratigraphy and structural detail of the Coalville and Chalk Creek
gas (aquifer) storage facilities, Utah, USA (after Morgan, 2004).
23

S N 90
70
50
30
10
300
200
100
Met
hane
(ppm
)
Etha
ne &
Pro
pane
(ppb
) Methane
Ethane
Propane
WELL WELL WELL WELL
700
900
800
1000
1100
Dept
h be
low
sea
leve
l (m
) Capay
CA
IN.
0 550 m275Storage reservoir
T.D. 1074 m
T.D. 914 m
T.D. 871 m T.D. 893 m
Top Cretaceous (unconformity)
CR
ETA
CE
OU
S
After Jones & Drozd BGS©NERC. All rights reserved
Figure 40. Cross-section of the Pleasant Creek gas (aquifer) storage facility in
California (after Jones & Drozd, 1983). Also shown the soil-gas profiles showing
leakage of the aquifer caprock.
Syst
em
Serie
s Group
GALENA
ANCELL
PRARIE DU CHIEN
CA
MB
RIA
N
CIN
CIN
N-
CH
AM
PLA
INIA
N
FRANCONIAN
MT SIMON
Member
Member
Member
EMINENCE
CA
NA
DIA
NC
RO
IXA
N
NEW RICHMOND
BRAINARD
SCALES
WISE LAKE -DUNLEITH
GUTTENBURG
MIFFLIN
Leaf River
Brookville
Herscher
Crescent City
Manlove
Sciota
Pontiac
CHICAGO
0 40 km
Illinois
Formation
MAQUOKETA
PLATTEVILLE
OR
DO
VIC
IAN
AT
IAN
Elmhurst
EA
U C
LAIR
E
GALESVILLE
IRONTON
Lombard
Proviso
POLOSI
ST PETER SST
GLENWOOD
ONEOTA
GUNTER
SHAKOPEE
NEDA
FT. ATKINSON
NACHUSA GRAND DETOUR
PECATONICA
Troy Grove
Waverley
Lake Michigan
After Collinson et al, Kolata & Wilson BGS©NERC. All rights reserved
Figure 41. Stratigraphy of Illinois aquifer sandstones and location of the main
gas storage sites having experienced difficulties, see Appendix 5 (after Collinson
et al., 1988; Kolata & Wilson, 1991).
24

150
150
100
100
100
50
75
75
50
75
75
25
2530
12 15
18
18
25
18
5030
0 300 m150
Sinkhole No.1
Sinkhole No.2
mine workings
below mean sea level
N
Weeks Island Dome
seen May 1992
seen Feb 1995
Approximate extent of
Top of salt in metres
After Warren BGS©NERC. All rights reserved
Figure 42. Structural contour map of the Weeks Island salt dome, Louisiana,
illustrating the sites of the two sink holes in relation to the extent of salt mine
workings (after Warren, 2006).
TRIASSIC, JURASSIC and WE RETACEOUS
Main Coal Seam
‘
‘B’ seam
Shales & sandstones
Surface Gravels
metres (above mean
sea level)Feet
5800
5600
5400
5200
4800
Surface workings
1750
1700
1650
1600
1550
1500
1450
5000
(marginal marine)
PRECAMBRIAN (igneous and metamorphic)
a
b
Front Range
Dakota Hogback
Denver
W E
GOLDEN FAULT
LO R C
A’ seam
SHAFT No.3
Air shaft
SHAFT No.2
SHAFT No.1
Part B
PALAEOZOIC
UPPER CRETACEOUS (marine)
UPPER CRETACEOUS
TERTIARY and UPPER CRETACEOUS (continental)
COAL BEDS (LARAMIE FORMATION)
After Raven Ridge Resources BGS©NERC. All rights reserved
Figure 43. Detail of the Leyden Mine gas storage site, Colorado (after Raven
Ridge Resources, 1998).
25

Santa Anna
Potrero
NEWPORT - INGLEW
OOD FAULT ZONEPALOS VERDES
NORTHERN SHELF
SHELF
SHELF
WHITTIER FAULT
RAYMOND FAULT
Oilfield
8 km0
BB
WB Hfwy
Pfwy
AS
Hfwy
AS BB 3rd WB Hfwy Pfwy 118°00’
118°30’ 33°45’
34°00’
3rd
El Segundo
CENTRAL TROUGH
Santa Monica
N
SANTA MONICA FAULT
CH
AR
NO
CK
FAU
LT
cb
a
Old well casing
Gas bubbles
SAN FERNANDO VALLEY
SAN GABRIEL VALLEY
WESTERN
SANTA ANNA
Playa del
Rey
Venice
Beach
Inglewood
Montebello
Whittier
Los Angeles City
Salt Lake
Fault
Sth Salt Lake
See Fig. 23b
Alvarado Street Beverly Boulevard Third Street Wilshire Boulevard Hollywood Freeway Pasadena Freeway
Refer Fig. 23b
Playa del Rey oilfield - old wells Playa Vista - old well (2004)
After Seaver Center for Western History Research, Los Angeles County Museum of Natural History Save Ballona Wetlands, Camp Dresser & McKee, Wright and Biddle BGS©NERC. All rights reserved
Figure 44. Map of the oilfields and main tectonic features in the Los Angeles Basin. a)
Oilfields based upon Camp Dresser & McKee (2001) and Wright (1991), faults based
upon Wright (1991) and Biddle (1991), b) oil derricks along the ocean front at Playa del
Rey (after Seaver Center for Western History Research, Los Angeles County Museum
of Natural History), c) gas bubbles emerging from old oil well in lagoon at Playa Vista,
Playa del Rey oilfield (courtesy Jeanette Vosberg, Save Ballona Wetlands - see
http://saveballona.org/techpages/well.html).
26

a
Castaic
Hills
X
Y
5
126
San Gabriel Mountains
Santa Susana Mountains
Saugus
San Fernando
Los
Ange
les
Co.
San Fernando
Oilfields
PICOANTICLINE
1.6 km0
210
5
N
SAN GABRIEL FAULT
14
Wayside Canyon
Tapia
Honor Rancho
Aliso Canyon
Vent
ura
Co.
Valley
Faults
Wayside Canyon b Oilfield
EOCENE
(?OLIGOCENE-MIOCENE)
(MIDDLE MIOCENE)
L. PLIOCENE)
& TICK
& OLDER
PIC
O F
M
Gas Storage Field
SA
N G
AB
RIEL FA
ULT
F-1 FAU
LT
HONOR RANCHO FAULT
1 km0
CRETACEOUS & OLDER
SEEPE FORMATION
TOPANGA FM
TOWSLEY FM (U. MIOCENE-
MINT CANYON FORMATION
VASQUEZ
FORMATION
CASTAIC FORMATION
CRETACEOUS
Wayside Sand 13
SAUGUS FORMATION
(QUATERNARY)
Honor Rancho
(old SE Area Pool)
SAUGUS FM
MODELO FM
OD
1
2
3
Depth below OD (km
)
After Davis & Namson BGS©NERC. All rights reserved
Figure 45. Castaic and Honor Rancho gas storage facilities. a) Location map, b)
cross section of the Honor Rancho Oilfield (after Davis & Namson, 2004).
27

well at 2255 m
5 ½” casing
Milled slot at
Successful
at 730 m
7” casing
Successful
Initial
& re-entry
2470 m
1335 m
1250 m
a b
c d
7” casing
Shale
Casing crushed at sand-shale boundary
7” casing
Shale
well
well
(Not to scale)
Initial sidetrack
Reservoir at 3100 m
3021- 3027 m
sidetracked well
sidetracked well
sidetracked
attempt
Reservoir at
Sand Sand
Re-entry sidetracked
1st sidetracked
After Vector Magnetics BGS©NERC. All rights reserved
Figure 46. Sketch diagrams showing problems with and the repair of gas storage
wells in California (after Vector Magnetics: http://www.vectormagnetics.com/
Case_HistoryO&G.html). a) and b) damage following an earthquake, c)
inadvertent sidetracking of a well, d) inadvertent sidetrack due to corroded
casing.
28

SALTFLEETBY SCENARIO
PERMIAN
NAMURIAN
MERCIA
GROUP
GROUP
LINCOLNSHIRE LIMESTONE
Top SSG
Top reservoir
Top DINANTIAN
Top BROTHERTON (UPPER MAGNESIAN LIMESTONE)
WESTPHALIAN + VARIABLE
MUDSTONE
SHERWOOD SANDSTONE
JURASSIC
LIAS
TRIASSIC
CHALK + LOWER CRETACEOUS
BGS©NERC. All rights reserved
Figure 47. Sketch section illustrating the geological conditions likely to represent
the ‘Saltfleetby scenario’ (based upon Hodge, 2003).
W WELTON OILFIELD SCENARIO E
PERMIAN
TOP BROTHERTON FORMATION (UPPER MAGNESIAN) LIMESTONE)
TOP WESTPHALIAN COAL MEASURES
TOP DINANTIAN LIMESTONE
JURASSIC
MERCIA MUDSTONE GROUP + PENARTH GROUP
BASAL SANDS
TRIASSIC
SHERWOOD SANDSTONE GROUP
Based upon Rothweel &Quin BGS©NERC. All rights reserved
Figure 48. Sketch section illustrating the geological conditions likely to represent
the ‘Welton scenario’ (based upon Rothwell & Quinn, 1987).
29

GAINSBOROUGH - BECKINGHAM SCENARIO
NS TRIASSIC PERMIAN BECKINGHAM GAINSBOROUGH
0
0
NAMURIAN
c. 480-550 m
NAMURIAN
> 70 m
UPPER NAMURIAN
PERMIAN 225-250 m
c. 640-675 m
PRE-CARBONIFEROUS
PRE-CARBONIFEROUS
CARBONIFEROUS THIN NAMURIAN
1 km
5 km
NAMURIAN AND WESTPHALIAN
DINANTIAN
TRIASSIC
SANDSTONES SANDSTONES
COAL MEASURES (WESTPHALIAN)
DINANTIAN
BASEMENT
BASEMENT
WESTPHALIAN AND
0
1
2
3
4
5
6
7 km
NW GAINSBOROUGH SE
Ground level
Based upon Brunstrom, Fraser & Gawthorpe BGS©NERC. All rights reserved
Figure 49. Sketch section illustrating the geological conditions likely to represent
the ‘Gainsborough-Beckingham scenario’ (based upon Brunstrom, 1963; Fraser
& Gawthorpe, 1990, 2003).
S NCaythorpe
Chalk
Speeton Clay
Kimmeridge Clay
Mercia Mudstone Group
Group
PERMIAN AND CARBONIFEROUS
0 Horizontal scale
OD
Depth (km)
1
2
Group
CRETACEOUS
JURASSIC
and Amptill Clay
Sherwood Sandstone
Top Corallian Beds-Top Lias
TRIASSIC
1 km Lias and Penarth
Based upon Kirby & Swallow BGS©NERC. All rights reserved
Figure 50. Sketch section illustrating the geological conditions likely to represent
the ‘NE England scenarios’ (e.g. Caythorpe and Kirby Misperton gasfields –
based upon Kirby & Swallow, 1987).
30

WEALD BASIN SCENARIO
TERTIARY
OD
1
2
3 km
NS
HORNDEAN
SETTING
CORALLIAN BEDS
PG and MMG
WEALDEN BEDS
WEALDEN BEDS
GOG IO
10 km
TOP CORNBRASH
TOP IO
BSMT
~
UPPER
MIDDLE
PALMERS WOOD
BROCKHAM
HUMBLY GROVE
STOCKBRIDGE
ALBURY
GOODWORTH
TERTIARY
STORRINGTON
SINGLETON
BAXTERS COPSE
STRUCTURAL
PURBECK LST
KIMMERIDGE CLAY
CORALLIAN LST
KIMMERIDGE CLAY
OXFORD CLAY OXFORD CLAY
LIAS (CLAYS)
UPPER CRETACEOUS CHALK
BRIDPORT SANDS
BASE GAULT
LIAS
LOWER PALAEOZOIC
- Bs CRETACEOUS
JURASSIC
JURASSIC
LOWER JURASSIC
Based upon Hancock & Mithern BGS©NERC. All rights reserved
Figure 51. Sketch section illustrating the geological conditions likely to represent
the ‘Weald Basin scenarios’ (e.g. Humbly Grove and Storrington – based upon
Hancock & Mithern, 1987).
31

Age
Lithostratigraphy Main rock type
Strength/Av. Porosity(%)
Approx. thickness (m)
Chalk Chalky
limestone Moderately weak/
10 183-213
Upper Greensand Sand ~30
Gault Clay Claystone Weak rock 30-50 ~76
Lower Greensand Ferruginous sst Weak rock 75-92
Wealden Sandstones
and claystones
Moderately weak 192-232
Purbeck Siltstones, claystones, limestones
Weak rock 139-156
Portland Sst & siltst 52-62
Upp
er J
uras
sic
Kimmeridge Clay Lsts,claystones siltstones Weak rock/
35 172-188
Corallian Ssts, marls claystones & silts 66-73
Oxford Clay Organic rich clays & silts
Weak rock/30 101-109
Kellaways Beds Fine sands & clays Very weak rock/30 10-11
Mid
dle Cornbrash
Forest Marble & Gt Oolite Lst Limestones & ssts Weak to strong/ 9.6-16
60-70
Jur
Fuller’s Earth Claystone, siltst Very weak 17 Inferior Oolite Lst, clayst, siltst Weak 30 Upper Lias Claystone Weak 55 Middle Lias Siltst, fine sst Weak/35 50
Low
erJu
rass
ic
Lower Lias Organic rich claystones Weak ~100
Rhaetic Penarth Group Rhaetic Lst, sst Moderately strong ~10
Carb. Carboniferous Limestone Limestone >10
BGS©NERC. All rights reserved
Figure 52. Generalised stratigraphy for the Humbly Grove and northern Weald
area. Abbreviations: Lst –limestone; Sst – sandstone; Siltst - siltstone.
32

NW ENGLAND PERMO-TRIASSIC SCENARIO
Elswick
SSG
MM
CS
CS
CS
NAMURIAN
NAMURIAN
NAMURIAN
SSG MMMERCIA MUDSTONE GROUP
SHERWOOD SANDSTONE GROUP
MANCHESTER MARLS
COLLYHURST SANDSTONE DINANTIAN
DINANTIAN
LOWER PALAEOZOIC LOWER PALAEOZOIC
BGS©NERC. All rights reserved
Figure 53. Sketch section illustrating the geological conditions likely to represent
the ‘NW England (Elswick) scenario’ (based upon Aitkenhead et al., 1992).
BYLEY SCENARIO
18 - 20 km
2 - 2.5 kms 4.5 - 7.5 km
KING STREET Depth to bs WRH WEM - RED
GROUP
SSG
MERCIA
GROUP
MMG MMG
MMG
Halite
?
c. 600 - 650 m c. 450 m
c. 290 m
84 m
CARBONIFEROUS
~ - faulted out DRIFT
Summary: Depth to top caverns Nos. caverns 8
280 m
min. pressure 38 bar max. pressure max cavern diameter 85 m cavern height
SHERWOOD SANDSTONE
MUDSTONE
30 Foot Marl
Northwich Halite
Northwich
FAULT c. 60-155 m Nearest WRH 1.5 kms to N
ROCK FAULT Northwich Halite
c. 600-650
Well spacing Total volume 4.5 Mcm (160 mscf)
105 bar
c. 100 m
BGS©NERC. All rights reserved
Figure 54. Sketch section illustrating the geological conditions likely to represent
the ‘Cheshire Basin scenario’ – relating to the Byley, Hole House, King Street
and Stublach sites.
33

Dep
th(m
bgl
)
Stratigraphy Byley Hole House
h-Byley Mudstone
h Halite
ME
RC
IA M
UD
S
Bollin Mudstone
100
200
300
400
500
600
700 Halite
Mudstone
Wyc
Northwic
TON
E G
RO
UP
QUATERNARY
Top Bed (Top Rock)
Thirty Foot Marl (Middle Marl) Bottom Bed Bottom Rock, Hundred Foot or Main Salt
BGS©NERC. All rights reserved
Figure 55. Sketch section illustrating the geological conditions likely to represent
the ‘Byley and Hole House scenarios’.
34

2 SCENARIOS FOR PREESALL FAULT ZONE: -
SSG
SSG
SSG
GROUP
GROUP
SSG
SSG
SSG
PERMIAN
PERMIAN
PERMIAN
CARBONIFEROUS
CARBONIFEROUS
PERMIAN
MMG
MMG
MMG
MMG
MMG
MERCIA
GROUP
MERCIA
GROUP
MMGMMG
MMG
MMG
PH
Preesall Halite
PreesallHalite
(+ thin mdsts)
DRIFT
DRIFT
DRIFT
WRH
Depth to top caverns c. 220-425m No. caverns ?20
Minimum pressure 25 bar Maximum pressure 75 bar Maximum cavern diameter Cavern heights 55-290m
BOUNDING
BOUNDING
200-500m
100-125m
c. 240m
c. 360m
289-?500m
c. 500
Mining
0.5-
0.75
km� 1.
5 km
<0.5
km
50-75m below base
of drift c. 100-250m
c. 100-125m 1
2
c. 400-500 m
c. 2.2 - 2.5 kms
c. 2.5 kms
c. 250m
- 140 to >289m~
A Mid-southern areas
B
1
2
SHERWOOD SANDSTONE
SHERWOOD SANDSTONE
MUDSTONE
MUDSTONE
Preesall Halite
Well/cavern spacing 150m Total volume 1200 Mcm
c. 100m
FAULT
FAULT
Preesall Fault Zone
Solution mining
Wet Rockhead (WRH)
SSG @ subcrop to drift in Footwall Block (northern reaches) MMG @ subcrop to drift in Footwall Block (southern reaches)
of Preesall Saltfield
Northern areas of Preesall Saltfield
BGS©NERC. All rights reserved
Figure 56. Sketch section illustrating the geological conditions likely to represent
the ‘Preesall saltfield scenario’. a) the southern areas of the saltfield (more
intragrabenal faults), b) the northern areas of the saltfield (fewer intragrabenal
faults).
35

PORTLAND SCENARIO
S N
Top Main Halite
Top IO
Top PENARTH GROUP
TRIASSICGas storagecaverns
SHERWOOD SANDS
Top CB
AbRF
SE Isle of Portland NW
2300
2400
2500
0
2600
2200
Depth below
G.L. (m)
Top CORNBRASH
Top INFERIOR OOLITE
GROUPTop PENARTH Top PG
Base MMG
Top Main Halite
Base MMG
SSG
SSG
SSG
Upper
Beds
Beds
Depth top caverns No. of caverns
Main ‘S7’
halite
Gas
20 m 2385 m
2480 m
80 m
20 m
90 m
Brine
Sump
CORALLIAN
TopCORNBRASH(CB)
Top
Salt
Salt
Top PG
Top CORALLIAN
TONE GROUP
1 km
Top CORALLIAN CRETACEOUS
Saliferous
Lower Saliferous
c. 2400 m 14-18
2400 m 15 m
SpacingWidthHeightRoof thickness Minimum pressure Maximum pressure Total area Cavern volume
Not known90 m100 m35 m130 bar350 bar�20 km270.8 Mcm (2bcf) each
After Egdon Resources Ltd and Chadwick & Evans BGS©NERC. All rights reserved
Figure 57. General setting of the Dorset Halite in the region of the proposed salt
cavern storage facility beneath the Weymouth-Isle of Portland area. a) Line
illustration of the thickening of the (Dorset) halite of the Wessex Basin in the
Weymouth Anticline, based upon depth converted seismic reflection data
(Chadwick & Evans, 2005), b) sketch of the level of proposed gas storage caverns
and layout (after Egdon, 2006a).
36
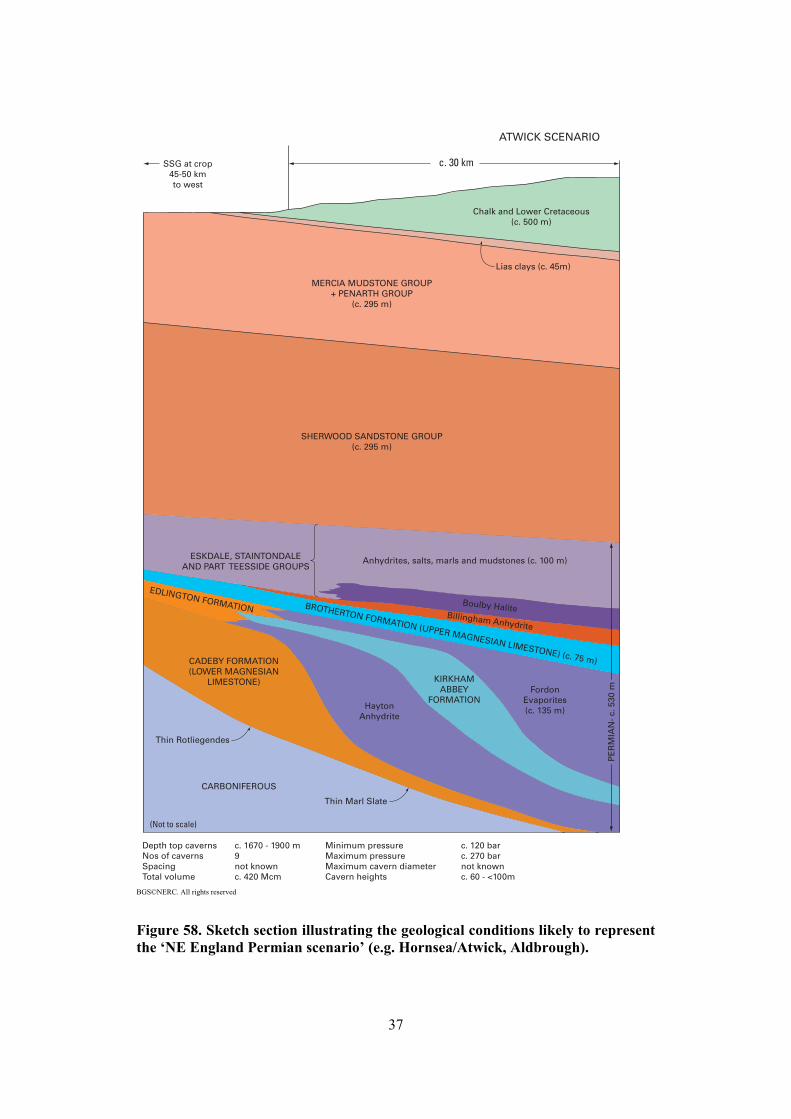
ATWICK SCENARIO
SSG at crop 45-50 km to west
(Not to scale)
Lias clays (c. 45m)
Thin Marl Slate
Hayton Evaporites
(c. 295 m)
(c. 295 m)
PE
RM
IAN
- c.
530
m KIRKHAM
CARBONIFEROUS
Boulby HaliteBillingham Anhydrite
BROTHERTON FORMATION (UPPER MAGNESIAN LIMESTONE) (c. 75 m)
EDLINGTON FORMATION
c. 30 km
Chalk and Lower Cretaceous (c. 500 m)
Thin Rotliegendes
Anhydrite
Fordon
(c. 135 m)
MERCIA MUDSTONE GROUP + PENARTH GROUP
SHERWOOD SANDSTONE GROUP
CADEBY FORMATION (LOWER MAGNESIAN
LIMESTONE)
ESKDALE, STAINTONDALE AND PART TEESSIDE GROUPS
ABBEY FORMATION
Anhydrites, salts, marls and mudstones (c. 100 m)
Depth top caverns c. 1670 - 1900 m Minimum pressure c. 120 bar Nos of caverns 9 Maximum pressure c. 270 bar Spacing not known Maximum cavern diameter not known Total volume c. 420 Mcm Cavern heights c. 60 - <100m
BGS©NERC. All rights reserved
Figure 58. Sketch section illustrating the geological conditions likely to represent
the ‘NE England Permian scenario’ (e.g. Hornsea/Atwick, Aldbrough).
37

1
Tables
Table 1 (following page). Summary of operational and planned underground gas
storage facilities in Britain. Note: information regarding the caverns operational
in the Teesside area and the product stored has been in part supplied by SABIC,
whose assistance is gratefully acknowledged. This represents our most up to date
information on the various caverns and stored products. However, more detail
might become available with time.
Note Table 2: DTI (2006a&b) figures, 2 Note Table 2: DTI (2006a&b) figure
38

aerA
eti
Sr
otare
po/re
nw
O
Sto
rag
e
cap
aci
ty
(Mcm
)
Nu
mb
er o
f
caver
ns
(Ch
alk
& s
alt
sto
rag
e)
Ap
pro
x.
dep
th
of
sto
rag
e (t
op
-
bo
tto
m i
f k
now
n
-m
)
Co
mm
ents
Op
era
tio
na
l fa
cili
ties
– d
eple
ted
oil
an
d g
asf
ield
s
Rou
gh (
offs
hore
) S
outh
ern
Nor
th S
ea
Cen
tric
a 2,
832
N/A
c.
274
3 O
pera
tion
al s
ince
198
5
Eas
t Mid
land
s H
atfi
eld
Moo
rs
Edi
nbur
gh O
il &
Gas
12
2 N
/A
c. 4
27
Ope
rati
onal
sin
ce 2
000
Wes
sex-
Wea
ld
Bas
in
Hum
bly
Gro
ve
Sta
r E
nerg
y 28
0 N
/A
c. 9
82
Ope
rati
onal
sin
ce 2
005
Pla
nn
ed f
aci
liti
es –
dep
lete
d o
il a
nd
ga
sfie
lds
Eas
t Mid
land
s W
elto
n S
tar
Ene
rgy
435
N/A
c.
136
0 P
lann
ing
appl
icat
ion
refu
sed,
like
ly P
ubli
c In
quir
y. C
omm
issi
on 2
008?
E
ast M
idla
nds
Sal
tfle
etby
W
inga
s U
K L
td
600
N/A
c.
223
4 P
lann
ing
appl
icat
ion
subm
itte
d Ja
nuar
y 20
05. C
omm
issi
on 2
009?
E
ast M
idla
nds
Hat
fiel
d W
est
Edi
nbur
gh O
il &
Gas
N
ot k
now
n N
/A
c. 3
96
Pla
nned
-fe
asib
ilit
y st
udie
s 20
04-2
005
Eas
t Mid
land
s G
ains
boro
ugh
Sta
r E
nerg
y 22
7-24
0 N
/A
c. 1
375
Pre
-pla
nnin
g st
age
Eas
t Yor
kshi
re
Cay
thor
pe
War
wic
k E
nerg
y L
td
Up
to 2
10
N/A
c.
182
9 P
lann
ing
cons
ent r
efus
ed 2
2 Ju
ne 2
006.
Pub
lic
Inqu
iry
due
to s
tart
24
Apr
il 2
007.
Wes
sex-
Wea
ld
Bas
in
Alb
ury
– ph
ase
1 S
tar
Ene
rgy
160
N/A
c.
625
P
re-p
lann
ing
stag
e, c
omm
issi
on 2
007/
08?
Wes
sex-
Wea
ld
Bas
in
Alb
ury
– ph
ase
1 S
tar
Ene
rgy
Up
to 7
15
N/A
di
tto
Pre
-pla
nnin
g st
age,
com
mis
sion
201
0?
Wes
sex-
Wea
ld
Bas
in
Ble
tchi
ngle
y S
tar
Ene
rgy
Up
to 9
00
N/A
c.
930
-114
3 P
re-p
lann
ing
stag
e, c
omm
issi
on 2
009?
Wes
sex-
Wea
ld
Bas
in
Sto
rrin
gton
S
tar
Ene
rgy
Not
kno
wn
N/A
c.
115
2 P
re-p
lann
ing
stag
e –
appl
icat
ion
like
ly a
fter
fea
sibi
lity
stu
dies
.
Op
era
tio
na
l fa
cili
ties
– C
ha
lk c
ave
rns
Nor
th L
inco
lnsh
ire
Kil
ling
holm
e C
onoc
oPhi
llip
s an
d C
alor
Gas
0.1
(liq
uid §
60,0
00 to
nnes
of
LP
G)
2 18
0-?2
10
Tw
o m
ined
cav
erns
in C
halk
c. 1
80 m
bel
ow g
roun
d le
vel,
oper
atio
nal s
ince
198
5
Op
era
tio
na
l fa
cili
ties
– s
alt
ca
vern
s
Che
shir
e B
asin
H
olfo
rd H
-165
In
eosC
hlor
(fo
rmer
ly
oper
ated
by
NG
(T
rans
co),
now
Ine
os
0.17
5 1
350-
420
Pla
nnin
g ap
prov
al g
rant
ed 1
983.
Ten
yea
r in
spec
tion
com
plet
ed 2
006.
One
of
num
ber
of
aban
done
d br
ine
cavi
ties
wit
h et
hyle
ne &
nat
ural
gas
sto
rage
sin
ce 1
984.
Che
shir
e B
asin
H
ole
Hou
se F
arm
(W
arm
ingh
am B
rine
fiel
d)
Ene
rgy
Mer
chan
t (E
DF
T
radi
ng)
75
4 30
0-40
0 P
lann
ing
appr
oval
gra
nted
199
5. 4
cav
erns
, ope
rati
on s
tart
ed in
Feb
ruar
y 20
01
Eas
t Yor
kshi
re
Hor
nsea
/Atw
ick
Sco
ttis
h &
Sou
ther
n E
nerg
y 32
5 9
c. 1
720-
1820
P
lann
ing
gran
ted
1973
, ope
rati
ng s
ince
197
9. 9
cav
erns
pla
nned
.
Tee
ssid
e S
alth
olm
e S
AB
IC (f
orm
erly
Ineo
sChl
or//
Hun
tsm
an)
Up
to 0
.12-
0.2
18 (
plus
9re
dund
ant)
35
0-39
0
Dev
elop
men
t in
1950
s, s
tora
ge s
tart
ed 1
965-
1982
. 18
ex I
CI
cave
rns
in o
pera
tion
. 1 ‘
dry’
ca
vity
sto
ring
nit
roge
n; 1
7 ‘w
et’
stor
age
cavi
ties
con
tain
ing
hydr
ocar
bons
ran
ging
fro
m
Hyd
roge
n to
Cru
de O
il; 9
red
unda
nt s
tora
ge c
avit
ies;
75
redu
ndan
t bri
ne w
ells
/cav
itie
s ne
ver
used
for
sto
rage
; 5 in
ser
vice
bri
ne w
ells
.
Tee
ssid
e S
alth
olm
e In
eosC
hlor
/Nor
ther
n G
as N
etw
orks
0.
08
4 34
0-37
0 4
ex I
CI
natu
ral g
as c
avit
ies.
Dev
elop
men
t sta
rted
195
9-19
83, s
tora
ge s
tart
ed 1
959-
1983
. N
ow o
wne
d by
Ine
osC
hlor
& o
pera
ted
by N
orth
ern
Gas
Net
wor
ks f
or n
atur
al g
as.
Tee
ssid
e W
ilto
n S
AB
IC (f
orm
erly
Ineo
sChl
or/H
unts
man
) U
p to
0.0
4 5
(plu
s 3
redu
ndan
t)
650-
680
Sto
rage
sta
rted
fro
m 1
959
to 1
983.
8 c
aver
ns le
ache
d, 5
ope
rati
onal
cav
itie
s in
tota
l lea
ched
fo
r st
orag
e pu
rpos
es: 4
cav
itie
s st
orin
g E
thyl
ene,
1 c
avit
y st
orin
g M
ixed
C4’
s. 3
cav
itie
s re
dund
ant o
r ne
ver
in s
ervi
ce f
or s
tora
ge
edisseeT
notl iW
CO
B/proCb
meS
nwonkto
N2
086-05 6)negorti
NC
OB
rof(negortin
gnirots&lanoitarepo
-seitivac
ICI
xe2
Pla
nn
ed f
aci
liti
es –
sa
lt c
ave
rns
Che
shir
e B
asin
B
yley
/Hol
ford
(so
uthe
rn e
nd
of H
olfo
rd B
rine
fiel
d -
Dra
kelo
w L
ane
area
)
Sch
eme
init
iate
d by
S
cott
ish
Pow
er, s
old
to
E.O
n U
K p
lc
160-
170
8 63
0-73
0 S
ecre
tary
of
Sta
te r
ever
sed
Pub
lic
Inqu
iry
deci
sion
. Und
er c
onst
ruct
ion,
com
mis
sion
200
8?
Sal
t cav
erns
to b
e le
ased
fro
m I
neos
who
ow
n th
e sa
lt &
wil
l con
stru
ct c
aver
ns
Che
shir
e B
asin
S
tubl
ach
(Hol
ford
Bri
nefi
eld
betw
een
Dra
kelo
w L
ane
and
Lac
h D
enni
s)
Ineo
s E
nter
pris
es L
td
540 1
28
55
0-56
0 P
lann
ing
appl
icat
ion
Dec
embe
r 20
05, g
rant
ed J
une
2006
, ful
ly c
onse
nted
Aug
ust 2
006.
G
over
nmen
t wil
l not
cal
l in
for
Inqu
iry.
Pro
ject
pro
gres
sing
to d
esig
n st
age,
com
mis
sion
ing
2009
?
Che
shir
e B
asin
K
ing
Str
eet (
Hol
ford
B
rine
fiel
d)
Kin
g S
tree
t Ene
rgy
(NP
L E
stat
es)
216
9 >
400
Pro
pose
d co
nstr
ucti
on o
f 9
cavi
ties
, eac
h w
ith
a vo
lum
e of
400
,000
cub
ic m
etre
s, h
oldi
ng
up to
216
Mcm
of
gas
in to
tal o
f w
hich
up
to 1
26 M
cm w
ill b
e w
orki
ng g
as
Eas
t Yor
kshi
re
Hor
nsea
– A
ldbr
ough
N &
S
Sco
ttis
h &
Sou
ther
n E
nerg
y an
d S
tato
il
420
9 18
00-1
900
Pla
nnin
g gr
ante
d 20
00, 2
sit
es o
pera
tion
al b
y Q
3 20
07?
NW
Eng
land
P
rees
all
Can
atxx
Gas
Sto
rage
L
td
c. 1
2002
20
-24
245-
510
Sig
nifi
cant
pub
lic
obje
ctio
n to
pro
posa
ls. P
ubli
c In
quir
y he
ld (
Oct
ober
05-
May
06)
, In
spec
tor’
s de
cisi
on n
ot e
xpec
ted
befo
re O
ctob
er 2
007
Eas
t Yor
kshi
re
Nor
th o
f A
ldbr
ough
E
.ON
UK
42
0 N
ot k
now
n c.
180
0 P
lann
ing
appl
icat
ion
subm
itte
d to
Eas
t Rid
ing
of Y
orks
hire
Cou
ncil
, Jan
uary
200
7. S
ubje
ct
to p
erm
issi
on, w
ork
to s
tart
late
200
7, f
irst
pha
se o
pera
tion
al 2
010,
wit
h co
mpl
etio
n 20
13.
Wes
sex-
Wea
ld
Bas
in, D
orse
t Is
le o
f P
ortl
and
Por
tlan
d G
as L
td.
(sub
sidi
ary
Egd
on
Res
ourc
es)
990
14-1
8 21
00-2
300
Pre
-pla
nnin
g st
age,
app
lica
tion
due
for
dis
cuss
ion
at C
ount
y C
ounc
il m
eeti
ng M
arch
200
7.
Lar
ne, N
Ire
land
L
arne
Lou
gh
Por
tlan
d G
as N
I L
td(s
ubsi
diar
y E
gdon
R
esou
rces
) N
ot k
now
n N
ot k
now
n 16
80
Fea
sibi
lity
stu
dy s
tage
, sei
smic
acq
uisi
tion
in O
ctob
er 2
007
39

40

Working Type and Number of UGS facilities (2005) Deliverability
Volume
Gas & Oil Salt Bcm Mcma1/dArea Aquifers Other Total 3 3Fields Caverns (109 m ) (106 m /d)
Europe 64 23 27 3 75 1,448 117
Former Soviet Union 36 13 1 110 983 50
U.S.A. 320 44 30 113.5 2,369 394
Canada 44 8 17 279 52
South America 2 0.2 22
Asia 7 2.6 14 7
Australia 5 1.0 10 5
Total 478 80 66 3 627 319.3 5,105
(%age) (76) (13) (11) (<1)
Number of incidents in
storage facilities 16 17 27 5
Number of incidents in None
storage facilities as %age 3% 21% 41% operatio-of number of facilities
nal, 2005 operational in 2005
Number of incidents in
storage facilities involving 3 2 9 5 casualties/
evacuations
Number of incidents in
storage facilities involving None 0.63% 2.5% 13.6% operatio-casualties as %age of
nal, 2005 number of facilities
operational in 2005
UGS Figures for America 1997/2005
Number of Working Volume (Bcm) - Number of facilities Working Volume (Bcm) -
facilities - 1997 1997 - 2005 2005
Gas & Oil Fields 643 3.49 023 3. 79 Aquifers 1 4 7 9.9 44 3. 11 Salt Caverns 7 2 3.3 03 9.4
lat oT 414 6. 701 493 5.31 1
Consumption and storage volumes
Total
gas Total
consu-
mption
(Bcm) -
1997
(BP,
Number
of
facilities -
1997
Working
volume
(Bcm) -
1997
%age gas
storage/
consumption
- 1997
gas
consu-
mption
(Bcm) -
2005
Number
of
facilities -
2005
Working
volume
(Bcm) -
2005
%age gas
storage/
consumption -
2005
2006)
769.3 414 107.6 14 775 446 130.5 16.8North America
341.3 75 53 15.5 427.4 117 c. 75 c. 17.6Western Europe
350.4 46 c. 80.5 c. 23 405 50 c. 110 c. 27.2Russian Federation
Not Total Europe and 936.1 138 - 1121 174 c. 187.5 16.7
available Russia-Eurasia
World Totals 2249.7 580 262.4 11.7 2749.6 627 319.3 c. 11.6
Table 2. Number of underground natural gas storage facilities, working volumes
and deliverability, both worldwide and in the USA (based upon IGU, 2003;
Favret, 2003; Plaat, 2004 & this volume; EIA, 2006).
3a Mcm = million cubic metres (as used by DTI), equalling 106 m
41

Table 3. Calculated diffusive fluxes for the McClave Field (Nelson & Simmons,
1995)
Cap rock porosity
5% 10%
Methane loss
(m3/yr)
521 2383
Methane loss
(mcf/yr) 18.4 84.1
Replacement
time (m.y.) 2.21 0.485
Table 4. Calculated methane losses for a 1737 m and a 39.6 m thick caprock
(Smith et al., 1971)
Calculated losses for fields with hypothetical gas production 1737 m thick caprock 39.6 m thick caprock
283.2 Mcm 2.83 Bcm 283.2 Mcm 2.83 Bcm
(10 bcf) (100 bcf) (10 bcf) (100 bcf)
Methane loss 2,832 21,294 124,310 934,455 (m
3/yr) (0.0028 Mcm) (0.0213 Mcm) (0.124 Mcm) (0.935 Mcm)
Methane loss
(mcf/yr) 0.100 0.752 4.39 33.0
42

Table 5. Summary of the main hydrocarbon province characteristics and
significant discoveries onshore UK.
Province Typical Typical Source(s) Trap type Examples
hydro-carbon Reservoirs
occurrence
Wessex- Oil and gas Bridport Sands, Lower Lias (clays Tilted fault Oil: Wytch Farm, Channel Great Oolite Jurassic) blocks & Kimmeridge, Basin (Jurassic), Palaeogene Humbly Grove, (including Sherwood inversion Stockbridge, the Weald Sandstone Group anticlines Wareham Basin) (Triassic) Gas: Albury East Midlands
Oil and gas Silesian sandstones & fractured Dinantian limestones (Carboniferous)
Silesian (Carboniferous) mudstones and coals
Variscan anticlines and stratigraphic traps
Oil: Eakring, Welton, Rempstone, Scampton, Gainsborough Gas: Hatfield Moors and Hatfield West, Trumfleet, Saltfleetby
Yorkshire/N E England
Gas Permian limestones (e.g.Upper Magnesian Limestones)
Silesian (Carboniferous) mudstones and coal
Mesozoic folds Malton, Marishes, Lockton, Eskdale
NW Oil and gas Sherwood Silesian Variscan Oil: Formby England Sandstone Group
(Triassic) (Carboniferous) mudstones and
anticlines, stratigraphic –
Gas: Elswick
coals superficial deposits trapping oil
Midland Oil and gas Silesian sandstones Silesian Variscan (end Oil: Dalkeith, Valley (Carboniferous) (Carboniferous) Carboniferous- Gas: Cousland Scotland mudstones and Permian)
coals anticlines
Table 6. Tolerance of microbes to extreme environments (West & McKinley,
2001).
Condition Example of organism Limit of growth
High temperature ‘Black smoker’ bacteria Reported to 1130C. Low temperature Sporotrichum carnis -200C High pH Nitrifying bacteria 12 Low pH Thiobacillus ferrooxidans 0 High salinity Halobacterium halobium 50% salt by weight Low salinity Salmonella oranienburg 70ppb dissolved salts High pressure Desulfovibrio desulfuricans 180MPa Radiation Deinococcus radiodurans Single dose 5000 Gy Chemical toxins e.g. PbCl2 Aspergillus niger 67 mg ml-1
43

Depleted oil/g a sfields
Aquifer Salt Cavern Abandoned mine Total
Storage Type
Ma
in p
roce
sses
att
rib
ute
d t
o l
eak
/fa
ilu
re m
ech
an
ism
/ab
an
do
nm
ent
of
faci
lity
w l le / nisac g or p elb ms/ eru l iaf
above g round infrastructure -valve/pipes/wellhead/compressor
failed pressure test – facility n ever commissioned
design/construction failure – facility neve r commissioned
dani oisur tni tnet rev n
d ni ru g r iaper / ni tset g/m ecnanet nia
O erusserprev qa ref iu /o ni l l i fr ev g nrevac
m oi targi n orf m ni j oi tce n of tni rpt o
pac kcor – n to thgi t sag
pac kcor - det luaf
t las peerc
nrevac oc mmu oi tacin n
m eni t fahs
w da ehkcor te / nis hk selo
sies m ci yt ivi tca
ot o ol lahs w y t i l icaf , naba do den
ssol fo w daehl le erusserp
n to reted m deni
5 4 11 02
3 1 7 11
1 1
3 3
1 1 2
2 2 1 5
1 2 3
5 5
9 2 11
2 4 6
3 3
1 1
1 1
1 1 2
1 1
1 1
1 1
1 2 3
tcudorp dei f icepsnU 2 2
sag nwot /sag larutaN 61 71 8 )senimlaoc( 2 34
GPL/enaporP 8 ’nrevac deni lnu‘ 1, ) ?enimlaoc( 1 01
enahtE 1 1
enely htE 3 3
enatuB 1 1
l io edur C 1 )enimt las( 1 2
1C
m181
T
7m51oL
22K
33M
9’1m1331CgmAR
321
6231ymG
1m1mB
11mD
11KU
Fire/explosion associated with the incidents 14
Total number of incidents 5
21 11 ainrof i la
01 )?enilaoc( s ioni l l I
01 01 sa xe
)enit las( 1 anaisiu
sasna
ippississi
nrevac deni lnu‘ , ) ?enilaoc( )a dananidulcni ( aci refo tse
ecnarF
nare
)enilaoc( uigle
kraneInci
den
ts b
y co
un
try/
US
sta
te
51 01
56 72 71 61
Number of incidents involving casualties/evacuees (%age of 3 ( §19%) 2 ( §12%) 9 ( §33%) None operational, 2005
incidents)
Total number of incidents as a %age of facility numbers in 2005 §3% (478) §21% (80) 41% (66) None operational, 2005(facility numbers – Table 1)
8mA-D 1WR-
9
3mA-j92WR-
c. 62
mA-E WR-
c. 6700
Hum
i m
pact
aci re daedl ro fo tse
84 aci r ederunI dl rofo tse
0116 25 .c ac i redetaucav005 13 dl rofo tse
a n
T daed lato 0 1 8 0 9
T derujni lato 5 9 84 0 .c 26
Total evacuated (excluding village of 38 > 005 .c 0116 0 .c > 0076
Knoblauch, Germany – numbers not found)
Table 7. Summary of main processes leading to leakage from and failure of
underground hydrocarbon storage facilities.
44

Dep
lete
d O
il/G
asf
ield
Sto
rag
e
Fa
cili
ty
Op
era
tor
Pro
du
ct
Da
te
Des
crip
tio
n o
f ev
en
t/fa
tali
ties
/in
juri
es
Rep
ot
nem
mo
c/esu
acdetr
)s(ecnerefer
nia
M
Inci
den
ts i
nvo
lvin
g c
asu
alt
ies/
larg
e ev
acu
ati
on
s
For
t Mor
gan,
C
olor
ado,
US
A
Col
orad
oIn
ters
tate
G
as C
o.
Gas
O
ctob
er20
06
Gas
leak
, hal
ting
sto
rage
ope
rati
ons.
13
fam
ilie
s ev
acua
ted
(c. 5
2)
Wel
l lea
k –
com
plet
ion
fail
ed
Sta
te o
f C
olor
ado
(200
6);
(htt
p://
tont
o.ei
a.do
e.go
v/oo
g/in
fo/n
gw/n
gupd
ate.
asp)
.
Rou
gh F
ield
, S
outh
ern
Nor
th S
ea,
UK
sec
tor
Cen
tric
a G
as
Feb
200
6 E
xplo
sion
and
fir
e, 2
inju
red,
31
airl
ifte
d fr
om
plat
form
C
atas
trop
hic
fail
ure
of a
coo
ler
unit
in o
ne o
f th
e fo
ur g
lyco
l de
hydr
atio
n un
its,
lead
ing
to e
xplo
sion
in v
icin
ity
Cen
tric
a (2
006)
Sou
ther
n Il
lino
is,
US
A
Not
ava
ilab
le
Gas
F
eb 7
th
1997
E
xplo
sion
& f
ire.
3 e
mpl
oyee
s in
jure
d In
adve
rten
t str
ike
of g
as f
rom
UG
S r
eser
voir
dur
ing
dril
ling
of
oil w
ell
Fin
dlaw
(20
02)
Ca
sua
lty
To
tals
5
in
jure
d/c
. 8
3 e
vacu
ate
d
Inci
den
ts w
her
e n
o c
asu
alt
ies
invo
lved
bu
t fi
na
nci
al
or
pro
per
ty l
oss
or
clo
sure
occ
urr
ed
Bre
itbr
unn/
Egg
stat
t G
asfi
eld
in B
avar
ia,
Ger
man
y N
ot a
vail
able
G
as
2003
P
ress
ure
incr
ease
in th
e fi
rst a
nnul
us o
f bo
reho
le
noitelpmoclle
weht
foerulia
F
teyra
Bal
., (2
002)
; Ü
bere
r et
al.,
200
4
Pla
ya d
el R
ey, L
A,
Cal
ifor
nia,
US
A
SoC
al
Gas
3 002 lirp
A
l iofot si
meni f
ah ti
wsag
f oesa eler
etu nim
52eko rbtinu
rosserpmoc
nievla
V)3 002(
ze uqraM
&no sre te
P
Cas
taic
Hil
ls &
H
onor
Ran
cho,
Cal
if.,
US
A
SoC
al
Gas
19
75-
pres
ent?
G
as m
igra
ting
fro
m C
asta
ic r
eser
voir
to
adja
cent
fie
lds
& th
ence
to s
urfa
ce
Gas
mig
rate
s to
sha
llow
er H
onor
Ran
cho
& T
apia
res
ervo
irs,
vi
a fa
ults
to s
urfa
ce k
illi
ng o
ak tr
ees
Dav
is &
Nam
son
(200
4); K
hily
uk e
t al.,
200
0)
Mon
tebe
llo,
LA
C
alif
orm
ia, U
SA
S
oCal
G
as
1950
s-19
80s
Sto
rage
gas
lost
ove
r ex
tend
ed p
erio
d S
tora
ge g
as m
igra
ted
from
inje
ctio
n ar
ea, i
njec
tion
cea
sed
1986
, fac
ilit
y cl
osed
200
3 B
enso
n &
Hep
ple
(200
5); C
hili
ngar
& E
ndre
s (2
005)
; EIA
(20
06)
Pla
ya d
el R
ey, L
A,
Cal
ifor
nia,
US
A
SoC
al
Gas
19
40s-
pres
ent
day
Mig
rati
on o
f st
ored
gas
S
tore
d ga
s ha
s be
en m
igra
ting
fro
m P
laya
del
Rey
str
uctu
re
into
Ven
ice
stru
ctur
e fr
om e
arli
est d
ays,
som
e fa
ult r
elat
ed
Rei
gle
(195
3); E
xplo
rati
on T
echn
olog
ies
Inc.
, (20
00);
SoC
al, (
2004
);
Chi
ling
ar &
End
res
(200
5)
McD
onal
d Is
land
, S
tock
ton,
Cal
ifor
nia,
U
SA
Pac
ific
Gas
&
Ele
ctri
cC
o.
Gas
O
ct 1
993
Exp
losi
on, c
ausi
ng U
S $
2 m
illi
on d
amag
e.
Exp
losi
on in
moi
stur
e ex
trac
tion
(ga
s co
ndit
ioni
ng)
plan
t L
ee (
1968
); D
elta
Pro
tect
ion
Com
mis
sion
(19
97)
Epp
s, L
ouis
iana
, U
SA
T
runk
line
G
as
1980
s-19
90s
Inje
cted
gas
pro
duce
d el
sew
here
in s
truc
ture
–
from
sam
e re
serv
oir
Gas
mig
rate
d aw
ay f
rom
inje
ctio
n fo
otpr
int –
con
nect
ion
betw
een
trap
s. F
acil
ity
rem
ains
ope
rati
onal
C
olem
an (
1992
); E
IA (
2006
)
McD
onal
d Is
land
, S
tock
ton,
Cal
ifor
nia,
U
SA
Pac
ific
Gas
&
Ele
ctri
cC
o.
Gas
19
74
Exp
losi
on, f
ire
burn
ed f
or 1
9 da
ys, 0
.42
Mcm
ga
s co
nsum
ed
t ava
ilab
leo
N
)2991(ytnuo
CniuqaoJ
naS
Eas
t Whi
ttie
r,
Cal
ifor
nia,
US
A
SoC
al
Gas
19
70s
Gas
mig
rate
d fr
om o
rigi
nal i
njec
tion
sit
e In
ject
ed g
as p
rodu
ced
by o
ther
com
pany
, fac
ilit
y ev
entu
ally
cl
osed
in 2
003.
B
enso
n &
Hep
ple
(200
5); E
IA (
2006
)
El S
egun
do,
Cal
ifor
nia
Not
ava
ilab
le
Gas
E
arly
1970
s G
as m
igra
tion
-fa
cili
ty a
band
oned
due
to n
ew
hous
ing
Gas
mig
rati
on f
rom
res
ervo
ir to
sur
face
. Aba
ndon
ed f
or s
afet
y.
Khi
lyuk
et a
l. (2
000)
Cal
ifor
nia,
US
A
Not
ava
ilab
le
Gas
N
ot
avai
labl
e S
tora
ge w
ell d
amag
ed -
crus
hed
Sto
rage
wel
l dam
aged
dur
ing
eart
hqua
ke
Vec
tor
Mag
neti
cs (
http
://w
ww
.vec
torm
agne
tics
.com
/ ca
sehi
stor
ies.
pdf)
Cal
ifor
nia,
US
A
Not
ava
ilab
le
Gas
N
ot
avai
labl
e S
tora
ge w
ell d
amag
ed -
casi
ng s
hoe
leak
W
ell i
nadv
erte
ntly
sid
etra
cked
dur
ing
repa
ir o
f ca
sing
sho
e le
ak
Vec
tor
Mag
neti
cs (
http
://w
ww
.vec
torm
agne
tics
.com
/ ca
sehi
stor
ies.
pdf)
Cal
ifor
nia,
US
A
Not
ava
ilab
le
Gas
N
ot
avai
labl
e C
orro
sion
of
stor
age
wel
l cas
ing
Wel
l ina
dver
tent
ly s
idet
rack
ed d
urin
g re
pair
of
corr
oded
cas
ing
Vec
tor
Mag
neti
cs (
http
://w
ww
.vec
torm
agne
tics
.com
/ ca
sehi
stor
ies.
pdf)
Tab
le 8
. S
um
mary
of
docu
men
ted
in
cid
ents
or
pro
ble
ms
rep
ort
ed a
t u
nd
ergro
un
d h
yd
roca
rbo
n s
tora
ge
faci
liti
es d
evel
op
ed i
n d
eple
tin
g
oil
/gasf
ield
s, s
om
e of
wh
ich
have l
ed t
o l
eak
age
an
d/o
r fa
ilu
re.
45

Aq
uif
er S
tora
ge
Fa
cili
ty
Op
era
tor
Pro
du
ct
Da
te
Des
crip
tio
n o
f ev
en
t/fa
tali
ties
/
inju
ries
R
eport
ed c
au
se/c
om
men
t M
ain
ref
eren
ce(s
)
Inci
den
ts i
nvo
lvin
g c
asu
alt
ies/
larg
e ev
acu
ati
on
s
Spa
ndau
, Ger
man
y G
AS
AG
G
as
Apr
il
2004
E
xplo
sion
, 9 in
jure
d, 3
ser
ious
ly, 5
00
evac
uate
d in
1 k
m r
adiu
s of
inci
dent
Exp
losi
on, p
erha
ps li
nked
to m
aint
enan
ce w
ork,
a
defe
ctiv
e se
al, o
r w
ork
on th
e fa
cili
ties
con
tent
s ga
uges
, des
troy
ed th
e w
ellh
ead
Ass
ocia
ted
Pre
ss (
Apr
il 2
3rd,
200
4); F
May
(pe
rs c
om (
2004
)
Ket
zin
(Kno
blau
ch),
Ber
lin,
G
erm
any
1960
s no
t ava
ilab
le,
latt
erly
UG
SM
itte
nwal
de
Tow
n ga
s (1
960s
),na
tura
l gas
(197
0s-2
000)
19
60s-
2000
19
60s-
gas
mig
rati
on f
rom
res
ervo
ir to
su
rfac
e, to
wn
of K
nobl
auch
eva
cuat
ed
(per
man
entl
y?).
1 f
atal
ity
in h
ouse
Cap
roc
k no
t gas
tigh
t – m
igra
tion
alo
ng f
ault
s in
ca
p ro
ck a
lso
thou
ght l
ikel
y. T
he 1
fat
alit
y li
nked
to C
O m
igra
ting
up
old
wel
l int
o ho
use
http
://w
ww
.myd
elta
ques
t.com
/eng
lish
/arc
hive
-New
-tec
hnol
ogy-
wou
ld-s
tore
-car
bon-
unde
rgro
und;
Juh
lin
et a
l. (2
007)
; NJ
Ril
ey
(per
s co
m.,
2007
)
Ca
sua
lty
To
tals
1
dea
d,
9 i
nju
red
, >
50
0 e
vacu
ate
d
Inci
den
ts w
her
e n
o c
asu
alt
ies
invo
lved
bu
t fi
na
nci
al
or
pro
per
ty l
oss
or
clo
sure
occ
urr
ed
Ste
nlil
le, D
enm
ark
Dan
ish
Oil
and
G
as C
ompa
ny
(DO
NG
) G
as
1995
G
as in
sha
llow
aqu
ifer
and
bub
bled
to
surf
ace
kaelgnis a
C
&re ia
LØ
bro
(200
4 &
in p
ress
)
Ché
mer
y, F
ranc
e G
az d
e F
ranc
e G
as
Sep
t 198
9 M
ajor
gas
leak
, no
expl
osio
n. F
ligh
ts
dive
rted
aro
und
gas
clou
d D
urin
g ro
utin
e m
aint
enan
ce o
f w
ell c
ompl
etio
n an
d re
plac
emen
t of
a fi
lter
N
AW
PC
(19
99);
IA
VW
OP
SG
(20
05);
Fra
nken
thal
, Ger
man
y S
aar-
Fer
ngas
G
as
Sep
t 198
0 G
as e
scap
e, n
o ex
plos
ion,
no
casu
alti
e s
Dri
llin
g in
to e
xist
ing
pipe
wor
k?
AE
A (
2005
)
Ler
oy, W
yom
ing,
US
A
Mou
ntai
n F
uel
Sup
ply
Co.
G
as
1973
-mid
19
80s
Num
erou
s in
cide
nts
of g
as e
scap
ing
Cor
rode
d w
ell c
asin
g &
ove
rpre
ssur
ing
of a
quif
er
Kat
z an
d T
ek (
1981
); A
rakt
ingi
et a
l. (1
984)
; Nel
son
et a
l. (2
005)
Ple
asan
t Cre
ek, C
alif
orni
a,
US
A
Not
ava
ilab
le
Gas
19
72-
1976
S
oil g
as s
urve
ys d
etec
t gas
ove
r st
orag
e ar
ea
Gas
mig
rati
ng u
p ou
t of
rese
rvoi
r. P
oor
seal
? Jo
nes
& D
rozd
, 198
3; J
ones
& P
irkl
e: h
ttp:
//w
ww
.eti
-ge
oche
mis
try.
com
/Fin
alV
ersi
on1.
10.h
tm)
Sci
ota,
Ill
inoi
s, U
SA
C
entr
al I
llin
ois
Pub
lic
Ser
vice
C
ompa
ny
Gas
19
71-
1974
T
esti
ng a
nd in
ject
ion
1971
-197
2 In
effe
ctiv
e se
al p
rovi
ded
by c
apro
ck, f
acil
ity
was
ab
ando
ned
in 1
974
Bus
chba
ch &
Bon
d (1
974)
; Col
eman
et a
l. (1
977)
Pon
tiac
, Ill
inoi
s, U
SA
N
orth
ern
Illi
nois
G
as C
ompa
ny
Gas
19
63-
1974
T
esti
ng a
nd in
ject
ion
wit
h in
ert
com
bust
ion
gas
1970
In
effe
ctiv
e se
al p
rovi
ded
by c
apro
ck,
faci
lity
was
in
acti
ve in
197
4 B
usch
bach
& B
ond
(197
4); C
olem
an e
t al.
(197
7)
Lea
f R
iver
, Ill
inoi
s, U
SA
N
orth
ern
Illi
nois
G
as C
ompa
ny
Gas
19
68-
1971
W
ater
pum
p an
d in
ject
ion
test
s re
veal
le
ak
Fau
ltin
g, c
apro
ck le
ak, f
acil
ity
aban
done
d B
usch
bach
& B
ond
(197
4); C
olem
an e
t al.
(197
7)
Cha
lk C
reek
& C
oalv
ille
, U
tah,
US
Q
uest
ar, s
till
op
erat
iona
l G
as
1970
s S
oil g
as s
urve
ys d
etec
t gas
ove
r st
orag
e ar
eas
Gas
mig
rati
ng u
p ou
t of
rese
rvoi
rs –
fau
lts?
Jo
nes
& D
rozd
, 198
3); M
orga
n (2
004)
Bro
okvi
lle,
Ill
inoi
s, U
SA
N
atur
al G
as
Pip
elin
e C
ompa
ny
Gas
19
63-
1966
W
ater
pum
p an
d in
ject
ion
test
s in
dica
ted
leak
fro
m r
eser
voir
F
ault
ing,
cap
rock
leak
, fac
ilit
y ab
ando
ned
Bus
chba
ch &
Bon
d (1
974)
; Col
eman
et a
l. (1
977)
Man
love
, Ill
inoi
s, U
SA
P
eopl
es G
as
Lig
ht a
nd C
oke
Com
pany
G
as
1961
-19
63
Gas
mig
rate
d fr
om 2
upp
er r
eser
voir
s in
to g
laci
al d
rift
dep
osit
s R
eser
voir
s ab
ando
ned
but 3
rd , d
eepe
r on
e la
ter
deve
lope
d B
usch
bach
& B
ond
(197
4); C
olem
an e
t al.
(197
7)
Wav
erle
y, I
llin
ois,
US
A
Pan
hand
le
Eas
tern
Pip
elin
e C
ompa
ny
Gas
19
60s
Gas
mig
rati
on to
sha
llow
er le
vels
G
as w
as e
ithe
r re
cycl
ed in
to r
eser
voir
, or
prod
uced
B
usch
bach
& B
ond
(197
4); C
olem
an e
t al.
(197
7)
Tro
y G
rove
, Ill
inoi
s, U
SA
(T
he th
en)
Nor
ther
n Il
lino
is
Gas
Com
pany
G
as
1957
-19
59
Gas
mig
rati
on f
rom
res
ervo
ir k
now
n si
nce
earl
y de
velo
pmen
t G
as w
ithd
raw
n fr
om h
ighe
r le
vels
and
re-
inje
cted
at
dep
th. F
acil
ity
stil
l ope
rati
onal
B
usch
bach
& B
ond
(197
4); C
olem
an e
t al.
(197
7); H
unt (
2004
)
Her
sche
r, I
llin
ois,
US
A
Nat
ural
Gas
S
tora
geC
ompa
ny o
f Il
lino
is
Gas
A
pril
-Ju
ly 1
953
Gas
fou
nd in
sha
llow
wat
er w
ells
wit
hin
5 w
eeks
of
oper
atio
n
Inje
ctio
n ce
ased
, rel
ief
wel
ls d
rill
ed -
wit
hdra
w
wat
er f
rom
per
iphe
ry &
inje
cted
into
ove
rlyi
ng
form
atio
ns p
ress
ure
Bus
chba
ch &
Bon
d (1
974)
; Col
eman
et a
l. (1
977)
Nor
ther
n In
dian
a, U
SA
N
ot a
vail
able
G
as
Not
av
aila
ble
Gas
esc
ape
Res
ervo
ir s
elec
ted
too
shal
low
, num
ber
of w
ater
w
ells
wer
e af
fect
ed b
y th
e in
trus
ion
of n
atur
al g
as.
Fac
ilit
y ab
ando
ned
Bus
chba
ch &
Bon
d (1
974)
; Per
ry (
2005
, 200
7 pe
rs c
omm
.)
Tab
le 9
. S
um
mary
of
docu
men
ted
in
cid
ents
or
pro
ble
ms
rep
ort
ed a
t u
nd
ergro
un
d h
yd
roca
rbon
sto
rage
faci
liti
es d
evel
op
ed i
n a
qu
ifer
s,
som
e of
wh
ich
have
led
to l
eak
age
an
d/o
r fa
ilu
re.
46

Table 10 (next page). Summary of documented incidents or problems reported at
underground hydrocarbon storage facilities developed in salt caverns, some of
which have led to leakage and/or failure.
47

Sa
lt C
av
ern
Sto
rag
e
Faci
lity
O
per
ato
r P
rod
uct
D
ate
D
escr
ipt
se iru j
n
i /seit i lat
af/tn
eve
fo
no i
ope
R
tn e
mm
oc/ es
ua c
detr ) s( ec
ne referni
aM
Inci
den
ts i
nvo
lvin
g c
asu
alt
ies/
larg
e ev
acu
ati
on
s
Mos
s B
luff
, Tex
as, U
SA
D
uke
Ene
rgy
Gas
A
ugus
t 19th
-25
th 20
04
Fir
e &
exp
losi
on, c
irca
360
eva
cuat
ed, c
irca
169
.9 M
cm (
6Bcf
) of
nat
ural
gas
re
leas
ed a
nd b
urne
d. F
ire
allo
wed
to s
elf
exti
ngui
sh b
y bu
rnin
g of
f th
e re
mai
ning
gas
Init
ial s
epar
atio
n an
d br
each
of
the
8 5/
8-in
ch w
ell s
trin
g in
side
the
cave
rn, p
ress
ure
surg
e in
w
ell a
cted
like
‘w
ater
ham
mer
’, c
ausi
ng b
reac
h of
cor
rode
d pi
pe a
bove
gro
und,
esc
apin
g ga
s ig
nite
d, r
esul
tant
fir
e ca
used
wel
lhea
d to
fai
l w
ith
blow
out p
reve
nter
suc
cess
full
y in
stal
led
on
26th
Aug
ust.
Duk
e E
nerg
y (2
004)
; (h
ttp:
//w
ww
.sol
utio
nmin
ing.
org/
cmsF
iles
/Fil
es
/Mos
sBlu
ff_P
art1
Exe
cSum
_&_I
ncid
entD
escr
p.pd
f)
Mag
noli
a, N
apol
eanv
ille
, L
ouis
iana
, US
A
Ent
ergy
-Koc
h (G
ulf
Sou
th)
Gas
D
ec 2
4th
2003
G
as le
ak/e
vacu
atio
n. c
. 9.9
Mcm
gas
rel
ease
d in
few
hou
rs, 3
0 ev
acua
ted
Cas
ing
fail
ure,
cra
ck in
the
casi
ng o
f a
wel
l nea
r th
e to
p of
a c
aver
n H
oppe
r (2
004)
; ht
tp:/
/ww
w.tx
gt.c
om/s
ec/P
ipel
ines
%20
10K
%20
12-3
1-05
%20
FIN
AL
Con
way
, McP
hers
on
Cou
nty,
Kan
sas,
US
A
Wil
liam
s M
idst
ream
N
atur
al G
as
Liq
uids
Pro
pane
19
80s-
2002
N
GL
’s f
ound
in w
ells
& lo
cal g
roun
dwat
er. 3
0 ho
mes
bou
ght a
nd c
. 120
pe
ople
rel
ocat
ed 1
980-
81.
Pro
blem
s po
ssib
ly r
elat
ed to
eff
ects
of
d a ehkcor te w
)20 02( .la te
nag itaR
Hut
chin
son/
Yag
gy,
Kan
sas,
US
A
One
ok
Gas
Ja
nuar
y 20
01
Fir
e &
exp
losi
on, 2
dea
d, 1
inju
red
& �
250
peop
le e
vacu
ated
C
asin
g fa
ilur
e –
dam
aged
dur
ing
re-e
ntry
ope
rati
ons.
$5.
25 m
illi
on p
unit
ive
dam
ages
. Pro
blem
w
ith
radi
oact
ive
tool
dur
ing
anot
her
min
or in
cide
nt, w
hich
was
late
r ce
men
ted
into
cav
ern.
A
llis
on (
2001
a&b)
, Kan
sas
Ge o
logi
cal S
urve
y (2
004)
and
w
ebsi
te (
http
://w
ww
.kgs
.ku.
edu/
Hyd
ro/H
utch
/)
Bre
nham
, Tex
as, U
SA
M
apco
L
PG
(pr
opan
e,
buta
ne, e
than
e)
Apr
il 1
992
Fir
e &
exp
losi
on, 3
dea
d, 2
3 in
jure
d, 5
0 ev
acua
ted,
26
hom
es d
estr
oyed
w
ithi
n 1.
5 m
iles
of
the
expl
osio
n, d
amag
e to
fur
ther
33
hom
es
Ove
rfil
ling
and
val
ve f
ailu
re. $
5.4
mil
lion
& $
138
mil
lion
pun
itiv
e da
mag
es a
war
ded
NT
SB
(19
93a&
b, 2
006)
; Tho
ms
& G
ehle
(20
00);
Bér
est &
B
roua
rd (
2003
) M
ont B
elvi
eu, B
arbe
rs’
Hil
l, T
exas
, US
A
Not
ava
ilab
le
Pro
pane
N
ov 5
th
5 89 1 detaucav e
0 0 0 2 , da ed 2 ,n ois o lp xe
&
eriF
eru liaf
gni saC
B
éres
t et a
l. (2
001)
Mon
t Bel
vieu
, Bar
bers
’ H
ill,
Tex
as, U
SA
N
ot a
vail
able
P
ropa
ne
Sep
t 17th
1980
F
ire
& e
xplo
sion
, 75
fam
ilie
s ev
acua
ted
(c. 3
00)
noisorroc -
eruliaf gnisa
C
)1002( .la te tseréB
Wes
t Hac
kber
ry,
Lou
isia
na, U
SA
S
PR
O
il
Sep
t 197
8 F
ire,
1 d
ead.
c. 7
2,00
0 bb
ls c
rude
oil
rel
ease
d g nisac
fo riaper
gnir ud erulia f
re kcaP
&
tseré
B
;) 0891( E
OD
B
roua
rd (
2003
)
Pet
al, M
issi
ssip
pi, U
SA
N
ot a
vail
able
B
utan
e A
ugus
t 197
4 F
ire
& e
xplo
sion
, 24
inju
re
detauc av e 0003 ,d
nre va c fo
gn il lifrevO
AI
E
(199
5); H
irsc
hber
g et
al.
(199
8); A
EA
(20
05)
Ca
sua
lty
To
tals
8
dea
d/4
8 i
nju
red
/c.
61
10
eva
cua
ted
Inci
den
ts w
her
e n
o c
asu
alt
ies
invo
lved
bu
t fi
na
nci
al
or
pro
per
ty l
oss
or
clo
sure
occ
urr
ed
Ode
ssa
, Tex
as, U
SA
H
unts
man
P
olym
ers
Pro
pane
/cav
ern
16 M
arch
20
04
100t
(c.
116
.5 m
3 ) na
tura
l gas
liqu
ids
stor
ed a
t 600
psi
esc
aped
fro
m a
n un
derg
roun
d st
orag
e ca
vern
, bet
wee
n 8.
30 p
m a
nd m
idni
ght.
Eth
ylen
e be
ing
adde
d to
sto
rage
at t
ime
Met
al g
aske
t in
a w
ellh
ead
flan
ge f
aile
d, r
emai
ning
gas
fla
red
off,
no
repo
rted
inju
ries
Haz
ardo
us C
argo
Bul
leti
n (J
une
2004
); N
Ril
ey (
pers
com
, 20
07);
ht
tp:/
/ww
w.a
cces
smyl
ibra
ry.c
om/c
oms2
/sum
mar
y_02
86-
1792
5865
_IT
M
For
t Sas
katc
hew
an,
Alb
erta
, Can
ada
BP
Can
ada
Eth
ane
Aug
ust 2
001
Gas
leak
& f
ire.
Est
abli
shed
that
14,
500
m3
of e
than
e w
as lo
st o
ver
8 da
ys
Val
ve f
ailu
re
EU
B (
2002
)
Min
eola
, E. T
exas
, US
A
Sub
urba
n P
ropa
ne
Pro
pane
19
95 (
1993
?)
Cas
ing
leak
, blo
w o
ut &
fir
e C
aver
n op
erat
ions
led
to c
onne
ctio
n be
twee
n ad
jace
nt c
aver
ns, s
udde
n pr
essu
re b
uild
-up
and
casi
ng le
ak
Geb
hard
t et a
l. (1
996)
; Bér
est &
Bro
uard
(20
03);
War
ren
(200
6); (
http
://w
ww
.wil
dwel
l.com
/Fir
efig
htin
g/ff
_na4
.htm
) S
trat
ton
Rid
ge, T
exas
, U
SA
M
G/D
ow
Gas
19
90s
Cav
ern
fa
eruli TI
M
deliaf –
kaeL
H
oppe
r (2
004)
Clu
te, T
exas
, US
A
Dow
Che
mic
al
Co.
& S
Tex
as
Pip
elin
e C
ompa
ny
Eth
ylen
e 19
88/1
989
$6 m
illi
on o
f et
hyle
ne (
7 m
illi
on g
allo
ns)
lost
bet
wee
n D
ecem
ber
1988
&
Mar
ch 1
989.
Esc
aped
at 3
96 m
dep
th. C
olle
cted
ben
eath
cap
rock
to s
alt d
ome
Pro
duct
esc
aped
fro
m c
asin
g le
adin
g to
the
cave
r n &
rel
ated
to m
ovem
ent i
n th
e sa
lt d
ome?
R
elie
f w
ell d
rill
ed a
nd p
rodu
ct b
urne
d of
f.
Kol
met
z (2
007:
htt
p://
kolm
etz.
com
/Eth
ylen
e-sa
fety
-in
cide
nts.
ecnarF
,tairi
V
elbaliav a toN
e nely ht
E
6891 duol c
saG
rutpu
R
tinu rotarapes
fo e
)moc
srep ,5002 E
SH(
y el iR
legi
N
Mon
t Bel
vieu
, Tex
as,
US
A
Not
ava
ilab
le
Pro
pane
O
ctob
er 1
984
Fir
e &
exp
losi
on, s
ever
al m
illi
on
e g am ad
s’ $ eru lia f
g nis aC
B
éres
t et a
l. (2
001)
Teu
tsch
enta
l, G
erm
any
Not
ava
ilab
le
Eth
ylen
e M
arch
198
8 E
thyl
ene
leak
&
. sr es ye g enilepi p/lle
w
eh t ni
k aeL
K
atzu
ng e
t al.
(198
8); K
ansa
s G
eolo
gica
l Sur
vey
web
site
(h
ttp:
//w
ww
.kgs
.ku.
edu/
Hyd
ro/H
utch
/Gas
Sto
rage
/oth
er.h
tml)
Mis
siss
ippi
, US
A
Not
ava
ilab
le
Nat
ural
gas
/sal
t ca
vern
s’0891
ylraE
seitlausac
fo stroper
on ,segakael sa g la ruta
N
snr evac 4
at f
acil
ity,
wel
ls o
f 2
foun
d to
be
leak
ing
due
to p
oor
c gnitn e
me )4 002(
se noJ &
el kri
P
;) 6891( elkri
P
Elk
Cit
y, O
klah
oma,
US
A
Not
ava
ilab
le
Uns
peci
fied
E
arly
197
0s
Sur
face
eru
ptio
ns,
r ia ni
nworht
sredl uob deificep sn
U
Kat
z (1
974)
E
min
ence
, Mis
siss
ippi
, U
SA
T
rans
co
Gas
A
pril
197
2 L
ost c
apac
ity.
Clo
sed
in th
e ea
rly
1980
s, b
ut v
olum
e ha
d be
en r
egai
ned
and
is
pres
entl
y op
erat
ing
Sal
t cre
ep –
too
low
ope
rati
ng p
ress
ure
rang
e.
All
en (
1972
); B
aar
(197
7; B
éres
t & B
roua
rd (
2003
); W
arre
n (2
006)
B
ryan
Mou
nd, T
exas
, U
SA
N
ot a
vail
able
U
nspe
cifi
ed g
as
1950
s L
oss
of w
ellh
ead
pr
er usse rae y
0 3 ,yt pme
den od na ba s nre va
C
e lba ts llit s ret al
s ) 600 2(
ne rraW
Goo
dyea
r A
rizo
na, U
SA
N
ot a
vail
able
P
ropa
ne
Not
ava
ilab
le
(Mic
rose
eps)
tsol
ena porp fo teef
cib u c noi lli
m
lar eveS
ni
el oh no iso rro
C
wel
l cas
ing
at d
epth
aro
und
91 m
be
dnuo rg wo l
l kriP
; )689 1 (
elk riP
e
& J
ones
(20
04)
Kie
l, G
erm
any
AG
T
own
gas
+
hydr
ogen
(60
% -
65%
)
1960
s-pr
esen
t?
Los
t cap
acit
y, c
aver
n op
erat
ed f
rom
196
8 to
at l
east
197
1. T
own
gas
stor
age
sinc
e 19
71?
Sal
t cre
ep
Coa
tes
et a
l. (1
981)
; Pad
ró &
Put
sche
(19
99);
Bér
est &
B
roua
rd (
2003
)
Ter
sann
e, F
ranc
e G
az d
e F
ranc
e N
atur
al g
as
1970
-197
9 L
ost c
apac
ity,
cav
ern
stil
l ope
rati
onal
, hav
ing
rega
ined
muc
h of
ear
lier
vo
lum
e lo
ss
Sal
t cre
ep
Bér
est &
Bro
uard
(20
03),
War
ren
(200
6)
Bay
ou C
hoct
aw, B
aton
R
ouge
, Lou
isia
na, U
SA
N
ot a
vail
able
E
mpt
y ca
vern
19
54
Col
laps
e of
ove
rbur
den
into
the
deve
lopi
ng c
aver
n nu
mbe
r 7
Unc
ontr
olle
snoitarepo gn ih cael
d 91 ( .l a t e
se ta oC
81
); N
eal &
Mag
oria
n (1
997)
Clo
vell
y, L
ouis
iana
, US
A
Not
ava
ilab
le
Em
pty
cave
rn
Not
ava
ilab
le
Insu
ffic
ient
thic
knes
s of
sal
t to
act
reir ra b a
sa h t
ni g nihcae l
nre vaC
g nah revo tl as
e )7 991(
na irog aM
&
l ae
N
Nap
olea
nvil
le, L
ouis
iana
, U
SA
N
ot a
vail
able
E
mpt
y ca
vern
N
ot a
vail
able
S
hale
laye
rs o
f sa
lt d
ome
side
enc
ount
ered
in s
ome
cave
rns,
leav
ing
insu
ffic
ient
buf
fer
salt
S
alt d
ome
edge
and
enc
losi
ng r
ocks
had
deretnu ocne
neeb )7991(
nairogaM
&
lae
N
84

49
Ab
an
don
ed M
ine
Sto
rage
Fa
cili
ty
Op
era
tor
Pro
du
ct/t
yp
e D
ate
D
escr
ipti
on
of
even
t/fa
tali
ties
/in
juri
es
Rep
ort
ed c
au
se/c
om
men
t M
ain
ref
eren
ce(s
)
Wee
ks I
slan
d,L
ouis
iana
, US
A
US
Dep
t. of
E
nerg
y O
il/s
altm
ine
1991
-19
94
Los
s of
sal
t min
e ca
vern
inte
grit
y at
SP
R
faci
lity
S
inkh
oles
cau
sed
by le
achi
ng o
f sa
lt a
nd
coll
apse
of
min
ed c
aver
ns
Nea
l & M
agor
ian
(199
7);
War
ren
(200
6)
And
erlu
es, B
elgi
um
Not
avai
labl
e G
as/c
oalm
ine
1980
-20
00
Lea
kage
fro
m c
oal m
ine.
Ope
rati
ons
ceas
ed in
200
0 du
e to
con
nect
ivit
y w
ith
shal
low
er m
ine
leve
ls s
uch
that
gas
es
cape
d to
ove
rlyi
ng s
trat
a, v
ery
cost
ly
mai
nten
ance
wor
k on
sha
fts
and
the
high
ad
sorp
tion
leve
ls o
f th
e ga
s on
to th
e co
al
seam
s
Cap
rock
not
gas
tigh
t, ga
s le
aked
out
of
min
e w
orki
ngs
Pie
sson
s &
Dus
ar (
2003
)
Ley
den,
Arv
ada,
C
olor
ado,
US
A
PS
Co
Gas
/coa
lmin
e 19
60s-
2000
L
eaka
ge f
rom
coa
l min
e. $
278,
000
dam
ages
, fac
ilit
y cl
osed
200
1.
Cap
rock
not
gas
tigh
t, ga
s le
aks
out o
f m
ine
wor
king
s R
aven
Rid
ge R
esou
rces
(1
998)
Cro
ssvi
lle,
Ill
inoi
s,
US
A
Not
avai
labl
e P
ropa
ne/c
oal
min
e
mid
1960
s -
2000
Lea
kage
fro
m m
ine.
No
repo
rted
ca
sual
ties
Lea
kage
fro
m th
e sh
aft,
once
in o
verb
urde
n m
igra
tion
was
pre
ssur
e dr
iven
alo
ng f
ault
s,
frac
ture
s an
d jo
ints
Pir
kle
(198
6); P
irkl
e &
Pri
ce
(198
6); J
ones
& B
urte
ll
(199
4)
Un
lin
ed r
ock
cav
ern
(sa
lt?
)
Rav
ensw
orth
, Vir
gini
a,
US
A
Was
hing
ton
Gas
Lig
htC
ompa
ny
Pro
pane
/un
line
d ro
ck
cave
rn
24 Aug
.19
73
Sm
ell o
f ga
s re
port
ed, w
ith
gas
bubb
ling
up
300
m f
rom
a r
esid
enti
al a
rea.
Wat
er
inje
cted
aro
und
wel
l to
stem
mig
rati
on o
f ga
s in
sub
surf
ace.
Not
cle
ar, b
ut a
ppea
rs p
ropa
ne e
scap
ed
from
an
unde
rgro
und
unli
ned
rock
cav
ern
Ber
est (
1989
); N
Ril
ey, H
SE
pe
rs c
om 2
007
Tab
le 1
1.
Su
mm
ary
of
docu
men
ted
in
cid
ents
or
pro
ble
ms
rep
ort
ed a
t u
nd
ergro
un
d h
yd
roca
rbon
sto
rage
faci
liti
es d
evel
op
ed i
n a
ban
don
ed
min
es, so
me
of
wh
ich
have
led
to l
eak
age
an
d/o
r fa
ilu
re

50

Table 12. Details of operating European UGS sites in MARCOGAZ survey of European UGS
incidents to 2000 (from Joffre & LePrince, 2002).
Number ofNumber ofNumber of UGS cumulatedCountries active storage sites years of site wells operation
Average number of years
of cumulative well operation
Austria Belgium Denmark France Germany Italy Spain Totals
4 2 2
13 10 9 2
42
25 10 25
355 114 307
9
845
178 40 20
294 213 215 10
970
2225 200 250
52185 12247 33002
45
100155
Table 13. Breakdown of the information collected during the MARCOGAZ survey of European
UGS incidents to 2000 (from Joffre & LePrince, 2002).
Substances involved
Criteria Number of events
Natural Gas 7 Oil 3 Solids 1 Total: 11
Immediate source of accident
Criteria Number of events
Storage (wells) 5 Surface process (compressor, treatment, piping) 6 Suspected Cause
Criteria Number of events
Human 3 Plant/equipment 8 Immediate Effects
Criteria Number of events
Injuries 2 (1 light)
(1 severe + 2 light) Material + release of gas 6 Not available 3 Emergency Measures Taken
Criteria Number of events
Well closed 1 Emergency plans activated 2 Checking process 1 None 1 Not available 6 Immediate Lessons Learnt
Criteria Number of events
Redundant blowout preventor installed 2 New design of installation 5 None 3 (unique accidents) Not available 1
51

Table 14. Summary of main casualty figures from various oil, gas and petrochemical incidents
in the USA and rest of the world. Figures relating to Office Pipeline Safety (OPS) and HSE
for domestic gas supplies partly duplicate those pipeline figures in the USA summarised in
Tables 15 & 16, which were the major incidents covered in NTSB reports.
Numbers Numbers Numbers
Type of Incident/industry reported reported reported
dead injured evacuated
UF
S2 11-7 se lbaT – ASU 8 84 011,6
c. 583 Rest of world – Tables 7-11 1 14 (excluding
Ketzin)
Above ground storage tanks (world -1951-2003; Persson & Lönnermark, 2004; 778 426 >7,000 Clark et al., 2001) – Table 20 Oil sector – (1986-2005; Hirschberg et al., 1998; Table 17)
15,695 20,276 274,746
Gas sector (1986-2005; Hirschberg et al., 1998; Table 17)
2,233 5,210 105,011
LPG sector (1986-2005; Hirschberg et al., 1998; Table 17)
3,701 21,120 961,776
Railroad (USA) – Table 19 (NTSB reports; 9 5,441 10,452 http://www.ntsb.gov/Publictn/R_Acc.htm) Petrochemical plants – world (Table 18;
En
ergy S
up
ply
Ch
ain
HSE, 1975; KAMEDO, 2000; Doyle, 2002; Marsh, 2003; Gruhn, 2003 & Macalister,
3,674 303,342 7,200
2005) OPS (USA) 1986-2006(part) -Transmission & distribution network & hazardous liquid pipelines (Table 15)
449 1,978 Not
available
HSE (UK) 1986-2005 domestic gas supply/use – Table 16 (figures in brackets = number from CO poisoning)
729 (576)
4,273 (3,346)
Not available
2 UFS has been ongoing in the Canada and the USA since 1915 and 1916 respectively and in Europe since the 1950s (see section 2.2.4.2 of the main report). For storage utilising depleting oil/gasfields, incidents involving casualties have only been found reported since 1997, although migrating gas has been known in some Californian gas storage facilities since the 1940s. Although leakage has been known in some aquifer storage facilities since the early 1950s, the few casualties are reported, with 1 fatality in the 1960s and 9 injured in 2004. For salt cavern storage facilities problems and leakages have been reported since the early-mid 1950s, although casualties associated with this storage type have been found reported from 1974.
25

Table 15. American OPS statistics for reported incidents and casualties involving both
hazardous liquids and gas supply for the period 1986-2006(part) – refer
http://ops.dot.gov/stats/stats.htm).
Hazardous Gas Gas
YearLiquid
Pipeline
Distribution
Operators
Transmission
Operators
Operators
No. of
Accidents Fatalities Injuries
No. of
Incidents Fatalities Injuries
No. of
Incidents Fatalities Injuries
1986 210 4 32 142 29 104 83 6 20
1987 237 3 20 163 11 115 70 0 15
1988 193 2 19 201 23 114 89 2 11
1989 163 3 38 177 20 91 103 22 28
1990 180 3 7 109 6 52 89 0 17
1991 216 0 9 162 14 77 71 0 12
1992 212 5 38 103 7 65 74 3 15
1993 229 0 10 121 16 84 95 1 17
1994 245 1 7 141 21 91 81 0 22
1995 188 3 11 97 16 43 64 2 10
1996 194 5 13 110 47 109 77 1 5
1997 171 0 5 102 9 67 73 1 5
1998 153 2 6 137 18 64 99 1 11
1999 167 4 20 118 16 80 54 2 8
2000 146 1 4 154 22 59 80 15 18
2001 130 0 10 124 5 46 87 2 5
2002 147 1 0 102 10 44 82 1 5
2003 131 0 5 141 11 58 97 1 8
2004 144 5 16 175 18 41 123 0 3
2005 137 2 2 170 14 38 182 0 7
2006
(part)
86 0 0 102 11 19 107 1 3
Totals 3,679 44 272 2,851 344 1461 1,880 61 245
Total no. 8,410 incidents
Total no. 449 fatalities
Total no. 1,978 injuries
53

Table 16. UK gas safety statistics illustrating known incidents relating to supply and use of
flammable gas for the period 1986-2005 and which resulted in fatalities/injuries (based upon
published Health & Safety Executive figures). The cause of incidents resulting in death or
injury and which were not known (or related to suicide) are not included here. Note: the HSE
fatalities refer to the gas distribution system and use of gas and not the transmission system.
1986/ 1987/ 1988/ 1989/ 1990/ 1991/ 1992/ 1993/ 1994/ 1995/
1987 1988 1989 1990 1991 1992 1993 1994 1995 1996
Total number
of incidents 131 148 126 130 121 139 138 179 146 146
(resulting in
fatalities/ (60/71) (71/77) (45/81) (68/62) (43/78) (50/89) (35/103) (47/132) (35/111) (42/104)
injuries)
Explosion/fire
(number of
fatalities/ 12/58 12/72 6/42 15/67 11/48 8/63 3/39 9/52 4/35 6/51
injuries)
CO poisoning
(number of
fatalities/ 35/85 48/76 41/94 34/88 30/131 33/184 41/176 29/252 30/198 29/141
injuries)
Totals
(fatalities/ 47/143 60/148 47/136 49/155 41/179 41/247 44/215 38/304 34/233 35/192
injuries)
(Based upon HSE figures – HSE, 2005, 2006)
1996/ 1997/ 1998/ 1999/ 2000/ 2001/ 2002/ 2003/ 2004/ 2005/
2006 Sub
1997 1998 1999 2000 2001 2002 2003 2004 2005 totals (part
Total number
of incidents 143 164 151 174 174 154 114 127 147 151 2903
(resulting in
fatalities/ (40/103) (45/119) (37/114) (56/118) (38/136) (44/110) (33/81) (34/93) (37/110) (31/120) 891/2012
injuries)
Explosion/fire
(number of
fatalities/ 9/35 8/43 11/30 10/61 8/36 5/47 5/38 5/43 2/42 4/25 153/927
injuries)
CO poisoning
(number of
fatalities/ 31/156 27/189 33/194 23/228 25/265 22/169 20/138 11/171 18/203 16/208 576/3346
injuries)
Totals
(fatalities/ 40/191 35/232 44/224 33/289 33/301 27/216 25/176 16/214 20/255 20/233 729/4273
injuries)
54

Table 17. Summary of casualty figures for varying stages of the energy chain. Based largely
upon the ENSAD (severe accidents) database for oil, gas and LPG production and supply for
the period 1969-1996 (from Hirschberg et al., 1998).
Category
Casualty Figures -
sector Oil Gas LPG Totals
Not known Fatalities 813 22 88 923 Injured 1,224 445 147 1,816
Evacuees 22,000 15,710 303,900 341,610
Exploration/extraction Fatalities 1,502 158 5 1,665 Injured 4,453 61 4,514
Evacuees 1,000 1,000
Transport to refinery Fatalities 5,839 5,839 Injured 883 883
Evacuees 20,240 20,240
Long distance transport Fatalities 987 828 1,815 Injured 1,857 1,578 3,435
Evacuees 82,525 3,501 86,026
Refinery/processing Fatalities 399 8 164 571 Injured 1,966 345 393 2,704
Evacuees 23,430 161,000 184,430
Regional distribution Fatalities 7,142 226 1,988 9,356 Injured 11,750 936 11,523 24,209
Evacuees 208,076 300 477,365 685,741
Local distribution Fatalities 600 330 930 Injured 1,349 7,199 8,548
Evacuees 4,476 1,900 6,376
Heating/industrial Fatalities 232 298 530 Injured 217 280 497 Evacuees 2,000 14,110 16,110
Totals Fatalities 15,695 2,233 3,701 21,629 Injured 20,276 5,210 21,120 46,606 Evacuees 274,746 105,011 961,776 1,341,533
55

Table 18 . Significant petrochemical plant accidents involving death or injury.
Petro-
chemical
industry
incidents
Information Description of
Location source Operator Type Date event/fatalities Reported cause
injuries
Coliseum, Indianapolis
KAMEDO
(2000) Not
available Gas 1963
Explosion, 66 dead, 436 injured
Functional fault at refrigeration plant, gas release and explosion
Flixborough, N Lincolnshire, England
HSE (1975), Marsh (2003)
Nypro (UK)
Cyclo-hexane
1st
June 1974
Explosion and fire, 28 dead, 104 injured, 3000 evacuated
Bypass pipe failed during a pressure surge, releasing product which formed a cloud that exploded (unconfined vapour cloud explosion) Major leak from holding tank with stored MIC overheated and released toxic heavier-than-air
Bhopal, India Union carbide
Chemical plant - Methyl isocyanate
3rd Dec 1984
Major leak, 3500 dead, over 300000 injured
MIC gas, which rolled along the ground through the surrounding streets. The gas may ultimately have injured between 150,000 to 600,000 people, at least 15,000 of whom later died
Pasedena, Texas
Phillips Chemical 23rd
Oct 1989
Explosion and fire, 23 dead, 130 injured
Release of highly flammable process gases during regular maintenance operation. Vapour cloud ignited.
Deer Park, Texas
Arco Chemical
Co 1990 17 dead Not available
27th Fire and explosion, Fire at chemical plant spreads to Belpre, Ohio Doyle (2002) Shell Chemical storage May 4 dead, 1700 nearby storage tanks, with loss of
1994 evacuated millions of gallons of chemicals Explosion in ammonium nitrate process area, destroying the main
Port Neal, Iowa
Marsh (2003), Gruhn (2003)
Terra Industries
Chemical plant 13th
Dec 1994
Explosion, 4 dead, 18 injured, 2500 outside plant evacuated
seven-storey process building and creating a crater about 10 m across. In addition, the explosion broke windows of buildings over 25 km away in Sioux City and was felt 48 km away.
Deer Park, Texas
Doyle (2002), Marsh (2003)
Shell Chemical plant 22nd
June 1997
Explosion and fire, blast felt 25 miles away. 30 receive medical help.
Flammable gas leak led to fire and explosion
Wuppertal, Germany
Marsh (2003) Not
available Chemical plant
8th
June 1999
Explosion, 50 injured including 20 local residents
Human error – wrong chemical added to tank during production of insecticide
Pasedena, Texas
Marsh (2003) ?Phillips Chemical/plastics 27th
Mar 2000
Explosion and fire, 1 dead, 69 injured
Chemical reaction caused explosion and fire during cleaning
Birkenhead, UK
Marsh (2003) Not
available Polyacrylates
16th
May 2001
Fire destroyed plant, 2 injured
Major release and fire destroys the polyacrylates plant
Toulouse, France
Marsh (2003), Macalister (2005)
Total Fertilizer plant 21st
Sept 2001
Explosion, 30 dead, 2500 seriously injured.
France’s worst industrial accident, but cause never established
Geismar, Louisiana
Doyle (2002) Shell Chemical plant 12th
Feb 2002
Explosion and flash fire, 1 dead, 1 injured
Not available
3674 dead/303342
Totals injured/7200
evacuated
56

Ra
ilro
ad
in
cid
ent
Info
rm
ati
on
sou
rce
Op
era
tor
Ty
pe
Da
te
Des
crip
tio
n o
f
even
t/fa
tali
ties
/in
juri
es/e
va
cua
tio
ns
Rep
ort
ed c
au
se
Bog
alus
a, L
ouis
iana
N
TS
B (
1995
) V
icks
burg
Che
mic
al
Com
pany
D
erai
lmen
t,ha
zard
ous
leak
23
rd O
ct19
95
Rup
ture
d fr
eigh
t tan
k, 4
710
peop
le tr
eate
d in
ho
spit
als,
81
adm
itte
d, 3
000
evac
uate
d D
erai
lmen
t led
to r
uptu
re o
f fr
eigh
t tan
ks a
nd le
akag
e of
ni
trog
en te
trox
ide,
for
min
g va
pour
clo
ud
Sw
eetw
ater
, Ten
ness
ee
NT
SB
HZ
B/9
8-02
N
orfo
lk S
outh
ern
Rai
lway
Com
pany
F
reig
ht ta
nk
frac
ture
7 th
Feb
1996
C
ircu
mfe
rent
ial f
ract
ure
on f
reig
ht ta
nk, 4
inju
red,
c.
500
resi
dent
s ev
acua
ted
Fre
ight
car
fra
ctur
ed in
two,
rel
easi
ng f
lam
mab
le 8
000
gall
ons
of to
xic
mat
eria
l
Ten
ness
ee P
ass,
Col
orad
o N
TS
B R
AB
/98-
08
Sou
ther
n P
acif
ic L
ines
D
erai
lmen
tha
zard
ous
leak
21
st F
eb19
96
Der
ailm
ent,
2 dr
iver
s de
ad, 1
inju
red,
4 f
amil
ies
evac
uate
d R
unaw
ay tr
ain
led
to d
erai
lmen
t, ru
ptur
e of
fre
ight
tank
s an
d m
ajor
spi
llag
e
Sel
kirk
, New
Yor
k N
TS
B H
ZB
/98-
03
Con
soli
date
d R
ail
Cor
pora
tion
F
reig
ht ta
nk
frac
ture
6 th
Mar
19
96
Cir
cum
fere
ntia
l fra
ctur
e on
fre
ight
tank
, 1 in
jure
d,
no e
vacu
atio
ns
Cat
astr
ophi
c fa
ilur
e of
fre
ight
tank
rel
easi
ng li
quef
ied
prop
ane
that
igni
ted
in la
rge
fire
ball
Alb
erto
n, M
onta
na
NT
SB
RA
B/9
8-07
M
onta
na R
ail L
ink
Der
ailm
ent,
haza
rdou
s le
ak
11 th
Apr
il19
96
Rup
ture
d fr
eigh
t tan
k, h
azar
dous
che
mic
al le
ak,
circ
a 10
00 e
vacu
ated
, 1 d
ead
on tr
ain,
350
trea
ted
for
gas
inha
lati
on, 1
23 s
erio
us
Der
ailm
ent l
ed to
rup
ture
of
frei
ght t
anks
and
spi
llag
e of
ch
lori
ne a
nd p
otas
sium
hyd
roxi
de s
olut
ion
Mem
phis
, Ten
ness
ee
NT
SB
HZ
B/9
8-04
Il
lino
is C
entr
al R
ailr
oad
Cra
ck in
tank
2 nd
Apr
il19
97
Cra
ck a
nd r
elea
se o
f ha
zard
ous
mat
eria
l, c.
150
(26
ho
uses
) ev
acua
ted
from
½ m
ile
radi
us
Hyd
roge
n-as
sist
ed c
rack
in r
epai
r w
eld
led
to r
elea
se o
f co
rros
ive
liqu
id a
nd v
apou
r cl
oud
Cri
sfie
ld, K
ansa
s N
TS
B/R
AR
-00/
01P
B20
00-9
1630
1 B
urli
ngto
n N
orth
ern
&
San
ta F
e R
ailw
ay C
o.
Der
ailm
ent,
haza
rdou
s le
ak
2 nd S
ept
1998
R
uptu
red
frei
ght t
ank,
rel
ease
haz
ardo
us m
ater
ial,
c.
200
evac
uate
d w
ithi
n 5-
mil
e ra
dius
D
erai
lmen
t led
to r
uptu
re o
f fr
eigh
t tan
ks a
nd r
elea
se o
f ha
zard
ous
mat
eria
ls a
nd f
ires
Lou
isvi
lle,
Ken
tuck
y N
TS
BH
ZB
/00/
02
Mat
lack
Inc
F
reig
ht in
cide
nt
19 th
Sep
t19
98
Haz
ardo
us m
ater
ial r
elea
se, 2
400
evac
uate
d fr
om
fact
ory,
600
rem
ain
indo
ors,
7 m
inor
inju
ries
C
hem
ical
rea
ctio
n du
ring
car
go tr
ansf
er, h
uman
err
or.
Whi
teha
ll, M
ichi
gan
NT
SB
HZ
B/0
0/03
Q
uali
ty C
arri
ers
Inc
Che
mic
al r
eact
ion
4 th Ju
ne19
99
Che
mic
al r
eact
ion,
1 d
ead,
1 in
jure
d, 1
1 ev
acua
ted
from
the
plan
t C
hem
ical
rea
ctio
n du
ring
car
go tr
ansf
er, h
uman
err
or.
Riv
ervi
ew, M
ichi
gan
NT
SB
/HZ
M-0
2/01
PB
2002
-917
002
AT
OF
INA
Che
mic
als
Inc
Pip
e fr
actu
re, g
asle
ak &
exp
losi
on
14 th
July
2001
P
ipe
frac
ture
, rel
ease
s po
ison
ous,
fla
mm
able
gas
, 3
dead
, inj
urie
s an
d c.
200
0 re
side
nts
evac
uate
d
Unl
oadi
ng li
ne o
f a
rail
road
tank
car
fra
ctur
ed a
nd
sepa
rate
d, w
ith
rele
ase
of m
ethy
l mer
capt
an, a
poi
sono
us
and
flam
mab
le g
as. G
as ig
nite
d, f
ire
ball
Min
ot, N
orth
Dak
ota
NT
SB
/RA
R-0
4/01
PB
2004
-916
301
Can
adia
n P
acif
ic
Rai
lway
Der
ailm
ent,
haza
rdou
s ga
s le
ak
18 th
Jan
2002
Rup
ture
fre
ight
tank
and
rel
ease
of
gas
and
vapo
ur
clou
d, 1
res
iden
t dea
d, 1
1 se
riou
sly
inju
red,
322
min
or in
juri
es, 1
1600
peo
ple
affe
cted
by
vapo
ur
clou
d
Tra
in d
erai
led,
cat
astr
ophi
c ru
ptur
e of
fre
ight
tank
and
re
leas
e of
am
mon
ia g
as a
nd v
apou
r pl
ume
Fre
epor
t, T
exas
N
TS
B/H
ZM
-04/
02P
B20
04-9
1700
3 B
AS
F C
orpo
rati
on
Fre
ight
tank
ru
ptur
e 13
th S
ept
2002
R
uptu
re o
f fr
eigh
t tan
k, 2
8 in
jure
d, r
esid
ents
wit
hin
1.5
mil
es e
vacu
ated
for
5 ½
hou
rs
Cat
astr
ophi
c ru
ptur
e of
fre
ight
tank
and
exp
losi
on a
t tr
ansf
er s
tati
on r
elea
se h
azar
dous
was
te. M
ajor
dam
age,
w
ith
loss
of
tran
sfer
sta
tion
and
bui
ldin
gs
Tam
aroa
, Ill
inoi
s N
TS
B/R
AR
-05/
01P
B20
05-9
1630
1 C
anad
ian
Nat
iona
lF
reig
ht T
rain
D
erai
lmen
t, ha
zard
mat
eria
l 9 th
Feb
2003
D
erai
lmen
t led
to le
ak a
nd f
ire,
no
inju
ries
, 850
resi
dent
s ev
acua
ted
Der
ailm
ent c
ausi
ng le
ak o
f m
etha
nol f
rom
fre
ight
tank
s,
whi
ch ig
nite
d. A
cid
rele
ased
fro
m o
ther
tank
s
Cal
amus
, Iow
a N
TS
B/H
ZM
-04/
01P
B20
04-9
1700
1 R
iver
Val
ley
Cor
pora
tion
C
argo
tank
15
th A
pril
2003
T
ank
rupt
ure,
1 d
ead,
1 in
jure
d S
udde
n fa
ilur
e of
car
go ta
nk r
uptu
re r
elea
sing
cor
rosi
ve
liqu
id/g
as. P
oor
wel
ding
& in
spec
tion
fou
nd.
Mid
dlet
on, O
hio
NT
SB
/HZ
B-0
401
Am
erig
as C
orpo
rati
on
Car
go ta
nk
22 nd
Aug
2003
F
reig
ht ta
nk f
ailu
re, 5
trea
ted,
cir
ca 1
00 e
vacu
ated
fr
om p
lant
C
argo
tank
fra
ctur
e re
leas
ing
pois
onou
s an
d co
rros
ive
gas
Eas
t St L
ouis
, Ill
inoi
s N
TS
B/R
AB
-05/
04
Alt
on &
Sou
ther
n R
ailw
ay C
ompa
ny
Tra
in c
olli
sion
,ha
zard
ous
rele
ase
21 st
Sep
t20
04
Haz
ardo
us m
ater
ials
rel
ease
, c. 1
40 e
vacu
ated
, no
inju
ries
rep
orte
d R
emot
e co
ntro
l col
lisi
on in
yar
d an
d ha
zard
ous
mat
eria
ls
rele
ase
Pic
o R
iver
a, C
alif
orni
a N
TS
B/R
AB
-05/
02
Uni
on P
acif
ic R
ailr
oad
Der
ailm
ent,
haza
rdou
s re
leas
e 16
th O
ct20
04
Der
ailm
ent,
frei
ght t
anks
str
ike
hous
es, c
irca
100
pe
ople
eva
cuat
ed. N
o in
jure
s re
port
ed
Der
ailm
ent o
f fr
eigh
t car
s, s
ome
hitt
ing
hom
es, r
uptu
ring
ta
nks
and
rele
asin
g di
esel
fue
l T
ota
ls
9 d
ead
/544
1 i
nju
red
/10
45
2 e
vacu
ate
d
Tab
le 1
9.
Sig
nif
ican
t A
mer
ican
hyd
roca
rbon
rel
ate
d r
ail
road
acc
iden
ts/i
nci
den
ts i
nvolv
ing d
eath
or
inju
ry (
base
d u
pon
NT
SB
fig
ure
s re
fer
web
site
).
57

Table 20. Above ground storage tank incidents between 1951-2003 resulting in
fatalities and/or casualties (based upon Persson & Lönnermark, 2004 but
including Clark et al., 2001).
Location Date Facility Ignition source Casualty Figures Santurca, Bilbao, Spain 1967 Crude oil storage tanks Rail tanker exploded 1 dead, 8 injured Amsterdam, Netherlands 20/11/1969 Petrol storage tank Not available 1 injured Czechowica, Poland 26/6/1971 4 crude oil storage tanks involved Lightning 33 dead (most firefighters) Spain 1972 Gasoline storage tank Smoking 1 dead
Ras Tamura, Saudi Arabia 22/8/1979 Aramco refinery storage tank exploded and was followed by fire
Not available Fire burned for one day. 2 dead, 6 injured
Heide, Germany 20/9/1979 Refinery tank Not available 1 injured Amsterdam, Netherlands 29/9/1979 ½ full storage tank in port area Not available 1 dead, 2 injured Cork, Ireland 1/3/1981 2 fuel storage tanks Operator sampling 1 dead Tacoa, Caracas, Venezuala 19/12/1982 2 heating oil storage tanks Not available 150 dead Bogata, Columbia 23/12/1982 3 gasoline/kerosene storage tanks Not available 1 dead 15 injured Corinto, Nicaragua 30/7/1983 8 oil storage tanks Maintenance 3 dead. Philadelphia, USA 5/10/1983 Naptha storage tank Explosion 4 injured Cologne, Germany May 1985 Several storage tanks Not available Area evacuated. Naples, Italy 1985 Aviation fuel storage tank Overfilling 5 dead, 170 injured Pretoria, S Africa 21/5/1985 Petrol tank Not available 3 firemen dead, 7 injured Chicago, USA 23/12/1986 Gasoline storage tank Explosion 1 dead Lyon, France 1987 14 tanks diesel storage tanks Not available 2 dead Chicago, USA 14/9/1987 Fuel storage tanks Explosion 2 dead, 3 injured Port Arthur, Texas, USA 1988 4 gasoline storage tanks Not available 8 dead, 8 injured Sines, Portugal 27/8/1988 3 tanks Maintenance 2 dead, 3 injured Qingdao, China 12/8/1989 Oil depot, 6 tanks Lightning 16 dead, 70 injured Sandwich, Mass, USA 5/8/1989 2 fuel oil tanks Maintenance 2 injured
Oklahoma, USA 1980 3 tanks Worker Worker using lighter ignited fuel, 3 tanks badly damaged. 3 dead.
Port of Tampa, Florida, USA May 1990 Gasoline tank Explosion 1 dead Houston, Texas, USA 8/7/1990 2 tanks Explosion 17 dead, 5 injured New Orleans, Louisiana, USA
1992 Crude oil storage tanks Not available 2 dead
Texas, USA 1992 Not available Human 1 dead, 4 injured Wyoming, USA 8/8/1992 More than 100 tanks Not available 4 injured Nanjing, China 21/10/1993 Gasoline storage tank Overfilling 2 dead Delaware City, USA 17/7/1994 2 oil tanks Lightning 6 firefighters injured
Ueda, Nagano, Japan 11/10/1994 Petrol storage tank explodes, igniting 3 other tanks
Not available 1 dead
Dronka, Egypt (Clark et al., 2001)
2/11/1994 Aviation fuel storage tanks Lightening 469 residents of village killed (Ash, 2006; Clark et al., 2001)
Addington, Oklahoma, USA 11/6/1995 Crude oil storage Lightning 2 dead San Juanico, Mexico 11/11/1996 2 gasoline storage tanks Faulty valve 4 dead
Hyderabad, India Sept 1997 LPG, kerosene & petroleum storage tanks
Explosion 34 dead, 100 injured
Israel Nov 1997 Diesel storage tank at refinery Explosion Diesel storage tank blew up at refinery. 1 dead
Calgary, Canada 9/8/1999 Oil, diesel fuel, jet fuel, propane storage tanks
Fire 2 dead
Kansas, USA 4/9/2001 Oil tank Human 1 dead
Duson, LA, USA 30/11/2001 Crude oil storage tank Explosion, cause not determined
1 boy badly burned
Dexter, KS, USA 7/6/2002 2 oil storage tanks Explosion 1 injured Turkey 28/7/2002 9 LPG tanks Not available 5000 evacuated Dunbar, S Africa 17/10/2002 Fuel storage tanks at bitumen factory Not available 1 dead, 6 injured Gdansk, Poland 3/5/2003 Gasoline tank ?mobile telephone 3 dead Buncefield, Hertfordshire, UK
11/12/05 Fuel storage depot Overfilling 43 injured
Totals 778 dead, 426 injured, >7000 evacuated
Published by the Health and Safety Executive 02/08

Executive Health and Safety
An appraisal of underground gas storage technologies and incidents, for the development of risk assessment methodology
This report was commissioned by the Health and Safety Executive to help assess the safety issues associated with the underground storage of natural gas. This has arisen because of the need to consider a number of applications submitted by various operators in the UK who wish to develop such facilities. The rising numbers of applications are as a result of UKCS oil and gas reserves showing rapid decline, to the extent that the UK became a net importer of gas during 2004. The Government recognises that the UK faces an increasing dependency on imports, yet has very little gas storage capacity and is, therefore, at a very real risk of supply shortfalls. It notes that the UK’s capacity to import, transport and store gas and LNG efficiently has to be improved and this will require greater investment in new, timely and appropriately sited gas (and LNG) supply infrastructure, part of which is likely to include (safe) onshore underground (natural) gas storage (UGS) facilities.
This report and the work it describes were funded by the Health and Safety Executive (HSE). Its contents, including any opinions and/or conclusions expressed, are those of the authors alone and do not necessarily reflect HSE policy.
RR605
www.hse.gov.uk