an appraisal of high definition survey approaches in
TRANSCRIPT

Vol. 14(9), pp. 250-259, September 2020
DOI: 10.5897/AJEST2020.2810
Article Number: 4A5662364765
ISSN: 1996-0786
Copyright ©2020
Author(s) retain the copyright of this article
http://www.academicjournals.org/AJEST
African Journal of Environmental Science and
Technology
Full Length Research Paper
An appraisal of high definition survey approaches in subsidence monitoring of crude oil storage tanks
Hart Lawrence* and Udeh Kenneth
Department of Surveying and Geomatics, Rivers State University, Port Harcourt, Rivers State Nigeria.
Received 11 January, 2020; Accepted 6 August, 2020
Vertical and horizontal motion of the solid earth surface due to geological and geodynamical phenomena are generally consequences of terrain deformation. Variations as a result of the deformation affect structures, particularly large storage facilities that are steel and/or concrete in nature. The criticality of these phenomena underscores the need to carryout regular measurements and monitoring of its effect in all dimension. Over the years, methods and instrumentation for subsidence monitoring has evolved from the conventional to the recently high definition surveying approach with an increasing need to detect and analyse deformation changes with clarity at any given time. The aim of this work was to appraise the high definition surveying approaches in subsidence dynamics of crude oil storage facilities. Classical instrumentations and the terrestrial laser scanning equipment were deployed based on the principles of geodetic positioning and mapping for overlity, verticality and radial displacement parameters determination using the two approaches. This paper will provide spatial information in terms of point clouds, 2D and 3D models, vertical and radial displacement of the crude oil storage facility. The work will further demonstrate the optimal capability of high definition surveying approach in our quest to constantly manage the complexities associated with subsidence. Several crude oil storage facilities in addition to other private storage facilities all over the country, require a policy to ensure regular monitoring and analysis of these facilities especially with the trend of earth tremors being experienced in parts of the country. Key words: Subsidence, high definition surveying, radial displacement, crude oil facility, geodetic positioning.
INTRODUCTION The advent of Terrestrial Laser Scanner (TLS) also referred to as High Definition Survey (HDS) with its current advancement in speed, has become a very useful survey equipment for various earth or near-earth based features that may be natural and/or man-made such as
as-built surveys, 3-dimensional (3D) spatial point cloud generation, archaeological site mapping and modelling, terrain characteristics and associated changes (Hart et al., 2018).
Meanwhile before the advent of these new HDS *Corresponding author. E-mail: [email protected].
Author(s) agree that this article remain permanently open access under the terms of the Creative Commons Attribution
License 4.0 International License

measurement, scientist and most geoscientists use the total station which basically is the improvement based on combination of the conventional theodolites and electronic distance measurement equipment (EDM). This compact equipment with in-built software enhanced the measurement capability of both angular and linear dimension of earth-based measurements. The use of total station for mapping and other surveys like deformation is still very relevant in today's world and can be used for subsidence monitoring especially on large storage crude oil tank farm.
The solid earth is under some form of stress and strain which results to ground movements. They can be attributed to natural processes or to some anthropogenic activities on the earth or near-earth surfaces. These movements can be slow or rapid depending on the magnitude of the force and/or load exerted on the solid earth though soft and compressible in most cases, it can also be as a result of the fluctuations associated with ground water and other geodynamical phenomena, (Crosetto et al., 2005). This development is synonymous to the Niger Delta Area of Nigeria where there are increase of oil and gas extraction on a daily basis in addition to the myriads of oil storage facilities spread within the area both by government and private holdings.
Large vertical cylindrical steel tanks widely used for crude oil storage generally consist of a thin bottom plate cylindrical shell and fixed or floating roof. These large tanks are susceptible to various types of settlement. The settlement components could be uniform settlement planer tilt or differential settlement. The uniform settlement and planer tilt causes rigid body deformation or rotation of the tank. Minimal differential settlement under the tank wall can induce large distortions along the tank top and high stresses at the tank base or in the top wind girder (Hart, et al, 2019). This work would showcase a classical case of the deployment of the TLS and conventional survey method in the monitoring of standards steel crude oil tank in the Niger-Delta area. The need for subsidence measurement and monitoring stems from the fact that slow movements related to load of structures on the solid earth has the potential of long-term damage and risk (Okeke, 2005). The aim of this work was to appraise the High Definition Survey approaches in the subsidence monitoring of crude oil storage. The objectives of the study were: 1) to determine the verticality of a crude oil tank using a 3-D model derived from laser scanning and 2) to determine overlity of a crude oil tank using a 3-D digital model derived from laser scanning output. The determination of the overlity, verticality and subsidence using conventional total station and digital level will provide the basis for the comparative analysis of the two approaches. The difference is that instead of measuring 'discrete points', the laser scanner measures 50000 points per second and with a point spacing of 0.1 at 100 m. This results in a very dense 'cloud' of data points, each of which is to the same
Hart and Udeh 251 accuracy as those measured by Total Station.
MATERIALS AND METHODS Study area description The study area is located in the Bonny Island situated in the southern edge of River State in the Niger Delta of Nigeria near Port Harcourt which most appropriately is defined by the following coordinates in WGS84, 4° 26” 18.81 N,7° 9” 39.3E; 4° 25” 30.77 N,7° 10” 47.93 E; 4° 24” 39.45 N,7° 9” 51.26 E; 4° 25” 4.96 N,7° 8” 49.39 E. The study area as depicted in Figure 1 houses several crude oil storage facilities in varying shapes and sizes besides other oil and gas facilities.
Scope of the work The scope of this work involves the deployment of contemporary laser scan equipment for scanning of crude oil tank 18 and show the processes involved from the in-situ checks to modelling. This is in addition to the conventional method (that is use of total station and level equipment) for subsidence monitoring of the same crude oil tank. The outputs of the two systems were reviewed both spatially and in 3-D for the laser scan, in order to generate the verticality, overlity and subsidence displacement from the two systems spatial and model output.
CONCEPTUAL REVIEW
The principles of light detection and ranging (Lidar) operation in typical mapping operations
The principles of LIDAR are quite simple; in explaining these phenomena scientifically, a LIDAR instrument emits a rapid pulse of laser lights at a surface some at 150000 pulses per second. The constant speed of the laser light is known hence the LIDAR instrument can calculate the distance between the source and the target with high accuracy. The distance or range can be computed as follows (Okeke and Moka, 2004; Okeke, 2005; Casu et al., 2016):
R=2
tC
(1) Where, C = speed of light (299792.458 m/s); t=time interval between sending and receiving the pulse(ns), R= Range. For range resolution the following formula is used:
2
tCR
(2) ∆R= Range resolution, ∆t= Change in time. To calculate laser pulse travel time,
C
Rt
2
(3) To compute for a continuous wave laser range distance r and range
resolution R ,

252 Afr. J. Environ. Sci. Technol.
Figure 1. Aerial view of the study area. Source: Google Earth Map (2018).
f
CR
22
f
CR
22
(4a,b)
Where, C =speed of light (299792458 m/s), =phase,=Phase resolution (radian), f=frequency or number of wave cycles per unit time.
From Equations 1.0 to 4a and b it can be computed that the continuous wave range and repeating it in rapid succession, the instrument builds up a large collection of data of the object. In computing for pulses, the coordinate position, the orientation and location of the scanner gotten from the GPS and Inertia Measuring Unit (IMU), the angle of the scan mirror and the range distance to the object are easily derivable. The collection of points in coordinate format is referred to as point cloud. The principles of total station operations
The total station is an instrument that combines both angle and distance measurement in the same system. The total station can measure slope distances as well as bearings. The slope distance with deduced horizontal angles and vertical angles is used to derive the horizontal distances and heights or depth of an object. Total stations are configured to carry out many survey tasks which also includes the storage of large set of data. The total station distance measurement is accomplished by the use of electromagnetic wave or a pulse. The electromagnetic wave passes through the atmosphere from the instrument to hit the target which usually reflect and return back to the instrument. Some total stations could operate as a reflectorless but the distances measured can use either the phase shift or the pulsed laser method. The simplest representation of the electromagnetic wave is the periodic sinusoidal wave motion which has its wavelength, frequency, speed and amplitude. These elements are used to estimate the distances, (Karl, 2004). For the pulse laser method, a pulse is derived from an
infra-red or visible laser diode which is transmitted through a telescope towards a remote end which is reflected to the instrument. For both cases, the mathematical relationship remains the same and is given as in Equation 5. 2D= Vt (5) Where, D =distance; V =velocity of pulse; t=time taken to and from the target. To compute for the partial horizontal and vertical distances in the total station it uses the in-built software using the following formula as expressed in Equations 6 and 6.
Horizontal Distance (HD)= LCos or LSin (6)
Also, the Vertical Distance VD= LSin or LSin (6)
Where = vertical angle and = Zenith angle.
The total station accuracy is expressed as (a mm + b ppm). The a mm is an independent errors source that could be due to the unwanted errors caused by the total station internal components which could be errors in phase and transit time measurement. Similarly, b is the error expressed in part per million.
Methodology The principles of the methodology will stem from traversing and differential levelling (that is Classical) and high definition survey methods based on laser scanning (that is modern). The fundamental principles of controls were deployed which include the establishment of six (6) GPS points within the Tank farm. This was followed by the extension of the control points to all the nine (9) tanks to be monitored with the aid of a Total Station and a Digital

Hart and Udeh 253
Table 1. Specimen of the result of the terrestrial in-situ Checks.
Activity Pillars Values computed Observed Value Difference
Angle check GPS-CP1GPS-CP2 GPS-CP3 89˚ 26’ 48” 89˚ 26’45” -00 00’ 03”
Distance Check GPS-CP2-GPS-CP1GPS-CP2- GPS-CP3 487.373 m 487.394 m -0.021 m
Elevation BONGPS4- BONGPS5 3.923 m 3.8966 m 0.026 m
Figure 2. Scan view of an oil storage tank (Hart et al., 2018).
level instrument however, crude oil storage tank 18 was reviewed in this research. This process indicates deviations axially horizontally and vertically over a period of time in the event of loading or changes in the earth crust (Hart et al., 2018). The tank settlement surveys: subsidence, ovality and verticality were all based on the extension control points. The reference stations were set at BONGPS6. Position was then translocated to GPS-CP1 to CP6. The results of the in-situ process for control check as shown in Table 1 shows that the differences are within allowable limits for the use of the control stations.
Conventional approach-field procedure Traversing was carried out using LEICA Total Station and was done in loops. This comprises three loops on the tank at three levels of the oil contents: low, middle and full levels. The traverse was based on the GPS points: GPSCP1, GPSCP2, GPSCP3, GPSCP4, GPSCP5 and GPSCP 6: and GPS extension controls around each tank. The tanks were marked 5m off the ground base at equal intervals. With the use of reflectorless total station the marked points at the base were bisected and tracked and its corresponding top of the tank was also tracked. Similarly, differential levelling was carried out using digital level which reads to four decimal places. The level was based on GPS pillars: BONGPS04 and BONGPS05 that proved in-situ and was extended to the tank site. The level was carried out on the already existing studs around the tanks. The level was done in two (2) loops-morning and evening at each oil level content of the tanks. That gave a total of six loops for each of the
nine tanks and a ground total of 54 loops for the nine tanks. Adjustments of the traversing and levelling data were classical carried out to guide the processing and analysis. High definition survey approach The Leica Scan station C10 was deployed for this research. The crude oil tank was scanned from six vantage positions to cover and create an overlap as shown in Figure 2. A total of six scanworld was generated. According to Ezeomedo et al. (2017), they described a scan world as a single scan or collection of scans which are aligned to a common coordinate system. It also contains control spaces and model spaces. The control spaces usually carry the constraint information that is used for the registration of multiple scans. Also, the model space contains information from the database that has been modelled (Hirt, 2015). During the scanning, a combination of the different scanning methods like the known back station, the resection method and the intersection methods were used depending on the setup method most suitable at the station. The data output from the exercise which is known as the point cloud are very dense such that current scanners can collect anywhere between 200 and 10000 points per second (Francis et al., 2018).
RESULTS The vertical check in Table 2 using the total station

254 Afr. J. Environ. Sci. Technol.
Table 2. Specimen of average vertical check with the total station.
Studs Decimal of Deg. Deg Min Sec
Stud1 0.088 00° 17' 11"
Stud6 0.084 00° 13' 45"
Stud7 0.082 00° 13' 45"
Stud12 0.017 00° 03' 26"
Stud17 0.016 00° 03' 26"
Table 3. Specimen of mean displacement of tank 18.
Studs Tank18
Radial length Mean radial length Radial displacement
S1 33.674 33.585 0.089
S2 33.715 33.585 0.130
S3 33.677 33.585 0.092
S4 33.632 33.585 0.047
S5 33.588 33.585 0.003
S6 33.574 33.585 -0.011
Radial displacement ranged from 2 t0 130 mm.
Figure 3. Radial displacement configuration of tank 18.
showed a maximum deviation of 17’ 11” on stud 1 with minimum deviation of 3’ 26” on studs 12 and 17. Similarly, the mean radial displacement as shown in Table 3 ranges from 2 to 130 mm and graphically demonstrated in Figure 3. In another vein, Table 4 describes the mean deviation of load variation viz. 2.4000, 10.7000 and 15.5000 m of tank level.
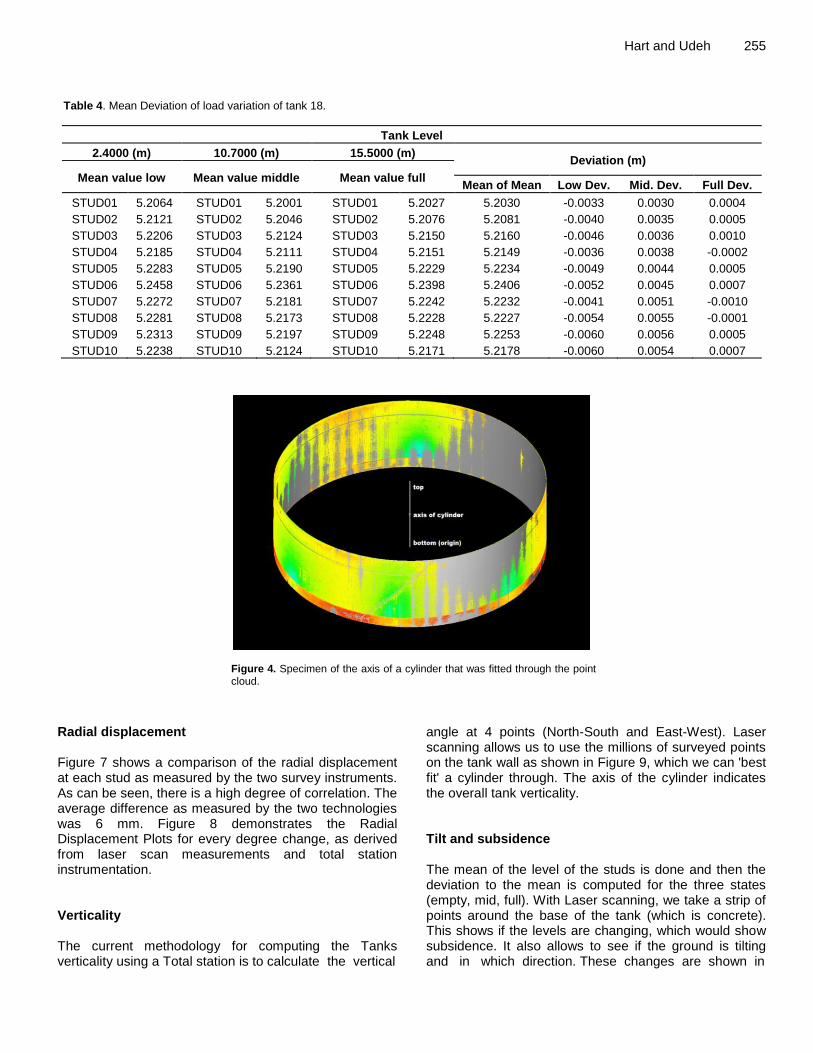
Figure 4, depicts the axis of a cylinder that was fitted through the point cloud and the statistics showing the fit quality can be seen in the fit quality Table 5. The axis of
the cylinder when empty is shown in the image. Table 6 describes the statistical information on the
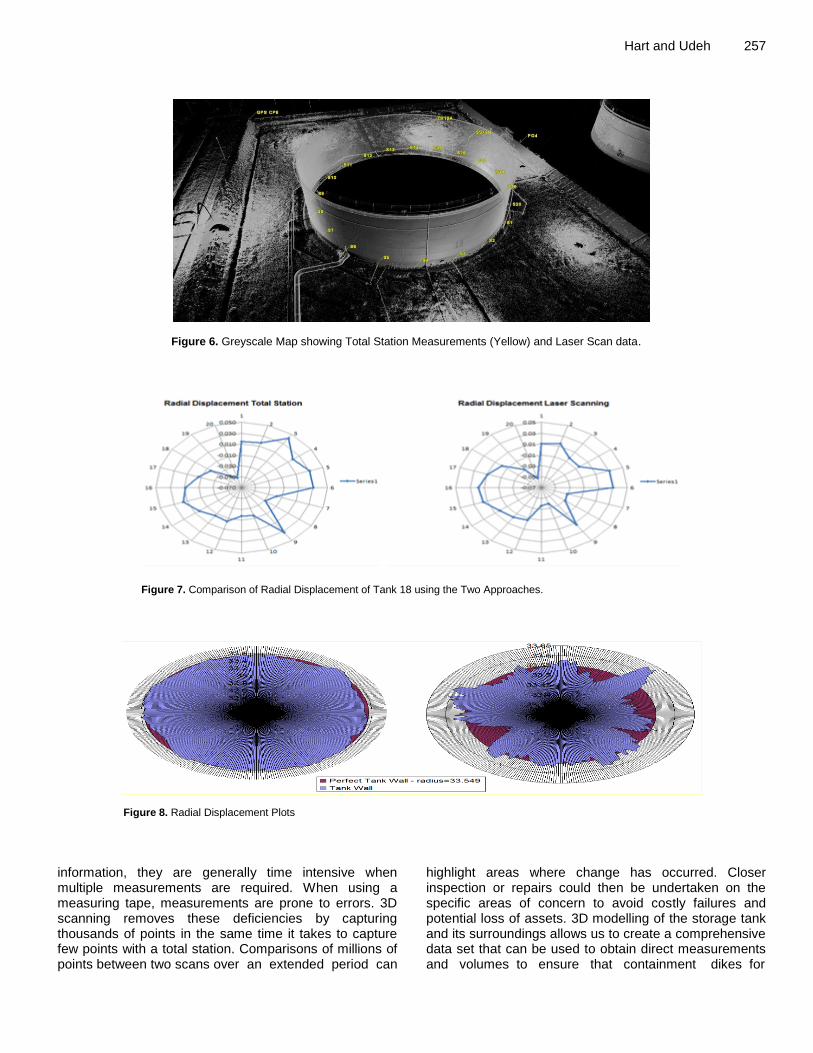
variability of the various levels of oil in the storage tank 18 as deployed by the scan models as shown in Figure 5 indicating the deviation as a function of the variation of the content level in tank 18. In the same vein, Figure 6 highlights the combination of the points of measurement using the classical (total station) and laser scan (high definition) techniques. The differentiation is in the colouration and markings.
-0.15
-0.1
-0.05
0
0.05
0.1
0.15S1
S2S3
S4
S5
S6
S7
S8
S9
S10S11
S12S13
S14
S15
S16
S17
S18
S19
S20
S21S22
Series1
Hart and Udeh 255 Table 4. Mean Deviation of load variation of tank 18.
Tank Level
2.4000 (m) 10.7000 (m) 15.5000 (m) Deviation (m)
Mean value low Mean value middle Mean value full Mean of Mean Low Dev. Mid. Dev. Full Dev.
STUD01 5.2064 STUD01 5.2001 STUD01 5.2027 5.2030 -0.0033 0.0030 0.0004
STUD02 5.2121 STUD02 5.2046 STUD02 5.2076 5.2081 -0.0040 0.0035 0.0005
STUD03 5.2206 STUD03 5.2124 STUD03 5.2150 5.2160 -0.0046 0.0036 0.0010
STUD04 5.2185 STUD04 5.2111 STUD04 5.2151 5.2149 -0.0036 0.0038 -0.0002
STUD05 5.2283 STUD05 5.2190 STUD05 5.2229 5.2234 -0.0049 0.0044 0.0005
STUD06 5.2458 STUD06 5.2361 STUD06 5.2398 5.2406 -0.0052 0.0045 0.0007
STUD07 5.2272 STUD07 5.2181 STUD07 5.2242 5.2232 -0.0041 0.0051 -0.0010
STUD08 5.2281 STUD08 5.2173 STUD08 5.2228 5.2227 -0.0054 0.0055 -0.0001
STUD09 5.2313 STUD09 5.2197 STUD09 5.2248 5.2253 -0.0060 0.0056 0.0005
STUD10 5.2238 STUD10 5.2124 STUD10 5.2171 5.2178 -0.0060 0.0054 0.0007
Figure 4. Specimen of the axis of a cylinder that was fitted through the point cloud.
Radial displacement Figure 7 shows a comparison of the radial displacement at each stud as measured by the two survey instruments. As can be seen, there is a high degree of correlation. The average difference as measured by the two technologies was 6 mm. Figure 8 demonstrates the Radial Displacement Plots for every degree change, as derived from laser scan measurements and total station instrumentation. Verticality The current methodology for computing the Tanks verticality using a Total station is to calculate the vertical
angle at 4 points (North-South and East-West). Laser scanning allows us to use the millions of surveyed points on the tank wall as shown in Figure 9, which we can 'best fit' a cylinder through. The axis of the cylinder indicates the overall tank verticality. Tilt and subsidence The mean of the level of the studs is done and then the deviation to the mean is computed for the three states (empty, mid, full). With Laser scanning, we take a strip of points around the base of the tank (which is concrete). This shows if the levels are changing, which would show subsidence. It also allows to see if the ground is tilting and in which direction. These changes are shown in

256 Afr. J. Environ. Sci. Technol.
Table 5. Overall Verticality Report Tank 18.
Empty X Y Z
Origin 522475.342 47591.862 4.902 DX* DY*
Top 522475.359 47591.831 22.807 0.017 -0.031
Dia= 67.086
Axis = (0.0010, -0.0017, 1.0000) **
Med X Y Z
Origin 522475.343 47591.860 4.906 DX* DY*
Top 522475.356 47591.843 22.738 0.013 -0.017
Dia= 67.099
Axis = (0.0007, -0.0009, 1.0000) **
Full X Y Z
Origin 522475.341 47591.862 5.008 DX* DY*
Top 522475.352 47591.846 22.699 0.011 -0.016
Dia= 67.107
Axis = (0.0007, -0.0009, 1.0000) **
Table 6. Statistical Information on Oil Level Variation of Tank 18 using the Scan Models.
Empty Mid Full
Derived from cloud with 3567898 points Derived from cloud with 3750056 points Derived from cloud with 2515332 points
Fit Quality
Error Mean = 0.000 m Error Mean = 0.000 m Error Mean = 0.001 m
Error Std Deviation = 0.045 m Error Std Deviation = 0.045 m Error Std Deviation = 0.043 m
Absolute Error Mean = 0.038 m Absolute Error Mean = 0.037 m Absolute Error Mean = 0.036 m
Maximum Absolute Error = 0.156 m Maximum Absolute Error = 0.155 m Maximum Absolute Error = 0.158 m
Figure 5. Subsidence deviation of tank 18 at three oil content levels.
Figure 10. CONCLUSION Laser scanning facilitates a comprehensive analysis of
storage tanks. Scanning allows us to monitor the entire tank shell for deformation rather than by the conventional surveying approach with a limited number of discrete points. Traditionally, storage tank survey is carried out using a total station or a simple measuring tape. While these techniques provide the necessary position
LOW DEV.-0.0200
0.0000
0.0200
DEV
IATI
ON
STUD01
STUD02
STUD03
STUD04
STUD05
STUD06
STUD07
STUD08
STUD09
STUD10
STUD11
STUD12
STUD13
STUD14
STUD15
STUD16
STUD17
STUD18
STUD19
STUD20
STUD21
STUD22
LOW DEV. -0. -0. -0. -0. -0. -0. -0. -0. -0. -0. -0. -0. -0. -0. -0. -0. -0. -0. -0. -0. -0. -0.
MID. DEV. 0.0 0.0 0.0 0.0 0.0 0.0 0.0 0.0 0.0 0.0 0.0 0.0 0.0 0.0 0.0 0.0 0.0 0.0 0.0 0.0 0.0 0.0
FULL DEV. 0.0 0.0 0.0 -0. 0.0 0.0 -0. -0. 0.0 0.0 0.0 0.0 0.0 0.0 0.0 0.0 0.0 0.0 0.0 0.0 0.0 0.0
SUBSIDENCE DEVIATION OF TANK 18 AT THREE OIL CONTENT LEVELS
Hart and Udeh 257
Figure 6. Greyscale Map showing Total Station Measurements (Yellow) and Laser Scan data.
Figure 7. Comparison of Radial Displacement of Tank 18 using the Two Approaches.
Figure 8. Radial Displacement Plots
information, they are generally time intensive when multiple measurements are required. When using a measuring tape, measurements are prone to errors. 3D scanning removes these deficiencies by capturing thousands of points in the same time it takes to capture few points with a total station. Comparisons of millions of points between two scans over an extended period can
highlight areas where change has occurred. Closer inspection or repairs could then be undertaken on the specific areas of concern to avoid costly failures and potential loss of assets. 3D modelling of the storage tank and its surroundings allows us to create a comprehensive data set that can be used to obtain direct measurements and volumes to ensure that containment dikes for

258 Afr. J. Environ. Sci. Technol.
Figure 9. Image Cylinder fit through Laser Data.
Figure 10. Verticality check for subsidence measurement.
example, satisfy regulatory requirements. Areas of potential concern or failure can be quickly identified and quantified to reduce repair time.
CONFLICT OF INTERESTS
The authors have not declared any conflict of interests.
REFERENCES
Casu F, Manunta M, Zinno I (2016). AGU 2015 Training on the SBAS-
DInSAR web tool for Earth surface deformation analysis through the ESA Geohazard Exploitation Platform. Zenodo. http://doi.org/10.5281/zenodo.44624 (last accessed October 2017).
Crosetto M, Crippa B, Biescas E (2005). Early Detection and In-depth Analysis of Deformation by Radainterferometry. Engineering Geology 79:81-91.
.
End Point 1 = (522743.432, 47543.056, 4.755) m
End Point 2 = (522743.431, 47543.061, 22.794) m
Origin = (522743.432, 47543.056, 4.755) m
Axis = (-0.0001, 0.0005, 0.0000)
Diameter = 67.098 m
Derived from cloud with 4265818 points

Ezeomedo IC, Anukwonke CC, Ono MN (2017). Space Science and
Technologies in Environmental Geodesy. A paper presented at the Nigeria Association of Geodesy General Assemble/Scientific Conference, Garden City 2017, Port Harcourt, Rivers State.
Francis IO, Nosa OA, Hart L (2018). Land Subsidence Mapping and Monitoring of Part of Niger Delta Region of Nigeria Using SBAS-DInSar Technique within the ESA Geohazard Exploitation Platform (GEP). Nigerian Journal of Geodesy 2(2):75-85.
Hirt C (2015). Digital Terrain Models. In: Encyclopedia of Geodesy (Ed. E.W. Grafarend), Springer, Berlin, Heidelberg.
Hart L, Oba T, Babalola A (2019). Geometric and Dynamic Application of Satellite Geodesy in Environmental Mapping: A Conceptual Review. Nigerian Journal of Environmental Sciences and Technology 3(2):386-397.
Hart L, Udeh K, Oba T (2018). A Comparative Study of the Classical and High Definition Survey Approaches in Subsidence Monitoring of Crude Oil Storage Tanks. A Conference paper presented at the 54th Annual General Meeting (AGM) and Conference of the Nigerian Institution of Surveyors 17th to 21st June, 2019 at Awka, Anambra State.
Hart and Udeh 259 Karl Z (2004). Surveying made Easy. A Monograph of Leica Geosystem
AG, Switzerland. Okeke FI, Moka EC (2004). "Detection and Monitoring of Land
Subsidence caused by anthropogenic activities in Nigeria (Niger Delta) using InSAR Technique, Proceedings of the Nigerian Institution of Surveyors AGM, Conference, May 2004, Port Harcourt, Nigeria.
Okeke FI (2005). “Application of InSAR Techniques for Topographic Mapping and Earth Surface Deformation Monitoring for Nigeria”, Nigerian Journal of Space Research 1(1):175-199.