an appraisal of camel rating system as a measure of performance in unity bank plc
DESCRIPTION
camels ratingTRANSCRIPT

AN APPRAISAL OF CAMEL RATING SYSTEM AS A MEASURE OF
PERFORMANCE IN UNITY BANK PLC
BY
MAHMOOD, Mohammed Musa MBA/ADMIN/42523/2004-05
(G04BAMP7106)
BEING A PROJECT SUBMITTED TO THE POST GRADUATE SCHOOL OF AHMADU BELLO UNIVERSITY, ZARIA IN PARTIAL
FULFILMENT OF THE REQUIREMENTS FOR THE AWARD OF THE DEGREE OF MASTERS OF BUSINESS ADMINISTRATION (MBA).
DEPARTMENT OF BUSINESS ADMINISTRATION, FACULTY OF ADMINISTRATION, AHMADU BELLO UNIVERSITY
OCTOBER, 2006

ii
DEDICATION
All praises due to Allah the lord of the world, and to the loving memory of my
late father Alhaji Musa B. Mahmood (Ndejin Lapai) and to all those who are God
fearing.
Lastly, this work is dedicated to my immediate family.

iii
CERTIFICATION
This is to certify that this project titled “An Appraisal of CAMEL rating system
as a measure of Performance, a case study of Unity Bank”. Written by Mahmood,
Mohammed Musa meets the partial regulations governing the award of the
degree of Master of Business Administration (MBA) of Ahmadu Bello
University, Zaria and it is therefore approved for its contributions to knowledge,
and literary presentation.
Dr/Mal/Mr/Mrs.
Chairman, Supervisory Committee Signature Date
Head of Department Signature Date
External Examiner Signature Date
Dean Postgraduate School Signature Date

iv
ACKNOWLEDGEMENT
All praises be to Allah for HIS constant guide and unflinching support during the
course of this course and always.
The saying that NO MAN IS AN ISLAND has made it mandatory not end this
work without sending my profound appreciation to some people for their support
and understanding all through.
First is my major project supervisor in the person of Mallam S. M. Gegu for his
too numerous to mention support and understanding. Then to my friends and
course mates, Mallam Abdul Garba, Mallam Abdurrahman Abdullahi, Mustapha
A. Yarima, Mallam Musa Mohammed Kandi for all the materials he provided fir
this work. The Asst. Area Manager Unity Bank, Minna for his time and ideas.
Mallam Garba Ilya Gindiri for all the materials he provided.
My special gratitude goes the followings, Alh. Abubakar Gimba (OFR), Alh.
Muhammad Maude Lapai (Madamin Lapai), and to my wonderful and able
brother Alh. Sani Mahmood, my sister Haj. Hassana Musa, Malama Amina
Musa, and also to all the ladies and gentlemen of the MBA Class P/T
(2004/2005). In fact, they are a wonderful lot that cannot be forgotten in a jiffy.
Finally, I pray that the Good Lord reward all my lecturers and course coordinator
and all those who contributed directly or indirectly to making this MBA
Programme a reality. I shall forever remain indebted.
Thanks,

v
DECLARATION
I declare that the work in the project entitled an appraisal of CAMEL rating
system as a measure of Bank performance, a case study of Unity Bank has been
performed by me in the Department of Business Administration. The information
derived from the literature has been duly acknowledged by me in the text and a
list of reference provided. No part of this project was previously presented for
another degree or diploma at any university.
.
Musa M. Mahmood Name of Student Signature Date

vi
TABLE OF CONTENTS
Title page ..................................................................................................... i
Dedication .................................................................................................... ii
Certification / approval page ......................................................................... iii
Acknowledgement ........................................................................................ iv
Declaration ................................................................................................... v
Table of contents .......................................................................................... vi
Abstract ........................................................................................................ viii
CHAPTER ONE: Background of the study
1.1 Introduction ....................................................................................... 1
1.2 Statement of the research problems .................................................... 2
1.3 Objective of the study ........................................................................ 2
1.4 Significance o the study ..................................................................... 3
1.5 Formulation of hypothesis ................................................................. 4
1.6 Scope of the study.............................................................................. 4
1.7 Limitation of the study ....................................................................... 5
CHAPTER TWO: Literature review
2.1 Introduction ....................................................................................... 7
2.2 Concept of Camel rating system ....................................................... 8
2.3 Valuation factors and weight ............................................................. 11
2.4 How to calculate the Composite rating ............................................... 19
2.5 Other Judgmental factors ................................................................... 20

vii
2.6 Compliance with laws and regulations ............................................... 21
CHAPTER THREE: Research methodology
3.1 Introduction ...................................................................................... 23
3.2 Research methods .............................................................................. 23
3.3 Population of the study ...................................................................... 23
3.4 Methods of data collection ................................................................. 24
3.5 Instruments used ................................................................................ 25
3.6 Sampling method ............................................................................... 25
3.7 Profile of the case study ..................................................................... 26
CHAPTER FOUR: Data Presentation and Analysis
4.1 Introduction ....................................................................................... 29
4.2 Data Presentation and Analysis .......................................................... 29
4.3 Test of hypothesis .............................................................................. 50
4.4 Findings ............................................................................................. 55
CHAPTER FIVE: Summary, conclusion and recommendation
5.1 Summary ........................................................................................... 57
5.2 Conclusion ......................................................................................... 58
5.3 Recommendation ............................................................................... 59
Bibliography................................................................................................. 60
Appendix ..................................................................................................... 62

viii
ABSTRACT
The research attempts an appraisal of CAMEL rating system as a measure of
Bank performance with Unity Bank as the fulcrum of the study over the periods
of 2005 – 2006 i.e. the post consolidation era. However, since the CAMEL rating
system as a tool to be used for measuring bank performance was not widely
understood hence the need to set an objective of appraising the performance of
unity bank The study will go on to formulate some hypothesis to determine the
viability of the CAMEL rating system as a tool .In the course of which the
method of survey research shall be used with the population as unity bank and
the sample population to be selected at random among the banks that made up the
unity bank.
Also in carrying out the research both the primary and secondary sources of data
will be used .After which the data gathered will be presented and analysed such
that it shall be found as to the state of viability of both the unity bank and the
goodness of fit of the CAMEL rating system as a tool for measuring bank
performance .The statistical tool chi-square shall be used to prove the hypothesis
earlier formed to be able to conclude as to the viability of the CAMEL rating
system and whether or not it will be further recommended for use as a good tool
for measuring bank performance.
The choice of Unity Bank was to allow for a fair comparison using the
judgemental factors for the CAMEL Rating System to actually show the
performance of the bank over the period.

1
CHAPTER ONE: BACKGROUND OF THE STUDY
INTRODUCTION
The landscape of the Nigerian banking industry has been characterized by the
need to strengthen the institutions and enhance their performance and
developmental role in the economy. As key institution in the financial
intermediation process, the banks are supposed to play a critical role in the
mobilization of fund and the creation of wealth.
However, it became apparent that most banks can not sufficiently mobilize
international and domestic capital for the development of investment especially
in the oil and gas sector which is the backbone of the economy, and are not
resident to shocks within the financial system.
At the point by which the distress signals became apparent at the doors of some
banks, Unity bank inclusive there has been dwindling confidence in the banking
system. This further aggravated by the high interest rates charged by banks,
emphasis on short term tendering to the neglect of manufacturing, agriculture and
other capital intensive projects.
The above scenario requires drastic actions if the banking system was to properly
play its role as a catalyst to development. The prevailing situation in the industry
is more or less a caricature of the system.

2
The financial sector of the Nigerian economy needs to be very prudent in its
business dealing in order to reduce, if not to totally eradicate cases of bank
distress and also to meet the difficulties posed by changing environment like
government regulations, needs of customers, competition, economic conditions
and technological advancements.
This research work attempts to look at an appraisal of the CAMEL rating system
as a measure of bank performance, the case of Unity Bank as basis for the study.
1.1 STATEMENT OF THE RESEARCH PROBLEM
There is that problem of the viability of the CAMEL rating system in assessing
the performance of the banks. The banking sector of the country’s economy faces
a lot of crises. Most banks went through thick and thin of the bank distress years.
Many banks were liquidated; this was a result of many factors ranging from non-
compliance with laws and regulations guiding banking operations in Nigeria.
Mismanagement of fund by the Board of Directors or Management of those Bank
and perhaps inadequate supervision by the apex bank i.e. the Central Bank of
Nigeria (CBN). Hence the fear of investing in banks became paramount in
people’s mind. And the need to determine how well is this CAMEL rating system
as a tool for measuring bank performance. These problems raised necessitate this
study of an appraisal of CAMEL rating System as a measure of bank
performance in Nigeria.

3
1.2 OBJECTIVE OF THE STUDY
Every phenomenon has its aims and objective. The objective of this study is to
appraise the performance of Unity Bank using the CAMEL Rating system, with
reference to the years under review i.e. 2005 – 2006, the post-consolidation era.
Also, to be able to determine the goodness of fit of the CAMEL rating system as
a tool for measuring bank performance. This is because not too many people
understand the tool.
1.3 SIGNIFICANCE OF THE STUDY
An attempt to know the state of healthiness of the bank would only be complete
if only the viability of the CAMEL rating system as a tool for such appraisal is
determined. Hence, it is of significance to measure the performance of the bank
under review and as well determine the goodness of the tool used for measuring
such performance.
Most importantly, the rating system is not to be used by banks supervisor in
appraising the performance of banks only it can be used by other parties as well.
These parties include, trade creditors, employees, bondholders, shareholders,
government and current and potential investors and the king’ i.e. the customers of
the bank.
1.4 FORMULATION OF HYPOTHESIS
The study would be anchored on some formulated hypothesis to be validated or
otherwise. The researcher would attempt to prove the null (Ho) and the
alternative (Ha) hypothesis using the statistical tools so as to be able to determine

4
the goodness of fit between the composite tool (CAMEL Rating System) and the
performance of Unity Bank.
The hypotheses are as follows:
Ho The CAMEL Rating System is not a good tool for measuring the
performance of Unity Bank.
Ha The CAMEL Rating System is a good tool for measuring the
performance of Unity Bank.
1.5 SCOPE OF THE STUDY
The study would be confined to Unity Bank and the CAMEL Rating System
would be used to appraise, analyse and interpret the activities, conditions and
performance of Unity Bank over the pre-consolidation period of 1999 – 2003.
The Unity Bank has nine banks coming together in consolidation. Most of the
data used would come from the randomly selected three among the nine i.e. Bank
of the North, Intercity Bank and First Interstate. The analysis would be on yearly
basis. Subsequently, comparison of the result would be made over the period
under review between the banks that make up the group.
The published financial statements for the banks would be used for the period
under review to anchor the analysis.
Lastly, the study would be conducted using qualitative and quantitative
approaches of evaluating the factors that actually affect the condition and
development of the bank. The qualitative approach would be undertaken by

5
evaluating Capital Adequacy, Assets Quality, Management Earning & Liquidity
(CAMEL parameters).
While the qualitative approach would consider the factors like, the compliance
with law and regulations, and other fundamental judgmental factors.
1.6 LIMITATIONS OF THE STUDY
There is the need to categorically highlight as one of the limitation of this piece
of work as to the problems of adequate kinds of data necessary for a work of this
magnitude, this is because of the information gathered are necessarily limited to
those made available by the authority and individuals concerned especially as far
as the required statistics are concerned.
Another source of limitation of this piece of work can not be unrelated to bias as
a human factor. As some people contacted in the cause of this work felt reluctant
to allow me access to some vital information for this research work being the
kind of corporate bodies they are.
Then also, the problems of lack of much publication relating to the CAMEL
Rating System of appraising or measuring bank performance.
However, the data collected from both primary and secondary sources were
sufficient for the study to envisage the importance of bank rating system used by
bank supervisors in the appraising of performance of Banks in Nigeria with a
view of making the necessary and appropriate recommendations.

6
Also, came the most piercing constraints finance which did hindered the
smoothness required during the journey’s of gathering the needed materials for
this research.
Finally, the constraints of natural imperfection as no expert and no novice.

7
CHAPTER TWO: LITERATURE REVIEW
INTRODUCTION:
The banking system has been designed such that banking supervisors use the
bank rating system in the evaluation and appraisal of banks. It serves as an “early
warning signals” to help detect emerging problems of banks. The rating system
provides a more scientific basis for supervisory actions such as preliminary
management discussions and priority schedule of on-site examinations. It is a
qualitative and quantitative approach of evaluating the factors that materially
affect the condition and development of banks. The quantitative approach is
undertaken by evaluating Capital Adequacy, Asset Quality, Management,
Earnings and Liquidity (CAMEL) parameters. While qualitative factors that are
suppose to be considered are the compliance with laws and regulations and other
fundamental factors.
However, in evaluating the CAMEL parameters, weight has been allocated to
each parameter as would be shown subsequently in this chapter. Each parameter
has been subdivided into components (or ratios) and credit point assigned based
on the comprehensiveness of the ratio as a measure of the parameter. The
procedure for measuring or evaluating each of the parameters would be shown.
Then also, a composite rating of all the parameters would also be worked out,
such that it will determine whether a bank is to be rated as either very sound,
satisfactory, marginal or unsound. A bank rating could be reduced from “sound”
to unsound” if certain judgemental factors observed so dictates. This would also
be shown in this chapter. It is expected that rating would permit the appraisal and

8
evaluating of a banks, current conditions, and its performance trend over a
period.
Basically, this chapter is out to explain the valuation factors and procedures,
composite rating and judgemental factors.
2.1 CONCEPTS OF CAMELS RATING SYSTEM
According Sani (2006), the financial failures in banks and other financial
institutions is said to occur when the banks or financial institution is unable to
meet its obligation to its customers, the owners as well as the economy. Such
obligations are usually used to test on the financial operational and managerial
conditions of the institution. This is so because inability often results from
weakness in these key areas which could render the institutions illiquid or
completely insolvent. The situation could even degenerate into bankruptcy that is
a condition where the value of total liabilities exceeds the value of total assets.
In the light of the foregoing and in order to determine the state of financial health
of banks and other financial institutions an effective composite index based on
the acronym CAMELS was developed. The composite index is simply the
weighted average of CAMELS parameters in which:
C = Capital Adequacy: The capital should be able to support
the liability the firm is carrying.

9
A = Asset quality: The proportion of performing assets to
non-performing assets should be good
enough to determine the assets quality
M = Management competency: The quality of the management team of
the bank / institution in terms of their
qualification, experience, skills and
their performance in relation to other
parameters within the CAMELS should
be of high standard.
E = Earning Power or Earning’s ability: The level of earnings should be
able to justify the size of
investment.
L = Liquidity sufficiency: This has to do with the ability to meet
up or run its operations. That is,
sufficient cash to meet customers
demand as and when required.
: Ability of the bank or financial
institution to meet all other obligations
especially those of short term.
The weighted parameter of the CAMEL index adds (sum) up to unity as
follows:
C = Capital Adequacy: 25%
A = Asset quality: 25%
10
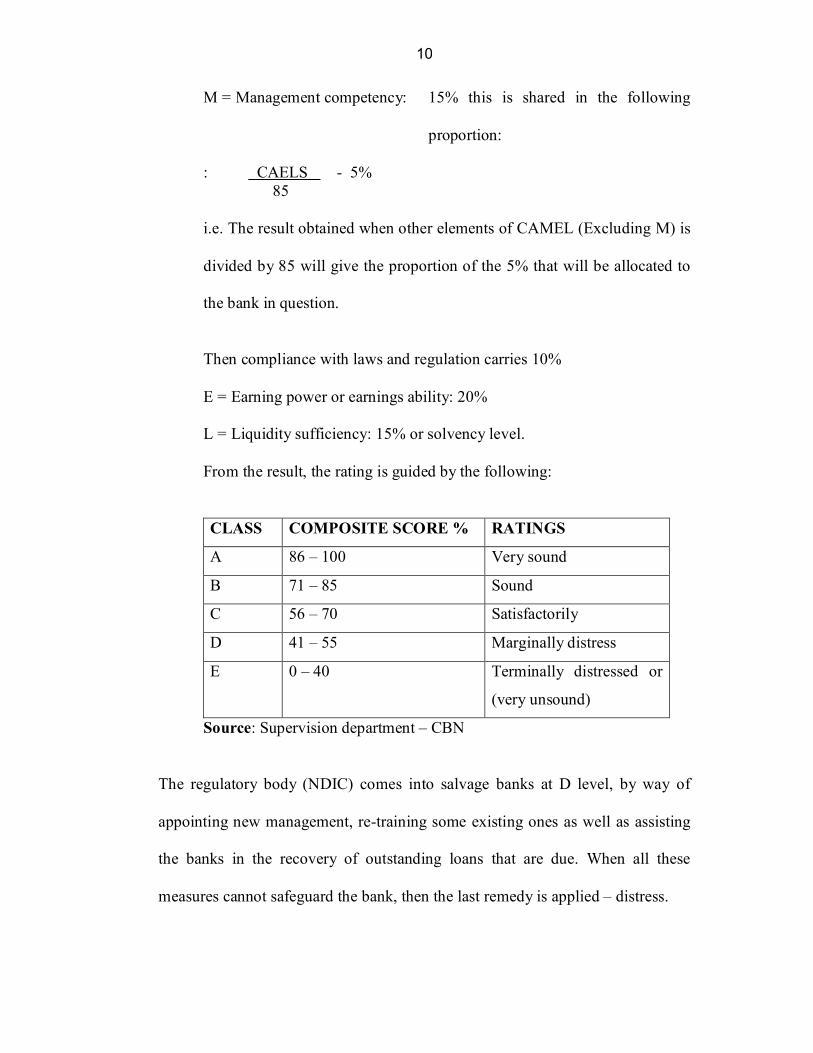
M = Management competency: 15% this is shared in the following
proportion:
: CAELS - 5% 85
i.e. The result obtained when other elements of CAMEL (Excluding M) is
divided by 85 will give the proportion of the 5% that will be allocated to
the bank in question.
Then compliance with laws and regulation carries 10%
E = Earning power or earnings ability: 20%
L = Liquidity sufficiency: 15% or solvency level.
From the result, the rating is guided by the following:
CLASS COMPOSITE SCORE % RATINGS
A 86 – 100 Very sound
B 71 – 85 Sound
C 56 – 70 Satisfactorily
D 41 – 55 Marginally distress
E 0 – 40 Terminally distressed or
(very unsound)
Source: Supervision department – CBN
The regulatory body (NDIC) comes into salvage banks at D level, by way of
appointing new management, re-training some existing ones as well as assisting
the banks in the recovery of outstanding loans that are due. When all these
measures cannot safeguard the bank, then the last remedy is applied – distress.

11
It is also pertinent to mention here that according to international standard a
banking industry is considered to be healthy when nearly all the banks in the
system are profitable and their non-performing loans constitute less than 2% of
the total assets.
On the other hand, a banking industry is considered to be in systemic (total)
distress when up to 20% or more of all the banks operating in it are technically
insolvent and have up to 25% of their assets under the non-performing category.
2.2 VALUATION FACTORS AND WEIGHT:
Inferring from the introduction, the rating of a bank is mainly assessed through
evaluation of factors considered to have material impact on the condition of
banks. The factors and components recommended are given weights
commensurate with their impact on the condition of the bank. The recommended
weight allocation is as shown below:
S/n Factor Component Component weight %
Total weight %
1 Capital A Capital to risk weighted assets ratio 15
25 B Adjusted capital ratio 5 C Capital growth rate 5 2 Asset quality A Non performing risk
assets to total risk assets
15
25 B Reserves for losses to
non performing risk assets
5
C Non performing risk assets to capital and reserves
5

12
S/n Factor Component Component weight %
Total weight %
3 Management A CAELS
85 5 15 B Compliance with laws
and regulations. 10
4. Earnings A Profit after tax to total
assets 5
20
B Total expenses to total income 5
C Net interest income to total earning assets. 5
D Interest expenses to total earning assets 5
5. Liquidity A Liquidity ratio 10
15 B Net loans and advances to total deposit
5
TOTAL 100 Source: Supervision Department CBN.
APPRAISAL PROCEDURES
1. EVALUATION OF CAPITAL:
This is evaluated base on the minimum required capital to risk weight assets
ratio, adjusted capital ratio and capital growth rate.
a. Capital to risk weighted asset ratio:
If the capital to risk weighted assets ratio is zero or negative, then
the credit point is zero. If the ratio is greater than or equals to 16%
the credit point are 100.
If the ratio is greater than zero but less than 16%, then the credit
point is prorated uniformly from zero to 100 that is it is computed
as the ratio divided by 0.16. It is pertinent to note that the bank for

13
internal settlement, base, set the minimum standard for capital to
risk weighted assets ratio as 8%. If a bank meets this standard it is
given 50 credit points since what it achieved is only minimum
desired ratio. Hence by allocating points uniformly 16% attracts
100 points.
b. Adjusted capital ratio:
This is the most popular measure of capital adequacy before the
adoption of capital to risk weighted ratio. It is a letter measure of
over trading by banks in comparison with the capital ratio, hence it
complements it. The standard adjusted capital ratio for the period
under review as contained in the monetary policy for that period is
1:10 hence this ratio is regarded as satisfactory.
If the adjusted capital ratio is zero or negative, then the credit point
is zero.
If the ratio is greater than or equal to 20%, then the credit point is
100.
If the ratio is greater than zero but less than 20% then the credit
point is prorated uniformly from zero to 100 that is it is computed
as the ratio divided by 0.20.
c. Capital growth:
This ratio measures the rate at which capital grows or deteriorates.
It should be noted that both the denominator and numerator for this

14
ratio can be positive or negative. Hence, the absolute value of the
denominator is used. This will ensure that a change in shareholders
fund from N240 million to N80 million is not computed as a
deterioration or a change from N4 million to N16 million is not
computed as growth in capital as will obviously result. A proxy for
this ratio which is currently used in the CAMEL programme is to
use total assets as the denominator.
The problem with this ratio is that it can only be computed once a
year, that is, it will be the same throughout an accounting years.
This is because banks appropriate their statutory, general and other
reserve as well as determine their retained earnings only at find is
the denominator, the ratio will be fixed within a year, but if total
assets is used it will change monthly.
Another problem is that a ban that used N20 million shareholders
fund and N8 million depositor’s Fund to earn and certain N20
Million will have a retain of 100% while a bank that used N80
million shareholder’s fund and N20 million depositor’s fund to ease
and certain N40 million will have a ration of 50%, which is
obviously unfair to the latter bank.
The standard for capital growth rate currently being used is 2% for
the period under review. It is pertinent to note that total Assets as
the denominator and only the retained income is used as the

15
numerator. Hence, if retained income, reserves and shareholders
fund are used to compute the ration then a higher standard is
advised. If the capital Growth rate is zero or negative then the
credit point is zero. If the ratio is greater than or equal to 2% then
the credit point is 100. If the ratio is greater than zero but less than
2% then the credit. Point is prorated uniformly from zero to 100,
that is, it is computed as the ratio divided by 0.02.
2. EVALUATION OF ASSETS QUALITY:
We would use 3 ratios for the evaluation of asset quality as thus;
a Ratio of Non – performing Risk Asset to Total Risk Assets:
Although there is no any desirable level of non performing Risk
assets for any bank, as banks can not avoid earning them in reality.
The standard for this ratio should be the maximum that could be
tolerated, going by the condition of the banks in the industry; a
standard maximum ratio of 20% is used. Hence, If the ratio is
greater than 20%, the current point is zero.
b Reserve for losses:
This ratio attempts to measure a bank’s compliance with guidelines
on provision. It can be shown that it is not very suitable for that
purpose. For instance a bank with all of its non performing loans in
the sub-standard category which are fully provided for will have a
ratio of 10% and will be given a credit point of 1.25 in stead pf 100

16
and will be given 100 credit points. If the ratio is greater than or
equals to 80% a credit point of 100 is given. If the ratio is less than
80%, then the credit point is computed as: Ratio divided by 0.8
c Non performance Risk Assets to Adjusted capital:
The non per forming loans and advances, leases, other assets and
off balance sheet engagements as defined by prudential Guidelines
on assets classification. If the adjusted capital is negative then the
credit point is zero, likewise, if the ratio is greater than 100% then
the credit point is zero. If the ratio is greater than zero and less than
100% then the credit point is computed as; 100
3. EVALUATION OF MANAGEMENT:
The quantitative evaluation of management is based on compliance with
rules and regulations and CAEL divided by five. The credit points for
compliance with rules, regulations and guidelines). The rules, regulations
and guidelines are given certain credit points. If a bank does not comply
with any rule, it will loose the credit points allocated to the rules. If a bank
does not still comply even after it has been specifically urged to comply, it
will loose twice the credit points allocated to the rules, regulations and
guidelines contravened.
The credit point for CAEL is computed as the sum of the weighted credit
points fir the Capital, Asset quality, Earnings and Liquidity divided by 85.
17
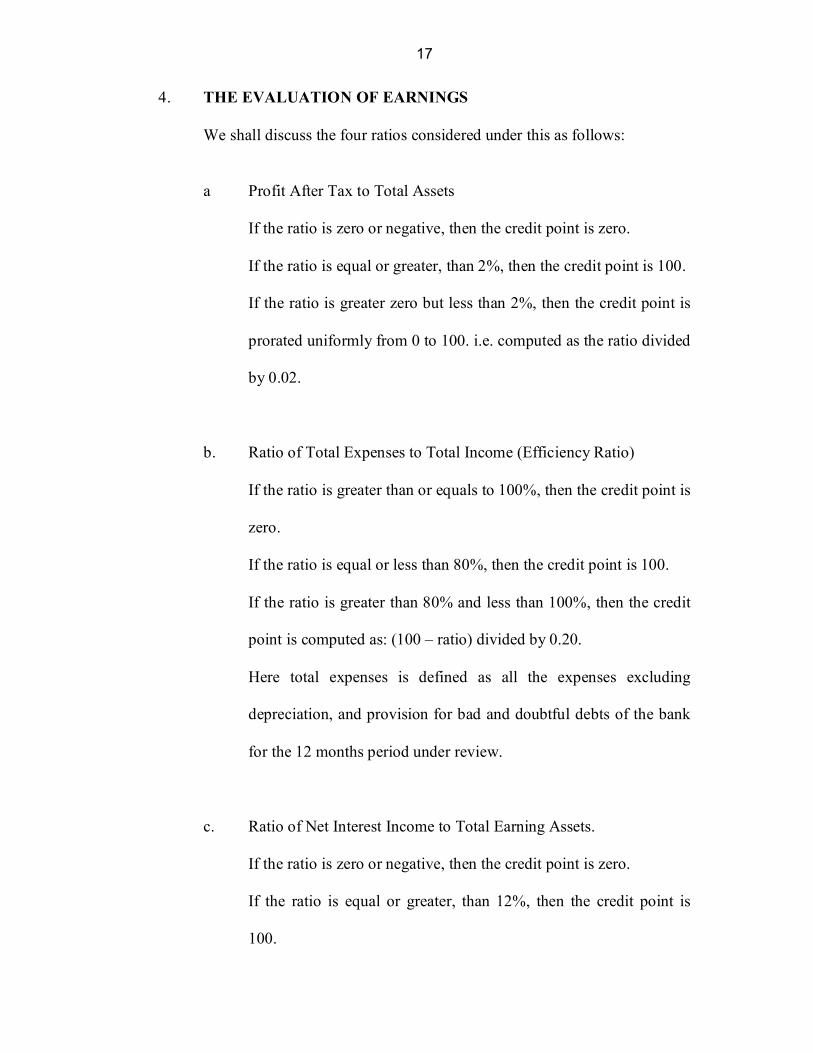
4. THE EVALUATION OF EARNINGS
We shall discuss the four ratios considered under this as follows:
a Profit After Tax to Total Assets
If the ratio is zero or negative, then the credit point is zero.
If the ratio is equal or greater, than 2%, then the credit point is 100.
If the ratio is greater zero but less than 2%, then the credit point is
prorated uniformly from 0 to 100. i.e. computed as the ratio divided
by 0.02.
b. Ratio of Total Expenses to Total Income (Efficiency Ratio)
If the ratio is greater than or equals to 100%, then the credit point is
zero.
If the ratio is equal or less than 80%, then the credit point is 100.
If the ratio is greater than 80% and less than 100%, then the credit
point is computed as: (100 – ratio) divided by 0.20.
Here total expenses is defined as all the expenses excluding
depreciation, and provision for bad and doubtful debts of the bank
for the 12 months period under review.
c. Ratio of Net Interest Income to Total Earning Assets.
If the ratio is zero or negative, then the credit point is zero.
If the ratio is equal or greater, than 12%, then the credit point is
100.

18
If the ratio is greater than zero and less than 2%, then the credit
point is prorated uniformly from 0 to 100. i.e. computed as the ratio
divided by 0.12.
d. Ratio of Interest Expenses to Average Earning Assets
If the ratio is greater than or 24%equal, then the credit point is 0.
If the ratio is less than or 24% then the credit point is computed as:
100 – (Ratio divided by 0.24).
5. THE EVALUATION OF LIQUIDITY
There two ratios of evaluating liquidity:
a. Liquidity
This is per monetary and credit policy guidelines issued by the
Central Bank of Nigeria (CBN)
If the ratio is zero or negative, then the credit point is zero.
If the ratio is greater or equal to 60%, then the credit point is 100.
If the ratio is greater than zero and less than 2%, then the credit
point is prorated uniformly from 0 to 100. i.e. computed as the ratio
divided by 0.12.
b. Net Loans and Advances to Total Deposit Ratio
This ratio measures cash availability. It is assumed that cash raised
through deposit is not given as loans but then it is invested in more
liquid asset.
If the ratio is greater or equal to 70%, then the credit point is 0.

19
If the ratio is greater than zero and less than 2%, then the credit
point is prorated uniformly from 0 to 100. i.e. computed as the ratio
divided by 0.12.
2.3 HOW TO CALCULATE THE COMPOSITE RATING
In the case of each component part, the points earned are multiplied by the
weights and divided by 100. This equals the components minus weighted credit
points equals the banks total rating score as:
100 x WeightsPointsComponent PointCredit Weighted
Therefore, Composite Rating = sum of weighted Credit Points.
S/n Factor and Components Maximum weight %
Credit Points
weighted Credit Points
1 Capital a Capital to risk weighted assets ratio 15 80 12
b Adjusted capital ratio 5 80 4 c Capital growth rate 5 80 4 2 Asset Quality a Non performing risk assets to total risk
assets 15 60 9.0
b Reserves for losses to non performing risk assets 5 60 3.0
c Non performing risk assets to capital and reserves 5 60 3.0
3 Management a Compliance with laws and regulations. 10 80 8 b CAELS
85 5 80 4
4. Earnings a Net Profit after tax to Total Assets 5 90 4.5 b Total Expenses to Total Income 5 90 4.5 c Net interest income to total earning
assets. 5 4.5
d Interest expenses to total earning assets 5 4.5

20
S/n Factor and Components Maximum weight %
Credit Points
weighted Credit Points
5. Liquidity
a Liquidity ratio 5 50 5.0
b Net loans and advances to total deposit 5 50 2.5
c Volatile liability – Dependency ratio 5 50 2.5
TOTAL weighted Credit Points
75
Source Supervision department of the CBN
Note:
Ratio DependencyLiability Volatile
sInvestment and Leases and LoansAssets Liquid - sLiabilitie Volatile
2.4 OTHER JUDGEMENTAL FACTORS
Deducing from the introduction earlier in this chapter, the quantitative result
obtained through the evaluation of CAMEL Parameters must be further analysed
and tested with other components not included or that can not be quantified.
Where there is an inconsistency in the result or the soundness of the bank is
materially affected by these other qualitative factors, the result of the composite
rating must be modified to reflect the actual soundness of the bank.
The rating of a bank will be materially affected as to necessitate its being reduced
to ‘unsound’ if certain circumstances exist in the bank. A bank will have its
rating reduced to ‘unsound’ if any of the following is found:
a. Internal Conflicts that may result in some difficulties in the bank. E.g.
Board room quarrels;

21
b. Involvement of external parties (third parties) in the management of
the bank, including uncommon cooperation such that one or several
officers of the bank are independent.
c. Window dressing in the booking and reporting that materially affects
the financial position of the bank and result in a wrong evaluation of
the bank, e.g. wrong or false information on returns.
d. Financial difficulties that result in temporary revocation or withdrawal
from participation in clearing or foreign exchange markets.
In this research work, the composite rating score will be shown with the ratings
itself to indicate whether the ‘unsound’ rating resulted from the existence of any
of the above situation.
2.5 COMPLIANCE WITH LAWS AND REGUALTIONS
The information in this section is derived from the Monetary and Credit Policy
guidelines. Where a bank violets any law, the associated mark is deducted from a
total of 100 to arrived at the bank’s credit score.
i. Excess Credit Growth:
For compliance nothing is done, while for non-compliance deduct 10
points.
ii. Small Scale Credit Allocation:
If complied nothing is done, while for non-compliance deduct 10 points.

22
iii. Sectorial Credit Allocation:
If complied nothing is done, while for non-compliance deduct 10 points
iv. Legal Lending Limit:
For concentration, deduct 10 points, but for unsecured loans to insiders,
deduct 20 points.
Others in this category includes,
For lack of timeliness deduct 5 points.
For lack of accuracy deduct 10 points.
For lack of completeness deduct 5 points.
Provision for Risk Assets,
For failure to provide up to banks own computation deduct 10 points.
For failure to provide up to examiners recommendation deduct 20 points.
For other violations:
Minor deduct 5 points
Moderate deduct 10 points
Major deduct 20 points
The Unity Bank shall be appraised in line with the explained CAMEL parameter
as shown in this chapter.

23
CHAPTER THREE: RESEARCH METHODOLOGY
INTRODUCTION:
The concept of research comes about as a result of man’s curiosity of wanting to
find answers to the numerous questions surrounding him. Research has been used
increasingly to find answers to the problems seeking solutions.
Thus, research is a problem induced activity. According to Osuala, (2006:2)
research can be defined as the process of arriving at dependable solutions to
problems through the planned and systemic collection, analysis and interpretation
of data.
3.1 RESEARCH METHOD:
The method used is the conceptual framework in which the whole research is
based, Obioma, (1988:16). The selection of a primary method of investigation of
a given problem is a key consideration for any researcher. Hence, the method
chosen will depend on the level of the research, the aim and the resources
available to the researcher. This chapter forms an important part of the study. The
basic methodology used in this project or research work is the survey research
method.
3.2 POPULATION OF THE STUDY:
By population we mean the entire unit of interest for a given study, Mills,
(1979:21). For the purpose of this study the population chosen is the unity Bank

24
group. But it is also pertinent to note that the samples randomly selected for the
study consist of the followings:
1. Bank of the North
2. Intercity Bank
3. First InterState
METHODS OF DATA COLLECTION:
In carrying out this research project the researcher made use of both primary and
secondary sources of data
The information used in this study was gathered through the use of documentary
analysis, questionnaires which was also supplemented by personal interview
DOCUMENTARY ANALYSIS
An extensive delving of the secondary sources of data was carried out for facts
and figures so as to allow for in-depth analysis of the gathered data for onward
processing into a meaningful and unambiguous information as well as
comparison and application of statistics to the gathered data.
PERSONAL INTERVIEW
This method was used to obtain information on the areas not covered by the
secondary method of data collection. It use was necessary because of the
following advantages:
- Its flexibility, in such a way that questions can be reframed or paraphrased
if not clear to the respondents.

25
- Also, the personal contact help ease the respondents when answering
questions thereby providing reliable information.
- It also saves time, since it is a direct way of data collection.
INSTRUMENTS USED:
The researcher made use of questionnaires which was closely supported by
interview.
Questionnaire: The questionnaire was designed and administered for responses
from the targeted staff of Unity Bank.
Distribution of questionnaires: The administering of the questionnaires began
with a brief covering letter to the respondents. It states the aim of the
questionnaires, asked for sincere and valid information from them and assured
them of the confidentiality of all the information and data obtained.
Collection of the questionnaires: The questionnaires were to be collected after
information is provided by the targeted respondents.
SAMPLING METHOD:
According to Shao, (1976:14), the items of a sample may be selected in two
different ways:
i. Based on judgement of a person (Judgemental Sampling)
ii. Selection at Random (Random Sampling)
However, the two ways above could also be classified into:
- Non-probability sampling (Judgemental Sampling) and

26
- Probability sampling (Random Sampling)
In Random sampling each element in the set has an equal chance of being
selected.
But in this piece of work the research used non-probability sampling method
because of the problems of cost, time and lack of sufficient and accurate data on
the part of some of the banks that make up the present Unity Bank.
PROFILE OF THE CASE STUDY:
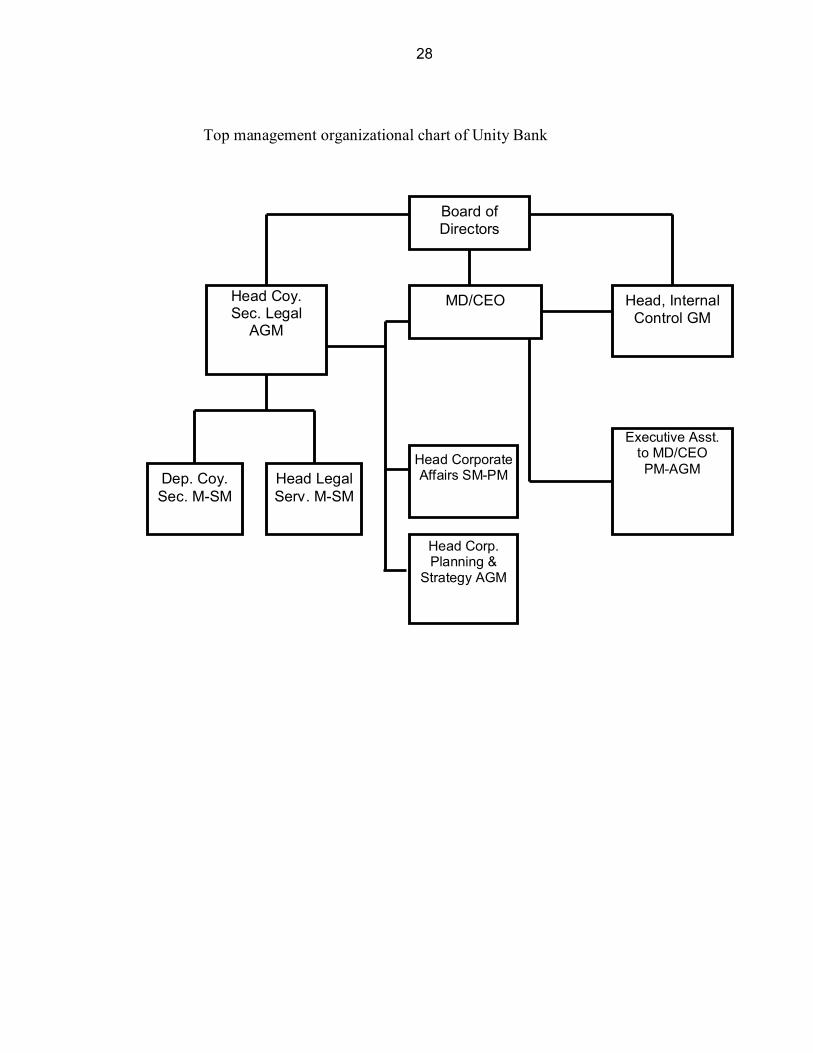
The bank consists of the Board of Directors headed by the Chairman. The board
considers the policy and strategy of the bank. The appointment of the top
management staff is also considered by the Board.
The daily running of the bank is done by the management that is headed by the
Managing Director closely assisted by the following Executive Directors.
Executive Director Operations and Services, Executive Directors Corporate
Banking and Treasury Management, Executive Director Risk Management and
Control. Executive Director Business Development (North) and Executive
Director Business Development (South).
The bank is divided into five divisions with each division been headed by one
executive director. The first division i.e. operations and services takes charge of
all matters affecting operations and the provision of services by the bank. The
executive director here ahs under him some General Managers and Deputy
General Managers who take charge of areas that includes, Admin and training.
The second division i.e. Corporate Banking and Treasury Management, this

27
division takes charge of all banking and corporate matters of the bank. The
executive director has some General Mangers and Deputy General Managers
who in turn are in charge of areas that includes liability management, treasury
management, corporate banking, investment banking, subsidiaries and wealth
management.
The third division i.e. risk management and control and the function of this
division is principally in the risk and portfolio management. The executive
director ahs some general managers and deputy general managers who in turns
take charge of areas that includes, credit administrative, risk management, credit
risk, marketable & liquid risk,. Operations risk, financial consultancy and
regulatory services.
The forth division i.e. Business development North, the executive director here is
in charge of the following areas as it affects the Northern part of the country.
These includes, retails and commercial banking north, retail and consumer
banking north as well as take charge of all the northern region.
The fifth division i.e. Business Development South, the Executive Director here
takes charge of the Business development as it pertains the southern region. Also
just live his northern counterparts he also take charge of areas which includes;
retail and commercial banking south, retail and consumer banking south, as well
as take charge of all the southern region.
28
Top management organizational chart of Unity Bank
Board of Directors
MD/CEO Head, Internal Control GM
Head Coy. Sec. Legal
AGM
Dep. Coy. Sec. M-SM
Head Legal Serv. M-SM
Head Corporate Affairs SM-PM
Executive Asst. to MD/CEO PM-AGM
Head Corp. Planning &
Strategy AGM

29
CHAPTER FOUR: DATA PRESENTATION AND ANALYSIS
INTRODUCTION
The usefulness of any data is when it has been analysed. Chisnall (1981:17)
observed that “the raw material of the research process (data) has to be processed
by tabulation, analysis and interpretation, so that the research findings can be
communicated to clients and should be readily understood.
4.1 DATA PRESENTATION AND ANALYSIS:
The aim of this chapter is to show how the researcher prepares and organized the
sets of data collected so that it looks properly presented in a form that would be
easily understood.
The first set of data to be presented are the ones collected for the computation of
the composite rating from the bank’s annual report / statement of account for
each bank for the periods under review i.e. (1999 – 2003).
While the second set of data to be presented for analysis would be the responses
from the administered questionnaires. However, the responses shall be tabulated,
summarized and presented in the form of tables, while percentages may also be
assigned to them in order to make them clearer.
The chi-square would be the tool for the analysis of the responses so as to either
prove or validate the hypothesis as the case may be. The following data to be
presented for analysis relates to the computation of the composite rating of the
banks.

30
Table 4.1: Computation of composite rating of Bank of the North – 1999
S/N FACTORS AND COMPONENTS Max.
weight %
Credit points
Weighted credit point
1. Capital: a. Capital to risk weighted assets
ratio 25.18 100 25.18
b. Adjusted capital ratio 30.00 100 30.00 c. Ratio of capital growth rate to
asset growth rate 1.95 97.50 1.90
2. Asset Quality: a. NPRA / TRA 18.52 7.40 1.37 b. Reserve for losses to non-
performing risk assets 91.00 100 91.00
c. Non performing risk assets to adjusted capital 55.00 45.00 24.75
3 Management: a. Compliance Complied -- 0 b. CAEL / 85 -- 4.54 0 4. Earnings: a. NPAT / Total Assets 0.54 27.38 0.14 b. Total expenses to total income 80.00 100 80.00 c. Net interest income to total
earning assets 11.00 91.67 10.08
d. Ratio of interest expenses to average earning assets 12.51 47.88 5.99
5. Liquidity: a. Liquidity ratio 100.08 100 100.08 b. Net loans / deposit 23.53 66.39 15.62 c. Volatile liabilities – dependency
ratio 100 0 0
TOTAL WEIGHTED CREDIT POINTS
386.11
Source: Computed by the researcher
The bank is rated “A” in 1999, showing that the bank performed very sound.

31
Table 4.2: Computation of composite rating of Bank of the North – 2000
S/N FACTORS AND COMPONENTS Max.
weight %
Credit points
Weighted credit point
1. Capital: a. Capital to risk weighted assets
ratio 26.18 100 26.18
b. Adjusted capital ratio 32.00 100 32.00 c. Ratio of capital growth rate to
asset growth rate 1.85 92.50 1.71
2. Asset Quality: a. NPRA / TRA 19.00 5.00 0.95 b. Reserve for losses to non-
performing risk assets 30.00 100 80.00
c. Non performing risk assets to adjusted capital 50.00 50.00 25.00
3 Management: a. Compliance Complied -- 0 b. CAEL / 85 -- 4.42 0 4. Earnings: a. NPAT / Total Assets 0.80 39.99 0.32 b. Total expenses to total income 79.00 100 79.00 c. Net interest income to total
earning assets 11.50 95.83 11.02
d. Ratio of interest expenses to average earning assets 22.50 6.25 1.41
5. Liquidity: a. Liquidity ratio 104.54 100 104.5 b. Net loans / deposit 18.76 73.2 13.73 c. Volatile liabilities – dependency
ratio 100 0 0
TOTAL WEIGHTED CREDIT POINTS
375.86
Source: Computed by the researcher
The bank is rated “A” in 2000, showing that the bank’s performance was
very sound.

32
Table 4.3: Computation of composite rating of Bank of the North – 2001
S/N FACTORS AND COMPONENTS Max.
weight %
Credit points
Weighted credit point
1. Capital: a. Capital to risk weighted assets
ratio 40.12 100 40.12
b. Adjusted capital ratio 39.00 100 39.00 c. Ratio of capital growth rate to
asset growth rate 1.92 96.00 1.84
2. Asset Quality: a. NPRA / TRA 18.00 10.00 1.80 b. Reserve for losses to non-
performing risk assets 75.00 93.75 70.13
c. Non performing risk assets to adjusted capital 50.00 50.00 25.00
3 Management: a. Compliance Complied -- 0 b. CAEL / 85 -- 4.29 0 4. Earnings: a. NPAT / Total Assets 0.20 9.87 0.02 b. Total expenses to total income 58.00 100 58.00 c. Net interest income to total
earning assets 8.58 71.5 6.13
d. Ratio of interest expenses to average earning assets 2.33 90.30 2.10
5. Liquidity: a. Liquidity ratio 103.19 100 103.19 b. Net loans / deposit 34.38 50.89 17.5 c. Volatile liabilities – dependency
ratio 101 0 0
TOTAL WEIGHTED CREDIT POINTS
365.01
Source: Computed by the researcher
The bank is rated “A” in 2001, it shows that the bank’s performance was
very sound.

33
Table 4.4: Computation of composite rating of Bank of the North – 2002
S/N FACTORS AND COMPONENTS Max.
weight %
Credit points
Weighted credit point
1. Capital: a. Capital to risk weighted assets
ratio 38.51 100 38.51
b. Adjusted capital ratio 41.00 100 41.00 c. Ratio of capital growth rate to
asset growth rate 1.39 69.50 0.97
2. Asset Quality: a. NPRA / TRA 15.50 22.50 3.49 b. Reserve for losses to non-
performing risk assets 71.00 88.75 63.30
c. Non performing risk assets to adjusted capital 48.00 52.00 24.96
3 Management: a. Compliance Complied -- 0 b. CAEL / 85 -- 4.29 0 4. Earnings: a. NPAT / Total Assets 1.54 76.93 1.18 b. Total expenses to total income 60.41 100 60.41 c. Net interest income to total
earning assets 7.98 66.54 5.31
d. Ratio of interest expenses to average earning assets 3.33 86.13 2.87
5. Liquidity: a. Liquidity ratio 106.00 100 106.00 b. Net loans / deposit 27.23 61.1 16.64 c. Volatile liabilities – dependency
ratio 100 0 0
TOTAL WEIGHTED CREDIT POINTS
364.64
Source: Computed by the researcher
The bank is rated “A” in 2002 because it has performed very sound.

34
Table 4.5: Computation of composite rating of Bank of the North – 2003
S/N FACTORS AND COMPONENTS Max.
weight %
Credit points
Weighted credit point
1. Capital: a. Capital to risk weighted assets ratio 40.12 100 40.12 b. Adjusted capital ratio 39.00 100 39.00 c. Ratio of capital growth rate to asset
growth rate 1.92 96 1.84
2. Asset Quality: a. NPRA / TRA 18.00 10.00 1.80 b. Reserve for losses to non-
performing risk assets 75.00 93.75 70.31
c. Non performing risk assets to adjusted capital 50.00 50.00 25.00
3 Management: a. Compliance Complied -- 0 b. CAEL / 85 -- 4.29 0 4. Earnings: a. NPAT / Total Assets 0.20 9.87 0.02 b. Total expenses to total income 58.00 100 58.02 c. Net interest income to total earning
assets 8.58 71.5 6.13
d. Ratio of interest expenses to average earning assets 2.33 90.30 2.10
5. Liquidity: a. Liquidity ratio 103.19 100 103.19 b. Net loans / deposit 34.38 50.89 17.5 c. Volatile liabilities-dependency ratio 101 0 0 TOTAL WEIGHTED CREDIT POINTS 365.01
Source: Computed by the researcher
The bank is rated “A” in 2003, this also goes to show that its performance
was very sound. The performance of Bank of the North was very sound
during the period under review that is, 1999 – 2003. The total weighted
credit points of 386.11, 375.86, 362.41, 362.41, 364.64 and 365.01 for
1999, 2000, 2001, 2002 and 2003 show the excellent performance of the
bank pre-consolidation. It then has a mean composite rating of 370.81 for
the period under review.

35
Table 4.6: Computation of composite rating of Intercity Bank – 1999
S/N FACTORS AND COMPONENTS Max.
weight %
Credit points
Weighted credit point
1. Capital: a. Capital to risk weighted assets
ratio 16.00 100 16.00
b. Adjusted capital ratio 6.03 30.15 1.82 c. Ratio of capital growth rate to
asset growth rate 2.00 100 2.00
2. Asset Quality: a. NPRA / TRA 20.52 0 0 b. Reserve for losses to non-
performing risk assets 80.00 100 80.00
c. Non performing risk assets to adjusted capital 6.53 93.47 6.10
3 Management: a. Compliance Complied -- 0 b. CAEL / 85 -- 2.98 0 4. Earnings: a. NPAT / Total Assets 2.00 100 2.00 b. Total expenses to total income 25.31 100 25.31 c. Net interest income to total
earning assets 4.00 33.33 1.33
d. Ratio of interest expenses to average earning assets 26.00 0 0
5. Liquidity: a. Liquidity ratio 101.34 100 101.34 b. Net loans / deposit 34.3 51 17.49 c. Volatile liabilities – dependency
ratio 112 0 0
TOTAL WEIGHTED CREDIT POINTS
253.39
Source: Computed by the researcher
The bank is rated “A” in 1999, as the computation shows it was
performing very sound in the year.

36
Table 4.7: Computation of composite rating of Intercity Bank – 2000
S/N FACTORS AND COMPONENTS Max.
weight %
Credit points
Weighted credit point
1. Capital: a. Capital to risk weighted assets
ratio 16.53 100 16.53
b. Adjusted capital ratio 5.00 25.00 1.25 c. Ratio of capital growth rate to
asset growth rate 2.58 100 2.58
2. Asset Quality: a. NPRA / TRA 26.51 0 0 b. Reserve for losses to non-
performing risk assets 55.00 68.75 37.81
c. Non performing risk assets to adjusted capital 3.51 96.49 3.39
3 Management: a. Compliance Complied -- 0 b. CAEL / 85 -- 2.45 0 4. Earnings: a. NPAT / Total Assets 15.00 100 15.00 b. Total expenses to total income 25.51 100 25.51 c. Net interest income to total
earning assets 5.54 46.17 2.56
d. Ratio of interest expenses to average earning assets 27.00 0 0
5. Liquidity: a. Liquidity ratio 104.00 100 104.00 b. Net loans / deposit 80 0 0 c. Volatile liabilities – dependency
ratio 103 0 0
TOTAL WEIGHTED CREDIT POINTS
208.63
Source: Computed by the researcher
The bank is rated “A”, and this goes to show that the bank performed very
sound.

37
Table 4.8: Computation of composite rating of Intercity Bank – 2001
S/N FACTORS AND COMPONENTS Max.
weight %
Credit points
Weighted credit point
1. Capital: a. Capital to risk weighted assets
ratio 20.00 100 20.00
b. Adjusted capital ratio 35.00 100 35.00 c. Ratio of capital growth rate to
asset growth rate 1.53 76.5 1.17
2. Asset Quality: a. NPRA / TRA 18.26 8.7 1.58 b. Reserve for losses to non-
performing risk assets 80.53 100 80.53
c. Non performing risk assets to adjusted capital 75.00 25.00 18.75
3 Management: a. Compliance Complied -- 0 b. CAEL / 85 -- 4.04 0 4. Earnings: a. NPAT / Total Assets 1.08 54.33 0.59 b. Total expenses to total income 90.00 50.00 45.00 c. Net interest income to total
earning assets 13.52 100 13.52
d. Ratio of interest expenses to average earning assets 26.00 0 0
5. Liquidity: a. Liquidity ratio 110.26 100 110.26 b. Net loans / deposit 93.57 43.47 17.2 c. Volatile liabilities – dependency
ratio 115 0 0
TOTAL WEIGHTED CREDIT POINTS
343.60
Source: Computed by the researcher.
The bank is rated “A” in 2001, which goes to show that the bank
performed very sound.

38
Table 4.9: Computation of composite rating of Intercity Bank – 2002
S/N FACTORS AND COMPONENTS Max.
weight %
Credit points
Weighted credit point
1. Capital: a. Capital to risk weighted assets
ratio 15.00 93.75 14.06
b. Adjusted capital ratio 19.00 95.00 18.05 c. Ratio of capital growth rate to
asset growth rate 1.75 87.65 1.53
2. Asset Quality: a. NPRA / TRA 30.93 0 0 b. Reserve for losses to non-
performing risk assets 16.24 20.30 3.30
c. Non performing risk assets to adjusted capital 20.00 80.00 16.00
3 Management: a. Compliance Complied -- 0 b. CAEL / 85 -- 2.53 0 4. Earnings: a. NPAT / Total Assets 2.50 100 2.50 b. Total expenses to total income 47.62 100 47.62 c. Net interest income to total
earning assets 6.30 52.50 3.31
d. Ratio of interest expenses to average earning assets 22.50 6.25 1.41
5. Liquidity: a. Liquidity ratio 107.73 100 107.73 b. Net loans / deposit 75 0 0 c. Volatile liabilities – dependency
ratio 100 0 0
TOTAL WEIGHTED CREDIT POINTS
215.51
Source: Computed by the researcher.
The bank is rated “A” rating in 2002 which shows it performed very
sound.

39
Table 4.10: Computation of composite rating of Intercity Bank – 2003
S/N FACTORS AND COMPONENTS Max.
weight %
Credit points
Weighted credit point
1. Capital: a. Capital to risk weighted assets ratio 18.00 100 18.00 b. Adjusted capital ratio 19.50 97.50 19.01 c. Ratio of capital growth rate to asset
growth rate 0.11 5.50 0.006
2. Asset Quality: a. NPRA / TRA 0.32 98.39 1.41 b. Reserve for losses to non-
performing risk assets 22.82 28.53 6.51
c. Non performing risk assets to adjusted capital 35.00 65.00 22.75
3 Management: a. Compliance Complied -- 0 b. CAEL / 85 -- 3.16 0 4. Earnings: a. NPAT / Total Assets 1.68 84.08 1.41 b. Total expenses to total income 50.15 100 50.15 c. Net interest income to total earning
assets 4.63 38.61 1.79
d. Ratio of interest expenses to average earning assets 25.68 0 0
5. Liquidity: a. Liquidity ratio 131.09 100 131.09 b. Net loans / deposit 37.61 46.27 17.4 c. Volatile liabilities-dependency ratio 101 0 0 TOTAL WEIGHTED CREDIT
POINTS 268.43
Source: Computed by the researcher.
The bank is rated “A” in 2003, which it depicts it had perform very sound.
Intercity Bank had performed very sound during the period under review
1999 – 2003. The total weighted credit points of 253.39, 235.14, 343.60,
215.51 and 268.43 for 1999, 2000, 2001, 2002 and 2003 is an indication
of very sound performances which further gave a mean composite rating
of 263.21 pre-consolidation for the period under review.

40
Table 4.11: Computation of composite rating of First Inter State Bank – 1999
S/N FACTORS AND COMPONENTS Max.
weight %
Credit points
Weighted credit point
1. Capital: a. Capital to risk weighted assets
ratio 19.00 100 19.00
b. Adjusted capital ratio 23.12 100 23.12 c. Ratio of capital growth rate to
asset growth rate 5.51 100 5.52
2. Asset Quality: a. NPRA / TRA 25.00 0 0 b. Reserve for losses to non-
performing risk assets 50.51 63.13 31.89
c. Non performing risk assets to adjusted capital 35.00 65.00 22.75
3 Management: a. Compliance Complied -- 0 b. CAEL / 85 -- 3.02 0 4. Earnings: a. NPAT / Total Assets 6.17 100 6.71 b. Total expenses to total income 35.52 100 35.52 c. Net interest income to total
earning assets 11.21 93.42 10.47
d. Ratio of interest expenses to average earning assets 23.51 2.04 0.48
5. Liquidity: a. Liquidity ratio 84.44 10.0 84.44 b. Net loans / deposit 30.63 56.24 17.23 c. Volatile liabilities – dependency
ratio 101 0 0
TOTAL WEIGHTED CREDIT POINTS
257.13
Source: Computed by the researcher.
The bank is rated “A” in 1999 which means that the bank had performed
very sound.

41
Table 4.12: Computation of composite rating of First Inter State Bank – 2000
S/N FACTORS AND COMPONENTS Max.
weight %
Credit points
Weighted credit point
1. Capital: a. Capital to risk weighted assets
ratio 18.00 100 18.00
b. Adjusted capital ratio 25.51 100 25.51 c. Ratio of capital growth rate to
asset growth rate 1.81 90.5 1.64
2. Asset Quality: a. NPRA / TRA 17.52 12.40 2.17 b. Reserve for losses to non-
performing risk assets 71.25 39.06 63.46
c. Non performing risk assets to adjusted capital 40.00 60.00 24.00
3 Management: a. Compliance Complied -- 0 b. CAEL / 85 -- 3.18 0 4. Earnings: a. NPAT / Total Assets 3.29 100 3.29 b. Total expenses to total income 90.00 50.00 45.00 c. Net interest income to total
earning assets 10.00 83.33 8.33
d. Ratio of interest expenses to average earning assets 22.51 6.21 1.39
5. Liquidity: a. Liquidity ratio 60.00 100 60.00 b. Net loans / deposit 31.68 54.74 17.34 c. Volatile liabilities – dependency
ratio 102 0 0
TOTAL WEIGHTED CREDIT POINTS
270.13
Source: Computed by the researcher.
The bank is rated “A” in 2000 and it shows its performance is very sound.

42
Table 4.13: Computation of composite rating of First Inter State Bank – 2001
S/N FACTORS AND COMPONENTS Max.
weight %
Credit points
Weighted credit point
1. Capital: a. Capital to risk weighted assets
ratio 16.00 100 16.00
b. Adjusted capital ratio 14.51 72.55 10.53 c. Ratio of capital growth rate to
asset growth rate 1.02 51.00 0.52
2. Asset Quality: a. NPRA / TRA 19.51 2.45 0.48 b. Reserve for losses to non-
performing risk assets 89.51 100 89.51
c. Non performing risk assets to adjusted capital 80.00 20.00 16.00
3 Management: a. Compliance Complied -- 0 b. CAEL / 85 -- 3.09 0 4. Earnings: a. NPAT / Total Assets 19.73 100 19.73 b. Total expenses to total income 55.12 100 55.12 c. Net interest income to total
earning assets 11.52 96.00 11.06
d. Ratio of interest expenses to average earning assets 25.00 0 0
5. Liquidity: a. Liquidity ratio 46.16 76.93 35.51 b. Net loans / deposit 25.89 63.02 16.31 c. Volatile liabilities – dependency
ratio 102 0 0
TOTAL WEIGHTED CREDIT POINTS
262.77
Source: Computed by the researcher.
The bank is rated “A” in 2001, this goes to show that the bank’s
performance is very sound.

43
Table 4.14: Computation of composite rating of First Inter State Bank – 2002
S/N FACTORS AND COMPONENTS Max.
weight %
Credit points
Weighted credit point
1. Capital: a. Capital to risk weighted assets
ratio 17.00 100 17.00
b. Adjusted capital ratio 19.52 97.6 19.05 c. Ratio of capital growth rate to
asset growth rate 1.00 50.00 0.5
2. Asset Quality: a. NPRA / TRA 20.00 0 0 b. Reserve for losses to non-
performing risk assets 85.00 100 85.00
c. Non performing risk assets to adjusted capital 35.00 65.00 22.75
3 Management: a. Compliance Complied -- 0 b. CAEL / 85 -- 2.93 0 4. Earnings: a. NPAT / Total Assets 0.20 9.9 0.02 b. Total expenses to total income 80.00 100 80.00 c. Net interest income to total
earning assets 10.35 56.25 8.93
d. Ratio of interest expenses to average earning assets 23.42 2.42 0.57
5. Liquidity: a. Liquidity ratio 0.20 9.90 0.02 b. Net loans / deposit 23.48 6.64 13.6 c. Volatile liabilities – dependency
ratio 100 0 0
TOTAL WEIGHTED CREDIT POINTS
249.44
Source: Computed by the researcher.
The bank is rated “A” in 2002, which also means that it’s performance is
very sound.

44
Table 4.15: Computation of composite rating of First Inter State Bank – 2003
S/N FACTORS AND COMPONENTS Max.
weight %
Credit points
Weighted credit point
1. Capital: a. Capital to risk weighted assets ratio 15.52 97 15.05 b. Adjusted capital ratio 38.00 100 38.00 c. Ratio of capital growth rate to asset
growth rate 1.95 97.50 1.90
2. Asset Quality: a. NPRA / TRA 15.51 22.45 3.48 b. Reserve for losses to non-
performing risk assets 95.00 100 95.00
c. Non performing risk assets to adjusted capital 55.00 45.00 24.75
3 Management: a. Compliance Complied -- 0 b. CAEL / 85 -- 4.31 0 4. Earnings: a. NPAT / Total Assets 0.68 34 0.23 b. Total expenses to total income 35.00 100 35.00 c. Net interest income to total earning
assets 56.00 100 56.00
d. Ratio of interest expenses to average earning assets 23.51 2.04 0.48
5. Liquidity: a. Liquidity ratio 80.00 100 80.00 b. Net loans / deposit 26.32 62.4 16.42 c. Volatile liabilities-dependency ratio 120 0 0 TOTAL WEIGHTED CREDIT POINTS 366.31
Source: Computed by the researcher.
The bank is rated “A” in 2003, an indication that it performed very sound.
The total weighted credit points of 257.13, 270.13, 262.77, 249.44 and
DATA 366.31 for the years, 1999, 2000, 2001, 2002 and 2003
respectively tend to depict the good and sound performance of the bank
for the period under review pre-consolidation, hence its mean composite

45
rating for the period is 281.15. The second set of data relates to the
opinion of the respondents to the various questions in the questionnaire as
presented below:
A total of 300 hundred questionnaires were administered and 273 were
returned and responded to which gives %91100300273
x .
Question 1: The CAMEL rating system is effective in measuring bank
performance
Table 4.16: CAMEL rating system is effective in measuring bank
performance
OPTIONS NUMBER OF
RESPONDENTS PERCENTAGE
STRONGLY AGREE 118 43.2%
AGREE 89 32.6%
UNDECIDED 12 4.4%
DISAGREE 44 16.1%
STRONGLY DISAGREE 10 3.7%
TOTAL 273 100%
Source: Administered questionnaire, October, 2006.
Majority of the respondents here strongly agree i.e. 43% that the CAMEL
rating system is effective in measuring bank performance.
Question 2: Banks do get the required appraising from the CAMEL
rating system.

46
Table 4.17: Appraising from the CAMEL rating system.
OPTIONS NUMBER OF
RESPONDENTS PERCENTAGE
STRONGLY AGREE 115 42.1%
AGREE 70 25.6%
UNDECIDED 15 5.5%
DISAGREE 60 22%
STRONGLY DISAGREE 13 4.8%
TOTAL 273 100%
Source: Administered questionnaire, October, 2006.
Inferring from table 4.17m 42.1% i.e. majority of the respondents strongly
agree that banks do get the required appraising from the CAMEL rating
system.
Question 3: Unity bank should be appraised on CAMEL rating system.
Table 4.18: Unity bank should be appraised on CAMEL rating system.
OPTIONS NUMBER OF
RESPONDENTS PERCENTAGE
STRONGLY AGREE 30 11.0%
AGREE 60 22.0%
UNDECIDED 62 22.75
DISAGREE 80 29.3%
STRONGLY DISAGREE 41 15.0%
TOTAL 273 100%
Source: Administered questionnaire, October, 2006.
Inferring from table 4.18 majority of the staff (29.3%) disagree that every
bank should be apprised on CAMEL rating system.
47
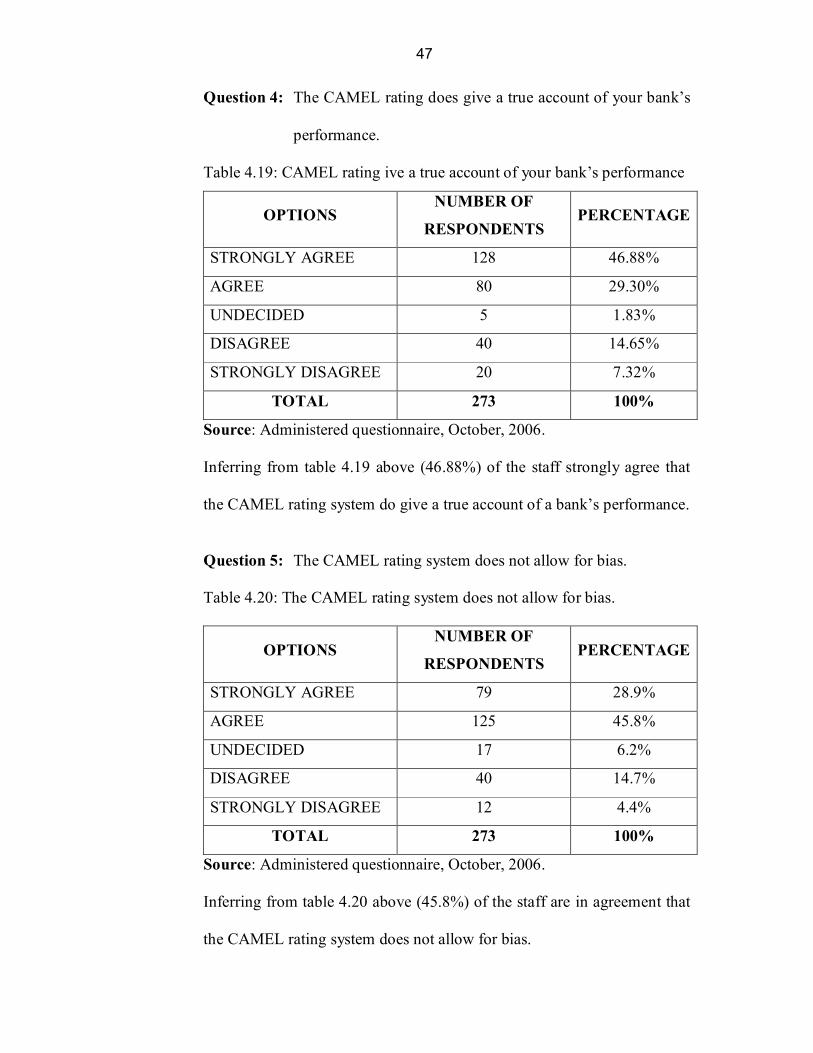
Question 4: The CAMEL rating does give a true account of your bank’s
performance.
Table 4.19: CAMEL rating ive a true account of your bank’s performance
OPTIONS NUMBER OF
RESPONDENTS PERCENTAGE
STRONGLY AGREE 128 46.88%
AGREE 80 29.30%
UNDECIDED 5 1.83%
DISAGREE 40 14.65%
STRONGLY DISAGREE 20 7.32%
TOTAL 273 100%
Source: Administered questionnaire, October, 2006.
Inferring from table 4.19 above (46.88%) of the staff strongly agree that
the CAMEL rating system do give a true account of a bank’s performance.
Question 5: The CAMEL rating system does not allow for bias.
Table 4.20: The CAMEL rating system does not allow for bias.
OPTIONS NUMBER OF
RESPONDENTS PERCENTAGE
STRONGLY AGREE 79 28.9%
AGREE 125 45.8%
UNDECIDED 17 6.2%
DISAGREE 40 14.7%
STRONGLY DISAGREE 12 4.4%
TOTAL 273 100%
Source: Administered questionnaire, October, 2006.
Inferring from table 4.20 above (45.8%) of the staff are in agreement that
the CAMEL rating system does not allow for bias.

48
Question 6: CAMEL rating system shows the adequacy of unity bank’s
capital
Table 4.21: The adequacy of unity bank’s capital
OPTIONS NUMBER OF
RESPONDENTS PERCENTAGE
STRONGLY AGREE 21 7.7%
AGREE 74 27.1%
UNDECIDED 70 25.6%
DISAGREE 73 26.7%
STRONGLY DISAGREE 35 2.8%
TOTAL 273 100%
Source: Administered questionnaire, October, 2006.
Inferring from table 4.21 above (26.7%) of the staff are seen to disagree
that the CAMEL rating system shows the adequacy of unity bank’s
capital.
Question 7: CAMEL rating system gives a true position of a bank’s asset
quality.
Table 4.22: True position of a bank’s asset quality
OPTIONS NUMBER OF
RESPONDENTS PERCENTAGE
STRONGLY AGREE 20 7.3%
AGREE 85 31.1%
UNDECIDED 40 14.7%
DISAGREE 90 33.0%
STRONGLY DISAGREE 38 13.9%
TOTAL 273 100%
Source: Administered questionnaire, October, 2006.

49
Inferring from table 4.22 (33%) of the respondents disagree that CAMEL
rating system gives a true position of a bank’s asset quality.
Question 8: CAMEL rating shows whether or not the bank has
competent management.
Table 4.23: The bank has competent management.
OPTIONS NUMBER OF
RESPONDENTS PERCENTAGE
STRONGLY AGREE 3 1.1%
AGREE 63 23.1%
UNDECIDED 19 7.0%
DISAGREE 118 43.2%
STRONGLY DISAGREE 70 25.6%
TOTAL 273 100%
Source: Administered questionnaire, October, 2006.
Inferring from able 4.23 above, (43.3%) disagree that the CAMEL rating
system is a good measure of bank’s management competence.

50
Question 9: The CAMEL rating system does give a satisfactory position
of a bank’s earning.
Table 4.24: The position of a bank’s earning.
OPTIONS NUMBER OF
RESPONDENTS PERCENTAGE
STRONGLY AGREE 70 25.6%
AGREE 130 47.6%
UNDECIDED 8 2.9%
DISAGREE 55 20.1%
STRONGLY DISAGREE 10 3.7%
TOTAL 273 100%
Source: Administered questionnaire, October, 2006.
Inferring from table 4.24 above, (47.6%) agree that the CAMEL rating
system do give a satisfactory position of a bank’s earning.
Question 10: The CAMEL rating system does no give satisfactory
position of a bank’s liquidity level.
Table 4.25: The position of a bank’s liquidity level
OPTIONS NUMBER OF
RESPONDENTS PERCENTAGE
STRONGLY AGREE 78 28.6%
AGREE 120 44.0%
UNDECIDED 9 3.3%
DISAGREE 54 19.8%
STRONGLY DISAGREE 12 4.3%
TOTAL 273 100%
Source: Administered questionnaire, October, 2006.

51
Inferring from table 4.25 above, (44%) of the respondents agree that the
CAMEL rating system does give a satisfactory position of a bank’s
liquidity.
4.2 HYPOTHESIS TESTING:
Hypothesis:
HO The CAMEL rating system is not a good tool for measuring the
performance of Unity Bank.
Ha The CAMEL rating system is a good tool for measuring the
performance of Unity Bank.
Question 1 – 10 are used to test this hypothesis for acceptance or rejection.
Table 4.26 shows observed frequencies (o)
S/n Question Agree Disagree Total
1. The CAMEL rating system is effective in
measuring bank performance 207 54 261
2. Banks do get the required appraising from
the CAMEL rating system 185 73 258
3. Every bank should be appraised on
CAMEL rating system 90 121 211
4. The CAMEL rating does give a true
account of unity bank’s performance 208 60 268
5. The CAMEL rating system does not allow
for bias 204 52 256
6. CAMEL rating system shows the
adequacy of unity bank’s capital 95 108 203
7. CAMEL rating system gives a true
position of a bank’s asset quality 105 128 233

52
S/n Question Agree Disagree Total
8. CAMEL rating system shows whether or
not the bank does competent management 66 188 254
9. The CAMEL rating system does not give
a satisfactory position of a bank’s
earnings.
200 65 265
10. The CAMEL rating system does not give
the satisfactory position of a banks
liquidity level.
198 66 264
1,558 915 2, 473
The above table shows the observed frequencies. The expected values can
be calculated as thus:
NCRE ii
ij
Where Ri = Row Total, Ci = Column Total and N = Grand Total.
The results of Eij represent the expected value in the corresponding cell;
while the degree of freedom = (r – 1) (c – 1).
Therefore:
E1 261 x 1558 = 164.4 2473 E2 258 x 1558 = 162.5 2473 E3 211 x 1558 = 132.9 2473
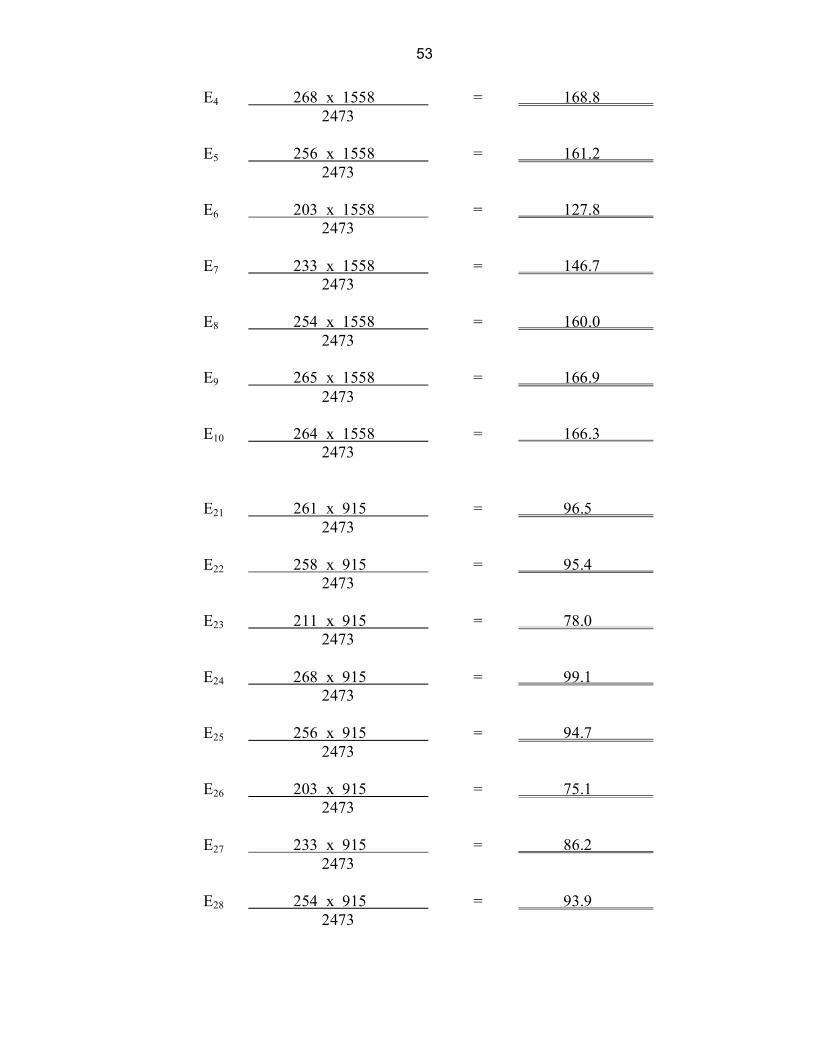
53
E4 268 x 1558 = 168.8 2473 E5 256 x 1558 = 161.2 2473 E6 203 x 1558 = 127.8 2473 E7 233 x 1558 = 146.7 2473 E8 254 x 1558 = 160.0 2473 E9 265 x 1558 = 166.9 2473 E10 264 x 1558 = 166.3 2473 E21 261 x 915 = 96.5 2473 E22 258 x 915 = 95.4 2473 E23 211 x 915 = 78.0 2473 E24 268 x 915 = 99.1 2473 E25 256 x 915 = 94.7 2473 E26 203 x 915 = 75.1 2473 E27 233 x 915 = 86.2 2473 E28 254 x 915 = 93.9 2473

54
E29 265 x 915 = 98.0 2473 E210 264 x 915 = 97.6 2473
Table 4.27Shows Expected frequencies (E)
164.4 96.5 261
162.5 95.4 258
132.9 78.0 211
168.8 99.1 268
161.2 94.7 256
127.8 75.1 203
146.7 86.2 233
160.0 93.9 254
166.9 98.0 265
166.3 97.6 264
1,558 915 2,473
The chi-square is calculated below

55
Table 4.28 shows chi-square (x2)
O e O – e (o – e)2 (o – e)2/e
207 164.4 42.6 1814.76 11.03
185 162.5 22.5 506.25 3.11
90 132.9 -42.9 1840.41 13.84
208 168.8 39.2 1536.64 9.10
204 161.2 42.8 1831.84 11.36
95 127.8 -32.8 1075.84 8.41
105 146.7 -41.7 1736.89 11.85
66 160.0 -94 8836 55.22
200 166.9 33.1 1095.61 6.56
198 166.3 31.7 1004.89 6.04
54 96.5 -42.5 1806.25 18.71
73 95.4 -22.4 501.76 5.25
121 78.0 43 1849 23.70
208 99.1 108.9 11859.21 119.66
204 94.7 109.3 11946.49 126.15
95 75.1 19.9 396.01 5.27
105 86.2 18.8 353.44 4.10
66 93.9 -27.9 778.41 8.28
200 98.0 102 10404 106.16
198 97.6 100.4 10080.16 103.28
TOTAL X2 657.03
From the above table, the chi-square calculated is 657.03 while from the
chi-square table, the critical value at 0.05 level of significance and K = 10
– 1 or (r – 1) (K – 1) = 9 hence check the chi-square table for the
equivalent value i.e.

56
905.0
2x = 16.919
DECISION RULE:
Reject the null hypothesis (Ho) for the alternate hypothesis (Ha) if the X2 >
critical value, else accept the null hypothesis.
DECISION:
Since the calculated X2 (657.08) is greater than the alternate hypothesis reject
the null (HO) and accept the alternate hypothesis (Ha) and conclude that the
CAMEL rating system do show a significant measure of the Unity Bank’s
performance.
4.3 FINDINGS:
In an attempt to find answers to the research question, first the composite
score of Unity Bank was calculated using the data from the annual report
and accounts as shown in the population of the 3 banks selected at random
from the 9 that made up the Unity Bank and the composite mean shows
that the bank was sound during the period under review (1999 –
2003).This is because for all the composite mean for each of the randomly
selected sample bank did exceed the 100 points score as thus; Bank of the
North has 370.81 ;Intercity Bank has 263.21;and First interstate Bank had
281.15.

57
It was also found that having formed and tested the hypothesis the result
of the calculated chi-square X2 which is 659.03 greater than the table
value of the chi-square which is 16.919 translates to mean that the
CAMEL rating system is a good tool for measuring the performance of
unity bank. The following were discernable:
i. The capital of Unity Bank is adequate
ii. The bank has quality assets.
iii. The management of the bank is also competent
iv. The bank has satisfactory earnings
v. The bank also has a satisfactory liquidity level.
58
CHAPTER FIVE: SUMMARY, CONCLUSION AND
RECOMMENDATION
5.1 SUMMARY
In chapter one, the researcher highlighted on the background of the study where a
general overview of the Nigerian banking industry was discussed up to where the
problems of bank’s become apparent and the need to appraise them
intermittently. Also, hypothesis was formed to show the goodness of fit of this
composite tool of appraising bank performance.
While the scope and limitation of this study was also discussed so as to show the
areas that was covered by this research as well as the problems that were
encountered during the course of this project work.
Chapter two started with the brief introduction and dealt with the review of
literature. The study was conducted by using both the quantitative and qualitative
approach of appraising the factors that affect the performance of banks. It
discussed the concept of CAMEL rating system, how to calculate the composite
score, valuation factors as well as the appraisal procedures.
Chapter three started with the introduction of research methodology. It went on
to discuss method adopted for the research. It gave the population of the study,
the method of data collection, instruments used, the sampling method used where
three banks were selected at random out of the nine that made up the Unity Bank
for the computation of the composite score. While lastly, it discussed the profile
of the case study.

59
In chapter four, the work centred on the presentations and analysis of data, where
the first set data that was presented was the one from the annual report and
account of the three randomly selected sample for the period under review i.e.
1999 – 2003. This was then analyzed so as to determine the rating of Unity bank.
While the second set of data presented for analysis was those opinions from the
273 responses from the administered questionnaires to the staff of Unity Bank.
The Chi – square technique of data analysis was used to determine the validity or
otherwise of the hypothesis. On testing the hypothesis, the decision rule was
applied which led to the findings.
Lastly, chapter five of this project work dealt with the summary as well as the
conclusion and recommendations of this study.
5.2 CONCLUSION
The Unity Bank just like many other banks in the Nigerian banking industry had
quite a number of problems ranging from non – compliance with laws and
regulations among others that necessitates their appraisal so as to determine and
measure their performance.
However, to do this successfully an objective of appraising the bank using the
CAMEL rating system was set for a given period of reference i.e. 1999 – 2003.
This is to allow the stakeholders to have the required knowledge of the well
being of the bank i.e. whether it was sound or unsound as was later on shown
through the computation of its composite score.

60
Also it was possible to ascertain the viability of the CAMEL rating system as a
tool for measuring bank performance as was later on proved by the research that
it is a good tool for measuring of Unity Bank’s performance.
5.3 RECOMMENDATION:
In line with the result of our findings of this work, it becomes pertinent to
make the following recommendations:
1. That even though the Unity Bank was found to be ‘very sound’ during the
period under review, there is still the need for the banking supervisors to
intensify more efforts as regards the state of affairs of this bank.
2. The CAMEL rating system is also recommended for better and stringent
banking examinations. As it has been proven to be a good tool for
measuring bank performance.
3. The Central Bank and all the relevant stakeholders should strive to have
more publications on this veritable tool of appraising bank performance.
4. Finally, the management of Unity Bank should avail themselves with the
opportunities provided by the banking industry and try to fulfil its
strategic role of stimulating economic growth and financial
intermediation.

61
BIBLIOGRAPHY
CHISNALL, P. M. (1981), Marketing research analysis and measurement; U. K.
McGraw Hills Books publishing
JAMES, C. V. (2002): 13th Edition “Financial Management and Policy Prentice
Hall of India, Private Limited
MEEKYAA, U. J. (1992), ‘The Preparation and Presentation of Research
Project’, Jos: Planning research Publications.
MILLS R. L. (1979): Statistics for Applied Economics and Business, New York:
McGraw Hills Inc.
OSUALA E. C. (2005): 3rd Ed. ‘Introduction to research Methodology, Onitsha
Nigeria: Africana – First Publishers Ltd.
PARK I. & Barth. O. (1998): Practical Guide to Theses and project Work, King
and Queens System Limited.
SHAO S. P. (1976); ‘Statistics for Business and Economics USA: Charles E.
Merrill publishing Company.
CIRCULAR (1990). ‘To all licensed banks and their Auditors on prudential
guidelines for license banks, 7th November
Federal Ministry of Information and National Orientation (2005):Obasanjo
Reforms: Banking Sector, Abuja: Production, Publication and
Documentation Department.
CENTRAL BANK OF NIGERIA (1999): ‘Banking Supervision Annual Report.
Annual Report and Accounts (1999 - 2003) Bank of the North Ltd.

62
Annual Report and Accounts (1999 - 2003) Intercity Bank Plc
Annual Report and Accounts (1999 - 2003) First InterState Bank Plc
Unity Bank Digest (November 2005), Volume 1 No 1
Unity Bank Digest (February 2006), Volume 2 No 1

63
AHMADU BELLOW UNIVERSITY, ZARIA
QUESTIONNAIRE
THIS QUESTIONNAIRE IS DESIGNED FOR UNITY BANK STAFF ONLY.
COURSE: MASTERS IN BUSINESS ADMINISTRATION
TO WHOM IT MAY CONCERN This research project is purely an academic exercise and therefore all information
given is to be exclusively used for the subject matter of the research. It has been
guaranteed that the information that would be given shall be treated as
confidential.
INSTRUCTION:
Please endeavour to tick () the appropriate option among the five (5) options
provided against each questions.
S/N QUESTIONS STRONGLY
AGREE
AGREE UNDECIDED DISAGREE STRONGLY
DISAGREE
1. The CAMEL Rating
System is effective in
measuring bank
performance.
2. Banks do get the
required appraising from
the CAMEL rating
System.
3. Every bank should be appraised on CAMEL Rating System.
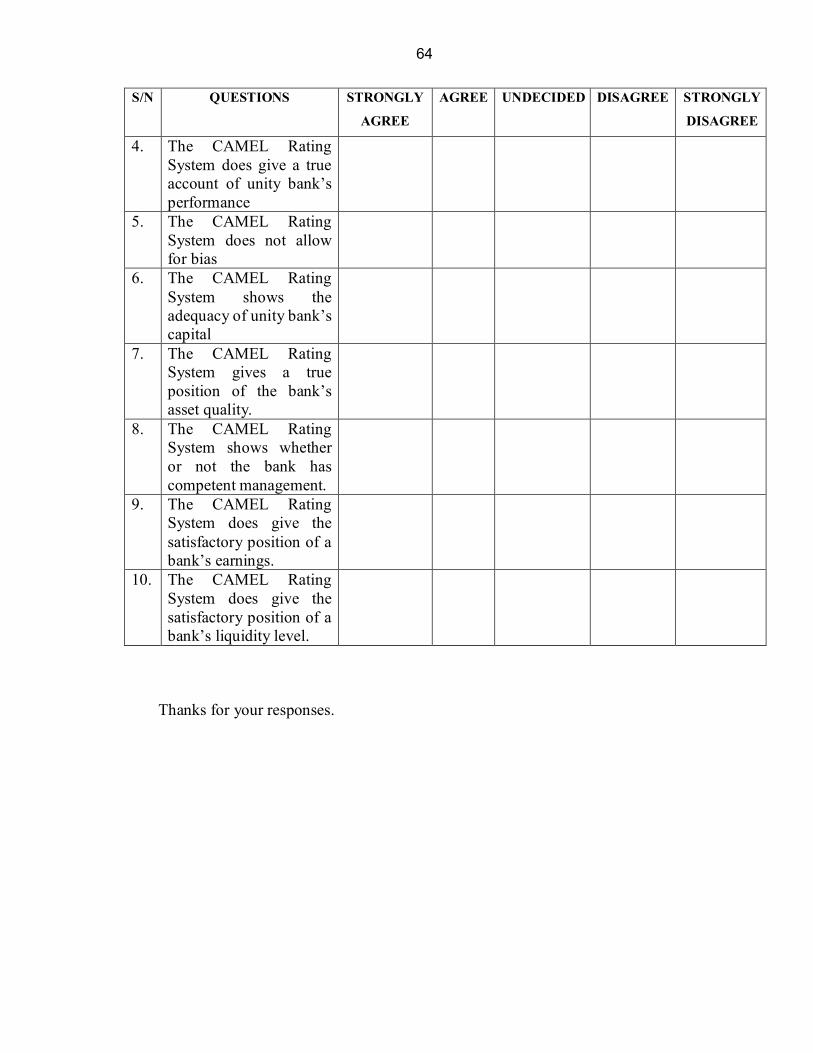
64
S/N QUESTIONS STRONGLY
AGREE
AGREE UNDECIDED DISAGREE STRONGLY
DISAGREE
4. The CAMEL Rating System does give a true account of unity bank’s performance
5. The CAMEL Rating System does not allow for bias
6. The CAMEL Rating System shows the adequacy of unity bank’s capital
7. The CAMEL Rating System gives a true position of the bank’s asset quality.
8. The CAMEL Rating System shows whether or not the bank has competent management.
9. The CAMEL Rating System does give the satisfactory position of a bank’s earnings.
10. The CAMEL Rating System does give the satisfactory position of a bank’s liquidity level.
Thanks for your responses.