an application of order restricted inference methodology to a problem in psychiatry
TRANSCRIPT

PSYCHOMETRIKA--VOL. 50, NO. 4, 421-427
DECEMBER 1985
AN A P P L I C A T I O N O F O R D E R R E S T R I C T E D I N F E R E N C E M E T H O D O L O G Y T O A P R O B L E M IN PSYCHIATRY
TIM ROBERTSON
DEPARTMENT OF STATISTICS AND ACTUARIAL SCIENCE THE UNIVERSITY OF IOWA
GILES WARRACK
DEPARTMENT OF MATHEMATICS UNIVERSITY OF NORTH CAROLINA
AT GREENSBORO
Using data which reflects upon the genetic makeup of patients, Cadoret, Woolson and Wino- kur (1977) test two theories regarding the genetic makeup of patients suffering from unipolar affective disorder. This hypothesis test is a good example of a problem in order restricted infer- ence. Using some recently developed techniques in order restricted inference we analyze these data and compare the analyses.
Key words: unipolar affective disorder, likelihood ratio tests, least favorable, chi-bar-square distri- bution.
Introduction
Cadoret, Woolson and Winokur (1977) consider the genetic factors contributing to the risk of unipolar affective disorders (UAD). They consider two theories accounting for the age of onset of UAD: (a) the "qualitative" theory, which postulates that the genetic makeup of those afflicted early in life and those who are afflicted later is somehow differ- ent, and (b) the "quantitative" theory which maintains that there is a particular type of gene causing UAD, and that those who succumb earlier do so because they possess the gene in greater numbers.
In their investigation, Cadoret et al. (1977) consider a sample of 767 women and 398 men suffering from UAD. In addition to the age at which each patient was first afflicted with the disorder, they had information regarding whether or not the patient's parents suffered from alcoholism or depression.
Their data reflect on the genetic makeup of the patients under study and the two above-mentioned theories are modeled in terms of the shapes of the functions relating the likelihood of alcoholism or depression in parents to the age of onset of the patient 's illness. If the qualitative theory holds then the risk function should be constant until some age (Cadoret et al., 1977, chose the age of forty), drop at that age, and be constant there- after. On the other hand, if the quantitative theory holds then the risk function should simply be nonincreasing. The shapes of the risk function under the two theories are shown in Figure 1.
Order restricted inference is that part of the theory and methods of statistics which studies techniques for taking into account shapes of regression functions such as those
Requests for reprints should be sent to Tim Robertson, Department of Statistics and Actuarial Science, The University of Iowa, Iowa City, IA 52242.
This research was sponsored by the Office of Naval Research under contract N00014-80-C-0321.
0033-3123/85/1200-7040500.75/0 421 © 1985 The Psychometric Society

422 PSYCHOMETRIKA
P
"quantitative" theory
,% "qualitative" theory
/
Il l I lU
20 3'0 4'0 5b 6'0 7b FIGURE 1.
Shapes of the risk function under the Two Theories Explaining the Age of
onset of U.A.D.
depicted in Figure 1. Thus, the problem of deciding between these two possible shapes for the risk function is a prime example of a problem to which those techniques should apply. It is well documented (Barlow, Bartholomew, Bremner, & Brunk, 1972) that taking such shapes into account can significantly improve the quality of the analysis. The most com- plete discussion of order restricted inference is to be found in Barlow et al. and general surveys are given in Bartholomew (1983) and Robertson (1985).
It is the purpose of this note to describe several different techniques for analyzing the data regarding the age of onset of unipolar affective disorder within the context of the model theorized by Cadoret et al. (1977) and to compare these analyses with their analy- sis.
Cadoret et al. (1977) divided each sample (men and women) into 6 age groupings according to the age at which the patient first suffered from the disorder. The six age groupings are 0-20 years, 20-29 years, 30-39 years, 40-49 years, 50-59 years, and over 60 years. Let Pi, i = 1, 2 . . . . . 6, be the respective risks for these age groups (likelihood of an alcoholic father in one case and the likelihood of a parent suffering from depression in the other case). In terms of statistical hypotheses, the qualitative theory implies that Ho: Pl = P 2 = P3 > P4 = P5 = P6 while the quantitative theory implies that HA: pl > P2 > "'" P6. Note that Ho implies H A so that an appealing way to decide be-

TIM ROBERTSON AND GILES WARRACK 423
TABLE i
Proportions of Alcoholic Fathers and Parents Suffering from Depression.
A. FEMALES Proportion
Age of # of of alcoholic onset of illness patients fathers
< 20 yrs. 68 .16 20-29 141 .ii 30-39 165 .15 40-49 140 .09 50-59 142 .04 60-69 iii .02
Proportion of depressive parents
.16
.18
.12
.09
.09
.07
B. MALES
< 20 yrs. 33 .09 .21 20-29 87 .08 .I0 30-39 67 .13 .15 40-49 83 .05 .15 50-59 58 .O3 .o9 60-69 70 .04 .10
tween the two theories would be to use the data to test H o as a null hypothesis when the alternative is restricted by H a (i.e., test Ho vs. H A -- Ho; H A but not Ho).
Likelihood Ratio Analysis
The data used by Cadoret et al. (1977) is contained in Table 1. Consider the problem of testing the null hypothesis, H0, against the alternative Ha - Ho. In order to illustrate the required calculations, we will discuss the fourth set of data, namely, the proportion of depressive parents of males suffering from UAD. In some ways, as we will see in section 3, this is the most interesting data set. Let /~ ; i = 1, 2 . . . . . 6, denote the unrestricted maxi- mum likelihood estimates for the probabilities Pl, P2 . . . . . P6 (i.e., the sample proportions). For our data,/~l = .21, /~2 = .10 . . . . . The maximum likelihood estimates subject to H o and Ha can be found using any one of several algorithms in chapters 1 and 2 of Barlow et al. (1972). Since our order restrictions are simple, the easiest algorithm is the pool adja- cent violators algorithm given in section 1.2 of Barlow et al. (1972). Let p*; i = 1, 2, . . . , 6, denote the maximum likelihood estimates subject to the restriction, H A . Starting with the unrestricted estimates .21, .10,. 15, .15, .09, .10 the values of/~2 and/~3 constitute a violator since/~2 </~3 and HA requires that P2 ~ Pa. The values of/~2 and/~3 are replaced by their weighted average, namely, (n2ffa + n3~a)/(n2 + n3) = (9 + 10)/(87 + 67) = .12 (hi is the number of probands in the ith group). Note that this value is the proportion of depressive parents of males in the 2nd and 3rd groups. It is obtained by "pooling" the samples from these two groups. We now consider the five numbers .21, .12, .15, .09, .10. The second and third values are "violators" and are replaced by their weighted average, (154 • .12 + 83 • .15)/237 = ( n 2 f f 2 q- /'13ff 3 -q- n4ffa)/(n 2 + n 3 -4:- h a ) = .13. Note that the weight placed upon .12 is the "pooled" sample size. We now have a sequence of four numbers, .21, .13, .09, .10, and the last two are replaced by their average (ns/~s + nr~6)/(n5 + nr) = .09. The resulting three numbers are decreasing in i and have no violators. It is helpful to visualize a "tree" with the final three numbers as roots and the unrestricted estimates as the top

424 PSYCHOMETRIKA
• 1 .1 5 . 5 . 9 .10
.21 I .1 5 .0 0
.21 .13 .09 FIGURE 2.
Pool Adjacent Violators tree.
branches as in Figure 2. The estimates restricted by H a are obtained by replacing each unrestricted estimated by its root, namely, .21,.13,.13,. 13, .09, .09.
Let/~; i = 1, 2 . . . . ,6, denote the maximum likelihood estimates subject to Ho. These estimates are obtained by pooling the data corresponding to ages less than 40, pooling the data corresponding to ages over 40, and then pooling the resulting values if we have a reversal. For the male-depression data, the estimates are/~ = .14; i = 1, 2, 3, and 26~ = .12; i = 4, 5, 6. The likelihood ratio,
6
A ~ - i - -1 6
I-I (p,*)'P'(1 - p ~ r 'c ' -p ') i = t
is then computed and the test rejects for large values of the statistic T = - 2 In A. For this data the value of T is 5.36.
The authors have recently been able to derive the appropriate limiting, null hypoth- esis distribution of T (Warrack & Robertson, 1984). The power function of T is not constant over the null hypothesis, H0. However, one can show that if hi---, ~ ; i = 1, 2 . . . . . 6, in such a way that the ratios nJnj each converge to some strictly positive number, then
sup lim Po[T >_ t] = ~ e l [gx, 3]PE[e2, 3]p[z2~+e2-2 -- t], (1) p e H o ni~ov 3 ~ g l + g 2 ~ < 6
where Pp is the probability computed under the hypothesis that p is the true vector of probabilities, X 2 denotes a standard chi-square variable with ~ degrees of freedom, and

TIM ROBERTSON AND GILES WARRACK
TABLE 2
P-values for Testing the Two Theories
425
TEST Combined
H 0 v s . H A H 0 v s . H A H 0 v s . H~ P - v a l u e
Male Depression
L-R Stat 5.36 3.25 2.53 P-value 0.065 0.056 0.073 0.027
Male Alcoholism
L-R Star 0.ii 0.0 0.Ii P-value 0.78 1.0 0.518 0.858
Female Depression
L-R Stat 4.96 4.17 0.79 P-value 0.082 0.043 0.303 0.069
Female Alcoholism
L-R Stat 7.94 0.36 7.60 P-value 0.019 0.288 0.007 0.014
PI[d l , 3] are the so-called level probabilities of order restricted inference (Barlow et al., 1972, sec. 3.3). These level probabilities can be very difficult to compute. However, in this case they can be computed using formulas (3.24) and (3.25) of Barlow et al. (1972) together with the fact that ~eal = t P~[-~'~, 3] = 1. These formulas give
1 1 Pt(1, 3) = ~ - 2"~ sin-1 p'
1 P1(2, 3) = ~, and
1 1 P1(3, 3) = ~ + ~ s in-x p,
where
P = nl + nz)(nz + n 3 ) J "
The values for Pz[f2 , 3] are computed in a like fashion using n4, ns, n6 in place of nl, n2, n 3 . For a discussion of recent research on the level probabilities of order restricted inference and an approximation which is adequate for most problems which are likely to be encountered in practice, see Robertson and Wright (1985). The limiting distribution for T derives its form from the fact that it is the probability distribution of the sum of two independent random variables, each variable being distributed according to Bartholo- mew's chi-bar-square distribution (see Barlow et al., 1972, Theorem 3.1).
Table 2 contains the value of the likelihood ratio statistic and the P-values for each of the four data sets. The last three columns of Table 2 concern the analysis of Cadoret et al. (1977) and will be discussed in the next section.
426 PSYCHOMETRIKA
Other Analyses
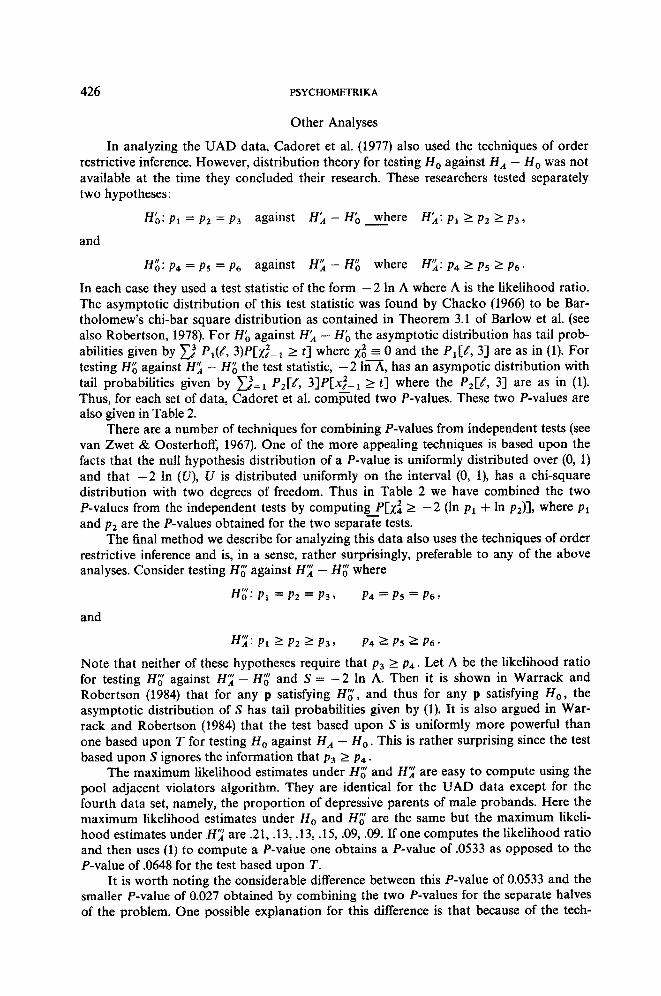
In analyzing the UAD data, Cadoret et al. (1977) also used the techniques of order restrictive inference. However, distribution theory for testing Ho against HA -- Ho was not available at the time they concluded their research. These researchers tested separately two hypotheses:
H~: Pl = P2 = Pa against H~t - H~ where H~: Pl -> P2 >- P3,
and
H~: P4 = P5 = P6 against H~ - H~ where H~: P4 ~ P5 > P6.
In each case they used a test statistic of the form - 2 In A where A is the likelihood ratio. The asymptotic distribution of this test statistic was found by Chacko (1966) to be Bar- tholomew's chi-bar square distribution as contained in Theorem 3.1 of Barlow et al. (see also Robertson, 1978). For H~ against H i -- H~ the asymptotic distribution has tail prob- abilities given by ~e 3 Pl(g, 3)P[z~- ~ -> t] where g z = 0 and the P~[g, 3] are as in (1). For testing H~ against HI - H~ the test statistic, - 2 lff-A, has an asympotic distribution with tail probabilities given by ~3= 1 P2[~, 3]P[xe2-1 > t] where the P2[f, 3] are as in (1). Thus, for each set of data, Cadoret et al. c o m ~ t e d two P-values. These two P-values are also given in Table 2.
There are a number of techniques for combining P-values from independent tests (see van Zwet & Oosterhoff, 1967). One of the more appealing techniques is based upon the facts that the null hypothesis distribution of a P-value is uniformly distributed over (0, 1) and that - 2 In (U), U is distributed uniformly on the interval (0, 1), has a chi-square distribution with two degrees of freedom. Thus in Table 2 we have combined the two P-values from the independent tests by computing__P[x] > - 2 (ln p~ + In P2)], where Pt and P2 are the P-values obtained for the two separate tests.
The final method we describe for analyzing this data also uses the techniques of order restrictive inference and is, in a sense, rather surprisingly, preferable to any of the above analyses. Consider testing H~' against H~ - H~' where
H~': Pl = P 2 = P 3 , P4-~P5 = P 6 ,
and
H~: pl >__p2 >_pa, p4 >--ps >---p6 •
Note that neither of these hypotheses require that P3 >- P4. Let A be the likelihood ratio for testing H~' against H ~ - H~' and S = - 2 In A. Then it is shown in Warrack and Robertson (1984) that for any p satisfying H~', and thus for any p satisfying H o, the asymptotic distribution of S has tail probabilities given by (1). It is also argued in War- rack and Robertson (1984) that the test based upon S is uniformly more powerful than one based upon T for testing H 0 against Ha - Ho. This is rather surprising since the test based upon S ignores the information that P3 ~ P4.
The maximum likelihood estimates under H~' and H~' are easy to compute using the pool adjacent violators algorithm. They are identical for the UAD data except for the fourth data set, namely, the proportion of depressive parents of male probands. Here the maximum likelihood estimates under H o and H~' are the same but the maximum likeli- hood estimates under H~ are .21, .13, .t3, .15, .09, .09. If one computes the likelihood ratio and then uses (1) to compute a P-value one obtains a P-value of .0533 as opposed to the P-value of .0648 for the test based upon T.
It is worth noting the considerable difference between this P-value of 0.0533 and the smaller P-value of 0.027 obtained by combining the two P-values for the separate halves of the problem. One possible explanation for this difference is that because of the tech-

TIM ROBERTSON AND GILES WARRACK 427
nique for combining the P-values we are, in effect, testing against a different alternative hypothesis. In both analyses the null hypothesis maintains that P l = P2 = P3 a n d P4 =
P5 = P6. Howver, in testing H~' against H ~ - H~' the alternative maintains that pl > P2 -> P3 and P4 > P5 > P6 while at least one of the statements P l = P2 = P3 o r - p 4 = P5 =
p6--does not ho~d. "On the other hand, because of the way we combined the P-values, one could argue that the alternative in this test stipulates that neither Pl = P2 = P3 nor P4 = P5 = P6 holds. A more restrictive alternative hypothesis may be expected to produce higher P-values on occasion. There are, of course, other ways of combining P-values according to the departures one expects from the null hypothesis (Cox & Hinkley, 1977, p. 34).
The referees of this paper have raised several points questioning whether these data and the two hyotheses, H o and HA, actually contrast the two theories for the age of onset of unipolar affective disorder in an unambiguous way. We have given some thought to these questions and in fact have corresponded with one of the authors of the paper in which the original analysis was discussed. We feel that the referees' points are valid. On the other hand their questions would seem to be pertinent to virtually all statistical analy- ses, to some extent. Moreover, a constant problem with much psychiatric data lies in the fact that precise measurements of variables such as age of onset, intensity of illness, et cetera are unobtainable.
References
Barlow, R. E, Bartholomew, D. J., Bremner, J. M., & Brunk, H. D. (1972). Statistical Inference Under Order Restrictions. New York: Wiley.
Bartholomew, D. J. (1983). Isotonic inference. Encyclopedia of Statistical Sciences, 4, 260-265. Cadoret, R. J., Woolson, R., & Winokur, G. (1977). Relationship of age of onset in unipolar affective disorder to
the risk of alcoholism and depression in parents. Journal of Psychiatric Research, 13, 137-142. Chacko, V. J. (1966). Modified chi-square test for ordered alternatives. Sankhya (B), 28, 185-190. Cox, D. R., & Hinkley, D. V, (1977). Problems and Solutions in Theoretical Statistics. London: Chapman and
Hall. Robertson, T. (1978). Testing for and against an order restriction on multinomial parameters. Journal of the
American Statistical Association, 73, 197-202. Robertson, T. (1985). Monotone relationships. Encyclopedia of Statistical Sciences, 5, 609-611. Robertson, T., & Wright, F. T. (1985). On approximation of the level probabilities and associated distributions
in order restricted inference. Biometrika, 70, 597-606. van Zwet, W. R., & Oosterhoff, J. (1967). On the combination of independent test statistics. Annual Mathemat-
ical Statistian, 38, 659-680. Warrack, G., & Robertson, T. (1984). A likelihood ratio test regarding two nested but oblique order restricted
hypotheses. Journal of the American Statistical Association, 79, 881-886.
Manuscript received 11/22/84 Final version received 5/14/85