an analysis of savings and investment of the farming … · · 2013-08-18saving behaviour of...
TRANSCRIPT

An analysis of savings and investment of the farming household in Bangladesh
Draft Report(Please do not quote)
Report Prepared byPollibir Unnayan Sangstha, Thakurgaon, Bangladesh
(Pollibir Development Organizations)for the Food and Agriculture Organization of the United Nations (FAO)
Rome, Italy, February 2013

Table of Contents
Page
Main findings 3
1. Introduction 4
2. Agriculture and food security in Bangladesh 6
2.1 Macro economic scenario2.2 Sectoral overview of agriculture 62.3 Food security situation in Bangladesh 14
3. Investment in agriculture 17
3.1 Overall Investment in agriculture 183.2 Public investment in agriculture
4. Analysis of Savings of the farming households 19
4.1 Ownership of land 194.2 Distribution of household by occupation 194.3 Income, expenditure and savings by size of own land in rural area 20
5. Saving behaviour of households with and without migrant workers 21
6. Household income and expenditure based household income 23and expenditure survey
6.1 Level of income by household sizes 246.2 Sources of income 276.3 Consumption expenditure 286.4 Food expenditure 30
Annexes 33
A1. Sample design 33A2. Concepts and definitions 34
2

Main findings
If income less expenditure is counted as saving then, overall, based on a nationwide survey, it appears that in Bangladesh the farming household in aggregate do not save. Household income and expenditure survey shows that for all group of households, the percentage of income saved is almost nil.
Household with no land and those with land but with holding size of less than half a acre, nearly 66 percent of the holdings of the country, have negative savings. The holding size of up to 1.5 acre also do not have any positive savings. Therefore if this group is also included then it would appear that all households with less than 1.5 acre of land, amounting to nearly 85 percent of the farming households, including the landless, do not have any positive savings. Only the households with holdings of 1.5 acre and above generate positive savings, and higher the holding size higher the rate of savings.
What emerged is that in terms of savings and investment, in addition to holding sizes, there is a clear distinction between the families with a migrant and those without a migrant. Average annual household saving for migrants amounts to Tk.87583 compared to Tk. 28957 for non-migrant households. Thus migrant households save about 25 percent of their total annual income while non-migrant households save about 22 percent of their total annual income. There is large difference between absolute saving of these two groups of households; the difference between the proportions of income saved is small. Savings are held in different forms, the most popular form being bank deposits.
Agricultural households – both migrant and non-migrant, invest in agriculture as well as outside agriculture. Agricultural households hold real as well as financial assets. They also reduce their financial obligation. As expected the migrant households spend a large amount on land. It was pointed out during FGD that migrant households are not limited to purchase of land in their own village or locality; they also buy land in urban areas. Acquisition of assets by migrant households is significantly different (higher) from that of non-migrant households in most cases.
3

1. INTRODUCTION
According to 6th Five Year Plan of Bangladesh (SFYP) for 2011-1015, one of the major problems Bangladesh economy is facing today is the stagnation of the overall level of investment in the domestic economy (Figures 1 and 2). Aggregate investment has stagnated in the 24%-25% of GDP range in recent years, despite a steady increase in the national savings rate. Although private sector investment has been increasing at a pace slightly above the rate of growth of GDP, a secular decline in public investment in relation to GDP largely offsets that, keeping total investment broadly stagnant in relation to GDP. This low level of investment significantly falls short of the investment rate needed to support the 8% GDP growth target set for in the 6th Plan.
Figure 1: Pattern of Private Investment Growth
Source: Bangladesh Bureau of Statistics
Figure 2: Public Investment and ADP in relation to GDP
Source: Ministry of Finance
Achieving the higher growth target will require total investment under the Plan to increase steadily by 8.1 percentage points in relation to GDP to 32.5% of GDP by FY15. In addition to the private sector, the public sector will play a catalytic role in raising the total investment rate to the required levels during the SFYP period. Public investments and policies would create the necessary investment climate and heighten investors’ (both national and foreign) confidence to undertake the required investments.
4

As in the past, much of the additional increase in the growth of investment is projected to come from the private sector. The secular increase in the relative share of private investment in total investment is in part a reflection of reforms initiated in late 1980s and in 1990s by removing restrictions, initiating privatization of public enterprises, and creating a more favourable investment climate. The growing share of private sector investment reflects favourable private sector response to the improved investment climate. However, the rate of growth of private sector growth in investment has slowed down in recent years due to infrastructure constraints which tended to intensify on account of declining public investment and the inability of the public sector to undertake large infrastructure projects (The 6th Plan).
The declining trend in public investment in relation to GDP is a matter of concern. Past difficulties in ADP implementation (Table 1) prevented the government from investing in many critical areas such as infrastructure and agriculture. Over the years the infrastructure gap has been widening and has become a binding constraint by choking Bangladesh’s economic growth potential.
Table 1: Budget ADP Allocation and Actual Spending, FY05-FY11
Fiscal Year Budget Actual Actual as % of Budget% Increase over the
previous year
(In billion taka) (%) (%)FY05 227 194 85.3 1.8FY06 246 175 71.0 -9.6FY07 260 176 67.5 0.5FY08 250 184 73.8 4.8FY09 256 193.7 75.7. 5.3FY10 305 255.4 83.7 31.8
FY11(estimate) 385 358.3 93.1 40.2.Source: Ministry of Finance
Efforts to reverse the declining trend in ADP was launched with the FY10 budget and intensified further in FY11 budget, the first year of SFYP. The Government established an ambitious target for ADP in FY10 by setting the ADP target at Tk. 305 billion, which was about 57% higher than the outturn of the preceding year. Although the actual increase was lower (31.8%), this was a major improvement over the ADP implementation rate recorded in recent years. After many years of steady decline, ADP spending in relation to GDP increased by 0.5% in FY10. Building on this gain, the target for ADP in FY11 has been set at 0.8 percentage points higher at 4.9% of GDP. The Plan’s objective is to sustain this momentum by increasing the ADP size by an additional 2.4 percentage points to 6.1 % of GDP. Special emphasis has also been given to infrastructure and power sectors in the FY11 ADP. Implementing this larger ADP, while maintaining the quality of spending, will certainly be a major challenge. To ensure the quality of spending and better project implementation, all ministries are being brought under the Medium Term Budget Framework (MTBF). The planning and budgeting processes are being strengthened to improve the quality of public investment.
Aggregate Savings
The sharp rise in investment projected in the SFYP will be largely supported by a significant increase in national savings. National savings, comprising domestic savings and inflow of workers’ remittances, have been on a rising trend owing to increased domestic saving but also because of rapid growth in the inflow of remittances (Figure 3). As the national savings rate increased the domestic investment effort
5

did not expand commensurately causing the external current account balance to reach a record surplus of 3.7% of GDP in FY10.
Figure 3: Gross National Saving Rebound and its Key Drivers
Source: Bangladesh Bureau of Statistics and the Bangladesh Bank
Building on the recent positive performance on the national savings front, the Plan aims to increase national savings rate by 2.1 percentage points to 32.1% of GDP. The pace of increase is about the same as recorded in recent years. The fall in the savings rate in FY11 was primarily attributable to the slowdown in remittances and a marked increase in imports associated with the global commodity price increase. The savings rate should revert back to the level of the base year by FY13 as global prices stabilize and growth in the inflow of remittances reverts back to its projected normal level. Inflow of workers’ remittance has been playing a very important role in the growth of national savings in Bangladesh in recent years.
The increase in national savings projected under the Plan will depend on the continued growth in remittances. However, given that agriculture remains an important dominant economic sector of the country, savings behaviour of farming sector of the country will be an important determinant of overall savings of the country. This report investigates the saving behaviour of the farming sector of the country. In the next section the report describes the agriculture sector of the country, followed by analysis of household savings, based on survey of household income and expenditure.
2. THE ECONOMY, AGRICULTURE AND FOOD SECUIRITY IN BANGLADESH
2.1 Macro Economic Scenario
The GDP of Bangladesh over the last five years grew consistently at an average rate above 6 percent. The growth of import-export trade, secular increasing trend in the flow of remittance and the favourable balance of the current account kept the external sector to some extent stable.
6

Fig. 2 Recent changes in structure of GDP
During the recent decade overall GDP of Bangladesh has been considerably shown upward trend. But the growth in agriculture GDP slightly declined with an average of 3.4% during 1997 to 2008. Agriculture being the supportive of growth of the economy, there is no other alternative but to develop agriculture sector for alleviation of poverty by attaining accelerated economic growth. Since provision of food security, improvement of the living standard and generation of employment opportunities of the huge population of the country are directly linked to the development of agriculture, there have been continued efforts by the Government for the overall development of this sector.
2.2 Sectoral overview of agriculture
Agriculture is the most important sector of Bangladesh economy due to its role in food security, employment and livelihood. The current share of agriculture to GDP is around 21%, although this share has been declining in the last ten years along with the one of the agricultural sub sectors’ (Table 1). Still more than 70% of the people in Bangladesh are directly or indirectly employed in this sector.
The agriculture of Bangladesh is dominated by crops which accounts about half of total agricultural GDP Fisheries & livestock are also important sub-sector contributing to agricultural GDP (Table 1). It is important to note that in the recent decade the subsector of livestock, forestry and fisheries had faster growth rate (Table 2). There are, however, substantial year to year fluctuations in these rates and it is most pronounced in case of crops.
Table 1.Contribution of agriculture to GDP (%) at constant prices (Base: 1995-96=100)
Sector/ Sub-Sector
Year
1999-00
2000-01
2001-02
2002-03
2003-04
2004-05
2005-06
2006-07
2007-08
Agriculture 25.58 25.03 23.99 23.47 23.08 22.28 21.85 21.37 20.88
A. Crops 14.59 14.7 13.75 13.43 13.23 12.51 12.28 12 11.7
B. Livestock 3.02 2.95 2.96 2.93 2.91 2.95 2.92 2.88 2.79
C. Forestry 1.88 1.87 1.88 1.86 1.83 1.82 1.79 1.76 1.75
D. Fishing 6.09 5.51 5.4 5.25 5.11 5 4.86 4.73 4.64
Source: Statistical Yearbook of Bangladesh 2007
7
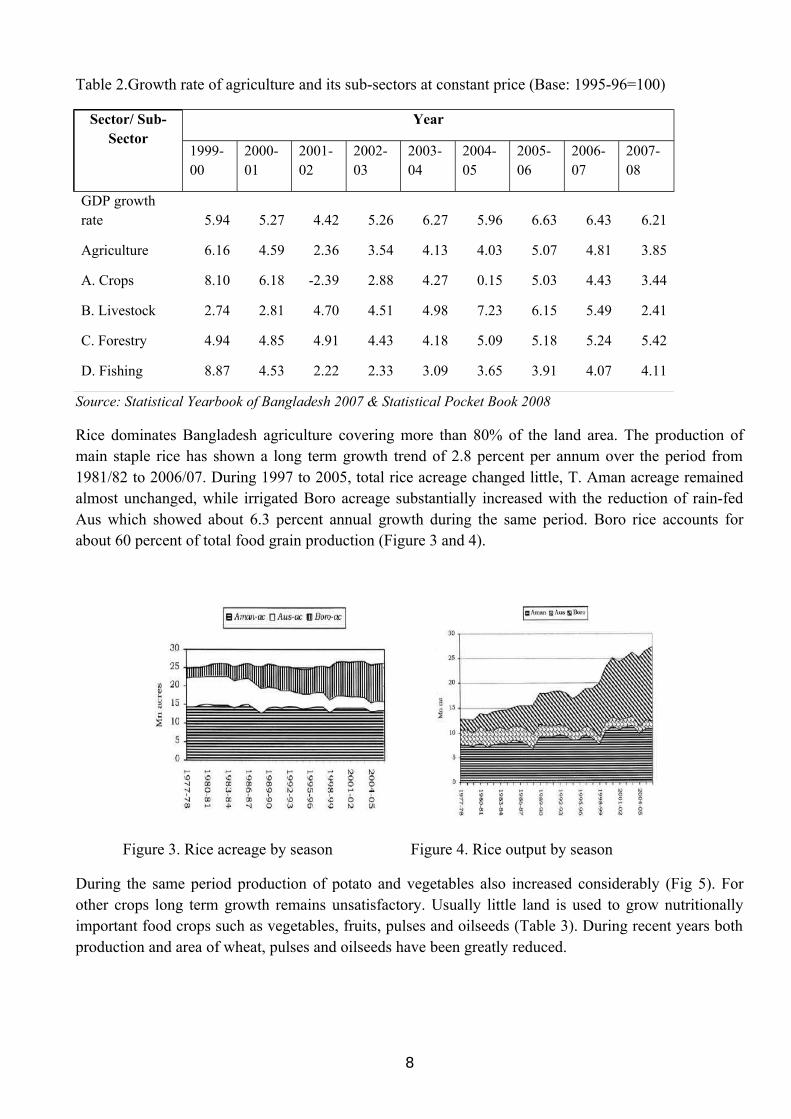
Table 2.Growth rate of agriculture and its sub-sectors at constant price (Base: 1995-96=100)
Sector/ Sub-Sector
Year
1999-00
2000-01
2001-02
2002-03
2003-04
2004-05
2005-06
2006-07
2007-08
GDP growth rate 5.94 5.27 4.42 5.26 6.27 5.96 6.63 6.43 6.21
Agriculture 6.16 4.59 2.36 3.54 4.13 4.03 5.07 4.81 3.85
A. Crops 8.10 6.18 -2.39 2.88 4.27 0.15 5.03 4.43 3.44
B. Livestock 2.74 2.81 4.70 4.51 4.98 7.23 6.15 5.49 2.41
C. Forestry 4.94 4.85 4.91 4.43 4.18 5.09 5.18 5.24 5.42
D. Fishing 8.87 4.53 2.22 2.33 3.09 3.65 3.91 4.07 4.11
Source: Statistical Yearbook of Bangladesh 2007 & Statistical Pocket Book 2008
Rice dominates Bangladesh agriculture covering more than 80% of the land area. The production of main staple rice has shown a long term growth trend of 2.8 percent per annum over the period from 1981/82 to 2006/07. During 1997 to 2005, total rice acreage changed little, T. Aman acreage remained almost unchanged, while irrigated Boro acreage substantially increased with the reduction of rain-fed Aus which showed about 6.3 percent annual growth during the same period. Boro rice accounts for about 60 percent of total food grain production (Figure 3 and 4).
Figure 3. Rice acreage by season Figure 4. Rice output by season
During the same period production of potato and vegetables also increased considerably (Fig 5). For other crops long term growth remains unsatisfactory. Usually little land is used to grow nutritionally important food crops such as vegetables, fruits, pulses and oilseeds (Table 3). During recent years both production and area of wheat, pulses and oilseeds have been greatly reduced.
8

0
5000
10000
15000
20000
25000
30000
35000P
ro
du
cti
on
in
th
ou
san
d M
t
Rice
Wheat
Potato
Pulses
Oilseeds
Vegetables
Fig. 5 Trend in production of rice and non-rice crops
Table 3 Percentage of land area planted to different crops in 2004-05
Land area percentage
Rice 79.4
Wheat 4.09
Pulses >2.80
Oilseeds >2.37
Potato >2.39
Jute >2.86
Fruits >1.36
Sugar cane >1.15
Tea >0.39
Spices and condiments >2.21
Vegetable >2.14
During recent years both production and area of wheat, oilseed and pulses have greatly reduced. The growth of pulses was only 0.3% while sugar was negative 1.2% other than rice and potatoes all other crops showed the decline in growth rate (Table 4).
Table 4 Growth of non rice crops in Bangladesh during 1971 to 2007
Food Items Percent/Year (1971-2007)
Wheat -2.9
Pulses 0.3
9

Oil crops 2.3
Potatoes 3.0
Vegetables 1.5
Sugar -1.2
Fish 2.5
Meat 2.3
Milk 2.3
Egg 4.0
The preceding section describes the contribution of principal drivers in crop sector growth:
Irrigation
The recent agricultural growth in the country has been largely due to expansion of minor irrigation through the use of Deep Tubewells (DTWs), Shallow Tubewells (STWs) and Low Lift Pumps (LLPs) (Figure 6). During 2006, there were 29,170 DTWs, 12,02,720 STWs and 1,07,290 LLPs fielded and the total irrigated area was estimated at 4.883 M ha which was 56.51% of the net cultivable area of the country; where irrigation coverage by groundwater and surface were 80.6% and 19.4%, respectively. Again, in 2007 the national irrigation coverage was 5.05 million hectares which is 60.92% of the total cultivable land, where groundwater covered 78.98% and surface water covered 21.02% of the total irrigated area (MoA, 2008).
Fertilizer use
Fertilizer use in Bangladesh has increased from 3.28 million tons in 2001-02 to 3.55 million tons in 2006-07 (Figure 4). During 2002 to 2009 the growth rate of total fertilizer use in Bangladesh was 4.2% per annum. Between 2002 and 2009, the demand for fertilizer in Bangladesh has increased by 25%. Fertilizer prices in Bangladesh have risen very sharply during 2008. The cost of Triple Super Phosphate (TSP) and Muriate of Potash (MOP) rose from BDT 16 in 2007 to BDT 50 and BDT 40 per kg, respectively while the cost of urea was maintained at BDT 6 per kg by a government subsidy,
0
500
1000
1500
2000
2500
3000
3500
4000
4500
5000
5500
Are
a Ir
rig
ated
in 0
00' h
a
82/8
383
/84
84/8
585
/86
86/8
787
/88
88/8
998
/90
90/9
191
/92
92/9
393
/94
94/9
5
95/9
696
/97
97/9
898
/99
99/0
000
/01
01/0
202
/03
03/0
4
04/0
505
/06
06/0
707
/08
Year
Fig 1: Trend of Irrigation Growth in Bangladesh
:
10
Fig.6 Yearly Trend in Irrigated Land Area in Bangladesh

reduced greatly by government. It is however noted that very recently the government has increased price urea to Tk 12 per kg and the prices of MOP and TSP have been largely reduced through government intervention. In the fiscal year 2010-11, government has decided to support 1.82 crore farmer families under the agro-input Assistance-Card for purchasing diesel, fertilizers, seeds and receiving credit.
Supply of Quality Seeds
A number of agencies, both public and private are presently involved in seed production and distribution system of the country. The fact is that only about 18% seed requirements of the country can be met from certified and Truthfully Labelled Seeds (TLS) of Government and private sources, the remaining 82% seed comes from the farmers own seed. There are serious problems of seed quality supplied by public, private and farmer’s saved seed.
Livestock
In 2006-07, total cattle population of the country was about 23 million, buffaloes 1.21 million, goat and sheep 23 million and poultry and duck 246 million. The production of milk, meat (beef, mutton and chicken) and eggs had an increasing trend over the past several years (Fig 7 and 8). However, its total production is still far below the national requirements. The milk production showed slow growth but sustained growth while recently meat production is slightly decreasing. On the other hand, the egg production largely fluctuates due to avian influenza.
0
5
10
15
20
25
302002-03
2003-04
2004-05
2005-06
2006-07
2007-08
Pro
du
ctio
n (
Lac
to
n)
Milk
Meat
420004400046000480005000052000540005600058000
2002-03
2003-04
2004-05
2005-06
2006-07
2007-08
Eg
g p
rod
uct
ion
(L
ac N
um
ber
)
Fig. 7 Trend in production of milk and meat in Bangladesh Fig. 8 Trend in egg production in
Bangladesh. Data from Bangladesh Economic Review, 2009
Fisheries
Long term growth rate in production of fish during 1971 to 2007 was 2.5%. During 2001-02 to 2007-08 total fish production increased from 1.89 million MT to 2.59 million MT with an average annual growth rate of 5.3%, while inland fish and cultured fish production had growth rates of 8.2% and 4.2%, respectively (Table 5). Overall shrimp production has increased steadily over the last 20 years (Figure 9 and 10), but still much lower than that of the neighbouring countries such as Thailand with 800 kg/ha (Samsak et al. 2005) and India with 600 kg/ha (Vasudevappa, 2005). Among shrimp producing
11

countries, Bangladesh ranks fourth with respect to area under shrimp farming and sixth in volume of production.
0
5
10
15
20
25
30
2001-02
2002-03
2003-04
2004-05
2005-06
2006-07
2007-08
Prod
uctio
n in
Lac
met
ric to
n Inland fish
Culture fish
Marine fish
Total fish
Fig 9. Trend in fish production Fig. 10. Trend in shrimp production
Data from Bangladesh Economic Review, 2009
Table 5. Recent trend in fish production in Bangladesh during 2001-08
CommodityGrowth (during 2001-
2008)
Inland fish 8.2
Culture fish 4.2
Marine fish 2.4
Total fish 5.3
Source: Bangladesh Economic Review, 2009 and authors calculation
Forestry
The production of wood in Bangladesh since 1970 is increasing. This increase depends largely on the expansion of new social forestry plantations involving private participants. Beside these, over 10 million homesteads in about 88 thousand villages across the country possess a large quantity of trees. These homesteads are the major suppliers of wood for the nation. The role of the homesteads in growing stock is presented in Table 6. The total forest area in Bangladesh is 2.53 million hectare in 2007; but all do not necessarily carry tree cover. The tree covers 48.8% of the forest land.
Table 6. Estimated growing stock of wood in Bangladesh
Forest type Gross volume of growing stock of wood,
12

million m3
1990 2000 2005
Hill forest* 19.34 17.26 16.03
Plain land forest* 2.07 1.98 1.97
Littoral forest* (Mangroves)
13.14 11.97 12.00
Village/homestead forest**
69.16 89.58 101.94
* Data from FAO, 2005.
**Hammermaster data of 54.8 million m3 in 1981 with growth rate of 2.62 ( Choudhury and Hossain 2009 used to derive the estimated data).
2.3 Current Food security situation
About 40% of Bangladesh’s total population are calorie poor, consuming less than 2122 kcal per capita per day, while one-fifth of population are hard core poor who consume less than 1805 kcal per capita per day (BBS, 2007). According to SOFI 2009, Bangladesh has an estimated 40.2 million undernourished people in 2004-061. One positive aspect is that the proportion of undernourished in total population has declined from 36% in 1990-92 to 26% in 2004-06. Out of a total of 336.6 people who are estimated to be undernourished in South Asia, 12% comes from Bangladesh (India’s share is 75%). The most recent estimates (Household Income Expenditure Survey – HIES, 2005) revised to up to 56 million (still 40% of the population) the absolute number of undernourished people, those who fail to meet minimum level of caloric consumption needs of 2122 Kcals/person/day. Within this population 27 million are unable to consume 1805 Kcal/person/day and 11 million are below the consumption level of 1600 Kcal/person/day.
Food security worsens with inter-year shortfall in food grain production caused by climatic variations and natural disaster such as floods, tidal surge and insect and pest attacks. Variations in food intake also exist between regions of the country, between adults and children and between men and women at the household level.
Household Income and Expenditure Survey 2000 shows that malnutrition is widespread among the poorest 14 percent of the rural population, who consume only about 1600 Kcal per capita per day. Another 10 percent consume between 1600 and 1800 Kcal (BBS, 2000). Bangladesh Demographic and Health Survey (2004) shows that 43 percent of children under 5 are stunted and the prevalence of stunting increases from 10 percent of children below 6 months to 51 percent of children from 48-59 months of age. The survey also shows that mothers suffer from calorie deficiency and pregnant women suffer from anaemia.
1 Undernourishment exists when caloric intake is below the minimum dietary energy requirement (MDER). The MDER is the amount of energy needed for light activity and a minimum acceptable weight for attained height, and it varies by country and from year to year depending on the gender and age structure of the population.
13

Bangladesh has made good progress since 1992 in reducing income poverty based on the national poverty line. The country was able to lower the overall incidence of poverty from 58.8 percent in 1991-92 to about 48.9 percent in 2000, with an annual rate of decrease of 1.8% per year. It further declined to 40% in 2005 with a decreasing rate of 3.9% per annum (Fig. 11). In spite of the advancement, about 57.7 million people are poor with one-third caught in hard-core or extreme poverty.
Fig 11. Proportion of population below national poverty line during 1991 to 2005 (estimates for 2007)
Bangladesh past efforts towards improving food security have resulted in a 5% point decrease in the proportion of undernourished between 1990-1992 and 2002-2004 down to 30%. However, mainly due to population growth, the number of undernourished actually increased from 39.3 million to 44 million (POA, 2008-15).
Based on one of the population projection of 181.4 million in 2015, attaining the MDG hunger target implies that the number of undernourished people must decrease to 31.8 million. Meeting the WFS hunger, i.e. reducing the number of undernourished to 19.65 million by 2015, implies that the MDG1 target needs to be overachieved with the proportion of the undernourished brought down to 11% (POA, 2008-15): a significant challenge for Bangladesh where the absolute number of undernourished has seen only a limited decrease in the period 2005-2009.
Table 7: Proportion and number of undernourished in Bangladesh
Past status Current Mid/Long Term
Targets
1995-97 2003-05 2004-06 2015
FAO – Proportion of undernourished (%) Baseline
40 27 26 18 (MDG)
14

1990-92: 36
FAO- Number of undernourished, million – Baseline: 1990-992: 41.6
51.4 40.1 40.2 20 (WFS)
Source: Monitoring Report 2009 of the National Food Policy Plan of Action.
Total food grain (rice and wheat) production in 2006/07 stood at 28.05 million tons, but there was a short fall of about 1.05 million tons of rice (Aus and Aman) in 2007/08 due to double floods in August and September 2007. The total food grain production further increased to 32.17 million in 2008-09 (Monitoring Report, 2009 – Fig 12, below). In 2007-2009, rice availability, defined as the sum of net production and total import, was estimated to be 14-15% higher than the estimated human consumption needs- assuming a consumption of 453 gm/person/day- while net production alone was estimated to be 12.6% in exceeds of needs implying achievement foodgrain self-sufficiency.
Availability of pulses, oilseeds, vegetables and fruits, which are the chief sources of protein, mineral and vitamin still remain far below the actual requirements, making it difficult to provide adequate diet for all. Fish production increased from 0.95 million tons in 1991-92 to 2.33 million tons in 2005-06. Meat, milk and egg production has also increased significantly over the years (Table 5), but the availability of these food items is far less than required for a nutritionally balanced diet.
Fig 12. Rice production in Bangladesh (from 1972-73 to 2008-2009)
Generally, improvements in the production/availability of food grains have not been accompanied by commensurate increases in the production of other major foods, such as, pulses, oilseeds fruits, vegetables, fish, meat and eggs, which are essential for a diversified and balanced diet.
For a large growing population of Bangladesh, it is more important to know the per capita availability of food items. On a per capita basis, availability of cereals has increased from 453 gm/day in 1991/92 to 540 gm/day in 2006/07. Per capita availability of potato, fruits and vegetables has also increased, but per capita availability of pulses and oilseeds has remained stagnant or declined (Table 8). Fish availability per capita increased from 27 gm in 1994-95 to 41 gm in 2003-04. Availability of meat, milk and eggs per capita has also increased. Per capita per day availability of energy has increased from 2069 calories in 1991/92 to 2489 calories in 2003/04.
Table 8: Per Capita Availability of Major Food Items: 1994-95 to 2004-05
15

Food Items
Availability
(gm/capita/day)
1994-95 1999-00 2004-05
Potato 32 57 108Pulses 11 8 10Oilseed 10 8 10Vegetable 21 24 108Fruits 24 22 68Fish 27 35 41*Meat 11 15 21Milk (ml) 35 36 45Egg (million) 2.76 4.20 5.54
Source: BBS, DAE, DLS, DOF, BARC; * Refers to 2003-04.
The average Bangladeshi diet contains very high intake of cereals (74.4% of total dietary energy of 2240 kcal) with too little contents of non-cereal food items and thus an average diet is not only deficient in energy but also imbalanced and deficient in vitamins and minerals. Gaps between requirement and production of other important food crops and livestock products are wide. According to MOA estimate, deficit of pulses and oilseeds are 1.12 million tons and 2.26 million tons respectively (2004-05). Similarly, shortage of vegetables and fruits is estimated at 2.24 million tons and 2.70 million tons respectively. The national deficit of milk and meat is 10.54 million tons and 5.12 million tons respectively, and of eggs is 9,253 million (DLS, 2007). The national requirement of fish is estimated at 3.0 million tons, showing a deficit of 0.67 million tons (DOF, 2007).
There is wide gap between projected cereal production and requirements for 2014-15. The implications of this projected consumption and requirements for acceleration and sustenance of cereal and non-cereal food production is that it is necessary to change in land use pattern for crop diversification, and improvement in food processing and food consumption habit.
3. Investment in agriculture
3.1 Overall investment in agriculture
There is no available time series data of investment in the agriculture sector of Bangladesh . However, BBS calculated GFCF in agriculture for the 4 years only from FY ‘97 to FY ’00. Table --- gives total investment in the economy and in agriculture, as estimated by BBS2.
Table 5: Investment in economy and in agriculture (Million Taka)FY 97 FY 98 FY 99 FY 00
Total 242,427 275,863 315,513 355,149Public 91,164 102,851 118,279 134,247Private 151,263 173,012 197,234 220,902Investment in agriculture (total) 20,025 22,924 26,409
29,904
Public 4,657 4,793 5,785
6,825
2 Methodology used to calculate GFCF is not publicly available nor any explanation why this attempt was not continued.
16

Private 15,368 18,131 20,624
23,079
Source: BBS
From the table, we can note that the average growth rate of public Investment is around 13.7 percent while average growth rate of private investment is around 13.4 percent. Investment in agriculture increased at a rate of around 12.5 percent per year. Both public and private investment in agriculture increased at about the same rate of the total. However, more than 75 percent of total agricultural investment is from private sector and this share remained same during the estimated period.
Shamsur Rahman and Atiqur Rahman (2002) also estimated the level of investment (capital formation) in Bangladesh agriculture. According to their estimates, while the investment in the Service sector grew exponentially, investment in agriculture remained static.
Figure ---:Trends in major sectoral capital stock in Bangladesh, 1980/81 to 1998/99 (million taka)
Data Source: Shamsur Rahman and Atiqur Rahma (2002)
3.2 Public Investment
As regard public investment, the allocation of ADP to Ministry of Agriculture (MOA) is a good indicator of the public investment in and for agriculture. Table --- gives ADP allocation of Ministry of Agriculture from 1980 -81 to 2006-07. It shows that though the share of allocation to Ministry of Agriculture has declined from about 16 percent in 1980 to about 2 percent in 2007, the absolute figures have increased moderately. In 1980, the allocation was 3729 million taka and in 2007 it was 5507 million taka. MOA invested almost entire amount on crop and irrigation.
Table 11: ADP allocation of Ministry of Agriculture from 1980 -81 to 2006-07 (Million Taka)
Plan Period Year CropMinor Irrigation
Forestry
Rural Institution Total
Country Allocation
Share of MOA (%)
Second five year1980-81
1834.30 1895.60 - -
3729.90 23689.90 15.74
1981-82
2096.40 1925.60 - -
4022.00 27152.50 14.81
1982-83
2504.70 1668.10 - -
4172.80 31263.00 13.35
1983-84
2894.70 1831.60 - -
4726.30 35847.00 13.18
1984-85
2096.10 1661.00 - -
3757.10 35084.10 10.71
17
0
500000
1000000
1500000
2000000
2500000
3000000
3500000
4000000
4500000
Service
Industry
Agriculture

Plan Period Year CropMinor Irrigation
Forestry
Rural Institution Total
Country Allocation
Share of MOA (%)
Third five year1985-86
1154.70 1195.60 - -
2350.30 40960.00 5.74
1986-87
1351.60 1310.20 - -
2661.80 45130.00 5.90
1987-88
1425.50 1137.70 - -
2563.20 46510.00 5.51
1988-89
2001.50 1431.00 - -
3432.50 45960.00 7.47
1989-90
1466.00 1427.40 - -
2893.40 51030.00 5.67
Fourth Five Year1990-91
1898.00 1192.00 - -
3090.00 61210.00 5.05
1991-92
2892.30 1332.00 - -
4224.30 71500.00 5.91
1992-93
2276.00 1096.20 - -
3372.20 81210.00 4.15
1993-94
2780.40 1302.00 - -
4082.40 96000.00 4.25
1994-95
2942.90 1490.40 - -
4433.30
113500.00 3.91
Two Year1995-96
2952.68 1204.30 - -
4156.98
104470.00 3.98
1996-97
3434.65 952.00 - -
4386.65
117000.00 3.75
Fifth Five Year1997-98
3589.30 721.80 - -
4311.10
122000.00 3.53
1998-99
3709.70 810.28 - -
4519.98
140000.00 3.23
1999-00
4292.90 903.40 - -
5196.30
165000.00 3.15
2000-01
3713.10 974.50 - -
4687.60
182000.00 2.58
2001-02
3346.60 847.10 - -
4193.70
160000.00 2.62
Three Year 2002-03
3409.78 817.70 - -
4227.48
171000.00 2.47
Rolling Plan2003-04
3677.30 1030.30 23.40 200.00
4931.00
190000.00 2.60
2004-05
3123.20 1542.10 200.00
4865.30
220000.00 2.21
2005-06
3363.30 2430.70 200.00
5994.00
245000.00 2.45
2006-07
3354.60 1923.20 29.20 200.00
5507.00
260000.00 2.12
Source: Ministry of Agriculture
4. Savings behaviour of the farming households
18

4.1 Ownership of Land
Table 13 presents distribution of households by size of land owned and operated in rural area of Bangladesh. It is revealed from the table that, in rural area, percentage of household having no land reduced to some extent in 2010. Household having land up to 0.49 acre increased from 55.2% in 2005 to 60.5% in 2010, whereas, it was 60.0% in 2000. It is also reveled from the table that, the percentage of households with land ownership 7.50 acre and over decreased to 1.1% in 2010 compared to 1.6 in 2005 and 1.3 in 2000.
In case of operated land, it may be seen from the same table that, the percentage of households having smaller size of operated land i.e. up to 0.49 acre increased over time. It was 52.9% in 2005 which increased to 55.4% in 2010.
Table 13: Rural Household by Size of Land (Owned and Operated)Land Size (in acre) HIES-2010 HIES-2005 HES-2000
1 2 3 4Owned Land
Total 100.0 100.0 100.0Landless 4.6 5.3 5.60.01-0.49 60.5 55.2 60.00.50-0.99 11.6 12.4 9.51.00-2.49 14.6 17.6 15.42.50-7.49 7.6 8.7 8.17.50+ 1.1 1.6 1.3
Operated LandTotal 100.0 100.0 100.0
Landless 3.6 4.1 4.90.01-0.49 55.4 52.9 54.00.50-0.99 14.2 14.2 11.91.00-2.49 18.3 19.1 18.82.50-7.49 7.8 8.6 8.87.50+ 0.7 0.9 1.6
4.2 Distribution of household by occupation
Table 14 provides distribution of head of households by main occupation and by residence. In 20I 0, the highest 36.1% of the head of household was engaged in agriculture, animal husbandry, forestry and fisheries, I6.9% were engaged in production & related works and transport works, 11.6% in the sales occupation and 2.9% were in clerical and related workers and government executives. The percentage of head of household engaged in administrative and managerial works was 2.9%. In the rural area, 46.4% of the head of households engaged in agriculture occupation followed by production and related workers and transport works 13.4%. In the urban area, 26.5% households are engaged in production and related works and transport workers followed by 18.9% in sales works.
Table 14: Distribution of Head of Households by Residence and Main Occupaiton-2010
Sly No. Major Occupation Nationa Rural Urban1 2 3 4 5
I Professional, technical & related workers 6.1 4.8 9.52. Administrative & managerial works 2.9 1.9 5.83 Clerical & related works and govt. executive 2.9 1.3 7.04 Sales workers 11.6 8.9 18.95 Service workers 5.9 5.4 7.47 Agricultural, animal husbandry, Forestry & 36.I 46.4 8.3
19

8 Production & related workers and transport 16.9 13.4 26.59 Head not working I7.6 I7.9 16.710 Total 100.0 100.0 100.0
4.3 Level of Income and Expenditure by Size of Own Land in Rural Area
Table 15 provides information on monthly household income, expenditure, family size and number of earners by size of own land in the rural area. In the landless group, the average income per household was taka 5713 in 2010. The corresponding figures for 2005 & 2000 were taka 3299 & 3248 respectively. On the other hand, the average income of the households owning land size 7.50 acres & above was taka 29673 which was 5.2 times higher than the average income of landless group. Average monthly income per household in rural area increased with the increase of size of owned land owned. Thus, land holding size is an important determinant of income particularly in rural area. It appears from the table 15 that, the highest percentage of households (38%) owned land 0.05-0.49 acres, where 80% of households owned land 0.01-1.49 acres. This indicates that, the farm size is very small in Bangladesh.
Another important feature was found that, the family size increased with the increase of own land size owned. The family size were 3.83 for the landless, 4.09 for land size 0.01-0.04 acre, 4.53 for land size 0.05-0.49 acre, 4.69 for land size 0.50-1.49 acres, 4.88 for land size 1.50-2.49 acres, 5.37 for land size 2.50-7.49 acres and 5.83 for land size 7.50 acres or more.
The number of earners per household also increased with the increase of land size except for landless household. Number of earner was 1.27 in rural area where 1.31 for the landless, 1.16 for land size 0.01-0.04 acre, 1.26 for land size 0.05-0.49 acre, 1.27 for land size 0.80-1.49 acres, 1.34 for land size 1.50-2.49 acres, 1.50 for land size 2.50-7.49 acres and 1.83 for land size 7.50 acres or more.
The monthly household expenditure by own land size also shows increasing pattern with the increase of Own land size owned.
Table: 15 Income, expenditure and savings by holding sizes
Holding Size in Acres
% of Holdings Income Expenditure Savings
% of income saved
All Group 100 9648 9612 36 0
Landless 5 5713 6507 -794 -14
0.01-0.04 23 5973 6735 -762 -13
0.05-0.49 38 8602 9010 -408 -5
0.50-1.49 19 10785 10518 267 2
1.50-2.49 7 13198 12424 774 6
2.50-7.49 7 19147 16035 3112 16
20

7.5+ 1 29673 24457 5216 18
If income-expenditure, i.e. non-consumption, is counted as saving then, overall, based on a nationwide survey, it appears that in Bangladesh the farming household in aggregate saves very little. Household income and expenditure survey shows that, as indicated in Table 15 , for all group of households, the percentage of income saved is almost nil.
Household with no land and those with land but with holding size of less than half a acre, nearly 66 percent of the holdings of the country, have negative savings. The holding size of up to 1.5 acre also do not have any positive savings. Therefore if this group is also included then it would appear that all households with less than 1.5 acre of land, amounting to nearly 85 percent of the farming households, including the landless, do not have any positive savings. Only the households with holdings of 1.5 acre and above generate positive savings, and higher the holding size higher the rate of savings.
However, the situation is different once we consider some types of expenditure, such as those on housings and purchase of durables as investment.
5. Saving behaviour of households with and without migrant workers
5.1 Surveys of Savings and investment by Household with and without migrants
A field survey was conducted to assess household level savings and investment. The size of the sample for the survey was 418 and it covered all of the 7 Divisions of Bangladesh. The districts selected for the survey were Mymensingh, Comilla, Pabna, Jessore, Patuakhali, Maulavibazar and Thakurgaon. From each of the district one random union was selected for the survey. From each union sixty households were selected for the survey (except one union, where the number was 58).
About 85 percent of the households in the sample have less than 7 members (Table 16). About 70 percent (Table 17) members of the households are literate and only 33 percent among them have secondary education and above.
Table 16: Average Family Size
Table 17: education level
Family size
Frequency
Percentage
1-2 10 2.473-4 139 33.305-6 205 49.007 and above
64 15.30
21

What emerged is that in terms of savings and investment that there is clear distinction between the families with a migrant and those without a migrant. Average annual household saving for migrants amounts to Tk.87583 compared to Tk. 28957 for non-migrant households. Thus migrant households save about 25 percent of their total annual income while non-migrant households save about 22 percent of their total annual income. There is large difference between absolute saving of these two groups of households; the difference between the proportions of income saved is small. Savings are held in different forms, the most popular form being bank deposits. This was also confirmed by participants in FGDs where they revealed that they maintain bank accounts for depositing remittance. Whenever some fund is needed taka is withdrawn from the account leaving the rest in the account.
Earlier studies estimated migrant households savings at 28 45 percent of remittance. Our estimate is somewhat lower than the earlier studies for two reasons. First, the saving rate is for agricultural households and not for all types of households. Second, saving rate is calculated as proportion of total income instead of remittance only. Since expenditure is fungible, it is more meaningful to estimate saving as proportion of total income.
Agricultural households – both migrant and non-migrant, invest in agriculture as well as outside agriculture. Over the last years migrant households invested Tk.322381 compared to Tk. 225179 by non-migrant households. The highest amount of income has been invested in house construction by migrant households; the same holds for non-migrant households. This is a general feature of household behaviour – live in better house as income increases. An interesting finding is that of higher investment in agricultural equipment by migrant households and the difference is statistically significant
Table 18 Average annual household savings in Taka
MigrantNon Migrant
Mean Difference
t Sig.
Bank deposits89530.73
31044.03 58486.70 3.770 0.000*
Post office 31333.3 20000 11333.33 1.205 0.351
Level of Education
Frequency Percentage
Illiterate 123 29.4Primary 114 27.3Secondary 138 33Higher secondary and above
42 0.20
22

3
NGO24430.43
15892.73 8537.708 1.004 0.324
Others70785.87
20753.85 50032.02 1.019 0.316
Total87582.74
28957.04 58625.70 4.267 0.000*
. Table 19 Average household investment portfolio in Taka over last 10 years
Investment heads MigrantNon Migrant
Mean Difference
Land Improvement 67750 36819.72 30930.28
House Construction 471500 327430.6 144069.4
Business start/ expansion 208547.6 184750 23797.62
Purchase of draught animal 64588.89 44947.37 19641.52
Purchase of breeding animal 30853.7 29472.97 1380.731
Purchase of agri equipment 22280 6361.111 15918.89
Purchase of Transport 133660 130978.6 2681.429
Total 322381.2 225179.3 97201.87
Agricultural households hold real as well as financial assets. They also reduce their financial obligation. As expected the migrant households spend a large amount on land. It was pointed out during FGD that migrant households are not limited to purchase of land in their own village or locality; they also buy land in urban areas. Acquisition of assets by migrant households is significantly different (higher) from that of non-migrant households in most cases.
Table 20 Average household assets in Taka over last 10 years
Migrant Non Migrant Mean Difference
Purchase of Land558364.3 205550 352814.3
Improvement of House232105.3 43750 188355.3
Payment of Loan247501.9 190916.7 56585.19
23

Purchase of transport for own use58970.83 17150 41820.83
Purchase of gold, silver94576.67 50540.54 44036.13
Others 25000 23333.33 1666.667
Total432715.6 185300 247415.6
5.2 Focus group discussion
Focus group discussion was arranged in three villages in three districts to assess the impact of migration on poverty and food security and agriculture and rural development. These are Chapil of Dhaka district, Rashid Deohata of Tangail district and Dhonuakhola of Comilla district. In Chapil about 60 percent of the households have migrant workers, in Rashid Deohata about 18 percent and in Dhonuakhola about 75 percent of households have migrant workers. An average of 10 persons including women from migrant agricultural households and 5 persons from non-migrant agricultural households participated in the discussions. Besides, owners of tractors and power pumps in the villages were separately met.
Migrant workers come from households which can bear the cost of migration either from own savings or borrowing or both. Thus households without any savings or assets such as land to sell or mortgage can hardly send workers abroad. However, it is reported that sometimes migrant workers facilitate migration of their relatives or neighbours which makes migration even from less well off households possible. This is how 75 percent of households in Dhonuakhola in Comilla have been able to send their members abroad.
6. Household income and expenditure based on household income and expenditure survey 2010
This chapter details with estimates of household income and expenditure based on the findings from Household Income and Expenditure Survey 2010. Income and expenditure estimates are central to the entire findings of the Survey. Moreover, distribution of income and expenditure by decile group, Gini co-efficient by income, expenditure by land ownership, consumption expenditure and expenditure by major food items have also been discussed in this chapter. The economic scenario presented here is the fundamental basis for short and long term economic analysis of the economy.
6.1 Level of Income
Table 21 provides monthly income per household, number of earner per household, monthly income per member (monthly per capita income) and monthly income per earner etc. Average monthly income per household at current price was estimated at taka 11479 at the national level in 2010. This was Tk. 7203, Tk. 5842 and Tk. 4366 in 2005, 2000 and 1995-96 respectively. In 2010, the monthly household income increased by 59.36% when compared with 2005 and by 162.9% with respect to 1995-96. Per capita monthly income was estimated at taka 2553 in 2010. This was Tk. 1485, Tk. 1128 and Tk. 830 in 2005, 2000 and 1995-96 respectively.
24

Per capita monthly income increased by Tk. 1068 (71.92%) in 2010 compared to 2005 and increased by Tk. 1723 (207.59%) over the year 1995-96. It is notable that in 2010, rural income increased at a higher rate than that of urban income. In 2010, rural income increased by 58.29% whereas urban income increased by 57.45% in 2010. This increase of income in both urban and rural areas accelerated the process of poverty reduction in both urban and rural areas.
25

Table 21: Number of Members, Earners, Household Income, Income Per Member and Earner By Residence
Survey year & residence
Number of members per household
Number of earners per household
Monthly household income per household
Monthly income per member
Monthly income per earner
01 02 03 04 05 06
National
2010 4.50 1.31 11479 2553 8795
2005 4.85 1.40 7203 1485 5145
2000 5.18 1.45 5842 1128 4029
1995-96 5.26 1.48 4366 830 2950
Rural
2010 4.53 1.27 9648 2130 7592
2005 4.89 1.37 6095 1246 4449
2000 5.19 1.43 4816 928 3368
1995-96 5.25 1.46 3658 697 2505
Urban
2010 4.41 1.40 16475 3740 11778
2005 4.72 1.50 10463 2217 6975
2000 5.13 1.54 9878 1926 6414
1995-96 5.30 1.59 7973 1504 5014
Urban as % of rural
2010 97 110 171 176 155
2005 96 109 172 178 157
2000 99 108 205 208 190
1995-96 101 109 218 216 200
In HIES-20 I 0, the number of earners per household was found to be 1.31 at national level, 1.27 in rural area and 1.40 in urban area. Since, 1995-96, number of earner per household shows a declining trend and has a positive correlation with the declining changing pattern of household size.
26

In 2010, income per earner was found to be taka 8795 for the country as a whole. In rural area, this was taka 7592 and in the urban Tk. 11778. Income per earner increased to Tk. 8795 in 2010 from Tk. 5145 in 2005, an increase of Tk. 3650 (70.94%) during this period.
6.3 Income Distribution
Decile groups from the table 22 shows the pattern of distribution of income from percentage share of income of households. It is evident from the table 4.2 that the gap between the poorest of the poor (bottom 5%) and the richest of the rich (top 5%) is extremely high. In HIES 201 0, the income accruing to top 5% of the household was 24.61%, whereas, the same was 0.78% for the bottom 5% household. In 2005, income accruing to top 5 percent of the households was 26.93%, where the same was 0.77% for the bottom 5%. It slightly increased from 0.77% to 0.78% in 2010. On the contrary, the share of income of the top 5% decreased from 26.93% to 24.61% over the same period indicating redistribution of income in favour of the mid-level.
It is also evident from the table 22 that, income accruing to households belonging to Decile-] to Decile-5 remains almost same in 20 10 and recorded at 2.00%, 3.22%, 4.10%, 5.00% and 6.01% respectively at national level. Percentage shares in 2005 were 2.00%, 3.26%, 4.10%, 5.00% and 5.96% respectively. These five deciles jointly share only 20.33% of total income, although they comprise 50% of the population. In 2010, the income share of the households belonging to Decile-6 to Decile-9 increased but, that of Decile-10 decreased corresponding to those of2005. In 2010, the decile-6 shared 7.32% of the total income, decile-7 9.06%, decile-8 11.50%, decile-9 15.94% and decile- I 0 35.85%, whereas, these were 7.17%, 8.73%, 11.06%, 15.07% and 37.64% respectively in the year 2005.
For both rural as well as urban area, show the similar changing pattern of decile distribution of income as the national level.
Table 22 Percentage share of income of households by Decile group and Gini Co-efficient
Household
Income Group
2010 2005
Total Rural Urban Total Rural Urban
01 02 03 04 05 06 07
National 100.00 100.00 100.00 100.00 100.00 100.00
Lower 5% 0.78 0.88 0.76 0.77 0.88 0.67
Decile-1 2.00 2.23 1.98 2.00 2.25 1.80
Decile-2 3.22 3.53 3.09 3.26 3.63 3.02
Decile-3 4.10 4.49 3.95 4.10 4.54 3.87
Decile-4 5.00 5.43 5.01 5.00 5.42 4.61
Decile-5 6.01 6.43 6.31 5.96 6.43 5.66
Decile-6 7.32 7.65 7.64 7.17 7.63 6.78
27

Decile-7 9.06 9.31 9.30 8.73 9.27 8.53
Decile-8 11.50 I 1.50 11 .87 11.06 11.49 10.18
Decile-9 15.94 15.54 16.08 15.07 15.43 14.48
Decile-10 35.85 33.89 34.77 37.64 33.92 41.08
Top5% 24.61 22.93 23.39 26.93 23.03 30.37
Income Gini
Co-efficient
0.458 0.431 0.452 0.467 0.428 0.497
The Gini Co-efficient of income decreased to 0.458 in 2010 from 0.467 in 2005. This decrease of Gini Co-efficient bears the evidence that, income share of higher declines decreased to some extent in 2010 compared to 2005.
6.4 Sources of Income
Table 23 exhibits percentage of income of households by major sources of income with rural and urban break-down. The share of agriculture as source of income of the households at the national level increased to 20.44% in 2005 from 20.0% in 2005. On the contrary, the sectoral share of agriculture as source of income estimated in 2009-10 GOP was found to be 20.29 which is very close to that of HIES 2010 estimate. In the rural area, the share of agriculture as source of income was 29.73% whereas; the same was 5.56% in urban area. In 201 0, the percentage share of business and commerce was 19.16%; its share was 15.05% in the rural area and 25.75% for urban area. At national level, the percentage share of business and commerce declined to 23.1% in 2005 from 25.9% in the year 2000. The highest percentage share of household income came from professional wages and salary was recorded at 35.55% at national, 29.57% in rural area and 45.14% in urban area in 2010. The housing services recorded at 7.27% share at national level, 5.18% in rural area and 10.63% in urban area. Household income from gift and remittance accounted to I 0.62% at national level, 17.28% in rural area and 7.75% in urban area in 2010.
Table 4.3: Percentage Share of Income of Households by Sources of Income
Decile of
Household
Total Agriculture Business & Commerce
Professional Wages and Salary
Housing
Services
Gift &
Remittance Others
01 02 03 04 05 06 07 08
National
2010 100.0 20.44 19.16 35.55 7.27 13.62 3.93
2005 100.0 20.0 23.1 31.3 6.7 9.8 8.7
2000 100.0 18.0 25.9 29.4 7.8 10.9 8.0
1995-96 100.0 26.3 20.3 30.3 6.8 9.1 7.2
Rural28

2010 100.0 29.73 15.05 29.57 5.18 17.28 3.16
2005 100.0 28.7 17.3 28.1 5.1 12.0 8.7
2000 100.0 25.5 22.4 27.7 5.0 11.0 8.4
1995-96 100.0 35.4 14.7 27.7 6.5 9.6 6.1
Urban
2010 100.0 5.56 25.75 45.14 10.63 7.75 5.15
2005 100.0 5.8 33.1 36.9 9.5 5.9 8.7
2000 100.0 3.7 32.4 32.6 13.1 10.6 7.5
1995-96 100.0 4.8 33.4 36.6 7.4 7.9 9.9
6.5 Consumption Expenditure
Table 24 gives the estimates for monthly expenditure and consumption expenditure per household. At the national level, average monthly expenditure per household was estimated at taka 11200 at current price in 2010. It was taka 9612 in rural area and taka 15531 in urban area. Average monthly expenditure shows an increasing trend. It was taka 6134, taka 4881 and taka 4096 in 2005, 2000 and 1995-96 respectively.
The average monthly consumption expenditure per household was taka 11003 in 2010 at the national level. In rural area, the average consumption expenditure was taka 9436 per month, whereas, in the urban area, it was found to be taka 15276. In 2005, it was Tk. 5964, Tk. 5165 and Tk. 8315 at national level, rural and urban respectively. The monthly average consumption increased by 84.5% over the year 2005 and by 142.5% over 2000.
The consumption expenditure was 98.2% of the total expenditure at national level, 98.2% in rural area and 98.4 in urban area in 201 0.
Table 24 Average Monthly Expenditure and Consumption Expenditure per Household by Residence
Year Residence Average Expenditure per month
Average Consumption per month
% of total expenditure
Consumption Non
consumption
01 02 03 04 05 06
2010
National 11200 11003 98.2 1.8
Rural 9612 9436 98.2 1.8
Urban 15531 15276 98.4 1.629

2005
National 6134 5964 97.2 2.8
Rural 5319 5165 97.1 2.9
Urban 8533 8315 97.4 2.6
2000
National 4881 4537 93.0 7.0
Rural 4257 3879 91.1 8.9
Urban 7337 7125 97.1 2.9
1995-96
National 4096 4026 98.3 1.7
Rural 3473 3426 98.7 1.3
Urban 7274 7084 97.4 2.6
The standard errors of income and consumption expenditure are estimated at Tk. 280.62 and Tk. 223.14 respectively and relative standard errors (Co-efficient of variation) of those are estimated at 2.44% and 2.03% respectively (For details, see appendix-D).
The Table 25 below provides monthly household nominal income, expenditure and consumption expenditure by administrative divisions from HIES 2010.
Table 25 Monthly Household Nominal Incomes and Consumption Expenditures by Divisions-2010
Division Income Consumption
Total (National) 11479 11003Barishal Division 9158 9826Chittagong Division 14092 14360Dhaka Division 13226 11643Khulna Division 9569 9304Rajshahi Division 9342 9254Rangpur Division 8359 8298Sylhet Division 11629 12003
The highest average monthly household nominal income was recorded at Tk. 14092 for Chittagong Division followed by Dhaka Division at Tk. 13226 and Sylhet Division at Tk. 11629 and all of these exceeded the national average of Tk. 11479 in 2010. The four Divisions, which recorded monthly household income below the national average, were Barishal Division at Tk. 9158, Khulna Division at Tk. 9569 and Rajshahi Division at Tk. 9342, Rangpur Division 8359.
The highest average monthly consumption expenditure was recorded in Chittagong Division at Tk. 14360 followed by Sylhet Division at Tk. 12003 and Dhaka Division at Tk. 11643 and their income exceeded the national average of monthly household consumption expenditure at Tk. 11003 in
30

2010. On the other hand, the average monthly household expenditure of Barishal Division, Khulna Division and Rajshahi Division and Rangpur Division fell well below the national average and were estimated at Tk. 9826, Tk. 9304 Tk. 9254 and Tk. 8298 respectively.
Food Expenditure
Table 26 captured the food expenditure pattern incurred to households in different survey years. Percentage share of expenditure of items of the food bundle is also presented in this table. Monthly food expenditure was taka 6031 per household in 2010 of which expenditure on cereals was 35.95%. The table shows that, cereals accounted for bulk of the food expenditure. The share of expenditure on cereals decreased by 3.05% percentage points in 2010 compared to 2005. In the rural area, expenditure share of food decreased to 39.62% in 2010 compared to 42.25% in 2005. In the urban area expenditure share of cereals decreased to 28.41% in 2010 compared to 31.30% in 2005.
Table 26: Percentage Share of Food Expenditure by Residence & Major Food Items
Food item National Rural Urban
2010 2005 2000 2010 2005 2000 2010 2005 2000
01 02 OJ 04 OS 06 07 08 09 10Total food expen. 6031 3209 2477 5543 3023 2300 7362 3756 3175
% of Total 100.00 100.00 100.00 100.00 100.00 100.00 100.00 100.00 100.00
Cereals 35.95 39.00 38.02 39.62 42.25 41.23 28.41 31 .30 28.87
Pulses 2.35 2.65 2.92 2.32 2.39 2.79 3.00 3.28 3.29
Fish 13.71 12.24 12.48 12.74 11.46 12.06 15.71 14.11 13.66
Meat & eggs 10.31 8.51 8.02 8.61 7.64 6.97 13.80 10.56 11.01
Vegetables 7.79 8.38 9.21 7.98 8.34 9.44 7.40 8.48 8.57
Milk/Milk products 3.02 3.74 3.95 2.74 3.46 3.62 3.58 4.41 4.89
Edible oil 4.35 4.25 3.71 4.26 4.07 3.62 4.53 4.67 3.97
Condim/Spices 9.99 7.52 7.13 10.54 7.18 7.22 8.85 8.31 6.87
Fruits 4.08 3.23 2.97 3.49 2.97 2.57 5.29 3.83 4.10
Sugar/Our 1.06 1.56 1.34 1.04 1.54 1.29 1.12 l.62 1.49
Beverage 0.73 0.68 1.97 0.51 0.45 1.57 1.18 1.21 3.10
Miscellanies 5.67 8.25 8.29 6.15 8.25 7.62 6.38 8.23 10.18
Table 27 shows that, in rural area the share of expenditure on cereal has decreased to 49.34% in 2010 from 43.02% in 2005 for landless group. It is observed that, as the land holding size increase the share of expenditure on vegetables decreases with some exception but expenditure on fish, meat and poultry and eggs, milk and fruits increases.
Table 27: Share of Expenditure on Major Food Items by Size of Owned Land in RuralArea
Size ofLand
Owned
Ave. Exp.onMajor Food Item
Share of Expenditure on Major Food Items
Total Cereal Pulses Veget ables
Fish Meat, poultry, egg
Milk Fruits Others
01 02 03 04 05 06 07 08 09 10 11
2010
All Group 5543 100.0 39.62 2.32 7.98 12.74 8.61 2.74 3.49 22.50
31

Landless 4259 100.0 40.34 2.40 8.13 12.62 6.01 2.46 2.49 25.54
0.01-0.04 4314 100.0 43.17 2.24 8.67 1 1.44 6.97 1.72 2.84 22.94
0.05-0.49 5304 100.0 40.38 2.32 8.32 12.82 8.00 2.31 3.32 22.53
0.50-1.49 5927 100.0 39.17 2.33 7.75 12.88 8.78 3.26 3.61 22.21
1 .50-2.49 6804 100.0 37.68 2.31 8.35 13.31 40.42 3.72 4.65 21.14
2.50-7.49 8247 100.0 35.17 2.45 6.84 13.38 11.70 3.97 4.22 22.28
7.50+ 11014 100.0 32.28 2.17 7.01 15.30 11 .27 3.61 5.80 22.56
2005
All Group 3023 100.0 42.27 2.39 8.34 11.46 7.65 3.46 2.98 21.50
Landless 2008 100.0 43.02 2.75 9.29 11.29 5.43 2.09 2.69 23.54
0.01-0.04 2168 100.0 47.07 2.14 9.09 10.17 5.44 1.95 2.29 21.90
0.05-0.49 2828 100.0 43.37 2.50 8.57 11.17 6.71 2.75 2.82 22.17
0.50-1.49 3250 100.0 41.47 2.39 8.30 11.24 8.26 3.94 3.15 21.28
1.50-2.49 3661 100.0 39.96 2.41 8.03 12.53 8.76 4.49 3.23 20.61
2.50-7.49 4459 100.0 39.00 2.21 7.34 12.54 10.32 5.03 3.35 20.20
7.50+ 6207 100.0 36.64 2.33 7.14 13.61 10.40 5.69 4.24 19.92
It is found from the table 4.9 that, share of food was 54.81% of the total consumption expenditure at the national level in 2010, as compared to 53.81% in 2005. In rural area, this share was 58.74%, but in urban area, it was 48.19% in 2010, vis-a-vis 58.54% and 45.17% respectively in 2005. It is observed that, the share of housing and house rent decreased from 12.25% in 2005 to 9.95% in 2010. The share of fuel and lighting decreased to 5.63% in 2010 from 5.98% in 2005.
It appears from the Table 28 that, 54.81% of consumption expenditure accounted to food and beverage, 4.95% to cloth and footwear, 9.95% to housing and house rent, 5.63% to fuel and lighting, 1.68% to household effect and 22.98% to miscellaneous expenditure at national level. The percentage share of food and beverage consumption increased from 53.81% in 2005 to 54.81% in 2010. The consumption expenditure on housing and house rent decreased from 12.25% in 2005 to 9.95% in 2010.
The distribution by rural and urban shows some variation of share of consumption by major expenditure groups. In 2010, 58.74% consumption expenditure accounted to food and beverage in the rural area, whereas, the same was 48.19% in the urban area. It is evident that, the rural people spend bulk of their consumption expenditures on food and beverage than that of the urban people.
Another significant change is observed in case of expenditure on housing and house rent. It was estimated at 9.95% in 2010, whereas, it was 12.25% in 2005. Share of consumption expenditure on housing and house rent has reduced in 2010 because of increase in share of consumption expenditure in other heads. Share of expenditure on cloth & footwear and fuel & lighting have decreased by about one percent in both the cases.
Table 28: Consumption Expenditure on Major Items of Expenditure by Size of LandOwned in Rural Area
Share Of Components On Total Consumption Expenditure
32

Size ofLand
Owned
AverageMonthly
Consum Exp
Total Food and
Bevera
Cloth &footwear
Housing& rent
Fuel/Lightin
g
Household
Effects
Mise
01 02 03 04 05 06 07 08 092010
All group 94.36 100 58.74 5.12 7.29 6.06 1.85 20.94
Landless 6449 100 66.05 4.93 4.50 7.44 1.19 15.900.01-0.04 6605 100 64.82 4.93 5.58 6.36 1.28 16.020.05-0.49 8867 100 59.82 5.25 7.33 6.29 1.61 19.700.50-1.49 10306 100 57.23 5.26 8.05 8.76 2.07 21.641.50-2.49 12182 100 55.85 5.16 8.08 5.45 2.31 23.162.50-7.49 15514 100 53.16 4.97 8.40 4.77 2.39 26.317.50+ 23216 100 47.44 4.26 6.27 4.27 3.36 34.39
2005
All group 5164 100 58.54 5.54 9.77 6.10 1.80 18.22
Landless 3018 100 66.55 5.26 6.78 7.36 1.16 12.860.01-0.04 3325 100 65.22 5.51 7.72 7.35 1.08 13.100.05-0.49 4579 100 61.76 5.48 9.26 6.64 1.58 15.250.50-1.49 5500 100 59.10 5.61 9.20 6.01 1.95 18.101.50-2.49 6673 100 54.86 5.42 11.l2 5.63 2.03 20.912.50-7.49 8714 100 51.17 5.85 11.08 4.85 2.37 24.667.50+ 14613 100 42.47 5.05 16.19 3.82 2.64 29.80
33

Annex-11. Sample Design
A two stage stratified random sampling technique was followed in drawing sample of HIES 2010 under the framework of Integrated Multipurpose Sample (IMPS) design developed on the basis of the sampling frame based on the Population and Housing Census 2001. The IMPS design consisted of 1000 Primary Sampling Units (PSUs) throughout the country. There were 640 rural and 360 urban PSUs in the sample. The PSU was defined as contiguous two of more enumeration areas (EA) used in Population and Housing Census 2001. Each PSU comprised of around 200 households. In the first stage about one half, 612 is in exact out of total 1000 IMPS PSUs, were drawn. These PSUs were selected from 16 different strata. There were 6 rural, 6 urban and 4 SMA strata. In the second stage, 20 households were selected from each of the rural PSUs and also PSUs located in the municipal areas and SMAs. Thus, the HIES is a sub-set of IMPS.
Number of Sample PSUs, Households and Population covered in HIES-2010 by Residence
Division Number of Sample PSUs, Households and Population 2010National Rural Urban
1 2 3 4Sample PSUsTotal 612 392 220Barisal 49 34 15Chittagong 110 71 39Dhaka 177 105 72Khulna 90 55 35Rajshahi (Former)
-Rajshahi (New)-Rangpur
1437964
944945
493019
Sylhet 43 33 10Sample HouseholdsTotal 12240 7840 4400Barisal 980 680 300Chittagong 2200 1420 780Dhaka 3540 2100 1440Khulna 1800 1100 700Rajshahi (Former)
-Rajshahi (New)-Rangpur
286015801280
1880980900
980600380
Sylhet 860 660 200Total 12240 7840 4400Barisal 980 680 300Chittagong 2200 1420 780
Sample PopulationsTotal 55580 35894 19686Barisal 4464 3107 1357Chittagong 10943 7201 3742Dhaka 15658 9383 6275Khulna 7673 4666 3007Rajshahi (Former)
-Rajshahi (New)121386607
78674038
42712569
34

-Rangpur 5531 3829 1702Sylhet 4704 3670 1034
2. Concepts and Definitions
Goods, Durable:
Durable goods are those whose individual life expectancy is one year or more. These include radio, TV, Tape, recorders, wooden and steel furniture, china-ware (not for daily use), cutlery and kitchen utensils, etc.
Goods, Non-Durable:
Item whose durability is less than one year are termed as non- durable goods. these are food items, clothing, fuel and lighting, medicines, etc. Services are also regarded as non durable goods.
Household:
Household is the smallest unit of social institution. Almost all the socio-economic activities are being performed around this unit. It can be defined as a dwelling unit where one or more persons live and eat together under a common cooking arrangement. Matrimonial or blood or both relations, exit among most of the persons who reside in the dwelling.
Household Expenditure:
Household expenditure includes household consumption and certain other outlays of the household. Consumption expenditure of the household is the aggregate value of goods and services actually consumed during the reference period. The non-consumption expenditure of the household includes income tax and other taxes, pension and social security contributions and related insurance premium, gifts and other transfers. [terns extended from the expenditure schedule are additions to saving, various types of investment expenditure (both monetized and non monetized) including amount spent.
Household, Head of:
Head of household means a member of the household who is the decision- maker regarding the different activities of the household. This household is also being run under his command. In case of Household Income and Expenditure Survey, a Member is regarded as head of a household whom the other members consider him so. Generally, the eldest male or female earner of the household or the main decision-maker is considered to be the head of household.
Household, member:
Household member include permanent family members, as well as, boarders and lodgers, servants and other employees who often live in the household and take food together. These also included person temporarily away from the household. persons whose usual place of residence elsewhere but found staying with the household at the time of enumeration are not deemed a members of the household. Guests visiting a household temporarily or a person normally resides and takes food outside is not considered as a member of the household for the survey.
35

Income, Actual Agricultural:
Actual agricultural income has been defined as the income received from gross household agricultural produce from crop, poultry, bovine, etc. minus expenditure incurred to produce the gross agricultural produce.
Income: Actual Agricultural (Regular)-Non-Cash:
Yearly wages and salary received in kind from regular employment or investment in agriculture.
Income, Household:
Income means material return in cash or kind received in exchange of goods and services in a particular period. In case of household income, it refers to the material return of all the members of the household in the same period. So, household income in a particular period can be defined as the sum of the earnings of all the members of the household in cash or kind in the same period of time. Income from wages and salaries, pensions, contributions and professional fees earned by the members of the household are estimated on yearly basis.
Income from interest, dividends, earnings from agricultural activities, business, commercial and industrial establishments, land and property, rent, gifts and assistance and insurance benefits, including other special types or receipts by the member of the household are also estimated on yearly basis.
Income, Imputed:
Assigning a value to any goods consumed or services enjoyed by the household received as gifts or home-made or procured in any other manner other than cash purchase. Rent of a rent-free/owner-occupied house, values of home-made goods or services are the examples of imputed income.
Income, Non-Agriculture:
The nonagricultural income of the households are those income which was accumulated from business, industry and investment in different sectors. These income are collected on yearly basis.
Income, Other Sources of:
Include receipt from dis-saving and dis-investment of assets and properties, as well as, loan repayments received, etc. Also security benefits, G.P. Fund receipts, windfall gains, etc.
Income, Secondary Extra:
Income received from extra source other than main source. This share of extra income must be less than that of main source.
Land, Cultivable:
Land under temporary agricultural crop such as paddy, jute, rabi crop, Kharif crop, etc. is termed as cultivable land. It also includes fallow land.
36

Land, Leased-In:
Land taken from other household or institution for the purpose of habitation, farming fishery, etc. in lieu of fixed rent or on share cropping basis or on mortgaged or in any other term is considered as land leased-in.
Land, Leased-Out:
Land leased out to any person or institutional in lieu of fixed rent or on share cropping basis or on mortgaged or in any other term is considered as land leased out.
Land, Operated:
Area of land under the possession of household for the purpose of habitation, farming, fishery, etc. is considered as land operated by the household. Operated land is the sum of area of land owned plus land leased-in minus land leased-out.Land, Owned:
Legal ownership of any area of land in the name of all the family members is considered as land owned by the household.Landless (Operated):
Household that does not have any operated land on the day of enumeration is considered as landless (operated).
Landless (Own Land):
Household that does not own any land in the name of any family member of the household is considered as landless (Own land).
Literate:
A person aged 7 years and above and who is able to write a letter is considered as literate.
Occupation:
Occupation is generally the acceptable means of income to fulfill the financial requirement. It can be defined as a means associated with the activities from which the individual earns livelihood. Occupation may be a major or a minor, according to the grater or smaller share in income.
Pension:
Currently received allowances in lieu of services rendered in past to government, semi government, autonomous bodies, non-government organization, international bodies, private or any other organization.
37