an analysis of retirement models to...
TRANSCRIPT

AN ANALYSIS OF RETIREMENT
MODELS TO IMPROVE PORTABILITY AND COVERAGE
Alicia H. Munnell, Anek Belbase, and Geoffrey T. Sanzenbacher in conjunction with Summit Consulting, LLC
SPECIAL REPORT MARCH 2018
Center for Retirement Research at Boston College Hovey House
140 Commonwealth Avenue Chestnut Hill, MA 02467
Tel: 617-552-1762 Fax: 617-552-0191 http://crr.bc.edu
The authors are with the Center for Retirement Research at Boston College. Alicia H. Munnell is director, Anek Belbase is a research fellow, and Geoffrey T. Sanzenbacher is associate director of research. This report has been reformatted from the original report funded by the U.S. Department of Labor, Chief Evaluation Office, under Contract to Summit Consulting (Prime Contract Number DOLQ129633250) (dated February 25, 2018), which can be downloaded here. Findings and interpretations in this report have not been altered from the original report. The views expressed are those of the authors and should not be attributed to DOL, Summit Consulting, LLC, or Boston College. The mention of trade names, commercial products, or organizations do not imply endorsement by the U.S. Government. The authors wish to thank Anqi Chen for excellent research assistance and Angela Antonelli, Brigitte Madrian, John Scott, Steve Utkus, and Christian Weller for very helpful comments. © 2018, Alicia H. Munnell, Anek Belbase, and Geoffrey T. Sanzenbacher. All rights reserved. Short sections of text, not to exceed two paragraphs, may be quoted without explicit permission provided that full credit, including © notice, is given to the source.
About the Center for Retirement Research
The Center for Retirement Research at Boston College, part of a consortium that includes parallel centers at the University of Michigan and the National Bureau of Economic Research, was established in 1998 through a grant from the Social Security Administration. The Center’s mission is to produce first-class research and forge a strong link between the academic community and decision-makers in the public and private sectors around an issue of critical importance to the nation’s future. To achieve this mission, the Center sponsors a wide variety of research projects, transmits new findings to a broad audience, trains new scholars, and broadens access to valuable data sources.
Center for Retirement Research at Boston College Hovey House
140 Commonwealth Ave Chestnut Hill, MA 02467
Tel: 617-552-1762 Fax: 617-552-0191 http://crr.bc.edu
Affiliated Institutions: The Brookings Institution
Syracuse University Urban Institute
Executive Summary
Retirement security is an important policy issue. A number of factors may result in the
need for more retirement income than in the past. The U.S. population is living much longer and
working only a bit longer, so retirement spans are lengthening.1 Low interest rates and rising
out-of-pocket health care costs may also play a role. At the same time, workers will receive less
income from Social Security relative to their pre-retirement earnings – at any given claiming age
– as the Full Retirement Age moves from 65 to 67, Medicare premiums are projected to take a
larger share of the benefit,2 and more people are slated to pay taxes on a portion of their
benefits.3 While Social Security’s progressive benefit formula provides low earners with higher
benefits relative to earnings, these workers often claim benefits early and receive actuarially
reduced amounts in exchange for receiving benefits for a longer period.4 Since Social Security
alone is insufficient for most workers to maintain their pre-retirement living standard, they will
be increasingly reliant on a retirement savings plan.5
In the United States, most retirement savings plans in the private sector are provided
through an employer on a voluntary basis. Many of those with retirement plans have insufficient
balances to maintain their standard of living in retirement, and half the workforce does not
participate in a plan at any given time.6
For the half of private sector workers who do participate in a plan at their current job,
portability between plans is often difficult, money often moves from the generally lower-cost
workplace system to the generally higher-cost “retail” system of Individual Retirement Accounts
(IRAs), and leakage from the combined workplace and retail system may negatively affect
balances.
1 Between 1980 and 2016, life expectancy at 65 increased by 4.4 years for men, from 14.7 to 19.1 years (U.S. Social Security Administration, 2017a). Meanwhile, the average retirement age increased by 0.6 years for men, from 64.1 to 64.7 (authors’ updates of Munnell, 2015). As a result, the retirement span grew by 3.8 years over this period. 2 The Medicare actuaries project Medicare out-of-pocket costs to increase from about 16 percent of average Social Security benefits in 2017 to over 30 percent of benefits by 2045 (Centers for Medicare & Medicaid Services, 2017). 3 Ellis, Munnell, and Eschtruth (2014). 4 Among workers in the lowest earnings tercile, 63 percent claim before their Full Retirement Age (U.S. Social Security Administration, 2017b). 5 Many analysts use the Aon and Georgia State University Replacement Rate Study for measures of adequacy (Palmer, 2008). Households need less income in retirement than they did while working to maintain the same standard of living as they tend to pay less in taxes, no longer need to save for retirement, and may have paid off their mortgage. The study found that retired households require 75 to 90 percent of their pre-retirement income to maintain the same standard of living, depending on the number of earners, marital status, and earnings level. 6 Ellis, Munnell, and Eschtruth (2014).
2
Among the half of workers who do not participate in a plan at their current job, 84
percent are with an employer that does not offer a plan, while the remaining 16 percent work for
an employer that offers a plan but either choose not to participate or are not eligible to
participate. Additionally, an increasing number of workers – such as, contractors or temporary
workers – do not have a traditional employer-employee relationship, so they are also part of the
group that lacks coverage from an employer.
This report examines the employer-based voluntary retirement system and explores a variety
of potential changes through a three-part analysis:
• The first part focuses on the 401(k) system and documents the extent and nature of
portability, the flow of money to IRAs, and leakage from both systems. It summarizes
resulting problems and potential solutions.
• The second part explains the coverage gap among traditional wage and salary employees
and assesses potential options for shrinking the gap.
• The third part looks at the separate challenge of covering workers in non-standard
employment, who would tend to be left out of fixes for traditional workers.
• The overall objective of this study is to summarize what is currently known using
analysis of existing proposals and, where relevant, examples from other countries, and to
provide a wide (though not comprehensive) list of available options.
Portability, Transfers to IRAs, and Leakage
The current defined contribution system could be improved along three dimensions. The
first dimension is to minimize procedural barriers to moving money between employer plans in
order to reduce the number of small and lost accounts. Currently, plans are not required to
accept incoming rollovers and face no standards for timely and efficient plan-to-plan transfers
when people switch jobs. This lack of orderly procedures can make it difficult to move money
from an old plan to a new plan. Often, even simple processes for transferring assets between
plans require several steps and can take a month or more to complete. Additionally some plans

3
do not accept rollovers from other 401(k)s. As a result, 401(k) plan balances often do not follow
workers as they move jobs, and people can end up with multiple small accounts – which may
make keeping track of accounts more challenging.
The second dimension is the effect of transfers from the workplace system to the advisor-
oriented retail component (such as IRAs). IRAs often involve higher fees and can result in
conflicts of interest for financial advisors when dealing with clients. Of course, IRAs also have
potential benefits to the retail market, such as a broader array of investment alternatives, the
ability to consolidate assets, and personalized financial advice. However, these benefits may not
outweigh the costs of receiving advice that could reflect a conflict of interest.
The third dimension is leakage from both workplace plans and IRAs, which tends to cut balances
at retirement by about 25 percent on average. Although the current system imposes a 10-percent
penalty tax on pre-retirement withdrawals on top of income taxes, this provision may not be an
effective deterrent for many participants. For example, for low- and moderate-income workers
who pay little or no income tax, the penalty may seem acceptable. In addition, a meaningful
portion of the participant’s account may include employer (or “free”) contributions. So the net
cost for “cashing out” can seem quite minimal, in both financial and psychological terms, for
many workers.
Options for addressing the three issues discussed above that could enhance portability,
protect transfers from the workplace to IRA system, and reduce leakage) are outlined in Table
ES-1.
Table ES-1. Options to Address 401(k) Portability, Transfers to IRAs, and Leakage Goal Option Enhance portability Require plans to accept rollovers
Standardize rollover rules and paperwork Encourage direct rollovers Set up a public registry to prevent lost accounts Create clearinghouse to automatically roll over small balances
Protect transfers from workplace to IRA system
Limit forced transfers and expand their investment options Reduce conflicts of interest through the Fiduciary Rule Enhance transparency of fees
Reduce leakage Limit or prohibit cashouts at job termination Tighten hardship withdrawal criteria Coordinate age for penalty-free withdrawals with Social Security claiming provisions
4
Plan Coverage for Traditional Workers
Even if policymakers were able to solve all the problems in the defined contribution
system, a large coverage gap would remain. At any moment in time, about half of private sector
workers are not participating in an employer-sponsored retirement plan. (For the purposes of
this report, “coverage” and “participation” are used synonymously.) That pattern means that
some workers never gain coverage during their work lives and others have only intermittent
coverage. For many workers, Social Security alone is not enough to enable them to maintain
their pre-retirement standard of living.
The percentage of workers covered has not improved since the late 1970s. This pattern
may be driven by two factors. First, many employers – particularly small employers – do not
offer a retirement plan, partly due to high costs but often for non-financial reasons such as
workers’ preference for cash wages. Second, the uncovered employees who work for an
employer with a plan either choose not to participate, often through inertia, or are not eligible
because they have not worked for the employer long enough, work too few hours, or are in a type
of job that is not covered by the plan. As a result, increasing coverage will require both
expanding access to employer-based plans and increasing participation in existing plans.
Two types of federal and state initiatives have been aimed at increasing coverage for
traditional workers: (1) efforts to reduce barriers to adopting plans and (2) laws that require
employers to provide access to workers. At the federal level, efforts to reduce barriers have
focused on lowering the costs of offering a plan. These efforts are reflected in products for small
businesses, like SIMPLE and SEP plans, and regulations facilitating multiple-employer plans,
which can lower costs by pooling resources across related employers. States have also attempted
to make it easier for small businesses to offer retirement plans: Washington and New Jersey are
creating marketplaces that include a curated list of retirement plans suitable for small businesses.
However, past efforts to broaden coverage through simpler products or better markets have not
resulted in a significant increase in total coverage.7
In contrast, efforts to expand coverage by moving away from the voluntary model and
imposing a mandate on employers have been effective in other countries such as the United
Kingdom; and even within the voluntary system, 401(k) plans that automatically enroll workers
7 An Investment Company Institute study (2017) shows that only 6 percent of households have a SEP, SIMPLE, or SAR-SEP IRA, vehicles designed to make it easier for firms to offer a retirement saving plan.

5
– with the ability to opt out – have boosted participation rates. Along these lines, U.S. policy
experts developed an idea that would require employers without a plan to automatically enroll
workers in an IRA. This proposal has not been adopted at the federal level, but several states are
moving forward with these auto-IRAs.
Table ES-2 summarizes options to expand retirement savings among traditional workers
with and without access to workplace plans. These changes could substantially shrink the
coverage gap.
Table ES-2. Options to Expand Coverage by Retirement Plans
A more comprehensive approach to expanding coverage might involve shifting
responsibility for the provision of retiree benefits from the employer to a third-party platform
(see right-hand column of Table ES-3, on the next page). This option could be either voluntary
or mandatory. On the voluntary side is a proposal offered a decade ago by the ERISA Industry
Goal Option Improve participation among workers eligible for 401(k)s
Mandate that 401(k) plans automatically enroll new employees immediately and non-participating employees periodically
Enhance voluntary system
Publicize availability of federal plans designed for small business (SEP IRAs, SIMPLEs) Expand marketplaces like those in New Jersey and Washington if they prove successful Enact legislation to facilitate the establishment of open MEPs Expand the Saver’s Tax Credit
Establish plans with auto-enrollment for employees without coverage
Impose a federal mandate on employers without a plan to auto enroll their workers in an IRA; or Revise Employee Retirement Income Security Act of 1974 (ERISA) to enable a federal mandate on employers to auto enroll their employees in 401(k)s (or open MEPs), like in the United Kingdom Enable states to mandate employers without a plan to auto enroll their workers in an IRA; or Revise ERISA to enable states to mandate employers without a plan to auto enroll their workers in open MEPs Promote efforts to move administrative burden from employers to third-party platforms
Require employer contributions along with coverage of employees
Impose a federal mandate that employers must contribute to a retirement plan on behalf of their employees, as in Australia Combine mandatory coverage with shift in responsibility from employers to third-party platforms

6
Committee (ERIC) that would allow employers to shift responsibility for the provision of
benefits to an outside administrator.8 On the mandatory side, a 2012 proposal by the Center for
American Progress (CAP) would provide all workers with access to an IRA-based plan modeled
after the Federal Thrift Savings Plan.9 International models could also achieve similar
objectives: Australia and the Netherlands provide near-universal access to employer-based
pensions with a minimal administrative burden on employers and accounts that are far more
portable than 401(k) plans.
Introducing Broader Options to Cover Self-Employed and Contingent Workers
Even if all traditional workers had coverage through their employers, the self-employed,
and the growing number of contingent workers would be left out. Covering the self-employed
and contingent workers in supplementary plans, however, is in its infancy even in countries that
have aimed for universal coverage. One step in that direction may be creating some type of plan
with auto-enrollment for workers in non-standard employment. Table ES-4 (on the next page)
presents several ways to encourage and evaluate broader options to expand coverage to workers
without a traditional employer relationship.
8 ERISA Industry Committee (2007). 9 This proposal has been modified over time. See Madland, Rowell, and Davis (2016), Madland (2012), and Davis and Madland (2013).
Table ES-3. Options to Broaden Coverage by Degree of Compulsion and Locus of Administration
Degree of compulsion Locus of administration
Employer Third party
Voluntary/supplemental Existing U.S. system + enhancements (part-time, MEPs, state marketplaces) ERIC model
Mandatory/universal Mandatory auto-enrollment of all workers (federal or state policy) U.K. model
CAP model Australia, Netherlands

7
Conclusion
A changing retirement landscape may require today’s workers to accumulate more
savings, but barriers exist for accumulating and managing money in defined contribution plans,
and many do not participate in any form of employer-provided retirement program.
A number of changes could help make existing plans work better by enhancing
portability and safeguarding small accounts, protecting transfers from the workplace to IRA
system, and reducing leakage.
Coverage could be expanded substantially within the existing financial infrastructure, but
a more ambitious approach may be required to relieve the burden on employers and to cover the
self-employed and the growing number of contingent workers. For these more ambitious
approaches, the central issues revolve around how much compulsion is desirable in the U.S.
retirement system and the optimal role for employers.
Table ES-4. Options to Cover Self-Employed and Contingent Workers Goal Option Provide coverage under an individual mandate
Require individuals to contribute a percentage of earnings
Provide coverage in current U.S. voluntary system
Encourage innovative efforts to bring retirement plans to contingent workers (e.g. Betterment plan for Uber) Create an auto-IRA arrangement using tax code
8
Introduction
Retirement security is an important policy issue. A number of factors may result in the
need for more retirement income than in the past. The U.S. population is living much longer and
working only a bit longer, so retirement spans are lengthening.10 Low interest rates and rising
out-of-pocket health care costs may also play a role. At the same time, workers will receive less
income from Social Security relative to their pre-retirement earnings – at any given claiming age
– as the Full Retirement Age moves from 65 to 67, Medicare premiums are projected to take a
larger share of the benefit,11 and more people are slated to pay taxes on a portion of their
benefits.12 While Social Security’s progressive benefit formula provides low earners with higher
benefits relative to earnings, these workers often claim benefits early and receive actuarially
reduced amounts in exchange for receiving benefits for a longer period.13 Since Social Security
alone is insufficient for most workers to maintain their pre-retirement living standard, they will
be increasingly reliant on a retirement savings plan.14
In the United States, most retirement savings plans in the private sector are provided
through an employer on a voluntary basis. However, many workers with an employer plan have
insufficient balances to maintain their standard of living in retirement, and half the workforce
does not participate in a plan at any given time.15
These challenges are set against a background where the employer retirement system has
changed from defined benefit to defined contribution. Until the early 1980s, most workers who
were covered by an employer plan relied solely on a defined benefit plan, where benefits
typically equal a percentage of final earnings and are paid as an annuity.16 In 2017, most
10 Between 1980 and 2016, life expectancy at 65 increased by 4.4 years for men, from 14.7 to 19.1 years (U.S. Social Security Administration, 2017a). Meanwhile, the average retirement age increased by 0.6 years for men, from 64.1 to 64.7 (authors’ updates of Munnell, 2015). As a result, the retirement span grew by 3.8 years over this period. 11 The Medicare actuaries project Medicare out-of-pocket costs to increase from about 16 percent of average Social Security benefits in 2017 to over 30 percent of benefits by 2045 (Centers for Medicare & Medicaid Services, 2017). 12 Ellis, Munnell, and Eschtruth (2014). 13 Among workers in the lowest earnings tercile, 63 percent claim before their Full Retirement Age (U.S. Social Security Administration, 2017b). 14 Many analysts use the Aon and Georgia State University Replacement Rate Study for measures of adequacy (Palmer, 2008). Households need less income in retirement than they did while working to maintain the same standard of living as they tend to pay less in taxes, no longer need to save for retirement, and may have paid off their mortgage. The study found that retired households require 75 to 90 percent of their pre-retirement income to maintain the same standard of living, depending on the number of earners, marital status, and earnings level. 15 Ellis, Munnell, and Eschtruth (2014). 16 Borzi (2005).

9
covered workers rely solely on a defined contribution plan – often a 401(k) – where retirement
income depends on the amount the individual and employer contribute plus investment earnings
accumulated in the account over time, and the individual, rather than the employer, bears both
investment and longevity risk.17 The defined benefit plan tends to work well for people who
spend their working lives with a single employer, while defined contribution plans are better for
mobile employees.18
Defined contribution plans have three limitations that can inhibit efficient money
management. First, they are less portable in practice than in theory; it is hard to move 401(k)
savings from one plan to another. Second, in contrast, it is relatively easy to move 401(k)
savings into the retail environment of Individual Retirement Accounts (IRAs), which have fewer
consumer protections and, often, higher fees than workplace plans. Finally, 401(k) plans are
prone to pre-retirement withdrawals, which can substantially erode balances at retirement.
Beyond the limitations of 401(k)s, however, lies the greater challenge of coverage. Since
the late 1970s, only about half of private sector wage and salary workers have participated in any
type of retirement plan at their current job.19 (For the purposes of this report, “coverage” and
“participation” are used synonymously.) This lack of coverage means that some employees end
up at retirement with no source of income other than Social Security, and others cycle in and out
of coverage, producing very small accumulations of retirement assets.
One group that lacks coverage is workers without a traditional employer relationship – a
growing part of the labor force. A recent update of the Bureau of Labor Statistics’ (BLS)
Contingent Worker Survey by Katz and Krueger (2016) showed that the percentage of workers in
any type of alternative work arrangement (i.e. temporary help agency workers, on-call workers,
contract company workers, and independent contractors) rose from 10 percent in 2005 to 16
percent in 2015. One result for these contingent workers – as well as for self-employed workers
not captured in this group – is that they are not enrolled in any employer retirement plan on their
current job.20 This lack of coverage, depending on the length of time they spend in contingent
17 Brien and Panis (2011) illustrate how the role of annuities can help transfer some of the investment and longevity risks to insurance companies. 18 This assessment is less true today than in the past as many private sector employers have shifted their defined benefit plan to a cash balance plan where lump-sum payments are available upon termination. 19 Munnell and Bleckman (2014). 20 Nightingale and Wandner (2011) discuss some of the policy implications of informal and non-standard employment for low-skilled workers.

10
work, may result in less savings at retirement because very few people open an IRA on their
own.21
In short, several reasons can help explain why so many workers are not building up
retirement savings on a regular basis. For workers with a 401(k) plan, portability is difficult
within the workplace system, 401(k) assets often move into IRAs with higher fees, and a lot of
money leaks out through pre-retirement withdrawals.22
Among those workers without savings in an employer-sponsored plan, many are with an
employer that does not offer a plan, others work for employers that offer a plan for which they
are not eligible, and some who are eligible choose not to participate. Additionally, workers in
non-standard employment do not have a traditional employer-employee relationship, so they also
lack coverage. As a result, many workers are left with either no coverage or with multiple small
accounts.23
To better understand the challenges of the 401(k) system and its coverage and to assess
possible strategies to improve it, this report presents a three-part analysis. The first part focuses
on 401(k)s and documents the extent and nature of portability, the flow of money to IRAs, and
leakage from both systems. It summarizes resulting problems and potential solutions. But
beyond the existing 401(k) system, a coverage gap remains. So, the second part of the analysis
identifies the nature of the coverage gap among wage and salary employees and assesses
proposed solutions. But these solutions would not affect the 16 percent of workers in non-
standard employment. Therefore, the third part of the analysis looks at options for covering
these workers.
The objective of this report is to assess and present a wide – though not comprehensive –
range of available options by examining and summarizing existing proposals and, where
relevant, examples from other countries.
21 Knoll (2010), Iwry and John (2009), and Springstead and Wilson (2000). 22 For estimates of leakage in 401(k)s and IRAs, see Munnell and Webb (2015). 23 Banerjee (2014) found that individuals with less than $25,000 in assets are more likely to withdraw money from their defined contribution accounts when they leave their employer.

11
Portability, Transfers to IRAs, And Leakage
401(k) plans are the main way that private sector workers save for retirement (see Figure
1). The balances in these accounts, together with 401(k) assets rolled over to IRAs, are workers’
primary source of retirement income other than Social Security.24 Outside of workplace-based
plans and rollovers, individuals save very little except through the accumulation of home equity.
Data from the 2016 Survey of Consumer Finances show that the typical household approaching
retirement had about $17,000 of financial assets outside of retirement accounts (see Figure 2).
Yet, in that same year, the typical working household with a 401(k) approaching retirement had
$135,000 in 401(k)/IRA assets.25
Three contributors to small retirement balances are the lack of portability within the
401(k) system, the movement of money from workplace plans to the retail IRA market, and
leakage from both workplace plans and IRAs. This section describes each of these issues and
evaluates some proposed solutions.
Difficult to Move Savings from One Plan to Another
Data from the Survey of Income and Program Participation show that nearly a quarter of
all workers ages 25-34 move to a new job each year (see Figure 3).26 Even among mature
workers, ages 45-54, 18 percent change jobs each year. Mobility rates for those with a
retirement plan are lower than for those without but still very high – 20 percent and 14 percent
for the age groups mentioned above. These high annual mobility rates mean that roughly 20
million people change jobs each year – 10 million of whom have a retirement plan. Increasingly,
the plan they have is a 401(k).
In theory, defined benefit plans – with benefits typically based on final pay – are well
designed for people who spend their career with a single employer, while defined contribution
plans are better suited to mobile workers because they can easily take their savings with them as
they move from job to job. However, in practice, it is often very hard to move money between
defined contribution plans.
24 Ellis, Munnell, and Eschtruth (2014). 25 The 401(k)/IRA asset figure is also from the Survey of Consumer Finances; see Munnell and Chen (2017). 26 Light and McGarry (1998),), and U.S. Department of Labor (2015).

12
When participants change jobs, they can choose between four options regarding their
401(k) assets:
• Leave balances in the previous employer’s plan
• Roll over balances to the new employer’s plan
• Roll over balances to an IRA
• Cash out
In some cases, this decision could be difficult and what’s best for the worker may depend
on a variety of factors. For example, Federal government employees moving to the private
sector might consider leaving their money in the Federal Thrift Savings Plan due to its low
administrative fees. And workers who are leaving one small employer plan with high fees for
another might find that rolling over to an IRA instead can reduce fees. In most cases, however, a
very effective option for preserving and accumulating retirement savings is rolling over money
to the new employer’s plan.27 Unfortunately, this option is often difficult, and sponsors report
that only 10-15 percent of participants move their balances to a new employer’s plan.28
For workers who want to move their money from one 401(k) to another, the rollover can
be done either directly or indirectly.29 A direct rollover involves either sending funds straight to
the new plan or sending a check made payable to the new plan. Several factors make this
process cumbersome. First, the financial services provider at the old employer has little
incentive to facilitate a rollover out of its asset pool as its compensation is based on assets under
management. Second, the new employer plan is not required to accept a rollover from the old
employer plan. Third, the U.S. Government Accountability Office (GAO) reports that some new
plans have waiting periods – that can last weeks to months – before accepting 401(k) balances
from a previous employer; such delays are possible because employers face no specific deadline
for processing these transactions.30 Fourth, rollovers can involve a complex verification process
to ensure that the incoming funds are tax qualified. Fifth, the paperwork required for plan-to-
27 Anyone engaging in a rollover who is considering moving from a traditional account – which holds pre-tax assets – to a Roth account – with post-tax assets – would need to consider the tax consequences of a Roth conversion. Such a conversion requires paying taxes today on the transferred amount. 28 U.S. Government Accountability Office (2013). 29 Whether a rollover is direct or indirect, workers must fill out the form 1099-R. 30 U.S. Government Accountability Office (2013). One question is whether this pattern is driven by plan eligibility standards. Often retirement plans will require some amount of time to pass or number of hours worked before a new hire is enrolled. An employer with such an eligibility standard might have difficulty accepting a rollover. One option might be to hold the rollover in some escrow arrangement until the new employee is enrolled.
13
plan rollovers is not standardized; some distribution forms are only a few pages, others 15 pages.
Finally, the Internal Revenue Service (IRS) regulations expressly allow sending a check payable
to the new plan to the participant rather than the recordkeeper, which requires the participant to
give the check to the recordkeeper. This additional step further prolongs the rollover period and
unnecessarily shifts part of the burden of completing the procedure from the recordkeeper to the
individual.
An indirect rollover involves issuing a check payable to the departing participant, which
must be deposited within 60 days in a new 401(k) or IRA. This approach introduces the added
problem of adverse tax consequences if participants do not understand the 60-day deadline.
Even if they do understand the deadline, they may be confused by the 20-percent withholding
requirement. Specifically, when a participant receives a cashout, the 401(k) plan must withhold
20 percent of the distribution for tax purposes. If the individual rolls the remaining 80 percent
into a tax-qualified account within the 60-day grace period, the individual must add funds from
other sources to replace the 20 percent withheld or the withholding will count as income subject
to income tax. For example, an individual who attempts to indirectly roll over $100,000 will
receive a check for just $80,000 and will need to find an additional $20,000 within 60 days
before sending the money on to the final 401(k) or IRA. This requirement makes indirect
rollovers an especially difficult option for workers who do not have extra savings available.
Given the difficulties with the process of plan-to-plan rollovers, money often either
moves from the workplace system to an IRA or stays in the old employer plan; in this latter case,
workers can end up with multiple small accounts.
Having a number of relatively small accounts over a lifetime poses three potential
problems for building up retirement saving. First, some of these accounts may simply get lost.
Companies are frequently restructured, and plans are terminated, merged, or renamed. If
accounts are lost, key information may be held by different plans, different service providers, or
different government agencies. Second, participants with many small accounts are also less
likely to have an asset allocation that best reflects their risk/return preferences compared to those
14
with a single consolidated account.31 Third, plan participants are much more likely to cash out
small amounts.
This pattern of cashing out is evident in a tabulation of data from the Health and
Retirement Study (HRS) that show the relationship between account size and the disposition of
funds (see Table 5).32 Of those people working in 2012, the HRS asks whether they switched
employers since the last survey in 2010, whether the previous employer provided a defined
contribution plan, how much money was in that account, and what was done with the balances.
The results show that 58 percent of people with 401(k) balances of $5,000 or less with their
previous employer withdrew their money; this percentage drops to 37 percent for balances
between $5,000 and $20,000 and then falls off sharply. This pattern is similar to the results from
other studies.33
Money Moves from Workplace to Retail Accounts
One result of the lack of portability between 401(k) plans is that a lot of money is rolled
over from the workplace system to the retail world of IRAs. Sometimes the employers make
these rollovers when departing workers leave small balances behind. More often, the participant
makes the rollover because it is easier to roll over to an IRA than to another plan.
SMALL BALANCES. If participants leave their jobs with 401(k) balances of less than
$5,000 and fail to specify what should be done with these savings, employers can transfer the
funds out of the plan and into an IRA.34
Prior to 2001, employers could pay out 401(k) balances of less than $5,000 in cash and
close the account. In order to protect small balances, 2001 legislation reduced the payout limit to
less than $1,000 and allowed employers to roll over amounts between $1,000 and $4,999 to an
IRA.35 Current law also allows employers, in some cases, to transfer out accounts with $5,000
31 Choi, Laibson and Madrian (2009) found that most participants are passive decision makers and stay with default plan options. Similarly, Mitchell et al. (2006) found that plan participants are inattentive portfolio managers, with 80 percent of participants not adjusting investment allocations over a two-year period. Individuals with assets spread out over several accounts will likely not reallocate based on their combined asset level but rather stay with the default option in each account. 32 Authors’ calculations from University of Michigan, Health and Retirement Study (2010-2012). 33 Williams (2013), and Yakoboski (1997). 34 Purcell (2009). 35 These thresholds are not adjusted for inflation so, over time, their impact on overall 401(k) asset accumulation is gradually diminishing.
15
or more. For example, a plan can transfer an account with a balance of $20,000 if less than
$5,000 is attributable to contributions made on the current job.
The same 2001 legislation also required the DOL to prescribe the investment options for
these forced rollovers. Essentially, under the regulations issued in 2004, the plan satisfies its
fiduciary obligation if the investment preserves the dollar value of the rolled balances. In other
words, the money can be invested in a money market fund. The motivation for this guidance
was an expectation that participants would end up tapping these small account balances before
retirement. However, the fees charged to the forced transfer accounts often outpace the low
returns earned by the conservative investments prescribed by the DOL’s safe harbor rules,
causing account balances to decline.36
This problem is not trivial. Data provided by the U.S. Social Security Administration
(SSA) show that, over the period 2004-13, separated employees left more than 16 million
accounts of $5,000 or less in workplace plans, with an aggregate value of $8.5 billion.37 In short,
a substantial number of accounts are vulnerable to forced transfers by the employer.
LARGER ACCOUNTS. Every aspect of the rollover process makes it easier to roll over
money to an IRA than to a new employer’s plan. As noted, some employers do not accept
rollovers, and employers who do are not required to process them on a timely basis. In contrast,
it is always possible to roll over to an IRA, and IRA rollovers involve no waiting period. As a
result, while 401(k) plans serve as the main gateway for retirement saving, they often do not
retain the money. As of 2016, more than half of 401(k) balances had been rolled over to IRAs,
and these rollovers are responsible for the bulk of IRA assets. As a result, IRAs are now the
largest single repository of retirement plan savings (see Figure 4).38
The rollover activity is extraordinary, given that participants are typically passive in other
interactions with their 401(k) plans. For example, they rarely change their contribution rate or
rebalance their portfolios in response to market fluctuations or as they age.39 Indeed, inertia has
36 U.S. Government Accountability Office (2014). 37 U.S. Government Accountability Office (2014). 38 ICI (2016) estimates that $6.2 trillion of the total $7.3 trillion in IRA assets are held in traditional IRAs. Of traditional IRAs, 86 percent were opened with rollovers. For more information on the role of IRAs in retirement savings, see Holden and Schrass (2016) and Munnell and Chen (2017). 39 Munnell and Sundén (2004),), and Ameriks and Zeldes (2004).
16
been identified as such a problem that reforms have focused on automatic mechanisms, such as
auto-enrollment to boost participation, auto-escalation of contribution rates to encourage
adequate saving levels, and target-date funds to promote a diversified portfolio that automatically
rebalances with age.40 Thus, one would think that the force of inertia would lead participants to
leave their balances in their old 401(k) accounts until they draw them down in retirement. The
fact that they move their funds suggests a strong motivating force. As shown in Table 6, some
households are drawn by the opportunity to obtain a wider menu of investment options or to
consolidate their account holdings. But others may be influenced by advertisements from
financial services firms urging participants to move their funds out of their old 401(k) plans into
a new IRA.41
The shift from 401(k)s to IRAs moves the employee’s money to an environment with
fewer regulatory protections, more potential conflicts of interest, and higher fees. IRAs, unlike
401(k)s, are not subject to the fiduciary requirements of the Employee Retirement Income
Security Act of 1974 (ERISA), as detailed below. As a result, broker dealers who handle IRA
rollover transactions are not prohibited from steering clients to mutual funds that pay ongoing
commissions to the broker dealer. The potential concern is that investors could end up in funds
for which they may not be well suited or that have high fees. Financial services firms handling
IRAs face no requirement to disclose fees which may make it more likely that participants end
up paying higher fees in IRAs than in workplace plans.42 As Figure 5 shows, the bulk of 401(k)
participants are in large plans where fees generally average less than 1 percent of assets – less
than 0.5 percent in the case of very large plans.43
40 Madrian and Shea (2001),), Thaler and Benartzi (2004),), Young (2012),), and Clark, Utkus, and Young (2015). 41 A Charles Schwab ad shows a man with a 1980s boombox and the tag line “Let’s talk about that 401(k) that you picked up back in the ‘80s.” Merrill Edge (launched by Bank of America, owner of Merrill Lynch) depicts a woman with her arms spread and the phrase “Catching up with my old 401(k)s.” TD Ameritrade shows a sad young woman with writing in the background that says “roll over your old 401(k).” Fidelity’s “follow the green line” campaign includes an ad with a woman speaking to a Fidelity representative about how to roll over her “old 401(k).” 42 A GAO study found that participants in IRAs are more likely to invest in products such as individual variable annuities or retail mutual funds, which generally have higher fees. For more detail, see U.S. Government Accountability Office (2009). Munnell, Aubry, and Crawford (2015) find that IRAs have lower net returns than 401(k)s, which could be one symptom of higher fees. Alfred (2015) shows that 401(k) plans with large assets can have very low fees. IRAs, on the other hand, tend to be invested in mutual funds with higher fees (Munnell, Webb, and Vitagliano 2013). Turner and Klein (2014) conclude that a substantial rollover from a low-fee 401(k) plan to an IRA is generally a mistake. Aven Gladych (2015) notes that enhanced disclosure of fees for 401(k)s helped bring fees down. 43 Authors’ estimates from U.S. Department of Labor, Form 5500 Private Pension Plan Bulletin (2013) and BrightScope and Investment Company Institute (2014).
17
Another potential concern is that IRAs can be more susceptible to pre-retirement
withdrawals than 401(k)s. The broader issue of leakage is addressed in the next section; here,
the emphasis is simply on the differences in withdrawal rules and procedures between 401(k)s
and IRAs.
Virtually all withdrawals from 401(k)s and IRAs made before age 59½ are subject to a
10-percent tax penalty (in addition to federal and state income taxes). Exceptions include
distributions for large health care expenses (those that exceed 10 percent of Adjusted Gross
Income), in the event of permanent and total disability, and for periodic payments over a
lifetime. IRAs, however, offer three additional exemptions not available in 401(k)s: (1)
withdrawals to cover expenditures for postsecondary education for any family member, (2) up to
$10,000 toward first home purchase or repair, and (3) expenditures on health insurance for those
unemployed for 12 or more weeks.
In addition to the exemptions from the 10-percent penalty tax, the barriers to accessing
funds are lower in the case of IRAs than 401(k)s. As discussed below, 401(k) withdrawals can
be made only at job change or for reasons of hardship. IRA withdrawals can be made at any
time and without justification.44 Moreover, 401(k) hardship withdrawals involve interactions
with plan administrators, the filing of paperwork, and, at least in theory, justification for the
withdrawal. In contrast, the providers of IRAs generally do not discourage withdrawals prior to
reaching retirement age. Finally, while in 1992 Congress imposed the 20-percent withholding
requirement on money taken out of a 401(k), no such withholding exists on IRA transactions.45
All of these factors may result in more leakage or pre-retirement withdrawals from IRAs than
from 401(k)s.
The bottom line is that many participants in large 401(k) plans with low fees could be
much better off having their balances remain in the 401(k) system rather than rolled over into
IRAs.
44 It is unclear the extent to which IRA early withdrawal penalties are enforced. 45 Purcell (2009).

18
Leakage from Workplace and Retail Accounts Reduce Retirement Saving
Leakage out of workplace plans and IRAs reduces retirement saving. This reduction
would not be a concern if people were over-saving, but the evidence suggests they generally are
not.46 It is also not a concern if money is withdrawn for a true emergency, such as an
unexpected health shock or unemployment. But, regardless how compelling the reason for the
withdrawal, money used for other purposes is not available for retirement.
The current system does try to dissuade leakage through the penalty tax on early
withdrawals on top of income taxes. However, this provision may not be an effective deterrent
for many participants. For example, for those who pay little or no income tax due to low
earnings, the penalty may seem acceptable (particularly when facing a financial emergency). In
addition, a meaningful portion of the participant’s account may represent “free” employer
contributions. So, the net cost for “cashing out” can seem minimal, in both financial and
psychological terms, for many workers.
Leakage can occur through three channels: in-service withdrawals (hardship withdrawals
and withdrawals after age 59-½), cashout at job change, and loans. Researchers have tried to
estimate annual leakage rates using household surveys and, more recently, tax data.47
Unfortunately, the surveys are not designed to answer these precise questions and have led many
researchers to focus on loans. Loans are pervasive but are mostly repaid and therefore just a
small piece of the leakage puzzle – loans comprised only 18 percent of all leakages in 2015
according to Vanguard data.48 Fortunately, the Vanguard data present a comprehensive picture
of the percentage of assets leaking out each year through the various channels (see Figure 6).
These data show that cashouts at job change account for 46 percent of all leakage, by far the
largest source.
While the Vanguard data provide a useful way to identify the various leakage paths, they
likely understate leakage rates because Vanguard’s clients tend to be large plans with higher-paid
workers who are less likely to allow their assets to leak out of the retirement system. In fact, the
46 Ellis, Munnell, and Eschtruth (2014) provide a broad overview of retirement insecurity and inadequate saving. Poterba, Venti, and Wise (2012) find that many households outlive their assets. 47 For a full review of the literature, see Munnell and Webb (2015). 48 See Vanguard (2016) and Munnell and Webb (2015). One recent study using tax data did estimate the effect of all pre-retirement leakage – not just loan leakage – for households younger than 55 during the Great Recession (Argento, Bryant, and Sabelhaus 2015).
19
annual leakage rates based on household surveys amount to 1.5 percent of aggregate balances,49
modestly higher than those implied by Vanguard, and estimates using tax data are much higher,
amounting to 2.9 percent of assets.50 Therefore, to estimate how much leakage reduces assets at
retirement, Munnell and Webb (2015) assume that the leakage out of 401(k) plans equals 1.5
percent of assets each year (as opposed to the 1.1 percent suggested by the Vanguard 2015 data).
While an annual leakage rate of 1.5 percent may sound small, over the course of a
worker’s career the effect is significant. Estimates show that an average leakage rate of 1.5
percent reduces accumulated wealth at age 60 by 25 percent (see Figure 7).51 This estimate
represents the overall impact for the whole population, averaged across both those who tap their
savings before retirement and those who do not. For those whose assets do leak out of the
system, the problem is more severe than indicated by these estimates.
A similar exercise can be used to estimate the impact of leakage from IRAs on wealth at
age 60. It assumes that an individual rolls over money from a 401(k) three times during his
career. The initial rollover into the IRA occurs at age 30, and withdrawal rates are taken from
the experience of households in the 2010 Survey of Consumer Finances (SCF). Under these
assumptions, leakage reduces IRA wealth by 23 percent.52
Interestingly, the effects of leakage from 401(k)s and IRAs on age-60 wealth are
relatively similar, which is consistent with an earlier study that estimated annual leakage at 1.5
percent from 401(k)s and 1.4 percent from IRAs.53 The explanation may be that while IRAs are
easier to access and have more options for penalty-free withdrawals, individuals who roll over to
IRAs may be more savings oriented. Furthermore, once money is in an IRA, one of the biggest
opportunities for leakage – when a worker changes jobs – is no longer relevant. In any case, the
49 Butrica, Zedlewski, and Issa (2010). 50 See Bryant, Holden, and Sabelhaus (2011) and Argento, Bryant, and Sabelhaus (2013). 51 This estimate of lifetime leakage relies on the following assumptions: the 401(k) participant begins contributing 6 percent of salary at age 30, the employer match rate is 50 percent, the participant’s initial salary is $40,000 (increasing at 1.1 percent a year in real terms), and investments earn a real 4.5-percent return. The calculations also assume a 75-percent linear decline in the leakage rate from age 30 to 60 – that is from higher than 1.5 percent at age 30 to less than 1.5 percent at age 60. The resulting estimate is considerably higher than Poterba, Venti, and Wise (2001), who assume much lower rates of job separation. This assumption, together with the exclusion from their analysis of hardship withdrawals, loan defaults, and IRA withdrawals, leads them to conclude that leakages will only reduce retirement wealth by about five percent. 52 Munnell and Webb (2015). 53 Butrica, Zedlewski, and Issa (2010).

20
estimates suggest that, in a mature system, leakage reduces aggregate 401(k)/IRA wealth at
retirement by about 25 percent.
Summing Up the Problem
A lack of portability among 401(k) plans, movement from workplace plans to IRAs with
fewer consumer protections, and leakage from the workplace/IRA system can undermine a
worker’s ability to accumulate a robust retirement nest egg. These problems can be serious in a
labor market like that of the United States, which is characterized by a high degree of worker
mobility. The lack of portability is caused largely by administrative barriers to moving money
from one 401(k) plan to another, which is often the best choice for mobile workers. Without
easy portability, money either becomes stranded in small accounts or moves either involuntarily
or voluntarily to IRAs. The retail IRA market is characterized by less protective regulation,
possible conflicts of interest, and higher fees. Finally, the combined workplace/IRA system
allows ample access to assets before retirement through cashouts and in-service withdrawals.
While some access to retirement savings may well be desirable, the current environment reduces
401(k)/IRA wealth at retirement by about one quarter.
Options for Enhancing Portability in 401(k) Plans
Some options for enhancing portability include: (1) making it easier for participants to
roll their balances from one 401(k) plan to another; (2) setting up a public registry for accounts;
(3) creating a clearinghouse to automatically roll over small accounts or more broadly to
facilitate rolling over balances within the system. The option to facilitate plan-to-plan rollovers
is a smaller-scale improvement that could be done in the short term, while the registry and
clearinghouse ideas are longer term initiatives with potentially larger payoffs.
FACILITATE TRANSFERS BETWEEN 401(K) PLANS. Establishing a few standardized
procedures to facilitate rollovers from one 401(k) to another could improve the portability
between plans. First, plans could be required to accept rollovers. Second, the process could be
made more efficient by establishing a schedule for timely action by both the new and old
employer plans and standardizing the paperwork. Third, indirect rollovers could be eliminated,
as they add the possibility of adverse tax consequences to an already complicated process.
21
Some steps have been taken to simplify the verification process regarding the tax-
qualified status of the rollover money, since part of the reluctance to accept rollovers is the
concern that funds coming from outside a plan may not be legally tax qualified under the Internal
Revenue Code. In 2014, the IRS issued guidance to ease the process and make plan-to-plan
rollovers less burdensome.54 Specifically, the ruling enables receiving plans to verify the tax-
qualified status of sending plans simply by checking a recent Form 5500 filing for the sending
plan on a public database. It is not yet clear whether this new ruling has altered behavior.
ESTABLISH A PENSION REGISTRY. Currently, the United States does not have a national
pension registry, and no coalition of financial firms has undertaken such an initiative. A bill was
proposed to establish such a registry in 2016; however, it did not gain traction.55 In contrast,
many other countries – such as Denmark, The Netherlands, Australia, and Belgium – provide
consolidated online information for participants on all their workforce retirement accounts (see
Table 7). These pension registries, which include information on both active and inactive
accounts, may be helpful not only to participants but also to plan administrators, who can use
them to locate missing participants and eliminate outstanding liabilities.56 One other function a
U.S. pension registry could provide is collecting information on forced transfer IRAs that could
be used to establish the government as the account administrator of last resort, a function in
Australia that is assumed by the Tax Office.
The closest the United States comes to a pension registry is the SSA’s Potential Private
Retirement Benefit Information. This information on deferred vested benefits from past
employers for over 33 million people includes the name of any plan where a participant has
savings, the plan administrator’s name and address, the participant’s name, Social Security
number, savings balance, and the year that the plan reported savings left behind. SSA sends this
information when an individual files for Social Security benefits. Participants can request the
information earlier, but SSA received only about 760 requests in 2013.57 SSA does not promote
the availability of this information, nor does the agency consolidate information on accounts
54 Internal Revenue Service (2014). 55 Senators Elizabeth Warren and Steve Daines have put forward legislation in the form of the Retirement Savings Lost and Found Act of 2016, which would seek to create a national lost and found for pensions. The lost and found would allow employees to put in their name and find all of their past employer-sponsored retirement accounts. 56 U.S. Government Accountability Office (2014). 57 U.S. Government Accountability Office (2014).
22
from several employers to provide beneficiaries with a single statement. The GAO
recommended that SSA make such information more accessible to individuals before retirement,
perhaps sending consolidated information with the Social Security Statement (issued every five
years). SSA rejected the recommendation because it would place the agency in the position of
having to answer legal questions about private plans, an area where it lacks expertise.
U.S. federal agencies – the DOL, Pension Benefit Guaranty Corporation, and SSA – do
not have any current efforts to develop a pension registry.58 The DOL, in response to a GAO
recommendation, noted that it does not have the authority to require the reporting necessary to
establish a registry. Nevertheless, two industry associations (the American Bar Association and
the American Benefits Council) have suggested a central database for participants to check for
lost accounts in ongoing or terminated plans.59 And much of the required information for such a
database is already in place through large service providers. Thus, it is feasible to set up a U.S.
pension registry with some concerted government effort to determine the appropriate scope,
oversight, and financing method.
CREATE CLEARINGHOUSE TO AUTOMATICALLY ROLLOVER BALANCES. A clearinghouse
that would automatically roll over balances from one plan to another could address many of the
portability issues.60 One such proposal – at least for small balances – has been suggested by a
firm called the Retirement Clearinghouse to establish a platform to automatically route all the
participant’s old 401(k) balances to their next 401(k) plan through an IRA. The suggested costs
are $1.50 to $3 per month in custodial fees for the holding period and a $49 fee for the electronic
transfer to a new plan.61 The goal is to keep the small balances in an IRA for as short a period as
possible before transferring them to a new plan.
58 The Pension Benefit Guaranty Agency (PBGC) has a Missing Participant Program, which holds retirement benefits for missing participants and beneficiaries in terminated retirement plans to help them find and receive these benefits. PBGC recently finalized a regulation to expand the universe from single-employer defined benefit plans to include terminating defined contribution plans. These plans will have the option of transferring missing participants’ benefits to PBGC instead of establishing an IRA at a financial institution. Participant accounts will not be diminished by ongoing maintenance fees or distribution charges, and PBGC will pay out benefits with interest when participants are found. When implemented, the enhanced program aims to make it easier for people to locate their retirement benefits after their plan terminates. 59 U.S. Government Accountability Office (2014). 60 Williams (2013). 61 Pechter (2014).
23
While the technology may exist to provide automatic roll-ins, any firm attempting to take
on this task would need buy-in from government regulators and from all the major financial
services firms. To date, some progress has been made on this front. The Boston Research Group
has documented a big payoff to 401(k) consolidation for a large health care company,62 the
ERISA Advisory Council has heard testimony on the advantages of a single portable account,
and the 2014 IRS guidance on plan rollovers made it easier for 401(k) plan IT systems to certify
the tax-free status of roll-ins. However, such a process would require an advisory ruling from
the DOL; and it would be important to determine who serves as a fiduciary for money passing
through the system. Aside from the need to settle this latter point, it appears possible to
consolidate small 401(k) account balances through this type of system.
A more ambitious effort, proposed by the Bipartisan Policy Center’s Commission on
Retirement Security and Personal Savings, would establish a national Retirement Security
Clearinghouse. Under this proposal, the DOL and Treasury would convene industry
stakeholders to develop standards for streamlining transfers and rollovers among defined
contribution plans and IRAs. Plans could then choose to adopt these standards, which would
allow plan participants to easily consolidate their retirement assets in one place.63
In theory, developing a clearinghouse could be paired with the effort to establish a
pension registry, perhaps with the DOL, Treasury, or another public or private entity involved in
both functions. While these two aims are separate – a clearinghouse makes voluntary transfers
between accounts easier, while a registry keeps a record of all accounts – they both share the
goal of improving the ability to effectively manage retirement savings.
Options for Protecting Transfers from Workplace Plans to IRAs
As noted above, 401(k) balances can be transferred to IRAs by employers, or employees
themselves can choose to roll them over. In both instances, the balances could be better
protected than they are currently.
62 See Cormier (2013). The health care company had more than 190,000 participants and an average annual turnover of more than 40,000 employees. To control costs and better serve employees, the company instituted a “roll-in” program as a fringe benefit to help new or current employees consolidate their savings in the company’s plan or, for departing employees, in the plan of the next employer. The plan saved $6 million in costs, reduced subsequent cashouts by over 50 percent, and received considerable new money – over $55 million from new employees’ old 401(k) plans and $10 million from their IRAs. 63 Bipartisan Policy Center (2016).

24
SMALL BALANCES. In the absence of some type of clearinghouse solution, the GAO
suggests two very specific changes that will reduce money automatically transferred to IRAs and
the likelihood that balances will be eroded by fees. The first is to repeal the provision that allows
plans to disregard previous rollovers when identifying balances in a current 401(k) account
eligible for transfer. That is, an account with a balance of $20,000 (including rollover
contributions) would no longer be eligible based on the fact that assets accumulated based on
contributions while at the current employer are less than $5,000. The second proposal is to
amend the law to enable plans to invest the assets of 401(k) forced transfers in higher-yielding
investments, such as those included in the qualified default investment alternatives for the
employer’s 401(k) plan. However, the DOL expressed concern that this proposal would not
guarantee the preservation of the principal.64 Some innovative use of the Federal Thrift Savings
Plan (TSP) might offer a solution for handling abandoned accounts.65 With assets of $443
billion, TSP may be able to absorb all of the 16 million small abandoned accounts with only a
modest increase in fees.66
LARGER ACCOUNTS. For larger accounts, two options are reducing conflicts of interest
through the Fiduciary Rule and enhancing the transparency of fees.
The shift from 401(k)s to IRAs moves the employee’s money to a less-protective
regulatory environment. 401(k) plans are covered by ERISA, which requires plan sponsors to
operate as fiduciaries who act in the best interest of plan participants. In contrast, the standard of
conduct for a broker selling IRAs has historically been “suitability,” a lower hurdle.
The standard for brokers would be changed by the DOL’s “Fiduciary Rule,” which was
designed to ensure that those in the financial services industry act as fiduciaries (i.e. “solely in
the interest” of clients) when giving advice regarding retirement savings.67 Advisors would be
64 U.S. Government Accountability Office (2014). 65 TSP participants benefit from economies of scale, limited investment choices, and the broad relief from the regulations and compliance costs that apply to private sector plans. Therefore, the TSP’s results are difficult to achieve for private sector 401(k) plans (ICI 2015). 66 Federal Retirement Thrift Investment Board (2015). Such a transfer, however, would increase costs somewhat for current TSP participants unless TSP could parcel costs differentially across federal employees vs. everyone else. 67 The new rule is designed to eliminate the incentive for brokers to put retirement savers in inappropriate investments. Fiduciaries cannot engage in this behavior, because they are bound by the “best interest” standard. So the strategy of the rule is to expand the group of investment professionals who must act as fiduciaries. Under ERISA, anyone providing investment advice within retirement plans must act as a fiduciary, so the lever used to

25
held to the fiduciary standard with respect to not only 401(k) assets but also distributions from
401(k) plans and IRA assets. In fact, the recommendation to roll over is itself a fiduciary act.
Extending coverage to the rollover and then to IRA assets reflects the fact that both 401(k)s and
IRAs are integral and equally important parts of the retirement income system. The Fiduciary
Rule was issued in 2016 after a lengthy process.68 As of December 2017, the rule is in the
process of further review, with its enforcement provisions delayed until July 1, 2019 and its final
details uncertain.69
Moreover, as a 2009 GAO report found, when participants roll over their 401(k) balances
into an IRA, they are likely moving to a higher-fee environment.70 401(k) fees have been
coming down – perhaps due in part to the DOL’s fee disclosure rules, which require 401(k) plans
to disclose their fees in an easily understandable format. Financial services firms handling IRAs
face no such requirement. Requiring them to disclose their fees may put some downward
pressure on fees, as well as inform individuals about how much they are paying.
Options for Reducing Leakage
In deciding how much early access to allow to retirement savings, policymakers balance
two conflicting goals: (1) keeping money in the plan; and (2) allowing access to those who need
their funds, which can encourage participation and contributions. The following discussion
assumes that the primary purpose of 401(k)s/IRAs is to preserve money for retirement. Many
experts have proposed ways to reduce leakage, ranging from better education for plan
participants to changes in withdrawal penalties to tighter access to the funds.71 In considering
reforms, it may also be helpful to adopt a broad perspective that considers all leakage channels
and, as discussed in Box 1 (on the next page), the possible role of precautionary saving. In any
event, the ability to take money from 401(k) plans and IRAs could be made the same, including
allowing loans from IRAs.
expand who is considered a fiduciary is to redefine the term “investment advice” by replacing a 1975 five-part test with a more sensible and inclusive functional test. 68 For detailed analysis, see Borzi (1985 and 2011). 69 See U.S. Department of Labor (2017). In addition, the rule has faced legal challenges in several federal courts in Texas, Kansas, Minnesota, and the District of Columbia. To date, U.S. District Courts in Texas, Kansas, and DC have upheld the legal validity of the rule, and appeals are pending. 70 U.S. Government Accountability Office (2009). 71 Purcell (2009), AonHewitt (2011), U.S. Government Accountability Office (2009), Butrica, Zedlewski, and Issa (2010), and Fellowes and Willemin (2013). Burman et al. (2008) examine the interaction of public policies and behavioral influences.
26
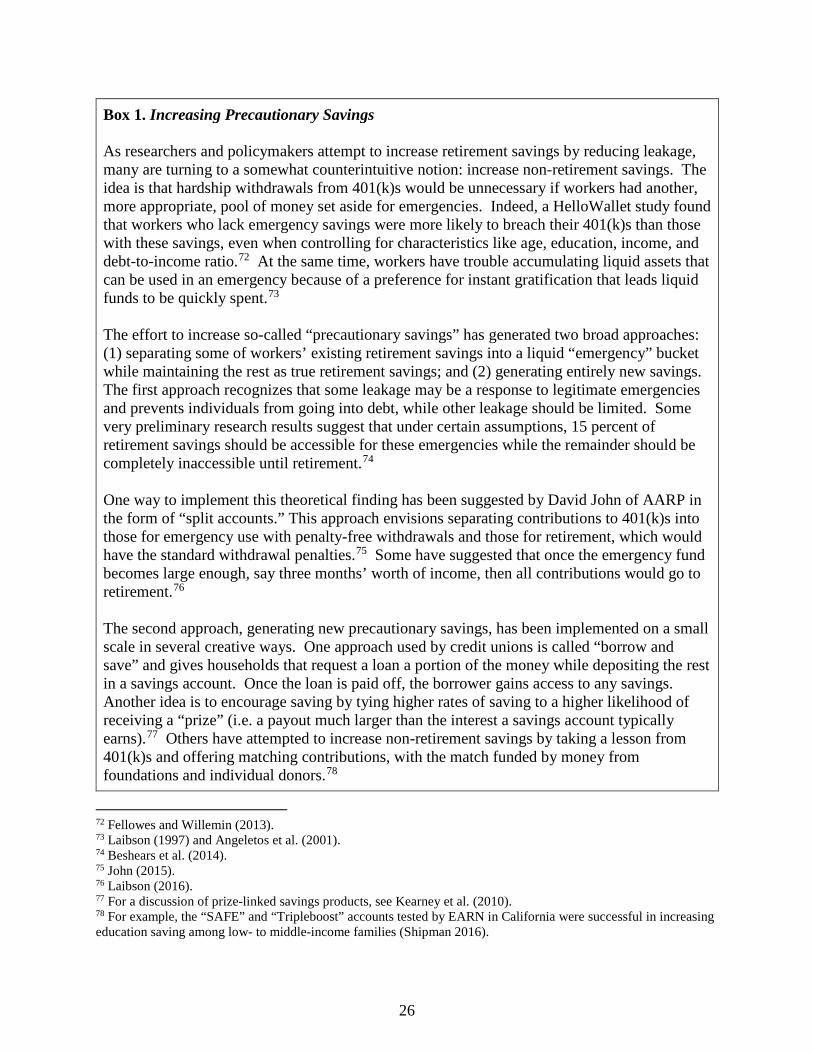
72 Fellowes and Willemin (2013). 73 Laibson (1997) and Angeletos et al. (2001). 74 Beshears et al. (2014). 75 John (2015). 76 Laibson (2016). 77 For a discussion of prize-linked savings products, see Kearney et al. (2010). 78 For example, the “SAFE” and “Tripleboost” accounts tested by EARN in California were successful in increasing education saving among low- to middle-income families (Shipman 2016).
Box 1. Increasing Precautionary Savings As researchers and policymakers attempt to increase retirement savings by reducing leakage, many are turning to a somewhat counterintuitive notion: increase non-retirement savings. The idea is that hardship withdrawals from 401(k)s would be unnecessary if workers had another, more appropriate, pool of money set aside for emergencies. Indeed, a HelloWallet study found that workers who lack emergency savings were more likely to breach their 401(k)s than those with these savings, even when controlling for characteristics like age, education, income, and debt-to-income ratio.72 At the same time, workers have trouble accumulating liquid assets that can be used in an emergency because of a preference for instant gratification that leads liquid funds to be quickly spent.73
The effort to increase so-called “precautionary savings” has generated two broad approaches: (1) separating some of workers’ existing retirement savings into a liquid “emergency” bucket while maintaining the rest as true retirement savings; and (2) generating entirely new savings. The first approach recognizes that some leakage may be a response to legitimate emergencies and prevents individuals from going into debt, while other leakage should be limited. Some very preliminary research results suggest that under certain assumptions, 15 percent of retirement savings should be accessible for these emergencies while the remainder should be completely inaccessible until retirement.74
One way to implement this theoretical finding has been suggested by David John of AARP in the form of “split accounts.” This approach envisions separating contributions to 401(k)s into those for emergency use with penalty-free withdrawals and those for retirement, which would have the standard withdrawal penalties.75 Some have suggested that once the emergency fund becomes large enough, say three months’ worth of income, then all contributions would go to retirement.76
The second approach, generating new precautionary savings, has been implemented on a small scale in several creative ways. One approach used by credit unions is called “borrow and save” and gives households that request a loan a portion of the money while depositing the rest in a savings account. Once the loan is paid off, the borrower gains access to any savings. Another idea is to encourage saving by tying higher rates of saving to a higher likelihood of receiving a “prize” (i.e. a payout much larger than the interest a savings account typically earns).77 Others have attempted to increase non-retirement savings by taking a lesson from 401(k)s and offering matching contributions, with the match funded by money from foundations and individual donors.78
27
IN-SERVICE WITHDRAWALS. Hardship withdrawals provide a safety valve for families in
financial trouble. However, to help limit leakages, these withdrawals could be limited to serious
unpredictable hardships such as disability, high health care costs, and job loss.79 Predictable
events like housing and higher education could be excluded. With such limitations, the
disincentive of a 10-percent tax penalty could be eliminated to avoid punishing those with severe
financial problems. Another way to limit hardship withdrawals would be to restrict them to the
amount of an employee’s contributions. For post-59½ withdrawals, one idea is to coordinate the
threshold age for penalty-free withdrawals with Social Security claiming provisions.80
CASHOUTS. Cashing out when changing jobs could be eliminated entirely by prohibiting
lump-sum distributions at termination.81 The allowable options could be limited to leaving the
money in the prior employer’s plan, transferring the money to the new employer’s 401(k), or –
for those leaving the labor force – rolling over the plan balance into an IRA. This approach
could be done jointly with the actions described above intended to make direct rollovers between
401(k)s easier.
LOANS. Of the various ways to access funds, loans appear to be the best way to minimize
leakage. Most borrowers continue to contribute to the plan while they have a loan; and most of
the money is repaid. The likely point of default arises when a terminating employee cannot
repay the loan within 60 days, causing the money to be treated as a taxable distribution and
subject to penalties. But the estimated leakage from loan defaults is much smaller than from
other sources. So, given that the availability of loans encourages employees to participate and
contribute, loans are a low-leakage way to allow participants to access funds.
Still, defaults on loans from 401(k) accounts do occur, so the loans are not costless in
terms of retirement security. Moreover, even if an individual pays back their loan, many plans
do not allow a worker with an outstanding loan to make contributions to their 401(k), eliminating
the chance to continue building up balances.
79 See, for example, Munnell and Webb for a discussion of the literature and suggestions on policy options to reduce leakages (2014). For an international comparison, see Beshears et al. (2015). 80 Munnell and Webb (2014). 81 Purcell (2009) suggests requiring at least part of the distribution to be rolled over.

28
An emerging alternative to 401(k) loans is to leverage the credit of the employer to offer
employees low-interest loans outside of their retirement accounts. For example, MassMutual has
made the “Kashable” service available to employers using its benefit platform.82 This service
allows employees to receive emergency loans at a much lower interest rate than they could
receive elsewhere. Repayment occurs automatically out of the worker’s paycheck and does not
incur the administrative fees of a loan out of the retirement account nor stop a worker’s ability to
make contributions. This approach may be a way to limit any leakage from loan defaults in the
future.
Summing Up the Options
Table 1 summarizes the options for enhancing 401(k) portability, protecting transfers to
IRAs, and reducing leakage.
Table 1. Options to Address 401(k) Portability, Transfers to IRAs, and Leakage
The proposals in this section could improve the system’s administrative efficiency and
management of 401(k)/IRA assets. These changes, however, would do little to improve
coverage among private sector employees. This coverage issue is the focus of the next section.
82 MassMutual (2016).
Goal Option Enhance portability Require plans to accept rollovers
Standardize rollover rules and paperwork Encourage direct rollovers Set up a public registry to prevent lost accounts Create clearinghouse to automatically roll over small balances
Protect transfers from workplace to IRA system
Limit forced transfers and expand their investment options Reduce conflicts of interest through the Fiduciary Rule Enhance transparency of fees
Reduce leakage Limit or prohibit cashouts at job termination Tighten hardship withdrawal criteria Coordinate age for penalty-free withdrawals with Social Security claiming provisions

29
Reducing the Coverage Gap
While the retirement savings of those with a 401(k) plan is often hindered by portability
and leakage problems, workers still benefit from being covered by a 401(k). Many workers have
no access to a 401(k), and this situation shows no sign of improving on its own. The precise
percentage of workers covered depends on how coverage is defined. Employees can work for an
employer that offers a plan for some of its employees, but not be eligible to participate. Their
employer can offer a plan, and they can be eligible to participate but choose not to do so. Or
they can actually participate in the plan. (For the purposes of this study, the terms “coverage”
and “participation” are used synonymously).83
The percentage of workers covered by an employer-sponsored plan also depends on the
population under consideration. For example, using the Current Population Survey (CPS),
restricting the population to full-time wage and salary workers ages 25-64 and using an employer
offer as the criterion indicates that about 62 percent of that sample had at least the potential for
plan participation in 2013 (see Figure 8). (Note: The Figure includes 2014 data, but 2013 data
are emphasized here because of the inexplicable dip in 2014.84) However, a commonly cited
measure of coverage is all private sector wage and salary workers ages 25-64 participating in an
employer-sponsored plan – only 44 percent in 2013 – and this definition is used for the
remainder of the report unless specified. Of course, the CPS is only one of many datasets that
measure coverage. Box 2 (on the next page) discusses coverage estimates from alternative
surveys.85
83 “Coverage” is commonly used by the IRS and DOL to describe when a worker is eligible for the plan. “Participation” is also commonly used to describe when a covered employee is a participant in the plan. However, this study focuses on people who do not have a workplace plan for any reason – either they are not offered one or choose not to join it – so we rely on the “participation” measure. Overall, though, we believe that the word “coverage” is clearer and more accessible, so it is used synonymously with “participation” in this paper. 84 Some of the recent decrease in estimated coverage may reflect a change in the CPS design (the effects of which are not well understood. See Copeland (2015b). 85 An alternative estimate of participation not discussed in Box 2 is presented in Dushi, Iams and Lichtenstein (2015). The estimate used data from the Survey of Income and Program Participation (SIPP), a survey of individuals that relies on self-reported estimates of pension participation. To correct for any reporting bias related to 401(k)s, the analysis matched the SIPP responses with W-2 data. They concluded that the overall participation rate for private sector workers was 61 percent in 2012. This estimate could potentially overstate participation, because the authors assume that all respondents who believed they participated in a 401(k) when their W-2 showed no contributions were actually participating in a defined benefit plan.
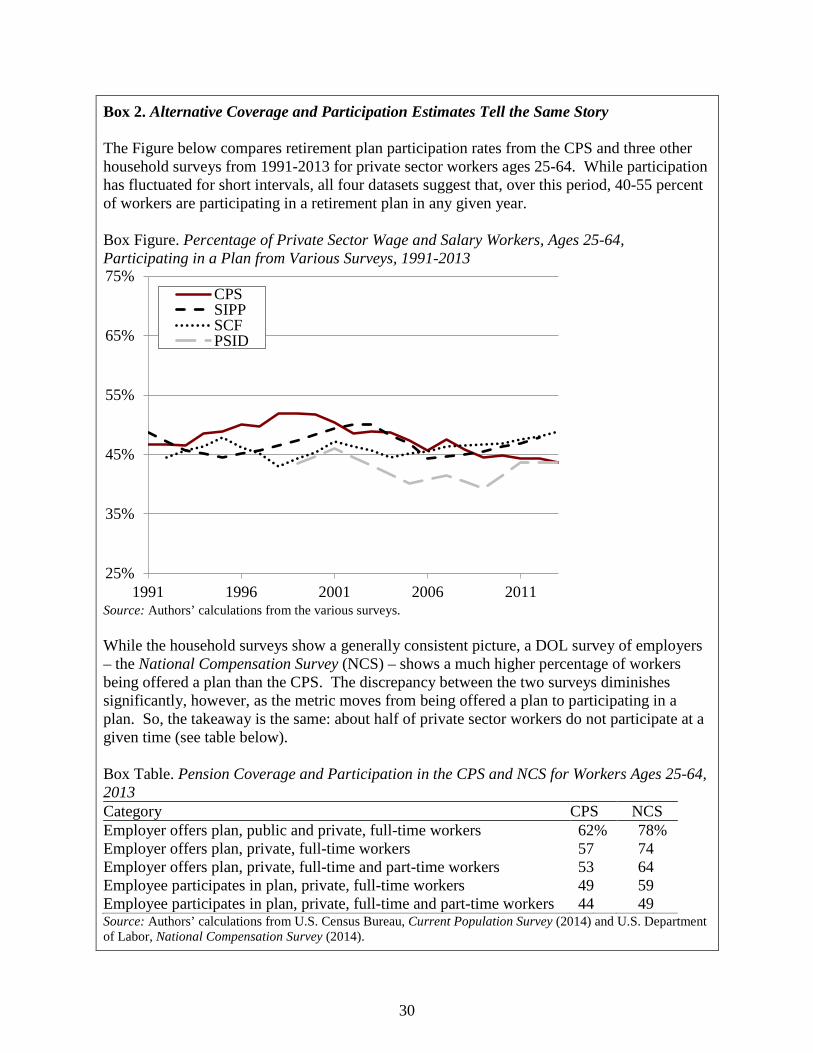
30
Box 2. Alternative Coverage and Participation Estimates Tell the Same Story The Figure below compares retirement plan participation rates from the CPS and three other household surveys from 1991-2013 for private sector workers ages 25-64. While participation has fluctuated for short intervals, all four datasets suggest that, over this period, 40-55 percent of workers are participating in a retirement plan in any given year. Box Figure. Percentage of Private Sector Wage and Salary Workers, Ages 25-64, Participating in a Plan from Various Surveys, 1991-2013
Source: Authors’ calculations from the various surveys. While the household surveys show a generally consistent picture, a DOL survey of employers – the National Compensation Survey (NCS) – shows a much higher percentage of workers being offered a plan than the CPS. The discrepancy between the two surveys diminishes significantly, however, as the metric moves from being offered a plan to participating in a plan. So, the takeaway is the same: about half of private sector workers do not participate at a given time (see table below). Box Table. Pension Coverage and Participation in the CPS and NCS for Workers Ages 25-64, 2013 Category CPS NCS Employer offers plan, public and private, full-time workers 62 % 78 % Employer offers plan, private, full-time workers 57 74 Employer offers plan, private, full-time and part-time workers 53 64 Employee participates in plan, private, full-time workers 49 59 Employee participates in plan, private, full-time and part-time workers 44 49 Source: Authors’ calculations from U.S. Census Bureau, Current Population Survey (2014) and U.S. Department of Labor, National Compensation Survey (2014).
25%
35%
45%
55%
65%
75%
1991 1996 2001 2006 2011
CPSSIPPSCFPSID
31
Participation in a retirement plan is closely correlated with earnings (see Figure 9). In the
top quintile, two-thirds of workers – both male and female – are in an employer-sponsored plan.
In the bottom quintile, that figure drops to roughly 10 percent. Moreover, the participation rate
for men has declined, while the rate for women has been essentially flat (with gains among the
lower earners largely offset by declines among the higher earners). The drop in male
participation rates may have been caused in part by the rapid growth of 401(k) plans that made
employee participation in employer plans voluntary, unlike the mandatory participation of
defined benefit plans. Additional causes could include declines in unionization and large-firm
employment, as these factors have been associated with higher plan coverage.86 Pension
participation among full-time, full-year workers is now equal for both men and women. (For the
purposes of this study, the term “pension” refers to any type of employer-sponsored retirement
plan.)
The CPS data show that, of private sector wage and salary workers not covered by a
pension plan, roughly 25 percent work for an employer with a plan but are either ineligible or
choose not to participate. The bulk of uncovered workers, however, are those whose employers
do not offer any coverage; most of these workers are with small employers (firms with fewer
than 100 workers) (see Figure 10).
Even if small employers were willing to offer 401(k) plans, the current architecture leads
to very high costs for small plans. Figure 11 shows all the players in the 401(k) system; as the
money flows through, each player takes a slice. Nevertheless, data from BrightScope indicate
that the economies of scale for large plans (over $100 million in assets) almost uniformly result
in fees below 1 percent of assets, with the largest plans’ fees typically below 0.50 percent. But
these relatively low fees stand in stark contrast to those for small plans, where the average is
about 2 percent and with many plans paying more (see Figure 12).87 Paying 2 percent or more in
fees makes investing prohibitively expensive and cuts balances at retirement nearly in half
compared to a no-fee world. So the challenge in the coverage area is not just providing
retirement plans for the uncovered population but doing so in a cost-effective way. Before
discussing ways to address this issue, the next section looks at the implications of the lack of
universal coverage.
86 For an exploration of declining pension coverage among men in the 1980s, see Even and Macpherson (1994). 87 Alfred (2015).

32
Implications of Coverage Gap
The fact that only about half the private sector workforce is covered by an employer-
sponsored pension at any moment in time has two important implications for retirement income.
First, some households will end up at retirement without any retirement savings and thus will be
entirely reliant on Social Security. Second, projections of 401(k) accumulations based on steady
contributions may not be realistic for households that move in and out of coverage.
RELIANCE SOLELY ON SOCIAL SECURITY. The data presented above provide only a
snapshot of pension coverage in a given year. As workers switch jobs, many will move into
coverage at some point over their work life, so the point in time snapshot understates the
percentage of workers who will end up with coverage. The Health and Retirement Study, which
asks respondents about participation and assets in employer-sponsored plans, shows that 69
percent of households ages 63-73 end up with assets from any type of employer-provided plan
(see Figure 13).88 In other words, more than 30 percent of households end up entirely dependent
on Social Security; for low earners, the figure is four-fifths of households.89
Lower earners’ sole reliance on Social Security would not be a problem if the program
provided sufficient income to maintain their standard of living. But Social Security was never
intended to be the sole source of income for retirees. Social Security replacement rates –
benefits as a percentage of pre-retirement earnings – fall far below the generally accepted
benchmark of 75 percent to ensure an adequate retirement.90 And low earners are more likely to
claim early, which results in an actuarial reduction in the replacement rate. For example, for low
earners retiring at age 62, Social Security currently replaces 44 percent of a worker’s pre-
88 The HRS is a nationally representative sample of older American households. This study began in 1992 by interviewing about 12,650 individuals (ages 51-61) from about 7,600 households and their spouses (regardless of age), and the survey has been re-administered every two years since 1992. The HRS is conducted by the Institute for Social Research (ISR) at the University of Michigan and funded by the National Institute on Aging. 89 Data from the 2013 Survey of Consumer Finances show that almost a third of Americans have no retirement savings and are not covered by a defined benefit pension. Among respondents aged 55-64, 19 percent report having no retirement savings or pension outside of Social Security (Keith, Madland, and Weller 2015). 90 Palmer (2008). This benchmark applies to single workers with pre-retirement earnings of $50,000. For single workers with $20,000 and $90,000 in pre-retirement earnings, the benchmarks are 88 percent and 81 percent, respectively. Munnell, Webb, and Hou (2014) show that half of today’s working families are “at risk” of not being able to maintain their standard of living once they retire.

33
retirement earnings (see Figure 14).91 For those low-income workers who must pay their own
Medicare premiums – Medicaid covers the premiums for about half such workers – the net
replacement rate is lower. Thus, Social Security alone often does not provide enough retirement
income. Working until the Full Retirement Age or beyond (to age 70) would produce higher
replacement rates, but many people in this group may be unlikely to be able to stay in the labor
force that long due to health issues and declining productivity.92
INADEQUATE 401(K) BALANCES. The second implication of the lack of universal
coverage is that workers will likely move in and out of coverage. As a result, their 401(k)
accumulations could be much lower than projections based on the prospect of a steady lifetime
of contributions. For example, a typical 25-year old worker in 1981 with median earnings who
began contributing a steady 6 percent of their earnings with an employer match of 3 percent
should accumulate about $364,000 by age 60 (see Figure 15).
Yet, according to the Federal Reserve’s Survey of Consumer Finances, the typical
household approaching retirement had 401(k)/IRA balances of only $135,000 in 2016, far short
of the projected amount for the individual. A number of factors contribute to this discrepancy –
including a failure to participate at young ages, low contribution rates, leakage, relatively high
fees, and the lack of maturity of the 401(k) system – but moving in and out of covered
employment is an important contributing factor. One study found that having only intermittent
contributions could account for roughly a quarter of the difference between what a steady
contributor could have earned and actual 401(k) savings for a typical household.93
The consequences of having either no coverage or intermittent coverage are apparent
when assessing summary measures of retirement preparedness. Lower-income households are
much more likely to lack regular access to a workplace retirement savings plan, which is part of
the reason why they are less likely to be on track to maintain their pre-retirement income at
retirement (see Figure 16).
91 Replacement rates are from the U.S. Social Security Administration’s Office of the Chief Actuary (Clingman et. al 2016). 92 Munnell, Webb, and Chen (2015) and Burtless (2013). 93 Munnell (2014).

34
Summing Up the Problem
The coverage gap is large and includes both those who never have coverage and those
with only intermittent coverage. Either type of gap poses a serious problem, because Social
Security alone is often not enough – even for low-income workers. Having sufficient retirement
savings requires that either employees have continuous participation in an employer plan
throughout their career or that those with intermittent coverage make very high contributions
when participating. Notably, the coverage gap has not diminished over the past several decades.
The causes of the coverage gap are twofold. First, many employers – particularly small
employers – do not offer a retirement savings plan, perhaps partly due to high administrative
costs but more likely due to non-financial reasons discussed below. This group accounts for 65
percent of the uncovered (see Figure 17). Second, as noted, another group of uncovered
employees work for an employer that sponsors a plan but are either ineligible or choose not to
participate. This group accounts for 22 percent of uncovered workers. The self-employed
constitute the remaining 14 percent of the uncovered. The following discussion focuses on the
first two groups; the problem of covering the self-employed is discussed in the final section.
Options for Expanding Coverage
In theory, any degree of coverage for traditional employees is achievable. It depends on
the extent to which compulsion is introduced into pension arrangements and somewhat on the
locus of pension arrangements – employer-based or centered on third-party platforms. At one
end of the spectrum is the United States with an entirely voluntary, employer-based system. At
the other end are Australia and the Netherlands, where coverage is mandatory and the employer
plays a minimal role (see Table 2).
Table 2. Options for Broadening Coverage by Degree of Compulsion and Locus of Administration
Degree of compulsion Locus of administration
Employer Third party Voluntary/supplemental Existing U.S. system + enhancements
(part-time, MEPs, state marketplaces) ERIC model
Mandatory/universal Mandatory auto-enrollment of all workers (federal or state policy) U.K. model
CAP model Australia, Netherlands
35
The discussion proceeds in four steps: (1) documenting options for enhancing the existing
U.S. retirement system; (2) describing efforts to introduce mandates on employers in the United
States; (3) exploring international models with respect to their degree of compulsion and their
locus of administration; and (4) reviewing proposals – one with voluntary participation and one
with mandatory participation – to move the locus from employer to third-party platforms for the
United States.
ENHANCING COVERAGE OPTIONS IN THE U.S. VOLUNTARY SYSTEM. Expanding coverage
in the U.S. system has taken two tracks. One is to use auto-enrollment devices to expand
coverage for those already covered by a 401(k) plan, and the other is to create special accounts
for small businesses – the locus of most of today’s uncovered employees. Automatic features in
401(k) plans have been very successful, and these provisions could be made mandatory for all
plans. Special accounts for small business have met with little success to date but alternatives –
Treasury’s former myRA program and so-called “open” multiple-employer plans – provide
options to explore.
Closing the Coverage Gap for Workers Eligible for a 401(k). The major innovation to
encourage participation in 401(k) plans has been automatic enrollment.94 Studies have shown
that this simple change in the default increases participation by as much as 41 percentage
points.95 Even though participants are able to opt out, after three or four years, the vast majority
of those automatically enrolled were still participating.96 The Pension Protection Act of 2006
removed obstacles that had kept some employers from adopting these arrangements and
established a safe harbor whereby employers that adopt automatic enrollment are deemed to have
met the “top heavy” and anti-discrimination rules.97 However, while the share of plans with
94 The government changed the rules in 1998 to allow firms to require workers to “opt out” of a plan, instead of the traditional requirement to “opt in.” 95 Nessmith, Utkus, and Young (2007); Fidelity Investments (2007), and Madrian and Shea (2001). 96 Choi, et al. (2001). 97 One obstacle for employers was state laws that required employers to obtain an employee’s permission before making payroll deductions. The Pension Protection Act amended ERISA to pre-empt state laws that conflict with automatic enrollment provisions. To qualify for the safe harbor, the plan sponsor must enroll employees at a deferral rate of at least 3 percent of compensation, increase the employee’s deferral percentage by at least 1 percentage point annually up to 6 percent of compensation, and provide matching or non-elective contributions for the non-highly compensated of 100 percent on the first 1 percent of contribution and 50 percent on the next 5 percent for a total match of 3.5 percent.
36
auto-enrollment increased substantially in the wake of the PPA, the share of plans with this
feature is still below 50 percent.98 And employers often auto-enroll only new employees, so the
effect on participation can be very gradual.99 In short, auto-enrollment is not being applied as
extensively as it could be.
One segment of the uncovered population – the relatively small group that chooses not to
participate in a plan offered by their employer – could be helped by changes to 401(k) rules to
make full use of behavioral incentives by requiring all employers with a 401(k) to adopt
automatic features. Specifically, the requirements could include auto-enrollment with a 6-
percent default contribution rate and auto-escalation until the combined employee-employer rate
reaches 10 to 12 percent of earnings.100 The use of auto-escalation is critical because, without it,
participants often stay where they are put.101 And many plans with auto-enrollment currently
have low default rates.102 Alternatively, employers could set a higher and predictable
contribution rate from the start. In that case, employees could be defaulted into the plan with a
10-percent contribution rate without automatic escalation.
The default investment could be a low-fee, target-date fund. In addition, the auto-
enrollment provisions could apply to all workers, not just new hires, so that someone who might
have chosen to opt out of the default in one year ends up enrolled in the following year. A plan
following these practices would reduce non-participation rates for those with access to a plan to a
bare minimum.
Improve Plans Available to Small Businesses. For decades, policymakers have tried to
solve the coverage problem by introducing simpler products that could be adopted by small
business. The SIMPLE (Savings Incentive Match Plan for Employees of Small Employers) is a
prime example.103 Firms with fewer than 100 employees can offer a SIMPLE, which can be set
98 Utkus and Young (2017). 99 Utkus and Young (2017). 100 While 10-12 percent is the contribution rate required for the higher paid to accumulate adequate retirement saving to maintain their standard of living once they retire, little is known about the effects of such contribution rates on the lower paid over time. Lower-paid workers are likely to face more frequent financial crises and require easy access to some form of precautionary saving. Hence raising default rates increases the salience of establishing precautionary savings accounts at the same time. 101 Butrica and Karamcheva (2012). 102 Butrica and Karamcheva (2012). 103 SIMPLE plans, which were introduced in 1996, generally replaced SARSEPs (Salary Reduction Simplified Employee Pensions), which were the earlier pension arrangements for small employers.
37
up as an IRA for each employee or as a 401(k) plan. The SIMPLE has a number of advantages.
Firms can either match the employees’ contributions or contribute a fixed percentage of their
payroll without a direct contribution from employees. Once established, the SIMPLE is
administered by the employer’s financial institution and does not even require the employer to
file an annual financial report. Furthermore, most employers are eligible for tax credits for the
first three years after starting the SIMPLE.104 The trend data on coverage, however, indicate that
simplifying plan design has not led to a major expansion of coverage. This lack of take-up may
be due to small employers’ perception that plans are too expensive to set up, that they do not
have the resources to administer them, and that their employees prefer cash wages (see Figure
18).
myRA. In 2015, the U.S. Treasury introduced the myRA (my retirement account) – a
starter account for those without coverage at their current employer. Treasury discontinued this
program in 2017 due to concerns about its cost effectiveness. MyRAs were Roth IRAs, so
contributions were made with after-tax dollars, contributions could be withdrawn tax free at any
time, and earnings could be withdrawn tax free after age 59½. These accounts had no fees and,
to protect the new saver, the Treasury constructed a security that preserved the principal and paid
the same interest rate as the Government Securities Investment Fund in the federal employee
TSP. MyRAs were available to anyone with an annual income in 2016 under $134,000
($194,000 for couples).
To avoid placing any burden on employers, their only task under the myRA program was
to decide whether to offer the accounts and then to make payroll deductions for any employee
who chose to participate. Employers were not required either to administer the accounts or to
contribute to them. To avoid burdening – or competing with – financial services firms, the
Treasury administered the accounts (in collaboration with a private sector bank) when they were
small and, if the program had matured, would then have turned them over to the private sector
once balances exceeded $15,000 (or after 30 years, whichever comes first).105
The myRA program started with an initial pilot in 2014, then Treasury launched the
program nationwide in 2015. People had three ways to contribute to a myRA: automatic direct
deposit through their employer, one-time or recurring contributions from a checking account, or
104 U.S. Department of Labor and Internal Revenue Service (2009). 105 U.S. Department of Treasury (2016).

38
direct deposit of all or part of their tax refund. Despite myRA’s multiple access points, no fees,
and preservation of principal, take-up was only about 10,000 accounts. One possible reason for
the small takeup was limited marketing of the product (compared to private sector efforts to
promote retirement savings products). Other issues may have been its default investment, the
Roth rather than traditional IRA,106 the role of government sponsorship, and its untested nature.
Despite these issues, many of the state initiatives, described below, had discussed using the
myRA as a starter account.
Multiple-Employer Plans (MEPs). Multiple-Employer Plan 401(k)s have the same limits
as regular 401(k) plans, they have no income restrictions on participation, they allow the
employer to make matching contributions, and they have ERISA’s consumer protections.107 But,
as discussed above, individual 401(k)s for small employers tend to be very expensive, and
employers are very concerned about their fiduciary liability. MEPs allow employers with a
“common bond” to form a pooled 401(k) retirement plan, offering benefits through the same
administrative structure but with generally lower costs and less compliance burden than if each
employer offered a separate plan.
Specifically, a MEP can file one Form 5500, purchase one ERISA fidelity bond, and have
a single audit for the entire plan. In a non-MEP situation, each employer would generally have
its own Form 5500, bond, and audit.108 Moreover, participating employers in a MEP generally
have their fiduciary responsibility limited to selection and oversight of the person operating the
plan.109 It may also be possible for financial services firms to assume all the fiduciary liability.
Current law discourages the formation of MEPs in two ways.110 First, while the IRS has
ruled that the combined plan of many unrelated employers is a single plan as long as the plan’s
assets are aggregated in one pool, as a consumer protection measure the DOL also requires that
the plans “are tied together” by “genuine economic or representational interests.” This restriction
makes offering MEPs less attractive to providers, who would have to work with smaller groups
106 Investments in a Roth IRA can only be rolled over to other Roth vehicles, which could exacerbate the problem of many small accounts over the employee’s worklife. 107 ERISA has established channels for adjudicating savers’ complaints and sponsors’ malfeasance and rules defining necessary disclosures, which help keep fees low and protect spouses in the case of divorce or death. 108 Morse (2014). It is worth noting that the requirements are more onerous for plans with 100 or more participants than for plans with fewer than 100 participants. 109 Borzi (2010). 110 U.S. Senate Committee on Finance (2015).
39
of employers and, thus, lower asset levels. Second, within a MEP, each plan is separately tested
for compliance with coverage and nondiscrimination provisions, and a violation of these rules by
one employer can disqualify the entire plan.
As a result of these factors, MEPs are not very common today. In 2014, MEPs
represented fewer than 3,000 of the over 600,000 retirement plans identified in the Form 5500
Database.111 Even among plans with 100 or more participants, among which MEPs are more
common, just 2,159 plans out of 85,000, or 2.5 percent, were MEPs (see Figure 19). Some of
these MEPs do represent the traditional notion of small employers linked together by a common
bond, such as the South Dakota Association of Community Based Services. But both the largest
defined benefit and defined contribution MEPs are sponsored by General Electric, whose various
divisions (e.g. health care, aviation) operate separately and are brought together for retirement
plan purposes under a MEP.112
To increase the prevalence of MEPs, in 2016, President Obama’s budget and a bi-partisan
group of Senators from the Committee on Finance proposed removing the “common bond”
requirement (which would permit so-called open MEPs) to allow more small businesses to offer
pooled plans to their workers.113 In addition, the Senate bill would limit the application of the
disqualification sanction due to a rules violation to only the plan of the offending company.
Advocates of open MEPs maintain that they will not only expand coverage and
portability but also promote more competition among providers of small business retirement
plans and increase the quality of the investment products available to employees, while
potentially reducing fees.114 However, MEPs are not without risks. In the health sphere,
Multiple Employer Welfare Arrangements (MEWAs), like MEPs, allow multiple employers to
access low-cost health coverage through a common provider. But, in some cases, MEWAs have
been used to defraud employers by charging high administrative fees that leave little money left
to pay employees’ promised benefits. In response, the Affordable Care Act gave new authority
to the DOL to stop this type of situation, and since 2010 the agency has pursued civil and
111 Authors’ calculations from Form 5500 database and U.S. Government Accountability Office (2012). 112 U.S. Government Accountability Office (2012). 113 The proposals to improve MEPs would also fund pilots for states and nonprofits to try new approaches to expand retirement plans to groups who lack access, such as contractors and other self-employed individuals. 114 U.S. Government Accountability Office (2012). The Bipartisan Policy Center’s Commission on Retirement Security and Personal Savings (2016) also recommends using MEPs to reduce the financial and legal burden of offering a retirement plan among small businesses.

40
criminal enforcement against MEWAs engaged in fraudulent practices.115 The experience with
MEWAs raises the question of whether employers with no common bond will scrutinize a plan’s
operations as carefully as a group of companies with a shared interest. The 2016 report of the
Bipartisan Policy Commission advocates creating a board that would certify open-employer
MEPs to help reduce concerns on this front.
State Marketplaces. Another idea for improving coverage is to make it easier for
employers to shop for plans through a marketplace. The marketplace concept has been adopted
by two states: Washington and New Jersey.116 The intent is to educate small employers on plan
availability and promote competition among providers to offer low-cost, low-burden retirement
savings plans. Participation is voluntary. Employers participating in the marketplace could be
covered under ERISA, although both marketplaces are also going to include plans like the
SIMPLE-IRA on their portals where ERISA would not apply.
Summary. Offering plans like the SIMPLE to small businesses has had little effect on
coverage in the past, so efforts to expand visibility of these offerings through a marketplace is
unlikely to expand coverage significantly. To date, data indicate that few small employers offer
such plans, even if the plan is simple and has few administrative requirements.117 And numerous
studies have shown that many low- and middle-income workers do not contribute to a retirement
plan when offered one, although once auto-enrolled they tend to stay in.118 So leaving all the
choice in the hands of employers and employees is likely to produce little additional saving.
Open MEPs may be a slightly different story only because they, unlike the SIMPLE or
myRA, are strongly supported by the financial services industry.119 This support means that, if
open MEPS were adopted, private companies would likely actively market them to small
employers. Even if they make some inroads, however, voluntary take-up will likely not
eliminate the coverage gap. And the risk is that many small and moderate-sized companies with
plans could convert to an open MEP to reduce costs and fiduciary liability.
115 U.S. Department of Labor (2013). 116 State of Washington Legislature (2015) and State of New Jersey Legislature (2016). 117 The latest IRS data show that only 4 percent of households participate in a SEP, SIMPLE, or other form of employer-sponsored IRA (see Chen and Munnell 2017). And, as noted above, Treasury’s recent decision to end the MyRA program was related to a lack of demand. 118 Beshears et al. (2010), Madrian and Shea (2001), Butrica and Karamcheva (2012), and Nessmith, Utkus, and Young (2007). 119 Kalamarides (2016).

41
INTRODUCING COMPULSION INTO THE U.S. SYSTEM. Given the difficulty in getting small
employers to introduce employer-sponsored plans, many researchers and policymakers came to
recognize that a major expansion of coverage was unlikely to happen on its own. Ideas
coalesced around imposing a mandate on employers to automatically enroll their employees in
some type of plan. This notion was originally conceived as a national initiative, but it soon
spread to the states.120
The National Proposals. In 2009, President Obama proposed auto-IRAs based on an idea
introduced by researchers from the Heritage Foundation and the Brookings Institution.121 Under
the initiative, employers with more than 10 employees and no retirement plan would be required
to place 3 percent of an employee’s salary in an IRA. Employees could choose between a Roth
and a traditional IRA, but the Roth, which allows low-income workers who may need the money
to withdraw their contributions without penalty, was the default. The auto-IRA contributions
would qualify for the Saver’s Tax Credit which could help very low earners find the money to
save (see Box 3, on the next page). Additionally, the proposal provided a tax credit to help small
businesses with implementation costs. As with auto-enrollment in 401(k)s, employees could opt
out of the plan.
120 See, for example, Iwry and John (2009) and Munnell, Belbase, and Sanzenbacher (2016). 121 Iwry and John (2009). In addition, the auto-IRA idea was embraced in 2008 by both major party presidential candidates.
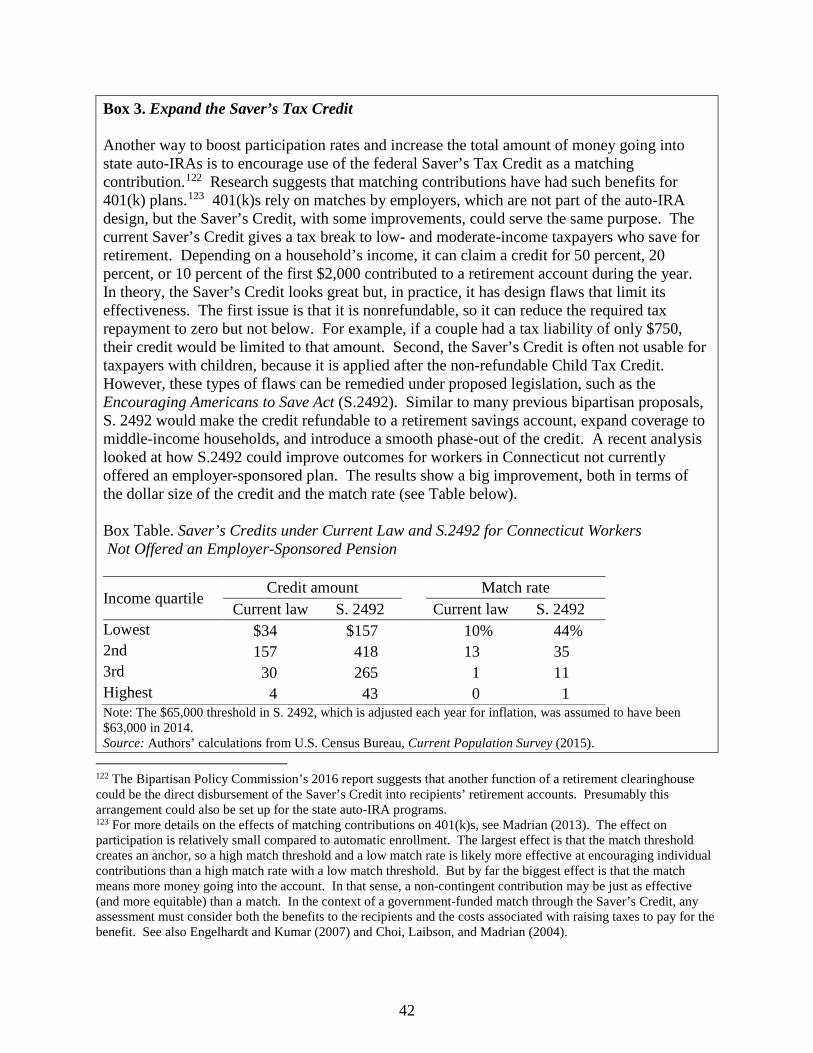
42
122 The Bipartisan Policy Commission’s 2016 report suggests that another function of a retirement clearinghouse could be the direct disbursement of the Saver’s Credit into recipients’ retirement accounts. Presumably this arrangement could also be set up for the state auto-IRA programs. 123 For more details on the effects of matching contributions on 401(k)s, see Madrian (2013). The effect on participation is relatively small compared to automatic enrollment. The largest effect is that the match threshold creates an anchor, so a high match threshold and a low match rate is likely more effective at encouraging individual contributions than a high match rate with a low match threshold. But by far the biggest effect is that the match means more money going into the account. In that sense, a non-contingent contribution may be just as effective (and more equitable) than a match. In the context of a government-funded match through the Saver’s Credit, any assessment must consider both the benefits to the recipients and the costs associated with raising taxes to pay for the benefit. See also Engelhardt and Kumar (2007) and Choi, Laibson, and Madrian (2004).
Box 3. Expand the Saver’s Tax Credit Another way to boost participation rates and increase the total amount of money going into state auto-IRAs is to encourage use of the federal Saver’s Tax Credit as a matching contribution.122 Research suggests that matching contributions have had such benefits for 401(k) plans.123 401(k)s rely on matches by employers, which are not part of the auto-IRA design, but the Saver’s Credit, with some improvements, could serve the same purpose. The current Saver’s Credit gives a tax break to low- and moderate-income taxpayers who save for retirement. Depending on a household’s income, it can claim a credit for 50 percent, 20 percent, or 10 percent of the first $2,000 contributed to a retirement account during the year. In theory, the Saver’s Credit looks great but, in practice, it has design flaws that limit its effectiveness. The first issue is that it is nonrefundable, so it can reduce the required tax repayment to zero but not below. For example, if a couple had a tax liability of only $750, their credit would be limited to that amount. Second, the Saver’s Credit is often not usable for taxpayers with children, because it is applied after the non-refundable Child Tax Credit. However, these types of flaws can be remedied under proposed legislation, such as the Encouraging Americans to Save Act (S.2492). Similar to many previous bipartisan proposals, S. 2492 would make the credit refundable to a retirement savings account, expand coverage to middle-income households, and introduce a smooth phase-out of the credit. A recent analysis looked at how S.2492 could improve outcomes for workers in Connecticut not currently offered an employer-sponsored plan. The results show a big improvement, both in terms of the dollar size of the credit and the match rate (see Table below). Box Table. Saver’s Credits under Current Law and S.2492 for Connecticut Workers Not Offered an Employer-Sponsored Pension
Income quartile Credit amount Match rate
Current law S. 2492 Current law S. 2492 Lowest $34 $157 10 % 44 % 2nd 157 418 13 35 3rd 30 265 1 11 Highest 4 43 0 1 Note: The $65,000 threshold in S. 2492, which is adjusted each year for inflation, was assumed to have been $63,000 in 2014. Source: Authors’ calculations from U.S. Census Bureau, Current Population Survey (2015).

43
In 2012, then-Senator Tom Harkin (who was chairman of the Health, Education, Labor,
and Pensions Committee) proposed “Rebuilding Pensions: Promise Funds,” which would create
a government-mandated, privately-managed defined contribution pension program.124 This plan
would automatically enroll all workers whose employer does not provide an employer-sponsored
plan meeting a minimum standard for generosity. The contributions would be invested in a
commingled portfolio, thereby spreading the risks among all participants and relieving the
individual of the burden of making investment decisions.125 Payments from the plan would be in
the form of an annuity, so that retirees would not have to worry about outliving their savings.
Again, workers would be able to opt out.
In 2016, Congressman Joe Crowley (a member of the House Ways and Means
Committee) proposed legislation that would direct employers with 10 or more employees that do
not provide a retirement plan to auto-enroll their employees in a traditional IRA. Employers
would be required to directly contribute 50 cents per hour into this account, with this amount
increasing with wage growth. Participating small employers (less than $5 million in gross
receipts) would get a refundable tax credit for five years; equal to the value of their contributions
for up to 10 employees. Employees, once enrolled, would contribute 3 percent of their pre-tax
income, with employee contributions increasing gradually over time unless the employee opts
out.126 Despite numerous proposals aimed at closing the coverage gap, no legislation has been
enacted at the federal level. Instead, the states have stepped into the breach.
The State Initiatives. Current efforts to set up state-sponsored retirement programs for
uncovered private sector employees represent the culmination of work by several policy, labor,
and consumer organizations, beginning in the late 2000s.127 The first effort, which occurred in
California, drew on specific proposals, not only by researchers, but also by the National
124 Harkin (2012). 125 Commingled funds are less expensive than the investment options available for IRAs. Investment costs, however, are only a small part of the costs of running an IRA system. 126 The plan would moderate swings in the stock market by channeling some above-average returns in good years into a collective investment pool and distributing those monies to accountholders in bad years. 127 The New America Foundation helped design California’s first private sector retirement bill, a 401(k) linked to the state employee pension system, introduced in 2007. In 2009, the Economic Opportunity Institute proposed a system of “universal voluntary retirement accounts” in Washington State based on earlier work by Dean Baker. During this period, Mark Iwry of the Brookings Institution was also active in efforts to promote pilot auto-IRA plans in a number of states. Ultimately, political support from key public sector unions, AARP, and other stakeholder groups helped pass private sector retirement bills in several state legislatures.
44
Conference on Public Employee Retirement Systems (NCPERS).128 The NCPERS plan
reflected the recognition by public employees that the quality of their own retirement coverage
could be at risk if their counterparts in the private sector lack access to a retirement system.
The California legislation enacted in 2012 – the California Secure Choice Retirement
Savings Program – looked quite different from the hybrid pension proposal included in the first
draft of the bill.129 Most importantly, the vehicle moved from a cash-balance plan (a defined
benefit plan that tracks balances on an individual account basis using credited contributions plus
interest) to an IRA, which increased the likelihood that the program would not be subject to the
reporting and fiduciary requirements of ERISA. The legislation retained both an employer
mandate and language allowing for participant risk pooling and guarantees, if feasible without
imposing liability on the state. At this point, California’s governor has signed the final bill to get
the program up and running in 2018.
Four other states – Connecticut, Illinois, Maryland, and Oregon – have also passed
legislation following the auto-IRA model.130 Connecticut completed its feasibility study and has
passed final enabling legislation. Illinois has completed a feasibility study and plans to move
forward in 2018. Maryland is at the earliest stage of the five states. Oregon has completed a
pilot of its auto-IRA program and is in the process of rolling out the program in stages based on
employer size.131
Other states, such as Massachusetts, are toying with the idea of having both an auto-IRA
system and a state-run MEP, which would allow unrelated employers to offer 401(k) plans but
shifts the administrative burdens and fiduciary responsibilities to a third party.132 While
128 Two important studies were the Retirement Security Project’s national auto-IRA (Iwry and John, 2006, 2009) and Teresa Ghilarducci’s 2011 California Guaranteed Retirement Accounts (Rhee 2011). The original NCPERS (2011) proposal envisioned a cash-balance plan with voluntary contributions and a modest guaranteed return. The program would take advantage of the public sector’s economies of scale to deliver investment results in a cost-effective manner and its ability to pool mortality risk over a large number of participants to provide annuities at retirement. 129 State of California Legislature (2012). 130 State of Connecticut General Assembly (2014), State of Illinois General Assembly (2014), State of Maryland General Assembly (2016), and State of Oregon Legislature (2015). 131 In the first stage, which started in November 2017 and will end in May 2018, the program will auto enroll workers employed at firms with more than 100 employees. The plan intends to reach all workers (in standard employment relationships) without access to a plan by the end of 2020 (Oregon Saves, 2017). 132 The system could be either directly run by the state or run by a third party overseen by the state. See Commonwealth of Massachusetts (2015).
45
employers cannot be required to adopt a MEP under ERISA, the MEP option may be seen as
desirable because it has higher contribution limits than IRAs and allows employer matches.
Figure 20 shows where plan activity has taken place. The red and orange colors identify
those states with plans underway, the stripes indicate states with active legislation, and the light
grey those states with failed legislation. It should be noted that many of the states with active
programs today had many failed pieces of legislation before an actual program was enacted. The
message from the map is that state activity to cover uncovered workers is widespread.133
Some involved in the state-based initiatives were concerned that a state-run auto-IRA
program would trigger ERISA coverage. While ERISA offers many consumer protections, it
also involves significant reporting and disclosure requirements and stringent conduct standards
for plan fiduciaries. Several states indicated that if their auto-IRA programs would trigger
ERISA coverage, they would not proceed. These concerns appeared to have been diminished in
2016 by a DOL rule that established a safe harbor whereby state-run payroll deduction programs
with automatic enrollment would not trigger the creation of plans subject to ERISA by private
sector employers.134 In early 2017, however, Congress eliminated this rule, which makes the
path ahead somewhat more uncertain. In any case, states that have adopted auto-IRA plans are
moving forward; for example, Oregon has already begun to launch its program.
Even assuming successful implementation, state auto-IRA programs may have
challenges.135 For instance, in some cases, state programs may include provisions that make it
difficult for employers who operate in multiple states, administering payroll-deduction
contributions for some workers but not others. And employees who leave a state with a program
and begin working in a state without one will lose access to automatic enrollment which could
affect savings. Nevertheless, state-IRAs could help shrink the coverage gap in the absence of a
federal auto-IRA program. The following section looks at international models to see the extent
to which they use compulsion to ensure coverage and the extent to which they rely on employers
as opposed to third parties to administer their systems.
133 For additional details on specific states, see AARP (2016), Georgetown University Center for Retirement Initiatives (2016), and Pension Rights Center (2016). 134 U.S. Department of Labor (2016). 135 The Bipartisan Policy Center’s Commission on Retirement Security and Personal Savings (2016) echoes this need to avoid a patchwork of state regulations. Beginning in 2020, it proposes a national minimum coverage standard that would require employers with 50 or more employees who do not offer a plan meeting certain thresholds to automatically enroll employees into a new Retirement Security Plan (administered by a third party).

46
INTERNATIONAL MODELS TO ACHIEVE BROAD COVERAGE. Other countries have used
various degrees of compulsion to achieve broad coverage. These countries also vary in the
extent to which the administrative burden falls on the employer. The following discussion looks
at three countries: the United Kingdom, which is rolling out a nationwide auto-enrollment
program; the Netherlands, which has achieved broad coverage without an explicit mandate and
has dramatically reduced the burden on employers; and Australia, which has mandated that
employers save on behalf of their employees and has also reduced the role of employers to that
of a conduit.
United Kingdom. The United Kingdom is in the process of moving to a universal system
for traditional employees through the introduction of an auto-enrollment mandate, now being
phased in by firm size, as well as the introduction of the National Employment Savings Trust
(NEST) as the plan administrator of last resort.
The United Kingdom entered the new century with a serious retirement income problem.
Its government old-age pension benefits – among the least generous in the industrial world –
were on track to become even less generous, with retirees increasingly dependent on means-
tested benefits. The decline in government pensions was an especially serious problem for
average- and low-wage workers, who typically have little or no retirement savings. To shore up
future retirement incomes, the government in 2001 imposed a retirement savings mandate on
employers, requiring all employers with five or more employees and no retirement program to
offer workers a “stakeholder” retirement savings plan. Despite the mandate, the stakeholder
initiative failed to gain traction.136
The Pensions Commission, created in 2002 to conduct a thorough review of the nation’s
private retirement income system, concluded that retirement incomes would become
“increasingly inadequate and unequal” unless the nation introduced significant reforms.137 These
reforms included an increase in the State Retirement Age, an increase in government pensions
available at that age (which would sharply reduce dependence on means-tested benefits), and a
136 With fees capped at 1.5 percent of assets for the first 10 years, and 1 percent of assets thereafter, financial services firms viewed the target market – average- and low-wage workers and small employers – as unprofitable. Marketing and set-up costs were high. Plan providers were also required to offer trustworthy advice, and advising participants who would likely be eligible for means-tested benefits was costly and risky. At the same time, the program did not attract much interest from workers: most stakeholder plans had no contributors. See Johnson, Yeandle, and Boulding (2010) and Pensions Commission (2005). 137 Pensions Commission (2005).

47
revamped employer mandate. Rather than just requiring employers to offer a plan, the
Commission called for requiring employers to automatically enroll their workers and make
matching employer contributions.138
In 2008, Parliament enacted such a mandate. When fully phased in, employers without a
better plan will be required to auto-enroll their workers in a retirement savings plan in which
workers contribute 4 percent of after-tax earnings, the employer provides a 3-percent match, and
the government adds 1 percent as tax relief on the worker contribution.
The existing legal system retains a large role for the employer. The United Kingdom
allows employers two main options for handling fiduciary and administrative responsibilities for
their retirement plans. First, they can serve as an administrator and trustee for their own plan.
Second, they can contract out the responsibility to an outside provider.
Employers that already had a plan prior to the reform must ensure it meets the new auto-
enrollment, contribution, investment, and fee standards of the 2008 legislation, but they retain
the right to run their own plans and serve as the administrator and trustee. In this case, their
administrative and fiduciary role is very similar to those of U.S. companies that sponsor 401(k)
plans. Alternatively, they can hire an insurance company to serve as trustee and recordkeeper,
which reduces their fiduciary responsibility.
Employers that did not have a plan prior to the reform are generally choosing “off-the-
shelf” products from one of several national pension providers, an industry that has blossomed
due to the new government requirements. These providers include a government-supported plan
– NEST – and competitors that have emerged, such as The People’s Pension and Now: Pension.
These third-party arrangements remove the fiduciary and administrative burden from employers,
similar to MEPs in the United States.
In short, the mandate is encouraging employers to revisit their legal relationship to
retirement schemes, and to look for structures (such as so-called “master trusts”) that reduce or
minimize their role. In effect, the U.K. mandate is creating a long-term incentive for the
138 Pensions Commission (2005). The mandate required employers to auto-enroll workers from age 22 to the State Retirement Age (currently 65 for men and 60 for women, rising to 66 for both men and women by 2020) with earnings above the threshold for participation in the state pension program (£9,440 a year in 2013/14). See Thurley (2013).

48
establishment of independent institutions of retirement benefit provision, as happened in
Australia.
The Netherlands. As in many other European countries, the Dutch pension system
consists of three pillars: (1) the state pension; (2) supplementary collective pensions; and (3)
individual saving products.139
Because the state pension is quite modest, the amounts received through the employment-
based supplementary pensions are the heart of the Dutch system. Coverage under these
arrangements is not always technically mandatory, depending on the industry/occupation of the
worker, but it is essentially universal. As a result, this system is considered “quasi-mandatory.”
The pension funds in the supplemental system consist of three types: (1) sectoral pension
funds, which constitute approximately 75 percent of the pension assets in the Netherlands; (2)
company pension funds; and (3) occupational pension funds, which are mandatory for specific
groups of independent professionals.
The employment-based supplementary pension schemes involve an arrangement between
the employer, the employee, and an independent external pension fund. The employer and
employee agree upon the conditions of the pension, which are commonly included in individual
employment agreements or in the collective bargaining agreement. After entering into a pension
agreement with the employee, the employer delegates the execution of the pension agreement to
a pension provider. The employer and the pension provider have an administrative agreement
about the provisions of the plan (premium contribution, indexation). The pension provider can
be a pension fund or an insurance company, which are both legally independent entities and are
governed by their own independent boards.140
139 This discussion is based on a number of sources, but the chapter on the Netherlands in Pensions and Insolvency – An International Survey (Sixma and Veldhoen 2015) was especially helpful. 140 The law provides for five types of governance models: the joint model, the independent model, and three mixed one-tier board models. In the joint model, the board consists of representatives from the three stakeholder groups: the employers, the employees, and the pension beneficiaries. The employee and beneficiary representatives together hold the same number of seats as the employer representatives. It is also possible to add one or two seats for independent members who do not directly represent the stakeholders in the fund. The supervision of the board is done by a permanent supervisory board consisting of independent members. For a sectoral pension fund, the supervisory board is mandatory; a company pension fund may instead opt for an annual review by a visitation committee. In the independent model, the board includes at least two independent professional board members, and supervision is structured in the same way as in the joint model. In the mixed models, both executive and non-executives have seats on the board, and the non-executive directors are charged with the supervision of the executive directors.
49
Two bodies regulate the Dutch pension system: the Dutch Central Bank and the Dutch
Authority for the Financial Markets. The Central Bank examines the financial position of
pension funds to assess whether they are financially healthy and whether they can be expected to
fulfil their financial obligations in the future. The Authority for the Financial Markets
establishes the required ratio of assets to liabilities.141 In the case of a funding shortfall, a
pension fund must notify the Central Bank and submit a recovery plan.
The net result of the Dutch pension system is that virtually all employees are covered and
the employer hands over all responsibility for retirement benefits to the pension fund and bears
almost none of the administrative or fiduciary burden.
Australia. Australia has achieved high individual retirement savings and broad coverage
at relatively little cost to the government and little burden on employers. The system consists of
three pillars: the government’s Age Pension program, a mandated Superannuation employer-
funded savings account for each worker, and private savings.142
The Superannuation program, created in 1992, is the heart of the Australian retirement
system. The program requires that employers contribute 9 percent of earnings, rising to 12
percent by 2025, to a tax-advantaged retirement plan. Over 90 percent of employed Australians
have savings in a Superannuation account. Most employees can select a Superannuation Fund,
which are generally organized by financial services companies or by public or private employer
or industry groups. The Funds typically give workers the choice on how their savings are
invested, and, in many cases, allow workers to keep their Fund when they switch employers.
The employer is the initial fiduciary in the Superannuation program and is responsible for
selecting a default Superannuation Fund if a pre-agreed industry or occupation standard does not
apply. The Funds, including a Fund the employer might sponsor, are also fiduciaries and are
141 A pension fund must value its assets and liabilities at fair value, and promised benefits must be discounted at the risk-free interest rate. 142 The Means-Tested Age Pension provides a basic income to those with incomes and assets less than specified threshold levels. Singles can get a benefit equal to about 28 percent of the average male wage and couples about 41 percent, with benefits reduced or eliminated as incomes or assets rise above the threshold levels. Individuals must be 65 to qualify. Roughly half of retirees get a full benefit, a quarter get a partial benefit, and the remaining quarter receive no benefit because their income and/or assets are too high. The eligibility age will rise to 67 over the next decade. Voluntary saving, the final pillar in the Australian system, includes both additional contributions to a Superannuation Fund and saving outside these tax-advantaged Funds. Only 20 percent of eligible employees take advantage of additional savings options, and most of those who do are concentrated in the upper end of the income distribution. As mandatory superannuation contributions rise to 12 percent of earnings, voluntary saving may decline.
50
responsible for selecting the menu of investment options and a default investment option for
those who make no choice. Overall the role of the employer is minimal, serving mainly as a
conduit.
In short, many other countries have concluded that all workers need to be covered by a
combination of public and private retirement plans that together provide adequate retirement
income. The degree of compulsion adopted to achieve broad coverage varies from a mandate on
employers to auto enroll their employees in the United Kingdom, to a social compact in the
Netherlands, to an outright mandate on employers to contribute on behalf of their employees in
Australia.
The other interesting aspect of these international plans is that the Netherlands and
Australia have reduced the role of the employer to that of a conduit for funds from the employer
to the third-party provider. The U.K. mandate also appears to be creating a long-term incentive
for the establishment of independent institutions of retirement provision, as happened in
Australia. The following describes proposals to reduce the employer’s role in the United States.
REDUCING THE ROLE OF THE EMPLOYER. The dissatisfaction of employers with the
provision of health and retirement benefits was clearly evident in 2007, when the ERISA
Industry Committee (ERIC) – a membership organization representing the employee benefit
plans of the nation’s largest employers – put forth a proposal that would shift the responsibility
for the provision of retiree and health benefits from the employer to a “New Benefit Platform for
Life Security.”
ERIC reported that employers often complain that they face complex regulations and
escalating financial commitments and that health and retirement plans divert their attention from
their business activities just when they most need to focus. If large employers feel burdened,
small employers must feel overwhelmed. In testimony, Michael Stapley, President and CEO of
Deseret Mutual and Chairman of the ERIC Task Force summarized the situation:
...Employers that today provide retirement, medical and similar life security
benefits are under stress. In addition to increased national and global
competition, U.S. employers face complex, inflexible, and often contradictory
rules as well as exposure to litigation that has increased over time. In many

51
cases, the administration of retirement, health, and other benefits has itself
become a major enterprise within companies that often diverts their focus from
competitive business challenges.143
In 2014, the American Academy of Actuaries also suggested shifting responsibility away
from employers in “Retirement for the AGES: Building Enduring Retirement Income
Systems.”144 AGES is an acronym for the four principles of Alignment, Governance, Efficiency,
and Sustainability. The Academy concluded that the roles of the stakeholders in the retirement
system were not aligned with their skills.145 Historically, employers have used retirement plans
to manage their workforce – to attract talented workers, to motivate their workers to perform
well, and eventually to ease them into retirement. Employers have established and administered
the plans, selected the investment managers, provided educational material, and performed many
fiduciary functions. Administering retirement programs, however, is complicated, and the legal
and financial issues are also complex. Some larger employers may be able to perform these roles
but, for many others, hiring and maintaining the expertise to administer and manage retirement
programs can be a distraction from their core businesses. A better alignment of roles would
enable employers simply to collect employee contributions to be invested in retirement plans
administered by a third party.
Several proposals have been put forth for restructuring the U.S. retirement system in
order to relieve the burden on employers and ultimately increase coverage.146 This section
presents two – one based entirely on the private sector – the ERIC proposal – and the other
relying on a government plan – a proposal from the Center for American Progress (CAP).147
ERIC Proposal. In 2007, ERIC proposed a new voluntary system that would involve
establishing third-party Benefit Administrators – trusted intermediaries with expertise in
designing, delivering, and managing retirement and health benefits. (Since ERIC’s proposal pre-
dates the ACA, it includes health as well as retirement benefits.) These administrators could be
banks, insurance companies, investment companies, or new entities created specifically for this
143 For more detail, see ERISA Industry Committee (2009). 144 https://www.actuary.org/files/PPC-Forward_AGES-Monograph_01-16-14.pdf 145 American Academy of Actuaries (2014). 146 Ghilarducci (2008), and James and Ghilarducci (2018 forthcoming). 147 A white paper from State Street Global Advisers building on lessons from abroad also advocates the creation of collective investment platforms to lessen the burden on individual employers. See Reilly and Kahn (2016).

52
purpose. The entities would compete for employers’ business and also for individuals who want
to buy their benefits directly.
To ensure that every business would have access to at least two Benefit Administrators,
the federal government would establish uniform services areas for retiree and health benefits.
The government would also establish national standards for the Benefit Administrators so that
individuals could make apples-to-apples comparisons. But the Benefit Administrators would be
free to offer additional benefits, such as life insurance or group auto and homeowners insurance.
Employers would have the option to contract with one or more of these providers, but could
continue to manage their own benefits if they wanted. The competing Benefit Administrators
and their affiliates would assume ERISA’s fiduciary liability. The complex non-discrimination
rules would be replaced with “safe harbor” designs to encourage broad-based availability of
benefits.
The ERIC proposal spells out the type of retirement savings offerings that the Benefit
Administrators would provide. Each Benefit Administrator would be required to offer three
types of plans:
• Guaranteed Benefit Plan – a cash-balance plan insured by the Pension Benefit Guaranty
Corporation where the employer, and perhaps the employee, would make the
contributions and the Benefit Administrator would establish the minimum guaranteed
credit and manage the assets. Benefits would be paid as an annuity at retirement with no
loans or guarantees before that time.
• Retirement Savings Plan – a defined contribution plan similar to a 401(k) that would be
financed by employers and employees and would be portable among competing Benefit
Administrators.
• Short-Term Security Account – an account available for specific purposes, such as
uncompensated medical expenses or education.
• This proposed three-part structure could be combined with auto-enrollment to enhance
participation.
In terms of the employers, the proposal would get the retirement and health plans off their
books and relieve them of fiduciary liability, while creating a structured uniform system that
could provide greater coverage and adequate benefits. The proposal would also make the
benefits completely portable from one benefit administrator to another. Employers who want to
53
offer generous benefits to compete for talent could continue to do so, but their job would involve
simply transferring money to some type of new platform.
CAP Proposal. The Center for American Progress (CAP) has a proposal (initially
introduced in 2012 and refined since then) that would provide all workers with access to a
National Savings Plan (NSP) modeled on the TSP, the 401(k)-style plan for federal employees
and members of Congress.148 Workers without access to a retirement plan at their workplace
would be automatically enrolled in the NSP, and independent contractors and the self-employed
would have easy access with automatic direct deposit from their bank accounts.
The NSP would be run by an independent federal agency – either the Federal Retirement
Thrift Investment Board, or a similar organization. This board would contract with private sector
companies to provide recordkeeping and investment services and to monitor the performance of
these companies. The investment options, similar to the TSP, would be limited to five core
funds and life-cycle funds that offer age-appropriate combinations of those funds.
Unlike the TSP, the NSP would be based on the IRA, rather than the 401(k).149 The
default option would be a Roth account, but a traditional option also would be available. The
authors of the plan would like the NSP to have the same income eligibility and contribution
limits as current 401(k)-style defined contribution plans, not the lower IRA limits.150 The higher
limits would enable meaningful saving for middle and slightly higher earners and ensure that
employees were not auto-enrolled in a plan in which they were ineligible to participate.
The initial default contribution rate would be 3 percent, but since participants tend to stay
where they are put,151 the NSP default would automatically increase contributions by 1 percent
per year until the rate reached 6 percent, a rate in line with the median contribution rate typically
148 For more details, see Madland, Rowland, and Davis (2016), Madland (2012), Davis and Madland (2013), and Davis, Kazzi, and Madland (2010). 149 Unlike the auto-IRA model being adopted by the states, employers would be permitted to make contributions to their employees’ accounts. If the employer decides to contribute, the NSP would require that the contributions be universal – either the same flat dollar amounts or the same percentage of pay for each employee. 150 The IRA annual contribution limit is currently $5,500, while participants in 401(k) plans can put aside $18,000 of their own money each year, with their employers able to contribute an additional $35,000. These amounts are indexed to inflation. Savers age 50 and older also can contribute additional “catch-up contributions,” which cannot exceed $1,000 for IRA savers or $6,000 for those in 401(k)s (Internal Revenue Service 2015a and b). 151 Research from Vanguard shows that 46 percent of automatically-enrolled retirement plan participants remained at their default contribution rate three years after enrollment.
54
reported by Vanguard.152 Both the initial default and the auto-enrollment ceiling could be
increased in the future.153
The authors assume that the NSP will have fees of 0.25 percent, consistent with the fees
available in the largest private market plans and the United Kingdom’s auto-enrollment-based
plan.154
To encourage savers to think about their balances as a stream of payments rather than a pile of
assets, the NSP would provide estimates of monthly income on plan statements, and individuals
would be defaulted into a lifetime-income stream upon retirement with the ability to opt out.
They would also be able to annuitize a portion of their accumulations.155
Summary. Transferring the sponsoring and administration of retirement plans to third
parties – as would be done in the ERIC and CAP approaches – could solve several problems.
One is coverage; the uncovered could be defaulted into plans run by these third-party entities
and, although some might opt out, many would stay and contribute at least a small amount. The
second problem is leakage. Workers who switch jobs could keep their third-party 401(k) plan at
their new employer, eliminating the cashing out of balances upon termination. The third
problem is costs. With an appropriate regulatory environment, third-party administration could
lead to more standardization in plan design and fee disclosures and offer economies of scale that
could bring down costs for small and mid-sized companies. Indeed, at least one private sector
startup – 401k4USA – is developing a third-party platform that would take many of the
responsibilities of running a 401(k) off employers. Currently, the firm is looking for clients and
funding.156
152 Utkus and Young (2016). 153 401(k) plans, however, typically include an employer contribution, which brings the median total contribution rate to about 10 percent. Even this level is on the low end of recommendations of many financial advisors, who suggest contribution rates anywhere from 10 percent to 15 percent. 154 NEST charges investors 0.3 percent of assets annually and a 1.8 percent one-time contribution charge. The contribution charge goes to paying back government loans to get the plan off the ground and is designed to be a temporary expense. The current TSP fee is 0.029 percent, but the government currently subsidizes TSP in a number of ways. For example, non-vested agency contributions are currently used to partially pay down TSP administrative costs when employees leave their positions early. Moreover, NSP is likely to incur new costs as it serves a wider audience with much less experience with retirement plans (National Employment Savings Trust 2015). 155 To help alleviate savers’ fears, the default annuitization could follow a “trial” model (see Gale et al. 2008) where the default annuities would extend only for a specified trial period, after which individuals could choose whether to continue the monthly payments. The board also could have savers automatically purchase deferred annuities over time (see Iwry and Turner 2009). 156 A brief overview of 401k4USA is available at: http://www.digital.nyc/startups/401k4usa
55
Of course, potential drawbacks exist as well. In a third-party arrangement, employers
give up some flexibility over the design details and administration of the retirement plan in favor
of choosing from a set menu of options. The reason third-party platforms like those found in the
United Kingdom and Australia can offer employers inexpensive plans with limited legal liability
is that they rely on several template plans that reduce the decisions made by the employers. The
employers would be able to determine their match and might sign off on a contribution rate and
vesting schedule, but they would leave the default contribution rate, investment lineup, and
investment monitoring up to the trust. For some employers, this situation might be desirable.
SUMMING UP THE OPTIONS. As noted at the beginning of this section, countries have the
ability to achieve any degree of coverage under their retirement plans that they wish. The
outcome depends on policymakers’ tolerance for compulsion. Table 3 (on the next page) sums
up the options for closing the coverage gap for traditional workers in the United States,
beginning with the most modest initiatives and ending with the Australian requirement that
employers contribute to a retirement plan on behalf of their employees. In tandem with
narrowing the coverage gap, some proposals would move the United States away from the
current employer-based system. More extensive changes of this sort would require a longer
timeframe to implement.

56
Introducing Broader Options to Cover Self-Employed and Contingent Workers
Even if all traditional workers had coverage through their employers, the self-employed
and the growing number of contingent workers would be left out. Covering the self-employed
and contingent workers in supplementary plans, however, is in its infancy even in countries that
have aimed for universal coverage.
Most workers in non-standard employment are not enrolled in a retirement plan. While
these workers could go out and open up their own IRA, the evidence indicates that they do not.
In fact, an industry survey found that fewer than one in six Americans have spent two hours or
more within the past year planning for an IRA investment.157 Data from the Investment
157 TIAA-CREF (2014).
Table 3. Options to Expand Coverage by Retirement Plans Goal Option Improve participation among workers eligible for 401(k)s
• Mandate that all 401(k) plans automatically enroll all new employees immediately and non-participating employees periodically
Enhance voluntary system
• Publicize availability of federal plans designed for small business, such as SEP IRAs and SIMPLEs
• Expand marketplaces like those in New Jersey and Washington if they prove successful
• Enact legislation to facilitate the establishment of open MEPs
• Expand the Saver’s Tax Credit
Establish plans with auto-enrollment for employees without coverage
• Impose a federal mandate on employers without a plan to auto enroll their workers in an IRA; or
• Revise ERISA to enable a federal mandate on employers to auto enroll their employees in 401(k)s (or open MEPs) like in the United Kingdom
• Enable states to mandate all employers without a plan to auto enroll their workers in an IRA; or
• Revise ERISA to enable states to mandate all employers without a plan to auto enroll their workers in open MEPs
• Promote efforts to move administrative burden from employers to third-party platforms
Require employer contributions along with coverage of employees
• Impose a federal mandate that all employers must contribute to a retirement plan on behalf of their employees, as in Australia
• Combine mandatory coverage with shift in responsibility from employers to third-party platforms

57
Company Institute show that only 14 percent of households contributed to an IRA in 2014 (see
Figure 21), and a recent study found that fewer than 10 percent make significant consistent
contributions.158
Moreover, workers with alternative work arrangements are likely not going to be picked
up by the state savings initiatives underway in California, Connecticut, Illinois, Maryland, and
Oregon (except perhaps for those at temp agencies). Those initiatives impose a mandate on
employers that are not providing a plan to automatically enroll their workers in an IRA. The
people with alternative work arrangements typically do not have an employer. Nationwide, in
2014, only 65 percent of those not participating in a retirement plan – those who work for an
employer that does not offer a plan – would be picked up by the state initiatives as currently
constructed (see Figure 17). The self-employed account for 14 percent of all uncovered workers.
Other routes for covering more of the uncovered exist, such as new technology (see Box 4, on
the next page), but it will not happen without some special effort.
Although the size of the contingent workforce today suggests it may already be valuable
to develop administrative arrangements to provide these workers with retirement plans, future
interest also depends on whether the increased size of this group is a one-time event or the
beginning of a trend. The answer depends importantly on why the shift is occurring. On the
supply side, alternative work arrangements are more common among older and more highly
educated workers, and the workforce has become older and better educated over time. But this
factor explains only a fraction of the increase.159 An alternative supply side factor could be that
people simply prefer more flexible work arrangements, and these arrangements are more feasible
with the increase in health insurance options that are not tied to an employer. But the increase in
contingent workers in the last decade seems like a very large response to the availability of
health insurance outside the workplace. On the demand side, employers may prefer these new
arrangements because they do not have to provide benefits to these workers. Or more
importantly, employers may be responding to technological change, which standardizes job tasks
and makes it more feasible for them to hire and monitor contingent workers.
158 Iams, Dushi, and Lichtenstein (2015). 159 Katz and Krueger estimate it accounts for only 10 percent of the increase.
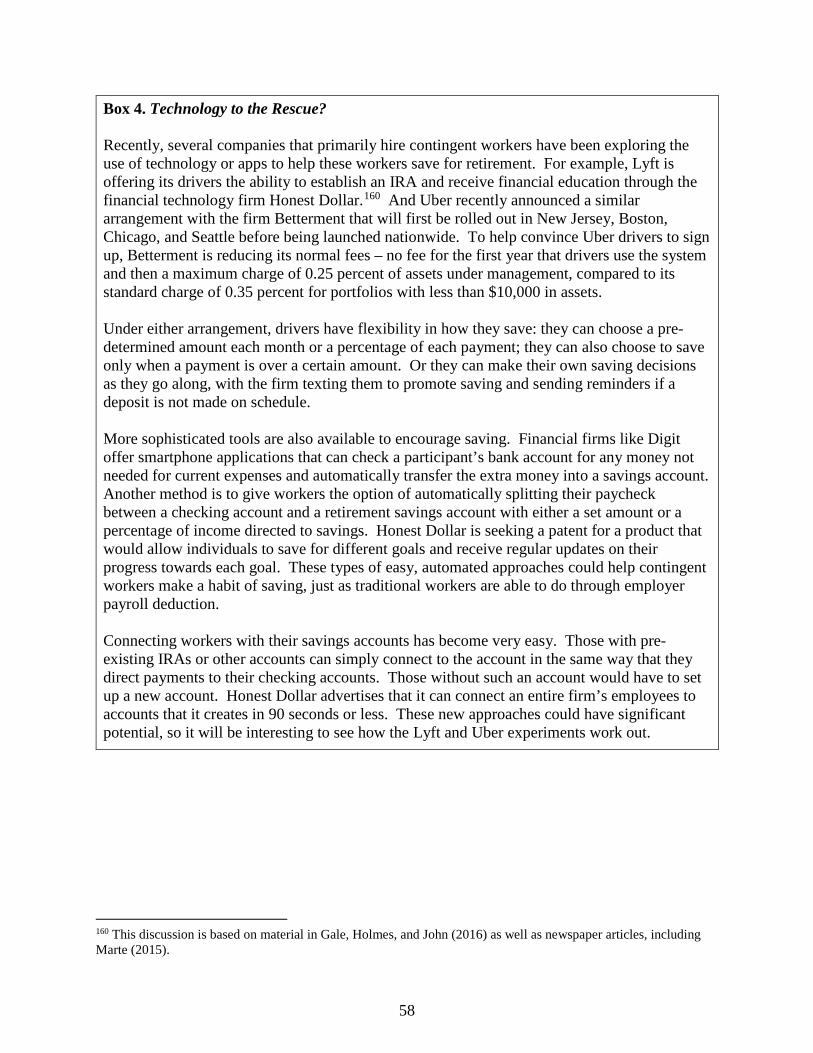
58
Box 4. Technology to the Rescue? Recently, several companies that primarily hire contingent workers have been exploring the use of technology or apps to help these workers save for retirement. For example, Lyft is offering its drivers the ability to establish an IRA and receive financial education through the financial technology firm Honest Dollar.160 And Uber recently announced a similar arrangement with the firm Betterment that will first be rolled out in New Jersey, Boston, Chicago, and Seattle before being launched nationwide. To help convince Uber drivers to sign up, Betterment is reducing its normal fees – no fee for the first year that drivers use the system and then a maximum charge of 0.25 percent of assets under management, compared to its standard charge of 0.35 percent for portfolios with less than $10,000 in assets. Under either arrangement, drivers have flexibility in how they save: they can choose a pre-determined amount each month or a percentage of each payment; they can also choose to save only when a payment is over a certain amount. Or they can make their own saving decisions as they go along, with the firm texting them to promote saving and sending reminders if a deposit is not made on schedule. More sophisticated tools are also available to encourage saving. Financial firms like Digit offer smartphone applications that can check a participant’s bank account for any money not needed for current expenses and automatically transfer the extra money into a savings account. Another method is to give workers the option of automatically splitting their paycheck between a checking account and a retirement savings account with either a set amount or a percentage of income directed to savings. Honest Dollar is seeking a patent for a product that would allow individuals to save for different goals and receive regular updates on their progress towards each goal. These types of easy, automated approaches could help contingent workers make a habit of saving, just as traditional workers are able to do through employer payroll deduction. Connecting workers with their savings accounts has become very easy. Those with pre-existing IRAs or other accounts can simply connect to the account in the same way that they direct payments to their checking accounts. Those without such an account would have to set up a new account. Honest Dollar advertises that it can connect an entire firm’s employees to accounts that it creates in 90 seconds or less. These new approaches could have significant potential, so it will be interesting to see how the Lyft and Uber experiments work out.
160 This discussion is based on material in Gale, Holmes, and John (2016) as well as newspaper articles, including Marte (2015).
59
All these explanations suggest the trend will likely continue. The only argument for a one-shot
event is that the dislocation caused by the Great Recession forced workers to accept other
arrangements when traditional jobs were not available. If the underlying supply and demand
factors – rather than the Great Recession – are the key drivers, however, the prevalence of the
contingent workers should remain steady or increase. More information will become available
when the DOL releases the results of a new survey conducted in 2017.161
International Efforts to Cover Non-traditional Workers
The international discussion of pension coverage for workers in non-standard
employment usually focuses on the self-employed. This categorization overstates the number of
workers in non-standard employment, because many of the self-employed are doctors or lawyers,
who know precisely what they will be doing next week or next year. It also excludes employees
of temp agencies who technically have an employer but do not know where they will be working
in a month’s time. Nevertheless, the treatment of the self-employed in the retirement savings
system suggests that most industrialized countries have not found a way to ensure that these
workers will have an adequate retirement income.
Because retirement systems are multi-tiered, it is useful to look at how the self-employed
are treated under the respective government plans before considering their status in workplace
arrangements.
THE SELF-EMPLOYED IN GOVERNMENT PLANS. Self-employed workers make up a small
but significant minority of the workforce in many countries in the Organisation for Economic
Cooperation and Development (OECD). Moreover, transitions into and out of self-employment
have become increasingly common for a larger group of workers.162 The self-employed tend to
have less stable income and their personal income is often difficult to distinguish from business
revenues. Therefore, many countries treat the self-employed as a separate group.
The approaches to pension provision for the self-employed in OECD countries fall into
three main groups. The first group is countries with non-contributory basic pension schemes.
These schemes generally cover the entire population including the self-employed. To
161 A release date has not yet been scheduled. Any updates about the release will be available at: https://www.bls.gov/cps/lfcharacteristics.htm. 162 Choi (2009).
60
supplement this basic pension, most countries also have government earnings-related plans
financed by contributions. Australia, Japan, the Netherlands, and the United Kingdom do not
require compulsory participation of the self-employed in the earnings-related scheme (although
participation for employees in these schemes is mandatory in Australia and quasi-mandatory in
the Netherlands). Canada, Finland, Iceland, Norway, and Sweden have mandatory earnings-
related schemes for the self-employed.
The second group consists of countries with an earnings-related pension scheme,
financed by contributions, that covers both salaried employees and the self-employed within the
same scheme. Countries in this group are Austria, the Czech Republic, Hungary, Korea,
Portugal, the Slovak Republic, Switzerland, Turkey, and the United States.
The third group of countries has special separate schemes for the self-employed as a
whole or for individual groups of self-employed (some of which are mandatory). These
countries include Belgium, France, Germany, Greece, Italy, Luxembourg, Poland, and Spain.163
The overall findings for the self-employed and government-provided pensions are
threefold. First, in the majority of OECD countries, the self-employed are covered by the same
pension schemes as those of employees. Second, while employees share the contribution burden
with their employers, the self-employed in most cases pay the full pension contribution from
their own income. Third, the self-employed get benefits that are the same as, or similar to, the
benefits of employees.
THE SELF-EMPLOYED IN WORKPLACE PLANS. While the self-employed are generally
included in government plans, their participation in workplace plans tends to be voluntary. This
situation is very similar to the United States, where the self-employed are covered by Social
Security – required to pay the combined employee/employer rate – but are not covered
automatically by any type of supplementary plan. The specifics for Australia, the Netherlands,
and the United Kingdom are informative.
In Australia, the self-employed are automatically covered by the government’s means-
tested Age Pension program but are not required to make Superannuation payments – although
they are encouraged to make voluntary tax-deductible contributions. Given that most retirement
income will come from the money accumulated in the Superannuation accounts, those self-
employed workers who do not participate will be at risk in retirement.
163 European Commission (2015).

61
In the Netherlands, all workers – both the employed and self-employed – are eligible for
the minimal state pension. In terms of the occupational pension schemes, they are quasi-
mandatory for employees in the sense that they are determined by industrial-relations agreements
and most workers participate. For some self-employed, such as doctors and lawyers,
participation is actually mandatory in the occupational pension schemes.
In the United Kingdom, traditionally both tiers of the government pension program have
included the self-employed. The first tier was aimed at providing a minimum level of protection
to everyone, and the second tier was designed to provide further income more related to the
individual’s earnings. In terms of the new auto-enrollment initiative, the self-employed are not
included. They can purchase a retirement plan from NEST or one of the competitors, but the
decision is totally voluntary. Given the low participation rates associated with voluntary
enrollment, many self-employed workers are likely to end up with little more than the
government pension.164
Given the lack of any model for the self-employed, one option for the United States
would be some form of “auto-enrollment” for workers in non-standard employment.
Options for the Self-Employed in the United States
Workers in work arrangements without an employer pose a problem for expanding
retirement savings coverage, because efforts like the auto-IRA typically target workers with
employers not offering plans. Indeed, independent contractors represent over half of workers in
alternative work arrangements and, by definition, these workers do not have an employer and,
therefore, fall through the cracks of the options discussed above.165 And the problem has grown
more pressing because the share of workers labeled as independent contractors rose by nearly
one-third from 1995-2015, from 6.4 percent to 8.4 percent (see Figure 22).
If the United States had a mandatory system, such as Australia, it could require people
who had not contributed the requisite percentage of earnings through an employer to pay a
comparable amount to the government when they pay their taxes. This contribution could be
forwarded to an account maintained by the government and returned when the individual
retirees. As noted above, Australia has not taken this path with its self-employed.
164 Cribb and Emmerson (2016). 165 Katz and Krueger (2016).

62
The United States does not have a mandatory retirement savings system and instead relies
on automatic enrollment when the employer choses to adopt the provision. To mirror the system
for employees, any plan for the self-employed would need to have three characteristics: (1)
automatic enrollment into a retirement savings plan; (2) the ability for individuals to opt out of
the savings arrangement; and (3) a mechanism to re-enroll workers who opt out. The first
feature is needed to overcome inertia that can prevent workers from saving on their own. The
second feature is needed to ensure that these self-employed workers do not face a more stringent
requirement than their traditionally employed counterparts, who are able to opt out of plans.
And the third is designed to ensure that workers who do opt out are periodically nudged until,
hopefully, they pick up the saving habit.
To facilitate automatic enrollment, the Individual Mandate of the ACA, which was
recently eliminated, provides some guidance on an approach that could be used to provide
incentives for self-employed workers to save for retirement. For example, the ACA’s Individual
Mandate taxed households $58 per adult month without health insurance and $29 per child
month.166 The mandate was enforced when an individual filed their taxes and reported whether
they had health coverage throughout the year. Documentation was provided if needed by the
insurance marketplaces or by individual health plans or Medicaid. Failure to have coverage
during any month of the year triggered the penalty.
Conceptually, this structure could be extended to saving. At the end of the year, self-
employed workers could be asked if they saved for retirement in the prior year and, if not,
penalized through a tax.167 Appropriate savings vehicles for these workers already exist,
including low-cost IRAs, such as those offered by Vanguard. Much of the documentation for
enforcing such a mandate also already exists, since IRA contributions are already tracked for tax
purposes. And such a tax, if approved by Congress, would likely be viewed as constitutional
given that the ACA’s Individual Mandate was upheld under Congress’s authority to levy
taxes.168 It is unclear why an individual mandate on saving would be different.
166 Patient Protection and Affordable Care Act (2010). 167 Practically, a months-per-year requirement could be difficult for contingent workers if they do not work in many months. An alternative is to require them to contribute a specified percentage of their average monthly earnings. 168 National Federation of Independent Businesses et al. v. Sebelius, Secretary of Health and Human Services et al. (2012).

63
Allowing these workers to opt out requires a little more creativity. One option would be to
require savings for only a few months out of the year. For example, self-employed workers may
need to demonstrate that they contributed to a retirement account three months out of the year,
allowing them to “opt out” at any time during the rest of the year. Re-enrollment could be built
into this structure relatively easily. For example, after the first year of self-employment, workers
may only be required to show they contributed to an IRA in one month of each year. This
approach would have the effect of getting them back into the habit of savings if they opted out.
While this type of solution represents just one potential approach, it provides a
framework for thinking about how to reach a group of workers that is left behind under most
proposals to close the coverage gap.
Interestingly, one proposal does exist that combines a savings mandate for all U.S.
workers with third-party administration. This proposal from Teresa Ghilarducci, an economist
with the New School, and Tony James, the President and CEO of Blackstone, would establish
Guaranteed Retirement Accounts (GRAs) for all workers.169 The GRAs would require
contributions of 3 percent (half by the worker, half by the employer), with a tax credit designed
to offset the cost of the worker contributions for those below the median income. The
investments would be pooled and managed professionally by fund managers that individuals
could choose from a national marketplace, and account balances would be paid as annuities at
retirement. The responsibility of employers would essentially be limited to making the required
contribution and handling the payroll deduction for the accounts. Those who are self-employed
would be responsible for both the employer and employee contribution.
Clearly, the challenge of covering the self-employed and contingent workers is more
complicated than that of traditional workers. But, reaching this growing part of the workforce is
a part of the puzzle to be solved if the goal is to provide reliable access to retirement savings
plans for everyone.
Summing Up the Options
Table 4 (on the next page) sums up the options related to covering the self-employed and other
contingent workers in a supplementary 401(k)-type system.
169 James and Ghilarducci (2018 forthcoming).
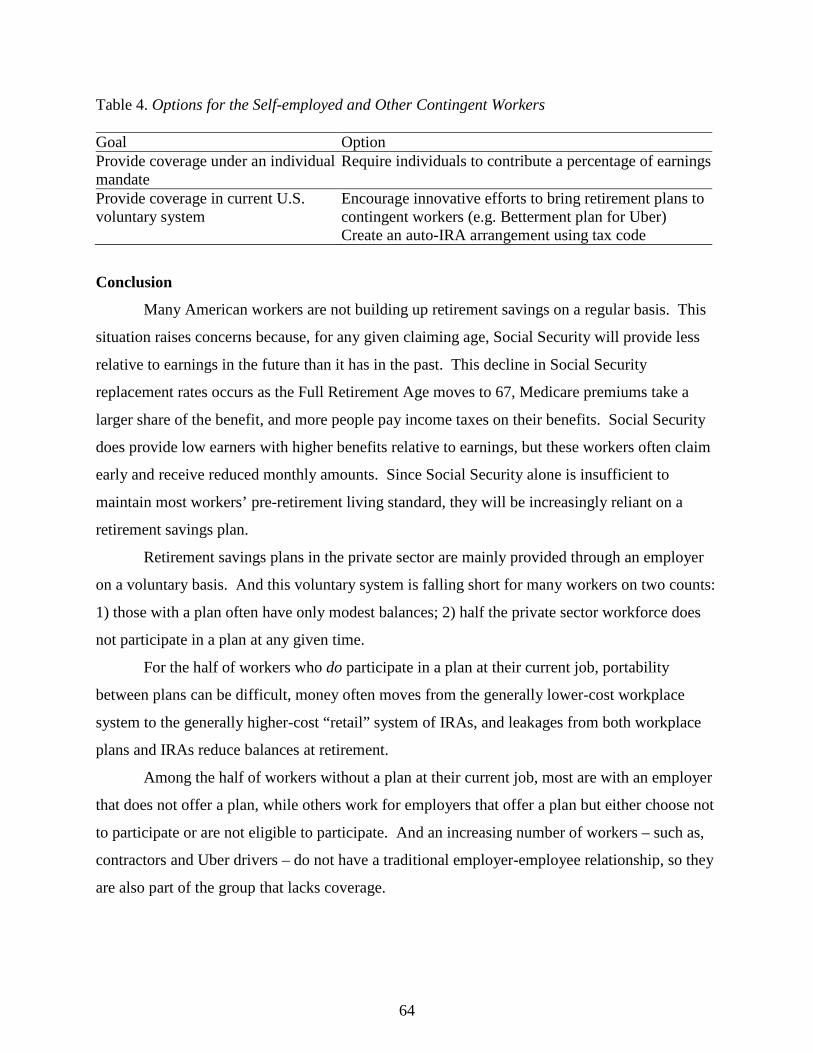
64
Table 4. Options for the Self-employed and Other Contingent Workers Goal Option Provide coverage under an individual mandate
Require individuals to contribute a percentage of earnings
Provide coverage in current U.S. voluntary system
Encourage innovative efforts to bring retirement plans to contingent workers (e.g. Betterment plan for Uber) Create an auto-IRA arrangement using tax code
Conclusion
Many American workers are not building up retirement savings on a regular basis. This
situation raises concerns because, for any given claiming age, Social Security will provide less
relative to earnings in the future than it has in the past. This decline in Social Security
replacement rates occurs as the Full Retirement Age moves to 67, Medicare premiums take a
larger share of the benefit, and more people pay income taxes on their benefits. Social Security
does provide low earners with higher benefits relative to earnings, but these workers often claim
early and receive reduced monthly amounts. Since Social Security alone is insufficient to
maintain most workers’ pre-retirement living standard, they will be increasingly reliant on a
retirement savings plan.
Retirement savings plans in the private sector are mainly provided through an employer
on a voluntary basis. And this voluntary system is falling short for many workers on two counts:
1) those with a plan often have only modest balances; 2) half the private sector workforce does
not participate in a plan at any given time.
For the half of workers who do participate in a plan at their current job, portability
between plans can be difficult, money often moves from the generally lower-cost workplace
system to the generally higher-cost “retail” system of IRAs, and leakages from both workplace
plans and IRAs reduce balances at retirement.
Among the half of workers without a plan at their current job, most are with an employer
that does not offer a plan, while others work for employers that offer a plan but either choose not
to participate or are not eligible to participate. And an increasing number of workers – such as,
contractors and Uber drivers – do not have a traditional employer-employee relationship, so they
are also part of the group that lacks coverage.
65
To provide information on potential ways to improve and expand retirement saving in
employer plans, this report assessed options for enhancing the current employer system and
expanding coverage among both traditional and non-traditional workers.
The current defined contribution system could potentially be improved along three
dimensions. The first is enhancing portability by minimizing procedural barriers to moving
money between employer plans, which could reduce the number of small and lost accounts. Key
barriers here include the lack of a requirement that plans accept incoming rollovers and the lack
of standards for timely and efficient plan-to-plan transfers when people switch jobs.
The second dimension is protecting transfers from the workplace system to the advisor-
oriented retail component. While participants may value the retail market’s broader array of
investment alternatives, the ability to consolidate their assets, and the advantages of tailored
financial advice, they also may face higher fees and potential conflicts of interest among
financial advisors.
The third dimension is reducing leakage from both workplace plans and IRAs, which, on
average, can cut balances at retirement by about 25 percent. Although the current system
imposes a 10-percent penalty tax on pre-retirement withdrawals on top of income taxes, this
provision may not be an effective deterrent for many participants.
Even if policymakers were able to solve all the problems in the defined contribution
system, a large coverage gap remains. At any moment in time about half of private sector
workers are not participating in an employer-sponsored retirement plan. That pattern means that
some workers never gain coverage during their work lives and others have only intermittent
coverage. Either situation poses a problem because Social Security alone is not enough to enable
most workers to maintain their pre-retirement standard of living. Notably, the coverage situation
has not improved since the late 1970s.
In theory, any degree of coverage for traditional employees is achievable. It depends on
the extent to which a country introduces compulsion into pension arrangements and somewhat
on the locus of pension arrangements – employer-based or centered on third-party platforms. At
one end of the spectrum is the United States with an entirely voluntary, employer-based system
that has large coverage gaps. At the other end are Australia and the Netherlands, where
mandates result in near universal coverage, and the employer plays a minimal role.
66
In the United States, the causes of the coverage gap are twofold. First, many employers –
particularly small employers – do not offer a retirement plan, partly due to high costs but more
likely for non-financial reasons such as workers’ preference for cash wages. Second, some
employees who work for an employer with a plan either choose not to participate, often through
inertia, or are not eligible because they have not worked for the employer long enough, work too
few hours, or are in a type of job that is not covered by the plan. As a result, reducing the
coverage gap involves both expanding access to employer-based plans and increasing
participation in existing plans.
Two types of federal and state initiatives have aimed to close the coverage gap for
traditional workers: (1) efforts to reduce barriers to adopting plans; and (2) laws that require all
workers to have access through their employers. At the federal level, efforts to reduce barriers
have focused on lowering the financial, administrative, and legal costs of offering a plan. These
efforts are reflected in products designed for small businesses and regulations facilitating
multiple-employer plans. States have also attempted to make it easier for small businesses to
offer retirement plans: Washington and New Jersey are creating retirement plan marketplaces
that include a curated list of plans suitable for small businesses. However, past efforts to
increase coverage through simpler products or better markets appear to have had little effect.
In contrast, efforts to expand coverage by moving away from the voluntary model and
imposing a mandate on employers have been effective in other countries such as the United
Kingdom. Even within the voluntary system, 401(k) plans that automatically enroll workers –
with the ability to opt out – have boosted participation rates. Along these lines, U.S. policy
experts developed an idea that would require employers without a plan to automatically enroll
workers in an IRA. This proposal has not been adopted at the federal level, but several states are
moving forward with auto-IRAs. A more comprehensive approach to expanding coverage might
involve shifting responsibility for the provision of retiree benefits from the employer to a third-
party platform.
Even if all traditional workers had coverage through their employers, the self-employed
and the growing number of contingent workers would be left out. Covering both groups in
supplementary plans, however, is in its infancy even in countries that have aimed for universal
coverage. One step in that direction may be creating some type of plan with auto-enrollment for
workers without an employer.

67
In short, a changing retirement landscape may require today’s workers to accumulate
more savings, but barriers exist for accumulating and managing money in defined contribution
plans, and many do not participate in any form of employer-provided retirement program. A
number of changes have the potential to make existing plans work better by enhancing
portability and safeguarding small accounts, protecting transfers from the workplace to IRA
system, and curtailing leakage. Coverage could be expanded substantially within the existing
financial infrastructure, but more ambitious approaches may be required to relieve the burden on
employers and to cover the self-employed and the growing number of contingent workers. For
these more ambitious approaches, policymakers need to decide how much compulsion is
desirable in the U.S. retirement system and the optimal role for employers.
68
References AARP. 2016. “State Retirement Savings Resource Center.” Washington, DC. Available at:
http://www.aarp.org/ppi/ state-retirement-plans. Alfred, Ryan. 2015. “The One Chart that Explains 401(k) Fees.” San Diego, CA: BrightScope. American Academy of Actuaries. 2014. “Retirement for the Enduring Retirement Income
Systems.” A Public Policy Monograph. Washington, DC. Ameriks, John and Steve Zeldes. 2004. “How Do Household Portfolios Vary with Age?”
Working Paper. New York, NY: Columbia University. Angeletos, George-Marios, David Laibson, Andrea Repetto, Jeremy Tobacman, and Stephen
Weinberg. 2001. “The Hyperbolic Consumption Model: Calibration, Simulation, and Empirical Evaluation.” Journal of Economic Perspectives 15(3): 47-68.
Argento, Robert, Victoria L. Bryant, and John Sabelhaus. 2015. “Early Withdrawals from
Retirement Accounts During the Great Recession. Contemporary Economic Policy 33(1): 1-16.
Argento, Roberto, Victoria L., Bryant, and John Sabelhaus. 2013. “Early Withdrawals from
Retirement Accounts.” Finance and Economics Discussion Series Paper 2013-22. Washington, DC: Board of Governors of the Federal Reserve System.
Australian Taxation Office. 2015. “20 Years of Superannuation Guarantee.” Canberra, Australia. Aven Gladych, Paula. 2015. “Regular Monitoring Keeps 401(k) Fees in Check. (July 23). New
York, NY: Source Media LLC, Employee Benefit News. Baker, Dean. 2006. “Universal Voluntary Accounts: A Step Towards Fixing the Retirement
System. Washington, DC: Center for Economic and Policy Research. Banerjee, Sudipto. 2014. “Take it or Leave it? The Disposition of DC Accounts: Who Rolls Over
into an IRA? Who Leaves Money in the Plan and Who Withdraws Cash?” EBRI 35 (5). Washington, DC: Employee Benefit Research Institute.
Benartzi, Shlomo and Richard H. Thaler. 2001. “Naive Diversification Strategies in Defined
Contribution Saving Plans.” American Economic Review 90(1): 79-98. Beshears, John, James J. Choi, Joshua Hurwitz, David Laibson, and Brigitte C. Madrian. 2015.
“Liquidity in a Retirement Savings System: An International Comparison.” American Economic Review: Papers & Proceedings 105(5): 420-425.

69
Beshears, John, James Choi, Christopher Clayton, Christopher Harris, David Laibson, and Brigitte Madrian. 2014. “Optimal Illiquidity in the Retirement Savings System.” Working Paper 14-05. Cambridge, MA: National Bureau of Economic Research.
Beshears, John, James J. Choi, David Laibson, and Brigitte C. Madrian. 2010. “The Impact of
Employer Matching on Savings Plan Participation under Automatic Enrollment.” In Research Findings in the Economics of Aging, edited by David A. Wise, 311-327. Chicago, IL: University of Chicago Press.
Beshears, John, James J. Choi, David Laibson, and Brigitte Madrian. 2009. “The Importance of
Default Options for Retirement Saving Outcomes: Evidence from the United States.” In Social Security Policy in a Changing Environment, edited by Jeffrey Brown, Jeffrey Liebman and David A. Wise, 167-195. Chicago, IL: University of Chicago Press.
Bipartisan Policy Center. 2016. “Securing Our Financial Future: Report of the Commission on
Retirement Security and Personal Savings.” Washington, DC. Borzi, Phyllis C. 1985. “A National Retirement Income Policy: Problems and Policy Options.”
University of Michigan Journal of Law Reform 19(1): 5-50. Borzi, Phyllis C. 2005. “Changing Risks Confronting Pension Participants.” Working Paper
2005-14. Philadelphia, PA: Pension Research Council at the Wharton School of the University of Pennsylvania.
Borzi, Phyllis C. 2011. Testimony before the House Committee on Education and the
Workforce, Subcommittee on Health, Employment, Labor, and Pensions. July 26. Washington, DC.
Borzi, Phyllis C. 2012. Testimony before the Senate Special Committee on Aging. March 7.
Washington, DC. Brien, Michael J. and Constantijn WA Panis. 2011. “Annuities in the Context of Defined
Contribution Plans.” Study for the U.S. Department of Labor, Employee Benefits Security Administration. Washington, DC.
Brightman, Chris. 2012. “Expected Return.” Investments & Wealth Monitor, IMCA (January-
February): 24-29. BrightScope and Investment Company Institute. 2014. “The BrightScope/ICI Defined
Contribution Plan Profile: A Close Look at 401(k) Plans, 2013.” San Diego, CA and Washington, DC.
Bryant, Victoria L., Sarah Holden, and John Sabelhaus. 2011. “Qualified Retirement Plans:
Analysis of Distribution and Rollover Activity.” Working Paper WP2011-01. Philadelphia, PA: Pension Research Council.

70
Burtless, Gary. 2013. “The Impact of Population Aging and Delayed Retirement on Workforce Productivity.” Working Paper 2013-11. Chestnut Hill, MA: Center for Retirement Research at Boston College.
Butrica, Barbara A., Sheila R. Zedlewski, and Philip Issa. 2010. “Understanding Early
Withdrawals from Retirement Accounts.” Discussion Paper 10‐02. Washington, DC: The Urban Institute.
Butrica, Barbara A. and Nadia S. Karamcheva. 2012. “Automatic Enrollment, Employee
Compensation, and Retirement Security.” Working Paper 2012-25. Chestnut Hill, MA: Center for Retirement Research at Boston College.
Centers for Medicare and Medicaid Services, Department of Health and Human Services. 2017.
Annual Report of the Boards of Trustees of the Federal Hospital Insurance and Federal Supplementary Medical Insurance Trust Funds. Washington, DC: U.S. Government Printing Office.
Chen, Anqi and Alicia H. Munnell. 2017. “Who Contributes to Individual Retirement Accounts.
Issue in Brief 17-8. Chestnut Hill, MA: Center for Retirement Research at Boston College.
Choi, James J., David Laibson, and Brigitte C. Madrian. 2004. “Plan Design and 401(k) Savings
Outcomes.” Working Paper No. 10486. Cambridge, MA: National Bureau of Economic Research.
Choi, James J., David Laibson, Brigitte C. Madrian, and Andrew Metrick. 2006. “Saving for
Retirement on the Path of Least Resistance.” In Behavioral Public Finance, eds. Edward McCaffrey and Joel Slemrod, 304-352. New York, NY: Russell Sage.
Choi, Laibson and Madrian. 2009. “Mental Accounting in Portfolio Choice: Evidence from a
Flypaper Effect” AER Choi, Jongkyun. 2009. “Pension Schemes for the Self Employed in OECD Countries.” Paris:
Organization for Economic Cooperation and Development. Clark, Jeffrey W., Stephen P. Utkus, and Jean A. Young. 2015. “Automatic Enrollment: The
Power of the Default.” Valley Forge, PA: Vanguard. Clingman, Michael, Kyle Burkhalter, and Chris Chaplain. 2016. “Replacement Rates for
Hypothetical Workers.” Actuarial Note Number 2016-9. Baltimore, MD: U.S. Social Security Administration.
Copeland, Craig. 2015a. “Individual Retirement Account Balances, Contributions, and
Rollovers, 2013; With Longitudinal Results 2010-2013: The EBRI IRA Database.” Washington, DC: Employee Benefit Research Institute.

71
Copeland, Craig. 2015b. “The Effect of the Current Population Survey Redesign on Retirement-Plan Participation Estimates.” Washington, DC: Employee Benefit Research Institute.
Cormier, Warren J. 2013. “Eliminating Friction and Leaks in America’s Defined Contribution
System. Fixing the Systemic Breakdowns That Impact Every Sponsor, Participant and Provider.” Hopkinton, MA: Boston Research Group.
Cribb, Jonathan, and Carl Emmerson. 2016. "What Happens When Employers Are Obliged to
Nudge? Automatic Enrolment and Pension Saving in The UK." Institute for Fiscal Studies.
Davis, Rowland, Nayla Kazzi, and David Madland. 2010. “The Promise and Peril of a Model
401(k) Plan.” Washington, DC: Center for American Progress. Davis, Rowland and David Madland. 2013. “American Retirement Savings Could Be Much
Better.” Washington, DC: Center for American Progress. Delfico, Joseph F. 1988. “Pension Portability and Preservation: Issues and Proposals.”
Testimony before the House Committee on Ways and Means, Subcommittee on Oversight. July 12. Washington, DC: U.S. General Accounting Office.
Dokko, Jane, Megan Mumford, and Diane Whitmore Schanzenbach. 2015. “Workers and the
Online Gig Economy.” Washington DC: The Hamilton Project, Brookings Institution. Duflo, Esther, William Gale, Jeffrey Liebman, Peter Orszag, and Emmanuel Saez. 2006. “Saving
Incentives for Low-and Middle-Income Families: Evidence from a Field Experiment with H&R Block.” The Quarterly Journal of Economics 121(4): 1311-1346.
Ellis, Charles D., Alicia H. Munnell, and Andrew D. Eschtruth. 2014. Falling Short: The Coming
Retirement Crisis and What to Do About It. New York, NY: Oxford University Press. Engelhardt, Gary V. 2002. “Pre-Retirement Lump Sum Pension Distributions and Retirement
Income Security: Evidence from the Health and Retirement Study.” National Tax Journal 55(4): 665-685.
Engelhardt, Gary V. and Anil Kumar. 2007. “Employer Matching and 401(k) Saving: Evidence
from the Health and Retirement Study.” Journal of Public Economics 91(10): 1920-1943. ERISA Industry Committee. 2009. Statement of Michael Stapley on Behalf of the ERISA
Industry Committee, Submitted to the Committee on Education and Labor of the U.S. House of Representatives at a Hearing on the Tri-Committee Draft Proposal for Health Care Reform. June 23. Washington, DC.
ERISA Industry Committee. 2007. “A New Benefit Platform for Life Security.” Washington,
DC.
72
European Commission. 2015. “Non-standard Employment and Access to Social Security Benefits.” Brussels, Belgium
Even, William E. and David A. Macpherson. 1994. “Why Did Male Pension Coverage Decline
in the 1980’s?” Industrial and Labor Relations Review 47(3): 439-453. Federal Retirement Thrift Investment Board. 2015. “Thrift Savings Fund Statistics.”
Washington, DC. Fellowes, Matt and Katy Willemin. 2013. “The Retirement Breach in Defined Contribution
Plans: Size, Causes, and Solutions.” Washington, DC: HelloWallet. Friedman, John N. 2015. “Building on What Works: A Proposal to Modernize Retirement
Savings.” Washington DC: The Hamilton Project, Brookings Institution. Gale, William G., J. Mark Iwry, David C. John, and Lina Walker. 2008. “Increasing
Annuitization in 401(k) Plans with Automatic Trial Income.” Washington, DC: The Retirement Security Project, Brookings Institution.
Gale, William G., Sarah E. Holmes, and David C. John. 2016. “Retirement Plans for Contingent
Workers: Issues and Options.” Washington, DC: Brookings Institution. Georgetown University Center for Retirement Initiatives. 2016. “State Activity Updates.”
Washington, DC. Available at: http://cri.georgetown.edu/states/. Ghilarducci, Teresa. 2003. “Delinking Benefits from a Single Employer: Alternative
Multiemployer Models.” Benefits for the Workplace of the Future: 260. Ghilarducci, Teresa. 2007. “Guaranteed Retirement Accounts: Toward Retirement Income
Security.” Washington, DC: Economic Policy Institute. Ghilarducci, Teresa. 2008. When I’m Sixty-four: The Plot Against Pensions and the Plan to Save
Them. Princeton, NJ: Princeton University Press. Harkin, Tom. 2012. “The Retirement Crisis and a Plan to Solve It.” U.S. Senate Committee on
Health Education Labor & Pensions. Washington, DC. Available at: http://bit.ly/2F4Rie3. Hiltonsmith, Robert. 2012. “The Retirement Savings Drain: The Hidden and Excessive Costs of
401 (k)s.” New York, NY: Demos. Holden, Sarah and Daniel Schrass. 2016. “The Role of IRAs in U.S. Households’ Saving for
Retirement, 2015.” Washington, DC: Investment Company Institute. Iams, Howard, Irena Dushi, and Jules Lichtenstein. 2015. “Retirement Plan Coverage by Firm
Size: An Update.” Social Security Bulletin 75(2): 41-55.
73
Investment Company Institute. 2015. “The Federal Thrift Savings Plan: Can It Be Duplicated?” Washington, D.C.
Investment Company Institute. 2016. “2016 Investment Company Fact Book.” Washington DC. Investment Company Institute. 2017. “The Role of IRAs in US Households’ Saving for
Retirement.” Washington, DC. Internal Revenue Service. 2014. “Rollovers to Qualified Plans.” Rev. Rul. 2014-9.” Washington,
DC. Internal Revenue Service. 2015a. “Retirement Topics – Catch-Up Contributions.” Washington,
DC. Internal Revenue Service. 2015b. “Amount of Roth IRA Contributions That You Can Make for
2015.” Washington, DC. Internal Revenue Service. 2016. “IRS Announces 2016 Pension Plan Limitations; 401(k)
Contribution Limit Remains Unchanged at $18,000 for 2016.” Washington, DC. Investment News. 2015. “Retirement Readiness: 15% Salary Deferrals Are the New 10% for
401(k)s.” (January 5). New York, NY. Investment News. 2016. “Thrivent Financial Files Sixth Lawsuit against DOL Fiduciary Rule.”
(September 30). New York, NY Iwry, J. Mark and David C. John. 2006. “Pursuing Universal Retirement Security Through
Automatic IRAs.” Working Draft (February). Washington, DC: The Retirement Security Project, Brookings Institution.
Iwry, J. Mark and David C. John. 2009. “Pursuing Universal Retirement Security Through
Automatic IRAs.” Policy Brief No. 2009-3. Washington, DC: The Retirement Security Project, Brookings Institution.
Iwry, J. Mark and John Turner. 2009. “Automatic Annuitization: New Behavioral Strategies for
Expanding Lifetime Income in 401(k)s.” Washington, DC: The Retirement Security Project, Brookings Institution.
James, Tony and Teresa Ghilarducci. 2018 (forthcoming). Rescuing Retirements. New York,
NY: Columbia University Press. John, David C. 2015. “Making Retirement Saving Even More Valuable by Adding Automatic
Emergency Savings.” Washington, DC: AARP. Available at: http://blog.aarp.org/2015/07/13/making-retirement-saving-even-more-valuable-by-adding-automatic-emergency-savings/.
74
John, David C. and William G. Gale. 2015. “Structuring State Retirement Saving Plans: A Guide to Policy Design and Management Issues.” Washington, DC: The Retirement Security Project, Brookings Institution.
Kalamarides, John J. 2016. “Helping Americans Prepare for Retirement: Increasing Access,
Participation and Coverage in Retirement Savings Plans.” Testimony before Senate Committee on Finance. January 26. Washington, DC.
Katz, Lawrence F. and Alan B. Krueger. 2016. “The Rise and Nature of Alternative Work
Arrangements in the United States, 1995-2015.” Working Paper No. 22667. Cambridge, MA: National Bureau of Economic Research.
Kearney, Melissa S., Peter Tufano, Jonathan Guryan, and Erik Hurst. 2010. “Making Savers
Winners: An Overview of Prize-Linked Savings Products.” Working Paper No. 16433. Cambridge, MA: National Bureau of Economic Research.
Knoll, Melissa. 2010. “The Role of Behavioral Economics and Behavioral Decision Making in
Americans' Retirement Savings Decisions.” Social Security Bulletin 70(4): 1-23. Laibson, David. 1997. “Golden Eggs and Hyperbolic Discounting.” Quarterly Journal of
Economics 112(2): 443-477. Laibson, David. 2016. “Optimal Retirement Savings in a Leaky World.” Presented at the
International Centre for Pension Management Discussion Forum. Boston, MA. Light, Audrey and Kathleen McGarry. 1998. “Job Change Patterns and the Wages of Young
Men.” Review of Economics and Statistics 80(2): 276-286. Lu, Timothy Jun, Olivia S. Mitchell, Stephen P. Utkus, and Jean A. Young. 2015. “Borrowing
from the Future: 401 (k) Plan Loans and Loan Defaults.” Working Paper No. 21102. Cambridge, MA: National Bureau of Economic Research.
Madland, David, Alex Rowell, and Rowland Davis. 2016. “Improving Americans’ Retirement
Outcomes Through the National Savings Plan.” Washington, DC: Center for American Progress.
Madland, David. 2012. “Making Saving for Retirement Easier, Cheaper, and More Secure.”
Washington, DC: Center for American Progress. Madrian, Brigitte. 2013. “Matching Contributions and Savings Outcomes: A Behavioral
Economics Perspective: A Behavioral Economics Perspective. In Matching Contributions for Pensions: A Review of International Experience, edited by R. Hinz, R. Holzman, D. Tuesta, and N.Takayama. Washington, DC: The World Bank.
75
Madrian, Brigitte C. and Dennis F. Shea. 2001. “Preaching to the Converted and Converting Those Taught: Financial Education in the Workplace.” Working Paper. Chicago, IL: University of Chicago.
MassMutual. 2016. “MassMutual Introduces Kashable Credit Services on the BeneClick!
Benefits Exchange.” (June 8). Springfield, MA. Miller, Keith, David Madland, and Christian E. Weller. 2015. “The Reality of the Retirement
Crisis.” Washington, DC: Center for American Progress. Mitchell, Olivia S., Gary R. Mottola, Stephen P. Utkus, and Takeshi Yamaguchi. 2006. “The
Inattentive Participant: Portfolio Trading Behavior in 401(k) Plans.” Working Paper 115. Ann Arbor, MI: Michigan Retirement Research Center Research
Morse, David. 2014. “State Initiatives to Expand the Availability and Effectiveness of Private
Sector Retirement Plans. How Federal Laws Apply to Plan Design Options.” Working Paper 2014-01. Washington, DC: Georgetown University Center for Retirement Initiatives.
Munnell, Alicia H. 2015. “The Average Retirement Age – An Update.” Issue in Brief 15-4.
Chestnut Hill, MA: Center for Retirement Research at Boston College. Munnell, Alicia H. 2017. “401(k)/IRA Holdings in 2016: An Update from the SCF. Issue in
Brief 17-18. Chestnut Hill, MA: Center for Retirement Research at Boston College. Munnell, Alicia H. and Annika Sundén. 2004. Coming Up Short: The Challenge of 401 (k)
Plans. Washington, DC: Brookings Institution Press. Munnell, Alicia H., Wenliang Hou, and Anthony Webb. 2014. “NRRI Update Shows Half Still
Falling Short.” Issue in Brief 14-20. Chestnut Hill, MA: Center for Retirement Research at Boston College.
Munnell, Alicia H., Anthony Webb, and Wenliang Hou. 2014. "How Much Should People
Save?" Issue in Brief 14-11. Chestnut Hill, MA: Center for Retirement Research at Boston College.
Munnell, Alicia H. and Dina Bleckman. 2014. “Is Pension Coverage a Problem in the Private
Sector?” Issue in Brief 14-7. Chestnut Hill, MA: Center for Retirement Research at Boston College.
Munnell, Alicia H. and Anthony Webb. 2015. “The Impact of Leakages from 401(k)s and
IRAs.” Working Paper 2015-2. Chestnut Hill, MA: Center for Retirement Research at Boston College.
76
Munnell, Alicia H., Anthony Webb, and Anqi Chen. 2015. “To What Extent Does SES Status Lead People to Retire Too Soon.” Working Paper 2015-19. Chestnut Hill, MA: Center for Retirement Research at Boston College.
Munnell, Alicia H., Anthony Webb, and Francis M. Vitagliano. 2013. “Will Regulations to
Reduce IRA Fees Work?” Issue in Brief 13-2. Chestnut Hill, MA: Center on Retirement Research at Boston College.
Munnell, Alicia H., Jean-Pierre Aubry, and Caroline V. Crawford. 2015. “Investment Returns:
Defined Benefit vs. Defined Contribution Plans.” Issue in Brief 15-21. Chestnut Hill, MA: Center for Retirement Research at Boston College.
Munnell, Alicia H., Anek Belbase, and Geoffrey T. Sanzenbacher. 2016. “State Initiatives to
Cover Uncovered Private Sector Workers.” Issue in Brief 16-4. Chestnut Hill, MA: Center for Retirement Research at Boston College.
National Employment Savings Trust. 2015. “National Employment Savings Trust Corporation
Annual Report and Accounts 2014-2015.” London, U.K. National Federation of Independent Business v. Sebelius. 2012. 567 U.S., 183 L. Ed. 2d 450, 132
S.Ct. 2566. National Employment Savings Trust. 2015. “Corporate Responsibility Statement.” London, U.K. Nessmith, William E., Stephen P. Utkus, and Jean A. Young. 2007. “Measuring the
Effectiveness of Automatic Enrollment.” Volume 31. Valley Forge, PA: Vanguard Center for Retirement Research.
Nightingale, Demetra Smith and Stephen A. Wandner. 2011. “Informal and Nonstandard
Employment in the United States: Implications for Low-income Working Families.” Perspectives on Low-income Working Families Brief 20. Washington, DC: Urban Institute.
Office of Management and Budget. 2016. The President’s Budget for the Fiscal Year 2017.
Washington, DC. Oregon Saves. 2017. “Work Hard. Save Easy: OregonSaves gives Oregonians an Easier Way to
Save for Retirement.” Available at: https://www.oregonsaves.com/home.html Palmer, Bruce A. 2008. “2008 GSU/Aon RETIRE Project Report.” Research Report Series 08-1.
Atlanta, GA: J. Mack Robinson College of Business, Georgia State University. Patient Protection and Affordable Care Act. 2010. 42 U.S.C. § 18001 et seq. Pechter, Kerry. 2014. “Fixing the 401(k)s’ Leakage Problem.” Retirement Income Journal 276.
77
Pensions Commission. 2005. A New Pension Settlement for the Twenty-First Century – The Second Report of the Pensions Commission. Norwich, United Kingdom: The Stationery Office.
Pensions Policy Institute. 2016. “The Pensions Policy Primer: A Guide to the U.K. Pensions
System. Update as at June 2016.” London, U.K. Pension Rights Center. 2016. “State-based Retirement Plans for the Private Sector.” Washington,
DC. Available at: http:// www.pensionrights.org/issues/legislation/statebased-retirement-plans-private-sector.
Pew Charitable Trusts. 2017. “Small Business Views on Retirement Savings Plans” Philadelphia,
PA. Poterba, James M., Steven F. Venti, and David A. Wise. 2012. “Were They Prepared for
Retirement? Financial Status at Advanced Ages in the HRS and AHEAD Cohorts.” Working Paper 17824. Cambridge, MA: National Bureau of Economic Research.
Poterba, James M., Steven F. Venti, and David A. Wise. 2001. “Preretirement Cashouts and
Foregone Retirement Saving: Implications for 401(k) Asset Accumulation.” In Themes in the Economics of Aging, edited by David A. Wise, 23-56. Chicago, IL: University of Chicago Press.
Public Plans Database. 2012. Center for Retirement Research at Boston College, Center for State
and Local Government Excellence, and National Association of State Retirement Administrators.
Purcell, Patrick. 2009. Pension Issues: Lump-Sum Distributions and Retirement Income Security.
CSR Report 7-5700. Washington, DC: Congressional Research Service. Rhee, Nari (editor). 2011. “Meeting California’s Retirement Security Challenge.” Berkeley, CA:
Center for Labor Research and Education, University of California, Berkeley. Reilly, Catherine and Melissa Kahn. 2016. “Local Goals, Global Lessons: Building Retirement
Security with Global Best Practices.” Boston, MA: State Street Global Advisors. Sass, Steven. 2014. “The U.K.’s Ambitious New Retirement Saving Initiative.” Issue in Brief 14-
5. Chestnut Hill, MA: Center for Retirement Research at Boston College. Shipman, Jade. 2016. “Great Expectations: Findings from 13 Years of Children’s Education
Savings Accounts.” San Francisco, CA: Earn Research Institute. Sixma, Karin and Dulijon Veldhoen. 2015. “The Netherlands.” In Pensions & Insolvency – An
International Survey. London, U.K.: INSOL International.

78
Springstead, Glenn R. and Theresa M. Wilson. 2000. “Participation in Voluntary Individual Savings Accounts: An Analysis of IRAs, 401(k)s and the TSP.” Social Security Bulletin 63(1): 34-49.
State of California Legislature. 2012. “California Secure Choice Retirement Savings Trust Act.”
S.B.1234. Sacramento, CA. State of Connecticut General Assembly. 2014. “An Act Promoting Retirement Savings.” S.B.
249. Hartford, CT. State of Illinois General Assembly. 2014. “Illinois Secure Choice Savings Program Act.” Public
Act 098-1150. Springfield, IL. State of Maryland General Assembly. 2016. “Maryland Small Business Retirement Savings
Program and Trust.” SB 1007. Annapolis, MD. State of New Jersey Legislature. 2016. “New Jersey Secure Choice Savings Program Act.” A.
4275. Trenton, NJ. State of Oregon Legislature. 2015. “Relating to Retirement Investments; Declaring an
Emergency.” S.B. 615. Salem, OR. State of Washington Legislature. 2015. “Creating the Washington Small Business Retirement
Marketplace.” S.B. 5826. Olympia, WA. Teachers Insurance and Annuity Association-College Retirement Equities Fund. 2014. “TIAA-
CREF IRA Survey Executive Summary.” New York, NY. Thaler, Richard H. and Shlomo Benartzi 2004. “Save More Tomorrow: Using Behavioral
Economics to Increase Employee Saving.” Journal of Political Economy 112(1) 164-187. The Pew Charitable Trusts. 2017. “Small Business Views on Retirement Savings Plans.”
Philadelphia, PA. Time Magazine. 2013. “10 Biggest 401(k) Mistakes – and How to Avoid Them.” (April 10).
New York, NY. Turner, John A., and Bruce W. Klein. 2014. "Retirement Savings Flows and Financial Advice:
Should You Roll Over Your 401 (k) Plan?." Benefits Quarterly 30 (4) 42-54. U.K. Department for Work and Pensions. 2015. “Automatic Transfers: A Framework for
Consolidating Pension Saving.” London, U.K. U.S. Board of Governors of the Federal Reserve System. 2017. Financial Accounts of the United
States: Third Quarter. Washington, DC.

79
U.S. Board of Governors of the Federal Reserve System. 2015. “Report on the Economic Well-Being of U.S. Households in 2014.” Washington, DC.
U.S. Congress. 2013. SAFE Retirement Act of 2013. S. 1270, 113th Congress. Washington, DC. U.S. Congress. 2014. Retirement Security Act of 2014. S.1970, 113th Congress. Washington,
DC. U.S. Congress. 2014. USA Retirement Funds Act. S.1979, 113th Congress. Washington, DC. U.S. Department of Labor, Bureau of Labor Statistics. 2018. “Labor Force Statistics from the
Current Population Survey.” Washington, DC. On BLS website at https://www.bls.gov/cps/lfcharacteristics.htm.
U.S. Department of Labor, Employee Benefits Security Administration. 2017. 29 CFR Part 2550.
“18-Month Extension of Transition Period and Delay of Applicability Dates.” Federal Register 82(228): 56545-56560. Washington, DC.
U.S. Department of Labor, Employee Benefits Security Administration. 2014a. Issues and
Considerations Surrounding Facilitating Lifetime Plan Participation. Washington, DC. U.S. Department of Labor, Employee Benefits Security Administration. 2014b. Outsourcing
Employee Benefit Plan Services. Washington, DC. U.S. Department of Labor, Employee Benefits Security Administration. 2015a. Savings
Arrangements Established by States for Non-Governmental Employees. Federal Register 80(222): 72006. Washington, DC.
U.S. Department of Labor, Employee Benefits Security Administration. 2015b. Interpretive
Bulletin Relating to State Savings Programs That Sponsor or Facilitate Plans Covered by the Employee Retirement Income Security Act of 1974. Federal Register 80(222): 71936. Washington, DC.
U.S. Department of Labor, Bureau of Labor Statistics. 2015c. Number of Jobs Held, Labor
Market Activity, and Earnings Growth Among the Youngest Baby Boomers: Results From a Longitudinal Survey. Washington, DC.
U.S. Department of Labor, Employee Benefits Security Administration. 2016. Savings
Arrangements Established by States for Non-Governmental Employees. Federal Register 81: 59464. Washington, DC.
U.S. Government Accountability Office. 1989. Portability and Preservation of Vested Pension
Benefits. Report No. GAO HRD-89-15BR. Washington, DC. U.S. Government Accountability Office. 2000. Characteristics of Persons in the Labor Force
Without Pensions. Report No. GAO-00-131. Washington, DC.
80
U.S. Government Accountability Office. 2009. Better Information and Sponsor Guidance Could Improve Oversight and Reduce Fees for Participants. Report No. GAO-09-641. Washington, DC.
U.S. Government Accountability Office. 2012. Federal Agencies Should Collect Data and
Coordinate Oversight of Multiple Employer Plans. Report No. GAO-12-665. Washington, DC.
U.S. Government Accountability Office. 2013. Labor and IRS Could Improve the Rollover
Process for Participants. Report No. GAO-13-30. Washington, DC. U.S. Government Accountability Office. 2014. Greater Protections Needed for Forced Transfers
and Inactive Accounts. Report No. GAO-15-73. Washington, DC. U.S. Government Accountability Office. 2015. Federal Action Could Help State Efforts to
Expand Private Sector Coverage. Report No. GAO-15-556. Washington, DC. U.S. Senate Committee on Finance. 2015. The Savings & Investment Bipartisan Tax Working
Group Report. Washington, DC. U.S. Social Security Administration. 2017a. The Annual Report of the Board of Trustees of the
Federal Old-Age and Survivors Insurance and Federal Disability Insurance Trust Funds. Washington, DC: U.S. Government Printing Office.
U.S. Social Security Administration. 2017b. Annual Statistical Supplement to the Social Security
Bulletin, 2017. Washington, DC: U.S. Government Printing Office. U.S. News & World Report. 2015. “How Much Should You Contribute to Your 401(k)?”
(February 17). New York, NY. Utkus, Stephen P. and Jean A. Young. 2016. “How America Saves 2017: A Report on Vanguard
2016 Defined Contribution Plan Data.” Valley Forge, PA: The Vanguard Group. Utkus, Stephen P. and Jean A. Young. 2016. “How America Saves 2016: A Report on Vanguard
2015 Defined Contribution Plan Data.” Valley Forge, PA: The Vanguard Group. Washington Post. 2016. “Uber is Tackling One of the Biggest Challenges for Workers in the Gig
Economy.” (August 24). Washington, DC. Weller, Christian E. 2015. Retirement on the Rocks: Why Americans Can't Get Ahead and How
New Savings Policies Can Help. London, U.K.: Palgrave Macmillan. Williams, J. Spencer. 2013. “Defined Contribution Account Consolidation. The Future is Now.”
Chicago, IL: Plan Sponsor Council of America.

81
Yakoboski, Paul Joseph. 1997. “Large Plan Lump-Sums: Rollovers and Cashouts.” Washington, DC: Employee Benefit Research Institute.

82
Tables and Figures Table 5. Disposition of DC Plan Assets When Individuals Leave Employer, 2010-2012 Account balance ($2012)
Withdrew money
Rolled into an IRA
Left in plan Other Total
≤ $5,000 57.5 % 18.9 % 23.6 % 0.0 % 100.0 % $5,001–$20,000 37.1 28.5 32.5 1.9 100.0 $20,001–$50,000 10.7 41.6 45.4 2.3 100.0 $50,001–$100,000 17.5 37.4 29.8 15.3 100.0 > $100,000 11.5 43.0 28.3 17.3 100.0 Total 26.6 % 34.1 % 32.1 % 7.2 % 100.0 % Source: Authors’ calculations from University of Michigan, Health and Retirement Study (2010-2012). Table 6. Primary Reason for Most Recent Rollover to IRA, 2014 Reason Percent 1 Did not want to leave assets with former employer 19 % 2 Wanted to consolidate assets 16 3 Wanted more investment options 21 4 Wanted same/different financial services provider 18 5 Wanted to preserve tax treatment 12 6 Was told by financial adviser to rollover 8 7 Easier than rolling over to new employer’s plan 4 8 Wanted same investments as in former employer’s plan 2 Source: Investment Company Institute (2016). Table 7. Attributes of Pension Registries in Four Countries Attribute Denmark The Netherlands Australia Belgium What sources of retirement income are included?
National, workplace, and personal
Workplace and national Workplace Workplace and
national
How is it financed?
Pension providers voluntarily
Per-participant fee on pension providers
Government general revenue and pension industry tax
Government general revenue
What was impetus for registry?
To help individuals track multiple accounts and plan for retirement
To help individuals track multiple accounts and plan for retirement
To help individuals track multiple accounts and encourage consolidation
To provide government information for tax and social policy and find lost accounts
Source: U.S. Government Accountability Office (2015).

83
Figure 1. Workers with Pension Coverage by Type of Plan, 1983, 1998, and 2016
Source: Authors’ calculations from U.S. Board of Governors of the Federal Reserve System, Survey of Consumer Finances (1983, 1998, 2016). Figure 2. Wealth of Typical Household with Head Ages 55-64, 2016
Notes: Amounts are for the mean of the middle 10 percent based on net worth. Data are not conditional of having the asset. Source: U.S. Board of Governors of the Federal Reserve System, Survey of Consumer Finances (2016).
62%
12%
26%24%
60%
16%17%
73%
10%
0%
20%
40%
60%
80%
Defined benefit only Defined contribution -401(k) plans - only
Both
198319982016
$301,300
$153,700
$93,659
$40,417 $16,797 $16,212
$0
$100,000
$200,000
$300,000
$400,000
SocialSecurity
Definedbenefit
Primaryhouse
Definedcontribution
Financialassets
Other assets
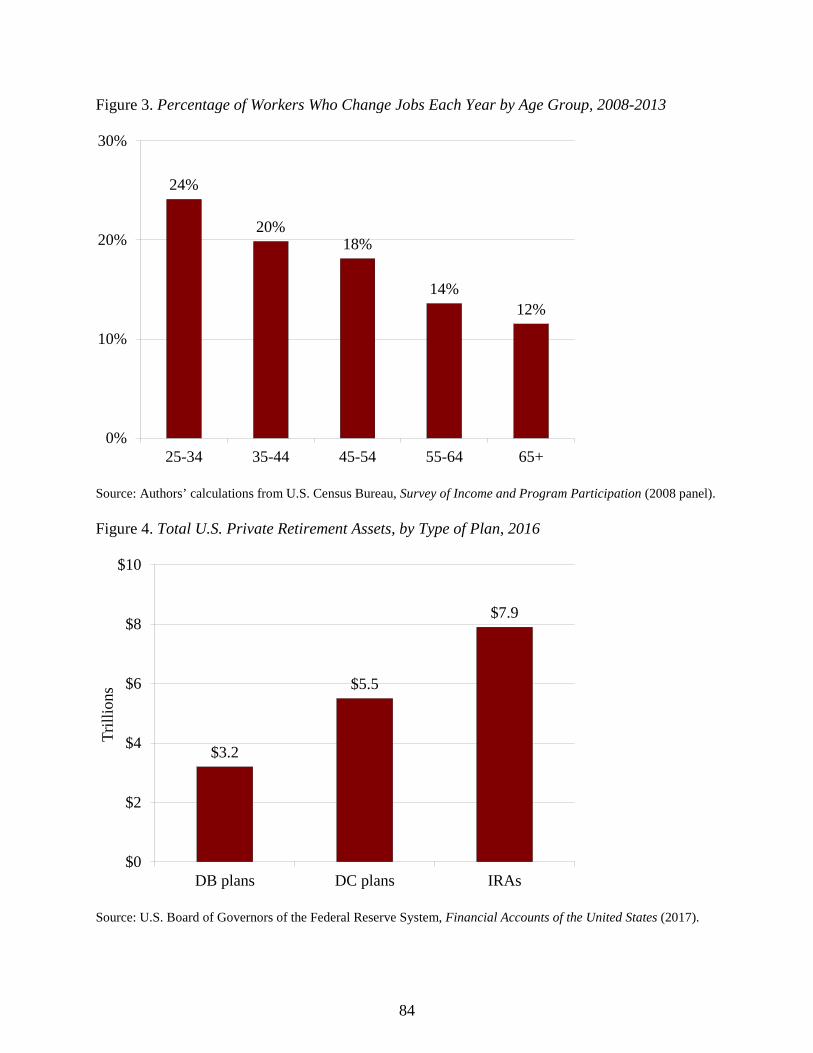
84
Figure 3. Percentage of Workers Who Change Jobs Each Year by Age Group, 2008-2013
Source: Authors’ calculations from U.S. Census Bureau, Survey of Income and Program Participation (2008 panel). Figure 4. Total U.S. Private Retirement Assets, by Type of Plan, 2016
Source: U.S. Board of Governors of the Federal Reserve System, Financial Accounts of the United States (2017).
24%
20%18%
14%12%
0%
10%
20%
30%
25-34 35-44 45-54 55-64 65+
$3.2
$5.5
$7.9
$0
$2
$4
$6
$8
$10
DB plans DC plans IRAs
Trill
ions

85
Figure 5. Distribution of Participants in Defined Contribution Plans by Average Fees as Share of Assets, 2013
Sources: Authors’ estimates from U.S. Department of Labor, Form 5500 Private Pension Plan Bulletin (2013) and BrightScope and Investment Company Institute (2014). Figure 6. Vanguard 401(k) Leakages as Percentage of Total 401(k) Assets by Type of Leakage, 2015
Source: Authors’ depiction based on Vanguard (2016).
7.0%
72.5%
26.6%
1.0%-3.0% 0.5%-1.0% Less than 0.5%
0.2%0.2%
0.2%
0.5%
0.0%
0.2%
0.4%
0.6%
Hardship Post 59 Loan Cashed-out½

86
Figure 7. Estimated Impact of Leakages on 401(k) and IRA Assets at Age 60
Note: The data show assets with and without leakages based on assumptions for a prototypical worker. Source: Munnell and Webb (2015). Figure 8. Pension Sponsorship and Participation in the Private Sector, Ages 25-64, 1979-2014
Note: The Figure includes 2014 data, but 2013 data are emphasized in the report because of the inexplicable dip in 2014. Source: Authors’ calculations from U.S. Bureau of the Census, Current Population Survey (1980-2015).
$272,000
$110,000
$203,000
$85,000
$0
$100,000
$200,000
$300,000
401(k)s IRAs
Without leakagesWith leakages
25%
50%
75%
1979 1984 1989 1994 1999 2004 2009 2014
Employer offers, public and private, full-timeEmployer offers, private, full-timeEmployer offers, privateEmployee participates, private, full-timeEmployee participates, private
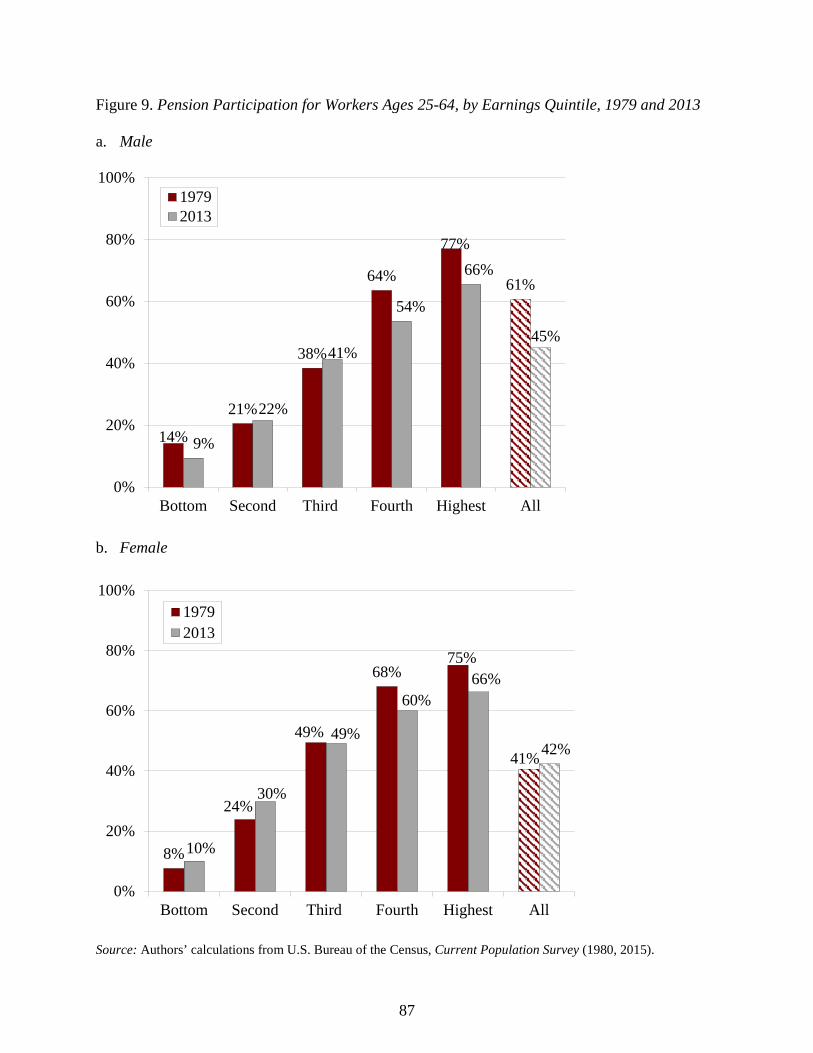
87
Figure 9. Pension Participation for Workers Ages 25-64, by Earnings Quintile, 1979 and 2013 a. Male
b. Female
Source: Authors’ calculations from U.S. Bureau of the Census, Current Population Survey (1980, 2015).
14%
21%
38%
64%
77%
61%
9%
22%
41%
54%
66%
45%
0%
20%
40%
60%
80%
100%
Bottom Second Third Fourth Highest All
19792013
8%
24%
49%
68%75%
41%
10%
30%
49%
60%66%
42%
0%
20%
40%
60%
80%
100%
Bottom Second Third Fourth Highest All
19792013
88
Figure 10. Workers Whose Employer Does Not Sponsor a Pension Plan, 2014
Note: Figure shows full-time, full-year, civilian, non-farm private wage and salary earners ages 25-64. Source: Authors’ calculations from U.S. Bureau of the Census, Current Population Survey (2015). Figure 11. Players in the 401(k) Industry and Functions that They Perform Note: Each industry player provides services. The arrows indicate who receives specific services. Source: Barstein (2012).
More than 100
employees, 43.6%
Fewer than 100
employees, 56.4%
Plan sponsors Service
Record keepers & TPAs Investments
Investment managers
Broker dealers
Compliance & trading
Plan advisors
Advice & guidance
Plan participants
89
Figure 12. 401(k) Plan Cost as Percentage of Assets
Source: Alfred (2015). Figure 13. Percentage of Households (Head Ages 63-73) with Assets from an Employer-Sponsored Plan, by Income Quintile, 2012
Source: Authors’ calculations from University of Michigan, Health and Retirement Study (1992-2012).
22%
57%
78%83% 82%
69%
0%
20%
40%
60%
80%
100%
Lowest Second Third Fourth Highest Total
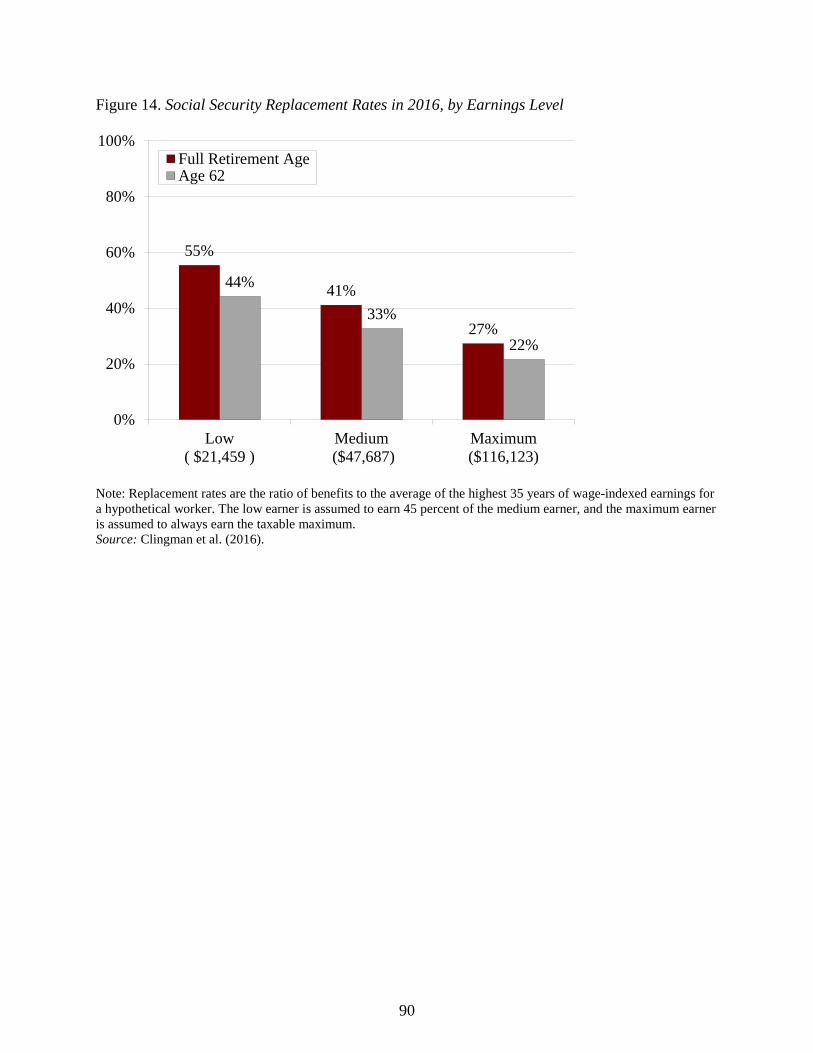
90
Figure 14. Social Security Replacement Rates in 2016, by Earnings Level
Note: Replacement rates are the ratio of benefits to the average of the highest 35 years of wage-indexed earnings for a hypothetical worker. The low earner is assumed to earn 45 percent of the medium earner, and the maximum earner is assumed to always earn the taxable maximum. Source: Clingman et al. (2016).
55%
41%
27%
44%
33%
22%
0%
20%
40%
60%
80%
100%
Low( $21,459 )
Medium ($47,687)
Maximum($116,123)
Full Retirement AgeAge 62

91
Figure 15. Median 401(k)/IRA Balances for Working Households Ages 55-64 with 401(k) Plans and Simulated Accumulations, 2016
Note: Simulation assumes a worker starting at age 25 in 1981 (about when 401(k)s started, but were not yet widespread) with median earnings, who contributed a steady 6.0 percent with an employer match of 3.0 percent. Assets are split 50/50 between stocks and bonds and are assumed to earn real stock and bond returns of 6.6 percent and 2.3 percent, respectively, and real wages are assumed to grow at 1.1 percent per year. Sources: Authors’ calculations from U.S. Board of Governors of the Federal Reserve System, Survey of Consumer Finances (2016); and authors’ estimations.
$364,000
$135,000
$0 $100,000 $200,000 $300,000 $400,000
Simulated
Actual

92
Figure 16. Percentage of Households “At Risk” of Being Unable to Maintain Living Standards in Retirement, 2013
Note: “At risk” is defined as a household that has an estimated retirement income replacement rate that is more than 10 percent short of its target rate. Source: Munnell, Hou, and Webb (2014). Figure 17. Share of Uncovered Workers by Reason Uncovered, 2014 Sources: Authors’ analysis from U.S. Census Bureau, Current Population Survey (2015) (for pie chart on the left) and U.S. Census Bureau, Survey of Income and Program Participation (1996, 2004, and 2008 panels) (for pie chart on the right).
60%
52%
43%
52%
0%
10%
20%
30%
40%
50%
60%
70%
Low Middle High AllIncome group
Self-employed, 14%
Plan at work, not included,
22%
No plan at work, 65%
Low tenure, 26%
Part-time, 23%
Job type, 9%
Too old/ too young, 3%
Eligible non-participant,
40%
93
Figure 18. Reasons Cited by Small Employers as the Most Important for Not Offering a Retirement Plan, 2017
Source: The Pew Charitable Trusts (2017). Figure 19. Retirement Plan with 100 or More Participants by Type, 2014:
Note: Participants include active workers, separated workers, retired workers who are not receiving benefits, and plan beneficiaries. Source: Authors’ calculations from U.S. Department of Labor, Form 5500 Database (2014).
37%
22%17%
7% 5%1%
11%
0%
10%
20%
30%
40%
50%
80,653
2,392 2,1590
25,000
50,000
75,000
100,000
Single employerplans
Multiemployer plans Multiple employerplans
(MEPs)
94
Figure 20. State Retirement Security Activity, as of June 2016
Source: Authors’ analysis. Figure 21. Percentage of Workers by IRA-Contribution Status in Tax Year 2014
Source: Investment Company Institute (2016).
Owned IRA but did not contribute,
18%
Contributed to IRA,
14%Did not own
IRA, 68%
Failed legislative initiative No activity
Active legislative initiative Auto-IRA enacted Marketplace enacted
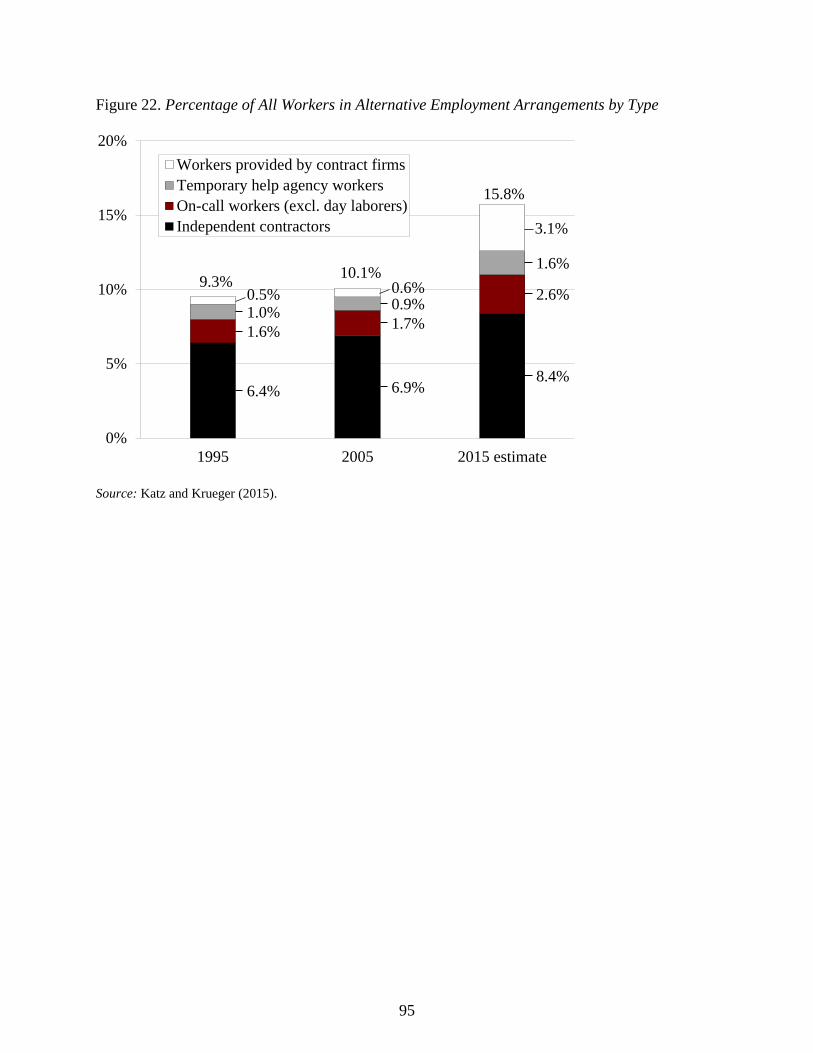
95
Figure 22. Percentage of All Workers in Alternative Employment Arrangements by Type
Source: Katz and Krueger (2015).
6.4% 6.9%8.4%
1.6% 1.7%
2.6%1.0% 0.9%
1.6%
0.5% 0.6%
3.1%
0%
5%
10%
15%
20%
1995 2005 2015 estimate
Workers provided by contract firmsTemporary help agency workersOn-call workers (excl. day laborers)Independent contractors
15.8%
10.1%9.3%