an analysis of perceived constraints to outdoor recreation
TRANSCRIPT

52
An Analysis of Perceived Constraints to Outdoor Recreation
Volume 32, Number 4 pp. 52–67
Journal of Park and Recreation AdministrationWinter 2014
Ramesh GhimireGary T. GreenNeelam C. PoudyalH. Ken Cordell
EXECUTIVE SUMMARY: Outdoor recreation has been an integral part of American life for many decades. While overall participation in outdoor recreation is expected to grow with the population, participation per capita is expected to decline partly because of projected structural change in socio-
among ethnic and marginalized groups in terms of their interest in and constraints toward participating in outdoor recreation. However, due to limited sample size and geographic coverage, many studies often failed to examine the perceived constraints faced by these ethnic and marginalized groups. This study, taking advantage of a national level household survey, analyzed whether ethnic minorities—African-Americans, American-Indians, Asians, and native Hawaiians—and marginalized groups, such as rural dwellers, females, and older people in American society perceived more constraints to outdoor recreation activities than their counterparts (Whites, urban dwellers, males, and younger people). Seventeen constraints related to health, safety, socioeconomic standing, and other personal or psychological factors were examined employing logistic regression model. Results indicated ethnic minorities, older people, females, and rural dwellers perceived more constraints to outdoor recreation than their respective counterparts. Comparing these results to an earlier study, marginalized groups in American society perceive more constraints today than a decade ago to outdoor recreation. Hence, outdoor recreation planning and management
limitations and barriers to outdoor recreation encountered by different socio-demographic and ethnic groups. Furthermore, as many of these constraints were related to personal safety, language, money, time, and transport, agencies may have the ability to help ameliorate many of these constraints through localized actions. For instance, the personal safety constraint may be addressed by making recreation sites physically safer (i.e., better lighting, promoting a user buddy system). Language-related constraints could be reduced by making information available in multiple languages. Some money-related constraints may be addressed by adopting discriminating prices policies to different visitors. Time- and transport-related constraints may be somewhat addressed by connecting public parks and recreation sites to public transport routes. As the share of ethnic minorities and elderly people in American population is expected to increase in

53
the future, innovation in outreach, marketing, and recruitment may be needed to increase their participation to outdoor recreation.
KEYWORDS: ethnic minorities, marginalized groups, outdoor recreation, perceived barriers/constraints, underparticipation AUTHORS: Ramesh Ghimire is with the Warnell School of Forestry and Natural Resources, University of Georgia, 180 E. Green Street, Athens, GA 30602-2152, Phone: 706 542 3098, [email protected]. Gary T. Green is also with the Warnell School of Forestry and Natural Resources, University of Georgia. Neelam C. Poudyal is with the Department of Forestry, Wildlife, and Fisheries, University of Tennessee. H. Ken Cordell is with the USDA Forest Service, Southern Research Station.
Participation in outdoor recreation has increasingly become a part of American culture
(Cordell, 2008; United States Forest Service, 2010) and is often used as a measure of people’s social well-being (Godbey, Roy, Payne, & Orsega-Smith, 1998; Tinsley, Tinsley, & Croskeys, 2002). Outdoor recreation is also considered a fundamentally important and
activities is evident by more than 140 million (44%) Americans who recently indicated outdoor recreation was a priority of their daily lives (Outdoor Foundation, 2012). Furthermore, participation in outdoor recreation activities in the United States grew by 4.4% from 1999 to 2008 (i.e., 208 million to 217 million estimated participants) (Cordell, 2008). At the same time, the number of days of participation across all participants and activities increased from 67 billion to 84 billion (Cordell, Betz, Green, & Mou, 2008). However, some studies have also found that certain marginalized groups in American society (for instance, ethnic minorities, women, rural dwellers, and older people) are less likely/willing to participate in outdoor recreation than their counterparts (Bialeschki, 1999; Crespo, Smit, Andersen, Carter-Pokras, & Ainsworth, 2000; Green, Bowker, Wang, Cordell, & Johnson, 2012; Sasidharan, 2001). In other words, these groups perceive more barriers to outdoor recreation or are more constrained in some manner from participating in outdoor recreation activities than their counterparts.
Analyzing constraints to outdoor recreation started in the 1970s and was substantially expanded during the 1990s (Crawford, Jackson, & Godbey, 1991; Henderson, 1991). Earlier studies focused mainly on racial or gender differences, while recent studies have expanded the contours of this research, analyzing the role of socioeconomic and demographic factors such as income, education, age, and residency location in addition to racial and gender differences (Arnold & Shinew, 1998; Floyd, Nicholas, Lee, Lee, & Scott, 2006; Green et al., 2012; Johnson, Bowker, & Cordell, 2001). Additionally, some studies have examined how social inequality (e.g., access, services, health) also serve to constraint these marginalized groups from participating in outdoor recreation (Jackson, 2005). However, because of sample size and geographic coverage, many previous studies
African-Americans, females, and rural dwellers. While share of Asian, and other ethnic groups, and elderly population is expected to rise in the future because of immigration, high growth of Asian, and other ethnic groups, and ageing of “baby boomers,” limited studies have analyzed perceived constrains faced by these groups to outdoor recreation.
ethnic minorities and marginalized groups, this study aimed to analyze whether African-Americans, American Indians, Asians, native Hawaiians, older people, females, and rural dwellers perceived more barriers to outdoor recreation compared to their respective counterparts in the United States.

54
Literature ReviewLiterature indicates minority groups participate in outdoor recreation activities at
lower levels or engage in different forms of activities. Two theories have been invoked to explain this underparticipation of minorities in leisure activities: the marginality and ethnicity hypotheses. The marginality hypothesis emphasizes minority status as a causal factor in explaining underparticipation among minorities. Stated differently, by occupying a subordinate class position, minorities have had limited access to society’s
leisure or recreation participation (Floyd, Shinew, McGuire, & Noe, 1994).The ethnicity or subcultural hypothesis states minorities’ underparticipation or intergroup variations result from differences between racial or ethnic groups in values systems, norms, and socialization patterns (Floyd et al., 1994). That is, subcultures (e.g., African-Americans,
recreation behavior. Washburne (1978), Woodard (1988), and West (1989) found support for the
marginality hypothesis (i.e., historic discrimination caused minorities to lack the economic and educational resources to participate in leisure activities). Conversely, Klobus-Edwards (1981) and Stamps and Stamps (1985) found support for the ethnicity hypothesis. Furthermore, sociopsychological factors could also be instrumental to understanding perceived constraints to outdoor recreation activities by minorities (Johnson, 1998; Virden & Walker, 1999; Williams, Patterson, Roggenbuck, & Watson, 1992). For instance, immigrants may experience more barriers to participate in outdoor recreation activities
(Rublee & Shaw, 1991; Stodolska, 1998; Yu & Berryman, 1996). In research among Hispanic populations, a total of 40% of Hispanics aged 45 and over mentioned language as a barrier to outdoor recreation activities (Adams, Baskerville, Lee, Spruiell, & Wolf, 2006).
Literature also indicates that females do not have as many opportunities to participate in recreational activities compared to their male counterparts (Henderson & Allen, 1991; Lee, Scott, & Floyd, 2001). According to Rojek (1985), women experience “a unique set of barriers to participate in outdoor recreation. These barriers relate both to the gender role structure imposed on women from a male-dominated society and from concerns women have as sexual objects in any male-dominated society” (p. 18). Henderson and Allen (1991) also indicated constraints, such as lack of time, interest, money, facilities, and opportunities are associated with low levels of female participation in recreation activities. Females might also have different recreation preferences than males. For instance, some females prefer to participate in social meetings regarding family care and home issues rather than participating in outdoor activities (Lee et al., 2001). Another constraint on female recreational activities is fear of crime. Females are more likely to consider safety issues than men (Frederick & Shaw, 1995; Shaw, 1999; Whyte & Shaw, 1994).
resources, income and education are likely to support the outdoor recreation participation culture (Clarke, 1956; Gramann & Allison, 1999; Lee et al., 2001). Income contributes to
1996). In examining park visitation by people of low income, Scott and Munson (1994) found “income was the single best predictor of perceived constraints to park visitation” (p. 79). Likewise, Lucas (1990) found 60% to 80% of park visitors in the United States throughout the year were college graduates. Furthermore, people with lower incomes were more likely to face other barriers such as lack of transportation (Johnson et al., 2001).
Individuals also pursue different recreation activities according to where they are in their lifespan (Levinson, 1986). Older people tend to participate less in outdoor recreation activities because of physical constraints and ageism (Gross, Gross, & Seldman, 1978; Iso-Ahola, Jackson, & Dunn, 1994). The physical constraints are often caused by declining biological functions that occur with increased age that lead older people to avoid outdoor recreation and to participate more in social and family activities (Floyd et al., 2006). Likewise, ageism creates constraints as older people are skeptical about their abilities and
55
their socialization skills (Wearing, 1999). For instance, Kelly (1980), in an empirical study, found individuals tend to participate less in outdoor recreation as they get older, instead spending more time on social and family activities.
Rural recreation programs tend to have less funding opportunities available for facility development than nonrural areas, due to lower income and tax base of local government (Scott, 2013). Hence, rural dwellers might have fewer opportunities to participate in outdoor recreation activities compared to urban dwellers (Green et al., 2012; Johnson et al., 2001).
Preceding literature suggests ethnic minorities and marginalized groups are likely to face more constraints to outdoor recreations compared to their counterparts. Hence, building upon previous studies, this study examined whether ethnic minorities, females, older people, and rural dwellers perceived more constraints to outdoor recreation activities compared to their respective counterparts in the United States.
Method
The National Survey on Recreation and the EnvironmentThis study used outdoor recreation participation data from the National Survey on
Recreation and the Environment (NSRE). The NSRE is an ongoing, nationwide household survey, dating back to the Outdoor Recreation Resources Review Commission of 1960 (Cordell et al., 1999). The NSRE is a random-digit-dialed telephone survey of individuals, aged 16 or older, living in United States households. The NSRE represents only civilian, noninstitutionalized Americans (people who are not in retirement facilities, hospitals, and military forces), 16 years of age or older in the United States. The NSRE telephone
locations. Each version consisted of modules of questions, and each version was tested to ensure an average time of 15 minutes to complete. Approximately 5,000 people were surveyed in each version. Some oversampling was done to ensure a minimum sample size of 500 per state (across all versions) or for some modules that focus on rural outdoor recreation use (i.e., oversampling of people living in rural areas). U.S. Department of Commerce, Bureau of the Census, and 2000 Census data was used to construct post-sample weights to correct for oversampling. Both English and Spanish versions of the questionnaires were used, and interviews were conducted bilingually to overcome language barriers.
This study used data from the NSRE conducted in 2004 (NSRE, 2004). The survey was conducted using a computer-aided telephone interviewing system (CATI). The CATI system randomly selects a telephone number, the interviewer upon hearing someone answer inquires how many people in the household are 16 years or older. The person with the most recent birthday is selected for interviewing (Link & Oldendick, 1998; Oldendick, Bishop, Sorenson, & Tuchfarber, 1988). Approximately 5,000 samples were collected; however, only 3,052 samples were used because of nonresponse errors and/or missing values in one or more of the covariates. Table 1 shows description and summary statistics of the explanatory variables used in this study. A set of dummy variables was used to see whether ethnic minorities and marginalized groups perceived more constraints to outdoor recreation compared to their respective counterparts. The income variable was measured using a scale of 1–11 and the education variable was measured using a scale of 1–9, with higher values in both scales denoting higher levels (Table 1).
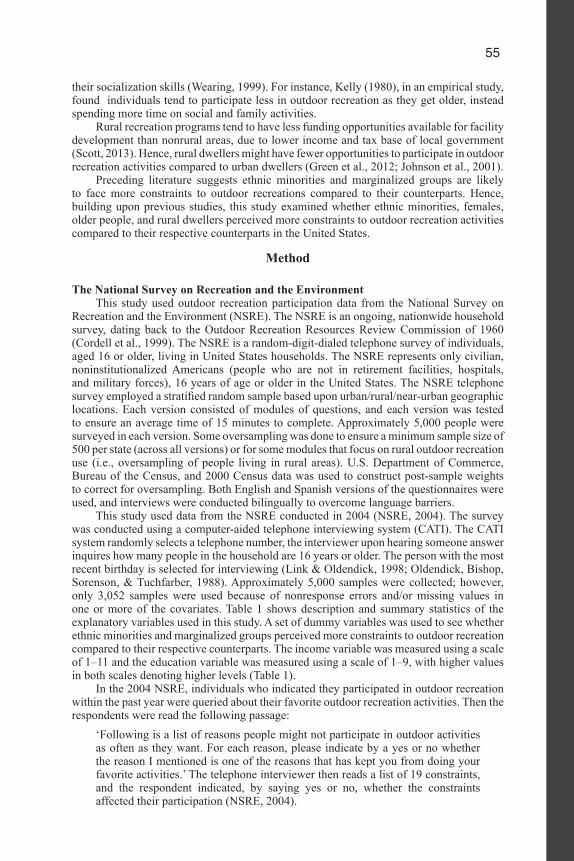
In the 2004 NSRE, individuals who indicated they participated in outdoor recreation within the past year were queried about their favorite outdoor recreation activities. Then the respondents were read the following passage:
‘Following is a list of reasons people might not participate in outdoor activities as often as they want. For each reason, please indicate by a yes or no whether the reason I mentioned is one of the reasons that has kept you from doing your favorite activities.’ The telephone interviewer then reads a list of 19 constraints, and the respondent indicated, by saying yes or no, whether the constraints affected their participation (NSRE, 2004).

56
of work; not enough time because of family, childcare, or other in-the-home obligations; and not enough time because of volunteer work or other outside obligations) were all time related, they were merged and labeled as “not enough time.” Hence, a set of 17 constraints that were likely to affect individuals’ outdoor recreation participation were examined (Table 2). For robustness of the results, the 17 constraints were grouped into three broad categories: intrapersonal, interpersonal, and structural constraints as per Crawford and Godbey (1987) and Crawford et al. (1991) (Table 2). Each constraint was also coded 1, if an individual felt his/her outdoor recreation participation was constrained by any of the factors listed in each category in Table 2, and zero otherwise.
Econometric ModelProbability of being constrained from outdoor recreation was modeled as a function
of individuals’ socioeconomic and demographic characteristics. To examine whether ethnic minorities and marginalized groups perceived more constraints to outdoor recreation than their counterparts, dummies were created for variables representing the ethnic minorities and marginalized groups (African-Americans=1, American-Indians=1, Asians=1, Native Hawaiians=1, rural resident=1, females=1, and old people (66–99 years of age) =1) and included in the model. The differences in climate, topography, culture, and availability of outdoor recreation resources across the United States may also lead to regional variations
United States Forest Service (2014)).
p y ( p )Variable Description Mean Min Max Ethnicity; African American =1 A dummy that equals one if respondent was African
American, and zero otherwise 0.07 0 1 Ethnicity; American Indian =1 A dummy that equals one if respondent was African
Indian, and zero otherwise 0.02 0 1 Ethnicity; Asian =1 A dummy that equals one if respondent was Asian, and
zero otherwise 0.01 0 1 Ethnicity; Native Hawaiians =1 A dummy that equals one if respondent was Native
Hawaiians, and zero otherwise 0.05 0 1 Residency location; rural resident=1 A dummy that equals one if respondent belonged to
rural area, and zero otherwise 0.35 0 1 Gender; females =1 A dummy that equals one if respondent was female,
and zero otherwise 0.53 0 1 Age; age group 16-35 =1 A dummy that equals one if respondent belonged to the
16-35 year group, and zero otherwise 0.32 0 1 Age; age group 66-99 =1 A dummy that equals one if respondent belonged to the
66-99 year group, and zero otherwise 0.10 0 1 Income Income of respondent in a scale from 1-11, with higher
value in scale denoting higher income 7.11 1 11 Education Education level of respondent in a scale from 1-9, with
higher value in scale denoting higher level of education 4.65 1 9 Geographic region; South =1 A dummy that equals one if respondent belonged to
Southern region, and zero otherwise 0.26 0 1 Geographic region; Pacific =1 A dummy that equals one if respondent belonged to
Pacific region, and zero otherwise 0.13 0 1 Geographic region; North =1 A dummy that equals one if respondent belonged to
Northern region, and zero otherwise 0.44 0 1 Note: All constraints (17 factors that individual may perceive as barrier in their outdoor recreation) examined were binary variable that equaled one if respondent perceived barrier in outdoor recreation by that particular factor, and zero otherwise. For age, age group 36-65 is reference category; for ethnicity, White is reference category; and for geographic region, Rocky Mountain is reference category.
Table 1Description and Summary Statistics of Variables Used (Sample Size = 3,054)

57
Since the dependent variable (responses of individuals regarding being constrained in outdoor recreation) is binary (1 if they felt constrained by factors mentioned in Table 2, and zero otherwise), a logistic regression was used in preference over an ordinary least square (OLS) for two reasons. Frist, the logistic regression ensures the probability range is between zero and one. In contrast, the OSL does not ensure the probability estimate will be between zero and one. Second, since the dependent variable is binary, the constant variance (homoscedasticity) assumption of the OLS is violated, whereas the logistic regressions
exp(XB) Prob(constrained)= 1+exp(XB) (1)
where, Prob (constrained) is the probability that individuals perceived constrained by certain factors (listed in Table 2) to outdoor recreations, X is a vector of explanatory variables (socioeconomic and demographic characteristics—residency location, age, gender, ethnicity, income, and education; and geographic region dummies) and B is a vector of parameters to be estimated.
Constraints* Constraints Structural constraints • Not enough time (because of my job and long hours of work; because
of family, childcare, or other in-the-home obligation; or because of voluntary work or other outside obligations);
• Not enough money • Poorly maintained activity areas • Inadequate information on places to do activities • Inadequate transportation • Crowded activity areas • Inadequate facilities in activity areas • Pollution problems in activity areas
Intrapersonal constraints • Personal safety problems in activity areas
• Outdoor pests • Feel unwelcome or uncomfortable at many outdoor recreation areas • Language barriers, can't understand the language • Feel afraid in forest or other natural settings • Physically limiting condition • Personal health reasons
Interpersonal constraints • No companion, no one to do activities with
• Disability in household member Note: *Although there are different ways to categorize the constraints, Crawford et al. classification is widely accepted in conceptualizing constraints to outdoor recreation. According to them, constraints to outdoor recreation can be grouped into three categories—structural, intrapersonal, and interpersonal constraints. Structural constraints refer to those factors seen to come between recreational preferences and actual participation (e.g., family life-cycle stage, lack of family financial resources, season, climate, the scheduling of work time, availability of opportunity, and reference group attitudes concerning the appropriateness of participating in the outdoor activities (Crawford & Godbey, 1987). Intrapersonal constraints are those factors occurring before recreational preferences are formed. These constraints deal with individual psychological states that focus more on the effect on leisure preferences than actual participation. Examples of intrapersonal barriers include stress, depression, anxiety, religiosity, kin and non-kin reference group attitudes, prior socialization into specific leisure activities, perceived self-skill, and subjective evaluations of the appropriateness and availability of the leisure activities (Whiting, 2012). Finally, interpersonal constraints are socially based and limit the relationship between individuals’ characteristics and interact with both preference for, and subsequent participation in, recreational activities (Crawford & Godbey, 1987). According to Crawford and Godbey (1987), these social factors are relevant when an individual is unable to locate a suitable partner who desires to participate in the outdoor activities. Hence, the lack of friends and/or family who prefer similar outdoor activities can be thought as interpersonal constraints.
Table 2Constraints to Outdoor Recreation

58
Results
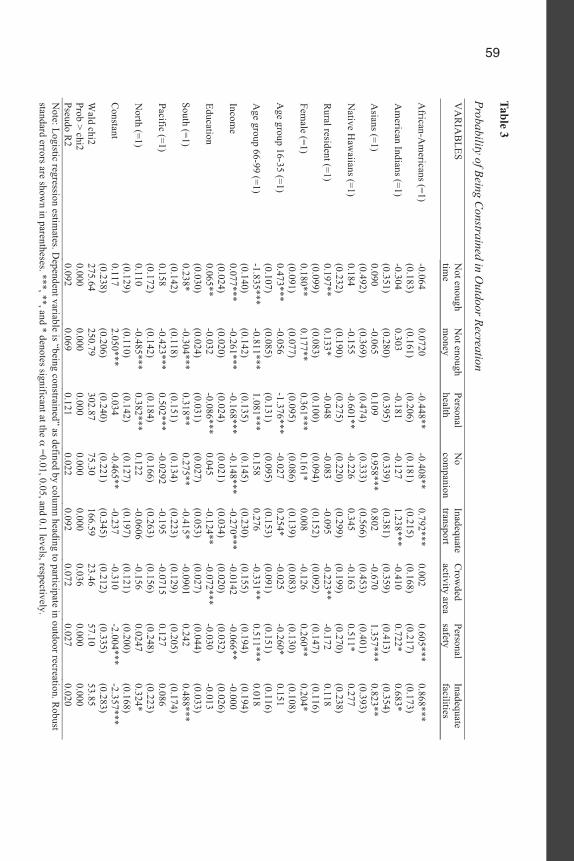
Logit Estimates for Perceived Constraints to Outdoor RecreationTable 3 summarizes the estimate for each constraint equation, shown by the column
Ethnicity. Four dummies were used to see whether ethnic minorities perceived more constraints to outdoor recreation than Whites. The African-Americans dummy was
inadequate facilities, poor maintenance, pollution problem, inadequate information, physical limiting conditions, member disability, outdoor pests, feel unwelcome, language
(personal health and no companion) at a 10% level or better.
(inadequate transport, personal safety, inadequate facilities, inadequate information, feel unwelcome, language barriers, and afraid in natural settings) at a 10% level or better.
personal safety, inadequate facilities, inadequate information, and physical limiting
in three constraint equations (personal safety, language barriers, and afraid in natural
level or better. Rural resident.
constraint equations (crowded activities area and feel unwelcome) at a 10% level or better. Females.
(not enough time, not enough money, personal health, no companion, personal safety, inadequate facilities, inadequate information, outdoor pests, and afraid in natural settings)
better. Age.
equations (not enough time, inadequate transport, poor maintenance, and inadequate
personal safety, physical limiting condition, member disability, outdoor pests, and feel
equations (personal health, personal safety, physical limiting condition, and member
enough money, crowded activity area, and inadequate information). Income.
equations (not enough money, personal health, no compassion, inadequate transport, personal safety, pollution problem, inadequate information, physical limiting conditions, member disability, outdoor pests, feel unwelcome, language barriers, and afraid in natural
level or better. Education.
(personal health, inadequate transport, crowded activities area, poor maintenance, physical limiting condition, member disability, feel unwelcome, and language barriers) and
Geographic regions. equations (not enough time, personal health, no companion, inadequate facilities, pollution
59
yg
VA
RIA
BLES
Not enough
time
Not enough
money
Personal health
No
companion
Inadequate transport
Crow
ded activity area
Personal safety
Inadequate facilities
African-A
mericans (=1)
-0.064 0.0720
-0.448** -0.408**
0.792*** 0.002
0.605*** 0.868***
(0.183)
(0.161) (0.206)
(0.181) (0.215)
(0.168) (0.217)
(0.173) A
merican Indians (=1)
-0.304 0.303
-0.181 -0.127
1.238*** -0.410
0.722* 0.683*
(0.351)
(0.280) (0.395)
(0.339) (0.381)
(0.359) (0.413)
(0.354) A
sians (=1) 0.090
-0.065 0.109
0.958*** 0.802
-0.670 1.357***
0.823**
(0.492) (0.369)
(0.474) (0.333)
(0.566) (0.453)
(0.401) (0.393)
Native H
awaiians (=1)
0.184 -0.155
-0.601** -0.226
0.345 -0.163
0.511* 0.277
(0.232)
(0.190) (0.275)
(0.220) (0.299)
(0.199) (0.270)
(0.238) R
ural resident (=1) 0.197**
0.133* -0.048
-0.083 -0.095
-0.223** -0.172
0.118
(0.099) (0.083)
(0.100) (0.094)
(0.152) (0.092)
(0.147) (0.116)
Female (=1)
0.180** 0.177**
0.361*** 0.161*
0.008 -0.126
0.260** 0.204*
(0.091)
(0.077) (0.095)
(0.086) (0.139)
(0.083) (0.130)
(0.108) A
ge group 16-35 (=1) 0.473***
-0.056 -1.376***
-0.027 0.254*
-0.025 -0.260*
0.151
(0.107) (0.085)
(0.131) (0.095)
(0.153) (0.091)
(0.151) (0.116)
Age group 66-99 (=1)
-1.835*** -0.811***
1.081*** 0.158
0.276 -0.331**
0.511*** 0.018
(0.140)
(0.142) (0.135)
(0.145) (0.230)
(0.155) (0.194)
(0.194) Incom
e 0.077***
-0.261*** -0.168***
-0.148*** -0.270***
-0.0142 -0.066**
-0.000
(0.024) (0.020)
(0.024) (0.021)
(0.034) (0.020)
(0.032) (0.026)
Education 0.065**
-0.032 -0.086***
0.045 -0.124**
-0.072*** -0.030
-0.013
(0.030) (0.024)
(0.031) (0.027)
(0.053) (0.027)
(0.044) (0.033)
South (=1) 0.238*
-0.304*** 0.318**
0.275** -0.415*
-0.0901 0.242
0.488***
(0.142) (0.118)
(0.151) (0.134)
(0.223) (0.129)
(0.205) (0.174)
Pacific (=1) 0.158
-0.423*** 0.502***
-0.0292 -0.195
-0.0715 0.127
0.086
(0.172) (0.142)
(0.184) (0.166)
(0.263) (0.156)
(0.248) (0.223)
North (=1)
0.110 -0.485***
0.382*** 0.122
-0.0606 -0.156
0.0247 0.324*
(0.129)
(0.110) (0.142)
(0.127) (0.197)
(0.121) (0.200)
(0.168) C
onstant 0.117
2.050*** 0.034
-0.465** -0.237
-0.310 -2.004***
-2.357***
(0.238) (0.206)
(0.240) (0.221)
(0.345) (0.212)
(0.335) (0.283)
Wald chi2
275.64 250.79
302.87 75.30
166.59 23.46
57.10 53.85
Prob > chi2 0.000
0.000 0.000
0.000 0.000
0.036 0.000
0.000 Pseudo R
2 0.092
0.069 0.121
0.022 0.092
0.072 0.027
0.020 N
ote: Logistic regression estimates. D
ependent variable is “being constrained” as defined by column heading to participate in outdoor recreation. R
obust standard errors are show
n in parentheses. ***, **, and * denotes significant at the =0.01, 0.05, and 0.1 levels, respectively.
Table 3
Probability of Being Constrained in O
utdoor Recreation

60
Table 3 (cont.)
y
g(
)V
AR
IAB
LES Poor m
aintenance Pollution problem
s Inadequate inform
ation Physical lim
iting conditions
Mem
ber disability
Outdoor
pests Feel unw
elcome
Language barriers
Afraid in
natural settings
A
frican-Am
ericans (=1) 0.701***
0.332* 0.706***
0.752*** 0.396*
0.343** 1.094***
1.064*** 1.199***
(0.186)
(0.180) (0.154)
(0.210) (0.221)
(0.160) (0.288)
(0.398) (0.234)
Am
erican Indians (=1) 0.534
0.535 0.633**
-0.721 -1.062
0.395 1.757***
1.521** 1.104**
(0.361)
(0.339) (0.315)
(0.663) (0.725)
(0.330) (0.457)
(0.685) (0.458)
Asians (=1)
0.680 -0.043
0.905*** 1.102**
0.323 0.529
0.631 1.250
0.143
(0.416) (0.460)
(0.337) (0.444)
(0.609) (0.383)
(1.104) (1.022)
(0.744) N
ative Haw
aiians (=1) 0.204
0.232 0.243
-0.372 -0.379
-0.036 -0.372
1.171*** 1.085***
(0.238)
(0.222) (0.195)
(0.353) (0.350)
(0.212) (0.548)
(0.425) (0.297)
Rural resident (=1)
0.059 -0.157
0.008 -0.059
0.130 0.105
-0.402* -0.091
-0.083
(0.118) (0.112)
(0.096) (0.128)
(0.135) (0.091)
(0.221) (0.309)
(0.187) Fem
ale (=1) -0.125
-0.051 0.249***
-0.079 0.020
0.883*** -0.132
-0.485* 1.067***
(0.109)
(0.101) (0.087)
(0.122) (0.128)
(0.087) (0.216)
(0.271) (0.189)
Age group 16-35 (=1)
0.194* 0.131
0.538*** -0.740***
-0.711*** -0.313***
-0.608** -0.167
-0.209
(0.117) (0.108)
(0.091) (0.158)
(0.159) (0.094)
(0.247) (0.295)
(0.184) A
ge group 66-99 (=1) -0.241
-0.241 -0.868***
1.208*** 0.444**
-0.191 -0.258
0.106 0.211
(0.209)
(0.190) (0.203)
(0.160) (0.182)
(0.150) (0.336)
(0.433) (0.278)
Income
0.007 -0.053**
-0.048** -0.128***
-0.090*** -0.069***
-0.290*** -0.142**
-0.079*
(0.025) (0.024)
(0.021) (0.030)
(0.0318) (0.021)
(0.053) (0.056)
(0.043) Education
-0.126*** -0.035
-0.017 -0.105***
-0.196*** -0.023
-0.203** -0.241**
0.0165
(0.035) (0.033)
(0.027) (0.040)
(0.045) (0.028)
(0.079) (0.115)
(0.057) South (=1)
0.266 0.704***
0.398*** -0.0960
0.197 0.736***
-0.0235 0.894
0.357
(0.177) (0.181)
(0.140) (0.185)
(0.206) (0.137)
(0.318) (0.578)
(0.269) Pacific (=1)
0.306 0.661***
-0.051 -0.0439
0.254 -0.221
-0.224 0.701
0.338
(0.210) (0.209)
(0.176) (0.233)
(0.252) (0.183)
(0.438) (0.665)
(0.318) N
orth (=1) 0.188
0.711*** 0.342***
-0.151 0.278
0.665*** -0.138
1.038* 0.059
(0.166)
(0.172) (0.133)
(0.174) (0.194)
(0.130) (0.303)
(0.567) (0.271)
Constant
-1.652*** -1.705***
-1.304*** -0.638**
-0.896*** -1.299***
-0.348 -2.810***
-3.394***
(0.278) (0.269)
(0.229) (0.292)
(0.320) (0.217)
(0.486) (0.836)
(0.478) W
ald chi2 48.83
48.50 141.08
182.55 92.37
203.26 102.94
51.24 131.30
Prob > chi2 0.000
0.000 0.000
0.000 0.0000
0.000 0.000
0.000 0.000
Pseudo R2
0.019 0.017
0.044 0.086
0.051 0.062
0.116 0.083
0.072 N
ote: Logistic regression estimates. D
ependent variable is “being constrained” as defined by column heading to participate in outdoor recreation. R
obust standard errors are show
n in parentheses. ***, **, and * denotes significant at the =0.01, 0.05, and 0.1 levels, respectively.

61
pollution problem, inadequate information, outdoor pests, and language barriers) and
Robustness of the ResultsFor robustness of the results, the 17 constraints were grouped into three broad
categories: interpersonal, intrapersonal, and structural constraints (Table 2). This study then re-estimated the probability that individuals perceived they were constrained to recreation activities (Table 4).
VARIABLES Interpersonal Constraints
Intrapersonal Constraints
Structural Constraints
African-Americans (=1) -0.232 0.318* 0.240 (0.163) (0.163) (0.307) American-Indians (=1) -0.244 0.235 0.290 (0.318) (0.310) (0.647) Asians (=1) 0.986*** 0.534 0.478 (0.332) (0.334) (0.766) Native Hawaiians (=1) -0.297 -0.031 0.546 (0.206) (0.184) (0.424) Rural resident (=1) -0.039 -0.023 0.255* (0.088) (0.083) (0.153) Female (=1) 0.181** 0.647*** 0.167 (0.081) (0.077) (0.134) Group 16-35 (=1) -0.203** -0.628*** 0.490*** (0.090) (0.085) (0.177) Group 66-99 (=1) 0.244* 0.672*** -1.628*** (0.134) (0.142) (0.169) Income -0.145*** -0.133*** -0.095** (0.020) (0.020) (0.038) Education -0.030 -0.052** 0.059 (0.026) (0.025) (0.045) South (=1) 0.319** 0.455*** -0.090 (0.126) (0.120) (0.213) Pacific (=1) 0.054 0.068 -0.067 (0.155) (0.145) (0.251) North (=1) 0.225* 0.434*** -0.112 (0.119) (0.111) (0.196) Constant 0.140 0.610*** 2.790*** (0.206) (0.195) (0.367) Wald chi2 105.80 262.47 149.67 Prob>chi2 0.000 0.000 0.000 Pseudo R2 0.029 0.068 0.076 Observations 3,054 3,054 3,054 Note: Logistic regression estimates. Dependent variable is “being constrained” as defined by column heading to participate in outdoor recreation. Robust standard errors are shown in parentheses. ***, **, and * denotes significant at the =0.01, 0.05, and 0.1 levels, respectively.
Table 4Probability of Being Constrained in Outdoor Recreation—Robustness of Results

62
Among ethnic groups, African-Americans felt hindered by intrapersonal constraints and Asians felt hindered by interpersonal constraints when compared to Whites. Results also showed rural residents perceived they faced structural constraints to their outdoor recreation. Females perceived they were limited by interpersonal and intrapersonal constraints compared to males. Individuals aged 16–35 felt they had structural constraints, but they perceived they were less hindered by intrapersonal and interpersonal constraints compared to those aged 36–65. In contrast, people aged 66–99 felt hindered by interpersonal and intrapersonal constraints, but they perceived they were less hindered by structural constraints. People with higher incomes perceived they were less hindered by interpersonal, intrapersonal, and structural constraints. People with higher levels of education felt less hindered by intrapersonal constraints. Southerners and Northerners felt more likely to face interpersonal and intrapersonal constraints compared to people in Rocky Mountain.
People who participated in different activities were likely to face different constraints. In Tables 3 and 4, recreation activities were not controlled for because people who feel constrained may be less likely to engage in outdoor recreation activities, leading to potential
of results, outdoor recreation activities were controlled for by grouping them in three broad categories: snow-based, land-based, and water-based, and the constraint equations were re-estimated as in Table 3 (results not shown here, but available upon request). The results
Discussion and Management ImplicationsEthnic minorities and marginalized groups perceived more constraints to outdoor
recreation compared to their respective counterparts, and these constraints were time, money, personal safety, language, and transport related. For African-Americans, American-Indians, Asians, and native Hawaiians, personal safety appeared to be a barrier to outdoor
in outdoor recreation areas may be perceived as threats to personal safety. Urban minorities may be more concerned with possible violence at community recreation sites (Johnson et al., 2001). As suggested by Scott and Munson (1994), local natural resource managers can overcome these constraints by bolstering existing law enforcement programs, including highly visible car and bicycling patrols, facility surveillance, and strategic placement of telephones for receiving and responding distress calls. Likewise, local government units may consider tightening security around public lands such as parks, not only to increase visitation of those public places but also to minimize potential costs over safety-related lawsuits. Additionally, some of these constraints may be eliminated through publicity and provision of relevant information through a variety of outlets.
For three groups—African-Americans, American-Indians, and native Hawaiians— language barriers (e.g., unable to understand English, language on signs, or language spoken at many outdoor recreation areas or activities), and afraid in natural settings were perceived as barriers to participate in outdoor recreation activities. Better education and outreach services help reduce psychological fears associated with natural settings. Language barriers can be partially eliminated by making information available in multiple languages. African-Americans and American-Indians were likely to be constrained by inadequate transportation, inadequate facilities, and feeling unwelcome. The inadequate transportation and inadequate facilities constraints are correlated with socioeconomic characteristics of ethnic minorities in the United States (Scott, 2013). Adding public transportation or re-routing existing public bus lines via parks may alleviate the transportation issue to some extent. Local nature resource managers can eliminate the inadequate facilities constraint by adding physical facilities to their park districts as per expectation of different user groups. Since some visitors may also want to pay premium for the use of their favorite physical

63
facilities (Kebede, Ngandu, Schelhas, & Batalia, 2006), local natural resource managers
To eliminate the feel unwelcome constraint faced by ethnic minorities, recreation and park agencies must strive to be more welcoming to people with different socioeconomic and demographic backgrounds. Although most public park and recreation agencies have adopted employee diversity policies, these efforts are often more symbolic rather than substantive (Allison, 1999). As suggested by Scott (2013), if agencies are to better serve poor and ethnic minorities, principles of inclusion must permeate the organization from top to bottom. Agency employees need to be trained to embrace the principle that ethnic minorities and people with low socioeconomic status deserve the same respect and
Results also showed people in different age groups perceived different factors as constraints to outdoor recreations. For example, compared to their younger counterparts, older people were more likely to be constrained by personal health, personal safety, physical limiting condition, and disability, while younger people were more likely to be constrained by time, transportation, and information. These results are not surprising considering many older people are winding down their careers or are retired, their families
often proceed at a slower pace. Furthermore, since many younger people are at the initial
require them to work longer hours. Although younger people are likely to have greater access/familiarity with many information sources, the results showed they are likely to face information constraints. This information constraint may be explained in light of the fact that much of the information available on recreational opportunities was available in traditional outlets, such as printed outlets as opposed to modern electronic media during the time when the NSRE was conducted. This information constraint may be less relevant these days since almost all state DNRs have pocket ranger or similar smart phone apps for mobile web users.
Females are more likely to be constrained by time, money, personal health, lack of a companion, personal safety, inadequate facilities as well as information, fear of outdoor pests, and discomfort of being in natural settings. Given this connection, women’s participation could be related to Henderson’s (1991) contention that females, more than males, were more conscious of the possibility of assault upon their persons and incorporate these concerns within their daily lives. For instance, women may be more likely than men to carry self-defense devices such as mace or take more precautions when navigating public spaces such as outdoor recreation areas, whether developed or dispersed. That is, females participate in outdoor recreation activities, but with more awareness and a concern for their vulnerability and safety. The perceived constraints of outdoor pests may also indicate that concerns for safety include natural phenomena and not just fear of men alone.
Rural dwellers perceive time and money to be major constraints to outdoor recreation. As poverty is concentrated in rural communities, rural residents don’t have enough money for outdoor recreation, and they also need to work longer hours to earn their livelihoods (Scott, 2013). In this regard, agencies need to make parks and recreation resources more affordable for people with low incomes. Scott (2013) proposed three strategies to eliminate the money-related constraints. First, local natural resource managers can use time-based price discrimination policy (i.e., during low occupancy time, visitors may be granted free pass or access at lower prices and also offer promotional deals). Cleveland Metroparks Zoo, located in Northeast Ohio has started using the time-based price discrimination policy (i.e., giving free access to visitors on every Monday to increase participation of marginalized groups) (Scott 2013). Second, customers may be allowed to volunteer in
residents to participate in outdoor recreations. People perceived many of the constraints were negatively associated with income
and education levels. In fact, as income and education levels increase, people are more

64
these constraints (e.g., personal health, inadequate transportation, and inadequate facilities) can be lowered by income to some extent. Hence state and federal governments’ policies in regard to income and education directly affect outdoor recreation participation rates.
In summary, ethnic minorities and marginalized groups in American society face more barriers to outdoor recreation compared to their respective counterparts. However, in a similar study, Johnson et al. (2001) found ethnic minorities and rural dwellers didn’t perceive more barriers to outdoor recreations compared to their counterparts. Hence, this
today than a decade ago to outdoor recreation.
Conclusion
feel constrained by various factors while participating in outdoor recreation. There is a
and this gap was evident particularly along ethnicity, residency location, gender, and age groups. Stated differently, certain groups in American society, including ethnic minorities, rural dwellers, females, and elderly people perceive more barriers to outdoor recreation than their counterparts. Hence, socioeconomic and institutional factors in American society still favor certain groups to outdoor recreations, though the constitution assures all individuals to be treated equally. As the modern approach of public health and human well-
the need for public policies as well as private investment in removing these barriers and make outdoor resources affordable and enjoyable to a bigger population.
Rampant urbanization, land-use change, and decline in natural base (forest, game population), which are key to many activities of outdoor recreation, are often linked to declines in recreation participation in metro areas. Recent studies have also concluded that structural changes in population, such as the browning and graying of America, may lead to declines in participation in certain consumptive recreation activities such as hunting
constrained and the share of these groups in American population is expected to expand with immigration, the high growth of Hispanic and Asian populations, and the aging of baby boomers, the cumulative impact of a business-as-usual policy on the outdoor recreation
may be needed to increase Americans’ participation in outdoor recreation.Two caveats of this study should be noted. First, the survey was conducted in 2004.
It should be noted that participation rates and several socioeconomic factors may have changed since then. However, the objective of this study was to look at the relationship between the characteristics of individuals and their ability to participate in outdoor recreation under different circumstances, and hence these changes are proportional and do not affect the nature of relationship. Regardless, the NSRE remains one of the most comprehensive datasets for this type of analysis to have generalizability at a national or regional level. Second, this study does not take into account factors that were not discussed in leisure constraint literature but are increasingly believed to have an impact on outdoor recreation. For example, changing climate, economic downturn, electronic media, and emergence
leisure time and how that will impact overall participation on outdoor recreation of various
meaningful, consistent with outdoor recreation participation literature, and are still relevant to understanding perceived constraints faced by people with different socioeconomic and demographic characteristics to outdoor recreation in American society.

65
ReferencesAdams, L., Baskerville, K., Lee, D., Spruiell, M., & Wolf, R. (2006). The Hispanic
communities and outdoor recreation. http://www.outdoorfoundation.org/pdf/ResearchHispanic.pdf
Allison, M. T. (1999). Organizational barriers to diversity in the workplace. Journal of Leisure Research, 31(1), 78–101.
Arold, M., & Shinew, K. (1998). The relationship of gender, race, and income on park use constraints. Journal of Park and Recreation Administration, 16, 39–56.
Bialeschki, M. D. (1999). Physical activity for women: What park and recreation departments can do. Journal of Physical Education, Recreation & Dance, 70(3), 36–39.
Clarke, A. C. (1956). The use of leisure and its relation to levels of occupational prestige. American Sociological Review, 21(3), 301–307.
Cordell, H. K. (2008). The latest on trends in nature-based outdoor recreation. Forest History Today, 2008(Spring), 4–10.
Cordell, H. K., Betz, C. J., Bowker, J. M., English, D. B. K., Johnson, C. Y., Mou, S. H., . . . Loomis, J. (1999). Outdoor recreation in American life: A national assessment of demand and supply trends. Champaign, IL: Sagamore Press, Inc.
Cordell, H. K., Betz, C. J., Green, G. T., & Mou, S. H. (2008). Outdoor recreation activities trends: What’s growing, what’s slowing? A Recreation Research Report in the IRIS Series: Warnell School of Forestry and Natural Resource, University of Georgia, Athens, GA.
Crawford, D. W., & Godbey, G. (1987). Reconceptualizing barriers to family leisure. Leisure Sciences, 9(2), 119–127.
Crawford, D. W., Jackson, E. L., & Godbey, G. (1991). A hierarchical model of leisure constraints. Leisure Sciences, 13(4), 309–320.
Crespo, C. J., Smit, E., Andersen, R. E., Carter-Pokras, O., & Ainsworth, B. E. (2000). Race/ethnicity, social class and their relation to physical inactivity during leisure time: results from the Third National Health and Nutrition Examination Survey, 1988-1994. American Journal of Preventive Medicine, 18(1), 46–53.
Leisure Sciences, 28(4), 351–368.
Floyd, M. F., Shinew, K. J., McGuire, F. A., & Noe, F. P. (1994). Race, class, and leisure activity preferences: Marginality and ethnicity revisited. Journal of Leisure Research, 26(2), 158–173.
Frederick, C. J., & Shaw, S. M. (1995). Body image as a leisure constraint: Examining the experience of aerobic exercise classes for young women. Leisure Sciences, 17(2), 57–73.
Godbey, G., Roy, M., Payne, L., & Orsega-Smith, E. (1998). The relation between health and use of local parks. Bloomington, IN: National Recreation Foundation.
Gramann, J., & Allison, M. (1999). Ethnicity, race, and leisure. In E. L. Jackson & T. L. Burton (Eds.), . State College, PA: Venture Publishing, Inc.
Green, G. T., Bowker, J. M., Wang, X., Cordell, H. K., & Johnson, C. Y. (2012). A national study of constraints to participation in outdoor recreational activities. In H. K. Cordell (Ed.), Outdoor recreation trends and futures (pp. 70–74). Asheville, NC: U.S. Department of Agriculture Forest Service, Southern Research Station.
Gross, R., Gross, B., & Seldman, S. (Eds.). (1978). The new old: Struggling for decent aging. Garden City, NY: Anchor Books.
Henderson, K. A. (1991). The contribution of feminism to an understanding of leisure constraints. Journal of Leisure Research, 23(4), 363–377.
Henderson, K. A., & Allen, K. R. (1991). The ethic of care: Leisure possibilities and constraints for women. Loisir et société, 14(1), 97–113.

66
Iso-Ahola, S. E., Jackson, E., & Dunn, E. (1994). Starting, ceasing, and replacing leisure activities over the life-span. Journal of Leisure Research, 26(3), 227–249.
Jackson, E. (2005). Leisure constraints research: Overview of a developing theme in leisure studies. In E. Jackson (Ed.), Constraints to leisure (pp. 3–19). State College, PA: Venture Publishing, Inc.
Johnson, C. Y. (1998). A consideration of collective memory in African American attachment to wildland recreation places. Human Ecology Review, 5, 5–15.
Johnson, C. Y., Bowker, J. M., & Cordell, H. K. (2001). Outdoor recreation constraints: An examination of race, gender, and rural dwelling. Southern Rural Sociology, 17(1), 111–133.
Kebede, E., Ngandu, M., Schelhas, J., & Batalia, D. (2006). Recreational demand for Tuskegee National Forest, a non-market valuation. The Business Review, Cambridge, 6(1), 232–238.
Kelly, J. (1980). Recreation trends toward the year 2000. Champaign, IL: Management Learning Laboratories.
Kelly, J. (1996). Leisure (3rd ed.). Englewood Cliffs, NJ: Prentice Hall.Klobus-Edwards, P. (1981). Race, residence, and leisure style: Some policy implications.
Leisure Sciences, 4(2), 95–112. Lee, J.-H., Scott, D., & Floyd, M. F. (2001). Structural inequalities in outdoor recreation
Journal of Leisure Research, 33(4), 427–449.
Levinson, D. J. (1986). The seasons of a man’s life. New York: Ballantine Books.Link, M. W., & Oldendick, R. W. (1998). Caller ID: Does it help or hinder survey
research? Paper presented at the Annual meeting of the American Association for Public Opinion Research, St. Louis, MO.
Lucas, R. C. (1990). Wilderness use and users: Trends and projections. In J. Hendee, G. Stankey, & R. C. Lucas (Eds.), Wilderness management (pp. 355–398). Golden, CO: North American Press.
National Survey on Recreation and the Environment (NSRE ). (2004). National Survey on Recreation and the Environment 2004. The Interagency National Survey Consortium, coordinated by the USDA Forest Service, Athens, GA and the Human Dimensions Research Laboratory, University of Tennessee, Knoxville, TN.
Oldendick, R. W., Bishop, G. F., Sorenson, S. W., & Tuchfarber, A. J. (1988). A comparison of the kish and last birthday methods of respondent selection in telephone surveys.
, 307–318. Outdoor Foundation. (2012). The outdoor recreation economy. Boulder, CO: Outdoor
Foundation. Poudyal, N. C., Cho, S.-H., & Hodges, D. G. (2008). Effects of urban sprawl on hunting
participation in the Southeastern United States. Southern Journal of Applied Forestry, 32(3), 134–138.
Rojek, C. (1985). Capitalism and leisure theory. London: Tavistock Publications Limited.Rublee, C. B., & Shaw, S. M. (1991). Constraints on the leisure and community
participation of immigrant women: Implications for social integration. Loisir et société, 14(1), 133–150.
Sasidharan, V. (2001). The urban recreation experience: An examination of multicultural differences in park and forest visitation characteristics. Unpublished doctoral dissertation, The Pennsylvania State University, University Park, PA.
Scott, D. (2013). Economic inequality, poverty, and park and recreation delivery. Journal of Park and Recreation Administration, 31(4), 1–11.
Scott, D., & Munson, W. (1994). Perceived constraints to park usage among individuals with low incomes. Journal of Park and Recreation Administration, 12(4), 79–96.
Shaw, S. (1999). Gender and leisure. In E. L. Jackson & T. L. Burton (Eds.), Leisure (pp. 271–282). State College, PA:
Venture Publishing, Inc.

67
Stamps, S. M., & Stamps, M. B. (1985). Race, class and leisure activities of urban residents. Journal of Leisure Research, 17(1), 40–56.
Stodolska, M. (1998). Assimilation and leisure constraints: Dynamics of constraints on leisure in immigrant populations. Journal of Leisure Research, 30(4), 521–551.
Tinsley, H. E., Tinsley, D. J., & Croskeys, C. E. (2002). Park usage, social milieu, and
groups. Leisure Sciences, 24(2), 199–218. United States Forest Service. (2010). Connecting people with America’s great outdoors:
A framework for sustainable recreation. Retrieved from http://www.fs.usda.gov/Internet/FSE_DOCUMENTS/stelprdb5346549.pdf
United States Forest Service. (2014). RPA regions. Retrieved from http://www.fs.fed.us/research/rpa/regions.php
Virden, R. J., & Walker, G. J. (1999). Ethnic/racial and gender variations among meanings given to, and preferences for, the natural environment. Leisure Sciences, 21(3), 219–239.
Washburne, R. F. (1978). Black underparticipation in wildland recreation: Alternative explanations. Leisure Sciences, 1(2), 175–189.
Wearing, B. (1999). Leisure and feminist theory. Thousand Oaks, CA: Sage Publications.West, P. C. (1989). Urban region parks and black minorities: Subculture, marginality, and
interracial relations in park use in the Detroit metropolitan area. Leisure Sciences, 11(1), 11–28.
Whiting, J. W. (2012). An examination of Georgia state parks stakeholders’ outdoor
and cultural demographics. An unpublished Ph.D. dissertation, University of Georgia, Athens, GA.
Whyte, L., & Shaw, S. (1994). Women’s leisure: An exploratory study of fear of violence as a leisure constraint. Journal of Applied Recreation Research, 19(1), 5–21.
Williams, D. R., Patterson, M. E., Roggenbuck, J. W., & Watson, A. E. (1992). Beyond the commodity metaphor: Examining emotional and symbolic attachment to place. Leisure Sciences, 14(1), 29–46.
Woodard, M. D. (1988). Class, regionality, and leisure among urban Black Americans: The post-civil rights era. Journal of Leisure Research, 20(2), 87–105.
Wooldridge, J. M. (2002). Econometric analysis of cross section and panel data. Boston: MIT press.
Yu, P., & Berryman, D. L. (1996). The relationship among self-esteem, acculturation and recreation participation of recently arrived Chinese immigrant adolescents. Journal of Leisure Research, 28, 251–273.