an analysis of internet content delivery systems stefan saroiu, krishna
Post on 21-Dec-2015
215 views
TRANSCRIPT

An Analysis of Internet Content Delivery Systems
http://www.cs.washington.edu/research/networking/websys/pubs/osdi_2002/osdi.html
Stefan Saroiu, Krishna Gummadi, Richard Dunn, Steven Gribble, Henry Levy
U. Washington

HTTP traffic distribution at U.W.

Bandwidth use at U. Wash.
• Bandwidth use (bidirectional) over time• Daily pattern: noon peaks, 4 am nadirs.

What is being downloaded?
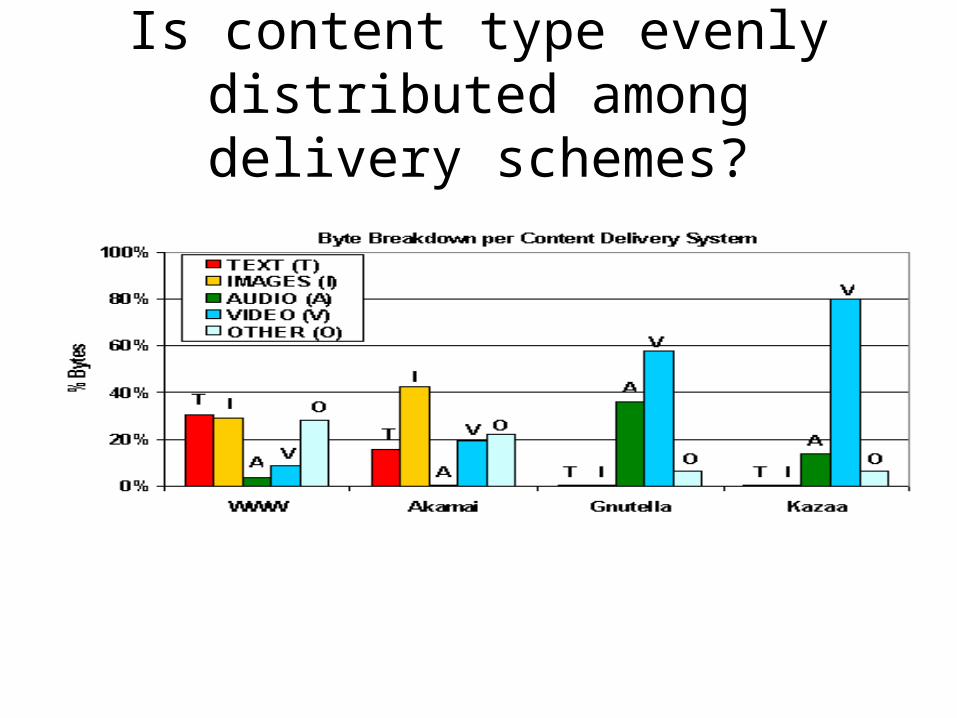
Is content type evenly distributed among delivery schemes?
Content Delivery Systems
• WWW
• Content Delivery Networks (CDNs)
• Peer-to-peer file sharing
• Note that all 3 use HTTP for file transfer, though P2P uses an additional protocol for indexing/searching.
• Study ignores streaming protocols, legacy protocols (FTP, email)

Traditional Web services
• Client/Server model
• Server (or farm) has a single location– Every client gets files from same place regardless of location
– Zipf’s law – 80%/20% rule
• Use caching to gain efficiency, usually at entrance to network

Zipf’s Law
According to NIST (http://www.nist.gov/dads/HTML/zipfslaw.html ):Definition: The probability of occurrence of words or other items starts high and tapers
off. Thus, a few occur very often while many others occur rarely.
Formal Definition: Pn ~ 1/na, where Pn is the frequency of occurrence of the nth ranked item and a is close to 1.
See also Zipfian distribution, Lotka's law, Benford's law, Bradford's law. Note: In the English language words like "and," "the," "to," and "of" occur often while
words like "undeniable" are rare. This law applies to words in human or computer languages, operating system calls, colors in images, etc., and is the basis of many (if not, all!) compression approaches.
Named for George Kingsley Zipf.
• Summarized: in a large data sample, 80% of the accesses refer to 20% of the objects
Zipf's law
0
0.2
0.4
0.6
0.8
1
1.2
1
14
27
40
53
66
79
92
10
5
11
8
13
1
14
4
15
7
17
0
18
3
19
6
rank
rela
tiv
e f
req
ue
nc
y
P (a=0.7)
P (a=1)
P (a=1.08)

Content Delivery Networks
• Akamai
• A shadow network to provide content which is as (topologically) close to the client as possible.
• Requests are redirected to nearest server based on user location (usually from IP address)
• Similar to web caching
• Low latency due to locality
Peer-to-Peer Networks
• Napster, Kazaa, Gnutella, BitTorrent
• Files distributed “evenly” across all nodes
• Replication for high availability
• To access a file, first must search to find host, then use a file transfer protocol to retrieve file
• Often use non-standard TCP ports to evade proxys and firewall policies
• Files sometimes broken into blocks across different peers

Method
• Snoop all traffic at network edge, looking for HTTP, regardless of port#
• Categorized by TCP port# and server domain• This places P2P search traffic (but not data xfer)
in the “misc” bin• Does not capture local traffic or remote server-
server traffic

Open Questions
• Is sample data representative of trends or internet at large?– One site only
– Vast majority of users are aged 17-21at a university campus
– 9 sequential days – does time of year change patterns?
• Identifies a trend, but results not precise
• Some results presented orthogonally– Useful to see % of bytes compared by % of clients, % of objects
not raw numbers of each.
– Useful to see # of bytes vs # of clients not % of bytes. (How much does each new user add to bw load?)

Results
• 97% of traffic bps is TCP– 43% of TCP bps is “misc”– 43% of TCP bps is P2P file xfer– 14% is WWW

Results
• Site is a net traffic provider• WWW traffic is 2:1 provider on average, but peak
traffic is symmetrical• Kazaa traffic is 7.6:1 provider on average• Can’t tell ratios of locally contained traffic to
remote• 15% of outgoing HTTP bps is WWW, 85% is P2P• Assuming outgoing WWW traffic is university
sponsored and P2P traffic is not, 85% of outgoing HTTP is NOT university sponsored.
Results
• Kazaa traffic (incoming): – 79% video (AVI+MPG)– 13.6% MP3– 7%? hashed (probably encrypted premium content)– Negligible text & still images
• WWW & Akamai breakdown is mostly text & images
• Content mix has changed since 1999– Less HTML, GIF, JPG– Much more Video, MP3

Results – object size
– P2P services providing more large files– Heavy tail has more volume
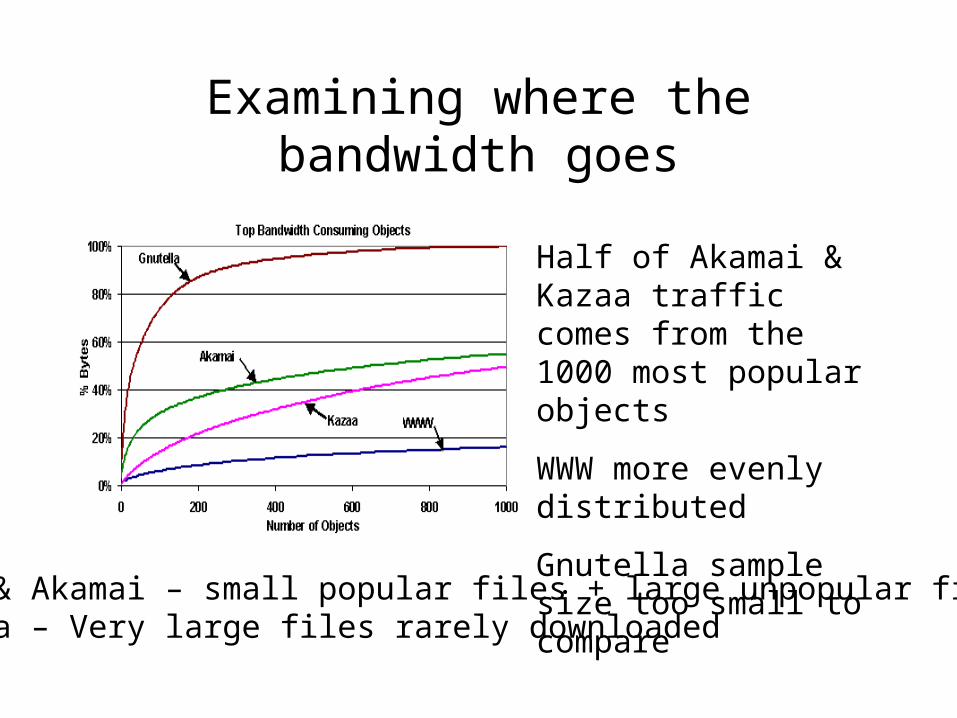
Examining where the bandwidth goes
Half of Akamai & Kazaa traffic comes from the 1000 most popular objects
WWW more evenly distributed
Gnutella sample size too small to compare
WWW & Akamai – small popular files + large unpopular filesKazaa – Very large files rarely downloaded

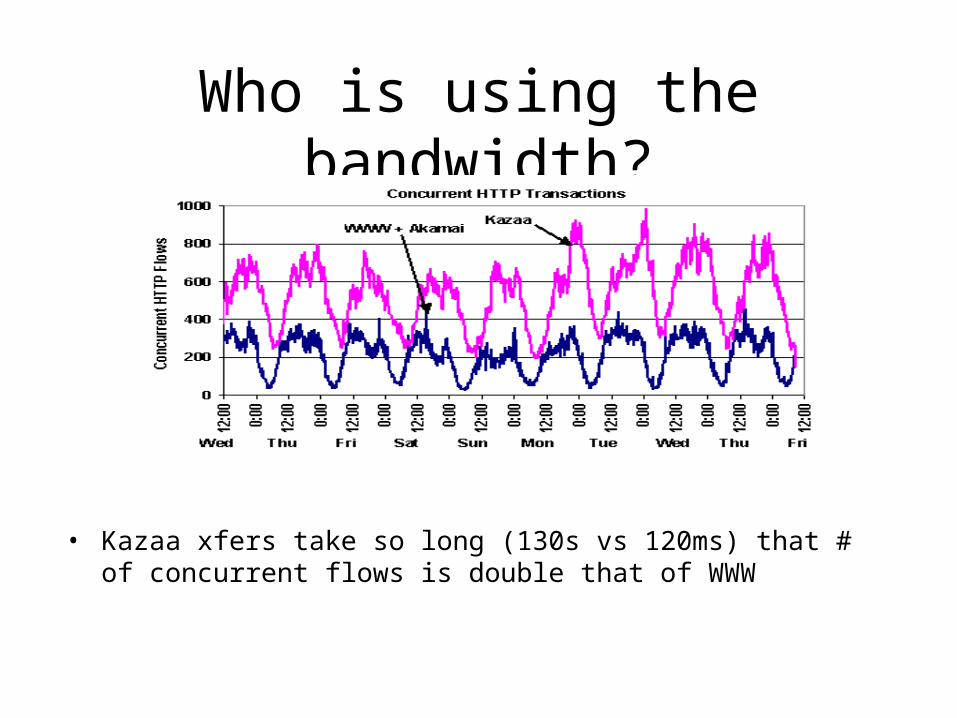
Who is using the bandwidth?
• A few Kazaa nodes cause a lot of incoming traffic. Biggest users cause lots of impact.

Who is using the bandwidth?
• WWW – fewer inbound requests than outbound
• Outbound WWW data rate still double inbound due to object size
• Kazaa – 2x outbound requests as inbound
• Small rate of Kazaa requests overwhelming large rate of WWW requests
Who is using the bandwidth?
• Kazaa xfers take so long (130s vs 120ms) that # of concurrent flows is double that of WWW
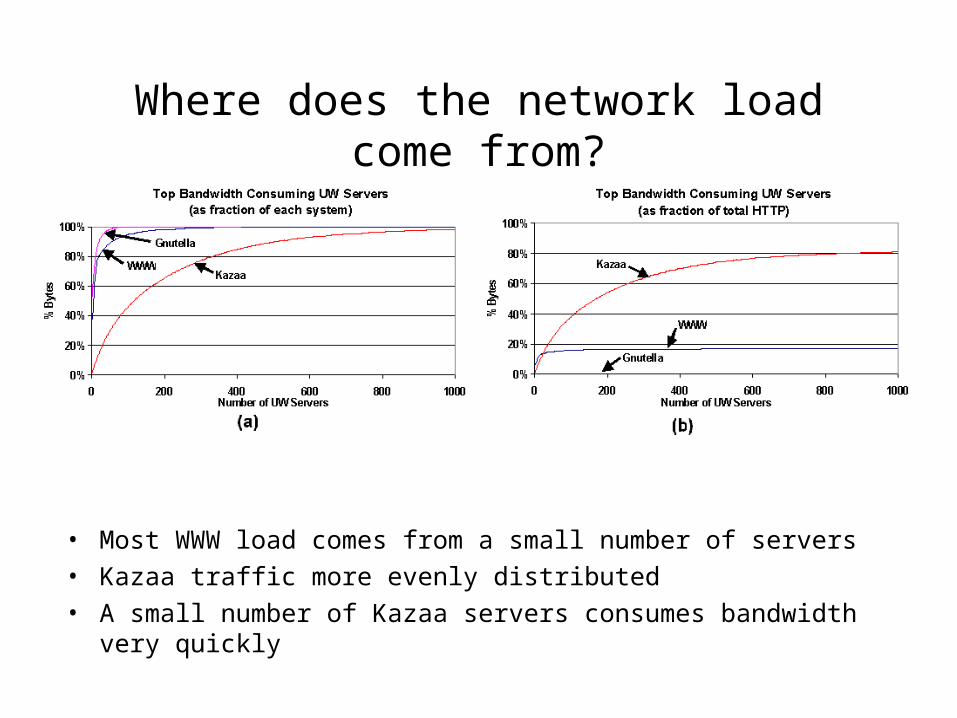
Where does the network load come from?
• Most WWW load comes from a small number of servers
• Kazaa traffic more evenly distributed
• A small number of Kazaa servers consumes bandwidth very quickly

Where does the network load come from?
• Kazaa distribution is flatter than WWW (no surprise)
• Akamai has VERY sharp curve, out of only 350 servers (no surprise)
• Gnutella has sharper distribution – smaller user community may skew results
• Would expect P2P curves to be flatter still

Where does the network load come from?
• P2P download error rates dwarf success rates, while WWW is mostly successful
• Byte fractions are still comparable
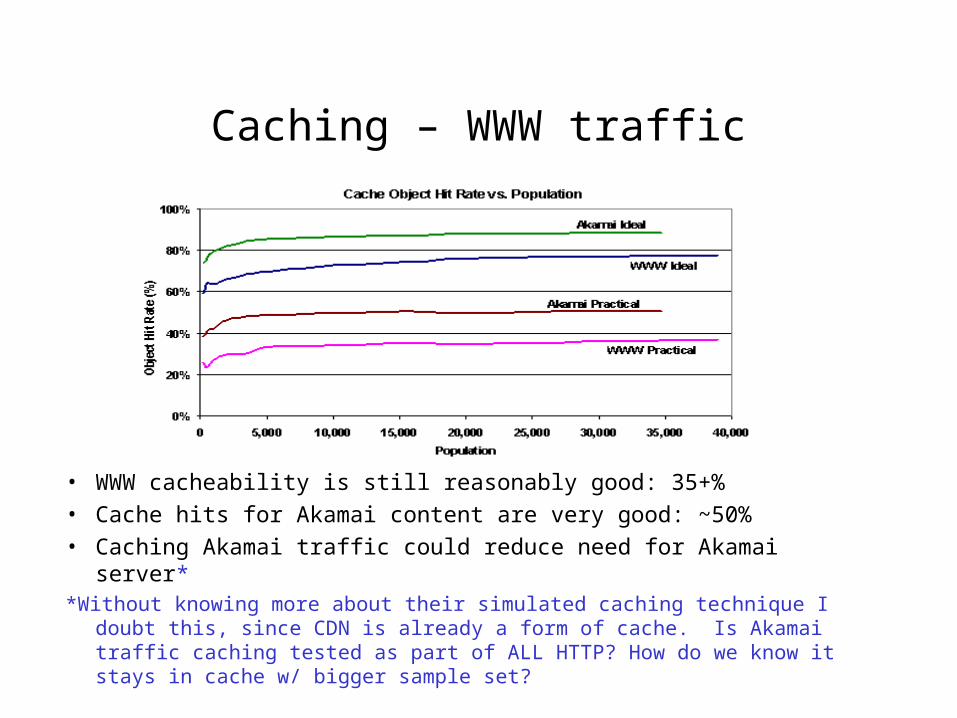
Caching – WWW traffic
• WWW cacheability is still reasonably good: 35+%
• Cache hits for Akamai content are very good: ~50%
• Caching Akamai traffic could reduce need for Akamai server**Without knowing more about their simulated caching technique I doubt this, since
CDN is already a form of cache. Is Akamai traffic caching tested as part of ALL HTTP? How do we know it stays in cache w/ bigger sample set?

Caching – P2P traffic
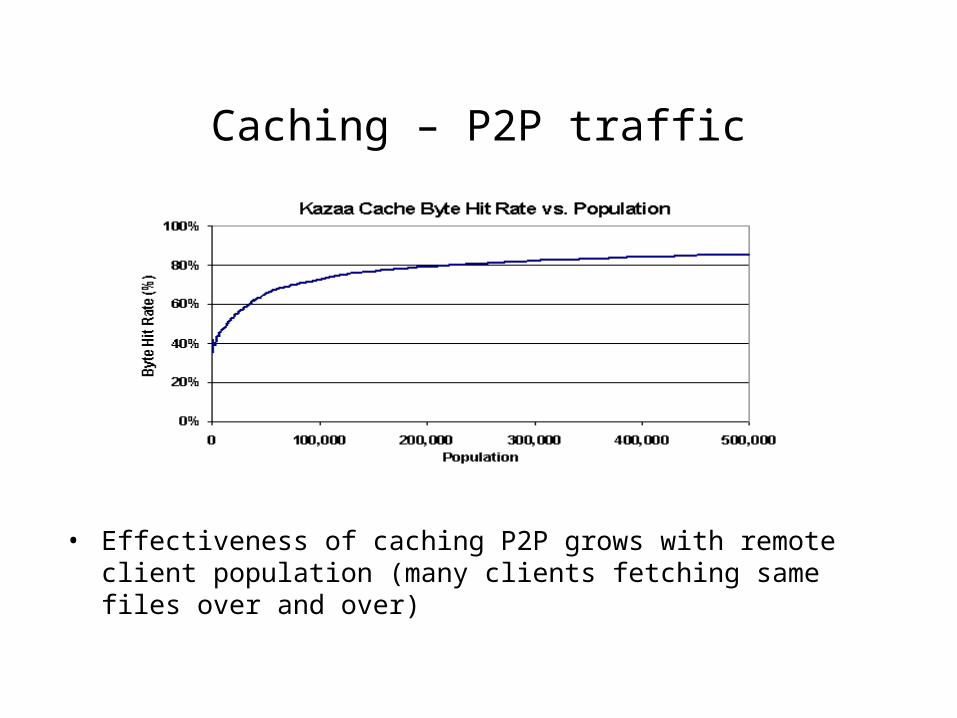
• Idealized outbound Kazaa cache warms after 6-7 days, levels at 85% hit rate
• Greater than idealized WWW, comparable to idealized Akamai
• Unknown if there is difference between ideal & practical
• Inbound cache warms more slowly, only at 35% after 9 days, still growing. (Can’t be extrapolated from their data set)
Caching – P2P traffic
• Effectiveness of caching P2P grows with remote client population (many clients fetching same files over and over)

Misc questions
• Too much undifferentiated traffic – – How much is Kazaa/Gnutella search traffic?– How much WWW is napster or other P2P?– Akamai is the only CDN extracted
• Some data is hard to compare apples to apples– Some stats are % traffic, some are % of TCP some
only include HTTP.
• Why is P2P so asymmetric?– Nodes on LAN more likely to serve files than dial-up
nodes?

Conclusions• P2P traffic has grown tremendously over past few years,
exceeding traditional WWW three-fold• Cause is huge file size• Kazaa file distribution is very heavy-tailed as is bandwidth• A cache for outgoing http traffic should greatly help save
network bandwidth.• A small number of P2P nodes adds tremendously to traffic load.• The top downloaders chew up a large chunk of incoming
bandwidth due to large files accessed• P2P distribution of serving load is not very fair• P2P does not appear to scale well within the I/O capacity of a
campus environment. 90 x WWW client needs.