an analysis of graduate earnings across higher education
TRANSCRIPT

+
An Analysis of Graduate
Earnings across Higher
Education Institutions
Graduation Cohorts: 2010 - 2017

2 An Analysis of Graduate Earnings across Higher Education Institutions
An Analysis of Graduate
Earnings across Higher Education Institutions
Graduation Cohorts: 2010 - 2017
A Report by the Higher Education Authority
June 2021
Brian Stanley, Victor Pigott, Valerie Harvey
Acknowledgements
The Authority wishes to thank Dr. Brendan O’Dowd, Statistician, CSO, for his work in
developing the Educational Longitudinal Database used in this report.
For further information please contact [email protected]

3 An Analysis of Graduate Earnings across Higher Education Institutions
Table of Contents TABLE OF CONTENTS 3
LIST OF TABLES 4
LIST OF FIGURES 4
GLOSSARY 5
LEGAL FRAMEWORK UNDERPINNING THIS RESEARCH 6
EXECUTIVE SUMMARY 7
1 INTRODUCTION 10
2 DATA DESCRIPTION 11
2.1 Introduction 11
2.2 Description of Earnings Data 13
2.3 Description of Student Characteristics 15
2.4 Administrative Data versus Survey Data 16
2.5 Sample Selection 17
3 DESCRIPTIVE STATISTICS 18
3.1 Introduction 18
3.2 Average Earnings across Institutions 18
3.2.1 Undergraduates 18
3.2.2 Postgraduates 22
3.3 Differences in Institution Populations by Gender 22
3.4 Differences in Institution Populations by Second-Level School Type 24
3.5 Differences in Institution Populations by Leaving Certificate Points 26
4 REGRESSION ANALYSIS FOUR YEARS AFTER GRADUATION 28
4.1 Introduction 28
4.2 Regression Methodology 28
4.3 Graduates’ Predicted Earnings by Institution 31
4.3.1 Undergraduates 31
4.3.2 Postgraduates 34
5 CONCLUSIONS 36
REFERENCES 37
APPENDIX 38
Appendix A: Sample Selection 38
Appendix B: Details of Student Characteristics 43
Appendix C: Multiple Graduations in Different Years 56
Appendix D: Graduates with Missing PPSN 58
Appendix E: Detailed Regression Results 60

4 An Analysis of Graduate Earnings across Higher Education Institutions
List of Tables
Table 1: Timeline of Data Availability ........................................................................13 Table 2: Timeline of Earnings Data ...........................................................................13 Table A.1: Number of Graduations per Individual .......................................................39 Table A.2: Sample Selection: All Graduates ...............................................................41 Table A.3: Undergraduate Observations ....................................................................42 Table A.4: Postgraduate Observations ......................................................................42 Table B.1: Threshold Ages for Young Graduates for each Award Type ...........................43 Table B.2: HEA-Funded Institutions by Institution Types .............................................43 Table B.3: Award Type and NFQ Level ......................................................................44 Table B.4: Description of Recoding Pre-2014 ISCED Fields of Study ..............................49 Table B.5: Description of Student Characteristics .......................................................52 Table C.1: Award Types for Multiple Graduations ........................................................56 Table C.2: Broad Fields of Study for Multiple Graduations ............................................57 Table E.1: Undergraduates Regression Results for Institution, 4 Years after Graduation ..60 Table E.2: Postgraduates Regression Results for Institution, 4 Years after Graduation .....62
List of Figures
Figure 1: Undergraduates’ Average Weekly Earnings by Institution (€), Universities .......19 Figure 2: Undergraduates’ Average Weekly Earnings by Institution (€), Colleges ............20 Figure 3: Undergraduates’ Average Weekly Earnings by Institution (€) – Institutes of
Technology ............................................................................................................21 Figure 4: Postgraduates’ Average Weekly Earnings by Institution (€) – Universities ........22 Figure 5: Gender Profile by Institution ......................................................................23 Figure 6: Second-Level School Type Profile by Institution ............................................25 Figure 7: Leaving Certificate Points Profile by Institution, for Undergraduates ................27 Figure 8: Undergraduates’ Predicted Earnings 4 Years after Graduation by Institution (€)33 Figure 9: Postgraduates’ Predicted Earnings 4 Years after Graduation by Institution (€) ..35

5 An Analysis of Graduate Earnings across Higher Education Institutions
Glossary
CAO Central Applications Office
CSO Central Statistics Office
DEIS Delivering Equality of Opportunity in Schools
ELD Educational Longitudinal Database
HEA Higher Education Authority
HEI Higher Education Institution
ISCED International Standard Classification of Education
LC Leaving Certificate
NFQ National Framework of Qualifications
PAYE Pay As You Earn
PPOD Post-Primary Online Database
PPSN Personal Public Service Number
QQI Quality and Qualifications Ireland
RCSI Royal College of Surgeons in Ireland, University of Medicine and Health
Sciences
STEM Science, Technology, Engineering and Mathematics
Graduates’ earnings are modelled in two ways.
Raw Prediction: The average prediction of graduates’ earnings before any attempt is
made to explain differences.
Model Prediction: Compares like-for-like graduates who:
• studied the same subject/course in the same institution,
• received the same grade,
• are the same gender,
• from the same county,
• attended the same type of second-level school,
• work in the same employment sector,
• accounts for the effect of having children on female earnings,
• enter higher education at the same age (undergraduates only),
• had the same Leaving Certificate performance (undergraduates only) and
• are from the same socio-economic group (undergraduates only).

6 An Analysis of Graduate Earnings across Higher Education Institutions
Legal Framework Underpinning this Research
The CSO provides researchers with access to relevant data holdings, subject to stringent
confidentiality criteria, within the framework of the Statistics Act, 1993.
The examination of learners’ outcomes provided in this report was produced by the HEA
under Section 11 of the Statistics Act 1993 using the Educational Longitudinal Database
(ELD) data source, which was created in compliance with all relevant data protection
legislation.
The ELD data source brings together data from the Department of Education and a number
of state agencies, including the HEA, QQI and SOLAS, with employment, benefits and
earnings data from the Revenue Commissioners and the Department of Social Protection.
Access to this data source is strictly limited to Officers of Statistics.
The ELD, provides the basis for a series of projects that the CSO facilitates in strict
compliance with the Statistics Act, which allows researchers to further analyse and examine
learner outcomes.
The CSO's role is limited to the development of the ELD data source and it is important to
note that any analysis, conclusions or recommendations made in this report are the HEA’s
alone.
Full details relating to the framework for this research work can be accessed through the
following links:
Statistical Agreement between the CSO and HEA:
https://www.cso.ie/en/aboutus/lgdp/legislation/memorandumsofunderstanding/statisticala
greementbetweenthecentralstatisticsofficeandthehighereducationauthority/
Statistics Act 1993: http://www.irishstatutebook.ie/eli/1993/act/21/enacted/en/html
Educational Longitudinal Database:
https://www.cso.ie/en/methods/education/educationallongitudinaldatabase/

7 An Analysis of Graduate Earnings across Higher Education Institutions
Executive Summary
This report was developed within the Central Statistics Office, under the legal framework of
the Statistics Act 1993. It extends the HEA’s (2019) previous graduate earnings report by
providing new evidence on graduates’ earnings from higher education institutions.
Graduates’ labour market earnings are influenced by their choice of subject, their grade and
their sector of employment. However, earnings are also influenced by graduates’
background characteristics, such as their prior academic attainment and their socio-
economic background. Therefore, comparisons of raw earnings across institutions may be
confounded by the impact of background characteristics. This report attempts to disentangle
these effects by modelling earnings to isolate the impact of institution choice on graduates’
earnings by comparing like-for-like graduates.
Using model predictions, institutions are compared using like-for-like graduates who studied
the same subject, received the same grade, are the same gender, from the same county,
entered higher education at the same age, had the same performance in the Leaving
Certificate, have the same socio-economic background and work in the same sector.
The main findings are as follows:
• In raw terms, undergraduates from TCD have the highest average earnings of €744 per
week four years after graduation. This is followed by DCU (€725 per week) and UCD
(€720 per week).
• Amongst institutes of technology, DIT undergraduates have the highest average raw
earnings of €682 per week four years after graduation; while Letterkenny IT, IT Tralee,
and IT Sligo had the lowest average raw earnings at €501, €532, and €554 per week.
• Relatively high earnings are evident for graduates of colleges that provide teacher
education: €713 per week for St. Angela’s College, €703 per week for St. Patrick’s
College, Drumcondra and €678 per week for Mary Immaculate College.
• When institutions are compared on a like-for-like basis, average predicted graduate
earnings from universities generally decrease, while the predicted earnings for institutes
of technology and colleges increase.
• Comparing like-for-like graduates, the predicted earnings for graduates from TCD, DCU
and UCD fall substantially (while remaining above the overall average). Conversely, the
predicted earnings for graduates from IT Tralee, Letterkenny IT and IT Sligo increase
substantially (while remaining below the overall average).

8 An Analysis of Graduate Earnings across Higher Education Institutions
These findings indicate that a large part of the differences in earnings across institutions
can be explained by differences in the subjects offered by each institution and differences
in student characteristics, such as prior academic achievement.
Some of the differences in student characteristics across institutions that the model
predictions account for include:
Leaving Certificate Points
• Undergraduates from universities and colleges achieved higher Leaving Certificate points
compared to undergraduates from institutes of technology.
• 94 percent of St. Patrick’s graduates and 87 percent of TCD graduates achieved over
400 points compared to 3 percent of IT Blanchardstown graduates.
Second-Level School Type
• Overall, a higher proportion of university graduates previously attended a fee-paying,
lower proportions attended a DEIS school. The reverse is true for institutes of
technology.
• In UCD, 27 percent of graduates previously attended a fee-paying school, while 7
percent attended a DEIS school. In Limerick IT, less than 0.5 percent of graduates
previously attended a fee-paying school, while 38 percent attended a DEIS school.
Gender
• The proportion of male and female graduates varies across institutions. Almost all
graduates from St. Angela’s and 68 percent of graduates from NCAD are female. This
compares to 46 percent and 45 percent female graduates, respectively, from Carlow IT
and GMIT.
Limitations
• The report only measures the labour market returns of higher education and fails to
capture the wider benefits of higher education to individuals and to society.
• The report only compares earnings of higher education graduates relative to other
graduates and does not compare absolute differences in graduates’ earnings to non-
graduates.
• The data do not include where a graduate is employed but it does measure the county
where the student is from.
• The relevance of a graduate’s qualification to their job is not captured in the data.
• The data does not capture individuals who graduate from an Irish HEI and work
overseas. In addition, the data does not identify Irish domiciled students who graduate
from institutions overseas and subsequently work in Ireland.
• The analysis only covers PAYE income for employees. Self-employment income is
excluded.

9 An Analysis of Graduate Earnings across Higher Education Institutions
Note
• Earnings are defined in this report as an individual’s weekly gross earnings, less tax
reliefs, such as pension contributions.
• The findings in this report should not be compared directly with data disseminated on
the CSO website, as the CSO data is based on median weekly earnings each year.

10 An Analysis of Graduate Earnings across Higher Education Institutions
1 Introduction
This report employs the same linked administrative data as the HEA’s (2019) previous
earnings report and extends the analysis to exploring graduate earnings from different
institutions. This report uses regression analysis to take into consideration the different mix
of subjects in institutions and the different background characteristics of student
populations, such as prior academic attainment.
In line with the data confidentiality protocols of the CSO, all data linking, and analysis is
carried out on pseudonymised datasets using Protected Identifier Keys. The CSO replaces
the PPSN for individuals with a proxy that is used to link the HEA’s graduation records to
the CSO’s administrative data. In addition, all identifiable information relating to individuals
and employers, such as names and addresses, are removed.
The purpose of this report is to compare graduate earnings across institutions, while taking
into consideration differences in subject mixes in institutions and differences in student
populations. For instance, when measuring the earnings impact from studying in a particular
institution, it is important to consider graduates’ underlying ability, as students with strong
ability before entering higher education may be better rewarded by the labour market
irrespective of their institution choice. To overcome such issues, this report compares
graduates’ earnings amongst similar individuals by exploiting a rich set of information on
graduates’ degrees, prior academic attainment, socio-economic background, sector of
employment and an indicator to account for the effect of having children on female earnings.
It is worth remembering that there are many benefits of participating in higher education
which extends beyond the narrow outcome of earnings in the labour market. For example,
there are many personal, social, and cultural benefits of participating in higher education
which are not measured here, such as participating in the Erasmus+ programme,
volunteering opportunities and involvement in sports and societies.
11 An Analysis of Graduate Earnings across Higher Education Institutions
2 Data Description
2.1 Introduction
The analysis in this report is based on the CSO’s Educational Longitudinal Database, which
uses administrative data to link graduates from higher education in Ireland into the Irish
labour market. The data is compiled in the CSO from numerous administrative sources,
which include earnings data from Revenue, benefits data from the Department of Social
Protection and data on educational participation from the Department of Education and a
number of State Agencies, including the HEA, QQI and SOLAS.
Under the auspices of the Statistics Act 1993 and in compliance with all relevant data
protection legislation, all data linking, and analysis is carried out on pseudonymised datasets
using Protected Identifier Keys. The CSO replaces the PPSN for individuals with a proxy
called the CSOPPSN. It is this proxy that is used to link the HEA’s records to the CSO’s
administrative data sources. In addition, all identifiable information relating to individuals
and employers are removed, such as names, addresses and date of birth information.
The analysis in this paper uses a part of the ELD that focuses on the HEA’s graduation
records as the primary information source. This dataset is then linked to the HEA’s new
entrant records, Revenue’s employment records, the Department of Social Protection’s
records and the Department of Education’s records on post-primary education (PPOD).
The HEA’s graduation records contains information on the year of graduation, institution
attended, course studied, type of award, final degree grade, gender and county of origin for
graduation cohorts over eight years from 2009/2010 to 2016/2017.
The HEA’s new entrant records contain information on students when they register for the
first time on a full-time undergraduate course. The data includes the year of entry to higher
education, Leaving Certificate points, Leaving Certificate Mathematics and English grades
for new entrant cohorts from 2007/2008 to 2014/2015. It also includes information from
the Equal Access Survey, such as fathers’ socio-economic group.1
1 The Equal Access Survey is a voluntary survey administered to all undergraduate new entrants at registration every year. The overall response rates for each academic year from 2007/2008 to 2014/2015 is as follows: 56 percent, 78 percent, 72 percent, 66 percent, 60 percent, 63 percent, 66 percent and 68 percent. Overall survey response rates by institution are published annually in the HEA’s Key Facts and Figures publication available here: http://hea.ie/statistics/publications/

12 An Analysis of Graduate Earnings across Higher Education Institutions
Revenue’s employment records contain information on individuals’ income from their main
employment, the number of weeks of insurable work and the sector of employment. The
records span eight years from 2011 to 2018.
The Department of Social Protection’s records contain relationship information between
mothers and children born after the year 2000. This is used to construct an indicator
identifying mothers of non-adult children. It is important to bear in mind that while this
indicator may partly explain some of the differences in earnings by gender it may also
partially capture part-time employment amongst females, as hours worked are not observed
in the data.
The Department of Education’s PPOD records contain information, since 2002, on
enrolments in second-level schools. From this, the most recent school each student attended
before they entered higher education is derived and this is used to determine the HP
deprivation index score of the school’s Electoral Division.2 The most recent second-level
school that students attended are divided into three types of school (standard, DEIS and
fee-paying schools) as a proxy measurement of graduates’ socio-economic background.
Table 1 shows the timeline of data availability for the PPOD, new entrant and graduation
records. Sufficient time must elapse to join a student’s PPOD and new entrant records to
their graduation record. Eight years of PPOD records (from 2001/02 academic year) are
available before the first graduates are observed in 2010. This means that the type of
second-level school that graduates previously attended can be observed for both
undergraduates and postgraduates over all graduation cohorts. New entrant records are
only available from 2008, meaning that sufficient matches to graduation records only occur
from 2012, which coincides with the average length of a four-year Honours Bachelor degree.
As the length of time for postgraduate study is longer, their new entrant information is
excluded when analysing their earnings.
Table 2 shows the years of earnings data that are observed for each graduation cohort. For
example, eight years of earnings data (from 2011 to 2018) are observed for the 2010
graduation cohort (one to eight years after graduating). One year of earnings data (2018)
is observed for the 2017 graduation cohort (one year after graduating). The shaded area
shows the (post-2012) graduation cohorts and years of earnings data for which new entrant
information is available.
2 The HP deprivation index is a composite index of demographic, social class and labour market indicators in the 2016 Census. Further information is available here: https://www.pobal.ie/app/uploads/2018/06/The-2016-Pobal-HP-Deprivation-Index-Introduction-07.

13 An Analysis of Graduate Earnings across Higher Education Institutions
Table 1: Timeline of Data Availability
2002 2003 2004 2005 2006 2007 2008 2009 2010 2011 2012 2013 2014 2015 2016 2017
PPOD (Academic Year)
01/02 02/03 03/04 04/05 05/06 06/07 07/08 08/09 09/10 10/11 11/12 12/13 13/14
New Entrant (Academic Year)
07/08 08/09 09/10 10/11 11/12 12/13 13/14 14/15
Graduation Cohort
2010 2011 2012 2013 2014 2015 2016 2017
Table 2: Timeline of Earnings Data
Years of Earnings Data (and Years Since Graduation)
1 2 3 4 5 6 7 8
Graduation
Cohort
2010 2011 2012 2013 2014 2015 2016 2017 2018
2011 2012 2013 2014 2015 2016 2017 2018
2012 2013 2014 2015 2016 2017 2018
2013 2014 2015 2016 2017 2018
2014 2015 2016 2017 2018
2015 2016 2017 2018
2016 2017 2018
2017 2018
Note: The shaded area shows the graduation cohorts (post-2012) for which new entrant information is available to analyse earnings.
2.2 Description of Earnings Data
Earnings data are sourced from Revenue’s P35 returns, which employers file annually on
behalf of their employees, and contains information on PAYE income. Earnings in this report
are defined as an individual’s income, which is liable to income tax.3 An individual’s annual
earnings information is not necessarily directly observed on the tax records because
individuals may have more than one job in a calendar year and the data includes one record
for each job. Each record includes the number of weeks of insurable work and the pay
received by the employee. The data does not include the number of hours worked or the
hourly wage. Earnings from self-employment are not analysed in this report because there
is a longer lag in its availability and there are difficulties in interpreting a consistent measure
of individuals’ income from their sales, profit and turnover.
3 It is thus the total income of taxpayers less personal reliefs (such as pension contributions) and other deductions at the marginal tax rate but prior to the application of tax credits and reliefs at the standard tax rate (such as health expenses).

14 An Analysis of Graduate Earnings across Higher Education Institutions
It is preferable to analyse weekly earnings rather than annual earnings because individuals
may work for different periods of time, in different jobs, in a calendar year. To calculate
weekly earnings, a main employment (or job) is identified for each individual as the one
which contributes the single largest pay to that individual over the course of the year. An
individual’s average weekly earnings is calculated for this main employment as their gross
pay divided by their number of weeks of insurable work for this employment. Earnings are
adjusted for inflation by multiplying by a factor based on the Consumer Price Index (CPI,
base=December 2016).
To ensure that short-term or casual work is excluded, graduates’ earnings are only analysed
for individuals who are in ‘substantial employment’. An individual is regarded as being in
substantial employment within a given calendar year if they fulfil the following two
requirements:
1. They have at least 12 weeks of insurable work within the calendar year across all
employments. This can be supplemented by weeks of maternity leave and/or illness
leave.
2. The average weekly earnings from only their main employer are at least €100 per week.
It is worth noting that while the definition of earnings remains the same, the analysis of
earnings in this report is not directly comparable to the CSO (2018) study. This is because
analysis here is based on mean earnings (as regressions are calculated at mean values)
rather than median earnings.

15 An Analysis of Graduate Earnings across Higher Education Institutions
2.3 Description of Student Characteristics
Below is a list of all student characteristics that are accounted for in this analysis, grouped
together into eight categories. Variables marked with an asterisk (*) are only included for
undergraduate models as they are sourced from the new entrant record of individuals’ first
full-time enrolment in higher education. Appendix B contains further information about these
student characteristics variables.4
1. Graduation Cohort
• Graduation cohorts (2010, …, 2017)
2. HEI and Subject
• Institution (detailed in Table B.2)
• Field of study (detailed in Table B.4)
3. Degree Characteristics
• Award type (Ordinary Degree, Honours Degree, Masters, PhD etc.)
• Final degree grade
4. Demographic Characteristics
• Gender
• County of origin (including Dublin postcodes)
• Age at entry to higher education*
5. Prior Academic Attainment
• Leaving Certificate points (155-200, 205-250, …, 555-600)*
• Leaving Certificate Mathematics grade*
• Leaving Certificate English grade*
6. Socio-economic Background
• Second-level school type (DEIS, fee-paying and standard)
• HP relative deprivation index score of schools’ Electoral Division
• Students’ socio-economic group (based on fathers’ occupation)*
7. Mother Information
• Indicator of motherhood
8. Sector of Employment
• NACE sector of employment
4 All variables are categorical and Table B.5 shows these categories and the shares of each category (mostly) with respect to the `Earnings Sample’ for all graduation cohorts (column 6 in Table A.2).

16 An Analysis of Graduate Earnings across Higher Education Institutions
2.4 Administrative Data versus Survey Data
Other sources of graduates’ earnings data for Ireland are the First Destinations Survey and
the Graduate Outcomes Survey, which surveys graduates nine months after completing
their degrees.5 Response rates are strong for these types of survey at over 60 percent for
the First Destinations Survey and over 50 percent for the Graduate Outcomes Survey.
However, the response rate for earnings is substantially lower, ranging between 19 and 31
percent for Honours Degree graduates between 2013 and 2016.
Administrative data has several advantages over survey data. Population-level coverage
allows estimates to be calculated with greater precision and enables analysis of specific sub-
sections of the population, while retaining sufficient sample size. Administrative data
examines the same individual over multiple periods in time, creating a panel dataset over a
long time series, which provides insight into earnings growth in graduates’ early career years
rather than just at a specific point in time. In addition, administrative data (such as
earnings) is largely free from measurement error, such as self-recall bias, non-response
bias or, in the case of panel data, attrition bias.6
However, there are limitations. Administrative data is collected separately to administer the
higher education sector and the tax system and not with the sole intention of analysing the
outcomes of graduates from higher education. For example, the perceived relevance of a
graduate’s qualification to their area of employment cannot be examined and the region
where graduates are employed cannot be identified from the data.7
This report only extends to individuals who graduate from an Irish HEI who subsequently
work in Ireland. Therefore, the data does not capture individuals who graduate from an Irish
HEI and work outside the State.8 In addition, the data cannot identify Irish domiciled
individuals who graduate from institutions outside of Ireland and subsequently return to
work in Ireland.9
5 These reports are available on the HEA website at: http://hea.ie/statistics/publications/ 6 Attrition bias can be significant. The response rate was 44 percent amongst 2007/08 graduates in the UK who were followed up after three and a half years (Crawford and Vignoles, 2014). 7 Nevertheless, the region of employment can be considered an outcome of attending a particular HEI insofar as a student chooses to relocate to a HEI in a strong labour market region, with the intention of remaining there after graduation. 8 Survey data of Irish university graduates indicates that nine months after graduating with an Honours Degree, the proportion employed overseas range from 9 percent in 2011 to 12 percent in 2013, and 8 percent in 2016. For Masters and Doctorate graduates these range from 13 percent in 2011 to 15 percent in 2016 (HEA, 2018). 9 For instance, almost 11,000 students of Irish domicile were enrolled in UK universities in the 2014/15 academic year. Further information is available here: https://www.hesa.ac.uk/data-and-analysis/students/where-from

17 An Analysis of Graduate Earnings across Higher Education Institutions
2.5 Sample Selection
The CSO’s Educational Longitudinal Database contains the population of graduations from
HEA-funded institutions. A number of restrictions are applied before arriving at the sample
used in this analysis. Full details of the sample selection process are given in Appendix A.
RCSI graduates and non-Irish domiciled individuals are excluded due to high rates of missing
PPSN identifiers among these groups, which is required for matching to other administrative
data sources. In addition, small numbers of graduation records are excluded from generic
programmes (ISCED code 0) and a small number of graduation records are excluded for
individuals who had more than one graduation in the same year.
It is important to note that one-fifth of individuals have received more than one graduation
between the years 2010 and 2017. This report attributes individuals’ earnings only with
their latest graduation and thus, removes individuals’ earlier graduations. This is to ensure
that analysis is based on unique individuals rather than multiple graduations that relate to
the same individual.
The sample is then restricted to full-time young graduates to enable the report to focus on
the cohort of graduates who are attending higher education soon after leaving secondary
school. Around 5 percent of the remaining sample (of full-time young graduates) is missing
a CSOPPSN identifier, which prevents these graduations being matched to the CSO’s
administrative databases.10 Graduates in substantial employment, in any particular year,
then form the basis of the sample used for analysis.
10 To guard against the possibility that CSOPPSN is missing in a non-random fashion, all estimates are weighted by institute, award type and graduation cohort. Full description of the weighting method is given in Appendix D.

18 An Analysis of Graduate Earnings across Higher Education Institutions
3 Descriptive Statistics
3.1 Introduction
This section presents descriptive analysis of graduates’ earnings across institutions.
Differences in the student population across institutions are then shown, which may help to
explain the observed differences in earnings across institutes. Differences in gender, the
type of second-level school previously attended, and Leaving Certificate points are shown
for each institution.
3.2 Average Earnings across Institutions
This subsection shows the trajectory of average earnings over eight years, separately for
undergraduates and postgraduates, across institutions. However, the figures that follow are
purely descriptive and do not account for other student characteristics that may determine
wages.
It is worth reiterating that the earnings analysis in this report is not directly comparable to
the CSO (2018) study despite both using the same administrative data. This is because
descriptive analysis here is based on mean earnings instead of median earnings. Average
weekly earnings for each year after graduating are shown for combined graduation cohorts.11
3.2.1 Undergraduates
Average earnings for university undergraduates are shown in Figure 1. The average earnings
do not take into account the reality that students generally enter universities with different
Leaving Certificate points and also do not account for the different subject mix offered by
institutions.
Undergraduates from TCD earn the most one, two and three years after graduating however,
undergraduates from UCD earn the most after six, seven and eight years. Graduates from
TCD earn on average €550 per week after one year, rising to €668 after three years. After
eight years, graduates from UCD earn on average €1,017 per week.
11 To explain, average earnings one year after graduation include all graduation cohorts from 2010 to 2017, while average earnings two years after graduation includes cohorts from 2010 to 2016 and so on until earnings eight years after graduation includes only the 2010 cohort.

19 An Analysis of Graduate Earnings across Higher Education Institutions
Figure 1: Undergraduates’ Average Weekly Earnings by Institution (€),
Universities
Note: Earnings are conditional on substantial employment and relate to real values in terms of 2016 consumer prices (using the headline Consumer Price Index). Calculations for each year since graduation are based on the respective sample in substantial employment in columns 2 – 9 of Table A.3.
Average earnings for college undergraduates are shown in Figure 2. Colleges primarily
offer teacher training courses, except for NCAD, which primarily offers art and design
courses. These differences are not reflected in the headline average earnings across
institutions.
Many colleges have the highest earnings one and two years after graduating compared to
all institutions, reflecting the concentration of graduates from teacher training courses.12
Undergraduates from St. Angela’s have the highest average earnings after graduating.
They earn €621 per week on average after one year, rising to on average €802 after eight
years.
12 Mater Dei Institute of Education and St. Patricks College, Drumcondra were incorporated into DCU from the 2016/17 academic year. Therefore, graduates from these institutes in 2017 are recorded as graduating from DCU.

20 An Analysis of Graduate Earnings across Higher Education Institutions
Figure 2: Undergraduates’ Average Weekly Earnings by Institution (€), Colleges
Note: Earnings are conditional on substantial employment and relate to real values in terms of 2016 consumer prices (using the headline Consumer Price Index). Calculations for each year since graduation are based on the respective sample in substantial employment in columns 2 – 9 of Table A.3.
Average earnings for undergraduates from institutes of technology are shown in Figure 3.
For readability, the institutions are displayed across two figures alphabetically (according
to the names used in this report). The average earnings do not reflect the different
student populations in each institution.
Undergraduates from DIT have the highest average earnings amongst institutes of
technology, earning €466 per week one year after graduation and €881 after eight years.

21 An Analysis of Graduate Earnings across Higher Education Institutions
Figure 3: Undergraduates’ Average Weekly Earnings by Institution (€) –
Institutes of Technology
A: Institutions A - I
B: Institutions, I - W
Note: Earnings are conditional on substantial employment and relate to real values in terms of 2016 consumer prices (using the headline Consumer Price Index). Calculations for each year since graduation are based on the respective sample in substantial employment in columns 2 – 9 of Table A.3.

22 An Analysis of Graduate Earnings across Higher Education Institutions
3.2.2 Postgraduates
Average earnings for university postgraduates are shown in Figure 4. Postgraduates from
TCD earn the most one and two years after graduating, while graduates from UCD and
DCU earn the most after four years. Postgraduates from TCD earn on average €579 per
week after one year and postgraduates from UCD and DCU earn on average around
€1,110 per week after eight years.
Figure 4: Postgraduates’ Average Weekly Earnings by Institution (€) –
Universities
Note: Earnings are conditional on substantial employment and relate to real values in terms of 2016 consumer prices (using the headline Consumer Price Index). Calculations for each year since graduation are based on the respective sample in substantial employment in columns 2 – 9 of Table A.4.
3.3 Differences in Institution Populations by Gender
The concentration of male and female graduates varies across institutions. Overall, female
graduates comprise 57 percent of the “Earnings Sample” used in this report, while male
graduates make up 43 percent.
The distribution of males and females graduating from universities generally reflects the
overall graduate gender distribution. However, TCD has proportionally more female
graduates (65 percent), while UL has proportionally less (49 percent).

23 An Analysis of Graduate Earnings across Higher Education Institutions
In general, there are proportionally more males graduating from institutes of technology
compared to the overall gender graduate distribution. Males comprise over half of
graduates from Carlow IT, DIT, GMIT, IT Blanchardstown and Letterkenny IT. However,
only 36 percent of graduates are male from Athlone IT and Limerick IT.
The majority of graduates from colleges are women. Women comprise almost all
graduates from St. Angela’s and around two in three (68 percent) graduates from NCAD.
This reflects the concentration of female graduates from art, design and educational
courses that are offered by these institutions.
Figure 5: Gender Profile by Institution
Note: The number of observations is shown and is based on the ‘Earnings Sample’ for graduation cohorts from 2010 to 2017 (column 6 in Table A.2).

24 An Analysis of Graduate Earnings across Higher Education Institutions
3.4 Differences in Institution Populations by Second-Level School Type
The type of second-level school that graduates previously attended is used in this report as
a proxy measurement of socio-economic background. Graduates’ institution is broken down
by the type of second-level school they attended prior to entering higher education in Figure
6. Overall, a similar proportion of graduates previously attended a DEIS or fee-paying school
(10 percent and 11 percent, respectively). However, this distribution varies substantially
across institutions.
Overall, for universities, more graduates previously attended a fee-paying school and less
attended a DEIS school. TCD and UCD have the highest proportion of graduates who attend
a fee-paying school (26 percent and 27 percent, respectively) compared to a DEIS school
(6 percent and 7 percent, respectively). However, NUI Maynooth, DCU, NUI Galway and UL
have higher proportions of graduates that attended a DEIS school compared to a fee-paying
school.
Overall, for institutes of technology, more graduates previously attended a DEIS school and
less attended a fee-paying school. Limerick IT and IT Blanchardstown have the highest
proportion of graduates who previously attended a DEIS school (38 percent and 31 percent
respectively). Less than half a percent of graduates from Limerick IT attended a fee-paying
school. However, around one-in-five graduates from DIT and IADT attended a fee-paying
school.
More graduates from colleges previously attended a DEIS school compared to a fee-paying
school, except for NCAD. Less than 4 percent of graduates from colleges previously attended
a fee-paying school compared to 21 percent of graduates from NCAD.
Together these trends demonstrate the importance of accounting for institution and
second-level school type simultaneously using regression analysis. This is especially
relevant given the unequal geographical spread of DEIS and fee-paying schools around the
country.

25 An Analysis of Graduate Earnings across Higher Education Institutions
Figure 6: Second-Level School Type Profile by Institution
Note: The number of observations is shown and is based on the ‘Earnings Sample’ for graduation cohorts from 2010 to 2017 (column 6 in Table A.2). Type of school is missing for 7,675 individuals or 5 percent of this sample and are included here and in the regression analysis as a missing category. Further detail on missing values is provided in Appendix B.

26 An Analysis of Graduate Earnings across Higher Education Institutions
3.5 Differences in Institution Populations by Leaving Certificate Points
Leaving Certificate points are used in this report as a measurement of academic attainment
prior to higher education. After meeting basic matriculation requirements, most students
analysed in this report are allocated places in higher education courses on the basis of their
Leaving Certificate points. It is likely that high-achieving students in the Leaving Certificate
may self-select into courses with promising job prospects.
Analysis of Leaving Certificate points is restricted to undergraduate programmes only as the
information is obtained from an individual’s record upon first registering in higher education
and this coverage is limited for postgraduates (as detailed in Section 2.1).
Entry requirements differ across institutions, so the distribution of Leaving Certificate points
varies by institution, as shown in Figure 7. Across all institutions, 49 percent of
undergraduates entered their institution with over 400 points (excluding 5 percent of
graduates with missing records).
Undergraduates from colleges achieved the highest Leaving Certificate points overall. 94
percent of St. Patrick’s graduates achieved over 400 points, while 84 percent of Mary
Immaculate graduates did so.
Graduates from universities also achieved Leaving Certificate points above average. 87
percent of TCD graduates entered their courses with over 400 points, while 45 percent
achieved over 500 points. Amongst universities, graduates from NUI Maynooth entered their
courses with the lowest Leaving Certificate points with 55 percent achieving over 400 points.
Graduates from institutes of technology generally attained lower points than the average
for all graduates. Amongst institutes of technology, graduates from IT Blanchardstown
entered with the lowest points (3 percent entered with over 400 points), while graduates
from DIT and IADT entered with the highest points (32 percent and 24 percent,
respectively, entered with over 400 points).

27 An Analysis of Graduate Earnings across Higher Education Institutions
Figure 7: Leaving Certificate Points Profile by Institution, for Undergraduates
Note: The number of observations is shown and is based on the ‘Earnings Sample’ for undergraduate graduation cohorts from 2012 to 2017 (column 1 in Table A.3). Leaving Certificate points are missing for 5,290 or 5 percent of this sample and are included here and in the regression analysis as a missing category. Further detail on missing values is provided in Appendix B.

28 An Analysis of Graduate Earnings across Higher Education Institutions
4 Regression Analysis Four Years After Graduation
4.1 Introduction
As outlined above, this report focuses on analysing graduates’ earnings across higher
education institutions. This section presents the results of regression analysis that model
graduate earnings by taking into consideration graduate characteristics that determine
wages.
For instance, entry to most courses in institutions is based on prior academic performance,
so graduate characteristics will vary across institutions. Sections 3.3, 3.4 and 3.5 show how
gender, second-level school type and Leaving Certificate points, respectively, vary across
institutions. In turn, these characteristics may also determine graduates’ earnings, which
may confound the impact of institution on graduates’ earnings. This section attempts to
compare like-for-like graduates to isolate the impact of institution on graduates’ earnings.
4.2 Regression Methodology
In keeping with most of the academic literature, the causal impact of degree subject,
institution type, gender and socio-economic background on earnings cannot be determined
without experimental data. The causal impact of higher education on earnings is masked by
a student’s innate ability, which may also drive their choice of degree subject and institution.
For example, a student with exceptional ability may earn high wages, irrespective of their
education level, but typically they are more likely to study a degree programme in an
institution with high earnings potential.
While a student’s ability is not readily observable, prior academic attainment in terms of
Leaving Certificate points, Mathematics and English grades are observed in the HEA’s new
entrant records and these are used as a proxy for ability.
In essence, the analysis employs richly specified regression models to estimate how
graduates’ earnings vary amongst similarly qualified individuals. Graduates’ earnings four
years after graduation are measured as a function of graduation cohort, institution, subject,
demographic characteristics, prior academic attainment, socio-economic controls, an
indicator for motherhood and sector of employment.
The effect of socio-economic background is measured using the type of second-level school
that graduates previously attended because it is observed for both undergraduates and
postgraduates (as detailed in Section 2.1). The analysis also captures the effects of socio-
economic background using a deprivation index score of the schools’ Electoral Division. This

29 An Analysis of Graduate Earnings across Higher Education Institutions
is because a disadvantaged school may not necessarily be located in a disadvantaged area.
Students’ socio-economic group is also captured though it is only observed for
undergraduates as it comes from their new entrant record.13
Regressions include a control for detailed ISCED field of study rather than each course
because there is limited overlap of courses with the same names across institutions.
Specifically, ordinary least squares regression models of the relationship between graduates’
characteristics and their earnings are estimated. The dependant variable in all models is the
log of weekly earnings as the log transformation reduces the impact of outliers and yields
residuals more closely resembling normal. All regressions are weighted to adjust for missing
values of CSOPPSN by institution, award type and graduation cohort.14
Average predicted earnings four years after graduation are shown separately for
undergraduates and postgraduates by institution. Two predictions are shown. The ‘Raw’
prediction shows the raw relationship between earnings and the student characteristic of
interest.15 This represents the average prediction of graduate earnings before any attempt
is made to explain part of the variation in wages.
The ‘Model’ prediction takes into account the full set of student characteristics described in
Section 2.3, meaning that comparisons are being made for like-for-like graduates. That is,
comparisons are being made between graduates from different institutions who studied the
same subject, received the same grade, are the same gender, from the same county,
attended the same type of secondary school, work in the same sector and can account for
the effect of having children on female earnings. For undergraduates, comparisons are also
made between graduates who entered higher education at the same age, had the same
performance in the Leaving Certificate and are in the same socio-economic group.
Note that predictions of undergraduate and postgraduate earnings are not directly
comparable as postgraduate regressions do not include controls for graduates’ prior
academic attainment, age at entry to higher education and socio-economic background. As
detailed in Section 2.1, this information comes from a student’s new entrant record, when
they first register in higher education, and sufficient time does not elapse to link this
information to their postgraduate qualification.
13 There may nevertheless be other factors relating to social disadvantage that may cause earnings differences among graduates that cannot be accounted for here, such as parental education or health status. 14 Full description of the weighting method is given in Appendix D: Graduates with Missing PPSN. 15 The only other characteristic included is the graduation cohort the student graduates from.

30 An Analysis of Graduate Earnings across Higher Education Institutions
Furthermore, undergraduate models are estimated for pooled 2012, 2013 and 2014
graduation cohorts when such background information can be translated to their graduation
record. The number of observations in undergraduate models is 34,788. Postgraduate
models are estimated for more graduation cohorts, pooled from 2010 to 2014, as these
models are not constrained by the availability of such background information. The number
of observations in postgraduate models is 16,731.

31 An Analysis of Graduate Earnings across Higher Education Institutions
4.3 Graduates’ Predicted Earnings by Institution
Entry requirements vary across courses and institutions and therefore, graduate
characteristics will vary across different institutions. For instance, Sections 3.3, 3.4 and 3.5
shows how gender, second-level school type and Leaving Certificate points, respectively,
vary across institutions. Differences between the raw and model predictions indicate that
the variation in earnings across institutions can, at least partially, be explained by different
subject mixes and different student populations in institutions.
4.3.1 Undergraduates
Undergraduate predicted earnings four years after graduation by institution are shown in
Figure 8. Both the raw and model predictions are shown, and institutions are sorted by the
model prediction. The average number of individuals in each institution is 1,338 and
ranges from over 100 for some colleges (123 in Mater Dei and 161 in St. Angela’s) to over
1,000 in others. The average predicted earnings, four years after graduating, for
undergraduate cohorts 2012, 2013 and 2014, is €657 per week.
In the raw prediction, university undergraduates generally earn the most, four years after
graduating. This is followed by the four teacher training colleges and then by institutes of
technology. Average predicted raw earnings are highest for TCD graduates, earning €744
per week four years after graduating, followed by DCU (€725 per week) and UCD (€720
per week). Amongst institutes of technology, DIT graduates have the highest average
predicted raw earnings (€682). However, these values do not take into account differences
in the subjects offered by institutions and different student populations.
In the model prediction, comparisons of institutions are being made for individuals who
studied the same subject, received the same grade, are the same gender, from the same
county, entered higher education at the same age, had the same performance in the
Leaving Certificate, have the same socio-economic background and work in the same
sector. A clear pattern emerges that, when otherwise similar graduates are compared, the
predicted earnings for universities decrease, while the predicted earnings for institutes of
technology and colleges increase. This indicates that some of the differences in earnings
across institutions can be explained by differences in the subjects offered by each
institution and differences in student characteristics, such as prior academic achievement.
Introducing controls for field of study and student characteristics has a considerable
impact on some institutes. For instance, undergraduates from NCAD earn the lowest
amount in terms of average predicted raw earnings (€487 per week) four years after

32 An Analysis of Graduate Earnings across Higher Education Institutions
graduating or 31 percent less than a UCC undergraduate. However, when controlling for
the impact of field of study, prior academic attainment and other characteristics, the
difference compared to a UCC undergraduate is reduced to 7 percent.
When otherwise similar graduates are compared in the model prediction, the four teacher
training colleges have the highest earnings, in terms of the model prediction, four years
after graduating. This is likely due to the relative homogeneity of graduates from these
institutions. For instance, graduates from these institutions predominantly study education
courses and work in the education sector so, there is little overlap of subjects between
these colleges and other institutions.
Amongst universities, TCD undergraduates have the highest average predicted earnings of
€687 per week when comparing otherwise similar graduates, followed by UL (€684) and
UCD (€682). Amongst institutes of technology, DIT undergraduates have the highest
average predicted earnings of €672 per week, followed by Cork IT (€661) and IT Tallaght
(€660).

33 An Analysis of Graduate Earnings across Higher Education Institutions
Figure 8: Undergraduates’ Predicted Earnings 4 Years after Graduation by
Institution (€)
Note: Predicted earnings are conditional on graduates being in substantial employment. The number of observations is 34,788. The ‘Raw Prediction’ is the predicted earnings from the model containing indicators for only the graduation cohort and institution. The ‘Model Prediction’ for undergraduates includes additional controls for subject, award type, final degree grade, gender, county of origin, age at entry to higher education, LC points, LC Maths and English grades, second-level school type, deprivation index score of schools’ Electoral Division, socio-economic group, an indicator for motherhood and sector of employment. Detailed regression results are shown in Table E.1.

34 An Analysis of Graduate Earnings across Higher Education Institutions
4.3.2 Postgraduates
Postgraduate predicted earnings four years after graduation by institution are shown in
Figure 9. Both the raw and model predictions are shown, and institutions are sorted by the
model prediction. Estimates have been supressed for institutions comprising less than 100
individuals to increase confidence that the predictions are not the result of sample
variability. Excluding these, the average number of individuals in each institute is 1,240
and ranges from over 150 for some institutions (189 in Athlone IT and 229 in Cork IT) to
over 1,000 in others. The average predicted earnings, four years after graduating, for
postgraduate cohorts 2010, 2011, 2012, 2013 and 2014 is €733 per week.
Average predicted raw earnings are highest for DCU postgraduates, earning €806 per
week four years after graduating, followed by UCD (€794 per week) and TCD (€758 per
week). Amongst institutes of technology (for which sufficient observations are available),
DIT postgraduates have the highest average predicted raw earnings (€748). However,
these earnings are not adjusted for differences in the subjects offered by institutions and
differences in student populations.
In the model prediction, comparisons of institutions are being made for individuals who
studied the same subject, received the same grade, are the same gender, are from the
same county, attended the same type of secondary school and work in the same sector.
Introducing controls for field of study and student characteristics has a considerable
impact on the teacher training colleges. Mary Immaculate College and St. Patrick’s have
the highest earnings, in terms of the model prediction, four years after graduating. This is
similar to the case for undergraduates and is likely due to the relative homogeneity of
graduates from these institutes.
Amongst universities, UCD postgraduates have the highest average predicted earnings of
€785 per week when comparing otherwise similar graduates followed by TCD (€781) and
DCU (€763). Amongst institutes of technology, DIT postgraduates have the highest
average predicted earnings of €725 per week.

35 An Analysis of Graduate Earnings across Higher Education Institutions
Figure 9: Postgraduates’ Predicted Earnings 4 Years after Graduation by
Institution (€)
Note: Predicted earnings are conditional on graduates being in substantial employment. The number of observations is 16,731. The ‘Raw Prediction’ is the predicted earnings from the model containing indicators for only the graduation cohort and institution. The ‘Model Prediction’ for postgraduates includes additional controls for subject, award type, final degree grade, gender, county of origin, second-level school type, deprivation index score of schools’ Electoral Division, an indicator for motherhood and sector of employment. Detailed regression results are shown in Table E.2.

36 An Analysis of Graduate Earnings across Higher Education Institutions
5 Conclusions
This report has extended the HEA’s previous graduate earnings report (2019) by examining
graduates’ earnings from different institutions. The report uses linked administrative data
and regression analysis to take into consideration prior academic attainment and
background characteristics.
The findings show that students’ choice of institution varies by their gender, socio-economic
background and prior academic achievement. There is also variation in the subject mix
across institutions. When these differences are taken into account, by comparing like-for-
like individuals, the returns to studying undergraduate programmes (in terms of predicted
earnings) at universities decrease, while the returns to studying at institutes of technology
and colleges increase. For instance, undergraduates from TCD and UCD have the highest
average earnings, in raw terms, four years after graduation. However, when like-for-like
graduates are compared, undergraduates from the teacher training colleges have the
highest predicted earnings.
The analysis in this report makes a further contribution to the growing evidence base on
graduates’ earnings in the Irish labour market. The report shows that differences in raw
earnings across institutions can largely be explained by differences in graduates’
characteristics, particularly their performance in the Leaving Certificate. As more data
becomes available in this longitudinal dataset in the coming years, analysis of graduates’
outcomes will continue to become richer, which will allow further investigation into key policy
issues, including social mobility afforded by higher education.

37 An Analysis of Graduate Earnings across Higher Education Institutions
References
Central Statistics Office (2018). Higher Education Outcomes, Graduation Years 2010 to
2014. Dublin: CSO.
Crawford, C., & Vignoles, A. (2014). Heterogeneity in graduate earnings by socio-
economic background (No. W14/30). IFS Working Papers.
Higher Education Authority (2019), An Analysis of Labour Market Earnings for Higher
Education Graduates in their Early Careers, Graduation Cohorts: 2010 – 2017. Dublin:
HEA.
Higher Education Authority (2018), What do graduates do? The class of 2016. Dublin:
HEA.

38 An Analysis of Graduate Earnings across Higher Education Institutions
Appendix
Appendix A: Sample Selection
Table A.2 describes the sample selection process used this report. A number of restrictions
are applied to the population of graduations from HEA-funded institutions, which is called
the ‘Graduation Sample’ in column 1.
• The HEA graduation records are missing PPSN identifiers for nearly 80 percent of non-
Irish domiciled graduates.16 This arises because non-Irish domiciled students are not
required to apply for a PPSN to study at an Irish HEI. Non-Irish domiciled graduates
were removed from the analysis to allow the report to focus on the outcomes for Irish
graduates. These numbered approximately 40,000. A further 2,500 graduations were
Irish domiciled but were from Northern Ireland and these were also removed.
• The RCSI are missing PPSN identifiers for almost 75 percent of their graduates.
Approximately 7,000 graduations from RCSI were removed to prevent the results for
this cohort being estimated for a minority of the population.
• Around 7,000 Springboard graduates were removed as these students are mostly older
with different employment histories.
• Around 500 individuals had more than one graduation in the same year. Examples
include a graduate who received a Diploma in Education in combination with an Honours
Degree in another course or a graduate receiving a Certificate in Religious Education in
combination with an Honours Degree in Education. In these cases, the lower NFQ award
type was removed.
It is important to note that the same individual can have multiple graduations over different
years. There are 357,166 individuals in the dataset but 437,445 graduation records. Table
A.1 shows the number of graduations for each individual in the dataset. One-fifth of
individuals have more than one graduation. 17.5 percent of individuals have two
graduations, 2.3 percent have three graduations, while a small number have four or five
graduations. In total, 71,045 individuals had more than one graduation.
16 Irish domicile refers only to the Republic of Ireland.

39 An Analysis of Graduate Earnings across Higher Education Institutions
Table A.1: Number of Graduations per Individual
Number of Graduations Number Percent
1 286,121 80.1%
2 62,390 17.5%
3 8,102 2.3%
4 527 0.1%
5 26 0.0%
Total No. of Individuals 357,166 100%
Note: The total number of individuals corresponds to the ‘Graduates Sample’ sample (column 2) in Table A.2.
To ensure that regressions are based on unique individuals, rather than multiple graduations
relating to the same individual, the analysis of earnings is restricted to only the individual’s
latest graduation.17 This implies that an individual’s earnings, after they graduate, are only
attributable to their latest graduation. This restriction is applied in the ‘Graduates Sample’
in column 2 of Table A.2. In total, 80,279 graduation records are dropped relating to 71,045
individuals who had more than one graduation.18
However, out of the 71,045 individuals who had more than one graduation, 16,455
individuals have two distinct periods in the labour market arising from two different
graduations. A distinct period in the labour market is defined as an individual graduating
from a course (and not enrolling in another full-time course in higher education) and then
entering substantial employment. These 16,455 individuals are re-included in the analysis
(in the ‘Latest Graduations’ in column 3) because their earnings after each graduation are
separate.19
To explain further, consider an individual who graduates with an Ordinary Degree in 2010
and graduates from an Honours Degree in 2011. They then enter the labour market in 2012
and 2013. In 2014, they enrol in a full-time Taught Masters, graduate in 2015, and re-enter
employment in 2016. Thus, this individual has two distinct periods in the labour market
arising from different graduations. Their earnings in 2012 and 2013 are earned one and two
years after graduating from their Honours Degree, while their earnings in 2016 and after
are attributable to their Masters Degree.
17 99.3 percent of individuals’ latest graduation corresponds to their highest NFQ level award. A typical example of those whose latest graduation is at a lower NFQ level than previous awards are individuals with a Level 9 Masters qualification who later graduate with a Level 8 Professional Diploma in Education. 18 Additional information on individuals’ previous graduations is described in Appendix C: Multiple Graduations in Different Years. 19 1,372 of the 8,279 individuals have more than two distinct periods in the labour market. These earlier graduations are not considered.

40 An Analysis of Graduate Earnings across Higher Education Institutions
The sample is further restricted in column 4 to full-time young graduates to enable the
report to focus on the cohort of graduates who attended higher education full-time soon
after leaving secondary school.20 Around 160,000 mature graduates were removed and a
further 7,000 young part-time graduates were removed.
A CSOPPSN identifier is required to facilitate linking of graduation records to labour market
earnings. Around 5 percent of full-time young graduates are missing a PPSN identifier and
these are dropped. The remaining number of graduates with a valid CSOPPSN is shown in
column 5 of Table A.2. To guard against the possibility that CSOPPSN is missing in a non-
random fashion, all estimates are weighted by institution, award type and graduation cohort.
Full description of the weighting method is given in Appendix D: Graduates with Missing
PPSN.
Column 6 shows the ‘Earnings Sample’. These are the individuals who have substantial
earnings on record (while not being enrolled in another full-time higher education course)
in any year after graduating.
Columns 7 to 14 show the number of individuals with substantial earnings 1 to 8 years after
graduating, while not being enrolled in another higher education course in these years. In
addition, the top 1 percent of earnings are removed from each year since graduation
(columns 7 – 14) to prevent a small number of outliers disproportionally affecting results.21
In total, 5,000 observations are dropped for this reason.
20 Appendix A describes the age threshold for young graduates, which is based on their type of degree awarded. 21 This means that an individual’s earnings may be dropped in some years after graduating but not necessarily the rest. The top 1 percent of earnings are removed by year since graduating to prevent excess earnings being omitted from individuals in the data who spent the longest period of time in the labour market. This is because these individuals who are in the labour market the longest, in general, have the highest earnings in the data.

41 An Analysis of Labour Market Earnings for Higher Education Graduates in their Early Careers
Table A.2: Sample Selection: All Graduates
(1) (2) (3) (4) (5) (6) (7) (8) (9) (10) (11) (12) (13) (14)
Graduation Graduations Graduates Latest Young Valid Earnings Substantial Employment After:
Cohort Sample Sample Graduations Full-time PPSN Sample 1 Year 2 Years 3 Years 4 Years 5 Years 6 Years 7 Years 8 Years
2010 51,008 37,349 40,819 23,072 21,247 18,312 13,227 12,775 12,453 12,404 12,366 12,360 12,327 12,629
2011 52,468 38,619 42,076 23,042 21,802 18,897 14,255 13,643 13,428 13,401 13,247 13,141 13,328
2012 53,384 39,899 42,959 23,988 22,790 19,838 15,478 14,781 14,669 14,441 14,117 14,193
2013 55,272 42,728 45,302 24,626 23,481 19,984 15,997 15,379 15,106 14,743 14,590
2014 56,335 45,216 47,171 25,451 24,003 20,430 17,211 16,398 15,988 15,777
2015 54,047 44,604 45,843 24,339 23,493 19,411 16,868 15,880 15,898
2016 56,751 50,571 51,271 28,220 27,240 20,967 18,920 18,545
2017 58,180 58,180 58,180 32,446 31,587 20,849 20,757
Total 437,445 357,166 373,621 205,184 195,643 158,688 132,713 107,401 87,542 70,766 54,320 39,694 25,655 12,629
Note: For the most recent (2017) graduation cohort, the number of graduates in column 2 is equal to the number of latest graduations in column 3. This is because a later graduation for these individuals cannot be observed yet. However, it is known whether these graduates are enrolled in another full-time course in higher education in 2018 (one year after graduating) and these individuals are excluded in the earnings samples in columns 6 and 7.

42 An Analysis of Graduate Earnings across Higher Education Institutions
Table A.3: Undergraduate Observations
(1) (2) (3) (4) (5) (6) (7) (8) (9)
Graduation Earnings Substantial Employment after:
Cohort Sample 1 Year 2 Years 3 Years 4 Years 5 Years 6 Years 7 Years 8 Years
2010 13,797 9,667 9,360 9,106 9,114 9,128 9,146 9,131 9,387
2011 14,517 10,734 10,263 10,146 10,133 9,988 9,917 10,026
2012 15,616 12,035 11,461 11,370 11,202 10,913 10,960
2013 15,710 12,429 11,876 11,681 11,405 11,294
2014 15,906 13,249 12,608 12,285 12,181
2015 15,674 13,520 12,738 12,772
2016 16,809 15,068 14,839
2017 16,982 16,981
Total 125,011 103,683 83,145 67,360 54,035 41,323 30,023 19,157 9,387
NE Total 96,697 83,282 63,522 48,108 34,788 22,207 10,960
Note: The shaded area shows the graduation cohorts (post-2012) for which new entrant (NE) information is available.
Table A.4: Postgraduate Observations
(1) (2) (3) (4) (5) (6) (7) (8) (9)
Graduation Earnings Substantial Employment After:
Cohort Sample 1 Year 2 Years 3 Years 4 Years 5 Years 6 Years 7 Years 8 Years
2010 4,515 3,560 3,415 3,347 3,290 3,238 3,214 3,196 3,242
2011 4,380 3,521 3,380 3,282 3,268 3,259 3,224 3,302
2012 4,222 3,443 3,320 3,299 3,239 3,204 3,233
2013 4,274 3,568 3,503 3,425 3,338 3,296
2014 4,524 3,962 3,790 3,703 3,596
2015 3,737 3,348 3,142 3,126
2016 4,158 3,852 3,706
2017 3,867 3,776
Total 33,677 29,030 24,256 20,182 16,731 12,997 9,671 6,498 3,242

43 An Analysis of Graduate Earnings across Higher Education Institutions
Appendix B: Details of Student Characteristics
Young Graduates Detail
Young graduates, for the purposes of this analysis, are the cohort of graduates who attend
higher education soon after leaving secondary school. The distinction between young and
mature graduates are determined using an individual’s age at graduation in combination
with award type, as set out in Table B.1.
Table B.1: Threshold Ages for Young Graduates for each Award Type
Award Type Maximum Age at Graduation
Certificate 21
Ordinary Degree 23
Honours Degree 24 plus 1 for each year the course exceeds three years
Postgraduate Diploma / Certificate 26
Taught / Research Masters 27
PhD 29
HEA-Funded Institutions Detail
Table B.2: HEA-Funded Institutions by Institution Types
Universities Colleges Institutes of Technology
Dublin City University (DCU) Mary Immaculate College, Limerick Athlone IT
National University of Ireland, Galway Mater Dei Institute of Education Cork IT
National University of Ireland,
Maynooth
National College of Art and Design
(NCAD)
Carlow IT
Trinity College Dublin (TCD) St. Angela's College of Home
Economics, Sligo
Dublin Institute of Technology (DIT)
University College Cork (UCC) St. Patricks College, Drumcondra Dun Laoghaire Institute of Art, Design
and Technology (IADT)
University College Dublin (UCD) Dundalk IT
University of Limerick (UL) Galway-Mayo IT (GMIT)
IT Blanchardstown
IT Sligo
IT Tallaght
IT Tralee
Letterkenny IT
Limerick IT
Waterford IT
Note: RCSI is not included as it is missing PPSN for 80 percent of graduates. Mater Dei Institute of Education and St. Patricks College, Drumcondra were incorporated into DCU from the 2016/17 academic year. Therefore, graduates from these institutions in 2017 are recorded as graduating from DCU.

44 An Analysis of Graduate Earnings across Higher Education Institutions
Award Type and NFQ Level Detail
In some instances, the NFQ Level does not correlate exactly to the respective award types.
The NFQ level was recoded to align with the respective award types as below. In addition,
some award types were combined as some new award types were created for graduation
cohorts after 2016 and graduates from some awards were comparatively small. The seven
‘Merged Award Types’ are included as controls in all regression models.
Table B.3: Award Type and NFQ Level
Merged Award Type Award Type NFQ Level
Undergraduate / Higher Cert Undergraduate Certificate1 6
Higher Certificate1 6
Ordinary Degree Ordinary Degree 7
Honours Degree Honours Degree 8
Postgraduate Diploma / Cert
Higher Diploma2 8
Postgraduate Diploma2 9
Postgraduate Certificates 9
Taught Masters Taught Masters 9
Research Masters Research Masters 9
PhD PhD 10
Note: 1 Undergraduate Certificates and Higher Certificates were disaggregated for graduation cohorts from 2016 to reflect the different credits associated with both qualifications. Previously they were just recorded as Undergraduate Certificates. 2 Award types for Higher Diplomas and Postgraduate Diplomas were disaggregated from 2016 to reflect their different NFQ levels. Previously, they were just recorded as Postgraduate Diplomas.
Final Degree Grade Detail
Grading practices differ between courses and across institutions. For the purposes of this
report, the grades awarded for each course were coded into four standard categories:
• First Class Honours (H1)
• Upper Second Class Honours (H21)
• Lower Second Class Honours (H22)
• Third Class Honours (H3)
In addition, an ‘Other’ category captures non-standard grade categories for graduates of
non-research programmes.22 These included grades of ‘Other Honours’, ‘Credit’, ‘Not
Specified’, ‘Recommended (for Masters Degrees)’ and ‘Unclassified’. This category is
22 Research Masters or PhD graduates are awarded degrees without a standard grade classification. Their grade is therefore excluded from the regression analysis as it is uniform and perfectly collinear with their type of award.

45 An Analysis of Graduate Earnings across Higher Education Institutions
included in the regression analysis but only comprises less than 1 percent of graduations
for the ‘Earnings Sample’ (column 6 in Table A.2).
The range of possible grades awarded for each course were analysed and certain records
were reassigned to one of the four classifications above. For instance, grades of Distinction,
Merit 1, Merit 2 and Pass were respectively assigned to H1, H21, H22, H3.
Some courses awarded both a H3 and a Pass and these were both assigned to a H3. Some
courses were awarded a generic Second Class Honours (H2) grade together with either an
Upper or Lower Second Class Honours (H21 and H22). The H2 in these cases was deemed
to be an Upper or Lower Second Class Honours, depending on which class was missing.
However, in some cases, it was unclear whether a generic Second Class Honours (H2) was
equivalent to either an Upper or Lower Second Class Honours (H21 or H22):
• Some courses were awarded a generic Second Class Honours (H2) grade in conjunction
with both a H21 and a H22. In these cases, it was assumed that a H2 is equivalent to
an Upper Second Class Honours (H21).
• Some courses were awarded a generic Second Class Honours (H2) grade without either
a H21 or H22 (or a Merit 1 or a Merit 2). In these cases, it was assumed that a H2 is
equivalent to a Lower Second Class Honours (H22).
Calculation of Leaving Certificate Points Detail
Information on Leaving Certificate points comes from the HEA’s new entrant records. It is
reported by each HEI, and it represents the total points awarded by the HEI to gain
admission to a particular course. It therefore includes additional points for portfolios and
bonus points for sitting exams through Irish. However, the data also contains each student’s
Leaving Certificate subject and grade, so a consistent measure of Leaving Certificate points
are calculated using each student’s six best subjects.23
It is worth noting that applicants can meet the matriculation requirements of a course using
multiple sittings of the Leaving Certificate, while points can only be calculated on the basis
of one sitting. These separate sittings of the Leaving Certificate are not separated in the
data so Leaving Certificate points are calculated using a maximum of 10 subjects.
For individuals whose points could not be calculated in this way, their reported points were
used when available. Points were then grouped into ranges from 155-200, 205-250, …, 555-
23 Most new entrant information predates the introduction of bonus points for Leaving Certificate Mathematics (in 2012). Therefore, these bonus points are excluded to ensure consistency.

46 An Analysis of Graduate Earnings across Higher Education Institutions
600. Points below 155 and above 600 (a small number of individuals had reported points
above 600) were coded into an ‘other’ category. These comprise around 1 percent of the
‘Earnings Sample’ for undergraduate post-2012 graduation cohorts (shaded area of column
1 in Table A.3). Points could not be calculated for an additional 4 percent of these graduates
and are coded into a missing category, which is included in all estimates throughout this
report. Note that for descriptive statistics in Section 3.5 the missing category comprises
both the ‘other’ and ‘missing’ categories.
Socio-economic Group Detail
Students’ socio-economic group is based on their fathers’ occupation. The information is
collected from students’ responses to the Equal Access Survey, which is administered to all
undergraduate new entrants at registration. Occupational information is coded into eleven
socio-economic groups following CSO procedures. These are detailed in Table B.5.
NACE Sector Detail
The sectors of employment in this report are based on the alphabetical letter of the NACE
code (Revision 2). These are detailed in Table B.5.
Age at Entry to Higher Education Detail
Age at entry to higher education is not directly observed on the HEA’s new entrant records.
However, graduates’ age and year of graduation is available in the graduation records.
These are used in conjunction with the year of entry to higher education to determine their
age at entry. Age at entry is only used in undergraduate regression models and is missing
for 3 percent of the ‘Earnings Sample’ for undergraduate post-2012 graduation cohorts
(shaded area of column 1 in Table A.3).
It is preferable to control for graduates’ age on entry to higher education rather than their
age at graduation because the latter is closely correlated with their type of award. This is
exacerbated by the fact that young graduates, in this report, are determined by their age
in combination with award type.
Detail on Missing Values
Some of the variables in Section 2.3 have missing values for some students. These missing
values are included as separate categories in the regression analysis in Sections 4 and are
also shown in the descriptive statistics in Section 3.
Missing values occur for a variety of reasons, such as variables containing ‘Unknown’
categories, inability to match graduate records to their new entrant records and information

47 An Analysis of Graduate Earnings across Higher Education Institutions
being collected from voluntary surveys. Missing data related to age at entry to higher
education and Leaving Certificate points are detailed above.
The variable recording students’ county of origin includes fields for ‘Unknown Dublin’ and
‘Unknown Ireland’, which are included in regressions. Together, these comprise less than 1
percent of the ‘Earnings Sample’ (column 6 in Table A.2).
Leaving Certificate Mathematics and English grades are missing respectively for 14 percent
and 13 percent of the ‘Earnings Sample’ for undergraduate post-2012 graduation cohorts
(shaded area of column 1 in Table A.3).
The type of second-level school could not be identified for some graduates. This information
is linked to an individual’s graduation record from the last second-level school they attended
(which is identified from the Department of Education’s PPOD records). In some instances,
graduates could be of Irish domicile (defined as resident in Ireland for three of the last five
years) but they may not have attended an Irish second-level school immediately prior to
entering higher education. Also, the PPOD data is available from 2002, which allows eight
years for the first observed postgraduates to graduate in 2010. This may be an insufficient
time span for a 29-year-old PhD student who graduates in 2010 (29 is the oldest age for a
PhD graduate to be considered a young graduate in the context of this report). This is
reflected in the rates of missing school type information. School type is missing for 3 percent
of the ‘Earnings Sample’ for undergraduates (column 1 in Table A.3) and for 11 percent of
the ‘Earnings Sample’ for postgraduates (column 1 in Table A.4).
The student’s socio-economic group is based on their father’s occupation and is collected
via a voluntary survey of undergraduate new entrants at registration. Socio-economic group
information is missing for 31 percent of the ‘Earnings Sample’ for undergraduate post-2012
graduation cohorts (shaded area of column 1 in Table A.3), which may be due to non-
response to the survey or to this specific question.
Field of Study Detail
HEIs assign each course into a field of study using the International Standard Classification
of Education (ISCED), which is developed and used by the OECD and Eurostat. ISCED fields
of study can be broken down into broad, narrow and detailed classifications.
The first column of Table B.4 shows the labels used throughout this report, which are based
on detailed ISCED fields of study. Some of these labels are in fact merged ISCED fields
where sample sizes are small. In such cases, detailed fields of study are merged within the

48 An Analysis of Graduate Earnings across Higher Education Institutions
same narrow field of study. For example, Fine Arts (ISCED code 0215) is merged with
Handicrafts (ISCED code 0214). Also, `interdisciplinary` courses are merged with courses
‘not further defined or elsewhere classified’ for the most part.
The ISCED classification system was revised for graduation cohorts from 2014 onwards. The
final two columns show the relationship between the pre- and post-2014 ISCED fields of
study. The majority of pre-2014 fields of study are simply mapped to post-2014 fields.
However, a number of pre-2014 ISCED fields are mapped according to the course name as
outlined below:
• Courses in Biology and Biochemistry (pre-2014 ISCED code 421) and Computer Science
(pre-2014 ISCED code 481) were allocated to new ISECD fields on the basis of the course
name.
• Courses in ‘combined’ fields of study are allocated according to the course name and
any remaining courses are allocated to the indicated ‘interdisciplinary’ ISCED field.
• Courses in Balanced Combination across different fields of education (pre-2014 ISCED
code 900) and Balanced Combination of 'Humanities and Arts' and 'Social Sciences
Business and Law' (pre-2014 ISCED code 910) are allocated according to the course
name and any remaining courses are allocated to ‘Arts not further defined’.

49 An Analysis of Graduate Earnings across Higher Education Institutions
Table B.4: Description of Recoding Pre-2014 ISCED Fields of Study
Fields of Study Label
Post-2014 ISCED Code
Post-2014 ISCED Label Pre-2014 ISCED Code and Label
Education 1 Education 1 Education
Pre-school teacher training & other 0110 & 0112
Education n.f.d.
Training for pre-school teachers 143 Training for pre-school teachers
Education science 0111 Education science 142 Education science
Teacher training without subject spec.
0113 Teacher training without subject specialisation
144 Training for teachers at basic levels
Teacher training with subject spec. 0114 Teacher training with subject specialisation
145 Training for teachers with subject specialisation
146 Training for teachers of vocational subjects
Arts & Humanities 2 Arts & Humanities 2 Humanities & Arts
Other arts 0210 Arts n.f.d. 210 Combined Arts
Audio-visual & media production 0211 Audio-visual techniques and media production
213 Audio-visual techniques and media production
Fashion, interior & industrial design 0212 Fashion, interior and industrial design 214 Design
Fine arts & handicrafts 0213 & 0214
Fine arts 211 Fine arts
Handicrafts 215 Craft skills
Music & performing arts 0215 Music and performing arts 212 Music and performing arts
Other humanities 0220 Humanities (except languages) n.f.d. 220 Combined Humanities
Religion & philosophy & history
0221 & 0222 & 0223
Religion and theology 221 Religion
History and archaeology 225 History and archaeology
Philosophy and ethics 226 Philosophy and ethics
Languages 0230 & 0231 & 0232
Languages n.f.d.3
Language acquisition 222 Foreign languages
Literature and linguistics 223 Mother tongue
Interdisciplinary Arts & Humanities 0288 Interdisciplinary Arts & Humanities 200 Combined Arts & Humanities1
Social Sciences 3 Social Sciences, Journalism & Information 3 Social Sciences Business & Law
Other social & behavioural sciences 0310 & 0388
Social and behavioural sciences n.f.d. 310 Combined Social and behavioural science
Interdisciplinary Social Sciences & Journalism & Information
300 Combined Social Science, Business and Law1
Economics 0311 Economics 314 Economics
Political sciences & civics 0312 Political sciences and civics 313 Political Science and civics
Psychology 0313 Psychology 311 Psychology
Sociology & cultural studies 0314 Sociology and cultural studies 312 Sociology and cultural studies
Journalism & information 0320 & 0321 & 0322
Journalism and information n.f.d. 320 Combined Journalism and Information
Journalism and reporting 321 Journalism and reporting
Library, information and archival studies 322 Library, information, archive
Business, Admin. & Law 4 Business, Administration & Law 3 Social Sciences Business & Law
Other business & administration 0410 & 0488
Business and administration n.f.d. 340 Combined Business and Administration
Interdisciplinary Business Admin & Law
Accounting & taxation 0411 Accounting and taxation 344 Accounting and taxation
Finance, banking & insurance 0412 Finance, banking and insurance 343 Finance, banking, insurance
Management & administration 0413 Management and administration 345 Management and administration
Marketing & advertising 0414 Marketing and advertising 342 Marketing and advertising
Secretarial, retail & work skills 0415 & 0416 & 0417
Secretarial and office work 346 Secretarial and office work
Wholesale and retail sales 341 Wholesale and retail sales
Work skills 347 Working life
Law 0421 Law 380 Law
Sciences, Maths & Stats. 5 Natural Sciences, Mathematics & Statistics 4 Science, Mathematics & Computing
Other biological & related sciences 0510 Biological and related sciences n.f.d. 420 Combined Life Science
Biology 0511 Biology 421 Biology and biochemistry2
Biochemistry 0512 Biochemistry 421 Biology and biochemistry2
Other earth & physical sciences 0530 0532
Physical sciences n.f.d. 440 Combined Physical Science
Earth sciences 443 Earth Science
Chemistry 0531 Chemistry 442 Chemistry
Physics 0533 Physics 441 Physics

50 An Analysis of Graduate Earnings across Higher Education Institutions
Fields of Study Label
Post-2014 ISCED Code
Post-2014 ISCED Label Pre-2014 ISCED Code and Label
Other mathematics & statistics 0540 0541
Mathematics and statistics n.f.d. 460 Combined Maths and Statistics
Mathematics 461 Mathematics
Statistics 0542 Statistics 462 Statistics
Environment 0520 & 0521 & 0522
Environment n.f.d. 421 Biology and biochemistry2
Environmental sciences 422 Environmental Science
Natural environments and wildlife 852 Natural environments and wildlife
Interdisc. Nat. Sci. Maths & Stats 0588 Interdisciplinary Natural Sciences Maths & Stats
400 Combined Science, Mathematics and Computing1
ICT 6 Information & Communication Technologies 4 Science, Mathematics & Computing
Other ICTs 0610 & 0688
Information and Communication Technologies (ICTs) n.f.d.
481 Computer Science2
Interdisciplinary ICT
Computer use 0611 Computer use 482 Computer Use
Database & network design & admin. 0612 Database and network design and administration
481 Computer Science2
Software & applications development 0613 Software and applications development and analysis
481 Computer Science2
Engineering, Man. & Const. 7 Engineering, Manufacturing & Construction 5 Engineering, Manufacturing & Construction
Other engineering
0710 & 0788 & 0712
Engineering and engineering trades n.f.d. 520 Combined Engineering & Engineering Trades
Interdisciplinary Engineering Manufacturing & Construction
500 Combined Engineering, Manufacturing and Construction1
Environmental protection technology 851 Environmental protection technology & 850 Combined Environmental Protection
Chemical engineering & processes 0711 Chemical engineering and processes 524 Chemical and process
Electricity & energy 0713 Electricity and energy 522 Electricity and energy
Electronics & automation 0714 Electronics and automation 523 Electronics and automation
Mechanics & metal trades 0715 Mechanics and metal trades 521 Mechanics and metal work
Motor vehicles, ships & aircraft 0716 Motor vehicles, ships and aircraft 525 Motor vehicles, ships and aircraft
Other materials & textiles & manufact.
0720 & 0722 & 0723 0724
Manufacturing and processing n.f.d. 540 Combined Manufacturing and Processing
Materials (glass, paper, plastic and wood) 543 Materials (wood, paper, plastic, glass)
Textiles (clothes, footwear and leather) 542 Textiles, clothes, footwear, leather
Mining and extraction 544 Mining and extraction
Food processing 0721 Food processing 541 Food processing
Other architecture & construction 0730 Architecture and construction n.f.d. 580 Combined Architecture and building
Architecture & town planning 0731 Architecture and town planning 581 Architecture and town planning
Building & civil engineering 0732 Building and civil engineering 582 Building and civil engineering
Agriculture 8 Agriculture, Forestry, Fisheries & Veterinary 6 Agriculture & Veterinary
Crop & livestock production 0811 Crop and livestock production 621 Crop and livestock production
Other agriculture, forestry & fisheries
0812 & 0819 & 0821 & 0831 & 0888
Horticulture 622 Horticulture
Agriculture n.f.d. 620 Combined Agriculture, forestry and fishery
Forestry 623 Forestry
Fisheries 624 Fisheries
Interdisciplinary Agriculture Forestry Fisheries & Veterinary
600 Combined Agriculture & Veterinary1
Veterinary 0841 Veterinary 641 Veterinary
Health & Welfare 9 Health & Welfare 7 Health & Welfare
Dental studies & other health
0910 & 0911 & 0917 & 0988
Health n.f.d. 720 Combined Health
Dental studies 724 Dental Studies
Traditional and complementary medicine and therapy3
Interdisciplinary Health & Welfare 700 Combined Health and Welfare1
Medicine 0912 Medicine 721 Medicine
Nursing & midwifery 0913 Nursing and midwifery 723 Nursing and caring
Medical diagnostic & treatment tech. 0914 Medical diagnostic and treatment technology 725 Medical diagnostic and treatment technology
Therapy & rehabilitation 0915 Therapy and rehabilitation 726 Therapy and Rehabilitation
Pharmacy 0916 Pharmacy 727 Pharmacy
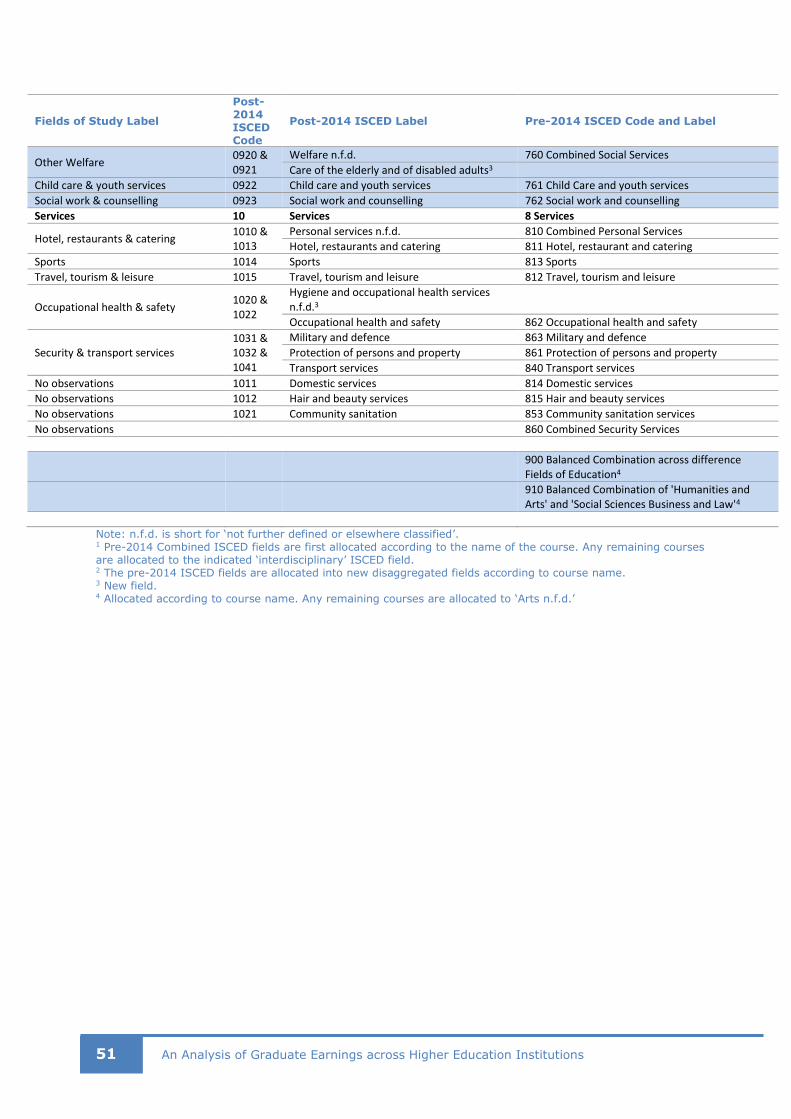
51 An Analysis of Graduate Earnings across Higher Education Institutions
Fields of Study Label
Post-2014 ISCED Code
Post-2014 ISCED Label Pre-2014 ISCED Code and Label
Other Welfare 0920 & 0921
Welfare n.f.d. 760 Combined Social Services
Care of the elderly and of disabled adults3
Child care & youth services 0922 Child care and youth services 761 Child Care and youth services
Social work & counselling 0923 Social work and counselling 762 Social work and counselling
Services 10 Services 8 Services
Hotel, restaurants & catering 1010 & 1013
Personal services n.f.d. 810 Combined Personal Services
Hotel, restaurants and catering 811 Hotel, restaurant and catering
Sports 1014 Sports 813 Sports
Travel, tourism & leisure 1015 Travel, tourism and leisure 812 Travel, tourism and leisure
Occupational health & safety 1020 & 1022
Hygiene and occupational health services n.f.d.3
Occupational health and safety 862 Occupational health and safety
Security & transport services 1031 & 1032 & 1041
Military and defence 863 Military and defence
Protection of persons and property 861 Protection of persons and property
Transport services 840 Transport services
No observations 1011 Domestic services 814 Domestic services
No observations 1012 Hair and beauty services 815 Hair and beauty services
No observations 1021 Community sanitation 853 Community sanitation services
No observations 860 Combined Security Services
900 Balanced Combination across difference Fields of Education4
910 Balanced Combination of 'Humanities and Arts' and 'Social Sciences Business and Law'4
Note: n.f.d. is short for ‘not further defined or elsewhere classified’. 1 Pre-2014 Combined ISCED fields are first allocated according to the name of the course. Any remaining courses are allocated to the indicated ‘interdisciplinary’ ISCED field. 2 The pre-2014 ISCED fields are allocated into new disaggregated fields according to course name. 3 New field. 4 Allocated according to course name. Any remaining courses are allocated to ‘Arts n.f.d.’

52 An Analysis of Graduate Earnings across Higher Education Institutions
Table B.5: Description of Student Characteristics
Variable # Obs. Percent Variable # Obs. Percent
Graduation Year Institution Type
2010 18,312 11.5% College 9,588 6.0%
2011 18,897 11.9% Institute of Technology 57,607 36.3%
2012 19,838 12.5% University 91,493 57.7%
2013 19,984 12.6% Total 158,688 100%
2014 20,430 12.9% Institution
2015 19,411 12.2% Athlone IT 3,214 2.0%
2016 20,967 13.2% Carlow IT 2,968 1.9%
2017 20,849 13.1% Cork IT 6,471 4.1%
Total 158,688 100% DCU 10,889 6.9%
Field of Study DIT 13,255 8.4%
Pre-school teacher training & other 719 0.5% Dundalk IT 3,929 2.5%
Education science 1,588 1.0% GMIT 4,029 2.5%
Teacher training without subject spec. 6,976 4.4% IADT 2,021 1.3%
Teacher training with subject spec. 4,969 3.1% IT Blanchardstown 1,450 0.9%
Other Arts 5,083 3.2% IT Sligo 3,561 2.2%
Audio-visual & media production 2,929 1.8% IT Tallaght 2,631 1.7%
Fashion interior & industrial design 2,077 1.3% IT Tralee 1,850 1.2%
Fine arts & handicrafts 1,601 1.0% Letterkenny IT 1,940 1.2%
Music & performing arts 2,104 1.3% Limerick IT 4,122 2.6%
Other Humanities 3,200 2.0% Mary I. 4,215 2.7%
Religion & philosophy & history 1,979 1.2% Mater Dei 456 0.3%
Languages 3,591 2.3% NCAD 1,138 0.7%
Interdisciplinary arts & humanities 1,101 0.7% NUI Galway 13,097 8.3%
Other Social & behavioural sciences 2,255 1.4% NUI Maynooth 8,457 5.3%
Economics 1,203 0.8% St. Angela's 644 0.4%
Political sciences & civics 1,311 0.8% St. Patrick's 3,135 2.0%
Psychology 1,997 1.3% TCD 12,004 7.6%
Sociology & cultural studies 2,419 1.5% UCC 16,470 10.4%
Journalism & information 1,208 0.8% UCD 19,212 12.1%
Other Business & administration 13,249 8.3% UL 11,364 7.2%
Accounting & taxation 4,981 3.1% Waterford IT 6,166 3.9%
Finance banking & insurance 1,840 1.2% Total 158,688 100%
Management & administration 9,016 5.7% Award Type
Marketing & advertising 4,112 2.6% Undergraduate / Higher Cert 2,169 1.4%
Secretarial retail & work skills 793 0.5% Ordinary Degree 8,849 5.6%
Law 5,378 3.4% Honours Degree 113,993 71.8%
Other Biological & related sciences 1,818 1.1% Postgraduate Diploma / Cert 6,526 4.1%
Biology 3,129 2.0% Taught Masters 24,418 15.4%
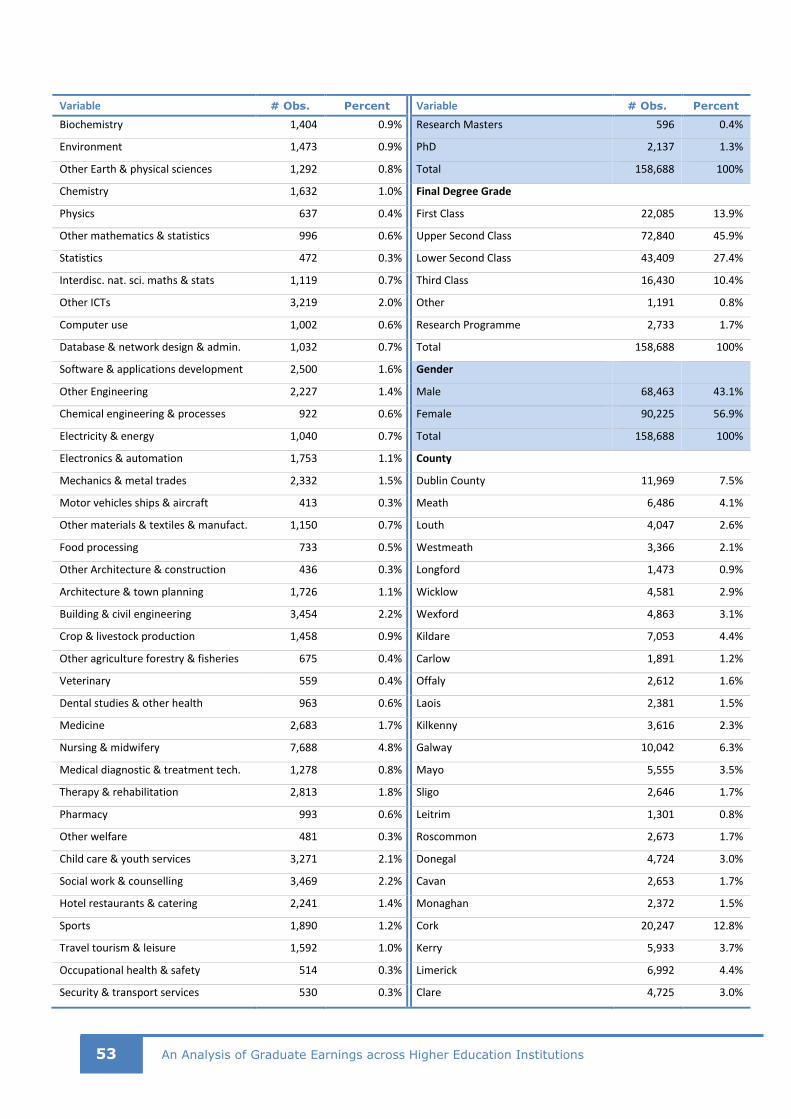
53 An Analysis of Graduate Earnings across Higher Education Institutions
Variable # Obs. Percent Variable # Obs. Percent
Biochemistry 1,404 0.9% Research Masters 596 0.4%
Environment 1,473 0.9% PhD 2,137 1.3%
Other Earth & physical sciences 1,292 0.8% Total 158,688 100%
Chemistry 1,632 1.0% Final Degree Grade
Physics 637 0.4% First Class 22,085 13.9%
Other mathematics & statistics 996 0.6% Upper Second Class 72,840 45.9%
Statistics 472 0.3% Lower Second Class 43,409 27.4%
Interdisc. nat. sci. maths & stats 1,119 0.7% Third Class 16,430 10.4%
Other ICTs 3,219 2.0% Other 1,191 0.8%
Computer use 1,002 0.6% Research Programme 2,733 1.7%
Database & network design & admin. 1,032 0.7% Total 158,688 100%
Software & applications development 2,500 1.6% Gender
Other Engineering 2,227 1.4% Male 68,463 43.1%
Chemical engineering & processes 922 0.6% Female 90,225 56.9%
Electricity & energy 1,040 0.7% Total 158,688 100%
Electronics & automation 1,753 1.1% County
Mechanics & metal trades 2,332 1.5% Dublin County 11,969 7.5%
Motor vehicles ships & aircraft 413 0.3% Meath 6,486 4.1%
Other materials & textiles & manufact. 1,150 0.7% Louth 4,047 2.6%
Food processing 733 0.5% Westmeath 3,366 2.1%
Other Architecture & construction 436 0.3% Longford 1,473 0.9%
Architecture & town planning 1,726 1.1% Wicklow 4,581 2.9%
Building & civil engineering 3,454 2.2% Wexford 4,863 3.1%
Crop & livestock production 1,458 0.9% Kildare 7,053 4.4%
Other agriculture forestry & fisheries 675 0.4% Carlow 1,891 1.2%
Veterinary 559 0.4% Offaly 2,612 1.6%
Dental studies & other health 963 0.6% Laois 2,381 1.5%
Medicine 2,683 1.7% Kilkenny 3,616 2.3%
Nursing & midwifery 7,688 4.8% Galway 10,042 6.3%
Medical diagnostic & treatment tech. 1,278 0.8% Mayo 5,555 3.5%
Therapy & rehabilitation 2,813 1.8% Sligo 2,646 1.7%
Pharmacy 993 0.6% Leitrim 1,301 0.8%
Other welfare 481 0.3% Roscommon 2,673 1.7%
Child care & youth services 3,271 2.1% Donegal 4,724 3.0%
Social work & counselling 3,469 2.2% Cavan 2,653 1.7%
Hotel restaurants & catering 2,241 1.4% Monaghan 2,372 1.5%
Sports 1,890 1.2% Cork 20,247 12.8%
Travel tourism & leisure 1,592 1.0% Kerry 5,933 3.7%
Occupational health & safety 514 0.3% Limerick 6,992 4.4%
Security & transport services 530 0.3% Clare 4,725 3.0%

54 An Analysis of Graduate Earnings across Higher Education Institutions
Variable # Obs. Percent Variable # Obs. Percent
Total 158,688 100% Tipperary 5,967 3.8%
Age at Entry to Higher Education Waterford 4,238 2.7%
17 7,317 7.6% Dublin 1 163 0.1%
18 43,715 45.2% Dublin 2 108 0.1%
19 36,538 37.8% Dublin 3 1,042 0.7%
20 5,456 5.6% Dublin 4 853 0.5%
21 1,100 1.1% Dublin 5 1,233 0.8%
Missing 2,571 2.7% Dublin 6 995 0.6%
Total 96,697 100% Dublin 6W 1,163 0.7%
Leaving Certificate Points Dublin 7 904 0.6%
155-200 1,134 1.2% Dublin 8 432 0.3%
205-250 3,103 3.2% Dublin 9 1,439 0.9%
255-300 7,165 7.4% Dublin 10 201 0.1%
305-350 13,598 14.1% Dublin 11 919 0.6%
355-400 18,801 19.4% Dublin 12 979 0.6%
405-450 19,322 20.0% Dublin 13 1,035 0.7%
455-500 15,465 16.0% Dublin 14 1,902 1.2%
505-550 8,839 9.1% Dublin 15 2,621 1.7%
555-600 3,980 4.1% Dublin 16 2,478 1.6%
Other 1,174 1.2% Dublin 17 196 0.1%
Missing 4,116 4.3% Dublin 18 1,784 1.1%
Total 96,697 100% Dublin 20 359 0.2%
Leaving Certificate Mathematics Dublin 22 748 0.5%
Higher A1 1,492 1.5% Dublin 24 1,571 1.0%
Higher A2 1,741 1.8% Unknown Dublin 1,053 0.7%
Higher B1 2,297 2.4% Unknown Ireland 104 0.1%
Higher B2 2,826 2.9% Total 158,688 100%
Higher B3 3,324 3.4% Leaving Certificate English
Higher C1 3,358 3.5% Higher A1 3,685 3.8%
Higher C2 3,182 3.3% Higher A2 5,823 6.0%
Higher C3 2,592 2.7% Higher B1 4,905 5.1%
Higher D1 1,942 2.0% Higher B2 8,167 8.4%
Higher D2 1,244 1.3% Higher B3 10,901 11.3%
Higher D3 869 0.9% Higher C1 9,687 10.0%
Higher Fail 170 0.2% Higher C2 10,531 10.9%
Ordinary A1 3,775 3.9% Higher C3 9,046 9.4%
Ordinary A2 6,047 6.3% Higher D1 5,621 5.8%
Ordinary B1 7,724 8.0% Higher D2 3,049 3.2%
Ordinary B2 8,443 8.7% Higher D3 1,635 1.7%
Ordinary B3 8,126 8.4% Higher Fail 95 0.1%

55 An Analysis of Graduate Earnings across Higher Education Institutions
Variable # Obs. Percent Variable # Obs. Percent
Ordinary C1 7,033 7.3% Ordinary A1 636 0.7%
Ordinary C2 5,898 6.1% Ordinary A2 1,432 1.5%
Ordinary C3 4,469 4.6% Ordinary B1 944 1.0%
Ordinary D1 2,989 3.1% Ordinary B2 1,694 1.8%
Ordinary D2 1,728 1.8% Ordinary B3 2,502 2.6%
Ordinary D3 1,239 1.3% Ordinary C1 1,182 1.2%
Ordinary Fail 267 0.3% Ordinary C2 1,300 1.3%
Missing 13,922 14.4% Ordinary C3 894 0.9%
Total 96,697 100% Ordinary D1 304 0.3%
Socio-Economic Group Ordinary D2 173 0.2%
(A) Employers & Managers 13,054 13.5% Ordinary D3 99 0.1%
(B) Higher Professional 6,839 7.1% Ordinary Fail 6 0.0%
(C) Lower Professional 6,195 6.4% Missing 12,386 12.8%
(D) Non-manual 6,559 6.8% Total 96,697 100%
(E) Manual Skilled 7,676 7.9% Mother Indicator
(F) Semi-skilled 3,736 3.9% No 68,104 96.2%
(G) Unskilled 2,040 2.1% Yes 2,662 3.8%
(H) Own Account Workers 5,238 5.4% Total 70,766 100%
(I) Farmers 6,389 6.6% Employment Sector
(J) Agricultural Workers 406 0.4% Agriculture Forestry & Fishing (A) 572 0.8%
(Z) Other Occupied & Unknown 8,914 9.2% Industry (B-E) 6,162 8.7%
Missing 29,651 30.7% Construction (F) 1,278 1.8%
Total 96,697 100% Wholesale & Retail (G) 7,063 10.0%
School Type Transportation & Storage (H) 855 1.2%
DEIS 16,486 10.4% Accommodation & Food Services (I) 2,453 3.5%
Fee-Paying 16,729 10.5% Information & Communication 5,356 7.6%
Missing 7,675 4.8% Finance & Real Estate (K-L) 7,190 10.2%
Standard 117,798 74.2% Professional Scientific & Technical (M) 10,478 14.8%
Total 158,688 100.0% Administrative & Support Services (N) 4,097 5.8%
Deprivation Index Score of School ED Public Administration & Defence (O) 2,992 4.2%
Less than (or equal to) -10 24,527 15.5% Education (P) 12,032 17.0%
-10 to 0 47,477 29.9% Health & Social Work (Q) 8,321 11.8%
0 to 10 34,137 21.5% Other Activities (R-U) 1,767 2.5%
Greater than 10 44,872 28.3% Missing 150 0.2%
Missing 7,675 4.8% Total 70,766 100%
Total 158,688 100%
Note: The number of observations for most student characteristics is 158,688 and refers to the `Earnings Sample’ for all graduation cohorts (column 6 in Table A.2). The number of observations for age at entry to higher education, Leaving Certificate and socio-economic group information is 96,697 because this information is available for undergraduates only and refers to the ‘Earnings Sample’ for 2012 to 2017 undergraduate cohorts (column 1 in Table A.3). The number of observations for the mother indicator and employment sector is 70,766 because these are the only indicators which vary according to the year of employment and refers to those with substantial earnings four years after graduation (column 10 in Table A.2).

56 An Analysis of Graduate Earnings across Higher Education Institutions
Appendix C: Multiple Graduations in Different Years
As previously shown in Table A.2, one-fifth of individuals have more than one graduation
over different academic years. While the analysis in this paper is restricted to an individuals’
latest graduation, this Appendix sheds further light on individuals’ previous graduations with
respect to their award types and field of study.
Table C.1 shows the relationship between previous and later award types for individuals’
last two graduations. The vast majority of undergraduates obtain a higher level of award
(these are illustrated in bold). For instance, 97 percent of Ordinary Degree graduates
subsequently obtain an Honours Degree. 92 percent of Higher Degree graduates
subsequently obtain a postgraduate qualification. Most postgraduates obtain another
postgraduate qualification. For instance, 52 percent of PhD graduates obtain a further
Postgraduate Diploma qualification, while 25 percent obtain a Taught Masters.
Table C.1: Award Types for Multiple Graduations
Latest Graduation
Previous Graduation
Undergrad / Higher
Cert Ordinary Degree
Honours Degree
Postgrad Diploma
Taught Masters
Research Masters PhD Total
Undergrad / Higher Cert 8% 55% 29% 3% 4% 0% 0% 100% Ordinary Degree 1% 0% 97% 1% 1% 0% 0% 100% Honours Degree 3% 0% 5% 18% 69% 2% 3% 100% Postgrad Diploma 4% 0% 1% 29% 58% 2% 5% 100% Taught Masters 9% 1% 4% 44% 29% 1% 12% 100% Research Masters 5% 1% 6% 29% 16% 4% 40% 100% PhD 6% 0% 7% 52% 25% 0% 9% 100%
Note: The number of observations is 71,045 individuals who have a second graduation. This corresponds to the number of individuals with more than one graduation in Table A.2. This analysis is restricted to individuals’ last two graduations.
Table C.2 shows the relationship between previous and later fields of study for individuals’
last two graduations. The majority of graduates pursue further qualifications in later
academic years in the same field of study. For instance, over 70 percent of Education,
Business, ICT, Engineering Manufacturing & Construction, Agriculture and Health graduates
obtain further a qualification in the same field.
Arts and Humanities and Social Sciences graduates are most likely to graduate with a second
qualification in different a different field. One-quarter (26 percent) of Arts and Humanities
graduates obtain a further qualification in Education, while 14 percent study Business,
Administration and Law and 11 percent study Social Sciences.
Amongst Social Sciences graduates, nearly one-quarter (23 percent) receive a later
qualification in Business, Administration and Law, while 12 percent graduate from Health &
Welfare and 11 percent from Education.

57 An Analysis of Graduate Earnings across Higher Education Institutions
Table C.2: Broad Fields of Study for Multiple Graduations
Latest Graduation
Previous Graduation
Education
Arts & Humanit
ies Social
Sciences
Business, Admin. & Law
Sciences, Maths & Stats. ICTs
Eng., Man. & Const.
Agriculture
Health & Welfare Services Total
Education 71% 9% 4% 5% 2% 2% 1% 0% 5% 1% 100% Arts & Humanities 26% 40% 11% 14% 1% 4% 1% 0% 2% 0% 100% Social Sciences 11% 7% 40% 23% 2% 4% 1% 0% 12% 1% 100% Business, Admin. & Law 3% 1% 3% 86% 0% 4% 1% 0% 1% 1% 100% Sciences, Maths & Stats. 8% 1% 1% 6% 56% 3% 10% 1% 13% 2% 100% ICTs 1% 4% 1% 7% 2% 82% 1% 0% 0% 0% 100% Eng., Man. & Const. 2% 1% 0% 7% 3% 4% 79% 0% 1% 2% 100% Agriculture 4% 0% 0% 15% 9% 0% 3% 68% 1% 1% 100% Health & Welfare 5% 2% 5% 4% 2% 1% 1% 0% 78% 2% 100% Services 3% 1% 1% 24% 1% 1% 2% 0% 4% 64% 100%
Note: The number of observations is 71,045 individuals who have a second graduation. This corresponds to the number of individuals with more than one graduation in Table A.2. This analysis is restricted to individuals’ last two graduations.

58 An Analysis of Graduate Earnings across Higher Education Institutions
Appendix D: Graduates with Missing PPSN
CSOPPSN identifiers are missing for 5 percent of graduates from the HEA’s records of young,
full-time and Irish domiciled graduates (column 4 in Table A.2). Figure D.1 shows the rates
of missing CSOPPSN across several key variables: institution, graduation year, gender,
award type and field of study. Rates of missing CSOPPSN are broadly similar across gender
and subject of study. Amongst institutions, TCD has the highest rate of missing identifiers
(13 percent) followed by UCD (10 percent), Cork IT (7 percent) and NUI Galway (7 percent).
Institutions with less than 1 percent missing graduate identifiers include Dundalk IT, IADT,
Limerick IT, Mater Dei, NCAD, NUI Maynooth, St. Patrick’s College and UCC.
CSOPPSN identifier coverage improves for more recent graduation cohorts. 8 percent of
graduate records were returned with a missing identifier in 2010, while 3 percent were
missing after 2015. Postgraduate courses have higher rates of missing identifiers. For
instance, PPSN identifiers are missing for around 3 percent of undergraduate award types
compared to missing identifiers for 14 percent and 17 percent of Research Masters and
PhDs, respectively.
This analysis shows that rates of missing CSOPPSN are most prevalent across institution,
award type and graduation cohort. To account for the non-random nature of missing
CSOPPSN identifiers, post-stratification weights are applied for these three strata where the
primary sampling units are the observed graduates.

59 An Analysis of Graduate Earnings across Higher Education Institutions
Figure D.1: Rates of Missing CSOPPSN
(A) By Institution
(B) By Graduation Year, Gender and Award Type
(C) By Subject (Broad ISCED)
Note: The number of observations is 205,184 young full-time individuals, which correspond to the ‘Young Full-Time’ sample (column 4) in Table A.2. Full names for institutions are given in Table B.2.

60 An Analysis of Graduate Earnings across Higher Education Institutions
Appendix E: Detailed Regression Results
Table E.1: Undergraduates Regression Results for Institution, 4 Years after
Graduation
Institute Institute Subject Degree Demo-
graphics Pre-HE Attain
SEG Mother Sector
Athlone IT -20.41*** -18.21*** -11.74*** -10.27*** -6.73*** -6.79*** -6.48*** -6.19*** (1.14) (1.13) (1.23) (1.42) (1.52) (1.52) (1.52) (1.47) Carlow IT -20.26*** -16.75*** -11.50*** -11.05*** -7.98*** -7.89*** -7.54*** -7.25*** (1.29) (1.34) (1.41) (1.57) (1.66) (1.67) (1.66) (1.60) Cork IT -7.31*** -5.42*** -2.02* -2.23* 1.16 1.11 1.38 1.26 (1.17) (1.15) (1.19) (1.19) (1.28) (1.28) (1.28) (1.23) DCU 3.03*** 2.35** 3.27*** 2.28* 3.59*** 3.37** 3.45** 2.60** (1.18) (1.09) (1.10) (1.34) (1.36) (1.37) (1.37) (1.31) DIT -3.04*** -0.37 2.07** 0.53 3.06** 2.98** 3.15** 2.88** (1.02) (1.03) (1.05) (1.31) (1.36) (1.36) (1.35) (1.30) Dundalk IT -17.04*** -13.58*** -9.16*** -9.37*** -6.56*** -6.42*** -5.94*** -5.76*** (1.08) (1.09) (1.15) (1.43) (1.52) (1.52) (1.52) (1.47) GMIT -16.14*** -13.03*** -9.99*** -8.92*** -5.62*** -5.59*** -5.17*** -4.28*** (1.19) (1.16) (1.19) (1.38) (1.47) (1.47) (1.47) (1.44) IADT -15.44*** -4.84** -1.67 -3.09 0.35 0.29 0.09 -1.14 (1.78) (2.00) (2.03) (2.15) (2.26) (2.25) (2.24) (2.11) IT Blanchardstown -10.89*** -10.30*** -2.95 -4.38** -1.36 -1.28 -0.49 -0.45 (1.74) (1.69) (1.82) (2.00) (2.10) (2.11) (2.13) (2.06) IT Sligo -21.27*** -16.92*** -12.21*** -11.26*** -8.18*** -8.17*** -7.78*** -7.71*** (1.12) (1.18) (1.25) (1.45) (1.54) (1.54) (1.54) (1.48) IT Tallaght -7.12*** -7.44*** -1.38 -3.45** 0.06 0.41 1.01 1.14 (1.35) (1.32) (1.40) (1.63) (1.75) (1.75) (1.76) (1.66) IT Tralee -24.30*** -18.35*** -12.00*** -10.66*** -7.90*** -7.94*** -7.40*** -6.84*** (1.43) (1.49) (1.62) (1.70) (1.77) (1.78) (1.76) (1.70) Letterkenny IT -28.77*** -28.27*** -23.57*** -19.38*** -16.42*** -16.24*** -15.69*** -15.26*** (1.43) (1.40) (1.48) (1.77) (1.87) (1.87) (1.85) (1.79) Limerick IT -17.18*** -16.04*** -10.64*** -9.92*** -6.46*** -6.63*** -6.36*** -5.34*** (1.13) (1.11) (1.18) (1.30) (1.39) (1.39) (1.39) (1.35) Mary I. -3.53*** 4.90*** 7.38*** 7.34*** 5.59*** 5.57*** 5.74*** 5.83*** (1.05) (1.50) (1.54) (1.58) (1.56) (1.56) (1.55) (1.53) Mater Dei -9.34*** 1.38 4.65 5.04* 8.72*** 8.75*** 9.55*** 8.29*** (2.45) (2.82) (2.93) (2.98) (3.14) (3.16) (3.19) (3.01) NCAD -30.79*** -10.91*** -8.69*** -9.69*** -7.53** -7.58** -7.91** -6.79** (2.25) (3.06) (3.15) (3.17) (3.32) (3.31) (3.30) (3.19) NUI Galway -7.27*** -3.35*** -1.79 -0.85 0.52 0.38 0.66 0.54 (1.14) (1.12) (1.15) (1.35) (1.37) (1.37) (1.38) (1.32) NUI Maynooth -10.49*** -0.80 0.34 -0.52 0.72 0.84 1.09 1.03 (1.08) (1.19) (1.20) (1.42) (1.44) (1.44) (1.44) (1.37) St. Angela's 1.32 6.44*** 7.14*** 9.56*** 10.08*** 9.92*** 9.78*** 8.82*** (1.96) (2.31) (2.29) (2.46) (2.46) (2.48) (2.46) (2.46) St. Patrick's 0.03 7.37*** 9.00*** 8.84*** 7.02*** 6.90*** 6.82*** 6.86*** (1.02) (1.56) (1.59) (1.80) (1.79) (1.79) (1.79) (1.74) TCD 5.86*** 8.68*** 9.16*** 8.36*** 6.37*** 6.22*** 6.26*** 5.23*** (1.24) (1.20) (1.22) (1.47) (1.43) (1.43) (1.42) (1.36) UCC - - - - - - - - UCD 2.44** 5.42*** 6.50*** 5.21*** 4.64*** 4.65*** 4.89*** 4.42*** (1.11) (1.03) (1.06) (1.30) (1.29) (1.29) (1.29) (1.24) UL 1.18 2.39** 4.44*** 4.43*** 5.05*** 5.09*** 5.33*** 4.78*** (1.10) (1.03) (1.05) (1.14) (1.15) (1.15) (1.15) (1.09) Waterford IT -19.11*** -13.72*** -9.47*** -8.91*** -5.93*** -5.92*** -5.38*** -4.65*** (1.00) (1.03) (1.08) (1.22) (1.30) (1.30) (1.29) (1.25)

61 An Analysis of Graduate Earnings across Higher Education Institutions
Institute Subject Degree Demo-
graphics Pre-HE Attain
SEG Mother Sector
Observations 34,788 34,788 34,788 34,788 34,788 34,788 34,788 34,788 R-squared 0.072 0.234 0.258 0.266 0.271 0.272 0.281 0.335 Controls: Graduation Cohort Institution Subject Award Type Final Degree Grade Gender County of Origin Age at Entry to HE Leaving Certificate Points Leaving Certificate Maths Leaving Certificate English Second-Level School Type School ED Deprivation Index Socio-Economic Group Mother Sector
Note: *, **, and *** denotes significance at the 10%, 5% and 1% level respectively. Coefficients and standard errors (in parentheses) show percentage differences in each institutions’ earnings compared to UCC. The variables included in the set of controls are described further in Section 2.3 and Appendix B. The coefficients (and standard errors) have been transformed from log percentage points into percentage points using the transformation 100(𝑒𝑏 − 1) where b is the log percentage points coefficient. The delta method is used to transform the log point standard errors (se) to percentage points using the transformation 𝑠𝑒 × 100(𝑒𝑏).

62 An Analysis of Graduate Earnings across Higher Education Institutions
Table E.2: Postgraduates Regression Results for Institution, 4 Years after
Graduation
Institute Institute Subject Degree Demo-
graphics SEG Mother Sector
Athlone IT -6.52** -13.90*** -15.88*** -12.50*** -12.24*** -11.90*** -11.29*** (2.69) (2.62) (2.51) (2.67) (2.68) (2.67) (2.63) Carlow IT -8.21 -8.42 -8.11 -5.20 -5.02 -3.51 -4.26 (5.94) (6.45) (6.33) (6.82) (6.79) (6.40) (6.42) Cork IT -8.52*** -6.59*** -7.23*** -7.64*** -7.36*** -7.09*** -5.85** (2.38) (2.39) (2.38) (2.37) (2.38) (2.40) (2.33) DCU 12.72*** 6.65*** 7.13*** 9.74*** 9.93*** 10.04*** 9.83*** (1.28) (1.22) (1.22) (1.50) (1.50) (1.49) (1.43) DIT 4.54*** 0.34 2.50* 4.48*** 4.49*** 4.57*** 4.40*** (1.25) (1.33) (1.36) (1.61) (1.61) (1.59) (1.55) Dundalk IT -4.78 -17.17*** -17.12*** -13.78*** -13.39*** -13.26*** -12.03*** (3.22) (3.06) (3.01) (3.34) (3.36) (3.34) (3.26) GMIT -0.64 -10.19*** -10.01*** -6.87** -6.62* -6.82** -4.12 (3.48) (3.15) (3.16) (3.35) (3.36) (3.36) (3.61) IADT -24.52*** -7.48 -8.34 -6.51 -6.26 -6.62 -8.44 (4.88) (6.52) (6.26) (6.43) (6.45) (6.43) (5.89) IT Blanchardstown -6.80 -13.85 -12.89 -11.82 -11.24 -11.77 -13.49 (12.94) (11.83) (11.96) (11.95) (11.95) (11.91) (10.91) IT Sligo -13.16* -17.37** -16.84* -14.13 -14.16 -13.54 -13.50 (7.26) (7.65) (8.44) (8.69) (8.72) (8.82) (8.46) IT Tallaght 40.26*** 15.39** 11.53 14.04* 14.77** 16.73*** 16.06*** (11.88) (7.67) (7.84) (7.79) (7.82) (6.91) (5.82) IT Tralee -29.30*** -30.52*** -32.44*** -32.16*** -32.05*** -31.51*** -31.37*** (4.94) (4.16) (4.04) (4.18) (4.21) (3.78) (3.32) Letterkenny IT -14.28*** -26.80*** -26.19*** -22.48*** -22.15*** -21.61*** -19.41*** (3.06) (2.54) (2.51) (2.87) (2.89) (2.92) (3.06) Limerick IT -15.86*** -14.44*** -11.97*** -10.29** -10.15** -9.81** -10.18** (3.90) (3.73) (3.76) (3.88) (3.88) (3.83) (3.76) Mary I. 0.21 17.31*** 16.36*** 17.65*** 17.51*** 17.58*** 18.73*** (1.63) (2.99) (2.92) (2.95) (2.95) (2.90) (2.87) Mater Dei -6.19* 7.79** 1.75 4.89 4.67 5.42 7.52* (3.55) (4.02) (3.77) (4.01) (3.98) (3.92) (4.00) NCAD -24.81*** -15.70*** -16.31*** -14.01*** -14.19*** -14.11*** -13.78*** (4.00) (4.29) (4.24) (4.39) (4.38) (4.40) (4.33) NUI Galway -6.05*** -3.10*** -3.52*** -0.53 -0.44 -0.42 -0.49 (0.99) (1.01) (0.99) (1.25) (1.25) (1.24) (1.19) NUI Maynooth -3.87*** -0.11 0.25 2.55* 2.71** 2.86** 3.06** (1.12) (1.15) (1.14) (1.38) (1.39) (1.38) (1.34) St. Angela's 25.04*** 38.09*** 41.23*** 48.54*** 48.28*** 46.87*** 46.16*** (6.48) (7.37) (9.09) (10.13) (10.00) (9.98) (9.84) St. Patrick's 4.76*** 21.21*** 21.15*** 24.83*** 24.70*** 24.70*** 25.53*** (1.16) (2.79) (2.74) (2.91) (2.91) (2.86) (2.78) TCD 5.94*** 11.36*** 10.68*** 12.97*** 12.94*** 12.85*** 12.48*** (1.32) (1.36) (1.37) (1.60) (1.59) (1.59) (1.54) UCC - - - - - - - UCD 11.05*** 12.16*** 10.90*** 13.07*** 12.82*** 12.83*** 13.03*** (1.09) (1.15) (1.13) (1.42) (1.42) (1.41) (1.36) UL 0.06 1.66 1.13 2.52** 2.61** 2.85** 3.29*** (1.15) (1.16) (1.15) (1.27) (1.27) (1.26) (1.24) Waterford IT -8.75*** -9.50*** -10.55*** -9.73*** -9.55*** -9.11*** -7.89*** (2.06) (1.96) (1.91) (2.08) (2.09) (2.07) (2.11) Observations 16,731 16,731 16,731 16,731 16,731 16,731 16,731 R-squared 0.049 0.206 0.235 0.241 0.242 0.248 0.293

63 An Analysis of Graduate Earnings across Higher Education Institutions
Institute Subject Degree Demo-
graphics SEG Mother Sector
Controls: Graduation Cohort Institution Subject Award Type Final Degree Grade Gender County of Origin Second-Level School Type School ED Deprivation Index Mother Sector
Note: *, **, and *** denotes significance at the 10%, 5% and 1% level respectively. Coefficients and standard errors (in parentheses) show percentage differences in each institutions’ earnings compared to UCC. The variables included in the set of controls are described further in Section 2.3 and Appendix B. The coefficients (and standard errors) have been transformed from log percentage points into percentage points using the transformation 100(𝑒𝑏 − 1) where b is the log percentage points coefficient. The delta method is used to transform the log point standard errors (se) to percentage points using the transformation 𝑠𝑒 × 100(𝑒𝑏).