an analysis of financial statement fraud at the audit
TRANSCRIPT

AN ANALYSIS OF FINANCIAL STATEMENT FRAUD AT THE AUDIT ASSERTION LEVEL
Isabel Wang
The Australian National University, Canberra, Australia
Renee Radich
Macquarie University, Sydney, Australia
Neil Fargher
The Australian National University, Canberra, Australia
September 28 2011
ABSTRACT: Prior literature has examined financial statement fraud at the account balance and transaction level. This study increases our understanding by narrowing the focus to the audit assertions violated. Using a sample of companies with alleged involvement in accounting manipulations as documented in Accounting and Auditing Enforcement Releases, the descriptive analysis suggests that the Occurrence and Cutoff assertions about classes of transactions are the major assertions at risk for revenue transactions and Accuracy for expense transactions. The results from a multivariate analysis indicate that the factors influencing fraud vary across assertions. Occurrence assertion is more likely to be violated when there is greater concentration of managerial power. The findings emphasise the importance of considering concentration of managerial power and potential management override of controls in detecting fraudulent financial statements at the assertion level.
Key Words: Audit assertion, financial statement fraud.
Acknowledgement: We gratefully acknowledge the helpful suggestions from Romana Autrey, James Hazelton, Gary Monroe, Phil Ross and participants at the AFAANZ conference 2009 and the American Accounting Association annual meeting 2010.

AN ANALYSIS OF FINANCIAL STATEMENT FRAUD AT THE AUDIT ASSERTION LEVEL
INTRODUCTION
The discovery of material misstatement in the financial statements is a major
purpose of an audit (Au316, ISA 240). More specifically, the auditor needs to consider
the potential for management override of controls and recognise that audit procedures
that are effective for detecting errors may not be effective in detecting fraud (Au316.12,
ISA 240.8). Prior research has provided insight in to the nature of fraud by identifying the
types of manipulations that lead to misstatement of the financial statements, and the
accounts affected (e.g. Dechow et al. 1996; Smieliauskas 2008, Dechow et al. 2011) 1
Auditing standards require the identification and assessment of risk, and the
performance of audit procedures in response to those risks, to be undertaken at the
assertion level (Au314.102, ISA240.25 and .30). An in-depth examination of fraudulent
transactions at the assertion level may help auditors detect irregularities in those
transactions at an earlier stage and identify internal controls which may be overridden
based on the assertion violated.
.
Relatively few studies however directly examined the link between financial statement
fraud and the assertions that were violated. This study uses examples of alleged
manipulations of financial reports to provide descriptive evidence of the transactions
level assertions most commonly violated in reported financial statement frauds.
The sample consists of U.S companies alleged to have accounting manipulations
as documented in Accounting and Auditing Enforcement Releases (AAERs) issued by the
1 For a comprehensive review of research related to fraud refer to Hogan et al. (2008).

- 1 -
Securities and Exchange Commission (SEC) from January 2005 to December 2010. The
study is undertaken in two stages. Stage One provides a descriptive analysis to address
the research question: “Which assertions at the class of transaction level tend to be
violated when issuing fraudulent financial statements?” The descriptive analysis shows
that for revenue transactions the highest frequency of violations is for the occurrence
assertion, followed by the cut-off assertion. For expense transactions the major assertion
at risk is the accuracy assertion.
Stage Two addresses the research question: “Are the factors found to influence
financial statement fraud consistent across the assertion violated?” We present evidence
that violations of the occurrence assertion are associated with boards that are dominated
by a few individuals. Relative to violations of other assertions, violations of the
occurrence assertion are more likely to occur where top management has a greater
concentration of ownership power; companies are trying to maintain investor perceptions;
have higher non-cash investment; more financing activities and lower changes in earnings.
The results also indicate that violations of the occurrence assertion were more likely in
the computer and less likely in the financial industry during the period studied.
ASSERTIONS AND THE DETECTION OF FRAUD
Auditors use assertions when assessing risk by determining the different types of
misstatements that could occur, and developing audit procedures that are appropriate in
the circumstances (Louwers et al. 2007). Assertions are categorised into classes of
transactions, account balances, and presentation and disclosure. Findings from COSO
(2010) indicate that over sixty percent of the frauds examined from 1998 to 2007 related
to revenue fraud. Therefore, this study focuses on fraudulent transactions related to
- 2 -
revenue 2
Prior research (e.g. Dechow et al. 1996, Dunn 2004) suggests that the probability
of perpetrating financial statement fraud is related to a concentration of executive power.
As the concentration of power of top management increases, the ability to override
controls is enhanced and we would expect that the likelihood of top management to
perpetrate financial statement fraud through the use of fictitious transactions increases.
We specifically examine whether the probability of the violation of the occurrence
assertion is positively associated with a higher concentration of management power.
. Five assertions about transactions and events are examined in this study:
occurrence, transactions and events that have been recorded, have occurred, and pertain
to the entity; completeness, all transactions and events that should have been recorded
have been recorded; accuracy, amounts and other data relating to recorded transactions
and events have been recorded appropriately; cutoff, transactions and events have been
recorded in the correct accounting period; and classification, transactions and events have
been recorded in the proper accounts. We initially examine the frequency of the violation
of these assertions.
SAMPLE SELECTION
A sample of U.S. companies with alleged accounting manipulations is selected
from the SEC’s Accounting and Auditing Enforcement Releases (AAERs) issued from
January 2005 to December 2010. AAERs provide one of the few documented sources of
information across a sufficiently large population of companies that have been alleged to
be involved in fraudulent activities to enable systematic research (e.g. Beasley 1996;
2 Because of the double-entry bookkeeping system, fraudulent transactions always affect at least two accounts and two places in financial statements, one in the income statement related to the transaction accounts and the other in the balance sheet related to the account balances. This study focuses on fraudulent transactions related to revenue fraud, therefore the category of assertions relating to classes of transactions is of primary concern. The assertions pertinent to account balances are not examined in this study.

- 3 -
Dechow et al. 1996; Beasley et al. 2000, Bonner et al. 1998, Carcello and Nagy 2004;
Dechow et al. 2011).
The sample selection procedure is summarized in Table 1. All AAERs from
AAER number 2158 through AAER number 3222 were reviewed, covering AAERs dated
from January 1st, 2005 to December 31st, 2010. From these 1065 AAERs, 20 could not be
collected because they were not available on the SEC’s database, 19 are the correction or
adjustment of a previous order, and 25 do not involve a specific company name, resulting
in a sample of 1001 AAERs. Since AAERs report actions against companies as well as
their managers, auditors and other related parties, the same company can have multiple
releases. The 1001 releases represent 458 distinct companies (the second column of Table
1). Of these, 70 companies are excluded because a valid CUSIP identifier is unavailable.
The full population of AAERs includes allegations of illegal acts that do not directly
affect financial statements.
Fraud related material misstatements can arise from: (1) fraudulent financial
reporting and (2) misappropriation of assets which result in nonconformity of the
financial statements’ presentation with generally accepted accounting principles (SAS No.
99). Consistent with prior research (e.g. Zimbelman 1997, Colbert 2000, Payne and
Ramsay 2005) this study is restricted to examining fraud which involves intentionally
misstating the financial statements3. The initial sample selection is therefore restricted to
AAERs involving an accusation of violating Section 10(b) of the 1934 Securities
Exchange Act, Rule 10b-5, or Section 17(a) of the 1933 Securities Exchange Act4,5
3 Besides these two sources there are of course other corruption schemes identified by the Association of Certified Fraud Examiners(1995) including conflict of interest (e.g. purchases and sales schemes of related parities), bribery (e.g. kickbacks and bid-rigging), illegal gratuities and economic extortion.
and
4 Section 17(a) of the 1933 Securities Act has similar content with Section 10(b) of the 1934 Securities Act. 5 This selection criterion is consistent with Skousen and Wright (2008), while Dechow et al. (2011) adopt a broader selection criterion when studying accounting misstatements in general.
- 4 -
results in 145 companies being excluded. The sample is further reduced by 10 companies
where the fraud is related to securities fraud. A sample of 233 companies with at least one
quarter of allegedly manipulated financial statements containing 563 allegedly fraudulent
transactions (column 3) are used for Stage One.
The fourth column of Table 1 includes a calculation of the sample size used in
Stage two for the multivariate analysis. Over the six years investigated, there are 744
company-year observations for the 233 companies with financial statement fraud.
Observations are excluded for companies where only the quarterly financial statements
were manipulated (144) or with missing financial data (176) leaving 424 company-year
observations. These are matched to comparison companies by year, industry and
company size resulting in 848 observations. The choice of a control company follows the
three-step process of Dechow et al. (1996)6
6 For the matched control sample, the industry is identified based upon four-digit SIC code, and total assets for the year-end prior to the first year of the manipulation period are obtained to represent the company size. Restrictions on the matched control companies are applied to ensure that (1) the matched control company did not have a manipulation of their financial statements as evidenced by an AAER against the company, (2) the matched control company was listed during the required period, and (3) the matched control company has proxy statements available for the required years.
.

- 5 -
Table 1: Sample selection
AAERs Companies Transactions Company -years
AAER No. 2158 – No. 3222 from 1 January 2005 to 31 December 2010
1065
Less: missing AAERs (20) Less: releases that correct a previous order or order for further suspension
(19)
Less: releases that do not involve specific company names
(25)
1001 Less: companies with multiple releases (543) Number of distinct companies 458 Less: companies without CUSIP identifier (70) Less: enforcements that do not violate Section 10(b) of the 1934 Securities Act (e.g. bribes, disclosure etc.) or enforcement that cannot be linked to specific reporting periods
(145)
Less: companies with securities fraud (10) Companies with at least one quarter manipulated financial statements
233 5631 744
Less: companies with quarterly manipulated financial statements
(144)
Less: missing data from COMPUSTAT, SEC filings and CRSP
(176)
Total number of observations (manipulation years) 424 Add: matched control sample 424 Total number of observations with all available data
8482
Notes: 1. Number of transactions evaluated in Table 2 for type of assertion violated. Tables 3 and 4 include only 208 company-year observations with occurrence assertion violations, 208 matched control sample observations, and 202 company-year observations with other assertion violations. 2. Tables 5 includes 848 company-year observations.
RESEARCH DESIGN
Stage One- Descriptive Analysis
The initial approach in Stage One is descriptive, providing detail of the assertions
violated in SEC documented fraud cases. Assertions are categorized into classes of
transactions, account balances, and presentation and disclosure. The five assertions about
classes of transactions examined in this study and defined as per the auditing standards
are: occurrence, completeness, accuracy, cut-off, and classification (ISA 315 Para A111).
From the sample of 563 fraudulent transactions, each transaction was reviewed, the

- 6 -
manipulations identified, and then coded according to the assertions violated (refer Table
2, codes 1 to 20).7 The codes for the fraudulent transactions are categorized into revenue
overstatement, expense understatement, expense overstatement and other manipulations
unrelated to revenue and expenses. Of importance to this study, is that the AAERs
document financial statement manipulations that are typically perpetrated by, or
otherwise involve, senior executives (e.g. Summer and Sweeney 1998). Senior executives
are typically alleged to have ‘participated’, ‘instructed’ or otherwise ‘abetted’ the
falsifying of financial records. 8 The active participation of management is consistent with
the strategic management override of internal controls, and the need to consider
assertions other than those regarding the controls of the client.9
As can be seen in Panel A of Table 2, revenue overstatement represents nearly half
of all 563 fraudulent transactions in the sample (47.25%). 183 transactions (32.5%) are
related to understatement of expenses. Fraudulent transactions other than revenue and
expense misstatements represent 19.72% of all the misstatements in the sample.
Panel B of Table 2 reports the assertion violated for revenue overstatements. The
violation of the Occurrence assertion covers more than seventy percent of all revenue
overstatements (190/266). Revenue fraud primarily arose from the creation of fictitious
transactions, such as round-trip and circular transactions (66 transactions)10
7 The primary coding was performed by the first author and checked by a co-author who has extensive audit experience. Ambiguous transactions were negotiated by the two coders after reviewing the facts of the AAERs and further consultation with third parties where necessary. A simple coding sheet and independent coding could not be used due to the complexity of the frauds and the variation in AAER documentation.
, and the use
8 Dechow et al. (2011) report that 49.2% of all AAERs involve officer of the company and 15.1% involve both an officer and the company. When focusing on fraud, we observe a much higher incidence of management involvement to an extent that it is not possible to identify a usable subset of AAERs where top management is not implicated at some level. 9 For example, an executive vice-president of Gemstar was alleged to have participated in fraudulent recording and disclosure of revenue including repeatedly signing false management representation letters regarding the status of negotiations to Gemstar’s auditors (AAER 2176, pp. 1-2). 10 For example, one of Qwest’s schemes allegedly included swapping with other telecom firms the rights to use fibre-optic strands for no legitimate business reason, and immediate booking of revenues to meet “Wall

- 7 -
of contingent or consignment sales to inflate revenue for the reporting period (72
transactions)11
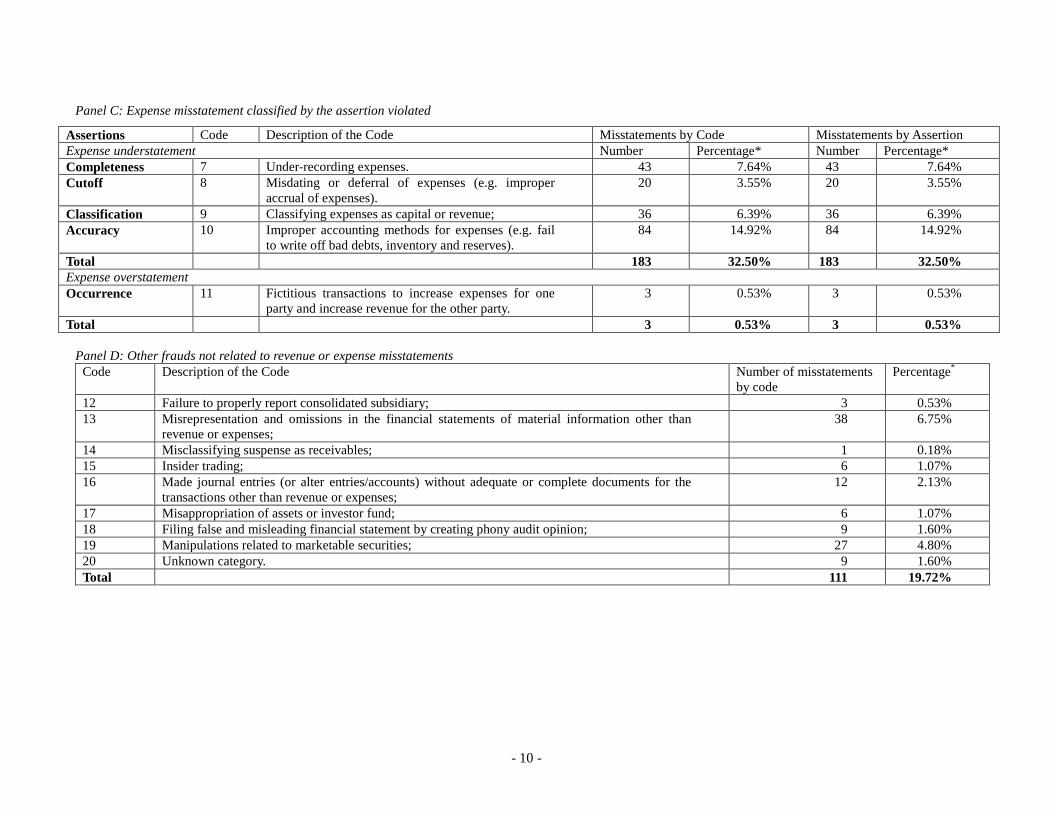
From Panel C of Table 2, it can be seen that companies are also likely to use
improper accounting methods to understate expenses (84 cases, 14.92%), suggesting that
Accuracy is the major assertion of concern in detecting expense misstatements. The
fraudulent transactions in this category include failing to write off bad debts, inventory
and reserves.
. These transactions were not legitimate in nature as they failed to represent
the actual economic events, or the underlying transaction did not exist. A further 60
observations violated the Cutoff assertion (10.66%), with companies backdating or
misdating contracts to improperly record revenue from future period sales or services in
the current-year accounts.
12 Apart from the Accuracy assertion, another 17.58% of the observations
were related to the understatement of expenses, including 43 (7.64%) cases violating the
Completeness of the reporting, 20 cases (3.55%) of misdating or deferral of expenses, and
36 cases (6.39%) that Classified expenses into capital or revenue accounts13
Street’s earnings expectations”(AAER 2207, pp.2-5). Reliant Resources engaged in round trip power and gas trades (AAER 2197, pp. 1-2). Other examples are more straightforward such as the Managing Director of Humatech who allegedly instructed that a sale be (falsely) recorded and an invoice issued but that the product not be shipped (AAER 2193, pp. 5-9).
. There were
three cases related to the overstatement of expenses. These transactions involved related
parties. Management of subsidiary companies aided and abetted fraudulent conduct by
the employees in the parent company.
11 For example, AAER 2404 alleges that “the former heads of the company entered into secret side deals” whereby the customer only had to pay if the software was successfully resold (AAER 2404, pp. 4-10). AAER 2257 alleges that the company improperly recognized revenue on “sales of equipment that the company had not delivered to customers, but instead had shipped to third party warehouses where the company controlled the equipment, paid to store it and insured it” (AAER 2257, pp. 1). 12 For example, AAER 2402 alleges that the Vice President recorded unearned receivables and failed to adequately reserve for excess or obsolete inventory (AAER 2402, pp. 1). AAER 2475 alleges that the former Chief Financial Officer and Chief Operating Officer routinely overstated the value of the company’s inventory in order to reduce the company’s cost of goods sold (AAER 2475, pp. 1). 13 For example, AAER 2368 alleges that the former Chief Financial Officer booked a settlement expense for a five-year consulting agreement as an asset (AAER 2368, pp. 1). AAER 2642 alleges the company for “overcapitalizing overhead costs” (AAER 2642, pp. 2).

- 8 -
Panel D of Table 2 reports the fraudulent transactions other than revenue or
expense misstatements and is provided for completeness of reporting.
In summary, nearly 80% of the 563 fraudulent transactions in the sample were
revenue and expense misstatements. The assertions at highest risk are occurrence,
accuracy and cutoff with 33.75%, 14.92% and 10.66% of all observations respectively.
Since audit procedures are linked to the assertions at risk, audit planning should
concentrate on obtaining evidence about these risks.
The descriptive analysis suggests that the majority of the fraudulent manipulations
were either non routine transactions or indicate that any internal controls were overridden
or bypassed by the management. For example, recognising revenue from fictitious sales
(Code 1) would require management to authorise and approve transactions outside sales
in the normal course of business. For channel stuffing (Code 3), management override of
terms and conditions of sales were made by the issue of side agreements for extended
return periods and payment terms. To overstate revenue by backdating or misdating the
sales contracts (Code 5), management override of cut-off procedures would be required.
Tests on the operation of internal controls are unlikely to detect these types of
management override.
Raising the awareness of assertions with a higher risk of fraud as the result of
management override of internal controls, may assist auditors in planning the audit. For
example, the detection of channel stuffing may require the extension of substantive
procedures for accounts receivable such that confirmations would also include
confirmation of the terms and condition of sale.14
14 This observation is consistent with Caster et al. (2008) who examine specific issues with confirmations failures documented in AAERs.

- 9 -
Table 2: Summary of assertions violated for the sample of alleged financial statement frauds Panel A: Overall summary of the frequency of material misstatements
Panel N Percentage*
Revenue overstatement B 266 47.25% Expenses understatement C 183 32.5% Expenses overstatement C 3 0.53% Other frauds not related to revenue or expense misstatements D 111 19.72% Total 563 100.00% Notes: * All percentages reported are of the total number of observations (n = 563). Panel B: Revenue overstatement classified by the assertion violated
Assertions Code Description of the Code Misstatements by Code Misstatements by Assertion Number Percentage* Number Percentage*
Occurrence
1 Recognizing revenue from fictitious transactions (e.g. round-trip, circular transactions).
66 11.72%
190† 33.75%
2 Forging documents to support the overstatement of revenue; 28 4.97% 3 Recognizing revenue from contingent sales or consignment sales
(e.g. channel stuffing, non-binding minimum-guarantee distribution contracts).
72 12.79%
4 Overstating revenue by improper revenue recognition without regard of GAAP or other financial reporting requirements.
24 4.26%
Cutoff 5 Backdating or misdating contracts to overstate revenue (e.g. revenue recognized on delivery, over-accrue projects revenue, unearned performance warrants, etc.).
60 10.66% 60 10.66%
Classification 6 Misclassifying others as revenue (e.g. reserves, consideration for amending existing agreements, non-operating income, etc.).
16 2.84% 16 2.84%
Total 266 47.25% 266 47.25% Notes: †The 190 transactions that violated the occurrence assertion include 208 company-year observations (examined in Tables 3, 4 and 6).
- 10 -
Panel C: Expense misstatement classified by the assertion violated
Panel D: Other frauds not related to revenue or expense misstatements
Code Description of the Code Number of misstatements by code
Percentage*
12 Failure to properly report consolidated subsidiary; 3 0.53% 13 Misrepresentation and omissions in the financial statements of material information other than
revenue or expenses; 38 6.75%
14 Misclassifying suspense as receivables; 1 0.18% 15 Insider trading; 6 1.07% 16 Made journal entries (or alter entries/accounts) without adequate or complete documents for the
transactions other than revenue or expenses; 12 2.13%
17 Misappropriation of assets or investor fund; 6 1.07% 18 Filing false and misleading financial statement by creating phony audit opinion; 9 1.60% 19 Manipulations related to marketable securities; 27 4.80% 20 Unknown category. 9 1.60% Total 111 19.72%
Assertions Code Description of the Code Misstatements by Code Misstatements by Assertion Expense understatement Number Percentage* Number Percentage* Completeness 7 Under-recording expenses. 43 7.64% 43 7.64% Cutoff 8 Misdating or deferral of expenses (e.g. improper
accrual of expenses). 20 3.55% 20 3.55%
Classification 9 Classifying expenses as capital or revenue; 36 6.39% 36 6.39% Accuracy 10 Improper accounting methods for expenses (e.g. fail
to write off bad debts, inventory and reserves). 84 14.92% 84 14.92%
Total 183 32.50% 183 32.50% Expense overstatement Occurrence 11 Fictitious transactions to increase expenses for one
party and increase revenue for the other party. 3 0.53% 3 0.53%
Total 3 0.53% 3 0.53%

- 11 -
Stage Two – Multivariate Analysis
The descriptive analysis indicates that the violation of the Occurrence assertion
accounted for more than seventy percent of all revenue overstatements (190/266). In this
section we initially examine the determinants of the probability of the violation of the
occurrence assertion for revenue. We specifically examine the general hypothesis that
greater concentration of managerial power allows management to perpetrate financial
statement fraud by violating the occurrence assertion. Following Dunn (2004)
management power in this study refers to the structural power and ownership power of
the top executives. Other variables are included to control for the known determinants of
fraud (from Dechow et al 2011). The relationships are analysed by using the following
logistic regression with each of the variables discussed below (company and year
subscripts are ignored):
P (Occur) = α + β1 Board_titles +β2 CEO_dual + β3 Exe_shares + β4 High_shares + β5 LogTA + β6 Computers + β7 Retail + β8 Services + β9 Financial + β10 Utility + β11 SCAR+ β12 Post_2002 + β13 Rsst + β14 Ch_rec + β15 Ch_cs + β16 Ch_cm + β17 Ch_earn + β18 Ch_top + β19 Leasedum + β20 Oplease + β21 Exfin + β22 Issue + β23 Cff + β24 Ep + ε [1] where:
P (Occur) = the probability of a transaction that violates the Occurrence assertion; Occur = an indicator variable with a value of 1 for a company with a transaction that violates
the occurrence assertion for this financial year as identified in the relevant SEC AAER; and 0 for matched sample of companies;
Board_titles = the percentage of titles management executives hold out of 10 official titles ; CEO_dual = an indicator variable with a value of 1 for CEOs also acts as the Chairman of the
Board and 0 otherwise; Exe_shares = the percentage of shares owned by top management as a group as a proportion of the
common share outstanding; High_shares = an indicator variable with a value of 1 when the percentage of shares owned by top
management as a group is greater than 50% and 0 otherwise; LogTA = log of total assets measured one year prior to the year for which accounting data is
reported; Computers = SIC codes 3570-3579, 3670-3679, 7370-7379; Retail = SIC codes 5000-5999; Services = SIC codes 7000-7369, 7380-8999; Financial = SIC codes 6000-6999; Utility = SIC codes 4900-4999; SCAR = the value of size adjusted abnormal return of common stock for the year prior to the
year for which accounting data is reported;
- 12 -
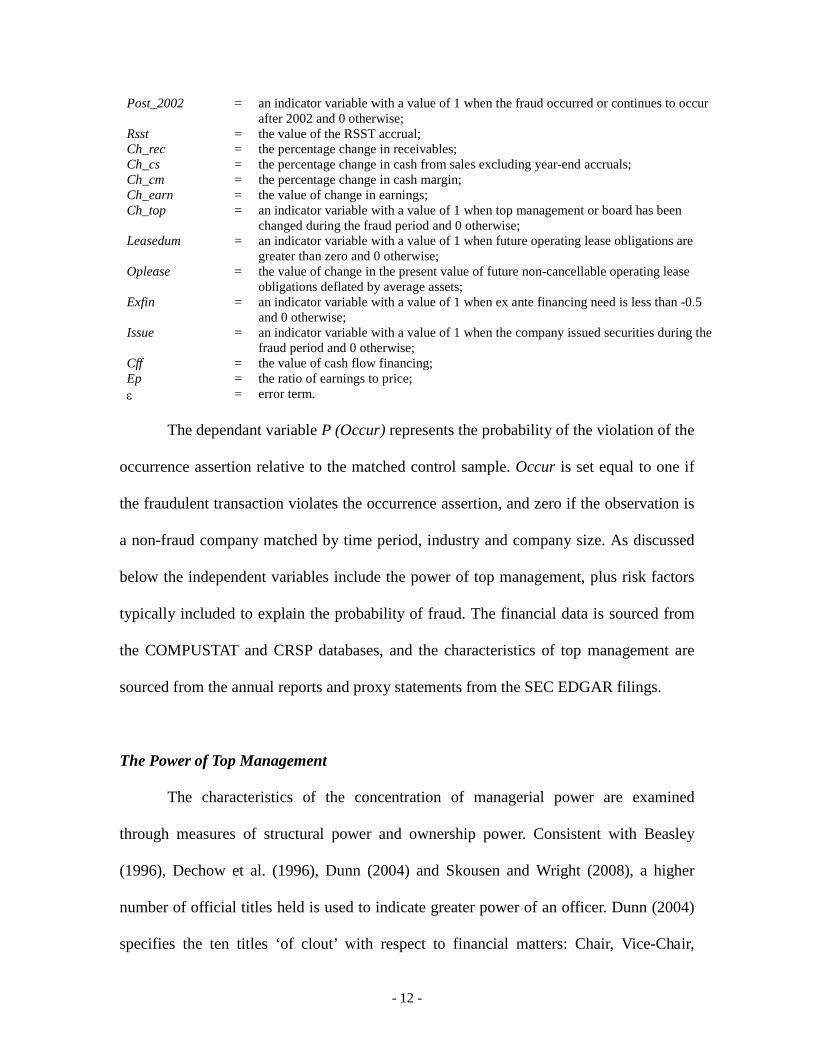
Post_2002 = an indicator variable with a value of 1 when the fraud occurred or continues to occur after 2002 and 0 otherwise;
Rsst = the value of the RSST accrual; Ch_rec = the percentage change in receivables; Ch_cs = the percentage change in cash from sales excluding year-end accruals; Ch_cm = the percentage change in cash margin; Ch_earn = the value of change in earnings; Ch_top = an indicator variable with a value of 1 when top management or board has been
changed during the fraud period and 0 otherwise; Leasedum = an indicator variable with a value of 1 when future operating lease obligations are
greater than zero and 0 otherwise; Oplease = the value of change in the present value of future non-cancellable operating lease
obligations deflated by average assets; Exfin = an indicator variable with a value of 1 when ex ante financing need is less than -0.5
and 0 otherwise; Issue = an indicator variable with a value of 1 when the company issued securities during the
fraud period and 0 otherwise; Cff = the value of cash flow financing; Ep = the ratio of earnings to price; ε = error term.
The dependant variable P (Occur) represents the probability of the violation of the
occurrence assertion relative to the matched control sample. Occur is set equal to one if
the fraudulent transaction violates the occurrence assertion, and zero if the observation is
a non-fraud company matched by time period, industry and company size. As discussed
below the independent variables include the power of top management, plus risk factors
typically included to explain the probability of fraud. The financial data is sourced from
the COMPUSTAT and CRSP databases, and the characteristics of top management are
sourced from the annual reports and proxy statements from the SEC EDGAR filings.
The Power of Top Management
The characteristics of the concentration of managerial power are examined
through measures of structural power and ownership power. Consistent with Beasley
(1996), Dechow et al. (1996), Dunn (2004) and Skousen and Wright (2008), a higher
number of official titles held is used to indicate greater power of an officer. Dunn (2004)
specifies the ten titles ‘of clout’ with respect to financial matters: Chair, Vice-Chair,

- 13 -
President, Chief Executive Officer, Chief Financial Officer, Chief Operating Officer,
Vice-President Finance, Secretary, Treasurer, and Founder. Therefore, the variable
Board_titles is defined as the percentage of these titles the executives on the board have
out of the ten official titles. We expect that the higher the proportion of titles the
executives have, the greater concentration of managerial power. It is expected that it is
easier for managers on the board to influence financial decisions when they control more
of these titles. The coefficient on Board_titles is expected to be positive. Further, Dechow
et al. (1996) found evidence that one officer acting as both CEO and the Chairman of the
Board at the same time, can facilitate his or her opportunity to commit fraud. The variable
CEO_dual is coded as one if the CEO is also acting as the Chairman of the Board and
zero otherwise. The ownership power of top management is further measured by shares
held by executives. Exe_shares is the shares owned by top management as a percentage
of the total common shares outstanding. This measure is supported by a number of prior
studies which indicate that when executives have a significant financial stake in a
company, they can face increased financial pressure when threatened by the company’s
poor financial performance (Beasley 1996; COSO 2010; Dunn 2004).
Control of Ownership
The red flag fraud literature (e.g. Skousen and Wright 2008) however emphasizes
the risks associated with young companies dominated by a small group of individuals and
hence higher concentration of control is predicted to be associated with a higher
probability of fraud. That is, executives with a lot of their wealth at stake in the company
are more likely to perpetrate fraud to maintain and enhance the value of company stock.
In order to control for the potential influence of these blockholders on the association
between Exe_shares and the probability of fraud, the variable High_shares is introduced

- 14 -
as an indicator variable with a value of one when the percentage of shares owned by
board executives as a group is greater than 50% and zero otherwise.
Size and Industry
Skousen and Wright (2008) and Dechow et al. (2011) find that size and industry
membership are associated with the occurrence of financial statement fraud. Size is
measured by the logarithm of total assets one year prior to the year for which accounting
data is reported (LogTA). For industry membership, companies in Computer, Retail and
Services industries represent nearly half of the companies with accounting misstatements
in Dechow et al. (2011). Since the sample covers AAERs arising from the Global
Financial crisis period, we expect that Financial and Utility industries will also have a
more frequent occurrence of financial statement fraud. Sample companies are classified
into Computer, Retail, Services, Financial, Utility and other industries by SIC codes.
Measures of Recent Market Performance
SAS No.99, ISA 240 and prior studies (Skousen and Wright 2008; Dechow et al.
2011) indicate that market events and market performance can create financial pressures
on management that provide motivation for financial statement fraud. That is, accounting
manipulations tend to occur following abnormally good performance or prior to the need
for additional financing. Abnormally good stock price performance in the year prior to
the year of the fraud can provide motivation for financial statement fraud as managers
seek to perpetrate the exceptional performance. Stock return performance is captured
using the size-adjusted abnormal returns of common stock (SCAR) for the year prior to
the year for which the financial statements are issued from CRSP. To be consistent with
Dechow’s model, ex ante need for financing (Exfin), actual issuance of new debt or
equity (Issue), cash flow financing (Cff) and earnings to price ratios (Ep) are used to

- 15 -
measure market-related events of interest.
Post-SOX Time Period
Prior research finds that the power of top management impacts company
performance and financial reporting quality (Dechow et al. 1996). However, after the
passing of the SOX legislation in 2002, corporate governance requirements have
increased. It is expected that the increased regulation will reduce the occurrence of
financial statement frauds involving top management overriding internal controls after
2002. As a result, a variable is included in the model to examine the changes between the
pre and post SOX era. In this study, Post_2002 is coded as one if the fraud occurred or
continues to occur, after 2002 and zero otherwise.
Financial Variables
According to Dechow et al. (2011) 15
Non-financial Variables
, misstatement years are associated with
unusually high accruals. By testing various measures of accrual quality, they suggest that
the more comprehensive RSST measure of accruals is more effective at detecting
manipulations. The RSST measures the changes in both short-term and long-term
investment. Change in receivables (Ch_rec) is found to be significant because half of the
manipulating companies are alleged to have been manipulating sales. In order to control
the variation in financial performance, change is cash from sales excluding year-end
accruals (Ch_cs), cash margins (Ch_cm) and change in earnings (Ch_earn) are included
in the model.
Dechow et al. (2011) use two non-financial measures of company performance-
abnormal change in the number of employees and abnormal change in order backlog.
15 The model used in this paper is based on an earlier version of Dechow et al. (2011), in which ROA, change in free cash flows and deferred tax expense were not significant.

- 16 -
These variables are not currently included in the model due to the unavailability of data.
Because this study is focused on the role of top management, an indicator variable for a
change in top management or board (Ch_top) is used. It is coded as one if the
composition of top management or the board has been changed during the fraud period
and zero otherwise.
Off-balance Sheet Variables
Dechow et al. (2011) indicate that accounting for operating leases allows
companies to record lower expenses early on in the life of the lease, and thus the use of
operating leases and unusual increases in operating lease activity are positively associated
with manipulations. To be consistent with prior research, the existence of operating leases
(Leasedum) and the change in operating lease activity (Oplease) are used as proxies of
off-balance sheet variables.16
RESULTS OF MULTIVARIATE ANALYSIS
Descriptive Statistics
Descriptive statistics are reported in Table 3. Panel A of Table 3 examines
differences in characteristics between the companies which had fraudulent transactions
with a violation of an occurrence assertion and non-fraud companies matched by time
period, industry and company size. Because there are a high proportion of observations
with some missing data, the descriptive statistics are presented for all observations with
data partially available. The variables Rsst, Ch_rec, Ch_cs, Ch_cm, Ch-earn, Cff, Ep and
SCAR are winsorzied at the 1% and 99% level to mitigate the influence of extreme values
on the analysis. 16 The variables Expected return on pension plan assets and Change in expected return on pension plan assets are not examined in this study because Dechow et al. (2011) do not find a significant relationship between the occurrence of earnings manipulation and these variables.

- 17 -
By construction the proportion of companies with an occurrence assertion
violation represents 50% of the sample. As reported in Panel A, the difference in LogTA
indicates that companies with fraudulent financial reporting were larger than control
sample companies, despite matching by company size. In addition companies with a
violation of the occurrence assertion have higher: concentration of power (Board_titles p
= 0.0509); prior year abnormal returns (SCAR p = .0009); changes of receivables (Ch_rec
p = 0.0676); lease obligations (Leasedum p=.0629) changes in the present value of future
non-cancellable operating lease obligations (Oplease p = 0.0054); cash flows from
financing activities (Cff p = 0.0004) and earnings to price ratio (Ep p=.0209). The test of
Exfin (p = .0297) indicates companies with occurrence violation had less ex ante
financing needs. Because the violation of the occurrence assertion accounted for more
than seventy percent of all revenue overstatements, as expected, these are consistent with
results reported by Dechow et al. (2011) when considering financial statement fraud for
revenue transactions.
Table 3: Differences in mean characteristics between a sample of AAERs involving violation of the Occurrence assertion and a sample of control companies matched by time period, industry and size. Panel A: Occurrence violation in comparison to matched control sample
Occurrence Assertion Violation (Mean)
Control companies
(Mean)
Difference
T-value Pr > │t│
N 208 208 Board_titles 0.5216 0.4986 0.0231 1.96 0.0505 * CEO_dual 0.8798 0.8750 0.0048 0.15 0.8815 Exe_shares 0.1685 0.1893 -0.0209 -1.12 0.2623 High_shares 0.0913 0.0673 0.0240 0.91 0.3656 LogTA 2.9486 2.5285 0.4201 4.37 <.0001 *** Computers 0.3029 0.3029 0.0000 0.00 1.0000 Retail 0.1010 0.1010 0.0000 0.00 1.0000 Services 0.1202 0.1202 0.0000 0.00 1.0000 Financial 0.0433 0.0577 -0.0144 -0.67 0.5029 Utility 0.0240 0.0240 0.0000 0.00 1.0000 SCAR 0.2726 0.0077 0.2649 3.18 0.0016 ***

- 18 -
Post_2002 0.3942 0.3942 0.0000 0.00 1.0000 Rsst 0.0278 -0.0050 0.0329 -1.32 0.1892 Ch_rec 0.2648 0.1598 0.1050 1.83 0.0676 * Ch_cs 0.1767 0.1531 0.0236 0.95 0.3436 Ch_cm 0.3819 0.0879 0.2940 1.44 0.1502 Ch_earn -0.9844 -0.8970 -0.0874 -0.24 0.8107 Ch_top 0.5990 0.5817 0.0173 0.36 0.7208 Leasedum 0.8077 0.7308 0.0769 1.87 0.0629 * Oplease 0.0116 0.0016 0.0100 2.80 0.0054 *** Exfin 0.0144 0.0529 -0.0385 -2.18 0.0297 ** Issue 0.5913 0.4327 0.1587 3.27 0.0012 *** Cff 0.0738 0.0197 0.0541 3.56 0.0004 *** Ep 0.0292 -0.0589 0.0881 2.19 0.0290 **
Panel B: Occurrence violation in comparison to all other violations
Occurrence Assertion Violation (Mean)
Other Assertion Violation (Mean)
Difference
T-value Pr > │t│
N 208 202 Board_titles 0.5510 0.5216 0.0294 2.36 0.0188 ** CEO_dual 0.8798 0.9158 -0.0360 -1.20 0.2300 Exe_shares 0.1685 0.1783 -0.0099 -0.51 0.6110 High_shares 0.0913 0.0693 0.0220 0.82 0.4134 LogTA 2.9489 3.0299 -0.0813 -0.84 0.4004 Computers 0.4010 0.3029 0.0981 2.09 0.0376 ** Retail 0.1010 0.0941 0.0069 0.23 0.8144 Services 0.1202 0.1040 0.0162 0.52 0.6037 Financial 0.0433 0.1188 -0.0755 -2.83 0.0049 *** Utility 0.0240 0.0297 -0.0057 -0.35 0.7235 SCAR 0.2726 0.0683 0.2043 2.52 0.0120 ** Post_2002 0.3942 0.4455 -0.0513 -1.05 0.2937 Rsst 0.0407 0.0278 0.0129 0.55 0.5835 Ch_rec 0.1967 0.1767 0.0200 0.82 0.4129 Ch_cs 0.2648 0.1941 0.0706 1.35 0.1790 Ch_cm 0.0331 -0.1668 0.1999 0.80 0.4226 Ch_earn -0.9844 -0.1923 -0.7921 -2.62 0.0092 *** Ch_top 0.5990 0.6238 -0.0247 -0.51 0.6090 Leasedum 0.8077 0.7772 0.0305 0.76 0.4480 Oplease 0.0116 0.0102 0.0014 0.41 0.6844 Exfin 0.0144 0.0297 -0.0153 -1.05 0.2923 Issue 0.5913 0.6139 -0.0225 -0.46 0.6424 Cff 0.0738 0.0470 0.0268 1.68 0.0934 *

- 19 -
Ep 0.0292 0.0551 -0.0259 -1.04 0.2984
Notes: *, **, *** indicate significance (two-tailed test) at the 10, 5, and 1 percent levels, respectively. Variable definitions: Board_titles is the percentage of titles executives hold out of 10 official titles, as stated in the annual report; CEO_dual is an indicator variable (1 for CEOs also acting as the Chairman of the Board; 0 otherwise); Exe_shares is the percentage of shares owned by top management as a group as a proportion of the common shares outstanding; High_shares is an indicator variable (1 for shares greater than 50%; 0 otherwise); LogTA is the logarithm of the total assets of the company in the year prior to first accounting manipulation; Computer is companies with SIC codes 3570-3579, 3670-3679, 7370-7379; Retailer is companies with SIC codes 5000-5999; Services is companies with SIC codes 7000-7369, 7380-8999; Financial is companies with SIC codes 6000-6999; Utility is companies with SIC codes 4900-4999. SCAR is the value of size adjusted abnormal return of common stock for the year prior to the year for which accounting data is reported; Post_2002 is an indicator variable (1 for fraud occurred after 2002; 0 otherwise); Rsst is the value of the RSST accrual; Ch_rec is the percentage of change in receivables; Ch_cs is the percentage change in cash from sales excluding year-end accruals; Ch_cm is the percentage change in cash margin; Ch_earn is the value of change in earnings; Ch_top is an indicator variable (1 for changing in the Board composition;0 otherwise); Leasedum is an indicator variable (1 for future operating lease obligations are greater than 0; 0 otherwise); Oplease is the value of change in the present value of future non-cancellable operating lease obligations deflated by average assets; Exfin is an indicator variable (1 for ex ante financing need is less than -0.5; 0 otherwise); Issue is an indicator variable (1 for new issued securities; 0 otherwise); Cff is the value of cash flow financing; Ep is the ratio of earnings to price; and ε is the error term.
We further compare the characteristics of companies using fraudulent transactions
that violated the occurrence assertion with violations of other assertions i.e.:
completeness, accuracy, cut-off, and classification. As reported in Panel B of Table 3,
companies with more concentration of power as a group are more likely to use fraudulent
transactions that falsify the existence of the actual economic events (Board_titles p
=0.0188). Companies violated the occurrence assertion are more likely to be in the
computer industry, have a prior year abnormal return and use financing activities to
compensate cash deficiency (Computer p = 0.0376, SCAR 0.0120 and Cff 0.0934
respectively). Companies violated the occurrence assertion are less likely to be in the
financial industry (Financial p = 0.0049). nor have a higher changes in earning from prior
years Ch_earn (p = 0.0092). No differences were found in LogTA, suggesting that
companies that violated the occurrence assertion and other assertions do not differ in
company size.
Multivariate Analysis Results
Multivariate analysis is used to examine the attributes associated with the
- 20 -
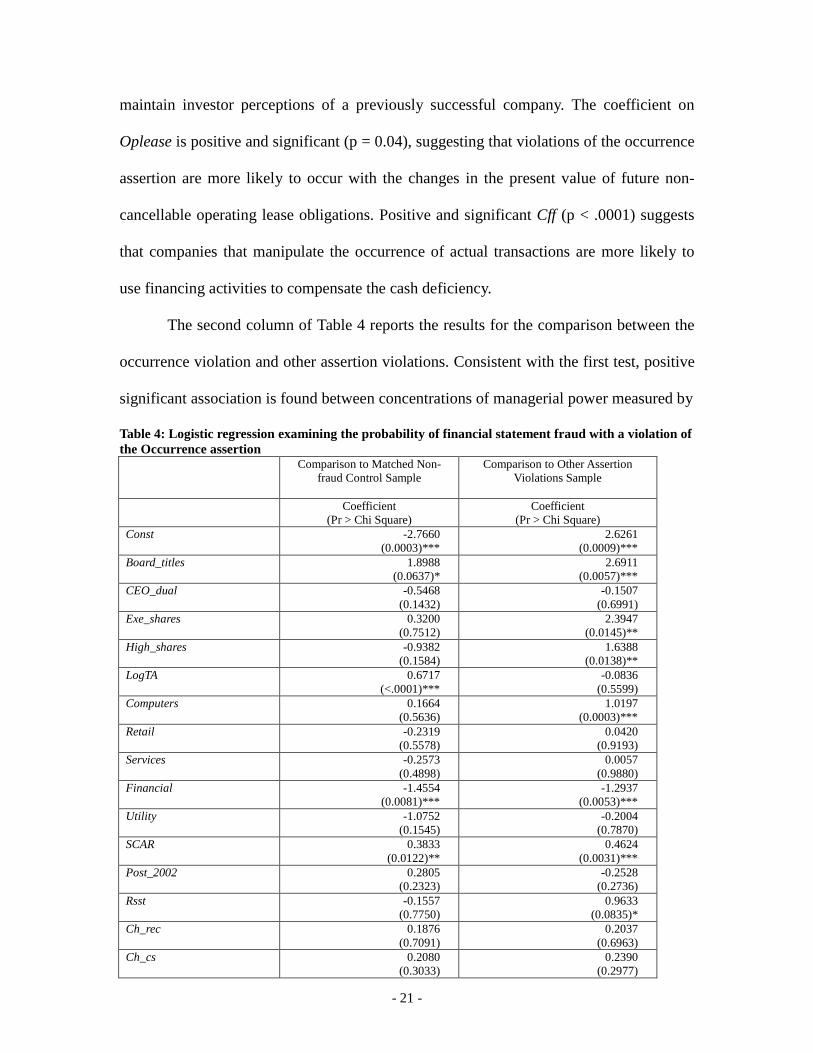
probability of financial statement fraud with a violation of the occurrence assertion. The
sample is restricted to observations with available data (208 observations). Two logistic
regressions are conducted matching the violation of the occurrence fraud sample with
first, a control sample of non-fraud companies and second, fraudulent transactions that
violated other assertions17
The first column of Table 4 summarises the results for the comparison between
occurrence violation and the matched non-fraud control sample. The significant
difference in LogTA (p= <0.0001) indicates that companies with fraudulent financial
reporting were larger than control sample companies, despite matching by company size.
The coefficient on the variable Board_titles is positive and marginally different from zero
(p = 0.06), suggesting that violations of the occurrence assertion are more likely to occur
where boards have more concentrated structural power. This result is consistent with the
concern that the occurrence assertion is more likely to be violated, where executives have
greater opportunity to override controls. Companies are more likely to engage in
transactions such as round-trip and circular transactions so as to inflate the profit.
Negative coefficient on Financial indicates that companies that manipulate the existence
of actual economic events are less likely to be in the financial industry. Positive and
significant cumulative abnormal returns (SCAR) in the prior year are consistent with
managers using manipulations that violate the occurrence assertion to try to continue to
. The results of both logistic regressions are reported in Table 4.
Consistent with studies of this type the explanatory power of both models are relatively
low (maximum rescaled r-square 22.69% and 18.14% respectively) and the results must
be interpreted with respect to this limitation.
17 The results are robust to some alternative classifications of the transactions with an occurrence violation. For example, we recoded channel stuffing as a cutoff violation or a classification violation and found results consistent with these reported.
- 21 -
maintain investor perceptions of a previously successful company. The coefficient on
Oplease is positive and significant (p = 0.04), suggesting that violations of the occurrence
assertion are more likely to occur with the changes in the present value of future non-
cancellable operating lease obligations. Positive and significant Cff (p < .0001) suggests
that companies that manipulate the occurrence of actual transactions are more likely to
use financing activities to compensate the cash deficiency.
The second column of Table 4 reports the results for the comparison between the
occurrence violation and other assertion violations. Consistent with the first test, positive
significant association is found between concentrations of managerial power measured by
Table 4: Logistic regression examining the probability of financial statement fraud with a violation of the Occurrence assertion
Comparison to Matched Non-fraud Control Sample
Comparison to Other Assertion Violations Sample
Coefficient
(Pr > Chi Square) Coefficient
(Pr > Chi Square) Const -2.7660
(0.0003)*** 2.6261
(0.0009)*** Board_titles 1.8988
(0.0637)* 2.6911
(0.0057)*** CEO_dual -0.5468
(0.1432) -0.1507
(0.6991) Exe_shares 0.3200
(0.7512) 2.3947
(0.0145)** High_shares -0.9382
(0.1584) 1.6388
(0.0138)** LogTA 0.6717
(<.0001)*** -0.0836
(0.5599) Computers 0.1664
(0.5636) 1.0197
(0.0003)*** Retail -0.2319
(0.5578) 0.0420
(0.9193) Services -0.2573
(0.4898) 0.0057
(0.9880) Financial -1.4554
(0.0081)*** -1.2937
(0.0053)*** Utility -1.0752
(0.1545) -0.2004
(0.7870) SCAR 0.3833
(0.0122)** 0.4624
(0.0031)*** Post_2002 0.2805
(0.2323) -0.2528
(0.2736) Rsst -0.1557
(0.7750) 0.9633
(0.0835)* Ch_rec 0.1876
(0.7091) 0.2037
(0.6963) Ch_cs 0.2080
(0.3033) 0.2390
(0.2977)

- 22 -
Ch_cm 0.0862 (0.3494)
0.0962 (0.2454)
Ch_earn 0.0119 (0.6986)
-0.0941 (0.0248)**
Ch_top 0.0327 (0.8849)
-0.1157 (0.6135)
Leasedum 0.0550 (0.8475)
0.0918 (0.7611)
Oplease 7.0789 (0.0432)**
0.5627 (0.8672)
Exfin -1.1885 (0.1102)
-0.5517 (0.2862)
Issue 0.2427 (0.3565)
-0.2674 (0.4482)
Cff 3.5567 (<.0001)***
1.4297 (0.0703)*
Ep -0.0098 (0.9787)
-0.5517 (0.2862)
Max-rescaled R2 22.69% 18.14%
N 416 410
Notes: *, **, *** indicate significance (two-tailed test) at the 10, 5, and 1 percent levels, respectively. P (Occur) is an indicator variable (1 for fraudulent transactions violating the occurrence assertion; 0 otherwise). Refer to Table 3 for definitions of the independent variables
Board_titles (p= 0.0057) and the violation of the occurrence assertion given that a fraud
was perpetrated. Positive and significant coefficient on Exe_share (p = 0.0129) indicates
that the violations of occurrence assertion are more likely to occur where top
management has a greater concentration of ownership power, compared to the violations
of other assertions. This finding suggests that a greater concentration of ownership power
increases management’s opportunity to override internal controls, and therefore increases
the use of unusual, non-routine transactions that violate the occurrence assertion. Positive
coefficient on High_shares (p= 0.0138) suggests that when the executive group owns
more than fifty percent of the total shares, it is more likely for them to engage in
transactions that violate the occurrence assertion. This result is consistent with the red
flag literature (e.g. Skousen and Wright 2008) and strengthens the result on Exe_share,
suggesting that executives with a lot of their wealth at stake in the company are more
likely to use unusual transactions to maintain and enhance the value of company stock.
Positive coefficient on SCAR (p = 0.0031) in the prior year is consistent with companies
- 23 -
using manipulations that violate the occurrence assertion to try to continue to maintain
investor perceptions, with the comparison to companies with other assertion violations.
The coefficients on Rsst, Cff and Ch_earn show that companies with increased use of
non-cash investment, more financing activities and lower changes in earnings are more
likely to engage in transactions that manipulates the legitimacy of transactions. The
results on Computer and Financial show that companies which violated the occurrence
assertion are more likely to in the computer industry and less likely to be in the financial
industry given by a fraud was perpetrated. Overall there is significant difference between
the factors found to influence financial statement fraud across assertions. We present
evidence that relative to other assertions, violations of occurrence assertion are more
likely to occur where boards that are dominated by a few individuals and top
management has a greater concentration of ownership power; companies are trying to
maintain investor perceptions; have higher non-cash investment; more financing activities
and lower changes in earnings. The results also show that violations of the occurrence
assertion are more likely in the computer and less likely in the financial industry.
Sensitivity Analysis
We further differentiate the full sample into three categories and factorise the
dependent variable P (Occur) to three levels: P (Occur) is equal to one if the transaction
violates the occurrence assertion, P (Occur) is equal to zero if the transaction violates
other assertions, and P (Occur) is equal to negative one if the transaction does not violate
any of the assertions. We use the matched non-fraud transactions as the control group.
This relationship is estimated by using a generalised logit regression. Results are
available on request. By comparing with control groups, the analysis of effect of each
variable suggests that companies with fraudulent transactions that violate the occurrence

- 24 -
assertion and other assertions are significantly different in terms of the concentration of
managerial power on the board, concentration of ownership power on the board,
company size, industries, prior year’s cumulative abnormal returns, changes in earnings,
the need for ex an financing and cash flow from financing activities.
We also compare companies with fraudulent transactions violating other
assertions with matched control non-fraud companies. The results suggest that companies
that violated other assertions have marginally greater concentration of managerial power,
higher changes in future non-cancellable operating leases, more uses of financial
activities, higher prior year abnormal returns, and are more likely to be in the financial
industry. We also compare companies with revenue misstatements and companies with
expense misstatements, and find companies with revenue misstatements are more likely
to have greater concentration of ownership power on a small group of executives, higher
changes in receivables and higher prior year abnormal returns.
CONCLUSION
This study explores factors associated with financial statement fraud by analysing
allegedly fraudulent transactions at the audit assertion level. Since auditors are required to
use assertions to plan the collection of sufficient audit evidence, this analysis has
implications for both internal and external auditors when planning an audit to detect the
potential risks of financial misstatement.
The results from the descriptive analysis of fraudulent transactions suggest that
the occurrence and cutoff assertions about classes of transactions are the major assertions
at risk for revenue transactions and accuracy for expense transactions. We also examine
risk factors associated with frauds specifically involving a violation of the occurrence
assertion and in particular the general hypothesis that the concentration of managerial

- 25 -
power allows management to perpetrate this type of financial statement fraud.
The results provide evidence consistent with the ability of observable measures of
top management power to explain the probability of fraud. We find significant differences
between governance and performance characteristics of companies violating the
occurrence assertion in comparison to non-fraud companies. We present evidence that
violations of the occurrence assertion are associated with boards that are dominated by a
few individuals. Given that a fraud has been committed, we find that concentration of
ownership power is associated with the violation of occurrence assertion. That is, testing
for violations of the occurrence assertion can help to identify the most probable frauds,
and these frauds tend to be associated with higher concentration of managerial and
ownership power.
The findings are generally consistent with the ability of executives to bypass
controls and use non-routine transactions to perpetrate financial statement fraud. A
potential implication is that a ‘control risk based approach’ to audit, with strong reliance
on the operation of internal controls for routine transactions, may fail to detect
management override of controls. The identification of non-routine aspects of
transactions may require extended procedures directed specifically at the high-risk
occurrence assertions.
There are several limitations. Firstly, similar to other studies that use the AAERs
selection bias exists because the AAERs are selected by SEC investigators for further
action. The companies captured by the SEC are relatively large and are mostly publicly
listed companies. This is likely due to the SEC’s incentive to identify only the most
material and visible manipulations involving large losses to numerous investors (Dechow
et al. 2011). Further, the AAERs do not provide consistent information on the magnitude

- 26 -
and details of the manipulations to fully evaluate the nature and extent of particular
frauds. Future research is needed, where data permits, to examine the effectiveness of
assertions in planning the collection of evidence and in the identification of frauds of a
particular magnitude and type. The non-fraud companies may in fact contain an element
of undetected/unreported fraud, i.e. our results may be stronger if all frauds were detected
and reported.

- 27 -
REFERENCES American Institution of Certified Public Accountants 2003, ‘Consideration of Fraud in a
Financial Statement Audit’, Statement on Auditing Standard (SAS) No.99, New York, NY: AICPA.
Association of Certified Fraud Examiners 1995, Report to the Nation: Occupational Fraud and Abuse, Austin, Texas.
Beasley, M. S. 1996, ‘An Empirical Analysis of the Relation between the Board of Director Composition and Financial Statement Fraud’, Accounting Review, Vol . 71, No. 4, pp. 443-465.
Beasley, M. S., Carcello ,J. V., Hermanson, D. R. & Lapides, P. D. 2000, ‘Fraudulent Financial Reporting: Consideration of Industry Traits and Corporate Governance Mechanisms’, Accounting Horizons, Vol . 14, No. 4, pp. 441-454.
Bonner, S. E., Palmrose, Z. V. & Young, S. M. 1998, ‘Fraud Type and Auditor Litigation: An Analysis of SEC Accounting and Auditing Enforcement Releases’, The Accounting Review, Vol . 73, No. 4, pp. 503-532.
Carcello, J. V. & Nagy, A. L. 2004, ‘Client Size, Auditor Specialization and Fraudulent Financial Reporting’, Managerial Auditing Journal, Vol . 19, No. 5, pp. 651-668.
Caster, P., Elder, R. J. & Jamvrin, D. J. 2008, ‘A Summary of Research and Enforcement Release evidence on Confirmation Use and Effectiveness’, Auditing: a Journal of Practice and Theory, Vol . 27, No. 2, pp. 253-279.
Colbert, J. L. 2000, ‘International and US standards: error and fraud’, Managerial Auditing Journal, Vol. 15, No. 3, pp.97-107.
Committee Of Sponsoring Organization Of The Treadway Commission (COSO) 2010, Fraudulent Financial Reporting: 1998-2007-Analysis of U.S. Public Companies, New York, NY: COSO.
Dechow, P. M., Sloan, R. G. & Sweeney, A. P. 1996, ‘Causes and Consequences of Earnings Manipulation: An Analysis of Firms Subject to Enforcement Actions by the SEC’, Contemporary Accounting Research, Vol. 13, No. 1, pp. 1-36.
Dechow, P. M., Ge, W., Larson, C. R. & Sloan, R. G. 2011, ‘Predicting Material Accounting Manipulations’, Contemporary Accounting Research, Vol. 28, No. 1, pp17-82.
Dunn, P. 2004, ‘The Impact of Insider Power on Fraudulent Financial Reporting’, Journal of Management, Vol. 30, No. 3, pp. 397-412.
Hogan, C. E., Rezaee, Z., Riley, R. A. & Velur y, U. K. 2008, ‘Financial Statement Fraud: Insights from the Academic Literature’, Auditing: a Journal of Practice and Theory, Vol . 27, No. 2, pp. 231-252.
Louwers, T. J., Ramsay, R. J., Sinason, D. H. & Strawser, J. R. 2007, Auditing and Assurance Services, New York, NY: McGraw-Hill/Irwin.
Payne, E. A. & Ramsay, R. J. 2005, ‘Fraud risk assessments and auditors' professional scepticism’, Managerial Auditing Journal, Vol. 20, No. 3, pp. 321-330.
Public Company Accounting Oversight Board (PCAOB) 2003, ‘Understanding the Entity and Its Environment and Assessing the Risks of Material Misstatement’, AU section 314, http://www.aicpa.org/Research/Standards/AuditAttest/Pages/SAS.aspx
———.2003, ‘Consideration of Fraud in a Financial Statement Audit’, AU section 316, http://pcaobus.org/Standards/Auditing/Pages/default.aspx

- 28 -
Smieliauskas, W. 2008, ‘A Risk Perspective on Fraudulent Financial Reporting’, Canadian Accounting Perspectives, Vol. 7, No. 3, pp. 189-227.
Skousen, C. J. & Wright, C. J. 2008, ‘Contemporaneous Risk Factors and the Prediction of Financial Statement Fraud’, Journal of Forensic Accounting, Vol IX, pp. 37-62.
Summers, S. L. & Sweeney, J. T. 1998, ‘Fraudulently Misstated Financial Statements and Insider Trading: An Empirical Analysis’, Accounting Review, Vol. 73, No. 1, pp. 131-146.
Securities and Exchange Commission (2005-2008), Accounting and Auditing Enforcement Releases. http://www.sec.gov/divisions/enforce/friactions.shtml.
Securities and Exchange Commission (1933), The Securities Exchange Act of 1933: section 17(a).http://www.sec.gov.
Securities and Exchange Commission (1934), The Securities Exchange Act of 1934: section 10(b). http://www.sec.gov.
The International Auditing and Assurance Standards Board (IAASB) 2010, ‘The Auditor’s Responsibilities Relating to Fraud in an Audit of Financial Statement’, International Standards on Auditing (ISA) 240, http://web.ifac.org/download/a012-2010-iaasb-handbook-isa-240.pdf
——— 2010, “Indentifying and Assessing the Risks of Material Misstatement through Understanding the Entity and Its Environment’, International Standards on Auditing (ISA) 315 (Effective for audits of financial statements for periods beginning on or after December 15, 2009), http://web.ifac.org/download/a017-2010-iaasb-handbook-isa-315.pdf
Zimbelman, M. F. 1997, ‘The Effects of SAS No. 82 on Auditors' Attention to Fraud Risk Factors and Audit Planning Decisions’, Journal of Accounting Research, Vol. 35, No. 3, pp.75-97.