an analysis of clark mapping the future county’s
TRANSCRIPT

An Analysis of Clark
County’s Communities
and Economy
Mapping the Future
PREPARED FOR:
Shani Coleman, Director
Clark County Office of Community and
Economic Development
PREPARED BY SRI INTERNATIONAL®
Center for Innovation Strategy and Policy
DECEMBER 2020

Authors
This report was researched and written by Paul Liu, Emily Mellicant, Roland Stephen, and J.R.
Sullivan at the Center for Innovation Strategy and Policy, SRI International. The authors would like to
acknowledge significant support provided by Shani Coleman and the staff of Clark County
government.
Note
This report was developed by SRI International based on research funded by the Clark County
government. The findings, conclusions, and any errors in the report are the sole responsibility of the
authors. SRI International is a registered trademark.

Executive Summary
01 Introduction
04 Community & Economic Assessment
29 Asset Map
42 SWOT Analysis
55 Strategic Direction & Action Plan
68 Evaluation Framework
71 Appendix A
76 Appendix B
78 Appendix C
83 Notes
Contents

Acknowledgements
The Clark County Community & Economic Development Strategy was developed in no small part with
the assistance of many individuals and organizations throughout Southern Nevada. SRI thanks the
following organizations that contributed to this effort:
City of Henderson
City of North Las Vegas
Clark County Board of Commissioners
Clark County Government
Dapper Companies
Get Outdoors Nevada
Guinn Center for Policy Priorities
Las Vegas Chamber of Commerce
Latin Chamber of Commerce
McCarran International Airport
University of Nevada Las Vegas
Urban Chamber of Commerce

Executive Summary
Mapping the Future
An Analysis of Clark County’s
Communities and Economy

Executive Summary
Community & Economic Assessment
Demographics
Clark County has experienced rapid population growth (14.4%) between
2010 and 2018, far above the average for all U.S. metro areas (6.9%).
Moving forward, Clark County should focus its efforts on attracting
individuals in the prime working age population (i.e., those aged 25 to
44) to maintain a dynamic regional labor force.
There also remains significant variation in socioeconomic status among
Clark County’s unincorporated areas. Poverty rates range from 6.8% in
Summerlin South to 21.9% in Sunrise Manor. Work remains to be done to
close the socioeconomic gap between the various unincorporated areas.
Business & Industry
Clark County’s economy grew at a steady pace prior to the COVID-19
pandemic. Emerging industries that assist the region’s economic
diversification include information technology, logistics, manufacturing,
and healthcare. Though these industries currently represent a smaller
portion of the region’s economy, their promise for future growth is
significant. Likewise, their resiliency in the face of the pandemic-induced
economic recession speaks to their role in the region’s economy moving
forward.
Workforce & Employment
Southern Nevada’s diversifying economy has led to notable growth in
high-paying occupations such as computer systems design and data
processing and hosting. Nevertheless, the region’s economy remains
dominated by low-wage and low-skill occupations such as food
preparation and serving and retail sales. Underemployment remains a
challenge for much of the region’s population, with 44.0% of those with
at least a bachelor’s degree employed in occupations that do not require
a four-year education. A similar challenge persists for those with some
college or an associate’s degree (70.0% underemployed) and those with
a high school education or GED (39.0% underemployed).

Innovation & Entrepreneurship
Nevada continues to make progress toward becoming an “innovation
economy.” Notably, UNLV has further cemented its importance to the
region’s innovation economy by attaining R1 status for “very high
research activity,” in addition to expanding funding and training
opportunities for student entrepreneurs. Work remains to be done,
however, particularly for the development and commercialization of new
technologies envisioned by Clark County entrepreneurs. Among selected
public universities in other Western states, UNLV outperforms only UNR
in invention disclosures, patent applications, number of licenses, and
startups formed.
Environment
Clark County residents have engaged with the region’s outdoor recreation
assets at an unprecedented level during the pandemic. Between March
and April 2020, BLM and other public lands in Clark County witnessed a
400% increase in visitor volume.
In addition to increased levels of engagement with their outdoor spaces,
Southern Nevadan’s have also demonstrated awareness of their region’s
unique habitat and the constraints of living in a desert climate. Despite a
rapidly growing population, water use per capita has consistently
decreased since 2000. Such conservation measures are necessary to
support Clark County’s future growth.
Infrastructure & Energy
Southern Nevada’s existing infrastructure continues to favor vehicles,
with a significant portion of the county’s population choosing to drive
alone or carpool to work. While new infrastructure projects tend to focus
on expanding roadway capacity and connectivity, there is an increased
interest in mixed-use and transit-oriented development.
Clark County’s energy infrastructure has continued to evolve to allow
greater use of renewable energy in the local grid. Though natural gas
continues to dominate the energy scene in the county, solar power shows
increasing promise for the region, and wind power may represent an
underdeveloped source as well.

SWOT Analysis
The SWOT analysis highlights sources of strength and weakness that may be addressed,
opportunities to be realized, and dangers and difficulties to be avoided.


Strategic Direction
Vision
Clark County is a world-class gateway to the Mountain West, built upon prosperous and diverse
communities and businesses.
Mission
Clark County catalyzes visionary initiatives that transform Southern Nevada into a smart, green, and
vibrant region.
Goals & Objectives
1. Cultivate a Fertile Environment for Small Businesses and Entrepreneurs
1.1. Support and coordinate activities that underpin entrepreneurship networks.
1.2. Ensure small-business owners have the tools and capabilities to scale successfully.
1.3. Expand community financial services.
2. Accelerate Economic Diversification
2.1. Streamline business services.
2.2. Support the growth of health services.
2.3. Fuel lifestyle entrepreneurship in arts and culture and outdoor recreation.
3. Integrate the Workforce Ecosystem
3.1. Improve access to diverse choices for training and education for workers and employers,
particularly among the region’s underserved communities.
3.2. Promote innovative remote workforce programs.
4. Mobilize Stakeholders around Community-Wide Initiatives
4.1. Reinforce strong relationships between Clark County and municipal governments.
4.2. Build fundraising capacity among regional organizations.
5. Promote Community-Centered Design of the Built Environment
5.1. Implement smart city innovation throughout the county to serve residents and visitors
5.2. Improve and diversify access to mobility options.
5.3. Adopt and promote sustainable practices in energy and infrastructure.
5.4. Encourage revitalization of distressed areas of unincorporated Clark County.
6. Ensure Equitable Access to Resources
6.1. Advance equity in both the workforce and the business community.
6.2. Sustain and expand streamlined access to county services for residents and businesses.

1
Introduction
Mapping the Future
An Analysis of Clark County’s
Communities and Economy
2
Introduction
Over the last decade, Clark County has demonstrated its resiliency. The impact of the Great
Recession of the late 2000s was perhaps felt nowhere harder than in Southern Nevada, where
consumer spending has traditionally driven the region’s economy and employed Clark County
residents. The global economic downturn produced strong headwinds for the region, slowing Clark
County’s return to growth. Nevertheless, through the efforts of regional stakeholders like the Clark
County government and the Las Vegas Global Economic Alliance (LVGEA), as well as state partners
such as the Governor’s Office for Economic Development (GOED), Clark County has not only rebuilt
its economy and communities but has expanded at an unprecedented rate.
As Clark County looks forward to the next decade, renewed dedication to purposeful development is
necessary to further diversify the region’s economy and address the needs of the county’s diverse
communities. The impact of the COVID-19 pandemic on the residents and businesses of Clark
County has reinvigorated this need. To lead the charge, the Clark County government has
established the Office of Community and Economic Development (OCED). OCED will play a critical
role in enabling development throughout the region by assisting new, established, and prospective
businesses in entering the Southern Nevadan market and engaging with local communities.
The Clark County Office of Community and Economic Development has engaged SRI International to
develop a Community and Economic Development Strategic Plan for the county. SRI has performed
other economic development projects in Southern Nevada, most recently including a comprehensive
economic development strategy (CEDS) for LVGEA in 2019, as well as for the state through GOED.
However, while prior work has focused primarily on the role of different state and local organizations
in furthering economic development and diversification, this document intends to more acutely
address the needs and challenges facing Clark County’s communities, and how these needs work
alongside economic change. This document includes an economic and community assessment,
asset map, and SWOT analysis, while also laying out a strategic vision, goals, and an action plan to
achieve this vision. An evaluation framework is also provided to measure the county’s progress on
several key performance metrics.
The following assessment serves to “diagnose” various characteristics of Clark County’s
communities and economy, identifying certain areas of interest or concern. Combined with the
output of the visioning exercises, the assessment lays the groundwork for identifying specific actions
stakeholder organizations can take to achieve the county’s vision. The first section, the Economic
and Community Assessment, primarily uses state and federal data to assess the region’s
performance over the last decade in a variety of subject areas, including industry, workforce,
innovation, and environment. The Asset Map that follows is informed by interviews conducted by SRI
with stakeholders throughout Clark County, supplemented by a review of literature related to the
local communities and economy. Finally, the SWOT Analysis identifies the key characteristics of Clark
County that impact its current and future performance.

3
Community & Economic
Assessment
Mapping the Future
An Analysis of Clark County’s
Communities and Economy
Lou Ruvo Center for Brain Health in Clark County, Nevada. Photo Courtesy of Paul K./Flickr.

4
Community & Economic Assessment
Clark County is comprised of many diverse communities that drive the local economy. To understand
the region’s economy, it is also necessary to understand the trends emerging and forces impacting
local communities. The Economic & Community Assessment seeks to understand the economic and
societal forces driving Clark County forward, particularly as the county emerges from the COVID-19
pandemic, and to assess the region’s performance on several key factors. The following are
important for this assessment:
• Demographics
• Business & Industry
• Workforce & Employment
• Innovation & Entrepreneurship
• Environment
• Infrastructure & Energy
This assessment is largely driven by quantitative data collection. While SRI has spoken with many
Clark County stakeholders, their inputs are more directly reflected in the Asset Map and SWOT
Analysis.
Methodological Note
Most of the data in the Economic & Community Assessment are analyzed at the metropolitan
statistical area (MSA) level, as defined by the U.S. Office of Management and Budget. The Las Vegas-
Henderson-Paradise MSA is coextensive with Clark County, Nevada. Similarly, Clark County is the
only county in the Southern Nevada region, as defined by the Nevada Governor’s Office for Economic
Development (GOED). Therefore, this report will refer to Las Vegas, the Las Vegas MSA, Clark County,
and Southern Nevada, all of which should be interpreted as representing the same area unless
otherwise noted.
SRI’s analysis uses comprehensive datasets from several state and federal statistical agencies, such
as the U.S. Census Bureau, the Bureau of Labor Statistics, and the Nevada System of Higher
Education (NSHE). Represented alongside Southern Nevada in these datasets are eleven peer
metropolitan areas. These peer MSAs were chosen based upon a mix of criteria, including size, rate
of growth, geographic proximity, and shared industry sectors.
Demographics
Clark County has seen significant population growth over the last decade. Between 2010 and 2018,
the county’s population swelled by about 280,000, bringing the total population for the Las Vegas-
Henderson-Paradise metropolitan statistical area (MSA) to over 2.2 million residents. This represents
an increase of more than 14%, far exceeding the national average for U.S. metropolitan areas (6.9%)
during that same time. Among its peer metro areas, Las Vegas ranked sixth for percent increase in
total population between April 2010 and July 2018 (Figure 1 below).
5
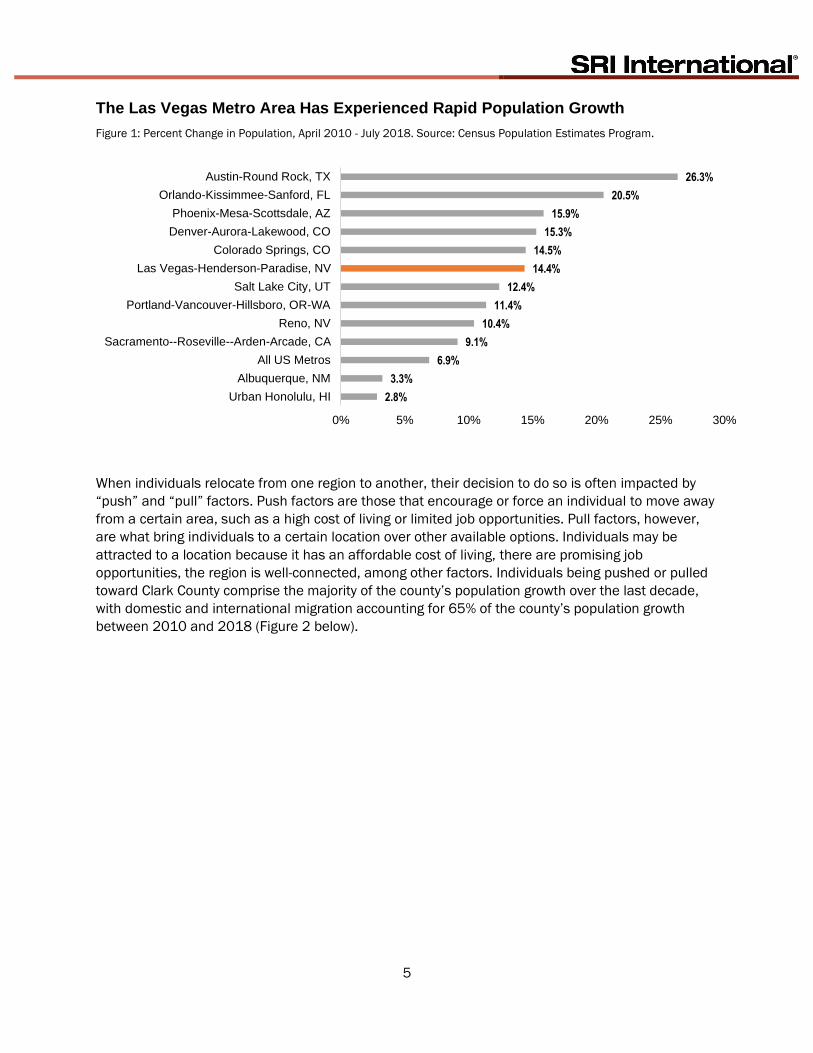
The Las Vegas Metro Area Has Experienced Rapid Population Growth
Figure 1: Percent Change in Population, April 2010 - July 2018. Source: Census Population Estimates Program.
When individuals relocate from one region to another, their decision to do so is often impacted by
“push” and “pull” factors. Push factors are those that encourage or force an individual to move away
from a certain area, such as a high cost of living or limited job opportunities. Pull factors, however,
are what bring individuals to a certain location over other available options. Individuals may be
attracted to a location because it has an affordable cost of living, there are promising job
opportunities, the region is well-connected, among other factors. Individuals being pushed or pulled
toward Clark County comprise the majority of the county’s population growth over the last decade,
with domestic and international migration accounting for 65% of the county’s population growth
between 2010 and 2018 (Figure 2 below).
2.8%
3.3%
6.9%
9.1%
10.4%
11.4%
12.4%
14.4%
14.5%
15.3%
15.9%
20.5%
26.3%
0% 5% 10% 15% 20% 25% 30%
Urban Honolulu, HI
Albuquerque, NM
All US Metros
Sacramento--Roseville--Arden-Arcade, CA
Reno, NV
Portland-Vancouver-Hillsboro, OR-WA
Salt Lake City, UT
Las Vegas-Henderson-Paradise, NV
Colorado Springs, CO
Denver-Aurora-Lakewood, CO
Phoenix-Mesa-Scottsdale, AZ
Orlando-Kissimmee-Sanford, FL
Austin-Round Rock, TX

6
Migration from Other U.S. Regions Accounts for Most of Southern Nevada’s
Population Growth
Figure 2: Composition of Population Growth in Las Vegas MSA, by Source of Growth, 2010-2018. Source: U.S. Census
Population Estimates.
Using demographic data from the American Community Survey, it is possible to discern what age
groups have been most compelled to move to Southern Nevada. This data may provide some
indication as to how the region’s assets attract individuals within certain age groups. Of particular
interest for Southern Nevada is population growth in those aged 25–44, as these individuals are
generally beginning their careers or relocating mid-career and are likely interested in growing their
careers in Clark County.
As can be seen in Figure 3 below, though Clark County’s overall population growth has been high
(see Figure 1 above), the region has struggled to attract those that may be considered “prime
working age,” or those that are aged 25–44. Among its peer metro areas, the Las Vegas metro area
ranked tenth for percent increase in population aged 25–44. Meanwhile, growth in older
populations, specifically those aged 45–64 and 65 and older, has far outpaced the younger
population, with Southern Nevada ranking third among its peer metro areas for percent growth in
population aged 65 and older.
96,269
279,540
29,132
154,139
0
50,000
100,000
150,000
200,000
250,000
300,000
Natural Increase InternationalMigration
DomesticMigration
Total

7
Growth in Working-Age Populations Remains Low
Figure 3: Population Change for Selected Age Groups, by MSA, 2010-2018. Source: American Community Survey, Five-Year
Estimates, 2014-2018. Note: Data are ranked by MSA’s population growth for those aged 25–44.
As Southern Nevada’s population has grown, so, too, has its poverty levels (Figure 4 below). This
increase has been most marked among Clark County’s population without a four-year degree,
following national trends that indicate higher education levels can lead to higher levels of income.
Poverty Rates Have Increased, Mainly for Those Without a Bachelor’s
Figure 4: Poverty Rate, by Education Level, 2010 and 2018. Source: American Community Survey, Five-Year Estimates,
2014-2018.
Ages 25-44: 6.61% (+38,168) Ages 45-64: 17.03% (+78,160)
Ages 65+: 46.78% (+96,195)
-10% 0% 10% 20% 30% 40% 50% 60% 70%
Albuquerque, NM
Urban Honolulu, HI
Las Vegas-Henderson-Paradise, NV
Sacramento-Roseville-Arden-Arcade, CA
Reno, NV
Phoenix-Mesa-Scottsdale, AZ
Salt Lake City, UT
Portland-Vancouver-Hillsboro, OR-WA
Colorado Springs, CO
Denver-Aurora-Lakewood, CO
Orlando-Kissimmee-Sanford, FL
Austin-Round Rock, TX
2010: 18.0%
9.4%7.2%
4.6%
2018: 20.9%
13.8%
10.2%
6.0%
0%
5%
10%
15%
20%
25%
Less than HS High School (or Equiv) Some College orAssociates Degree
Bachelor's Degree orHigher

8
The increase in Clark County’s poverty levels may indicate that the county’s population growth has
been concentrated in lower-education, lower-income population groups. However, zip code data from
the Economic Innovation Group (EIG) demonstrate that while poverty levels in Clark County have
increased, the percentage of individuals living in distressed zip codes has almost halved between
2007 and 2017 (31.6% and 16.1%, respectively), and the percentage of individuals living in
prosperous zip codes has increased from 21.2% to 35.1%. One way to interpret these data is the
concentration of Clark County’s lower-income populations into smaller areas of the county, whereas
other areas of the county are seeing greater income growth. Overall, according to EIG, Clark County
has emerged from the Great Recession, during which it was classified as a “mid-tier” county to now
be recognized as a “comfortable” county.1
Assessing Unincorporated Clark County
There are differences between Clark County’s communities that are worth mentioning here.
Specifically, a significant portion (nearly half of the county’s total) of Clark County’s population
resides in unincorporated areas of the county, without a local governmental jurisdiction aside from
Clark County government. These unincorporated areas comprise all land outside of the cities of Las
Vegas, North Las Vegas, Henderson, Boulder City, Mesquite, and Nellis Air Force Base.
Unincorporated Clark County represents 43% of the county’s population and contains 45% of its
housing units. In general, unincorporated areas in the county are more economically distressed than
its municipalities (see Table 1 below).
Residents in Unincorporated Clark County Are More Likely to Be Lower-Income,
Nonwhite, and Renters
Table 1: Comparison of Socioeconomic Indicators Between Incorporated and Unincorporated Areas in Clark County, 2018.
Source: American Community Survey, Five-Year Estimates.
Socioeconomic
Indicator
Unincorporated
Areas
Incorporated
Areas
Population 921,644 1,219,930
Housing Units 401,545 487,011
% Nonwhite 38% 31%
Median Household Income $54,593 $63,132
Median Worker Earnings $31,498 $35,119
Unemployment Rate 7.3% 7.2%
% Renters 52% 43%
% Homeowners 48% 57%
Median Age of Homes
(in years) 27 28
Residential Vacancy Rate 17% 11%

9
Although employment rates between the county’s incorporated and unincorporated areas are
comparable, residents living in unincorporated areas are generally poorer and more likely to be
nonwhite than those residing in the municipalities. Compared to municipal residents, a significantly
larger share of residents in unincorporated areas are renters. Lastly, the vacancy rate in
unincorporated areas is substantially higher despite the median age of homes being similar to that
of homes in incorporated areas.
However, not all unincorporated areas in the county are distressed. Rather, as shown in Table 2,
distress is concentrated in several unincorporated places, while other areas are relatively
prosperous.
Economic Distress Varies across Unincorporated Areas
Table 2: Comparison of 2018 socioeconomic indicators between unincorporated places in Clark County. Source: American
Community Survey, 5-Year Estimates. Note: Highlighted data signify that the unincorporated place ranks in the top three for
% Nonwhite, % Hispanic, % Adults over 25 without High School Degree, Unemployment Rate, Poverty Rate, % Renters,
Median Age of Home, and Residential Vacancy Rate, and the bottom three for Median Household Income and Median
Earnings.
Socioeconomic
Indicator
Unincorporated Regions of Clark County
Paradise Spring
Valley
Sunrise
Manor Enterprise Whitney Winchester
Summerlin
South Laughlin
Moapa
Valley
Population 233,689 199,722 192,934 164,314 43,072 28,331 27,506 7,502 6,843
% Nonwhite 43% 48% 48% 47% 55% 42% 24% 15% 4%
% Hispanic 35% 24% 53% 19% 36% 49% 11% 14% 8%
% Adults over 25
without a High
School Degree
16% 12% 27% 7% 16% 24% 4% 13% 9%
Unemployment
Rate 7.9% 5.7% 10.1% 4.4% 9.4% 10.1% 4.8% 16.4% 4.8%
Poverty Rate 17.6% 12.5% 21.9% 7.9% 15.4% 20.4% 6.8% 15.1% 7.0%
Median
Household
Income
$46,313 $55,828 $41,729 $76,952 $49,925 $37,737 $88,969 $33,851 $69,361
Median Earnings $29,964 $32,231 $26,493 $40,473 $30,066 $27,201 $57,614 $21,864 $47,394
% Owners 39% 45% 50% 59% 52% 36% 68% 42% 77%
% Renters 61% 55% 50% 41% 48% 64% 32% 58% 23%
Total Housing
Units 113,716 87,715 71,084 64,430 17,448 14,992 13,126 5,624 2,944
Median Age of
Home (in years) 31 24 30 15 19 44 15 30 31
Residential
Vacancy Rate 20.5% 15.0% 11.9% 14.5% 14.8% 23.1% 12.4% 31.8% 21.9%

10
There is wide variation in economic distress among Clark County’s unincorporated places, with
clusters of distress concentrated in Winchester, Laughlin, Sunrise Manor, and Paradise. Poverty is
highest in Sunrise Manor, Winchester, and Paradise, which corresponds to relatively high
unemployment and depressed income and earnings in these areas. The majority of residents in
Paradise, Winchester, Laughlin, and Spring Valley are renters, whereas residents in more prosperous
areas tend to be homeowners.
The median age of homes in Winchester, Paradise, Moapa Valley, Sunrise Manor, and Laughlin is
older than that of the county’s unincorporated areas as a whole, with homes in Winchester being
significantly older than most other areas. Residential vacancies generally correspond to the median
age of homes. Laughlin’s vacancy rate, at 32%, is by far the highest, followed by Winchester, Moapa
Valley, and Paradise.
In summary, the above analysis has shown that Clark County’s unincorporated areas are generally
more economically distressed than its incorporated areas. However, distress in unincorporated areas
appears to be concentrated in places such as Winchester, Laughlin, Sunrise Manor, and Paradise.
These findings have significant implications for the county’s economic development strategy, as
policies and programs may need to prioritize these most distressed areas.
Business & Industry
Between the Great Recession and the COVID-19 pandemic, Clark County has achieved an impressive
economic rebound that is evidenced by strong gross domestic product (GDP) and employment
growth. The county’s GDP grew by 43% between 2010 and 2018, or an average annual rate of 4.6%
(Figure 5). This places Southern Nevada’s economic growth solidly among the middle tier of its peer
metro areas, ranking seventh for percent growth between 2010 and 2018. As a result, Clark
County’s economic growth has kept pace with most of its peer regions and has closely paralleled
growth in the Orlando, Phoenix, and Colorado Springs metro areas.
Clark County Has Kept Pace with Peer Regions in GDP Growth
Figure 5: Index of GDP Growth, by MSA, 2010-2018. Source: Bureau of Economic Analysis.
Las Vegas-Henderson-Paradise, NV
100 103 104 108 113 121 127 132 143
0
20
40
60
80
100
120
140
160
180
2010 2011 2012 2013 2014 2015 2016 2017 2018

11
Clark County’s job market enjoyed a prolonged growth phase since 2010, driven by an influx of new
residents and its strong economic recovery. Employment in all sectors grew by 29%, from about
797,000 jobs in 2010 to 1,025,000 jobs in 2019. The private sector added about 218,500 jobs in
the same period, expanding by 31% from its 2010 employment levels.
While leisure and hospitality remain the bedrock of Clark County’s economy, employment in the
sector has largely stagnated or even declined in some areas. In contrast, rapid growth in industries
such as healthcare, logistics, IT, and manufacturing suggests that the economy has diversified since
the Great Recession. Nevertheless, the leisure and hospitality sector still accounts for one out of
every three jobs in Clark County.
Figure 6 below shows the growth trends of Clark County’s major employment sectors since 2010.
Although the business, professional, education, and health services sectors grew steadily, leisure
and hospitality remain by far the largest sector in the region prior to COVID-19. Unfortunately, it is
also the sector that is most vulnerable to the pandemic. The numbers in parentheses represent the
change in employment between February 2020 and September 2020. Employment in leisure and
hospitality contracted significantly in the early phases of the pandemic as businesses shut down and
visitor travel halted, falling 47% between February and April 2020. The industry has rebounded
somewhat, recovering about half of the jobs lost since February 2020, but employment remains
down by about 24% as of September 2020. Whereas other sectors, such as financial activities and
business and professional services, were able to continue operating through remote work and thus
were less affected by the pandemic, the leisure and hospitality sector had no such alternative.
Prior to COVID-19, Employment in Southern Nevada Grew Steadily
Figure 6: Las Vegas-Henderson-Paradise MSA Non-Seasonally Adjusted Employment (in thousands), by Selected Industry,
January 2010 to September 2020. Source: Quarterly Census of Employment and Wages, U.S. Bureau of Labor Statistics.
Note: The data in parentheses represent the change in employment from February 2020 to September 2020, capturing the
impact of the COVID-19 pandemic on employment. The grey line indicates the beginning of stay-at-home orders caused by
the COVID-19 pandemic in March 2020.
Construction (-5.0%)
Manufacturing (-3.9%)
Trade, Transportation, and Utilities(-5.74%)
Information (-19.1%)
Financial Activities (+0.37%)
Professional and Business Services(-12.3%)
Education and Health Services (-4.8%)
Leisure and Hospitality (-24.2%)
0
50
100
150
200
250
300
350

12
Figure 7 illustrates the extent to which the industry landscape revolves around gaming,
accommodation, and tourism. As the county’s economic base, the restaurant and accommodation
industries (which include casino hotels) account for more than 280,000 jobs, or roughly a quarter of
the county’s employed workforce. These two industries depend on supporting industries in the
business and professional services sector while creating demand for other industries, such as local
retail stores. The relatively low wages in accommodation and restaurants, as well as in most of its
supporting industries, present a significant challenge to Clark County’s economic development
objectives. However, the county’s strong healthcare sector and the emergence of new industry
clusters present opportunities for the region to build a more diverse economy.
Southern Nevada’s Economy Revolves around Accommodation & Tourism, but
Health Services and Logistics Represent Potential Opportunities
Figure 7: Employment Growth and Wages in Clark County’s Fifteen Largest Industries. Source: Quarterly Census of
Employment and Wages, U.S. Bureau of Labor Statistics. Note: Size of bubbles represents number of employed workers in
each industry; industries aggregated at the 4-digit NAICS code level.
Emerging industries which have experienced rapid growth since 2010 include those in the
information technology, logistics, manufacturing, consulting, and healthcare sectors (Table 3). In
information technology, the software publishing, data processing, and computer systems design
Accommodation (incl. casino hotels)
Restaurants
Management of Companies
& Enterprises
Hospitals
Building Equipment Contractors
Building Services
Business Support Services
Grocery Stores
Offices of Physicians
EmploymentServices
Building Exterior Contractors
Clothing Stores
Warehousing andStorageBuilding Finishing
Contractors
SecurityServices
$0
$20,000
$40,000
$60,000
$80,000
$100,000
$120,000
-50% 0% 50% 100% 150% 200% 250% 300%
Avera
ge A
nnual W
age (
2019)
% Employment Growth (2010 - 2019)
Leisure & Hospitality Retail Trade Professional & Business Services
Construction Trade, Transportation, & UtilitiesHealth Services

13
industries grew by 89% and added approximately 4,000 jobs between 2010 and 2019. Wages in
these industries tend to be above $90,000, and continued growth has the potential to improve job
quality in the county. Logistics-based industries, such as those that support air and ground
transportation, have also added thousands of jobs and have emerged as a major industry cluster.
Though logistics typically does not offer high wages, it does present another avenue to diversify the
county economy away from leisure and hospitality. Lastly, the county’s population growth, particularly
among the elderly, has driven demand for health services. Hospitals, laboratories, and physicians’
offices have added thousands of jobs and could present the local workforce with higher-wage
alternatives to tourism-related jobs.
Select High-Growth Industries in Clark County
Table 3: Select High-Growth Industries in Clark County, by Employment and Average Annual Wage. 2010-2019. Source:
Quarterly Census of Education and Wages, Bureau of Labor Statistics.
Industry 2010
Employment
2019
Employment
Percent
Growth
Avg. Annual
Wage
Computer Systems Design 3,749 5,883 +57% $98,847
Software Publishers 438 1,209 +176% $117,369
Data Processing & Hosting 409 1,604 +292% $95,216
Warehousing and Storage 3,656 13,620 +273% $36,479
Support Activities for Air
Transportation 2,578 5,010 +94% $56,602
Hospitals 13,614 19,853 +46% $76,172
Medical Diagnostics and
Laboratories 1,935 3,609 +87% $64,990
Management, Scientific, and
Technical Consulting Services 2,570 4,585 +78% $87,074
Architectural and Structural
Metals Manufacturing 816 1,785 +119% $52,354
Clark County’s strong economic growth and its path to diversification had gone unimpeded up until
the COVID-19 pandemic. While leisure and hospitality remain the dominant economic driver, the
county’s large and growing healthcare sector, the rapid rise of its logistics and transportation
industries, and emerging opportunities in IT present an avenue to accelerate the diversification of
Clark County’s economic base.
The need for Clark County to pursue industry diversification has been underscored by the economic
fallout of the COVID-19 pandemic. While casinos and hotels have largely shut down, industries such
as IT, professional services, and finance are able to continue operating due to their ability to
telework. Consequently, regions in which these industries are prominent have been able to keep
more workers employed and more businesses open during the pandemic. As Clark County plans for
its post-pandemic economic recovery, developing a strategy that fosters a diversified mix of
industries is critical to building a more resilient and sustainable economy.

14
Workforce & Employment
Clark County’s labor market has seen a strong recovery since the depths of the Great Recession. The
unemployment rate has fallen sharply as strong job growth made more positions available to local
residents. Compared to peer metro areas, however, Clark County’s unemployment rate has remained
consistently high and was outpaced only by Phoenix, Arizona (4.1%) and Albuquerque, New Mexico
(4.6%) (Figure 8).
Unemployment Fell Significantly before the COVID-19 Shutdown
Figure 8: Unemployment Rate, by MSA, 2010-2019. Source: Bureau of Labor Statistics.
The COVID-19 pandemic has had a greater impact on Clark County’s labor market than most metro
areas in the United States. Lockdowns and business closures in the Leisure and Hospitality sector
prevented a large proportion of Clark County’s workforce from working. The unemployment rate as of
August 2020 (15.5%) is the fifth highest among the nation’s 389 metro areas and far higher than
Clark County’s peer metro areas.
Figure 9 provides a more granular view of the pandemic’s impact on unemployment. As shutdowns
began in March and took full effect in April, the unemployment rate in Clark County jumped to 34%
before falling to 15.5% in August as some businesses reopened. The employment impact for peer
metro areas was less dramatic, especially for areas whose workforces contain large numbers of
telework-enabled workers and businesses. For example, the August 2020 unemployment rate in
Austin, Texas was 5.5%, due in part to its outsized Business Services and IT sectors whose workers
are generally able to continue working from home during the pandemic.
13.8%13.2%
11.3%
9.7%
8.0%
6.8%5.8%
5.2%4.7% 4.0%
15.5%
0%
2%
4%
6%
8%
10%
12%
14%
16%
18%
2010 2011 2012 2013 2014 2015 2016 2017 2018 2019 Aug2020
Las Vegas-Henderson-Paradise, NV

15
COVID-19 Brought a Disproportionate Impact on Clark County’s Labor Market
Figure 9: Unemployment Rate, by MSA, January 2020 – August 2020. Source: Bureau of Labor Statistics.
In the decade between the Great Recession and COVID-19, Clark County’s labor market has become
more diverse as growth in higher-wage and higher-skill occupations, such as those in healthcare and
business operations, led to a corresponding decrease in the share of lower-wage retail and sales
jobs. Nevertheless, restaurant workers, office and administrative assistants, and sales workers still
comprise almost 39% of all workers in Clark County (Table 4).
Southern Nevada’s Most Popular Occupations Are Mostly Low-Wage
Table 4: Top Ten Occupations in Clark County, by Number of Employees. Source: Bureau of Labor Statistics, Occupation
and Employment Statistics.
Occupational Category 2019
Employment
2019
Employment
Share
Change in
Employment
Share 2010–
2019
2019 Annual
Median Wage
Food Prep. and Serving 151,120 14.8% -1.2% $24,980
Office and Admin. Support 138,720 13.6% -3.5% $35,680
Sales 109,480 10.7% -0.5% $27,550
Transportation and Moving 88,500 8.7% +1.6% $30,410
Personal Care and Service 58,100 5.7% -0.8% $21,480
Building and Grounds Maintenance 57,370 5.6% -1.0% $34,000
Construction and Extraction 53,250 5.2% -0.3% $47,320
Management 50,120 4.9% +0.4% $95,960
Healthcare and Technical 47,270 4.6% +0.5% $83,090
3.9% 3.9%7.2%
34.0%
28.8%
17.8%16.6%
15.5%
0%
5%
10%
15%
20%
25%
30%
35%
40%
Jan2020
Feb2020
Mar2020
Apr2020
May2020
Jun2020
Jul2020
Aug2020
Las Vegas-Henderson-Paradise, NV

16
Occupational Category 2019
Employment
2019
Employment
Share
Change in
Employment
Share 2010–
2019
2019 Annual
Median Wage
Business and Financial Operations 38,960 3.8% +0.7% $62,120
Clark County’s labor market, despite trending toward higher-quality jobs (albeit slowly), is still
overwhelmingly concentrated in low-wage, low-skill, and service sector occupations. The four largest
occupations in the county are Retail Salespersons, Fast Food and Counter Workers, Waiters and
Waitresses, and Cashiers, which together comprise one in eight jobs within the county. Of the 20
largest occupations (comprising 40% of the county workforce), only four occupations offer an
average annual wage above $35,000.
The relative scarcity of higher-wage jobs in Clark County is reflected in the education levels of its
labor force. Only 26% of Clark County workers had Bachelor’s degrees in 2018, by far the lowest
among peer regions but a slight improvement from 2010, when 24% of workers were college
graduates (Table 5).
Clark County’s Labor Force Remains Concentrated in Lower Education Levels Table 5: Labor Force Educational Attainment, by MSA, 2018. Source: American Community Survey, 5-Year Estimates.
Less than
High School
High School
Graduate
Some College or
Associate Degree
Bachelor’s
Degree or Higher Austin-Round Rock, TX 8% 17% 27% 47%
Denver-Aurora-Lakewood, CO 7% 18% 28% 47%
Portland-Vancouver-Hillsboro, OR-WA 7% 17% 33% 43%
Colorado Springs, CO 5% 18% 36% 41%
Urban Honolulu, HI 5% 23% 33% 38%
Sacramento--Roseville--Arden-Arcade, CA 8% 19% 35% 38%
Salt Lake City, UT 8% 22% 34% 36%
Orlando-Kissimmee-Sanford, FL 7% 23% 34% 36%
Albuquerque, NM 9% 22% 34% 35%
Phoenix-Mesa-Scottsdale, AZ 10% 21% 34% 35%
Reno, NV 11% 23% 34% 32%
Las Vegas-Henderson-Paradise, NV 13% 27% 34% 26%
In general, growth in a region’s college-educated workforce is correlated with rising incomes in its
resident population. While this has been the case for other regions in Clark County’s peer group, the
county’s 19% increase in its college-educated workers has not led to income growth between 2010
and 2018 (see Figure 10 below). Instead, median household income has stagnated since the Great
Recession while incomes in other regions have grown considerably. The county’s median household
income in 2018 ($56,802) is roughly the same as it was in 2010 ($56,258). Among peer metro
areas, Clark County has experienced the lowest growth in median household income.

17
Growth in Household Income Has Lagged Peer Regions Despite Increase in
College-Educated Workers
Figure 10: Growth in College Graduates and Median Household Income, by MSA, 2010-2018. Source: American Community
Survey, Five Year Estimates.
Stagnant growth in household income may be a symptom of the negative impact that the county’s
dependence on leisure and hospitality, an industry that relies on a less educated workforce and pays
relatively low wages, has on the region’s long-term economic well-being. Even though the county’s
labor force is relatively less educated, the scarcity of higher-wage and higher-quality jobs (which
typically require at least a Bachelor’s degree) means that a sizable share of college-educated
workers are compelled to accept jobs that do not require a Bachelor’s degree. As Table 6 shows, only
56% of Clark County’s workers with Bachelor’s degrees work in occupations that require a Bachelor’s
degree. The rest work as casino workers, office clerks, and restaurant servers – occupations that do
not typically require a 4-year college education. Among workers who have some postsecondary
education but did not receive a Bachelor’s, 70% work in occupations that require only a high school
education or no formal education at all. These findings strongly suggest that a sizable share of Clark
County’s labor force is underemployed.
Growth in Median Household Income: 1.0%
Growth in College Graduates: 18.9%
0% 5% 10% 15% 20% 25% 30% 35% 40% 45% 50%
Albuquerque, NM
Urban Honolulu, HI
Sacramento--Roseville--Arden-Arcade, CA
Las Vegas-Henderson-Paradise, NV
Reno, NV
Colorado Springs, CO
Phoenix-Mesa-Scottsdale, AZ
Portland-Vancouver-Hillsboro, OR-WA
Orlando-Kissimmee-Sanford, FL
Salt Lake City, UT
Denver-Aurora-Lakewood, CO
Austin-Round Rock, TX

18
Clark County’s Workforce Is Underemployed
Table 6: Cross-Tabulation of Clark County Workers’ Educational Attainment by their Jobs’ Entry-Level Education
Requirements, 2018. Source: Bureau of Labor Statistics Employment Projections Program; American Community Survey
2014-2018; IPUMS USA Microdata. Note: Text in italics represents the five largest occupations in each category. The
“Percent Underemployed” may not add to 100% due to rounding.
Workers by Educational Attainment
Less than High
School
High School or
GED
Some College or
Associate Degree
Bachelor’s Degree
or Higher
Jobs by Entry-
Level
Education
Requirement
Less than
High School
60% Cleaners/housekeepers
Cooks
Construction laborers Cashiers
Freight laborers
39% Cleaners/housekeepers
Cashiers
Cooks Waiters/Waitresses
Retail salespersons
23% Retail salespersons
Waiters and waitresses
Cashiers Bartenders
Cleaners/Housekeepers
11% Retail salespersons
Waiters/waitresses
Cashiers Cleaners/Housekeepers
Cooks
High School
or GED
31% Drivers
Carpenters
Casino workers
Retail supervisors
Customer service reps
45% Drivers
Retail supervisors
Casino workers
Security guards
Customer service reps
47% Customer service reps
Retail supervisors
Security guards
Casino workers
Drivers
28% Retail supervisors Real estate agents
Customer service reps
Casino workers
Secretaries
Some
College or
Associate
Degree
4% Auto mechanics
Manicurists
Nursing assistants
Hairstylists
Teaching assistants
7% Hairstylists
Auto mechanics
Office clerks
Teaching assistants
HVAC mechanics
10% Office clerks
Nursing assistants
Hairstylists
Paralegals
Auto mechanics
5% Office Clerks
Paralegals
Teaching assistants
Nursing assistants
Bachelor’s
Degree or
Higher
4% Managers
HR workers
Computer specialists
Registered nurses
Writers and authors
9% Managers
Computer specialists
HR workers
Purchasing agents
Wholesale/retail buyers
19% Managers
Registered nurses
Accountants/Auditors
Computer specialists
Teachers
56% Teachers
Registered nurses
Managers
Accountants/Auditors
Lawyers
Percent Underemployed 0% 39% 70% 44%
The results from this analysis of Clark County’s labor force, as shown through Table 6, present
evidence that many of the more educated workers in Clark County are unable to find high-quality
jobs. In other words, there is a mismatch between the skills which many workers bring to the labor
market and the type of jobs which these workers eventually accept. Thus, while unemployment has
fallen and the county has seen an impressive number of jobs created since the Great Recession, the
quality of the labor market remains one of the foremost economic development challenges for Clark
County. Developing the industries, workforce, and institutional environment that create higher-quality
jobs should therefore be one of the key objectives as the county seeks to revive and restructure its
economy.

19
Innovation & Entrepreneurship
Economic diversification has been a priority for Nevada, and more so for Southern Nevada, since the
Great Recession. To drive this diversification, local and state officials have sought to incentivize and
encourage growth in high-skill, high-wage industries. These industries rely on a strong local network
comprised of qualified individuals and organizations that conduct a high level of innovation and
research and development (R&D) activities.
To understand a region’s ability to support innovation-intensive industries and businesses, the
number of individuals with backgrounds in science and engineering (S&E) has been a useful metric.
While the state has made some progress in recent years, Nevada has historically struggled to
produce individuals with these qualifications for S&E-intensive industries (Table 7). Though S&E
occupations have increased their share of the state’s workforce, overall S&E attainment remains
low. The relatively unchanged ranking of Nevada in national league tables since the Great Recession
hints at the existence of barriers for S&E workforce training and development in the state.2
While these data represent Nevada as a whole, the trends can also be observed in Clark County. At
UNLV, the number of awards conferred in S&E and S&E-related fields remains low when compared to
those conferred in the social sciences and business management.3 This trend is generally repeated
at Clark County’s other higher education institutions, such as Nevada State College (NSC) and the
College of Southern Nevada (CSN).
Nevada Continues to Underperform in S&E Fields, Slowing Efforts to Grow the
State’s Innovation Economy
Table 7: Nevada Values and Rankings for Selected Science and Engineering Indicators. Source: National Science Board.
2020. Science and Engineering Indicators 2018, State Indicators (NSC-2018-1). Notes: The Small Business Innovation
Research (SBIR) and Small Business Technology Transfer (STTR) programs are federal programs aimed at increasing small
businesses’ share of U.S. innovation activity in the private sector.
Indicator 2010 Rank 2018
(or most recent year) Rank
S&E Bachelor's Degrees Conferred per
1,000 Individuals 18-24 Years Old 8.50 50 12.78 50
S&E Occupations as a Percentage of All
Occupations 2.41 47 2.43 44
R&D as a Percentage of GDP 0.76 45 0.54
(2017) 50
Business R&D as a Percentage of Private
Industry Output 0.65 37
0.45
(2017) 43
Average Annual SBIR and STTR Funding
per $1 Million GDP
44.39
(2010-2012 avg.) 44
35.17
(2014-2016 avg.) 42
Venture Capital Disbursed per $1 Million
GDP 232.12 38 469.53 36
The low S&E achievement in Nevada’s workforce has downstream impacts on the state’s economy.
At a high level, a disproportionately small S&E workforce limits the ability for the state to diversify
into industries that require individuals with S&E qualifications. Conversely, the absence of a dynamic
portfolio of S&E-intensive industries and firms lessens the attractiveness of the state for those with
S&E qualifications as there are fewer options for employment. Both of these forces have spillover

20
effects; for example, spending on R&D has slid in recent years, with Nevada’s R&D spending as a
percentage of GDP falling between 2010 and 2017, and Nevadan business R&D spending also
falling. At the local level in Clark County, the low R&D performance can be seen in the subdued
spending on research at UNLV (Figure 11 below). Compared to universities in peer metro areas,
UNLV’s research expenditure remains very low, as does its share of federal research funding.
UNLV’s Research Spending Remains Low among Peer Universities
Figure 11: Average Total Research Expenditure and Average Total Federal Research Expenditure, by Selected University,
2010-2018. Source: Association for University Technology Managers (AUTM), Statistics Access for Technology Transfer
(STATT) Database. Note: Data are in U.S. dollars. Data are not available for all universities for all years. University of
Nevada, Las Vegas data are unavailable for the 2010-2015 period. University of Nevada, Reno data are unavailable for
2014. University of Utah data are unavailable for 2016.
As low levels of research funding result in less research and innovation activities, so too does it
hinder a university’s ability to produce intellectual property, such as patents and licenses. Table 8
below provides data on patent and licensing activity at UNLV and its peer universities. Though UNLV
outperforms University of Nevada, Reno (UNR) in the selected metrics, both universities significantly
underperform as compared to their peers.
Patenting and Licensing Activity at UNLV Has Room to Grow
Table 8: Patent and Licensing Activity, by Selected University, Averaged over 2010-2018. Source: Association for University
Technology Managers (AUTM), Statistics Access for Technology (STATT) Database. Note: Universities are ranked in
descending order by Patent Applications. Data are averaged for the years 2010-2018. Data are not available for all
universities for all years. University of Nevada, Las Vegas data are unavailable for the 2010-2015 period. University of
Nevada, Reno data are unavailable for 2014. University of Utah data are unavailable for 2016.
Number of
Licenses
Gross
Licensing
Income
Invention
Disclosures
Patent
Applications
Startups
Formed
University of Colorado, Boulder 39 $8,393,456 219 284 9
University of Arizona 60 $1,935,155 195 99 10
University of New Mexico 14 $2,046,032 118 94 9
University of Utah 65 $37,972,787 207 91 16
Average Total Research Expenditure: $73.39M
Average Total Federal Expenditure: $29.50M
$-
$100,000,000
$200,000,000
$300,000,000
$400,000,000
$500,000,000
$600,000,000
$700,000,000
$800,000,000
Universityof Nevada,Las Vegas
Universityof Nevada,
Reno
Universityof
Colorado,Boulder
Universityof Arizona
Universityof Utah
ColoradoState
University
Universityof NewMexico
Universityof Oregon

21
Number of
Licenses
Gross
Licensing
Income
Invention
Disclosures
Patent
Applications
Startups
Formed
Colorado State University 29 $2,010,717 110 50 5
University of Nevada, Las Vegas 7 $301,966 52 18 2
University of Nevada, Reno 3 $189,465 23 12 1
University of Oregon 166 $8,122,021 34 11 2
The above statistics are not to say that Southern Nevada and UNLV have not made progress in
recent years. Progress has been made on increasing startups’ access to funding, with venture capital
funding more than doubling between 2010 and 2018 (Table 7). The availability of funding remains a
critical component for entrepreneurship and helps to reduce the barriers to entry for young firms.
Continuing to increase funding availability and ensuring these funding opportunities are available to
the diverse range of Clark County entrepreneurs remains highly important for the local innovation
ecosystem.
Environment
Clark County falls within one of the most uniquely beautiful and complex environments in the United
States. The area, known as the Basin and Range province, is characterized by rugged mountain
ranges and wide valleys. In addition, the county is located in the Mojave Desert, which receives less
than six inches of rain per year on average and is susceptible to frequent droughts. Because of these
conditions, land and water conservation issues are central to community and economic development
in the county.
Southern Nevada is home to a variety of outdoor areas that provide residents and visitors alike with
recreation and education opportunities. Red Rock Canyon, Valley of Fire, Mount Charleston, Sloan
Canyon, and Lake Mead are just a few of the special resources of the region.4 Las Vegas provides an
excellent hub for international visitors interested in regional attractions as well, including Death
Valley, the Grand Canyon, and Joshua Tree National Park. Hiking, climbing, shooting, and horseback
riding are all extremely popular activities in the area.
Within Clark County, Lake Mead National Recreation Area welcomed 7.5 million visitors to the park
in 2019, who spent an estimated $336 million dollars in local gateway regions, supporting a total of
3,980 jobs5. In March-April 2020, as much of the state was shutting down due to the COVID-19
public health emergency, the Bureau of Land Management (BLM) and the Las Vegas Metropolitan
Police Department saw a 400% increase in visitors to BLM and other public lands such as Red Rock
National Conservation area, despite “Stay at Home” orders.6 The increase in visitors has caused
strain on the infrastructure and the abilities of the federal land managers to tamp down on illegal
activities.

22
Clark County, in cooperation with the Southern Nevada Regional Planning Coalition and municipal
government agencies, has built around 74 miles of multi-use trails, 34 miles of equestrian trails, 10
pedestrian bridges, and 15 trailheads and waysides.7 These amenities connect residents and visitors
to parks, schools, workplaces, and natural areas while reducing traffic and improving air quality.
The Southern Nevada Health District currently hosts a trail finder tool called “Neon to Nature” which
includes an interactive map of the trails and outdoor amenities in the county. Trails have become
extremely popular throughout the county as socially distant activities have become essential. Several
trails are in the works, including the Vegas Valley Rim Trail which would connect disparate trails
around the Valley into one large loop.
The Bureau of Land Management administers much of the land in the county (see Figure 19 in
Appendix C). The Southern Nevada Public Land Management Act (SNPLMA) allows the BLM to sell
public lands within a set disposal boundary. Revenue from these sales go to the Nevada General
Education Fund, the Southern Nevada Water Authority, and the Secretary of Interior’s special
account for various conservation and capital improvement programs.8 As a result, most of the
municipalities are “landlocked”—surrounded by lands they cannot develop. With input from various
stakeholder groups, Clark County proposed the Southern Nevada Economic Development and
Conservation Act (also known as the Lands Bill) in 2018. This bill would expand lands available for
the county to dispose of for development. These include lands which stretch south along I-15 and in
areas surrounding Henderson. Early in 2020, Nevada State Senator Cortez Masto released a
discussion draft of the bill that maps out an additional 308,110 acres of public land to be protected
as wilderness and expands the border Red Rock Canyon National Conservation Area by 69,201
acres.
Southern Nevada is home to a variety of delicate ecosystems. The county itself administers the
Desert Conservation Program and the Multiple Species Habitat Conservation Plan (MSHCP), which
streamlines the process for developers to comply with the Endangered Species Act. The Plan expires
in 2031 or when 145,000 acres have been disturbed. Some funds from the sale of public lands
under SNPLA goes towards funding the MSHCP.
In addition to habitat conservation, water conservation is highly important to the continued
development of the county. 90% of the drinking water supply is sourced from the Colorado River,
NEVADA OUTDOOR RECREATION ECONOMY 2017
• 15 million visitors to national and state
parks
• $12.6 billion in consumer spending
• 87,000 direct jobs
• $1.1 billion in state and local tax revenue
57% Of Nevadans participate
in outdoor activities

23
diverted at Lake Mead. Outlying rural communities in the county rely almost entirely on groundwater
resources pumped from the aquifer, which accounts for the other 10%. Clark County lies within a
region that is most at risk from the effects of climate change, including rising temperatures and
decreased precipitation. While susceptible to droughts, the county is also prone to flash flooding
events. Continued access to dwindling water resources is a pressing question for the entire
Southwest, especially those areas that rely on the Colorado River and Lake Mead for their drinking
water (see Figure 12).
Lake Mead Water Levels Have Fallen over Time
Figure 12: Average Water Levels in Lake Mead Reservoir (in feet), 2000-2020. Source: U.S. Bureau of Reclamation.
The Southern Nevada Water Authority (SNWA) is a regional water authority made up of seven local
water and wastewater agencies. SNWA is responsible for water treatment and delivery to individual
water providers, as well as the acquisition and management of water resources in Southern Nevada.
SNWA has implemented an innovative approach to water conservation, promoting “return-flow
credits” where member agencies treat and return wastewater to Lake Mead to obtain water credits9.
Various water conservation programs—such as the Smart Water Landscape Rebate—have allowed
the county to reduce water usage despite population growth (see Figure 13). Since 2015, SNWA has
produced annual long-term planning scenarios as part of its 50-year water resource plan. These
scenarios consider climate change, drought, and other impacts to project future supply and demand
needs under various economic and population growth conditions. The SNWA’s successes serve as a
point of pride for the county, and further innovation around water and landscape conservation could
set a precedent for the region.
Several regional water authorities, including SNWA, have leveraged their connections with private
industry and the University of Nevada Desert Research Institute to create WaterStart. This incubator
brings together the expertise and infrastructure of various organizations to provide innovative water
services to water management agencies, policy makers, and tech companies to stimulate economic
growth in the water sector.
2000: 1,204
2004: 1,131 ft.
2008: 1,109 ft.2012: 1,121 ft.
2016: 1,077 ft.2020: 1,095 ft.
1,060
1,080
1,100
1,120
1,140
1,160
1,180
1,200
1,220
2000 2002 2004 2006 2008 2010 2012 2014 2016 2018 2020

24
Clark County Water Use Has Decreased over Time despite Increasing Population
Figure 13: Water Use in Gallons Per Capita Per Day Compared to Population Growth, 2000-2018. Source: Southern Nevada
Water Authority; U.S. Census Bureau.
While Southern Nevada has excelled in water conservation, it has also worked hard to provide
residents and visitors with improved air quality. Carbon monoxide has declined 84% since 1982,
ozone has been reduced by 12% since 2007, and particulate matter (<2.5µm) has been cut in half
since 2001. Type and amounts of pollutants, weather, and local topography all combine to affect air
quality in the county. The Las Vegas Valley is surrounded by mountains that rise thousands of feet
over the valley floor. These trap stagnant air and make quality control a complex task. Not only that,
but the county is vulnerable to outside events—such as wildfires in California and elsewhere—that
can diminish the quality of air.
Infrastructure & Energy
The most densely populated area of the county is the Las Vegas Valley—home to the cities of Las
Vegas, North Las Vegas, Henderson, and a large section of unincorporated Clark County that
includes the McCarran International Airport and the Las Vegas Strip. The valley presents a
challenging area for growth, as it is ringed by environmentally sensitive, federally owned lands
managed by the Bureau of Land Management, the State of Nevada, and the U.S. Military. Outside of
the valley, incorporated and unincorporated micropolitan areas include Mesquite, Boulder City, and
Laughlin.
0
0.5
1
1.5
2
2.5
100
120
140
160
180
200
Cla
rk C
ounty
Popula
tion
(mill
ions)
Gallo
ns p
er
capita p
er
day
(GP
CD
)

25
Driving Alone Continues to Be the Preferred Method of Transportation among
Clark County Workers
Figure 14: Worker Commuting Patterns, by MSA, 2018. Source: 2018 American Community Survey 1-Year Estimates.
Clark County is heavily reliant on cars, with 90% of Clark County residents reporting that they drive to
work with an average travel time of 25 minutes10 (see Figure 14). While the condition of roads in the
county is overall fair to good, greater connectivity is needed to support a growing and diversifying
population.9 Much of the land within the Las Vegas Valley has been developed as single family
residential, with commercial and mixed use corridors running along major roads such as U.S. 95 and
I-15.11 The reliance on cars and single-family homes leads to urban sprawl that pushes against the
borders of federally managed lands that ring the valley.
In recent years, there has been elevated interest in mixed-use and transit-oriented developments
within the county, including the Maryland Parkway TOD and the Reimagine Boulder Highway Project.
To serve the growing and diverse population, continued engagement with these projects is essential.
The Regional Transportation Commission (RTC), in collaboration with Clark County and its cities,
develops region-wide transportation plans for Southern Nevada. The most recent draft plan was
released in November 2019 and sets out goals for the next 10 years to tackle issues of connectivity
and sprawl.
Clark County is home to a system of airports, of which McCarran International Airport is the
largest and primary commercial airport for the region. The other airports are reliever and general
aviation airports, which include the Henderson Executive Airport, Jean Aviation Sport, North Las
Vegas Airport, Mesquite Airport, and Overton Perkins Field. Located in unincorporated Clark County,
McCarran International Airport saw 51.5 million total passengers in 2019 and over half of these
were deplaned.12 These numbers suggest that McCarran is an important hub for domestic and
international travelers moving through the airport, as well as a major entry point for travelers to
attractions within Clark County.
Since McCarran opened in 1948, the airport has been expanded several times to accommodate
increasing passenger volume. The most recent expansion was completed in 2012, when Terminal 3
0% 10% 20% 30% 40% 50% 60% 70% 80% 90% 100%
Urban Honolulu, HI
Portland-Vancouver-Hillsboro, OR-WA
Salt Lake City, UT
Denver-Aurora-Lakewood, CO
Phoenix-Mesa-Scottsdale, AZ
Sacramento-Roseville-Arden-Arcade, CA
Austin-Round Rock, TX
Colorado Springs, CO
Reno, NV
Albuquerque, NM
Las Vegas-Henderson-Paradise, NV
Orlando-Kissimmee-Sanford, FL
Drove Alone Carpooled Public Transportation Walked Worked at Home Other
26
was built to accommodate the rapid growth in domestic and international flights to Las Vegas.13
Further modernization projects were completed in 2018. Due to its proximity to urban development,
McCarran is constrained by both geographical and airspace limitations. The airport cannot be
expanded any further and therefore would not be able to meet future air traffic demands. To meet
these future needs, a site for a supplemental commercial airport was identified in 2000
approximately 30 miles south of Las Vegas. The Southern Nevada Supplemental Airport (formerly
known as Ivanpah) is proposed to be constructed in the Ivanpah Valley between the cities of Primm
and Jean.14
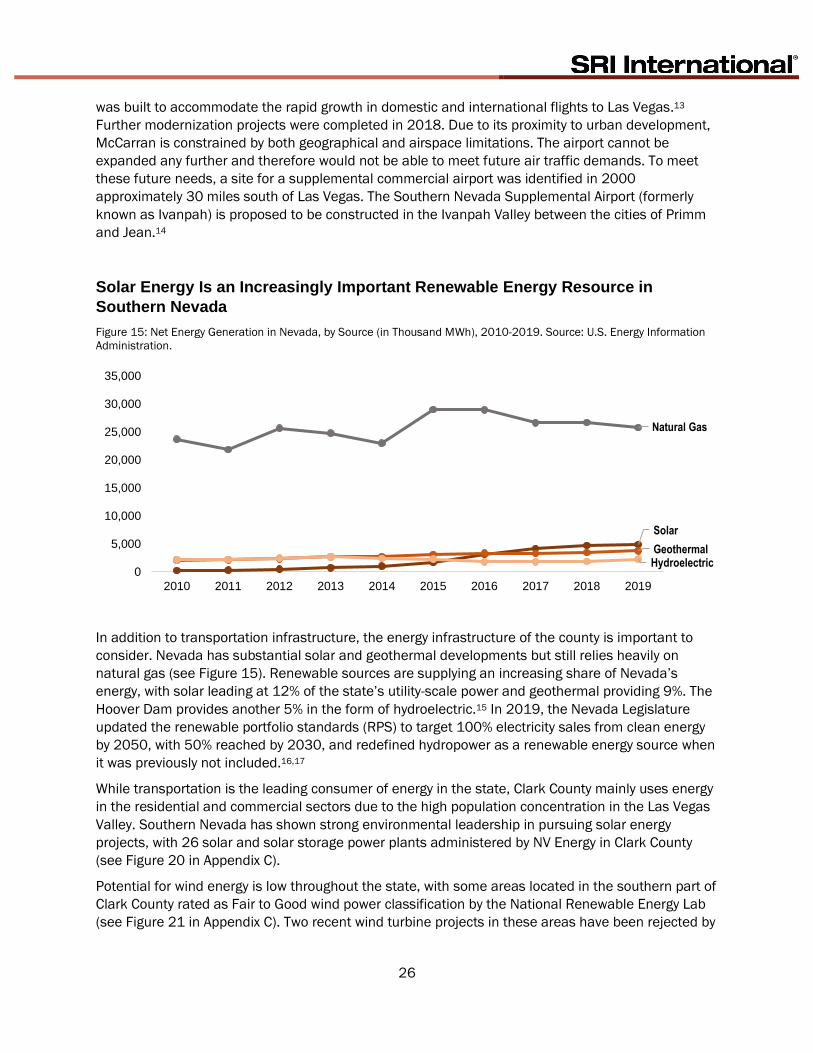
Solar Energy Is an Increasingly Important Renewable Energy Resource in
Southern Nevada
Figure 15: Net Energy Generation in Nevada, by Source (in Thousand MWh), 2010-2019. Source: U.S. Energy Information
Administration.
In addition to transportation infrastructure, the energy infrastructure of the county is important to
consider. Nevada has substantial solar and geothermal developments but still relies heavily on
natural gas (see Figure 15). Renewable sources are supplying an increasing share of Nevada’s
energy, with solar leading at 12% of the state’s utility-scale power and geothermal providing 9%. The
Hoover Dam provides another 5% in the form of hydroelectric.15 In 2019, the Nevada Legislature
updated the renewable portfolio standards (RPS) to target 100% electricity sales from clean energy
by 2050, with 50% reached by 2030, and redefined hydropower as a renewable energy source when
it was previously not included.16,17
While transportation is the leading consumer of energy in the state, Clark County mainly uses energy
in the residential and commercial sectors due to the high population concentration in the Las Vegas
Valley. Southern Nevada has shown strong environmental leadership in pursuing solar energy
projects, with 26 solar and solar storage power plants administered by NV Energy in Clark County
(see Figure 20 in Appendix C).
Potential for wind energy is low throughout the state, with some areas located in the southern part of
Clark County rated as Fair to Good wind power classification by the National Renewable Energy Lab
(see Figure 21 in Appendix C). Two recent wind turbine projects in these areas have been rejected by
Natural Gas
Solar
GeothermalHydroelectric
0
5,000
10,000
15,000
20,000
25,000
30,000
35,000
2010 2011 2012 2013 2014 2015 2016 2017 2018 2019

27
the Bureau of Land Management and opposed by local environmental groups and Native American
tribes.
In conjunction with the push for sustainable energy sources, several “smart city” projects have
emerged to modernize technology utilization throughout the county. In 2017, the City of Las Vegas
partnered with Cisco, RTT, and Dell to begin a smart city project to implement smart technologies in
traffic, water, transit, waste management, security, and parking.18 The ultimate goal of these projects
is to improve quality of life for residents and enhance the experience of visitors to Las Vegas. The
Innovation District, located in downtown, will operate as a proving ground for cutting-edge
technologies such as the internet of things—which would connect parking sensors, traffic signals,
bike-share stations, and emergency response vehicles.

28
Asset Map Mapping the Future
An Analysis of Clark County’s
Communities and Economy
Photo Courtesy of UnknownNet Photography/Flickr.
29
Asset Map
While the Economic & Community Assessment examined Clark County’s performance on a number
of topics, the asset map intends to synthesize the information received from county stakeholders
through interviews and, where necessary, use data to elaborate on stakeholder input. This section
will discuss the various policies, programs, and initiatives that have taken place in Southern Nevada
over the last several years and identify important resources that are at the county’s disposal. The
major topics to be discussed are:
• Economy
• Business & Regulatory Climate
• Training, Education, & Workforce Development
• Innovation & Entrepreneurship
• Infrastructure
• Community & Recreational Assets
• Environment & Natural Resources
Economy
Industrial Diversification
Over the last decade, Southern Nevada has made great strides in establishing and growing new
industries (e.g., health services and logistics). This diversification is intended to lessen Southern
Nevada’s dependence upon the leisure and hospitality industry, and related sub-industries, while
creating new opportunities for individuals from a variety of economic and educational backgrounds.
However, it is important to understand that the journey to diversification is measured in years, not
months. Southern Nevada’s progress is notable, but its continued reliance on traditional
powerhouses remains evident.
While the Great Recession signaled to state and local leaders that diversification was necessary, the
economic impact of the COVID-19 pandemic has reignited debates about Southern Nevada’s
economy and the success of diversification efforts thus far. The rise of unemployment to heights not
seen since the Great Depression has placed renewed focus on Clark County’s diversification
strategy.
The last decade has brought an increased level of coordination between state economic
development leaders and local governments and agencies, as seen through the strong relationship
between GOED and the Las Vegas Global Economic Alliance (LVGEA). This coordination has been an
invaluable asset to the region, as it has allowed Southern Nevada to make use of state programs
and incentives, including Office of Workforce Innovation (OWINN) funds and various tax abatements,
that have enabled greater diversification. Likewise, new programs aimed at entrepreneurship and
innovation have allowed for a greater variety of Southern Nevadans to contribute to the
diversification of the regional economy.
There do remain opportunities for fine-tuning the region’s approach to diversification. Concerns have
been raised about the quality of jobs that have been brought to Southern Nevada through
diversification efforts. While these jobs are created in industries that are new or emerging in
Southern Nevada, the wages and skill levels associated with these jobs remain comparatively low.

30
This has led some to question the efficacy of the current business recruitment tools employed in
Southern Nevada.
Attraction & Retention of a Skilled Workforce
As discussed in the Economic & Community Assessment, Southern Nevada’s population has grown
significantly. While this growth has been most pronounced for those aged 65 and older, the region
has also experienced notable growth in working-age populations, namely those aged 25 to 44 and
45 to 64 (Figure 3). The growth in working-age populations has also been met with an increase in the
overall education levels of the region’s labor market, with the number of college graduates has
increased by over 18% (Figure 10). A dynamic, qualified workforce is a necessity for Clark County’s
economy, particularly as it looks to shift away from a historical reliance on gaming, tourism, and
hospitality.
Despite Southern Nevada’s push for diversification, the leisure and hospitality industry does remain
a significant pull factor for much of the county’s employment and is thus an asset for attracting
talent to the region. While employment in this industry is more often lower-skill and lower-wage, the
leisure and hospitality industry has begun to attract more high-tech supporting sectors, such as
game design, that offer higher paying jobs. Partnerships between the region’s higher education
institutions and industry—such as Black Fire Innovation,19 a collaboration between UNLV and
Caesars Entertainment aimed at innovations in gaming, hospitality, and entertainment—represent an
opportunity for Southern Nevada to use its dominant industry as a foundation for growth in related,
yet independent, high-skill high-wage sectors and industries.
Nevertheless, for Southern Nevada’s other industries not related to leisure and hospitality, a skilled,
qualified workforce remains a formidable obstacle. Though education levels have generally
increased among the workforce, many employers in higher-skill, higher-wage industries have
difficulty finding qualified workers. Industries that are dependent upon this form of skilled worker—
that is, those with a bachelor’s degree and above—find it difficult to grow organically in the region.
This has led to two trends in Southern Nevada: employers are either required to import qualified
workers from other regions of the United States, or residents must move out of the county to find
meaningful work.
Business & Regulatory Climate
As with the Nevada state government, Clark County is known as a business-friendly region. Despite
some of the constraints the region faces, notably the vast BLM land ownership, local government
agencies are known to work together to bring new opportunities to Southern Nevada. Though the
COVID-19 pandemic has reshaped how government agencies interact with individuals and
businesses, the Clark County permitting and licensing departments have successfully moved their
operations online and continue to provide essential services to Clark County businesses.
Though Clark County has continued to perform strongly while enabling business growth and
development, there are areas where collaboration could be greater. Clark County is comprised of
several municipalities, ranging from highly urbanized to very rural. The diversity of these
municipalities means that Clark County has something to offer everyone. Those who want to enjoy
nightlife may take up residence in the county’s core, while those who are interested in a slower-
paced experience may settle in one of the region’s smaller communities. However, this diversity
among locales has also led to the development of several distinct identities within the county, each
with its own interest in attracting businesses and workers to its own jurisdiction. This makes

31
business attraction and retention a challenge, as municipalities within Clark County may feel more
compelled to compete with one another for new business, rather than perceiving business growth
and expansion as an overall win for the county.
Competition among local governments is not an inherent weakness in the county. However, pursuing
a coordinated approach between city governments and the county government, as well as other
economic development actors such as LVGEA, may help to unify the vision for Clark County as an
attractive place to live and do business. Strengthening the ties between municipalities, as well as
integrating business services and offerings when possible, may better enable the region to attract
new businesses.
Training, Education, & Workforce Development
Higher Education and Post-Secondary Training
The presence of an adaptable higher education system that works with K-12 schools and industry
partners to develop home-grown talent is crucial. While recruitment efforts by state, county, and city
officials seek to bring businesses to Clark County, if a qualified ready-to-work labor force is not
already in place, the county will continue to struggle to attract new and diverse businesses.
Clark County has made significant progress in this regard over the last decade. Notably, the
University of Nevada Las Vegas (UNLV) attained R1 status, placing it among the nation’s most active
research universities. As Southern Nevada’s flagship higher education institution, UNLV’s
designation as an R1 university is a critical step in enabling diversified growth in Clark County. As the
university produces more research and graduates in a variety of domains, businesses will take
notice.
UNLV is not Clark County’s only higher education asset, nor is it the only four-year degree-granting
institution. Founded in the early 2000s, Nevada State College (NSC) has seen its enrollment nearly
double since 2009, reaching almost 5,000 fall enrollments in 2018. NSC plays a vital role in
Southern Nevada’s healthcare workforce pipeline; of the 567 degrees conferred in 2018, about 45%
were in health professions and related programs.20 Since 2009, health professions and related
programs have been the most popular degree earned by NSC graduates. These programs remain
important to Clark County’s healthcare industry and provide a dedicated pipeline to the region’s
healthcare employers, which have historically suffered from an undersupply of qualified workers.
Touro University, a private university dedicated to the training of healthcare professionals in
Southern Nevada, also serves a critical role in the development of Clark County’s healthcare
workforce.
In addition to four-year degree-granting universities, Clark County is served by the College of
Southern Nevada (CSN), the region’s primary two-year degree-granting public college. CSN has
experienced steady enrollment since 2009, though total enrollment has declined by about 12%
between 2009 and 2018. A majority of the degrees conferred at CSN are in liberal arts and sciences
and business management though health professions, science technologies, and technicians also
account for a sizeable portion of the degrees earned.21
K-12 Education
Clark County School District (CCSD) is the fifth largest public-school district in the United States. In
addition to its size, CCSD has many unique characteristics that present opportunities and challenges
for the district and Southern Nevada. Student enrollment at CCSD schools accounts for 75% of

32
Nevada’s total K-12 student enrollment. Of the students attending CCSD schools, 75% come from a
minority or multiracial background, with Hispanic/Latinx students accounting for the single largest
student group, representing over 46% of the CCSD student body.
As the county’s only public K-12 education system, CCSD is an invaluable asset for county residents
and businesses, with many notable achievements in advancing student progress over the last
several years. For example, the graduation rate surpassed 85% for the 2018-19 academic year, a
significant increase from the sub-60% graduation rate for the 2010-11 academic year.22 Overall,
however, the district may be considered “spotty,” with pockets of high achievement scattered
throughout the county, but specific shortcomings that undermine the district’s standing. The average
ACT composite score for CCSD students (17.54) remains below the state average (17.66) as well as
the national average (20.7).23 Additionally, CCSD’s scores on the English Language Arts/Literacy
(ELA) and Mathematics Common Core State Standards tests remain below state and national
thresholds.24 Underperformance on standardized testing follows students to post-secondary
education and may prevent them from moving on to two- or four-year higher education institutions.
Remediation rates for CCSD graduates —that is, the rate of students who require additional
education or training before enrolling in college-level courses—remain high at the state’s higher
education institutions (CSN: 67%; UNLV: 36%; UNR: 40%).25
CCSD leadership has actively sought to increase the performance of the region’s public schools to
better prepare students to enter either the workforce or post-secondary education. Most recently, the
CCSD Board of School Trustees approved Focus: 2024, the district’s five-year strategic plan aimed at
increasing student success through a variety of supplementary initiatives. At the learner level, the
plan intends to increase student achievement in ELA and Mathematics Common Core State
Standards testing and decrease achievement gaps between the district’s different ethnicities.
District leadership has also made educator efficacy a priority, aiming for 100% of CCSD classrooms
to be served by licensed teachers by 2024. In 2019 CCSD partnered with the Clark County Education
Association (CCEA) to develop a program to recruit and retain high-quality teachers. Using incentives,
the program aims to reduce teacher turnover at underperforming middle schools throughout CCSD.26
Other priorities include aligning the governance and leadership of the district with the needs of the
community, ensuring district funding works to achieve equity among all students, and working with
parents and the community to provide support to students from all backgrounds.27
An important component of CCSD’s recent work to improve student outcomes is to minimize the
achievement gap that exists between the district’s high- and low-performers. The achievement gap is
most apparent when assessing enrollment in higher education based upon ethnicity and geography.
For example, in the CCSD class of 2018, students from white and Asian backgrounds were
significantly more likely to enroll in higher education, where other ethnicities saw higher education
enrollment rates between 39% and 45%. Higher education enrollment was also slightly more
pronounced in the region’s wealthier neighborhoods, including Summerlin and Henderson, than in
working class neighborhoods in North Las Vegas and more rural areas of the Vegas Valley.28
Currently, CCSD’s high-performing magnet and career and technical academies (CTAs) face an
overrepresentation of certain population groups, notably white and Asian students, and an
underrepresentation of others, particularly Black students, compared to these groups’ portion of
overall district enrollment.29 One way CCSD has sought to close the achievement gap is by lowering
the requirements for students of varying backgrounds to enroll in the district’s high-performing
magnet schools and CTAs. Whereas in the past students were required to meet certain academic
standards before admission to one of these programs, many programs have since shifted to
admission based on interest and program availability, rather than academic achievement.30 While

33
certain programs will remain selective based upon academic credentials, particularly STEM
programs, many of those geared toward vocational training and education—such as construction
technology, health information management, and mechanical technology—have been made available
to those with an expressed interest.31
Students at magnet schools and CTAs have access to several unique programs, including FutuReady,
a partnership between CCSD and LVGEA that helps connect students at these schools with
internship opportunities at Clark County businesses.32 An important component of these internship
programs is demonstrating to students the career pathways that are possible with or without a four-
year degree. Outside of the magnet schools and CTAs, CCSD entered into an agreement with the
Nevada System for Higher Education (NSHE) to develop a strategic partnership for college and
career readiness.33 Focusing on the district’s high schools, the CCSD–NSHE program aims to
increase collaboration between CCSD, NSHE, and workforce development institutions in Southern
Nevada, with the intention of increasing student participation in dual-enrollment courses and other
workforce development opportunities. Programs such as these will continue to be important for Clark
County as local governments pursue economic diversification in the medium and long term.
Innovation & Entrepreneurship
In its efforts to diversify the regional economy, Clark County and its municipal counterparts have
actively sought to attract and retain firms and industries that conduct a high level of innovation
activities. The data generally support this transition: Clark County has seen growth in non-traditional
occupations in the regional economy tied to innovation, like computer systems design (+57%),
software publishers (+176%), architectural and structural metals manufacturing (+119%), and
management, scientific, and technical consulting services (+78%).
Though Nevada and Southern Nevada have been slow to improve on many innovation metrics, state
and local leaders, as well as business leaders, have been adept at putting in place the requisite
components for an innovation ecosystem to emerge. As discussed in the Economic & Community
Assessment, Nevada’s venture funding has increased significantly in recent years. While the state-
administered Battle Borne Venture Fund has made a number of investments in Southern Nevadan
enterprises, UNLV’s Rebel Venture Fund (RVF) focuses on locally-grown businesses. A unique
component of the RVF is its student-led leadership, which helps Southern Nevada to develop home-
grown venture capitalists who, ideally, stay within the region and fill a gap in investor knowledge. RVF
student leadership works closely with local venture and angel investors, increasing their knowledge
of the venture funding process.34
As the region’s preeminent higher education institution, much of Clark County’s innovation strength
comes from UNLV. In addition to UNLV’s recent recognition as an R1 university, the UNLV Troesh
Center for Entrepreneurship and Innovation plays a pivotal role in the region’s small business
development efforts, providing degreed and non-degreed training to the region’s entrepreneurs.35
The Troesh Center is also a participant in the National Science Foundation’s I-Corps program,
receiving a three-year $255,000 grant to incubate 15-25 projects a year. I-Corps teams receive
hands-on mentorship in addition to up to $3,000 in seed funding, with the opportunity to receive
additional follow-on funding (between $5,000 and $150,000) based upon the team’s
performance.36 These UNLV programs are pivotal for developing local talent in the innovation
ecosystem, a resource Southern Nevada has historically lacked.

34
The Lee Prize for Innovation and Entrepreneurship, in part administered by UNLV’s Lee Business
School, challenges innovators to explore unique solutions to the impact of the COVID-19 pandemic
on tourism-dependent economies.37 UNLV is also home to the Nevada Institute for Autonomous
Systems (NIAS), which is one of six sites designated by the Federal Aviation Administration (FAA) to
test unmanned aerial systems (UAS) technologies.38 The NIAS is a critical component of Southern
Nevada’s emerging UAS industry and provides assistance to UAS companies looking to operate in
Nevada.
Local governments and businesses have also worked to grow Southern Nevada’s innovation
capabilities. The City of Las Vegas established the International Innovation Center @ Vegas (IIC@V) to
develop new and emerging technologies that can be used for public purposes, such as the internet
of things (IoT) and water sciences.39 Switch’s Innovation Center provides entrepreneurial Southern
Nevadans with a collaborative workspace to make connections with regional business leaders while
“co-locating” in an enabling space.40
Infrastructure
Broadband
Clark County’s digital connectivity remains a significant asset for the county. According to the Federal
Communications Commission (FCC), high speed internet refers to those connections with a minimum
download speed of 25 megabits per second (Mbps) and a minimum upload speed of 3Mbps.41 Using
this standard, virtually all of Clark County is covered by high speed internet connectivity with service
from at least two providers. However, on average the county’s rural residents are provided fewer
choices for high speed connectivity; while nearly 98% of urban Clark County residents have varied
choices for high speed connectivity, less than 44% of the county’s rural residents have at least three
choices for connectivity.42 This lack of choice in rural areas is compounded by less reliable mobile
phone coverage. Many users rely on mobile devices for their connectivity.
While the availability of high-speed internet to county residents is important, differences in
subscription patterns among socioeconomic groups are overlooked by these data. Considering
different income groups, it becomes apparent that internet subscription behavior among Clark
County households varies by income level. For example, while over 94% of Clark County households
making more than $75,000 a year have a broadband internet subscription, only 65% of those
making less than $20,000 a year have a similar subscription. More concerning, though, is the
number of low earners who have no internet subscription: nearly 35% of those making less than
$20,000 a year and 15% of those making more than $20,000 but less than $75,000 have no
service. These two groups account for over 60% of Clark County households, and a lack of
connectivity limits their ability to engage with critical county resources, as well as access
opportunities for personal and professional development.43
Transportation
Clark County’s central location means that it has easy automobile access to 11 western states and
nearly 53 million people. Clark County is easily accessible by car, with Las Vegas, Henderson, and
North Las Vegas ranked as having some of the best traffic conditions and road infrastructure among
U.S. cities.44 Due to these factors, the county is heavily reliant on cars. However, residents of the
county are also aware of environmental issues that follow heavy car use and have been quick to
adopt electric vehicles to combat pollution. In 2017, Las Vegas saw the highest growth in sales of
electric vehicles (EV) in the United States and 2,200 EV were registered in Clark County alone.45 The

35
state has been strongly supportive and subsidized EV charging stations along U.S. Route 95 to
create an “Electric Highway” from Reno to Las Vegas, with plans to expand the program regionally to
Arizona. Nevada also recently launched new incentives as part of Nevada Energy’s (NVE) Electric
Vehicle Infrastructure Demonstration (EVID) program to accelerate the adoption of EV and charging
stations across the state.46
In addition to local and regional transportation, McCarran International Airport serves as an
important hub for domestic and international visitors who visit for gaming, conferences, and outdoor
recreation. The number of passengers stopping at the airport has increased over the last several
years, only dropping off due to the COVID-19 pandemic (see Figure 16). With easy access to
entertainment and hospitality on the Strip, McCarran has non-stop international service to many
countries as well as to all major economic and population centers throughout the United States.
McCarran International Airport Passengers Increased until COVID-19
Figure 16: Deplaned Passengers at McCarran International Airport, January 2017 through May 2020 (in millions). Source:
Clark County Department of Aviation Statistics.
Since 2000, the location for a supplemental commercial airport has been preserved to address the
increasing number of passengers at McCarran International Airport and meet future air traffic
demands. Located east of I-15 between Primm and Jean, approximately 30 miles south of Las
Vegas, the Southern Nevada Supplemental Airport would connect with McCarran International Airport
as well as other areas within the region. In fall 2018, the project planning for the Southern Nevada
Supplemental Airport environmental impact statement resumed.47
Southern Nevada has explored and embraced innovative solutions to the region’s ground
transportation challenges. Planned projects include Bus Rapid Transit (BRT) and the Maryland
Parkway Transit-Oriented Development (TOD), which would create a dense, mixed-use area that
would promote economic diversity and competitiveness while reducing traffic. Plans to expand
transit services to maximize access to jobs and housing would partner with companies like Uber and
Lyft. The Boring Company completed the second of two tunnels underneath the Las Vegas
Convention Center in May 2020, entering the next phase of the development of the underground
people-mover billed as the Convention Center Loop.48 Though the early phases of the loop will be
2017
2018
2019
2020
0.00
0.50
1.00
1.50
2.00
2.50

36
human-operated, the system will move toward full automation with the capacity to move 4,400
convention-goers an hour, with the potential to expand services throughout downtown Las Vegas
and, eventually, into surrounding suburbs.49
Other alternative transportation options available in Southern Nevada include buses, bicycles, and a
Las Vegas Monorail. In 2017, the bus system in Clark County served more than 64 million
passengers, with around 19% of those representing visitors to the resort corridor.50 During the early
months of the COVID-19 pandemic, visits to transit stations in Nevada dropped by 50–60%51 while
ridership on RTC shared bicycles nearly doubled.52
Regional rail networks are often discussed, with past plans including the California-Nevada Interstate
Maglev, the Tesla/SpaceX Hyperloop, and expansion of the existing Amtrak rail lines, although all
have been abandoned. The most recent project, XpressWest by Brightline, plans to begin
construction in 2020 on a high-speed rail line running non-stop between Victorville, California and
Las Vegas partially along I-15.53
Outside of the Las Vegas Valley, the opportunity exists to create an industrial transportation hub
known as an inland port. Inland ports are defined as hubs that act as internal distribution networks
within a nation.54 They have infrastructure to support shipping, usually in the form of rail, truck, and
air, as well as facilities that can handle and sort large volumes of freight. An inland port can attract
industry to an area by lowering the cost of shipping freight to the transfer point where it will be
shipped either nationally or internationally. A report on the viability of an inland port in Southern
Nevada was produced in 2012, and the Nevada Department of Transportation further discussed
opportunities in their 2016 statewide freight plan. Sites near Laughlin and the Ivanpah Valley were
strongly considered, in addition to areas within the Las Vegas Valley near Henderson and North Las
Vegas. While Southern Nevada has long been a strong importer, an inland port could expand
industry in the region and bolster access to West Coast markets in Southern California.
Community & Recreational Assets
Housing
Clark County’s housing market was among the country’s most depressed following the Great
Recession. By September 2011, the median sale price for a home in the Las Vegas metro area had
fallen to $105,000, and by March 2012 the median home value bottomed out at $128,100. Las
Vegas also led the nation in foreclosures. However, the high level of growth in Clark County’s
population, fueled by an impressive economic recovery and expansion, has driven an increase in
home values and sale prices. According to Zillow’s estimates for home values in the Las Vegas-
Henderson-Paradise metro area, the median home value reached $295,500 in March 2020, a 97%
increase since March 2012, and the median sale price reached $291,200, a 130% increase since
September 2011.55 Despite this increase, Clark County’s relative affordability remains a significant
asset for the region as it continues to grow.
To enable continued population growth in the Las Vegas metro area, new residential housing will be
necessary. Southern Nevada has seen consistent growth in the number of new housing units
authorized for development over the last several years, with the number of authorized developments
increasing by more than 38% between 2014 and 2019 (Figure 17 below). Most of these units were
single-family homes (one-unit homes), which have represented about 71% of the annual authorized
housing units per year since 2014. Multi-family homes (two or more-unit homes), however, have

37
experienced less consistent growth. Between 2014 and 2019, these properties accounted for about
29% of annual authorized housing units in Southern Nevada.56
Single Family Homes Continue to Be the Top Choice for Residential Construction
in Clark County
Figure 17: New Privately Owned Housing Units Authorized in the Las Vegas-Henderson-Paradise Metropolitan Statistical
Area, 2014-2019. Source: U.S. Census Bureau, Building Permits Survey. Note: The data for “2 or More Units” represent the
sums of authorized housing units for 2-unit, 3- and 4-unit, and 5 or more-unit properties.
Given the continued dominance of single-family housing in Southern Nevada, understanding the
affordability of these builds is necessary to determine how the local housing market meets the needs
of Southern Nevada’s various socioeconomic groups. The housing affordability index (HAI) uses local
income and home price data to determine if the typical household in a given real estate market
earns enough income to afford the typically priced home in that market. Among its peers, the Las
Vegas metro area is comparatively affordable, with most households able to afford a home in the
metro area. This affordability is a considerable asset for the region, especially when compared to the
high costs of its coastal neighbors. Note, though, that Las Vegas’ affordability has decreased in
recent years, indicating that the average income and average home price in the region are beginning
to diverge.57
Housing Remains Comparatively Affordable in Clark County, Though Trends
Suggest an Increase in Cost
Table 9: Housing Affordability Index, by Selected Metro Area, 2018. Source: National Association of Realtors (NAR).
2018 Percent Change
2017-2018 Rank
Albuquerque, NM 162.4 -9.3 1
Austin-Round Rock, TX 152.6 -9.2 2
Phoenix-Mesa-Scottsdale, AZ 141.2 -12.1 3
Salt Lake City, UT 129.3 -10.4 4
Colorado Springs, CO 128.1 -13.3 5
1 Unit
2 or More Units
Total
0
2,000
4,000
6,000
8,000
10,000
12,000
14,000
16,000
2014 2015 2016 2017 2018 2019

38
2018 Percent Change
2017-2018 Rank
Orlando-Kissimmee-Sanford, FL 124.1 -12.4 6
Las Vegas-Henderson-Paradise, NV 120.0 -14.6 7
Sacramento—Roseville—Arden-Arcade, CA 116.2 -10.5 8
Portland-Vancouver-Hillsboro, OR-WA 114.0 -7.3 9
Denver-Aurora-Lakewood, CO 109.2 -11.1 10
Reno, NV 101.6 -13.5 11
Urban Honolulu, HI 61.9 -9.4 12
The declining affordability of property in Southern Nevada can be seen in the average pricing for new
and existing single-family homes in the area. The Housing Data and Index Project (HDIP), a joint
initiative of UNLV’s Lied Center for Real Estate and the State of Nevada’s Department of Business
and Industry, tracks monthly housing trends in Southern Nevada. According to data collected by the
HDIP, the average sale price for a newly built single-family home in Clark County in April 2014 was
under $300,000; however, by April 2020, that price had increased to over $575,000, an increase of
nearly 95% in six years.58 Existing single family homes have also seen their prices soar in recent
years. Whereas in April 2014 the average existing home would have sold for under $200,000, in
April 2020 that price had increased to more than $370,000, an increase of nearly 89%.59 Given that
single family homes account for the vast majority of housing stock in Southern Nevada, an increase
in price that outpaces income growth will eventually result in a glut of high-priced housing that is
unattainable for many county residents.
Health
The healthcare industry has been a priority for growth in Southern Nevada over the last several
years. The attention the industry has received has resulted in some notable wins, such as the
establishment of the School of Medicine at UNLV. In addition to the healthcare training programs
present at other post-secondary institutions in Southern Nevada, the UNLV School of Medicine will
serve as a vital pipeline for healthcare workforce development for the region and the state.
Southern Nevada’s dedication to developing the healthcare industry stems from a historical
underperformance of healthcare in the county, and indeed the state. According to the Southern
Nevada Health District’s (SNHD) 2019 Community Health Needs Assessment, healthcare access
remains a critical challenge for the region. Specifically, the high cost of care, the lack of healthcare
coverage, and the lack of available medical providers have pervaded the healthcare industry in
Southern Nevada (Table 10).60
Healthcare Access Continues to be a Challenge for Southern Nevada
Table 10: Healthcare Indicators for Clark County, Nevada, and the United States. Source: Southern Nevada Health District.
Note: Data availability varies by year. The latest year of availability for each indicator is indicated in parenthesis.
Percent of Adult
Population Uninsured
(%) (2019)
Percent of Population
without a Personal
Healthcare Provider (%)
(2019)
Number of Medical
Professionals per
100,000 Population
(2016)
Clark County 21.55 36.20 237
Nevada 19.42 33.75 246
United States 14.73 22.45 288

39
The Association of American Medical Colleges (AAMC) collects data on states’ physician workforces
and publishes a state-level profile on an annual basis. Though collected at the state level, these data
may be used to determine trends in physician workforce preparedness and availability for Clark
County as the county accounts for a significant portion of the state’s total population. In the AAMC’s
2019 Nevada Physician Workforce Profile, Nevada ranks in the bottom five nationally in all measures
of physician supply—including active physicians per 100,000 population (rank 45) and active primary
care physicians per 100,000 population (rank 48)—except for the percentage of active physicians
who are female (rank 44), percentage of active physicians who are international medical graduates
(rank 8), and percentage of active physicians who are age 60 or older (rank 38).61 The latter two of
these metrics hint at the state’s heavy dependence upon an imported and aging physician
workforce, with 27% of the state’s active physicians being international medical graduates and
nearly 30% being at least 60 years old.62
Nevada’s rankings related to physician workforce development are a mixed bag. Nevada ranks quite
well (rank 16) regarding the percentage of undergraduate medical students (UME) that matriculate
from in-state, with 73% of UME’s coming from Nevada. Likewise, in recent years the number of
medical residents and fellows enrolled in programs accredited by the Accreditation Council for
Graduate Medical Education (ACGME) has increased over 150%, though international medical
graduates still account for 26% of the medical residents enrolled in these programs. Nevertheless,
in-state enrollment in resident or fellowship programs remains very low in Nevada, with just over 21
individuals enrolled in ACGME programs for every 100,000 population (rank 44). A bright spot is
Nevada’s ability to retain many of the physicians trained in-state to work at Nevada’s medical
institutions, with nearly 77% of students enrolled in undergraduate and graduate medical education
(UME and GME) in Nevada choosing to practice in Nevada (rank 9).63
The AAMC’s data further indicate that physicians who complete their graduate medical education
(GME) (e.g., residency or fellowship) in Nevada are more likely to practice in Nevada; 55% of those
physicians who completed their GME in Nevada wound up practicing in-state. Even given this
majority, 17% of physicians who completed their GME in Nevada decided to practice in California.
The next most common state for Nevada-trained physicians to practice in is Washington, which
accounted for just 3% of Nevada-trained GME students. The loss of physicians to California is not
entirely surprising given the states’ proximity to one another but remains a challenge for retaining a
qualified physician workforce in Nevada.64
In addition to being an opportunity for stable employment in the region, especially as Clark County
continues to attract an older population, healthcare access and affordability are critical during the
COVID-19 pandemic. A well-developed local healthcare industry capable of handling a growing
number of illnesses without regressing to crisis standards of care is important. This requires not only
a greater number of trained medical professionals, but also more strategic locations for medical
facilities. The Las Vegas Medical District (LVMD) represents an opportunity for the establishment of a
strong, comprehensive medical district for Southern Nevada. The LVMD contains seven higher
education institutions, four hospitals, two imaging centers, and one neurodegenerative disease
treatment and research center.65 By centralizing the healthcare industry and medical practitioners
into a dedicated area, Southern Nevada reduces the burden for many individuals to travel to
different locations for treatment.

40
Outdoor Recreation
Outdoor recreation provides a multitude of economic benefits to the citizens of Clark County.
Outdoor areas also promote healthy lifestyles and foster a sense of community. These benefits are
especially important during the COVID-19 pandemic, when entertainment, restaurants, and other
indoor activities have been unavailable.
Although Clark County is well-situated in a beautiful area with vast public land, it is not well-known as
an outdoor recreation destination like many other areas in the American southwest such as Denver,
Colorado and Salt Lake City, Utah. Past efforts to market the Strip as “Sin City” with the focus on
gambling and indoor entertainment contribute to this lack of awareness.
In addition to federal and state park lands, the Las Vegas metro area only contains around three
acres of municipal park per thousand residents compared to the national average of ten acres per
thousand residents.66 This is partially mitigated by the fact that many of the master-planned
communities in the county contain hundreds of acres of privately-owned and maintained facilities,
including golf courses and equestrian trails. Although many of these are free for public use, such as
parks and trails in the Summerlin community, lack of access to parks within walking distance in less
affluent communities creates what the American Society of Civil Engineers calls “park deserts” (see
Figure 22 in Appendix C). While residents have ample access to federal lands, the importance of
small local parks to create a sense of place and community must not be overlooked. Southern
Nevada is home to a diverse community and a diverse business community—but in general—
minorities tend to be underrepresented both as visitors to parks and as business owners in the
outdoor recreation industry.67 Equity is an essential consideration when promoting outdoor
recreation, and care must be taken to foster inclusivity on public lands.
Environment & Natural Resources
In addition to natural attractions for outdoor recreation, mineral extraction has always been present
in the county, with early gold, silver, and lead mining drawing settlers to the area. Today, large-scale
gypsum, limestone, sand, and gravel operations are more important. The success of mining is
therefore closely tied to the local construction industry which relies on these materials. Although
mining is important statewide, mineral extraction in Clark County employs a relatively small number
of people and increasing automation likely will further reduce that workforce.
Solar assets are also important resources for the county. With 26 solar power plants already in place
and several planned, the county is poised to take advantage of its abundant sunshine. However,
solar has the major disadvantage of not producing power at night, and large fields of solar panels
can be controversial to rural residents.68 Diversification of resources through emerging and
developing technologies such as storage69, enhanced geothermal70, and hybridized power plants
(such as the Stillwater Triple Power Plant in use since 2012)71 are essential to meet the needs of
residents and the renewables requirements of the State of Nevada.

41
SWOT Analysis Mapping the Future
An Analysis of Clark County’s
Communities and Economy
The Hoover Dam in Clark County, Nevada. Photo Courtesy of Kristina D.C. Hoeppner/Flickr

42
SWOT Analysis
The ability to foresee change and analyze current capacity to handle change not only increases the
resiliency of an organization during times of economic turmoil, but also assists an organization in
capitalizing on opportunities during times of growth. In the 1960s and ‘70s, a team of researchers at
SRI undertook the monumental effort of creating a blueprint for this process. In order to create this
guide, researchers surveyed thousands of organizations and executives to best understand how
organizations were managing perceived changes to their industries, and how change management
could be improved. Their findings led to what eventually came to be known as the SWOT analysis.
Strength refers to what is satisfactory in the present (internal).
Weakness refers to what is currently unsatisfactory (internal).
Opportunity is an emerging trend that presents a chance for growth (external).
Threat is an emerging trend that presents an obstacle for growth (external).
A SWOT analysis enables organizations to assess their current capabilities and understand how to
work with them in order to navigate future uncertainty. This powerful analysis serves as the basis for
an organization’s strategy and highlights sources of strength on which to rely, weakness that may be
addressed, opportunities to be realized, and dangers and difficulties to be avoided or addressed.
These elements—in the case of Clark County today—are summarized in this section. The strengths,
weaknesses, opportunities, and threats identified below are directly attributable to the qualities and
characteristics of Clark County identified in the Community & Economic Assessment and Asset Map
above.
Strengths
Strengths: Community & Quality of Life
The presence of a strong hospitality industry in Southern Nevada has nurtured the development of
strong recreational assets for Clark County residents and visitors. Residential areas in the region
have been centered on the provision of these assets, such as master-planned communities with golf
courses, parks, and lakes. Most impressively, Southern Nevada has been able to provide these
assets while maintaining comparative affordability among its peer metros and other West Coast
metros.
• Large urban amenities with a small-town feel
Southern Nevada’s history with the leisure and hospitality industry has enabled it to develop
a strong culture around entertainment and 24-hour service. As a result, though the region
has a comparatively smaller population than some of its peers and larger U.S. metros,
residents have access to several amenities that are more typical of larger cities.
• Comparative affordability
Despite seeing a rebound in housing prices after the Great Recession, Southern Nevada’s
cost of living remains competitive among many of its peer and fellow western metro areas.
This affordability helps to attract younger workers looking to start their careers, as well as
older individuals looking to retire, increasing the dynamism of the region’s population.
• Close-knit communities in a large urban area
Despite the rapid growth in Clark County’s population, local residents have managed to

43
maintain strong ties with their respective communities. An increasing level of engagement
with local amenities has helped residents take pride in their communities and has fostered a
greater sense of communal identity in many neighborhoods.
Strengths: Business & Industry
Clark County’s world class entertainment and recreation assets draw visitors worldwide and have
played an integral role in the region’s economic recovery since the Great Recession. They serve as
an anchor for numerous regional industries that support the tourism, gaming, and entertainment
industry. As the county’s economic base, these assets create demand for local businesses, generate
tax revenues, and serve as a source of jobs for Clark County residents.
• Global brand drawing visitors worldwide
One of Southern Nevada’s key strengths is its ability to market a global brand that has been
successful at drawing millions of visitors throughout the world. The region’s cultural and
entertainment assets, combined with its world-class hospitality industry, offer visitors an
experience that is difficult to find in other locations. This competitive advantage has helped
the region create thousands of jobs since the Great Recession and continues to serve as the
region’s economic anchor.
• Business-friendly environment
Like the state of Nevada, Clark County has maintained a reputation of business-friendliness
and an eagerness to “close the deal” with firms relocating to the area. Working with the
region’s economic development authorities, Clark County has maintained a fairly expedient
business licensing process and a great deal of flexibility during the COVID-19 pandemic.
Strengths: Workforce & Education
The region’s labor-intensive entertainment and recreation industry attracts many new workers to
Clark County, who are inclined to stay once they understand the region’s broader offerings. This
ability to attract outside workers is supplemented by local colleges’ strengths in providing employers
with a reliable pipeline of homegrown talent.
• Attraction of a skilled workforce
Because Southern Nevada’s entertainment and recreation industry is labor-intensive, it
creates a significant “pull” factor that attracts workers to the region. The numerous
conferences and conventions held in Las Vegas every year, for example, bring in many skilled
workers and exposes them to the region’s offerings. As a result, the region’s ample business
and recreation opportunities have fueled a high level of in-migration to Clark County, with
many new residents possessing diverse backgrounds, skills, and entrepreneurial pursuits
that add to the region’s ability to meet the needs of nascent and growing industries.
• Higher education system complementary to regional strengths
Clark County’s higher education institutions increasingly complement regional employers’
needs. UNLV, which recently attained the status of a tier 1 research university, has forged
strong partnerships with the area’s major casino hotels through its College of Hospitality,
while NSC’s healthcare and technical programs have provided a reliable workforce pipeline
to the county health system.
Strengths: Innovation & Entrepreneurship
Southern Nevada’s ecosystem continues to emerge and has shown progress over the last several
years. Partnerships between higher education and industry have become more commonplace, and

44
venture capital has more than doubled. As the components of the regional innovation ecosystem
continue to mature, Southern Nevada will become a more competitive place to conduct high-skill,
high-wage, and high-tech business.
• Drive for applied technological innovation
Over the last decade, Southern Nevada has demonstrated a drive for harnessing new and
emerging technologies for economic growth and development. This openness can have a
broad impact on economic development as Clark County seeks to diversify from leisure and
hospitality toward higher-skill industries.
Strengths: Infrastructure
Clark County’s central location provides easy driving access to many cities on the West Coast as well
as the Southwest. With strong transportation infrastructure and low traffic, the county is poised to
emerge as a transportation hub for the region. In addition, the county has shown leadership in
testing and adopting smart technologies to connect and improve the lives of residents.
• Connection to regional, national, and international destinations
Clark County’s connectivity not only to other southwestern metropolitan areas, but also to
metro areas across the United States and the world through McCarran International Airport,
continues to be a strength for the region. As a tourism-dependent economy, global
connectivity has been a necessity, but as a region seeking to diversify into other industries,
such as logistics and advanced manufacturing, regional, national, and global connectivity
remain imperative.
• Broadband accessibility
Residents of Clark County generally enjoy a competitive broadband market, with most county
residents, particularly those in the county’s core, having many choices when selecting a
broadband service provider. A competitive broadband market helps to maintain affordable
prices for high-speed internet, enabling more residents to subscribe to service.
Strengths: Environment
Clark County has shown leadership around environmental conservation despite challenging
circumstances. The Southern Nevada Water Authority (SNWA) has implemented an innovative
approach to water conservation, with several programs that have reduced water usage in the county
despite increasing population. In addition to the SNWA, the county has recently rebranded the
Department of Environment and Sustainability which handles questions of sustainable development
concerning air quality, land conservation, and species protection.
• Access to diverse outdoor recreation areas
Expansive public parklands and multi-use trails within driving distance are a boon for county
residents and visitors. Locally, Clark County can boast of beautiful mountains, vast deserts,
and long lake shores. Outside of the county, National Parks and Recreation areas, including
the Grand Canyon, Death Valley, and Joshua Tree, are within easy driving distance.
• Streamlined endangered species conservation process for development
The Clark County Desert Conservation Program and the Multiple Species Habitat
Conservation Plan have streamlined the compliance process for developers to meet
requirements of the Endangered Species Act. This program allows developers to pay fees to
fund conservation programs and establish reserves outside of the development area. This

45
has allowed the county to develop while also supporting threatened habitats and endangered
species.
• Robust water conservation and management
Programs and projects that return treated wastewater to Lake Mead and promote native
plants and habitats have allowed the county to reduce its water consumption in the face of a
rising population. These programs, overseen by SNWA, are a point of pride for the county and
allowed continued development in a difficult environment.
Weaknesses
Weaknesses: Community & Quality of Life
Clark County has experienced tremendous population growth in recent years, placing a great deal of
strain on the region’s social infrastructure. While increasing healthcare access has long been a
priority in the region, the county’s population growth and the COVID-19 pandemic have moved this
challenge to the forefront. A disconnect between the location of much of the region’s healthcare
assets and the dispersion of the region’s population adds additional stressors to the region’s
healthcare and quality of life.
• Placemaking and urban development
Master-planned communities designed around single-family homes have continued to
dominate the residential development landscape in Southern Nevada. These properties are
increasingly out of range for the region’s typical household. A failure to develop denser, more
comprehensive neighborhoods risks underutilization of the limited space and resources
available in Clark County.
• Healthcare options and access
The establishment of the Las Vegas Medical District, anchored by UNLV’s new School of
Medicine, promises to grow Southern Nevada’s healthcare industry. However, the availability
of health services to county residents remains a challenge, with a shortage of primary care
physicians and specialists to serve Southern Nevadans.
• Preference for new development over redevelopment
The growth in Clark County over the last decade has been significant. This growth, however,
has been met predominantly by further suburban sprawl in lieu of the rejuvenation of Clark
County’s established communities. The preference for new construction over the
revitalization of existing neighborhoods risks increasing disparities between the region’s
various population groups.
Weaknesses: Business & Industry
Though Southern Nevada has sought to diversify its economy away from leisure and hospitality, the
approach in practice has been fragmented. With several strong, independent municipalities looking
to grow their respective local economies, Clark County has seen a range of local priorities that vary
widely across jurisdictions, complicating the road to diversification.
• Fragmentation among local governments
Clark County is home to diverse communities with their own priorities and constituencies.
However, competition between local governments to attract businesses to their jurisdictions
has hindered a wholistic approach to economic growth and diversification in the region. As a

46
result, while prosperity and growth have occurred in some areas of the county, others are
increasingly left behind.
• Slow pace of diversification
Though economic diversification is measured in decades, Clark County’s economy has not
demonstrated a notable shift away from the leisure and hospitality industry since the Great
Recession. While the foundation for diversification has been laid over the last several years,
a continued reliance on the leisure and hospitality industry to drive employment growth in
Southern Nevada will subvert efforts to grow employment in other sectors of the economy.
Weaknesses: Workforce & Education
The education and workforce pipelines in Southern Nevada have shown a capacity to adapt to the
changing needs of the region’s employers. At the K-12 level, strong pockets of excellence exist
among the county’s magnet and career technical academies. However, as a whole, these systems
underperform, impacting the region’s efforts to pivot away from low-skill, low-wage jobs.
• Underprepared high school graduates
CCSD has made significant strides in recent years to improve student achievement, having
recently achieved an 85% graduation rate from regional high schools. The expansion of
magnet schools and CTAs represents an opportunity for further workforce development at
the high school level. However, local employers continue to cite a lack of certain skillsets,
such as soft skills, and education credentials as a hindrance to hiring local talent. Likewise,
many graduates of CCSD require remedial education at NSHE institutions prior to enrolling in
college-level courses.
• Job growth in lower-skill, lower-wage occupations
Clark County’s workforce has essentially rebounded from the depths of the Great Recession;
however, this rebound remains predominantly within low-skill, low-wage occupations. This
has led to an increase in the number of underemployed workers (those working in jobs that
are not matched to their education and skill levels). High-wage workers considering a move
to Clark County may find it difficult to secure a suitable job for themselves or for their spouse
(the trailing spouse problem) due to the relative scarcity of high-quality jobs.
Weaknesses: Innovation & Entrepreneurship
Clark County’s innovation ecosystem has matured over the last decade. However, the ecosystem
remains in early stages of development, and the region’s approach to innovation remains ad hoc.
With entrepreneurs who are unsure of the resources at their disposal, Clark County’s capacity to
make innovation a driver of its economy will remain hampered.
• Fragmented innovation ecosystem
Southern Nevada has utilized a piecemeal approach to develop its local innovation
ecosystem. This has led to the creation of many different actors within the public and private
sectors and academia that have overlapping activities and priorities. For individuals looking
to enter this ecosystem, the pathway can be confusing and overwhelming.
• Gaps within the innovation ecosystem
Though venture funding has become more available in Southern Nevada, innovation
ecosystems require an extensive variety of resources for performance. The absence of strong
mentorship and investor networks means many local entrepreneurs must look outside of

47
Clark County for advice or, in many cases, leave Southern Nevada altogether in pursuit of
more developed entrepreneurship ecosystems.
Weaknesses: Infrastructure
Clark County is heavily reliant on cars. The county suffers from low walkability and less alternative
transit options than other similar urban areas. While low-density development has always been
favored, it is constrained by expansive federal land ownership, especially surrounding the Las Vegas
Valley where much of the population is concentrated. In addition, broadband is less accessible for
lower income residents. These impediments tend to have the greatest impact on the county’s most
vulnerable residents.
• Car-centric transportation infrastructure
Transportation infrastructure in the county strongly favors car ownership. With relatively few
alternative transit options, lower income and elderly residents are less able to easily access
services in the county. Local transportation infrastructure related to multimodal options and
connections are a weakness that need to be addressed—especially in connecting lower
income neighborhoods to local services and employment centers.
• Low walkability beyond the Strip
Municipalities throughout Clark County have low walkability. Residents must run errands and
access community services mainly by driving, although bus services are becoming more
advanced. Walkable neighborhoods promote stronger communities and better health and
reduce the impact of cars on the environment.
• Constrained development potential due to federal land ownership
The Bureau of Land Management and other federal agencies administer much of the land in
the county. The Southern Nevada Public Lands Management Act gives the BLM the ability to
sell public lands around a specific boundary surrounding the Las Vegas Valley. As a result,
most of the municipalities are essentially landlocked (i.e., surrounded by lands they cannot
develop). A bill to expand land for development south along I-15 and around Henderson has
been in progress since 2018.
• Digital divide
Though broadband is generally accessible to Clark County’s population, data show that there
is a socioeconomic divide between those with and without a subscription. While Southern
Nevada’s wealthier population is well-connected, those in lower income groups are far more
likely to lack in-home access to broadband services. This divide in digital services is likely to
exacerbate existing inequities in Clark County’s population.
Weaknesses: Environment
Although Clark County benefits from access to diverse and beautiful parklands, it also faces
challenges that arise from these natural areas. The county has active interest groups including
environmentalists, developers, and federal land managers who must have their voices heard when it
comes to environmental issues. The county must also be especially cognizant of the needs of
residents, particularly those in underserved communities, when it comes to outdoor spaces.
• Complex and sensitive environmental issues
Clark County is located in the Mojave Desert, an area with a complex set of environmental
issues that must always be considered during any development projects. Past environment
and development practices have disturbed and continue to disturb the fragile ecosystem.

48
Dealing with environmental challenges requires cooperation between environmental groups,
all levels of government, and industry interests, and can take years.
• Park deserts
Certain areas of Clark County suffer from a lack of access to small municipal parks that
beautify communities and bring people together. Many parks are concentrated in affluent
master-planned communities that privately fund development and maintenance. Although
many of these are free for public use, lack of locally accessible parks in less affluent
communities creates “park deserts” in the metro area.
Opportunities
Opportunities: Community & Quality of Life
Clark County is poised to create a strong community and enhance the quality of life for its residents.
Several opportunities exist to tap into the expertise of its residents, whether they be retirees or young
families moving to the area for the lower cost of living.
• Increasing number of business-savvy retirees
Over the last decade, Clark County’s 65+ community has been one of the fastest-growing age
groups in the region. Possessing decades of professional experience, these individuals
represent a unique asset for Southern Nevada, particularly as the region looks to grow its
entrepreneurship resources. As this demographic continues to grow in Southern Nevada, so,
too, does the opportunity for entrepreneurial mentorship.
Opportunities: Business & Industry
Clark County is well-positioned to exploit several regional advantages which represent significant
opportunities for the county to diversify and improve its business environment. The region’s
connectedness with other markets—whether through conventions, highways, or airplanes—is a
characteristic that has only begun to be explored. Additionally, as the COVID-19 pandemic forces
companies and industries to investigate relocating supply chains to the United States, Clark County
remains a competitive location for production and distribution.
• Easy access to West Coast markets
Clark County’s geographic proximity to southern California presents ample opportunity to
develop stronger connections with West Coast markets. As the region continues to diversify
its economy into high-tech industries, having suppliers, customers, and prospective
businesses within driving distance becomes an increasingly important competitive
advantage.
• Conferences, conventions, and tradeshows as opportunities to attract businesses
High-profile events such as the Consumer Electronics Tradeshow attract thousands of
visitors to Clark County each year, some of whom are eager to explore the potential of doing
business in the county. These events are ideal opportunities for the county to educate
prospective businesses, workers, and residents on what the region has to offer. It is
important to note, however, that this opportunity is heavily predicated upon the return of
business travel following the COVID-19 pandemic. While Las Vegas will likely continue to be
an attractive destination for high-profile business events, providing the region the opportunity
to attract these businesses permanently, it is similarly likely that mid-level events and shows
are unlikely to return to pre-pandemic levels.

49
• Reshoring of advanced manufacturing industries
While much U.S. manufacturing has moved overseas in recent decades, the advent of
advanced manufacturing in the Southwest region, as evidenced by Tesla’s Gigafactory in
Northern Nevada and the planned opening of TSMC’s silicon chip factory in Arizona, places
Clark County at the center of an emerging cluster of advanced manufacturing firms. The
county can leverage its proximity to West Coast markets, its role as a logistics hub, and its
recreational and natural amenities to position itself as a prime location for high-tech
manufacturing.
• Emerging logistics hub
Drawing on Las Vegas’ world class airport and the rapid growth of its warehouse and
transportation support industries, Clark County has emerged as a major logistics center for
cross-county freight. The county can utilize its strength in logistics to develop related
industries, such as manufacturing, and to explore new logistical applications such as
autonomous vehicles.
Opportunities: Workforce & Education
The relative scarcity of high-quality jobs in Clark County has been a deterrent for higher-wage
workers considering Clark County as their new home. However, the growing viability of remote work
in the wake of COVID-19 presents the county with an opportunity to overcome this problem. Policies
which attract residents who can work remotely have been piloted in other cities and could serve as a
model for Clark County.
• Increased opportunity to telework and lower cost of relocation
Many businesses’ successful transition to remote work during the COVID-19 pandemic has
demonstrated that many workers do not necessarily need to live close to their workplace. As
a result, it is possible for some professional workers, especially those who have difficulty
finding employment in Clark County within their chosen fields, to move to Southern Nevada
without terminating their jobs elsewhere.
• Remote worker programs as opportunity to attract high-wage workers
Local governments across the United States have developed innovative programs to attract
mobile workers who can work remotely (e.g., Tulsa Remote, Reno Reconnect, Vermont’s
Remote Worker Grant Program). Clark County can use these programs as models to develop
its own remote work initiative, thereby attracting higher-wage workers who otherwise could
not relocate to the county.
• Availability of innovative workforce programs
The state of Nevada has been adept at quickly designing and implementing new workforce
training and development programs to meet the needs of new and emerging industries.
Pursuing mutually beneficial workforce development programs, such as apprenticeships,
creates opportunities for Southern Nevada to grow its skilled workforce and attract diverse
businesses.
Opportunities: Innovation & Entrepreneurship
Local governments in Southern Nevada have shown a propensity for policy experimentation that
enables greater innovation. Maintaining this dedication and openness to innovation, while exploiting
geographic resources unique to the area, may better enable Clark County to increase opportunities
for local firm innovation.

50
• Access to West Coast innovation ecosystem
Clark County’s proximity to western states with innovative economies, such as California and
Washington, makes the region an attractive destination for those who are seeking to
establish and grow their business without entering the crowded and expensive markets that
dominate West Coast states (e.g., San Francisco and Seattle). With short, direct flights to
these cities, entrepreneurs in Southern Nevada can quickly access out-of-state resources
and networks while remaining local.
• Technology development and deployment for 21st century cities
Local governments in Clark County have demonstrated an openness to new and emerging
technologies that promise to change the nature and rhythm of cities and their suburbs. As
cities across the United States look to deploy these technologies, Southern Nevada is well
positioned to serve as a test bed for these technologies, particularly those related to
autonomous vehicles, renewable energy, and water conservation. This is particularly true in
the age of COVID-19, where public health technologies may be deployed to mitigate the
spread of deadly pathogens.
Opportunities: Infrastructure
Clark County has enthusiastically supported several interesting new infrastructure projects to
modernize urban areas. The COVID-19 pandemic has revealed other areas on which the city should
focus that would best serve residents. Creating mixed-use developments, expanding alternative
transit options, and adapting current transportation to be more sustainable are all important goals
for the county.
• Modern and innovative transit
Clark County has the opportunity to update and improve its infrastructure to support multi-
modal transit options and create complete streets through supporting transit-oriented
development projects, protecting and developing bike lanes, and expanding bus rapid transit
services.
• Smart city innovation
Las Vegas, in partnership with several companies, serves as a proving ground for various
new and exciting smart technologies in an urban setting. The purpose of this technological
innovation is to connect infrastructure, people, and government—creating a city that is more
responsive to the needs of the population. Smart city innovation could be an exciting
opportunity for communities outside of the Las Vegas core of the county, and opportunities
to expand these services to rural Clark County should be considered.
• Partnerships with local and regional governments to expand resources for electric vehicles
Clark County residents are unlikely to become car-free in the near future but have shown
themselves to be enthusiastic adopters of sustainable alternatives. Electric vehicles (EV)
have exploded in popularity over the last several years, and Nevada has been extremely
supportive of EV ownership and the infrastructure needed for charging stations. The county
has the opportunity to partner with municipal and regional governments to expand EV
infrastructure and think of new ways to take advantage of the demand for EV.
Opportunities: Environment
Dominated by the desert landscape, Southern Nevada has excelled at managing its limited water
resources and supporting land conservation efforts. This culture of conservation has become
51
engrained in residents, making it easier for government to enact sustainability measures. The county
should harness these attitudes and plan for an uncertain climate future.
• Expansion and diversification of renewable resource use
Nevada has a variety of accessible renewable energy resources including abundant solar and
strong geothermal. Clark County has seen an explosion of solar farms over the last five years,
and opportunities to expand solar and solar storage abound. But every renewable energy
resource has its own strengths and weaknesses, and advances in technology and
diversification of renewables can be tapped to offset the weaknesses of solar energy.
• Expansion of innovative water conservation
The Southern Nevada Water Authority has implemented several innovative water practices to
conserve water in the county. With climate change and continued demands for water in the
region, the county—in collaboration with other water resources agencies—should be active in
pursuing technology innovation in water management, while also being careful to study the
effects of new practices on sensitive water resources such as the aquifer and Lake Mead.
Threats
Threats: Community & Quality of Life
Clark County’s affordable quality of life has historically made it a competitive alternative for many
looking to relocate to or within the western United States. As the region looks to become a
mainstream destination for residents as well as visitors, establishing Southern Nevada as a region
that can serve all communities and all household types will be increasingly important.
• Growing disconnect between housing stock and housing needs
Though Clark County’s housing market has rebounded from the depths of the Great
Recession, the make-up of new housing construction in the region has increasingly departed
from the needs of the typical household. A preference by builders for larger, more expensive
homes in master-planned communities is slowly decreasing the region’s affordability while
limiting the options available for low- and middle-income earners, which account for a
significant portion of Southern Nevada’s population. Clark County risks losing its comparative
affordability with peer regions by continuing to neglect the housing needs of most
households.
• Limited healthcare options and accessibility for many in the region
Southern Nevada has historically struggled to attract and retain healthcare talent. While
progress has been made in recent years to bolster the healthcare workforce development
pipelines at the region’s higher education institutions, pervasive accessibility issues threaten
the development of the region’s healthcare industry and hinder public health mediation
efforts, especially in the era of COVID-19.
• “Sin City” reputation
Las Vegas looms large in marketing for Clark County. Its reputation as “Sin City” where
people go to gamble makes it difficult for visitors to recognize the county as a community
where people live, work, and raise families. This marketing has been so successful that it
overshadows many other aspects of the area and can discourage people from considering
the county as a place to settle down despite its affordable cost of living and amenities.
52
Threats: Business & Industry
Overdependence on tourism exposes Clark County to economic downturns, geopolitical shocks, and
changes in consumer discretionary spending. Las Vegas’ gaming and entertainment assets also face
increased competition from other regions and from online gambling.
• Exposure to economic shocks
The dependence of Clark County’s economy on tourism makes it highly susceptible to
economic downturns, pandemics, and geopolitical shocks. This exposure to macro-level
events will likely continue as long as tourism remains the dominant regional industry.
• Competition from other regions and the threat of online gambling
In recent years, the regulation of gambling and casinos has been increasingly delegated
down to the state and local levels. The decentralization of gambling regulation has
encouraged a proliferation of new gaming establishments throughout the United States as
well as rapid growth in online gambling, though Las Vegas remains the premier destination
for gambling and entertainment. Nevertheless, increased competition from other regions and
from online gambling may eventually affect the financial performance of Las Vegas’ tourism
industry.
Threats: Workforce & Education
COVID-19’s long-term economic impact on Clark County is a significant threat to its workforce and
economic development objectives. As the pandemic continues to put downward pressure on
employment in the county’s primary industry, it will become increasingly necessary for the region to
actively diversify its workforce.
• Pervasive medium- to long-term unemployment in dominant industries
The economic impact of the COVID-19 pandemic has disproportionately affected Clark
County’s economy. The near-total shutdown of the regional tourism and entertainment
industry has furloughed or laid off a substantial portion of the workforce. (The Las Vegas
metropolitan area’s May unemployment rate is 29%, the third highest in the United States.)72
While it is difficult to predict the pandemic’s long-term consequences, the possibility exists
that the local workforce may not be the same post-pandemic as it had been at the start. This
may present new challenges as the county seeks to design its economic and workforce
development strategy.
• Return to office-based work after COVID-19
Post-pandemic, the return of many workers to office-based work may reduce the appeal and
viability of remote work. Because the attraction of new residents who can work remotely is
one potential strategy to draw talent to Clark County, a return to office-based work may
reduce the pool of workers willing or able to relocate.
Threats: Innovation & Entrepreneurship
As Southern Nevada’s regional innovation ecosystem remains in early stages of development,
resources from the public sector are vital for continued growth. The COVID-19 pandemic, however,
has reoriented many public budgets away from innovation and toward public health and other crisis-
mitigation areas.
• Overdependence on federal funding for local R&D activities
UNLV remains the region’s primary R&D-performing higher education institution and remains
relatively dependent upon federal funds to conduct many of these activities. As the COVID-19
53
pandemic places pressure on state and federal funding for R&D, Southern Nevada may lose
a vital source of its research, development, and innovation funding, curtailing the region’s
efforts to harness innovation for economic development.
• Dwindling resources for entrepreneurs
Budgetary pressures are not only relegated to higher education. Local entrepreneurs use
federal, state, and local resources, including funding and informational resources, to make
critical decisions for their businesses. As governments at all levels look to limit discretionary
spending, programs that benefit local entrepreneurs are at risk of being curtailed to preserve
local budgets.
Threats: Infrastructure
Throughout the United States, aging infrastructure and the effects of the COVID-19 pandemic
challenge government agencies and businesses alike. Clark County has been battered by economic
shocks and must deal with a changed infrastructure landscape. Outdated transportation
infrastructure and aging buildings will likely impact the county for years to come.
• Reduced need for commercial buildings
The large-scale return to offices, conference centers, and sports stadiums is unlikely in the
near future. This presents a threat to commercial buildings in Clark County, which rely on rent
and attendance to remain in business.
Threats: Environment
Clark County is not unique in its vulnerability to the effects of climate change. Sweltering heat,
uncertain precipitation, and changing weather patterns are already affecting the county, and there
are no easy solutions to these issues. In the short term, the Las Vegas Valley and the regional water
supply is sensitive to the actions of regional and international actors.
• Exposure to climate change
Deserts are sensitive to the effects of climate change. Water conservation and land
management practices will become increasingly complicated in an area that is experiencing
population growth. Wildfires, both locally and regionally, are also a growing concern.
• Threat of regional and international actors to local environments
In addition to the effects of climate change, Clark County is at risk of pollution and
environmental degradation caused by regional and international actors outside of its control.
Wildfires in California have caused air quality issues, and the Las Vegas Valley is susceptible
to other air pollutants that may arrive from areas as far away as Southeast Asia. Lake Mead
and the Colorado River are regional resources, and water access is affected by several
different factors outside of the control of Clark County.
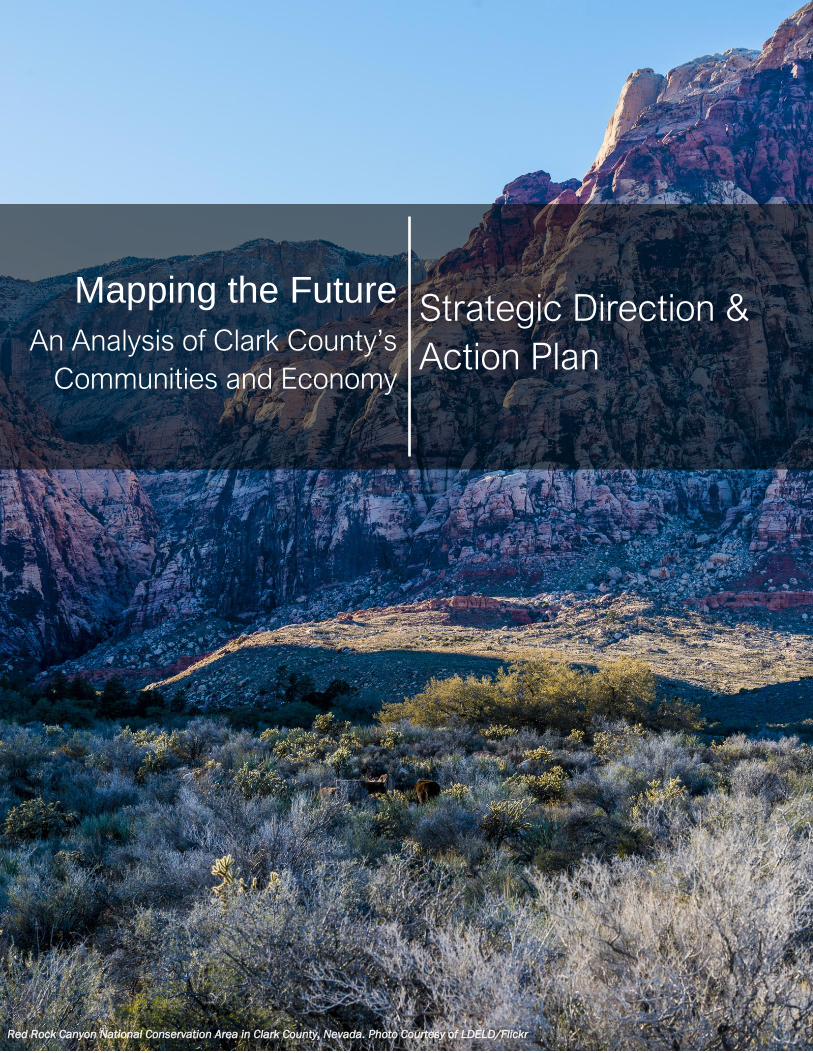
54
Strategic Direction &
Action Plan
Mapping the Future
An Analysis of Clark County’s
Communities and Economy
Red Rock Canyon National Conservation Area in Clark County, Nevada. Photo Courtesy of LDELD/Flickr

55
Strategic Direction & Action Plan
The Strategic Direction—composed of a vision, mission, and a series of goals and objectives—sets
forth a future desired state for Clark County’s communities and economy. It is informed by interviews
with stakeholders within the Clark County government, municipal governments, and others
throughout the region’s communities. The vision describes a desired future for Clark County that
reflects the collective aspirations of regional stakeholders, whereas the mission describes the overall
purpose of the activities undertaken by Clark County. To help Clark County achieve its vision, a
number of goals are identified that should drive the county’s activities. These goals are further
compartmentalized into specific, measurable objectives that the county should seek to achieve in
the short and medium term.
The interviews that SRI conducted with county stakeholders revealed several valuable insights. While
some themes, such as Economic Diversification and Workforce Capabilities, were identified in SRI’s
prior work in Nevada, others emerged as new areas of interest, including themes like Placemaking
and Equity. The remaining themes include Small Business Resources and Intraregional
Collaboration. These themes are manifested in the six goals SRI developed, which can be found
below, and represent the core of the community and economic development strategic plan.
Additional information on stakeholder engagement and participant comments is available in
Appendix B.
Perhaps most importantly, the Strategic Direction must be actionable. While the vision, mission,
goals, and objectives describe an ambition, they cannot be achieved without clear activities that
direct stakeholders toward a shared outcome. These activities are described in the Action Plan,
which can be found further below. The Action Plan offers a list of activities that correspond to each
objective, forming a pathway to realizing Clark County’s goals and thus its overall vision. Importantly,
the activities that comprise the Action Plan are derived from the characteristics identified in the
SWOT analysis. While the Community & Economic Assessment and Asset Map may identify various
characteristics of Clark County, the SWOT analysis more acutely identifies the qualities that are
within the scope of this report. For example, while there may be areas for potential improvement
within Clark County School District, it is beyond the scope of this report to provide a detailed action
plan to remedy all such areas. Rather, those trends identified in this report and codified in the SWOT
analysis are to be addressed in the following Action Plan. In addition to describing the specific
actions to be undertaken, each activity includes a designated lead and supporting organization(s), an
approximate timeframe, and a general indication of resource requirements. Some
activities may require little to no additional resources, whereas others are conditional
on new financial commitments.
Strategic Direction
Vision
Clark County is a world-class gateway to the Mountain West, built upon prosperous and diverse
communities and businesses.
Mission
Clark County catalyzes visionary initiatives that transform Southern Nevada into a smart, green, and
vibrant region.

56
Developing the Vision & Mission
SRI International developed a set of personas that were given to members of the Clark County
government. These personas were based upon emerging socioeconomic trends that SRI identified in
Clark County, including:
▪ A small-business owner looking to expand her business
▪ A family of four moving to the region and beginning high-paying careers
▪ A retired couple looking to remain active in their local community
▪ A recent STEM graduate seeking employment in the local job market
▪ A manufacturing worker looking to advance his career
Respondents were asked to identify hypothetical goals and motivations for their given persona and
how Clark County could help their persona achieve these goals. Respondents were also asked to
identify different challenges their persona may face in Clark County and different initiatives or
programs that may mitigate these challenges. Answers to the questions, “How can Clark County
meet these needs?” and “How can Clark County solve these problems?” were compiled and
categorized into one of six buckets based upon the content of the response (Small Business
Resources, Placemaking, Economic Diversification, Workforce Capabilities, Intraregional
Collaboration, and Equity). The vision statement was further refined using information SRI collected
through interviews of numerous Clark County stakeholders, including those in the public, private,
academic, and non-profit sectors.
Clark County Stakeholders Remain Focused on the Region’s Economy
Figure 18: Components of Clark County's Vision

57
Goals & Objectives
Six broad goals guide community and economic development efforts described in this strategy:
1. Cultivate a Fertile Environment for Small Businesses and Entrepreneurs
2. Accelerate Economic Diversification
3. Integrate the Workforce Ecosystem
4. Mobilize Stakeholders around County-Wide Initiatives
5. Promote Community-Centered Design of the Build Environment
6. Ensure Equitable Access to Resources
Goal 1: Cultivate a Fertile Environment for Small Businesses and Entrepreneurs
Small businesses and entrepreneurs remain the bedrock for local communities, comprising the
majority of firms and employers. As Clark County moves beyond the effects of COVID-19 on the
people and businesses of Southern Nevada, these firms will play a pivotal role in creating new
opportunities and accelerating the region’s recovery. Clark County’s role, then, is to provide the
requisite resources for this recovery and the new growth that is spurred by it. In particular, those
small businesses and entrepreneurs that are located outside of the region’s incorporated cities and
towns, and thus the resources provided by these jurisdictions, are in need of strategic and
operational assistance.
Objective 1.1: Support and coordinate activities that underpin entrepreneurship networks.
Objective 1.2: Ensure small-business owners have the tools and capabilities to scale successfully.
Objective 1.3: Expand community financial services.
Goal 2: Accelerate Economic Diversification
The impact of COVID-19 on the communities of Clark County has reinvigorated the call for economic
diversification. Many organizations are focused on this goal, including the Governor’s Office for
Economic Development (GOED), the Las Vegas Global Economic Alliance (LVGEA), and various
municipal departments throughout the county. As it enters the diversification discussion, Clark
County must be strategic to avoid the duplication of efforts by other organizations. For example,
while LVGEA has developed a list of target industries on which Southern Nevada should focus its
efforts, Clark County can enable the emergence and growth of these industries through service and
process innovations that facilitate business establishment and growth. Likewise, Clark County can
serve as an advocate for the region’s unincorporated areas as competitive places to do business.
Objective 2.1: Streamline business services.
Objective 2.2: Support the growth of health services.
Objective 2.3: Fuel lifestyle entrepreneurship in arts and culture and outdoor recreation.
Goal 3: Integrate the Workforce Ecosystem
The K-12 and higher education institutions in Clark County have initiated several workforce
development programs over the last decade to better align the region’s workforce with the needs of
its employers. More so than the other economic development organizations and municipal
governments in Southern Nevada, Clark County is well-positioned to drive change within Clark County
School District (CCSD), such as through the development of industry-relevant curriculum at the
district’s schools. Creating new, and strengthening existing, relationships between CCSD, workforce

58
training centers, higher education institutions, and regional employers, will be a critical step in
integrating Southern Nevada’s workforce ecosystem.
Objective 3.1: Improve access to diverse choices for training and education for workers and
employers, particularly among the region’s underserved communities.
Objective 3.2: Promote innovative remote workforce programs.
Goal 4: Mobilize Stakeholders around Community-Wide Initiatives
Efficient management in local government requires breaking down barriers to collaboration.
Stakeholders in the county include federal and municipal governments, LVGEA, and a variety of more
targeted organizations such as chambers of commerce and philanthropic groups. Internally, many
Clark County government departments have a stake in both community and economic development.
Therefore, it is important that Clark County pursue cross-cutting initiatives that mobilize both internal
and external stakeholders, as well as build relationships and capacity for innovation.
Objective 4.1: Reinforce strong relationships between Clark County and municipal governments.
Objective 4.2: Build fundraising capacity among regional organizations.
Goal 5: Promote Community-Centered Design of the Built Environment
Placemaking strengthens the connection between the people and the places where they live, work,
and play. Clark County is home to celebrated natural and man-made attractions as well as a city
known world-wide as an entertainment destination. But the heart of Clark County is its residents, a
diverse community that deserves a built environment where they can express their vitality and
character. The county should continue to promote its own identity through smart city innovations,
alternative transit options, walkable neighborhoods, and sustainable practices, the latter of which
are already a point of pride for the region. New technologies can serve residents as much as visitors,
and expansion and application of these technologies outside the urban core of the county is
essential for connecting communities.
Objective 5.1: Implement smart city innovation throughout the county to serve residents and visitors.
Objective 5.2: Improve and diversify access to mobility options.
Objective 5.3: Adopt and promote sustainable practices in energy and infrastructure.
Objective 5.4: Encourage revitalization of distressed areas of unincorporated Clark County.
Goal 6: Ensure Equitable Access to Resources
An equitable community is a resilient community. Equity means that, regardless of who you are, you
can receive the services necessary to live and thrive. Clark County is home to a diverse population—
racially, culturally, and economically—spread across administrative divisions and served by a variety
of local government agencies. The opportunity exists for the county to promote and ensure equitable
access to county services and adopt projects and practices with special attention to the needs of
low-income and underserved communities through partnerships with local service and business
organizations.
Objective 6.1: Advance equity in both the workforce and the business community.
Objective 6.2: Sustain and expand streamlined access to county services for residents and
businesses.
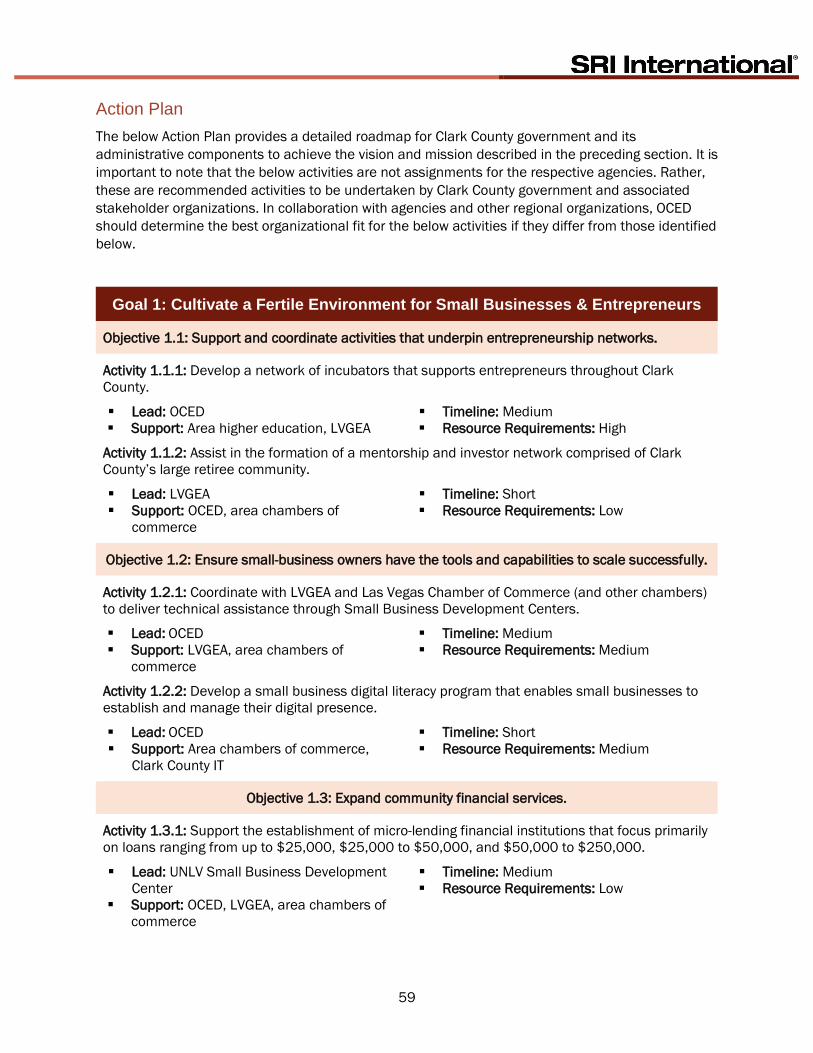
59
Action Plan
The below Action Plan provides a detailed roadmap for Clark County government and its
administrative components to achieve the vision and mission described in the preceding section. It is
important to note that the below activities are not assignments for the respective agencies. Rather,
these are recommended activities to be undertaken by Clark County government and associated
stakeholder organizations. In collaboration with agencies and other regional organizations, OCED
should determine the best organizational fit for the below activities if they differ from those identified
below.
Goal 1: Cultivate a Fertile Environment for Small Businesses & Entrepreneurs
Objective 1.1: Support and coordinate activities that underpin entrepreneurship networks.
Activity 1.1.1: Develop a network of incubators that supports entrepreneurs throughout Clark
County.
▪ Lead: OCED
▪ Support: Area higher education, LVGEA
▪ Timeline: Medium
▪ Resource Requirements: High
Activity 1.1.2: Assist in the formation of a mentorship and investor network comprised of Clark
County’s large retiree community.
▪ Lead: LVGEA
▪ Support: OCED, area chambers of
commerce
▪ Timeline: Short
▪ Resource Requirements: Low
Objective 1.2: Ensure small-business owners have the tools and capabilities to scale successfully.
Activity 1.2.1: Coordinate with LVGEA and Las Vegas Chamber of Commerce (and other chambers)
to deliver technical assistance through Small Business Development Centers.
▪ Lead: OCED ▪ Support: LVGEA, area chambers of
commerce
▪ Timeline: Medium
▪ Resource Requirements: Medium
Activity 1.2.2: Develop a small business digital literacy program that enables small businesses to
establish and manage their digital presence.
▪ Lead: OCED ▪ Support: Area chambers of commerce,
Clark County IT
▪ Timeline: Short
▪ Resource Requirements: Medium
Objective 1.3: Expand community financial services.
Activity 1.3.1: Support the establishment of micro-lending financial institutions that focus primarily
on loans ranging from up to $25,000, $25,000 to $50,000, and $50,000 to $250,000.
▪ Lead: UNLV Small Business Development
Center
▪ Support: OCED, LVGEA, area chambers of
commerce
▪ Timeline: Medium
▪ Resource Requirements: Low
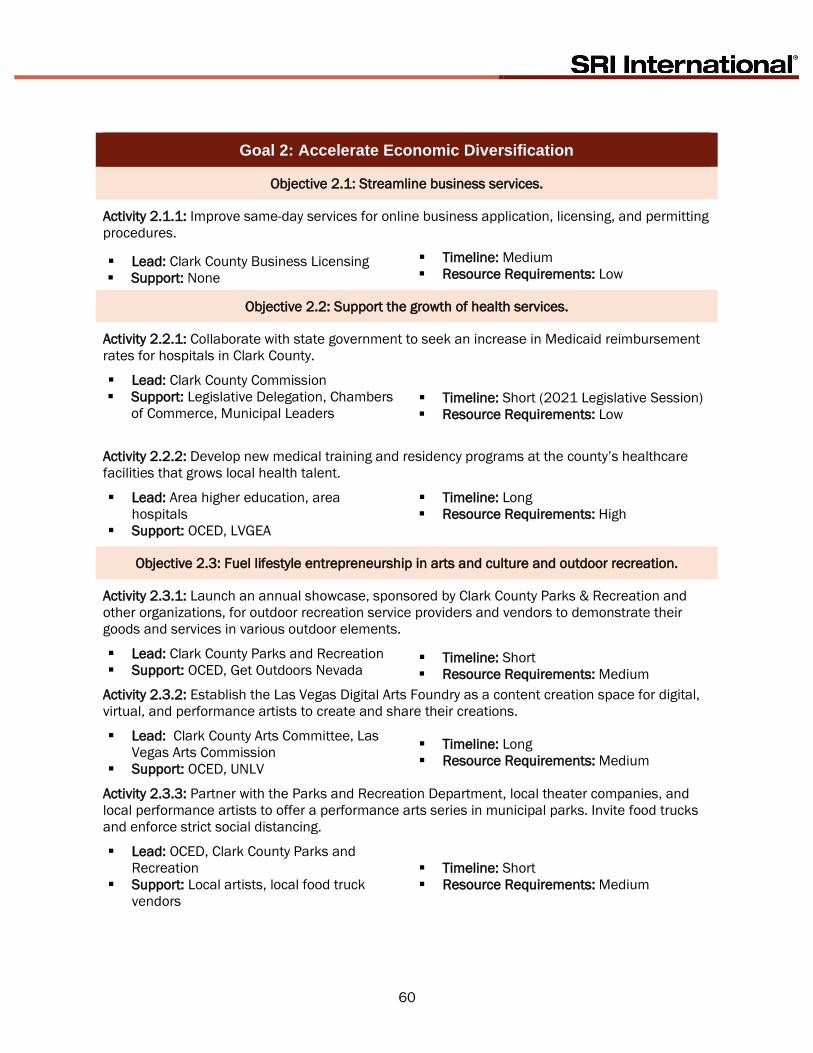
60
Goal 2: Accelerate Economic Diversification
Objective 2.1: Streamline business services.
Activity 2.1.1: Improve same-day services for online business application, licensing, and permitting
procedures.
▪ Lead: Clark County Business Licensing
▪ Support: None
▪ Timeline: Medium
▪ Resource Requirements: Low
Objective 2.2: Support the growth of health services.
Activity 2.2.1: Collaborate with state government to seek an increase in Medicaid reimbursement
rates for hospitals in Clark County.
▪ Lead: Clark County Commission
▪ Support: Legislative Delegation, Chambers
of Commerce, Municipal Leaders
▪ Timeline: Short (2021 Legislative Session)
▪ Resource Requirements: Low
Activity 2.2.2: Develop new medical training and residency programs at the county’s healthcare
facilities that grows local health talent.
▪ Lead: Area higher education, area
hospitals
▪ Support: OCED, LVGEA
▪ Timeline: Long
▪ Resource Requirements: High
Objective 2.3: Fuel lifestyle entrepreneurship in arts and culture and outdoor recreation.
Activity 2.3.1: Launch an annual showcase, sponsored by Clark County Parks & Recreation and
other organizations, for outdoor recreation service providers and vendors to demonstrate their
goods and services in various outdoor elements.
▪ Lead: Clark County Parks and Recreation
▪ Support: OCED, Get Outdoors Nevada ▪ Timeline: Short
▪ Resource Requirements: Medium
Activity 2.3.2: Establish the Las Vegas Digital Arts Foundry as a content creation space for digital,
virtual, and performance artists to create and share their creations.
▪ Lead: Clark County Arts Committee, Las
Vegas Arts Commission
▪ Support: OCED, UNLV
▪ Timeline: Long
▪ Resource Requirements: Medium
Activity 2.3.3: Partner with the Parks and Recreation Department, local theater companies, and
local performance artists to offer a performance arts series in municipal parks. Invite food trucks
and enforce strict social distancing.
▪ Lead: OCED, Clark County Parks and
Recreation
▪ Support: Local artists, local food truck
vendors
▪ Timeline: Short
▪ Resource Requirements: Medium

61
Activity 2.3.4: Establish “Digital Downtown Arts” by collaborating with selected properties to allow
digital projection of large scale, interactive murals highlighting local artists and incorporating
augmented reality to be enjoyed by viewers with mobile devices.
▪ Lead: Clark County Arts Committee, Las
Vegas Arts Commission
▪ Support: OCED, local artists
▪ Timeline: Short
▪ Resource Requirements: Low
Activity 2.3.5: Identify large vacant parking lots to be used for theaters and performers to set up
drive-through performances and movies.
▪ Lead: OCED
▪ Support: Department of Comprehensive
Planning
▪ Timeline: Short
▪ Resource Requirements: Low
Goal 3: Integrate the Workforce Ecosystem
Objective 3.1: Improve access to diverse choices for training and education for workers and
employers, particularly among the region’s underserved communities.
Activity 3.1.1: Host job fairs and information exchanges within underserved communities and
unincorporated areas of Clark County.
▪ Lead: OCED
▪ Support: Area chambers of commerce ▪ Timeline: Short
▪ Resource Requirements: Low
Activity 3.1.2: Increase access to high-quality career counseling for high school and community
college students.
▪ Lead: CCSD
▪ Support: Area higher education ▪ Timeline: Medium
▪ Resource Requirements: Medium
Objective 3.2: Promote innovative remote workforce programs.
Activity 3.2.1: Deploy individualized micro workstations at the county’s public libraries that provide
workers with Wi-Fi-enabled, personal workplaces.
▪ Lead: Las Vegas-Clark County Library
District
▪ Support: None
▪ Timeline: Medium
▪ Resource Requirements: High
Goal 4: Mobilize Stakeholders around Community-Wide Initiatives
Objective 4.1: Reinforce strong relationships among Clark County and municipal governments.
Activity 4.1.1: Host regional leadership program for county, municipal, and regional officials to
build leadership skills and relationships between different stakeholders.
▪ Lead: OCED ▪ Support: None
▪ Timeline: Short
▪ Resource Requirements: Low
Activity 4.1.2: Develop county toolkit for economic preparedness.

62
▪ Lead: OCED ▪ Support: Clark County and municipal
government departments
▪ Timeline: Medium
▪ Resource Requirements: Medium
Objective 4.2: Build fundraising capacity among regional organizations.
Activity 4.2.1: Contract with a grant-writing training firm to offer workshops for community
organizations and stakeholders in grant identification and writing.
▪ Lead: OCED ▪ Support: Non-profit grant-writing training
firm
▪ Timeline: Short
▪ Resource Requirements: Low
Activity 4.2.2: Contract with a non-profit training firm to develop training courses for community
organizations and others in non-profit management and fundraising.
▪ Lead: OCED ▪ Support: Non-profit training firm
▪ Timeline: Short
▪ Resource Requirements: Low
Goal 5: Promote Community-Centered Design of the Built Environment
Objective 5.1: Implement smart city innovation throughout the county to serve residents and
visitors.
Activity 5.1.1: Build “smart” streetlamps in low-income neighborhoods and public parks that
provide free Wi-Fi hotspots to help bridge the digital divide.
▪ Lead: OCED, Department of
Comprehensive Planning ▪ Support: Las Vegas Innovation District
▪ Timeline: Long
▪ Resource Requirements: High
Activity 5.1.2: Scale technologies from the Las Vegas Innovation District to other communities
throughout the county.
▪ Lead: OCED, Department of
Comprehensive Planning ▪ Support: Las Vegas Innovation District
▪ Timeline: Long
▪ Resource Requirements: High
Objective 5.2: Improve and diversify access to mobility options.
Activity 5.2.1: Partner with Clark County GIS Management Office to map unincorporated Clark
County for walkability based on proximity to services and businesses.
▪ Lead: OCED, GIS Management Office ▪ Support: None
▪ Timeline: Short
▪ Resource Requirements: Low
Activity 5.2.2: Support continued improvement of alternative transit options, including Regional
Transportation Commission bikeshares, bus rapid transit, and walkable transit-oriented
developments.
▪ Lead: OCED, RTC
▪ Support: None
▪ Timeline: Long
▪ Resource Requirements: High
Objective 5.3: Adopt and promote sustainable practices in energy and infrastructure.

63
Activity 5.3.1: Actively support NV Energy in the development of an electric vehicle charging
network throughout Clark County.
▪ Lead: OCED ▪ Support: NV Energy
▪ Timeline: Long
▪ Resource Requirements: Medium
Activity 5.3.2: Expand alternative recycling options in Clark County and investigate electric vehicle
battery recycling as an emerging industry.
▪ Lead: OCED, NV Energy ▪ Support: Nevada Department of
Environmental Protection
▪ Timeline: Long
▪ Resource Requirements: High
Objective 5.4: Encourage revitalization of distressed areas of unincorporated Clark County.
Activity 5.4.1: Partner with the Southern Nevada Regional Housing Authority (SNRHA) to
implement a home rehabilitation program for residents living in distressed neighborhoods.
▪ Lead: SNRHA ▪ Support: OCED
▪ Timeline: Medium
▪ Resource Requirements: High
Goal 6: Ensure Equitable Access to Resources
Objective 6.1: Advance equity in both the workforce and the business community.
Activity 6.1.1: Conduct study to identify gaps in transportation access to regional charter, magnet,
and CTE schools for disadvantaged students and their families.
▪ Lead: CCSD
▪ Support: RTC ▪ Timeline: Medium
▪ Resource Requirements: Medium
Activity 6.1.2: Partner with philanthropic groups, community services, and local chambers of
commerce to establish a Clark County Community Equity Task Force.
▪ Lead: OCED ▪ Support: Urban, Hispanic, Las Vegas, and
Asian chambers of commerce, local
philanthropic groups, community services
departments
▪ Timeline: Short
▪ Resource Requirements: Low
Objective 6.2: Sustain and expand streamlined access to county services for residents and
businesses.
Activity 6.2.1: Develop a mobile app that brings together social services for county residents,
allowing them to submit requests and required documentation to obtain county and municipal
services. The app could expand to include state services in partnership with state agencies.
▪ Lead: OCED, Clark County IT ▪ Support: Municipal governments, Nevada
Division of Welfare and Social Services
▪ Timeline: Medium
▪ Resource Requirements: Low

64
Visionary Opportunities for Clark County
SRI has identified clear opportunities for Clark County to pursue a select number of signature ideas:
high-profile projects with powerful economic and social spillovers that will also serve to build a
distinct image for the county as a rich, dynamic, complex community.
Red Rock Canyon/Spring Mountain Arts & Entertainment Venue
Red Rock Canyon National Conservation Area and the adjacent Spring Mountain Ranch are two of
the most spectacular natural assets in Southern Nevada, enjoyed at present for trails, scenery, and
outdoor events (including a summer theater festival). Working in partnership with the Bureau of Land
Management (BLM), the Southern Nevada Conservancy (SNC), and Nevada State Parks, Clark
County should take the lead in the funding, design, and construction of a permanent, year-round arts
and entertainment venue at a location within these amenities. The venue would be modeled on a
well-known example in Colorado, the Red Rocks Amphitheatre, an acoustically perfect outdoor
concert arena in a state park in the mountains outside of Denver, Colorado. Another model is the
Wolf Trap, an outdoor venue in Virginia near the Washington D.C. metro area, operated in
partnership with the National Park Service.
The venue proposed here would not be as ambitious as these other arenas, but rather would be
designed as an intimate place for local artists and performers to reach a local audience. It would be
a place that enriches the lives of Clark County residents, where they could commune with the stars in
the cool nighttime air of the desert, while enjoying performances by some of the talented performers
that live in Southern Nevada’s communities. Its design and construction have the potential be a
showcase for the substantial architectural and design talent in Southern Nevada.
Such a project requires political will as much as financing and can only be achieved by working
carefully with all stakeholders. The project would have to take account of the sensitive ecosystem of
the park and not impair other uses. But when achieved, it could be a hallmark for the vibrant creative
community that lives in the county.
Vegas Valley Rim Trail & Arts in the Desert
In the state of Nevada, 86% of land is public land managed by the federal government. In addition to
indoor entertainment found in Las Vegas, Southern Nevada boasts many outdoor recreation
attractions, such as Lake Mead, Red Rock Canyon, and Mount Charleston, which provide year-round
opportunities to enjoy the great outdoors. Trails and outdoor recreation are a great boon to the local
community, economically and socially.
As Nevada works to diversify its economy, the outdoor recreation workforce has grown. According to
the Outdoors Industry Association, the outdoors industry in Nevada generates $12.6 billion in
consumer spending, 87,000 jobs, $4 billion in wages and salaries, and $1.1 billion in local and state
tax revenue. Outdoor recreation ranks third behind only gaming and healthcare in sustaining jobs in
Nevada. Trails are attractive to nearby businesses and residents, increasing property values. They
can also promote healthy activity and create a sense of community.
The Vegas Valley Rim trail is a long-running project that aims to connect 113-miles of trails around
the Las Vegas Valley. In addition to beautiful natural attractions, Clark County is home to a small but
vibrant art community. First Friday Arts Showcase is a well-known monthly event that showcases
local arts and artists that takes place in the Las Vegas Art District, also known as 18b.
This signature idea would focus on completing and advertising the Vegas Valley Rim trail, as well as
supporting local arts culture. The initial stage would involve partnering with Get Outdoors Nevada

65
and the Clark County Comprehensive Planning Department to complete the trail. For the grand
opening, Clark County could obtain microgrants to fund a partnership between local artists, the First
Friday Foundation, and the College of Southern Nevada to design and create temporary and
permanent art installations along the completed Vegas Valley Rim Trail. Installations would be a mix
of physical sculptures and digital arts with the aim of low environmental impacts. Sculptures and
digital art performances would attract visitors to experience the natural wonders of Clark County
while supporting local artists struggling due to COVID-19. Art and artists, as well as outdoor
recreation, can improve quality of life for residents, while also attracting new visitors. Art installations
in the desert would be social media friendly and promote healthy activity.
Multi-Modal & Advanced Manufacturing Park
Clark County occupies a competitive location in the western United States, with proximity to several
major urban areas in the West, and is situated in a competitive, business-friendly state.
Strengthening connections with these urban areas, as well as other regions of Nevada, will increase
Clark County’s attractiveness as a place to produce and distribute goods for western markets and
beyond. The development of a multi-modal transportation hub in southern Clark County would build
these connections and cement Southern Nevada as a major logistics hub in the western United
States. Co-locating this hub with an advanced manufacturing park would further increase the
county’s attractiveness as not only a place to distribute goods, but also a place to produce them.
Existing studies have identified Southern Nevada as a competitive location for logistics and
manufacturing in the western United States, and the COVID-19 pandemic and its impact on national
and global supply chains has increased the attractiveness of expanded U.S.-based manufacturing
capacity. Establishing a multi-modal and advanced manufacturing park would provide further
opportunity for Clark County to diversify the regional economy while providing employment
opportunities for individuals at various education levels, including those with post-secondary
credentials, two-year and four-year degrees.
The development of a multi-modal and advanced manufacturing park would require collaboration
between local and state government, particularly as the park relates to infrastructure development
(e.g., highway and railway expansion) with considerable financial requirements.
Housing Southern Nevada’s Homeless
According to analysis by the U.S. Department of Housing and Urban Development’s 2018 Point in
Time (PIT) homelessness count by Security.org, the Las Vegas metro area ranked seventh in the
United States for the number of homeless individuals per 100,000 population. While data from
recent years indicate that Las Vegas has been successful at reducing the rate of homelessness in
the region, Las Vegas remains among the U.S. cities with the highest rates of homelessness.73
The 2019 Southern Nevada Homeless Census found that roughly 60% of the region’s homeless
population was unsheltered, and more than half of those who were unsheltered were living on the
street, outdoors, in vehicles, in the desert, or in an encampment.74 Likewise, between 2018 and
2019, while the region’s overall rate of homelessness declined, the rate of those who became
chronically homeless increased 23%, representing 11% of the region’s total homeless population.75
The loss of a job / unemployment and substance abuse were cited as the two most common causes
for homelessness in Southern Nevada, with mental illnesses also cited as a common reason.76 These
statistics indicate the need for a comprehensive approach to addressing Southern Nevada’s
homelessness.

66
Cities across the United States have begun experimenting with new interventions for servicing their
homeless populations. Approaches differ from offering wrap-around services for homeless
populations, to providing housing, or some combination of the two. A notable example can be seen in
Dallas, Texas, where a community of “tiny homes” was built in a neighborhood of the city to house
50 homeless individuals. The community was built in partnership between Dallas County, the City of
Dallas, and the non-profit CitySquare, which manages the homes in the community.77 Residents in
the neighborhood are offered several services, including free medical care and counseling, as well as
a place in one of the community’s tiny homes. According to estimates by CitySquare, the average
cost of a homeless individual in the community was $40,000 per year, whereas the cost to provide
shelter in a tiny house was roughly $15,000, making the community a cost-effective solution for the
county’s unsheltered homeless population.78
A similar approach to Clark County’s homeless population will require collaboration between local
governments and the various non-profit organizations that have established a reputation with
Southern Nevada’s homeless population, such as HELP of Southern Nevada, Help Hope Home, or
Built for Zero Southern Nevada. While any one of these organizations could assist in the
management of the proposed communities, the Clark County government could assist by providing
the land and supplemental resources for the community, including partial funding for the shelters as
well as the services provided within the community.
Fostering Clark County’s Technology Entrepreneurs
As part of the region’s efforts to diversify its local economy, regional-, county-, and municipal-level
organizations have sought to encourage the growth of home-grown technology talent. Stakeholders
throughout Clark County have enacted different policies and programs, including new programs at
the region’s two- and four-year higher education institutions, as well as tech-centered programs at
CCSD schools. While such programs are effective for developing individuals who can work in the
technology industry, they are less effective at providing opportunities for local talent to develop and
commercialize new technologies.
There have been preliminary efforts to fill this gap in Southern Nevada, notably through the
establishment of UNLV’s Black Fire Innovation campus. However, Black Fire Innovation remains
focused exclusively on the gaming, hospitality, and entertainment industries. While these industries
represent the dominant employers for the region, opportunities for technology entrepreneurs that
are interested in other industries to develop and commercialize their technologies will better enable
Clark County to diversify its economy. Similarly, a dedicated technology incubator in Southern
Nevada will allow the region to retain the existing educated workers who would likely approach an
incubator to develop a new technology, rather than relocate to other metro areas in the western
United States.
Launching a technology incubator in Southern Nevada will require Clark County to partner with
several other organizations and stakeholders in the regional economy. An obvious partner is UNLV,
which, as the region’s flagship university, serves as a natural hub for research, development, and
innovation activities in Clark County. StartupNV, a non-profit organization dedicated to
entrepreneurship and angel investment in Nevada, would be an effective managing organization for
establishing and growing the proposed technology incubator. To fund the development of this
incubator, Clark County will likely need to pool resources from these organizations, in addition to
regional economic development organizations like LVGEA.

67
Evaluation
Framework
Mapping the Future
An Analysis of Clark County’s
Communities and Economy
Valley of Fire in Clark County, Nevada. Photo Courtesy of Andrew Kearns/Flickr

68
Evaluation Framework
Performance Metrics
Goal 1 Performance Metrics: Cultivate a Fertile Environment for Small Businesses &
Entrepreneurs
Metric Data Source
Number of incubators established in Clark County OCED
Number of mentors recruited for retiree mentorship
and investor network
OCED
Number of activities promoting entrepreneurship
and business education
LVGEA
New capital investment LVGEA
Goal 2 Performance Metrics: Accelerate Economic Diversification
Metric Data Source
Number of medical residency and fellowship
programs established at Clark County hospitals
Southern Nevada Health District
Goal 3 Performance Metrics: Integrate the Workforce Ecosystem
Metric Data Source
Number of job fairs held OCED
Number of employers represented at job fairs OCED
Number of attendees at job fairs OCED
Number of schools equipped with career counselors CCSD
Number of micro-workstations installed at county
public libraries
OCED
Goal 4 Performance Metrics: Mobilize Stakeholders around Community-Wide Initiatives
Metric Data Source
Number of attendees at regional leadership program OCED
Number of attendees at grant-writing training
workshop
OCED
Number of attendees at non-profit training workshop OCED
Number of grants written OCED
Number of grants obtained OCED

69
Goal 5 Performance Metrics: Promote Community-Centered Design of the Built
Environment
Metric Data Source
Number of new charging stations NV Energy
Number of cars using charging stations NV Energy
Number of new bikeshare stations and bikes RTC
Number of bikeshare rides and downloads of
bikeshare application
RTC
Number of new BRT rides RTC
Number of houses rehabilitated SNRHA
Number of smart streetlamps installed Department of Comprehensive Planning
Number of smart technology applications scaled
from Las Vegas Innovation District
Goal 6 Performance Metrics: Ensure Equitable Access to Resources
Metric Data Source
Number of documents submitted through
application
Clark County IT
Number of application downloads Clark County IT
Number of services made accessible through
application
Clark County IT, Nevada Division of Welfare and
Social Services

70
Interviewee &
Participant List Appendix A

71
Appendix A-1: Interviewee & Participant List
Nancy Amundsen, Clark County Government
Derek Armstrong, City of Henderson
Roben Armstrong, McCarran International
Airport
Mauricia Baca, Get Outdoors Nevada
Larry Brown, Clark County Board of
Commissioners
Dr. Nancy Brune, Guinn Center for Policy
Priorities
Jessica Colvin, Clark County Government
John Curran, Dapper Companies
Richard Derrick, City of Henderson
Kenneth Evans, Urban Chamber of Commerce
James B. Gibson, Clark County Board of
Commissioners
Peter Guzman, Latin Chamber of Commerce
Nadia Hansen, Clark County Government
Marci Henson, Clark County Government
Daniel Hernandez, Clark County Government
Jacqueline Holloway, Clark County
Government
Justin Jones, Clark County Board of
Commissioners
Ryann Juden, City of North Las Vegas
Yolanda King, Clark County Government
Marilyn Kirkpatrick, Clark County Board of
Commissioners
Phil Klevorick, Clark County Government
John Jay Lee, City of North Las Vegas
Debra March, City of Henderson
Zachary Miles, University of Nevada Las Vegas
Paul Moradkhan, Las Vegas Chamber of
Commerce
Michael Naft, Clark County Board of
Commissioners
Kevin Schiller, Clark County Board of
Commissioners
Tick Segerblom, Clark County Board of
Commissioners
Les Lee Shell, Clark County Government
Jerry Stueve, Clark County Government
Randall Tarr, Clark County Government
Jeffrey Wells, Clark County Government
Appendix A-2: Interview Protocols
The following interview protocols provided the outline for each interview or stakeholder session, with
questions in bold representing the most important topics of interest. Interviewees were not
necessarily asked every single question due to time constraints, and follow-up questions beyond the
interview protocols listed here were asked as needed to clarify responses or better understand an
interviewee’s area of expertise. All interviews began with a summary of the project and a disclaimer
statement about how information the interviewee provided would be used.

72
Introduction and Disclaimer
SRI International’s Center for Innovation Strategy and Policy (CISP) is working with the Clark County
Department of Community and Economic Development to create an economic and community
development strategy for the county. As part of this project, we are conducting a wide range of
interviews to help assess the region’s economic performance, challenges, opportunities, and
strategic possibilities for the future. We are speaking with a diverse set of stakeholders, including
economic development practitioners, government agencies, educators and administrators, and
industry representatives to develop a balanced set of perspectives. We are also interested in
speaking with Clark County staff and elected officials.
Thank you for agreeing to participate in the project. The questions we will ask are intended to gather
information about your understanding of the county’s current economic situation, policies, and
practices. We will be taking notes but will be synthesizing feedback from the interviews and will not
attribute any comments to any specific individual in a public report. Do you have any questions
before we begin?
QUESTIONS FOR COMMISSIONERS
1. What are your main expectations, your most important priorities, for an economic and community
development plan for Clark County?
2. Are there any issues that you consider to be off-limits?
3. What are some of the problems or challenges you foresee in this project that SRI should be aware
of?
GENERAL QUESTIONS
1. Tell us about your organization and position.
2. How would you characterize your organization’s mission? What role does it play in the
county’s economy?
3. From the point of view of your organization, what are Clark County’s greatest assets?
4. Its greatest weaknesses?
5. From the perspective of your organization, how do you see the COVID-19 pandemic affecting
Clark County over the short term? The long term?
6. What are one or two policies, programs, or initiatives that you believe Clark County should
implement to effectively emerge from the COVID-19 pandemic?
7. What does a successful Clark County look like post-COVID-19? [e.g., more diversified; better
health options; better workforce training institutions; etc.]
8. What is your familiarity with the current state of economic development in the county? Does
it have any influence on your job?
9. What policies, programs, or initiatives would you like to see emphasized as part of the
community and economic development strategy for Clark County?

73
10. What policies, programs, or initiatives do you see as being out-of-scope for the community
and economic development strategy?
11. From the perspective of your organization, how important is collaboration with economic
development-focused organizations, such as the municipal government agencies, chambers
of commerce, and the Department of Community and Economic Development?
12. Are there any principles, guidelines, or documents that guide the activities you perform that
you think would be useful for this community and economic development strategy?
13. What role do you see your organization playing in future economic development projects in
Clark County?
14. In general, how would you describe the environment for doing business in Clark County
[permitting, taxes, etc.]?
15. Finally, is there anything else you believe is important for us to know for this project?
TOPICAL QUESTIONS
Workforce-Focused Questions
1. How does your organization market Clark County’s workforce and skill set to prospective
employers? What specific skills or attributes of the county’s workforce do employers find
valuable?
2. Are there specific business/industries related to your organization that have challenges in
hiring the workers they need? What occupations, skill sets, or areas of technical expertise do
your local employers say are in highest demand and/or least supply?
3. How would you judge the quality of the links between workforce institutions and employers in
Clark County? Can you name any examples of particularly innovative or successful
partnerships between universities/community colleges and private business?
Quality of Life and Culture
4. What kind of cultural and recreational assets does Clark County have that residents can
enjoy? What could make the region more attractive to more residents?
5. How does the region fare in areas such as health, safety, and crime? What could be
improved?
Environment and Infrastructure
6. Are there any environmental pressures that could constrain the region’s growth or jeopardize
its economy? [Prompts: water scarcity and management, heat waves, land use]
7. Are there any areas where Clark County has or could show environmental leadership?
8. How would you rate the quality of the region’s infrastructure? What challenges or
opportunities does it face in terms of transportation, energy, utilities, etc.?
Innovation-Focused Questions

74
9. (Idea Generation) What sectors or industries in the Clark County are known for performing a
lot of innovation, R&D, and technology development, and why?
10. (Innovation Culture) How would you characterize the entrepreneurial culture in Clark County?
Are people willing to take risks and start new companies?
11. (Risk Capital) Is there sufficient risk capital available in the region to entrepreneurs to
advance their technologies and get to market? Do startups have access to either public or
private seed funding, venture capital?
12. (Programs): What programs/resources in Clark County support innovation, R&D, and tech-
based development? (e.g., incubators, special VC/financing programs, university technology
transfer offices, etc.)? How well are these programs doing? What gaps are there that need to
be improved upon?
13. (Talent) Where do startups go to recruit skilled workers in the area? Are they able to find the
employees with the technical skills they need?
14. (Talent) Do entrepreneurs and startups know how to scale their businesses successfully? Is
there a shortage of managerial talent in the area?
15. (Networks) In general, how would you rate the linkages among universities, research
institutions, and entrepreneurs/the private sector in the area?
16. (Networks) Where can entrepreneurs and startups go for mentorship or advice in Clark
County [or specific metro/micro areas]? Are there experienced entrepreneurs or venture
capitalists who are available to serve as mentors for incubators, accelerators?

75
Stakeholder
Engagement Exercises Appendix B

76
Appendix B: Stakeholder Engagement Exercises
Community participation is a vital part of the Strategic Plan creation process, especially in the
crafting of a vision statement and the generation of goals for the County. In addition to interviews
with individual community members, visioning exercises were distributed to stakeholders. These
exercises were designed to collect community input on a vision for Clark County and elicit priorities
for the Strategic Plan.
Envisioning the Needs of a Diverse Population – Participants were divided into groups, with each
group receiving a “persona”—a hypothetical individual or household representative of a different
slice of the region’s current or prospective population. Each group was asked to consider the
potential goals, motivations, and concerns of their persona and determine what Clark County could
offer to help meet the needs of the persona. Common themes and answers were extracted and
categorized to generate a vision and mission for Clark County.
Additional
Visualizations Appendix C

77
Additional
Visualizations Appendix C
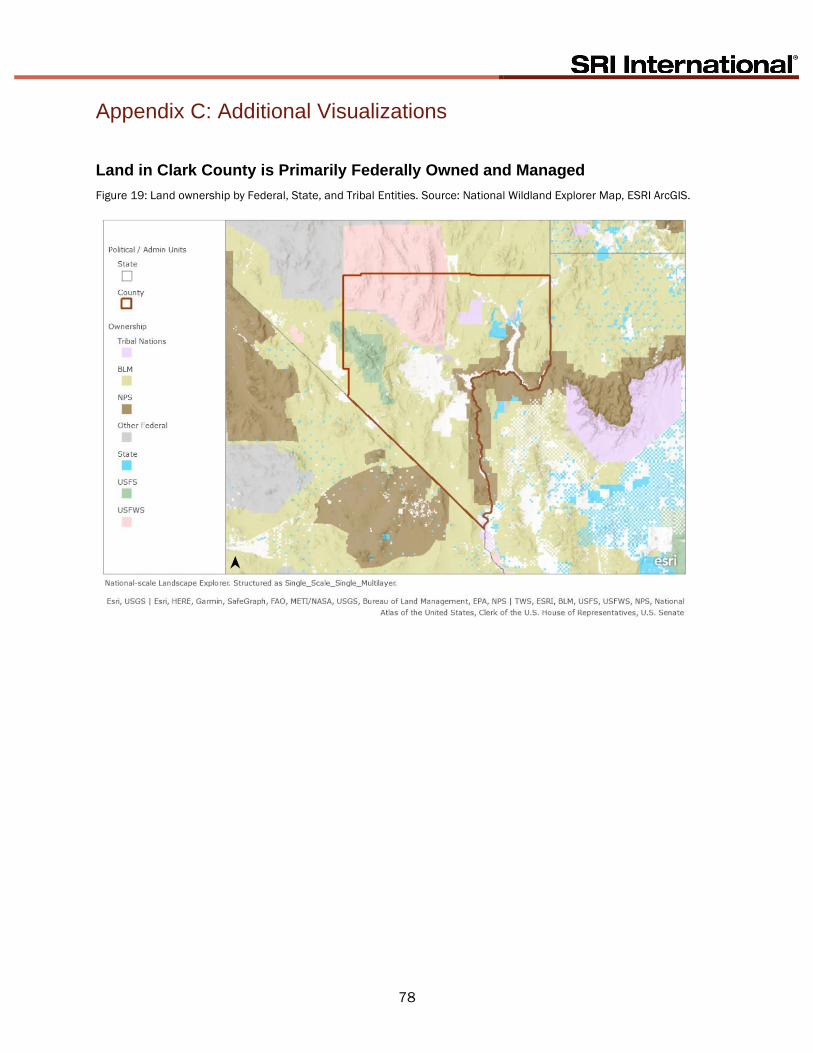
78
Appendix C: Additional Visualizations
Land in Clark County is Primarily Federally Owned and Managed
Figure 19: Land ownership by Federal, State, and Tribal Entities. Source: National Wildland Explorer Map, ESRI ArcGIS.
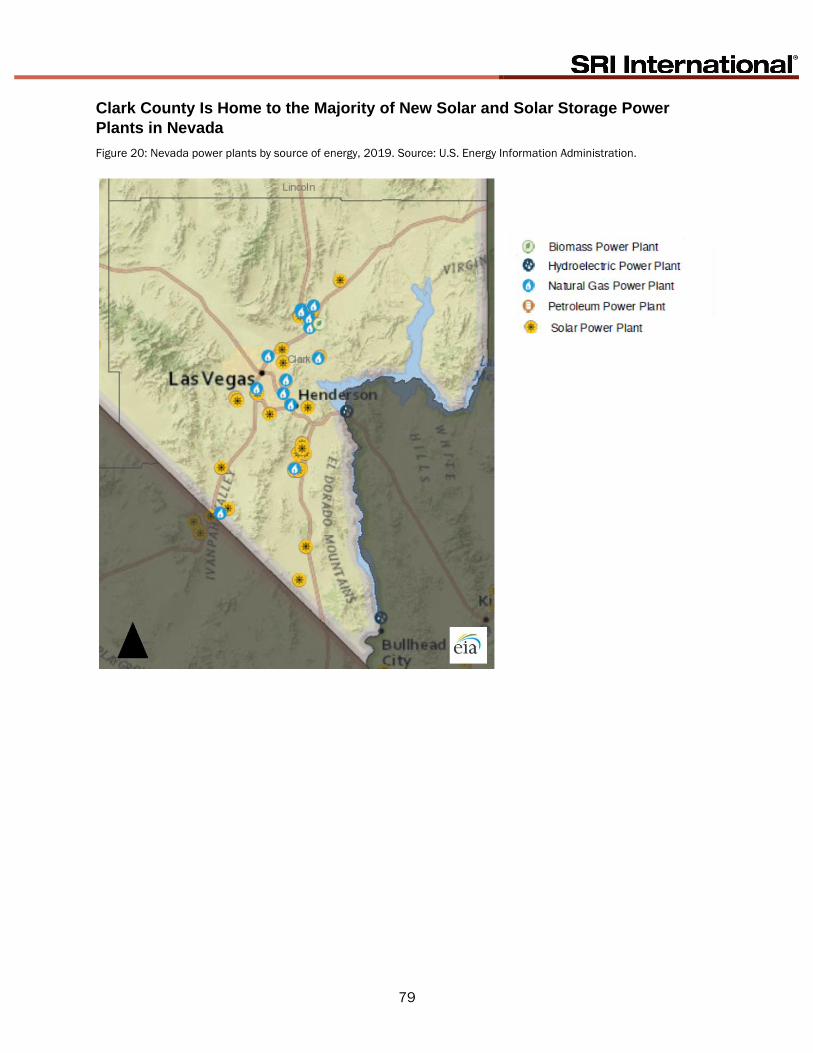
79
Clark County Is Home to the Majority of New Solar and Solar Storage Power
Plants in Nevada
Figure 20: Nevada power plants by source of energy, 2019. Source: U.S. Energy Information Administration.

80
Southern Clark County has Potential for Wind Energy Development
Figure 21: Wind Resource Potential in Southern Nevada, 2003. Source: U.S. Department of Energy.
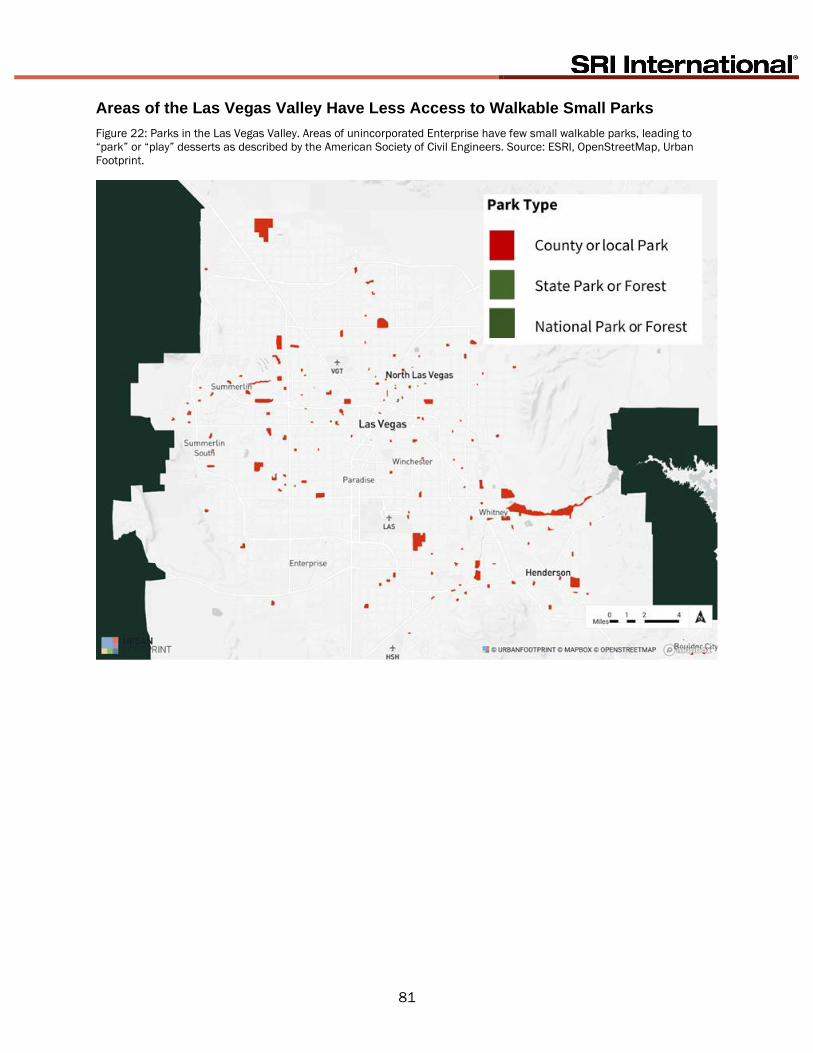
81
Areas of the Las Vegas Valley Have Less Access to Walkable Small Parks
Figure 22: Parks in the Las Vegas Valley. Areas of unincorporated Enterprise have few small walkable parks, leading to
“park” or “play” desserts as described by the American Society of Civil Engineers. Source: ESRI, OpenStreetMap, Urban
Footprint.

82
Notes

83
Notes
1 “Distressed Communities Index.” Economic Innovation Group. Accessed July 2020. https://eig.org/dci/2018-
dci-map-national-counties-map# 2 “State Indicators.” National Center for Science and Engineering Statistics. Accessed July 2020.
https://ncses.nsf.gov/indicators/states 3 “NSHE Awards Conferred.” Institutional Research. Accessed July 2020.
https://ir.nevada.edu/dashboard.php?d=awards_conferred 4 “Clark County Comprehensive Master Plan.” Clark County Comprehensive Planning Department. Accessed
July 2020.
https://www.clarkcountynv.gov/government/departments/comprehensive_planning_department/divi
sions/advanced_planning_division/comprehensive_master_plan.php#outer-5471 5 “Visitor Spending Effects - Economic Contributions of National Park Visitor Spending.” National Park Service.
Accessed July 2020 ““https://www.nps.gov/subjects/socialscience/vse.htm 6 “LVMPD and BLM Officials Combatting a Spike in Illegal Activity on Public Lands.” Las Vegas Metropolitan
Police Department. Accessed July 2020. https://www.lvmpd.com/en-
us/Press%20Releases/PO%20063%2004-06-20.pdf 7 “Trails Information.” Clark County Parks & Recreation Department. Accessed July 2020.
https://www.clarkcountynv.gov/government/departments/parks___recreation/parks___trails/trails_i
nformation.php 8 “Southern Nevada Public Lands Management Act (SNPLMA).” Bureau of Land Management. Accessed July
2020.
https://www.blm.gov/sites/blm.gov/files/documents/files/SNPLMA_New%20About%20Page.pdf 9 “2018 Nevada Infrastructure Report Card.” American Society of Civil Engineers. Accessed July 2020.
https://www.infrastructurereportcard.org/state-item/nevada/ 10 “Average Travel Time to Work in the United States by Metro Area.” U.S. Census Bureau. Accessed July 2020.
https://www.census.gov/library/visualizations/interactive/work-travel-time.html 11 “Existing Residential Properties Unincorporated Clark County.” Clark County Department of Comprehensive
Planning. Accessed July 2020.
https://cms8.revize.com/revize/clarknv/Comprehensive%20Planning/Map/Miscellaneous%20Maps
%20of%20Interest/Residential_Existing_LVV.pdf 12 “Passengers.” Clark County Department of Aviation Statistics. Accessed July 2020.
https://www.mccarran.com/Business/Statistics?id=7429 13 “McCarran International Airport.” Online Nevada Encyclopedia. Accessed July 2020.
http://www.onlinenevada.org/articles/mccarran-international-airport 14 “Talk of new Las Vegas airport in the air again.” Travel Weekly. Accessed July 2020.
https://www.travelweekly.com/North-America-Travel/Insights/Talk-of-new-Las-Vegas-airport-in-the-air-
again 15 “Nevada State Profile and Energy Analysis.” U.S. Energy Information Administration. Accessed July 2020.
https://www.eia.gov/state/analysis.php?sid=NV#35 16 “Four states updated their renewable portfolio standards in the first half of 2019.” U.S. Energy Information
Administration. Accessed July 2020. https://www.eia.gov/todayinenergy/detail.php?id=39953 17 “Sisolak signs milestone bill increasing renewable portfolio standard to 50 percent by 2030.” Nevada
Independent. Accessed July 2020. https://thenevadaindependent.com/article/sisolak-signs-
milestone-bill-increasing-renewable-portfolio-standard-to-50-percent-by-2030 18 “Why Las Vegas.” Innovate Las Vegas. Accessed 2020. https://innovate.vegas/Why-Las-Vegas 19 “Driving Innovation in Gaming, Hospitality, & Entertainment.” Blackfire Innovation. Accessed July 2020.
http://www.blackfireinnovation.com/ 20 “NSHE Awards Conferred.” Institutional Research. Accessed July 2020.
https://ir.nevada.edu/dashboard.php?d=awards_conferred 21 Ibid. 22 “CCSD graduation rate surpasses 85 percent.” Clark County School District. July 2020.
https://newsroom.ccsd.net/ccsd-graduation-rate-surpasses-85-
percent/#:~:text=02%20Jan%20CCSD%20graduation%20rate%20surpasses%2085%20percent&text

84
=The%20Clark%20County%20School%20District's,the%20Nevada%20Department%20of%20Educati
on. 23 “Nevada Accountability Report Card.” Nevada Department of Education. Accessed July 2020.
http://www.nevadareportcard.com/DI/nv/2019 ;
Average ACT Scores by State, Graduating Class of 2019. ACT.org. Accessed July 2020.
https://www.act.org/content/dam/act/secured/documents/cccr-2019/Average-Scores-by-State.pdf 24 “Nevada Accountability Report Card.” Nevada Department of Education. Accessed July 2020.
http://www.nevadareportcard.com/DI/nv/clark/2019 25 “Focus 2024: Clark County School District’s Five-Year Strategic Plan.” Clark County School District. Accessed
July 2020. https://newsroom.ccsd.net/wp-content/uploads/2019/02/Focus-2024.pdf 26 “New program pilots innovative teacher recruitment and retention.” Clark County School District. Accessed
July 2020. https://newsroom.ccsd.net/new-program-pilots-innovative-teacher-recruitment-and-
retention/ 27 “Focus 2024: Clark County School District’s Five-Year Strategic Plan.” Clark County School District. Accessed
July 2020. https://newsroom.ccsd.net/wp-content/uploads/2019/02/Focus-2024.pdf 28 “New data shows how many Clark County graduates head to college but also highlights some challenges.”
Nevada Independent. Accessed July 2020. https://thenevadaindependent.com/article/new-data-
shows-how-many-clark-county-graduates-head-to-college-but-also-highlights-some-challenges 29 “Clark County magnet schools relaxing admission requirements.” Las Vegas Review-Journal. Accessed July
2020. https://www.reviewjournal.com/local/education/clark-county-magnet-schools-relaxing-
admission-requirements-1861354/?clearUserState=true 30 “Clark County School District drops admissions criteria for some magnet programs adds kindergarten as an
option.” The Nevada Independent. Accessed July 2020.
https://thenevadaindependent.com/article/clark-county-school-district-drops-admissions-criteria-for-
some-magnet-programs-adds-kindergarten-as-an-option 31 Ibid. 32 “FutuReady Builds Workforce Pipeline to Local Industries.” Las Vegas Business Press. Accessed July 2020.
https://businesspress.vegas/c-level/futuready-builds-workforce-pipeline-to-local-industries/ 33 “Memorandum of understanding between the Board of Regents of Nevada System of Higher Education and
the Clark County School District to Promote for college and career readiness.” Board of Regents of
Nevada System of Higher Education. Accessed July 2020.
https://www.boarddocs.com/nv/ccsdlv/Board.nsf/files/B82NLB5BCA47/$file/01.10.19%20Ref.%20
5.01.pdf 34 “Rebel Venture Fund.” University of Nevada Las Vegas. Accessed July 2020.
https://involvementcenter.unlv.edu/organization/rebelventurefund 35 “About.” University of Nevada Las Vegas Troesh Center for Entrepreneurship and Innovation. Accessed July
2020. https://entrepreneurship.unlv.edu/about/. 36 “NSF I-Corps.” University of Nevada Las Vegas Troesh Center for Entrepreneurship and Innovation. Accessed
July 2020. http://entrepreneurship.unlv.edu/nsf-i-corps/. 37 “About.” Lee Prize. Accessed July 2020. https://www.leeprize.com/about/. 38 “About.” Nevada Institute for Autonomous Systems. Accessed July 2020. https://nias-uas.com/about/. 39 “International Innovation Center @ Vegas.” Innovate.Vegas. Accessed July 2020. https://innovate.vegas/IIC-
Vegas. 40 “About Innevation.” Rob Roy’s Innevation. Accessed July 2020. https://www.innevation.com/about-us/. 41 “Fastest High Speed Internet of 2020.” U.S. News & World Report. Accessed July 2020.
https://www.usnews.com/360-reviews/internet-providers/high-speed-
internet#:~:text=The%20Federal%20Communications%20Commission%20(FCC,send%20data)%20of
%203%20Mbps.. 42 “Fixed Broadband Deployment: Compare Broadband Availability in Different Areas.” U.S. Federal
Communications Commission. Accessed July 2020. https://broadbandmap.fcc.gov/#/area-
comparison?version=jun2018&tech=acfosw&speed=25_3&searchtype=county&geoid=32&searched
=y. 43 “Types of Computers and Internet Subscriptions.” American Community Survey 1-Year Estimates Subject
Tables, 2018. U.S. Census Bureau. Accessed July 2020.

85
https://data.census.gov/cedsci/table?q=Telephone,%20Computer,%20and%20Internet%20Access&g
=0500000US32003&hidePreview=false&t=Telephone,%20Computer,%20and%20Internet%20Acces
s&tid=ACSST1Y2018.S2801&vintage=2018&layer=VT_2018_050_00_PY_D1&cid=S2801_C01_001
E. 44 “Best & Worst Cities to Drive In.” 2019. WalletHub. Accessed July 2020. https://wallethub.com/edu/best-
worst-cities-to-drive-in/13964/. 45 2018 Southern Nevada State of Sustainability Report. ImpactNV. Accessed July 2020.
https://cms8.revize.com/revize/clarknv/Environmental%20Sustainability/Sustainability/2018report.p
df?t=1597938167970&t=1597938167970. 46 “Electric Vehicles Charging.” NV Energy. Accessed July 2020.
https://www.nvenergy.com/cleanenergy/electric-vehicles/charging. 47 “Second Las Vegas Airport Explored as Visitation Continues to Rise, McCarran Nearing Threshold.” 2018.
Casino.org. Accessed July 2020. https://www.casino.org/news/second-las-vegas-airport-explored-as-
visitation-continues-to-rise/. 48 “Musk’s Boring Co., LVCVA Execs Say Transit System Expansion ‘Teed Up.’” 2020. Nevada Public Radio.
Accessed July 2020. https://knpr.org/knpr/2020-01/musks-boring-co-lvcva-execs-say-transit-system-
expansion-teed. 49 Ibid. 50 “About the Master Plan.” Clark County Department of Comprehensive Planning. Accessed July 2020.
https://www.transformclarkcounty.com/master-plan. 51 “COVID-19 in the United States.” Data USA. Accessed July 2020. https://datausa.io/coronavirus. 52 “RTC Bike Share Usage Nearly Doubles in April Amid Shutdown.” May 2020. Las Vegas Review-Journal.
Accessed July 2020. https://www.reviewjournal.com/business/rtc-bike-share-usage-nearly-doubles-in-
april-amid-shutdown-2021138/. 53 “Train Connecting SoCal to Las Vegas Could be ready in 2024.” August 2020. Spectrum News 1. Accessed
August 2020. https://spectrumnews1.com/ca/la-west/transportation/2020/08/11/train-connecting-
la-to-las-vegas-could-be-ready-in-2023. 54 “Nevada Inland Port Study.” RCG1. Accessed July 2020. https://rcg1.com/reports/nevada-inland-port-
study/. 55 “Las Vegas-Henderson-Paradise Metro Home Prices & Values.” Zillow. Accessed July 2020.
https://www.zillow.com/las-vegas-henderson-paradise-metro-nv_r394775/home-values/. 56 “Permits by Metropolitan Area.” Building Permits Survey, U.S. Census Bureau. Accessed July 2020.
https://www.census.gov/construction/bps/msaannual.html. 57 Affordability Index of Existing Single-Family Homes for Metropolitan Areas. 2018. National Association of
Realtors. Accessed July 2020. https://www.nar.realtor/sites/default/files/documents/metro-
affordability-2018-existing-single-family-2019-06-11.pdf. 58 Nevada Housing Market Update: A Monthly Report from the Lied Institute for Real Estate Studies. April
2020. University of Nevada Las Vegas Lied Institute for Real Estate Studies. Accessed July 2020.
https://liedinstitute.unlv.edu/wp-content/uploads/2020/06/6025_Lied-Housing-Market-Report_April-
2020.pdf. 59 “Archive: Monthly Housing Reports.” University of Nevada Las Vegas Lied Institute for Real Estate Studies.
Accessed July 2020. https://liedinstitute.unlv.edu/research-reports/archive-monthly-housing-reports/. 60 Clark County Community Health Needs Assessment. May 2019. Southern Nevada Health District. Accessed
July 2020. https://media.southernnevadahealthdistrict.org/download/sothd/2019-community-health-
needs-assessment.pdf. 61 Nevada Physician Workforce Profile. 2019. Association of American Medical Colleges. Accessed September
2020. https://www.aamc.org/system/files/2019-12/state-physician-Nevada-2019%5B1%5D.pdf 62 Ibid. 63 Ibid. 64 Ibid. 65 “Overview.” Las Vegas Medical District. Accessed July 2020. https://lasvegasmedicaldistrict.com/lvmd-
partners/overview/.

86
66 “Nevada 2018 Report.” Infrastructure Report Card. Accessed July 2020.
https://www.infrastructurereportcard.org/state-item/nevada/. 67 Winter, P.L., W.D. Crano, T. Basanez, and C.S. Lamb. “Equity in Access to Outdoor Recreation—Information a
Sustainable Future.” Sustainability 2020: 12(1). https://www.mdpi.com/2071-1050/12/1/124/htm 68 “’Save our Mesa’ Gains Following.” August 2020. The Progress. Accessed August 2020.
http://mvprogress.com/2020/08/12/save-our-mesa-gains-following/. 69 “Declining Renewable Costs Drive Focus on Energy Storage.” January 2020. National Renewable Energy
Laboratory. Accessed August 2020. https://www.nrel.gov/news/features/2020/declining-renewable-
costs-drive-focus-on-energy-storage.html. 70 “Enhanced Geothermal in Nevada: Extracting Heat from the Earth to Generate Sustainable Power.” April
2013. U.S. Department of Energy. Accessed July 2020. https://www.energy.gov/articles/enhanced-
geothermal-nevada-extracting-heat-earth-generate-sustainable-power. 71 “This Hybrid Power Plant Combines 3 Clean Energy Sources in One.” October 2016. U.S. Department of
Energy. Accessed July 2020. https://www.energy.gov/articles/hybrid-power-plant-combines-3-clean-
energy-sources-one. 72 “Local Area Unemployment Statistics.” May 2020. U.S. Bureau of Labor Statistics. Accessed July 2020.
https://www.bls.gov/lau/ 73 “32 Cities with the Biggest Homelessness Problem.” Security.org. October 4, 2019.
https://www.security.org/resources/homeless-statistics/. 74 Homeless Census Comprehensive Report, Southern Nevada Homelessness Continuum of Care. Help Hope
Home, 2019. https://helphopehome.org/wp-content/uploads/2019/09/2019-Homeless-Census-
Narratives-and-Methodology-Final-2.0.pdf. 75 According to the U.S. Department of Housing and Urban Development, a person is considered chronically
homeless if they: (1) are homeless and live in a place not meant for human habitation, a safe haven,
or an emergency shelter; (2) have been homeless and living or residing in a place not meant for
human habitation, a safe haven, or an emergency shelter continuously for at least one year or on at
least four separate occasions in the last three years where the combined length of time homeless in
those occasions is at least 12 months; and (3) can be diagnosed with a substance abuse disorder,
serious mental illness, developmental disability (as defined in Section 102 of the Developmental
Disabilities Assistance Bill of Rights Act of 2000), post-traumatic stress disorder, cognitive
impairments resulting from brain injury, or chronic physical illness or disability. 76 Homeless Census Comprehensive Report, Southern Nevada Homelessness Continuum of Care. Help Hope
Home, 2019. https://helphopehome.org/wp-content/uploads/2019/09/2019-Homeless-Census-
Narratives-and-Methodology-Final-2.0.pdf. 77 Kristin Dickerson, “Tiny Homes for Dallas' Chronically Homeless.” NBC Local News, June 15, 2018.
https://www.nbcdfw.com/news/local/tiny-homes-for-dallas-chronically-homeless/236950/. 78 “Dallas Tiny Houses See Two Years of Successfully Housing Homeless.” Fox Local News, October 4, 2018.
https://www.fox4news.com/news/dallas-tiny-houses-see-two-years-of-successfully-housing-homeless.