an analysis and review of measures and relationships in
TRANSCRIPT
An Analysis and Review of Measures and Relationships in Space Transportation Affordability
Edgar Zapata, Carey McCleskey NASA Kennedy Space Center AIAA Joint Propulsion Conference, July 28-30 2104, Cleveland OH

2
An Analysis and Review of Measures and Relationships in Space Transportation Affordability
• Affordability, Prices and Costs � Poor data, $/kg, $ per flight, and many, many caveats
• Productivity, Flight Rate and Yearly Capability � Flights, tonnage
• Competitiveness � Current vs. Growth
• Direct vs. Indirect Costs � Where vs. Why, Comprising vs. Causing
• Closing
3
An Analysis and Review of Measures and Relationships in Space Transportation Affordability
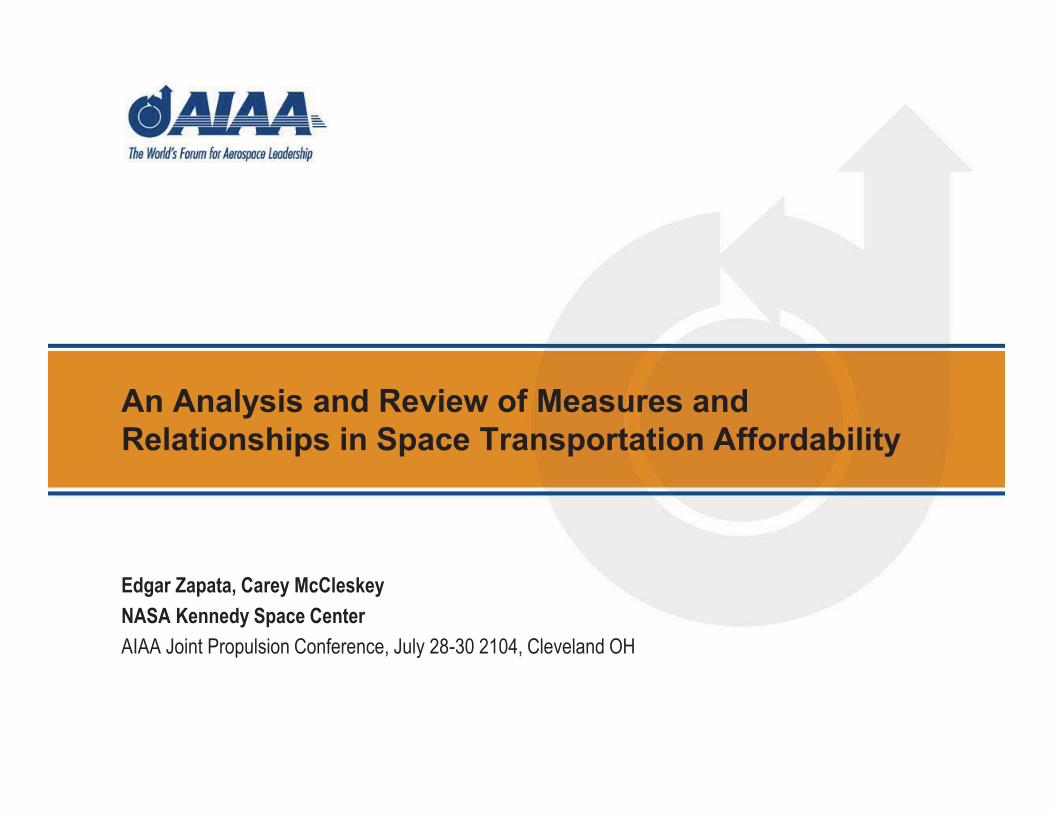
• A typical view of affordability • Recent data used here • Poor state of data, many contracts not public • Causality (X to Y) not implied nor clear
Figure 1: US Launchers and recent launch price contracts (2012-2015), using a linear scale and applying a power curve fit.
$-
$10,000
$20,000
$30,000
$40,000
$50,000
$60,000
$70,000
$80,000
$90,000
$100,000
0 20000 40000 60000 80000
"Spe
cific
" Co
sts =
$ p
er k
g=$
Pric
e/kg
Pay
load
Cap
abili
ty
Payload Capability of Launcherkg to LEO, 200km, 28.5 circ.
Recent US Launch Price Contracts 2012-2015(Linear Scale)
4
An Analysis and Review of Measures and Relationships in Space Transportation Affordability
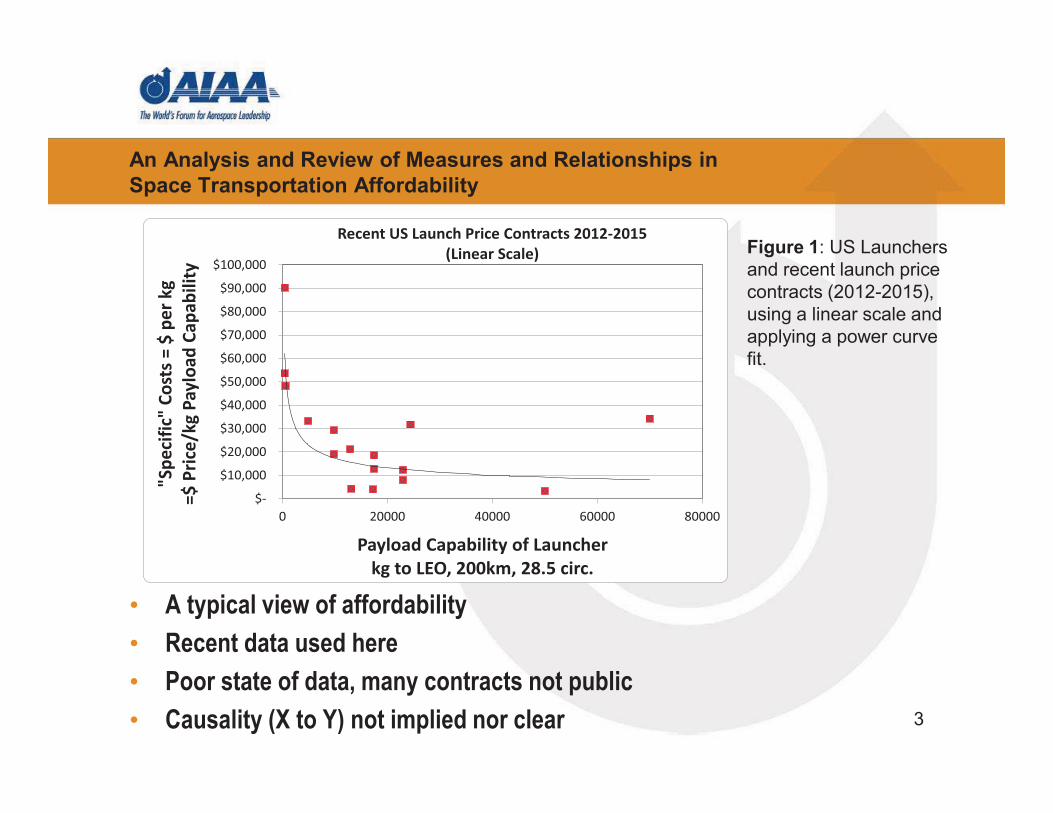
Figure 2: US Launchers and recent launch price contracts (2012-2015), using a logarithmic scale and applying a power curve fit.
Pegasus
MinotaurAntares
Atlas V 401>
Atlas V 401+ELC>
Falcon 9
Atlas V 541>
<Atlas V 541+ELC
Delta IV Heavy >
<Delta IV Heavy+ELC
Shuttle Ref.
Falcon Heavy
Scout SLS Ref.
y = 665074x-0.396
$1,000
$10,000
$100,000
100 1000 10000 100000
"Spe
cific
" Co
sts =
$ p
er k
g=$
Pric
e/kg
Pay
load
Cap
abili
ty
Payload Capability of Launcherkg to LEO, 200km, 28.5 circ.
Recent US Launch Price Contracts 2012-2015(Logarithmic Scale)
<ULA as System
• Shuttle only as reference (more ahead on apples/oranges) • Poor state of data • Similar to what an airline would have as CASM-cost per available seat mile • Relative indicator of competitiveness
5
An Analysis and Review of Measures and Relationships in Space Transportation Affordability
$-
$500
$1,000
$1,500
$2,000
$2,500
$3,000
0 10000 20000 30000 40000 50000 60000 70000 80000 90000
Min
imum
Cos
t of E
ntry
, $M
=Pri
ce o
r Ave
rage
Cos
t per
Flig
ht
Payload Capability of Launcherkg to LEO, 200km, 28.5 circ.
Bubble Size as Yearly Productivity, Yearly Throw, all Vehicles of that System
Space Shuttle Reference
SLS Reference
ULA as a System, Demonstrated, 2013
SpaceX as a System, "What-if" 8 F9's and 1 FH
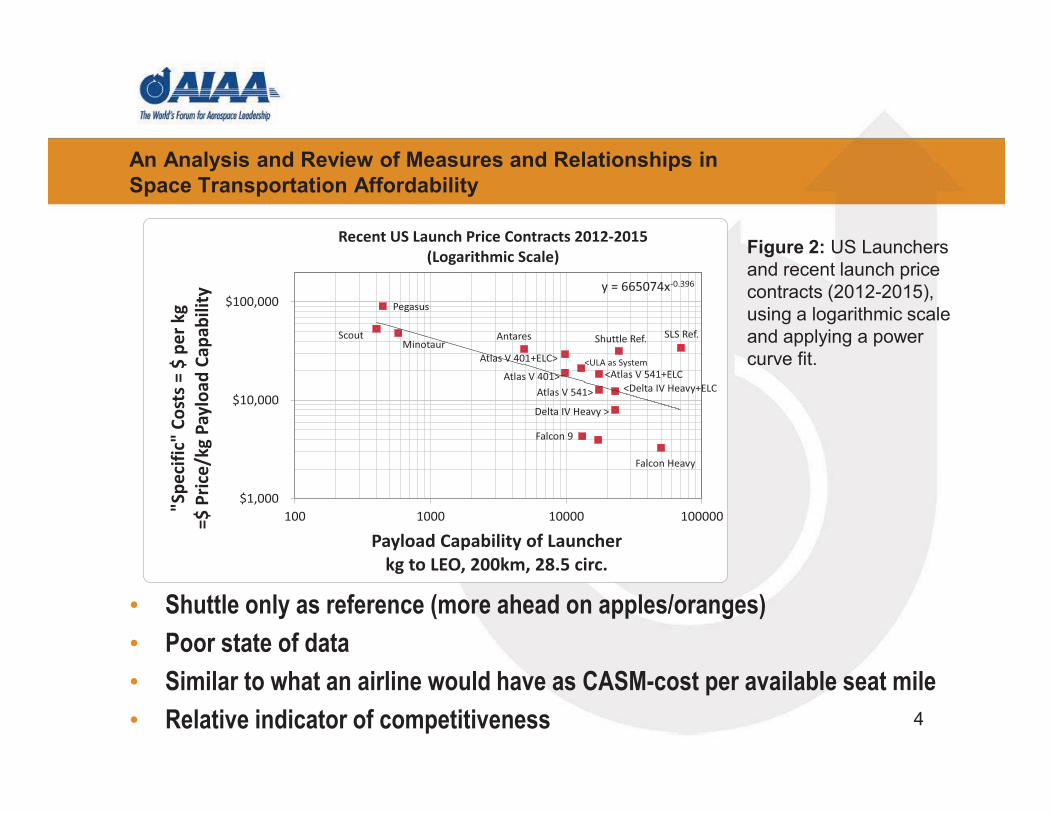
• Treat common capabilities as a system (all ULA, all SpaceX, etc.) • Tonnage “capability” (not “actual”; more on this ahead) • Want the bubble sizes to grow, and want more bubbles! • US launchers only
Figure 3: Using a bubble chart to show three variables; average payload capability of a system of launchers, the average cost of entry (or price to a customer), and the total tonnage capability deployed over a recent calendar year, as bubble size.
6
An Analysis and Review of Measures and Relationships in Space Transportation Affordability
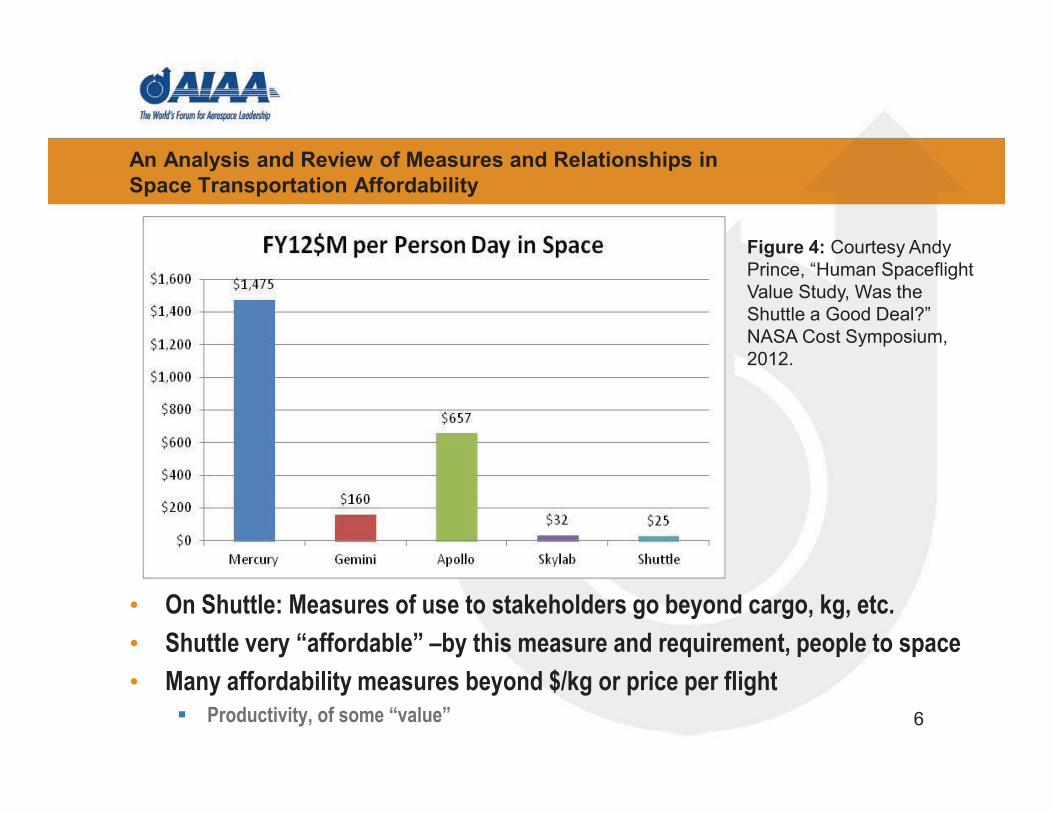
• On Shuttle: Measures of use to stakeholders go beyond cargo, kg, etc. • Shuttle very “affordable” –by this measure and requirement, people to space • Many affordability measures beyond $/kg or price per flight
� Productivity, of some “value”
Figure 4: Courtesy Andy Prince, “Human Spaceflight Value Study, Was the Shuttle a Good Deal?” NASA Cost Symposium, 2012.

7
An Analysis and Review of Measures and Relationships in Space Transportation Affordability
• Emerging / commercial space of great interest • Visually, a spectrum of being more or less commercial • Can compare two or more players as being more or less commercial • Commercial is not about just being private sector; it’s much more
Figure 5: What is “commercial” space to NASA?
8
An Analysis and Review of Measures and Relationships in Space Transportation Affordability
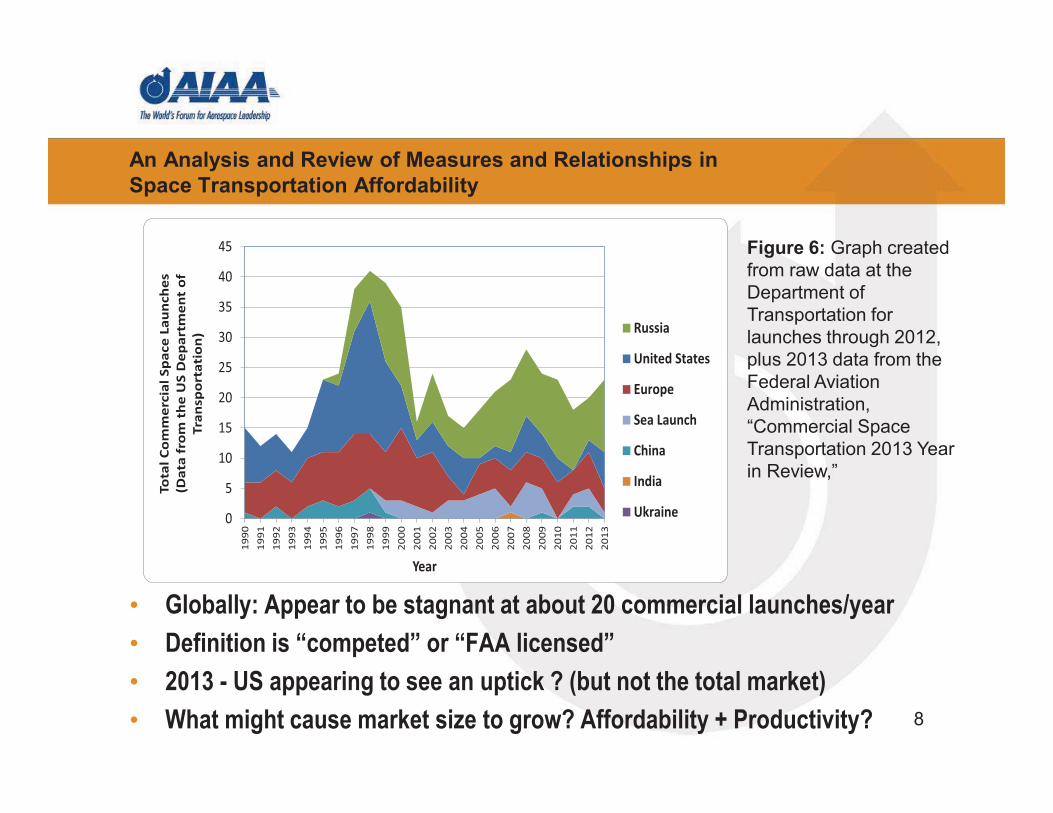
• Globally: Appear to be stagnant at about 20 commercial launches/year • Definition is “competed” or “FAA licensed” • 2013 - US appearing to see an uptick ? (but not the total market) • What might cause market size to grow? Affordability + Productivity?
Figure 6: Graph created from raw data at the Department of Transportation for launches through 2012, plus 2013 data from the Federal Aviation Administration, “Commercial Space Transportation 2013 Year in Review,”
0
5
10
15
20
25
30
35
40
4519
9019
9119
9219
9319
9419
9519
9619
9719
9819
9920
0020
0120
0220
0320
0420
0520
0620
0720
0820
0920
1020
1120
1220
13
Tota
l Com
mer
cial
Spa
ce L
aunc
hes
(Dat
a fr
om t
he U
S D
epar
tmen
t of
Tr
ansp
orta
tion
)
Year
Russia
United States
Europe
Sea Launch
China
India
Ukraine

9
An Analysis and Review of Measures and Relationships in Space Transportation Affordability
Ingredient Rationale
Product development and use, amortizing costs
The business case depends on having non-government customers. The product for the government is developed with non-government customers in mind. The product or service is also provided to non-government customers.
Contracts The government uses firm fixed price type of contracts. Efficiency Provider applies mostly commercial best practices. These practices or “how” are
outputs. Capability, performance, safety, and cost goals are inputs. Incentives Multiple suppliers (industry) and multiple buyers (government and non-
government) rationalize incentives, leading to success even when many requirements (performance, safety, cost) appear at odds. No monopoly (single provider) or monopsony (single buyer).
Table 1: Basic ingredients for a space exploration element (launch, spacecraft, habitat, etc.) being more commercial. The more these ingredients are captured, the more commercial the element is.
The formal, actual definition of what is “commercial” is expressed in the current space policy: “The term “commercial,” for the purposes of this policy, refers to space goods, services, or activities provided by private sector enterprises that bear a reasonable portion of the investment risk and responsibility for the activity, operate in accordance with typical market-based incentives for controlling cost and optimizing return on investment, and have the legal capacity to offer these goods or services to existing or potential nongovernmental customers.”
10
An Analysis and Review of Measures and Relationships in Space Transportation Affordability
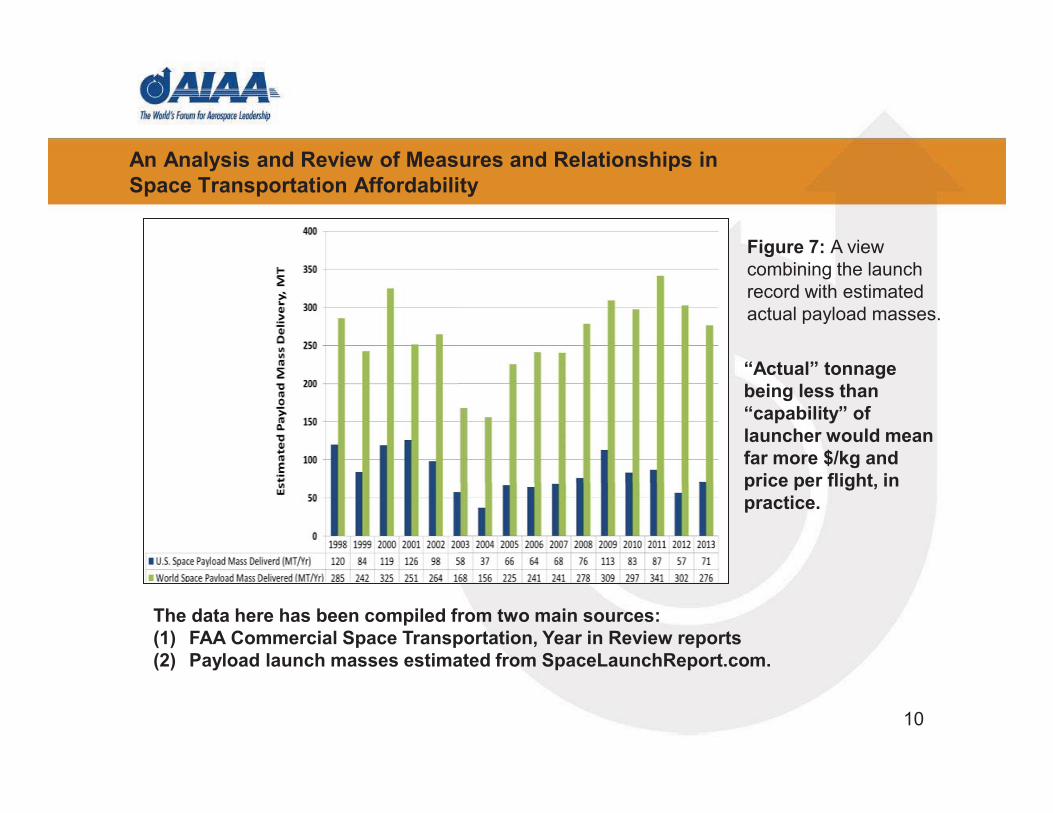
Figure 7: A view combining the launch record with estimated actual payload masses.
The data here has been compiled from two main sources: (1) FAA Commercial Space Transportation, Year in Review reports (2) Payload launch masses estimated from SpaceLaunchReport.com.
“Actual” tonnage being less than “capability” of launcher would mean far more $/kg and price per flight, in practice.

11
An Analysis and Review of Measures and Relationships in Space Transportation Affordability
Product Design Factors
Process/Practice DesignFactors
Direct Costs
Indirect Costs
Weak link Strong link
Figure 8: Technical product design factors (“what”; such as a number of parts, or different fluids, or the type of fluid, and reliability, etc.) distinguished from non-technical process factors (“how”; such as development practices, the flow of information, manufacturing steps, etc.) Needs: • Acceptance: Project/program cost data as a necessity,
not a cost itself, not a luxury • Insights, traceability • Understanding and separating what comprises costs
from what causes costs (not the same thing) • Getting into the less tangible, less “technology” alluring
indirect • Technology that focuses on direct
processes/responsiveness, productivity, in all phases from manufacturing to ops and launch; not just in flight
Methodology / model used in current models and analysis

An Analysis and Review of Measures and Relationships in Space Transportation Affordability
• What is needed is and ability to discriminate: � cost-per-pound of launch vehicle payload capability � cost-per-pound of payload delivered
• Specifically, need cost and productivity information: � Annual Production and Supply Chain Costs as a
function of Unit Production Rate � Annual Operations Costs as a function of delivery
(flight) rate 12
13
An Analysis and Review of Measures and Relationships in Space Transportation Affordability
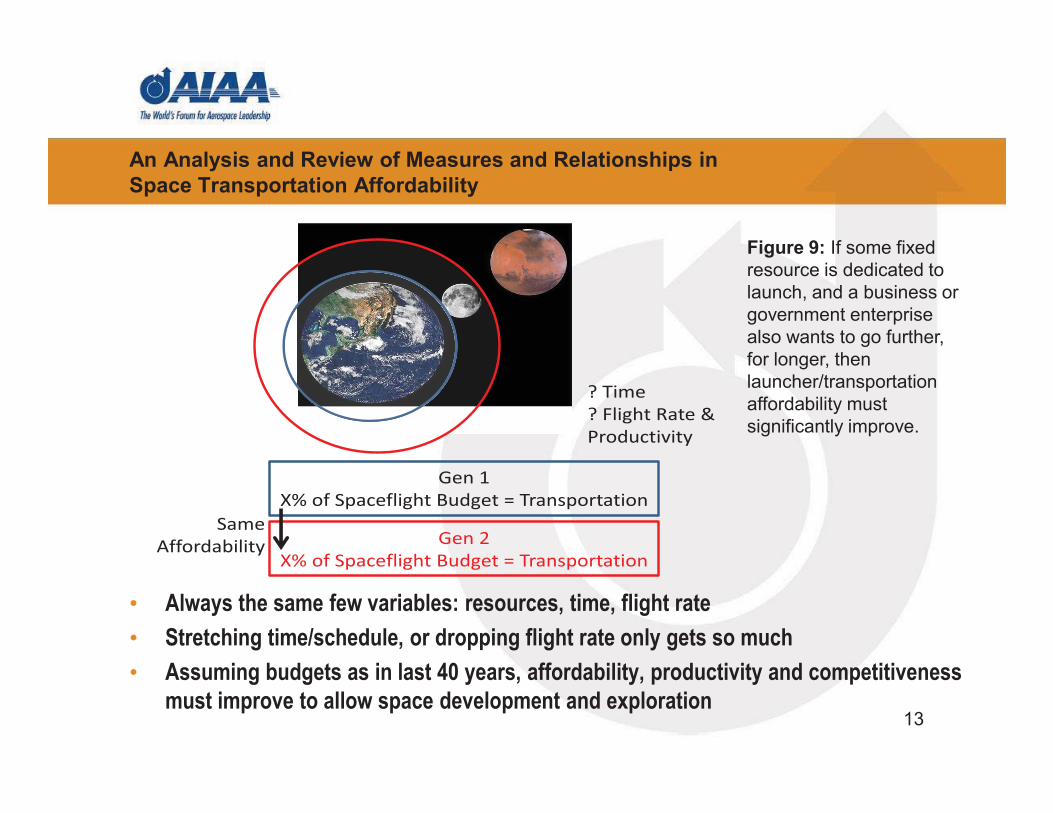
Figure 9: If some fixed resource is dedicated to launch, and a business or government enterprise also wants to go further, for longer, then launcher/transportation affordability must significantly improve.
Gen 1X% of Spaceflight Budget = Transportation
Gen 2X% of Spaceflight Budget = Transportation
? Time? Flight Rate &Productivity
SameAffordability
• Always the same few variables: resources, time, flight rate • Stretching time/schedule, or dropping flight rate only gets so much • Assuming budgets as in last 40 years, affordability, productivity and competitiveness
must improve to allow space development and exploration

14