an abstract of thesis of walter james williams for the
TRANSCRIPT

AN ABSTRACT OF THESIS OF
Walter James Williams for the degree of Master of Science in Radiation Health
Physics presented on May 30,2013
Title: Neutron Radiography And Tomography: Determining And
Optimizing Resolution Of Neutron Sensitive Multi Channel Plate Detectors
Abstract Approved:___________________________________________________
Steven R. Reese
The objective of this work was to determine and optimize the resolution of a
neutron sensitive Multi-Channel Plate (MCP) detector in order to determine
its capabilities in radiography and tomography. The Oregon State University,
Neutron Radiography Facility added an MCP Detector in 2012 in order to
analyze these capabilities. The leading factor in the generation of both two-
dimensional and three-dimensional imaging was the spatial resolution of the
detector. The MCP detector developed by Nova Scientific Inc. uses the
10B(n,α)Li7 reaction within the MCP’s bulk walls in order to convert the
neutron into an α and lithium particle which have a high probability of
initiating an electron avalanche that generates an output pulse. This reaction

governs the spatial resolution. The detector's mechanics allow for a theoretical
maximum spatial resolution of 17 µm. By fine tuning the electronics and
using a thermal neutron beam, count rates can be recorded throughout the
active detector area, where lower count rates can be used to identify areas of
neutron absorption or attenuation within the object. These differences are
used to create a radiograph which gives information on the material's
attenuation coefficient and geometry of the object being imaged. For this
study, the objects include resolution masks, American Society for Testing and
Materials (ASTM) Standards, along with a variety of other materials. Since the
radiograph is digitally created in near real-time, the detector has the capability
of neutron tomography with the radiograph's resolution being on the order of
the theoretical limit.

© Copyright by Walter James Williams
May 30, 2013
All Rights Reserved

Neutron Radiography And Tomography: Determining And Optimizing
Resolution Of Neutron Sensitive Multi Channel Plate Detectors
By
Walter James Williams
A THESIS
Submitted to
Oregon State University
in partial fulfillment of
the requirements for the
degree of
Master of Science
Presented May 30, 2013
Commencement June 2014

Master of Science thesis of Walter James Williams presented on May 30, 2013
APPROVED:
Major Professor, representing Radiation Health Physics
Head of the Department of Nuclear Engineering and Radiation Health Physics
Dean of the Graduate School
I understand that my thesis will become part of the permanent collection of
Oregon State University libraries. My signature below authorizes release of
my thesis to any reader upon request.
Walter James Williams, Author

ACKNOWLEDGEMENTS
I would like to thank all of my friends, family, colleagues and advisors for the
support. Special thanks to Dr. Reese for helping out through the ups and
downs. I would also like to thank Idaho National Labs for funding my
Graduate Research Assistantship at Oregon State University.

TABLE OF CONTENTS
1 Introduction ............................................................................................................. 1
1.1 Purpose .......................................................................................................... 3
1.2 Objective ........................................................................................................ 4
1.3 Document Overview .................................................................................... 5
2 Survey Of Literature ............................................................................................... 6
2.1 History ............................................................................................................ 6
2.2 Instrumentation .......................................................................................... 11
3 Materials And Methods ........................................................................................ 19
3.1 Detector And Electronics ........................................................................... 19
3.2 Configuring The Electronics ..................................................................... 23
3.2 Thermal Neutron Beam ............................................................................. 28
3.3 Pinhole Masks ............................................................................................. 28
3.4 Gamma Sensitivity ..................................................................................... 30
3.5 Standards ..................................................................................................... 34
3.6 Tomography Reconstruction .................................................................... 41
3.7 Applications And The AFIP7 Fuel Element ........................................... 47

4 Discussion And Conclusion ................................................................................. 53
5 Appendix A: Thermal Neutron Linear Attenuation Coefficients Using Average
Scattering And Thermal Absorption Cross Sections For Naturally Occurring
Elements (28) ........................................................................................................ 57
6 Appendix B: Gap Measurements Using Gap Probe ............................................. 59
7 Appendix C: Standards And Equipment ............................................................... 63
8 Bibliography ......................................................................................................... 66

TABLE OF FIGURES
Figure 1: Attenuation Of Uniform Radiation Beam ............................................... 2
Figure 2: Attenuation Coefficients Of Neutrons And X-Rays (17).................... 12
Figure 3: Film Radiography Reactions (19) ........................................................... 15
Figure 4: Boron Neutron Interaction (24)............................................................... 19
Figure 5: Electron Avalanche (24) ........................................................................... 20
Figure 6: MCP/Anode Layout (23) ......................................................................... 21
Figure 7: Threshold Adjustment Effects ................................................................ 24
Figure 8: Post acquisition Normalization k=1000(left) k=3000(right) ................ 26
Figure 9: Histograms of Radiographs in Figure 8 ................................................ 27
Figure 10: Gd Coated Pinhole Mask With 300 µm Diameter Holes. ................. 29
Figure 11: Pinhole Mask Used For Correction, Uncorrected(L) Corrected(R) . 30
Figure 12: Cs-137 Source At 1 Meter (Upper L) At 0.1 Meter (Bottom L) And
Respective Images With Correction (Right) .......................................................... 31
Figure 13: Strip-No Correction(left), With Correction (Right) ............................ 32
Figure 14: Mixed Antimony Source Result (left) Versus no Source (right) ...... 33
Figure 15: BPI Schematic and Quantitative Definitions ..................................... 34
Figure 16: ASTM Standard S1 Schematic (Units In Inches) (26)......................... 35
Figure 17: BPI pictured face-on (left) and at 90 degrees (right) .......................... 38

Figure 18: Flatfield (top left) SI (top right), Normalized SI (bottom) ............... 39
Figure 19: SI Standard (left) Heavily Thresholded (right) ................................. 40
Figure 20: Four Pixel Reconstruction (29) .............................................................. 42
Figure 21: BPI and Respective Sinograms ............................................................. 44
Figure 22: tomograph slices of BPI disk (left) and wire (right) .......................... 45
Figure 23: Skeleton of BPI wire ............................................................................... 46
Figure 24: Isosurface of the BPI ............................................................................... 46
Figure 25: AFIP 7 Mockup ....................................................................................... 47
Figure 26: Radiographs of AFIP7 element ............................................................. 48
Figure 27: AFIP 7 Sinograms ................................................................................... 49
Figure 28: Tomogrpahic Slices of AFIP 7 Euel Element ...................................... 50
Figure 29:Top AFIP 7 Gap Measurements............................................................. 51
Figure 30: Center AFIP 7 Gap Measurements ....................................................... 51
Figure 31: AFIP 7 Bottom Gap Measurements ...................................................... 52
Figure 32: BPI Standard (Left) SI Standard (Right) ............................................. 63
Figure 33: Vacuum Pump ........................................................................................ 63
Figure 34: MCP Detector ......................................................................................... 64
Figure 35: AFIP 7 Mock Element in Front of MCP Detector ............................... 64
Figure 36: AFIP 7 Element on Rotational Stage .................................................... 65

Figure 37: Electronic Process ...................................................................................... 65
LIST OF TABLES
Table 1: Neutron Radiography Standards ............................................................. 36
Table 2: ASTM Standard Value "H" ........................................................................ 37
Table 3: ASTM Standard Value "G" ........................................................................ 37
Table 4: Calculated ASTM Values For MCP Detector ......................................... 40

1
1 Introduction
The Oregon State University's (OSU), Neutron Radiography Facility
(NRF) added a multi-channel plate (MCP) Detector in 2012 in order to create
neutron radiographs and tomographs and analyze these capabilities. The
leading factor in the generation of both two-dimensional and three-
dimensional imaging is the spatial resolution of the detector. The MCP
detector developed by Nova Scientific Inc. uses the 10B(n,α)Li 7 reaction within
the MCP’s bulk walls in order to convert the neutron. The α particle has a
high probability of initiating an electron avalanche within the MCP channels,
which generates the output pulse. This reaction governs the spatial
resolution, as the track lengths of the α and lithium nuclei within the detector
are approximately 4 µm. The time delay of the pulse is used to back calculate
the location of the interaction with spatial resolution of approximately 9 µm.
This allows for a theoretical maximum spatial resolution of 17 µm. By fine
tuning the electronics and using a thermal neutron beam, count rates can be
recorded throughout the active detector area, where lower count rates can be
used to identify areas of neutron absorption or attenuation caused by an object
within the beam. These differences are used to create a radiograph which

2
gives density information on the material and geometry of the object being
imaged.
The NRF uses a thermal neutron beam from the TRIGA® reactor at
OSU. This beam is heavily collimated and filtered with boron and sapphire to
remove a majority of the gamma particles from the beam while shaping it into
a parallel beam. The beam has a thermal neutron flux of approximately 4.6E5
n cm-2 s-1 with an L/D ratio of 100 at the detectors location
While neutron radiography is already common practice, neutron
tomography is not. Radiography works in two dimensions by measuring
some attenuation of radiation after it has passed through an object as shown in
Figure 1 below. The cause of the attenuation cannot be distinguished
between the thickness or the density of the object.
Figure 1: Attenuation Of Uniform Radiation Beam

3
Due to the inability to make these distinctions, all of the information
about the object is compressed into a single geometric plane. In contrast,
tomography has the ability to view this same object in three-dimensions. This
is done by taking a series of radiographs of the object at different known
angles and reconstructing these images to form a tomograph.
1.1 Purpose
The purpose of this research was to analyze a new high-resolution
neutron imaging system that uses a MCP based detector to generate
radiographs in near real-time. The analysis consisted of the following:
determining its resolution in neutron imaging, the capabilities of the modified
MCPs and their ability to allow neutrons to cause a detectable electron
avalanche within the detector, the practicality of performing neutron
tomography with such a detector, and time constraints on collecting images.
The system in use at OSU ideally would have a resolution of on the order of 30
micron if the divergence of the beam is sufficiently low and the sample can be
placed close to the MCP detection element.

4
1.2 Objective
For this study, radiographs were taken of objects including resolution
masks, ASTM standards, along with a variety of other materials. These
images and standards were used to establish the spatial resolution of the
detector in order to determine its capabilities and practicality in neutron
imaging. Likewise, the standards' were also used to ascertain the quality of a
neutron detectors radiograph. The two standards used were a Beam Purity
Indicator (BPI) and a Sensitivity Indicator (SI) (1).
Since the radiograph was digitally created in near real-time, neutron
tomography was tested for practicality and whether the radiographs
resolution was on the order of the theoretical limit. The system was shown to
produce radiographs with a resolution an order of magnitude lower that most
existing high-speed neutron radiography systems.

5
1.3 Document Overview
This paper is organized in the following manner:
Chapter 1: Introduction - The introduction discusses the purpose and
objective of this thesis.
Chapter 2: Survey of Literature - The survey of literature discusses previous
work in the field of radiography and tomography and current methods for
analyzing detectors for their imaging capabilities.
Chapter 3: Materials and Methodology - Materials and Methodology is a
detailed description of the procedure used to fulfill the purpose and objective
of this thesis.
Chapter 4: Conclusion and Discussion - Conclusion and Discussion covers
the determined resolution and practicality of this detector and applications,
along with concluding remarks concerning this thesis.

6
2 Survey Of Literature
This section is separated into two parts. The first being a survey on the history
of radiography and tomography. The second is a survey on methods for
determining spatial resolution of the detector.
2.1 History
Neutron radiography and tomography are used to describe the
production of two-dimensional and three-dimensional images by transmitting
neutrons through an object and onto a neutron sensitive film or detector. The
neutron was first proposed by Rutherford in the early 1900’s. He postulated
that there was a particle that was able to move through materials more freely
than electrons. However, it would be exceptionally difficult to detect due to
the nature of its interactions and not being affected by charge (2).
W.D. Harkins was credited for giving the neutron its name while
writing a classification of isotopes in 1921 (3). However it was not until 1932
that James Chadwick discovered the neutron while examining the emission of
α particles and working with beryllium. He found it to be a highly energetic

7
and penetrating particle. This discovery ultimately lead to Chadwick receiving
the Nobel Prize (4) (5).
Not long after this ground breaking discovery, and only forty years
after the first radiograph from x-rays, people began searching for applications
for neutrons. The first demonstration of neutron imaging was done by
Hartman Kallmann and E. Kuhn in 1935, when they used a small neutron
accelerator to create the first radiograph using neutrons (6). This source was a
continuous yield neutron generator that used the H3(d,n)He4 reaction in a
miniature sealed tube accelerator to generate an output of fast neutrons from a
collision of a mixed beam of deuterium and tritium ions with a deuterium-
tritium loaded target (7).
Neutrons are efficiently attenuated by only a few specific elements such
as hydrogen, boron, cadmium, samarium and gadolinium. Neutron
radiography is an advance technique for non-destructive testing of materials
and is exact analogue of X-ray radiography; a method based on the local
variations in absorption encountered by a beam in simple transmission. Any
inhomogeneity, or neutron absorption and scatter properties, of the object
such as internal structure, defects like voids, cracks, inclusions, and porosity

8
will be shown up as a change in the detected intensity recorded behind the
object. It is possible to investigate very bulky objects and selectively see those
parts with high real or apparent absorption cross-section and also inspects
large thicknesses of heavy materials by neutrons in much less time than
required by X-ray radiographs. Therefore, it has some special advantages in
nuclear, aerospace, ordnance and rubber & plastic industries (8).
During this same time, O.Z. Peter was using a more powerful neutron
generator to produce radiographs of his own. His method cut down the
needed beam time from the hours that Kallmann and Kuhn required, to only
minutes. This research was set back by the onset of World War Two and was
not able to be continued or published until 1946, after the war had ended (9).
The Manhattan Project provided many advances in the nuclear industry, such
as reactors that allowed for a larger neutron flux than other sources. This lead
to more practical research in this field by creating thermal neutron fluxes
many orders of magnitude higher than those produced from previous neutron
generators. It was at this point that the opportunity for the application of
neutrons in non-destructive imaging started to come to light. Its first realistic
use was looking for voids in uranium, something that was not previously
possible due to the heavy attenuation of x-rays within high Z materials. With

9
the advent of reactor technology, it was J Thewlis in England that was able to
take the first neutron radiographs of useful quality (10).
In early 1960, Harold Berger and John Barton simultaneously began
evaluating neutrons as a tool for investigating irradiated reactor fuel. This
was done primarily at Argonne National Laboratories (11). This was where
Watts was able to produce the first American radiographs. Over the previous
few years, it became common knowledge amongst the scientific community
that neutron imaging was best achieved, in fact nearly impossible without,
using reactors(12).
By the 1970’s most reactors designated for research throughout Europe
and the United States were able to take neutron radiographs of reasonable
quality (13). In order to further develop and improve the methods and quality
of these radiographs, a meeting was held in Birmingham, England in 1973 and
again in Gaithersburg, USA in 1975. These conferences aided in the
advancement of neutron imaging techniques by pooling methods and results
from across the world (14).
In 1979 the Neutron Radiography Working Group was formed; its first
meeting being held in Riso, Denmark, through the Commission of the

10
European Communities. The second World Conference was held in 1987 in
Paris, France (15). Papers discussed at these meetings suggested the
development of electronic real-time neutron radiography, something not
achieved until the late 1980’s. This was done using newly developed detectors
for the time, but more importantly, medium to high flux reactors with well-
defined neutron beams (16).

11
2.2 Instrumentation
Once neutron sources became more available, the next real stepping
stone was instrumentation available to record and process detected neutrons
into better radiographs. Radiographs can be taken using different techniques,
each of which provides different information. In order to determine which
method is appropriate, it is first important to note the radiation type. By the
time neutron radiography came to be, x-ray radiography was already well
established. X-rays are attenuated as they pass through or near an atoms
electron cloud, losing energy or being absorbed along the way through pair
production, Compton scattering, and the photoelectric effect. Detectors are
used to ascertain details about the object imaged by comparing attenuated
radiation to that of the uniform beam.
Neutrons however, interact much differently than x-rays. While
ionizing electromagnetic radiation interacts with the electron clouds, neutrons
are only interacting with nuclear forces. This difference is reflected in their
absorption coefficients. X-rays absorption coefficients are directly related to
the size of the atoms and the electron cloud, best represented by the atomic
number, thus x-ray imaging becomes impractical for higher atomic number

12
materials. Neutrons, interacting with the nuclear forces, do not follow this
log-linear trend. They instead follow a seemingly random trend when
comparing their absorption coefficients to the atomic number of a material,
shown in Figure 2.
Figure 2: Attenuation Coefficients Of Neutrons And X-Rays (17)
The attenuation coefficients, µ, are calculated using the cross sections,
σ, of the specific isotopes and the atomic density of the isotope, N, as shown in
the equation The cross section, the main concern of this work, is the
sum of the scattering cross section and the absorption cross section. The two
interactions create the varying trend in Figure 2. Neutrons interacting

13
through absorption can be seen following somewhat of a log-linear trend
similar to x-rays, but since neutrons interact with the nuclear potential of the
isotope, the cross section also varies by isotope. An example of this is
hydrogen having a cross section nearly ten times larger than that of deuterium
where H1 has an incoherent scattering cross section of ~80 barns while
deuterium has an incoherent scattering cross section of ~2 barns (18).
This causes neutrons to be much harder to detect as the detectors must
consist of materials that can capture neutrons effectively. Thus it is easier to
convert neutrons into other particles that can be recorded. Converting the
neutron to an x-ray and using photographic film is one technique.
Photographic film works by using intensifying screens that convert the X-ray
to light, which then produce a visible pattern on the film. However, typical
photographic films are nearly unaffected by neutrons. Because of this, a
converter is placed over the film. The converter screen can be used during the
exposure or post exposure depending on the type of converter. When this is
done during the exposure, it is called direct exposure. When it is done post
exposure, it is called indirect, or transfer(17). An example of the direct
technique is shown in part A of Figure 3. This is where a gadolinium screen is
placed onto a photo-sensitive film and exposed in a neutron beam. Once the

14
neutrons interact with the Gadolinium, the following reaction occurs
157Gd(n,gamma)158Gd. In this case, electron capture is used to produce the
prompt particle emission resulting from the neutron interaction. For a Gd
converter, this is an internal conversion electron that creates a photographic
image upon the film.
The indirect, or transfer, method is shown in part B of the Figure 3.
This is done by exposing only the dysprosium converter screen to the neutron
beam and then placing it upon the photo sensitive film post irradiation. The
film then generates a radiograph by capturing the Beta particle the decay of
following the 164Dy(n,gamma)165Dy reaction (19).

15
Figure 3: Film Radiography Reactions (19)
These methods can have a resolution on the order of tens of µm (19).
While their resolution is competitive, they lack the speed to perform practical
tomography, taking long times to acquire multiple images. This is because
each radiograph requires the removal and replacement of films and converter
screens, after which each film must be developed.
Another neutron radiography detection method involves scintillation
based detectors. The neutron radiography facility at the National Institute for
Standards and Technology (NIST) uses a scintillation light converter screen, a

16
mirror, a condensing lens and a CCD camera to perform neutron radiography.
This is used for radiography by reflecting the scintillation light out of the
beam path using a mirror and focusing this light onto a CCD camera. This
method allows for very fast acquisition of images with a high fluence thermal
neutron beam. This high speed was capable of collecting images for
tomography; however, with a spatial resolution of approximately 200 µm,
high precision tomography is not yet possible with this scintillation detector
(21).
Simultaneously, other detectors were being implemented in order to
transform radiography facilities into tomography capable facilities. One
example of this was done at the BATAN’s RSG-GAS Reactor in Indonesia.
This facility used a CCD camera and an L6ZnS scintillator screen along with a
TiO2 mirror. This facility is currently able to utilize their high flux neutron
beam on the order of 1E6 [ncm2s-1] to carry out tomography scans in times of
around thirty minutes (22).
In January 2006 NOVA Scientific developed a neutron sensitive MCP to
perform neutron radiography, which was tested at NIST. The work done
there resulted in a measured spatial resolution of approximately 15 µm. This

17
was the highest resolution measured with a high-speed neutron sensitive
radiographic imaging system. While the resolution was comparable to or
higher than other modern systems, the detector efficiency was calculated to be
relatively low compared to other system at 18-20% efficiency (23).
This MCP system was made up of thin glass disks with microscopic
holes running through them. These holes run in parallel to make an array of
millions of close-packed hollow glass tubes with diameters from 4 to 100 µm,
where each capillary is an independent, microscopic channel electron
multiplier. There has been extensive testing done at UC Berkeley on the
physics behind MCP detectors. These tests have resulted in a proposed
maximum spatial resolution of approximately 15 µm. While the detector
efficiency is not yet precisely determined, they have performed calculations
showing that a stack of multiple MCPs can yield detection efficiencies
upwards of 78%. However, unlike the detectors in production, this would
require more than two multi channel plates, and possibly upwards of five. (24)
While detector development play an important role in the acquisition of
neutron radiographs, the source being used to acquire them can be said to
play just as important of a role. The most common source utilized today is a
neutron beam from a nuclear reactor. These beam ports are being drastically

18
improved by advancements in collimators being implemented as well as the
orientation of the beam with respect to the reactor. Both of these allow for
lower gamma content of the beam as well as having a heavily thermal beam
instead of a fast neutron source. The lower gamma content is vital due to the
fact that many neutron event counting detectors are sensitive to gamma
radiation as well. The use of cold and thermal neutrons is vital because the
absorption coefficients of fast neutron are much lower and therefore harder to
accurately detect (25).

19
3 Materials And Methods
3.1 Detector And Electronics
MCP imaging detectors with high spatial resolution and timing
accuracy are already widely used for electrons and ions, as well as UV and X-
ray photons. However, it was not until recently that MCPs became applicable
to neutron detection with high two-dimensional spatial resolution. This was
done by adding boron, specifically 10B to the MCP glass structure to enhance
the neutron interaction within the MCP through the 10B(n,α)7Li reaction,
illustrated in Figure 4. This reaction produces Li-7 (1.01 MeV) and a recoil α
particle (1.8 MeV) with a branching ratio of 6%, or Li-7 (0.84 MeV) and an α
particle (1.47 MeV) and a gamma ray (0.48 MeV) with a branching ratio of
94%. (23)
Figure 4: Boron Neutron Interaction (24)

20
These reaction products, primarily the α particle, create secondary
electrons directly in MCP channels through ionizations within the channel
walls, which in turn initiates an electron avalanche and a subsequent strong
output pulse. The α particle has a very short range, approximately 3.5 µm
within the MCP glass, and a very high probability of initiating an electron
avalanche, while the 7Li is absorbed within the glass walls due to its higher
LET. The geometry of these reactions within the MCP detector is illustrated in
Figure 5.
Figure 5: Electron Avalanche (24)

21
The neutron reactions primarily occur in the forward most MCP,
where this MCP provides a gain of 10E6 to 10E7e-. A delay line anode then
captures the electron cloud from the MCP stack and integrates the electrons as
a charge. This allows for the signal to be interpreted by user controlled
electronics and an event location can then be calculated, producing a spatial
resolution of 9 µm. The track length of the α particle, 3.5 µm, can be in any
direction, giving a spatial resolution of ~7 µm. Summing the two values gives
a theoretical maximum neutron event spatial resolution of approximately 15
µm.
Figure 6: MCP/Anode Layout (23)

22
The neutron detection efficiency, Qn, of a 10B-doped MCP detector is
given by the product of three terms, Qn=P1*P2*P3 where P1 is the fraction of
incident neutrons absorbed by the MCP structure, P2 is the fraction of those
interactions that generate an electron avalanche within an MCP channel, and
P3 is the fraction of avalanches registered by the electronics. Due to the
extremely sensitive electronics, an electron avalanche always yields a
detectable electron pulse, resulting in P3=1. Therefore, the primary detection
process consists of the multiplication of the first two terms P1 and P2. The
value of P3 relies upon the MCP detector operation and user control (24). This
control consists of using appropriate bias voltages, configuring MCPs in a
proper configuration, as well as the threshold range of the pulse readout
electronics. Due to the fact that this is a high speed detection system,
optimizing these factors is very practical because the effect of the adjustments
is shown instantly.
P1, the probability of absorption, and P2, the probability of initiating an
avalanche, have been judiciously calculated by Downing, Feller, and Tresmin
(24). While the final Qn was measured, P1 and P2 were not individually
measured in this study.

23
Working under the assumption that the P3 value has been optimized,
the product of P1 and P2 were determined by first calculating the rate of
neutrons incident on the detector. This was calculated in the equation below
by multiplying the neutron flux, with the active area of the detector.
Using this value, and comparing it to the maximum count rate achieved
after the removal of noise, approximately 2.5E5 neutrons s-1, the product P1
and P2, and therefore total efficiency, was calculated below to be
approximately 14%.
3.2 Configuring The Electronics
As discussed, the electronics play a significant role in MCP detector
systems. In order to optimize detection efficiency, the first step requires
setting the voltage bias across the detector plates using the main power
supply. Because the detector is operated within a vacuum, ranging from 10E-
6 to 10E-8 torr, no single voltage bias can be assumed to be the correct value.
However, so long as the vacuum is within this operating range, a starting

24
point of 1800 Volts and 2900 Volts applied to the back and front plates
respectively will start yielding counts within the detector. At this point, with
all of the system thresholds minimized to allow for all events, the bias should
be raised in small windows of 20 V increments without exceeding a voltage
gap of more than 1200 or exceeding 3200 V on either plate, until the event
count rate is optimized. The next step, done visually, is to adjust the
thresholding and timing within preamplifier, constant fraction discriminator,
and time delay card. Again, this is not a set value. Three examples, shown in
Figure 7, show the effects of threshold adjustments. The color gradient
represents registered counts at that location and should be equalized as best as
possible.
Figure 7: Threshold Adjustment Effects

25
Once a relatively uniform image of the neutron beam was achieved, an
oscilloscope was used to adjust each timing and threshold value to fall just
above the level of noise. This allowed for multi-event counting by being able
to segregate each pulse into separate events. Pulse pileups are not a concern
in this work because the neutron flux and the lower detector efficiency result
in count rates lower than the MCP detector system's 1MHz counting rate
capability. Any remaining non-uniformity within the image can be easily
eliminated in post collection processing.
The anode and MCPs are affected by heat as the vacuum pressure
changes as a function of temperature. This caused small deviations within the
timing and voltage bias. The pressure began to stabilize after about an hour of
use; however, prior to this time, each image required a separate threshold
adjustment. Deviations in these radiographs were also able to be corrected by
post collection processing by taking an image of the open beam (flatfield) and
normalizing radiographs to it. This dynamic system must be either constantly
rethresholded to maintain consistency or each individual image must have its
own flatfield for normalization. A combination of these two methods has
proven to be the most practical way to practically collect large numbers of
radiographs in a single time frame.
26
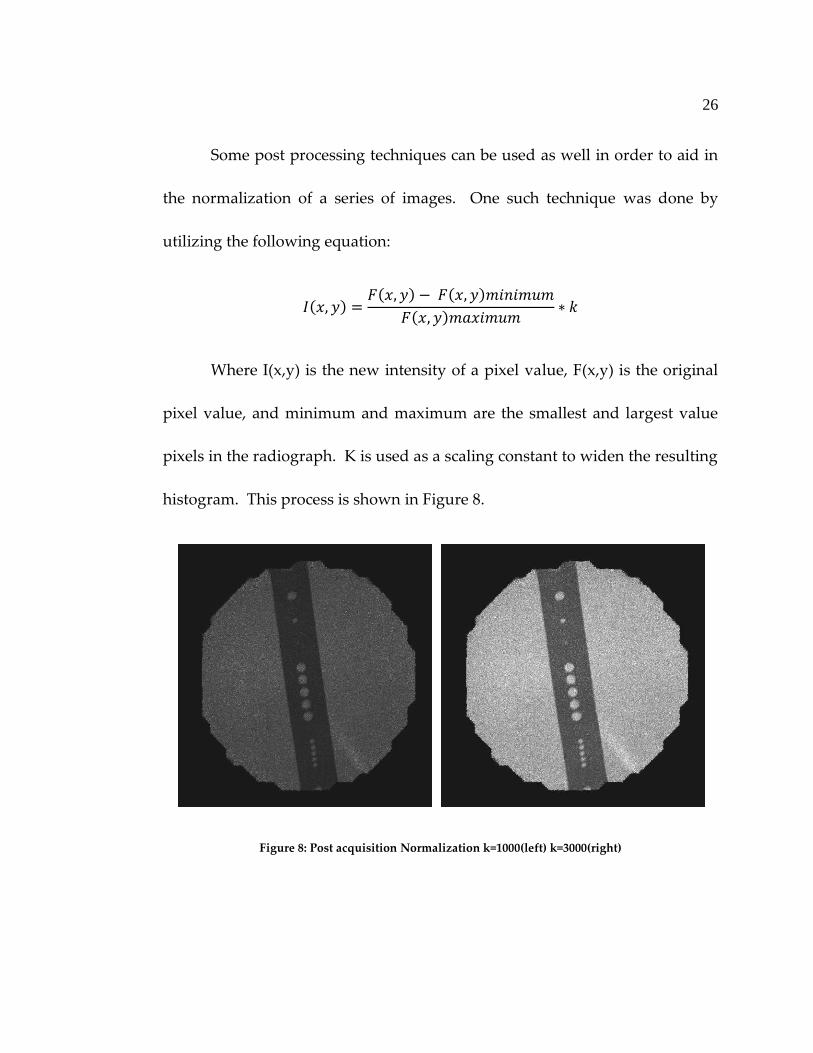
Some post processing techniques can be used as well in order to aid in
the normalization of a series of images. One such technique was done by
utilizing the following equation:
Where I(x,y) is the new intensity of a pixel value, F(x,y) is the original
pixel value, and minimum and maximum are the smallest and largest value
pixels in the radiograph. K is used as a scaling constant to widen the resulting
histogram. This process is shown in Figure 8.
Figure 8: Post acquisition Normalization k=1000(left) k=3000(right)

27
The benefit of using this method is that it can increase brightness and
contrast of the image allowing for small differentiations to stand out. This is
the first step in tomography reconstruction because in order to generate a
sinogram, discussed further in section 3.6, the different attributes of an object
must first be distinguished. Figure 9 illustrates the histograms, or intensity
range, of the images shown in Figure 8. It is apparent that with the correct
value of K the intensity ratio of a specific radiograph can be spread across the
operational range. As this is a sensitive method for correcting a shifting
histogram caused by intensity fluctuations, it only works if the entire object is
represented within each separate radiograph, which will prove to be
important later.
Figure 9: Histograms of Radiographs in Figure 8

28
3.2 Thermal Neutron Beam
The NRF, where this detector is employed, uses a tangentially
orientated beam port, allowing for a predominately thermal neutron beam
while minimizing the amount of gamma radiation in the beam. The beam
slightly increases in size as it crosses the interior of the NRF. The detector was
oriented such that an L/D ratio of 100 was achieved. The beam is an ASTM
E545 Category 1 neutron radiography beam with a thermal neutron flux of
4.6E5 ± 5.0E4 n cm-2 s-1. Thermal neutrons are most valuable for studying
industrial components due to their high penetration through the most widely
used industrial materials such as steel, lead, and aluminum along with their
high attenuation factors in materials such as 10B.
3.3 Pinhole Masks
The next concern, prior to taking measurements, was to correct for any
image distortion. These distortions have a range of causes, ranging from
detector geometry to electronic timing. In order to correct for these
distortions, a pin hole mask was made with known dimensions. Two such
masks were used; the first was an aluminum plate coated with gadolinium

29
oxide in order to increase neutron absorption for maximum contrast. There
were a series of 300 µm in diameter holes drilled throughout the mask spaced
1000 µm apart in grid formation. This mask, shown in Figure 10, proved to
have too large of a spacing to adequately correct the image, although
temporary corrections were able to be made.
Due to the needed correction on the edges of the imaging, where the
distortion was most prominent, a second mask with a 20% scale reduction was
made. This gadolinium mask with 250 µm diameter holes with a pitch of
1mm was instead used for correction. This mask and its correction are
pictured in Figure 11.
Figure 10: Gd Coated Pinhole Mask With 300 µm Diameter Holes.

30
This mask was used to create an algorithm to correct future images and
allow for accurate measurements to be performed.
3.4 Gamma Sensitivity
A significant factor affecting neutron radiography is the gamma
sensitivity of the detector system. Not only is this because many applications
of neutron tomography applications are within a gamma field, but also,
neutron beams from reactors can never fully filter or collimate out the
gammas. Other detectors, such as film and storage phosphors, are easily over
exposed in high gamma fields. The MCP detector in use here, is much less
sensitive to these low LET ionizing radiations than it is to neutrons.
Figure 11: Pinhole Mask Used For Correction, Uncorrected(L) Corrected(R)

31
In order to test this, multiple experiments were done where gamma
sources were introduced along with the inherent gamma radiation from the
reactor beam. The first test was done using a 137Cs source. The 137Cs source had
a strength of 0.02 R hr-1 at 1 meter with a gamma energy of 0.667 MeV. Figure
12 shows images taken of a cadmium strip with drilled holes. There was a
reference image taken of the strip without the source along with images with
the 137Cs source close (~10 cm) to the detector and far (~1 m) from the detector.
Figure 12: Cs-137 Source At 1 Meter (Upper L) At 0.1 Meter (Bottom L) And Respective Images With
Correction (Right)

32
The next source was antimony, 124Sb, to examine the higher energy
gamma. The 124Sb source emits a gamma that is twice the energy of the 137Cs
gamma, at 1.3 MeV. The exposure rate was 0.33 R hr-1 at 1 meter for this 124Sb
source. Figure 13 shows the effect the 124Sb source had on the system at 1
meter from the cadmium strip.
Pictured on the left in Figure 13 is the cadmium strip with no correction
done for gamma sensitivity, and on the right is the gamma corrected image
with the antimony source present. This suggests that the MCP detector
system is able to operate in a high gamma environment.
The detector was then sent for maintenance to eliminate the concavity
of the images. Upon return, the test was repeated with a new antimony
Figure 13: Strip-No Correction(left), With Correction (Right)

33
source. While the same setup was not able to be replicated, the same cadmium
strip was imaged with a mixed 357 mCi 124Sb, 4.6 mCi 122Sb source, yielding
0.39 R/hr at 1 meter. This source, placed at a distance of 0.05 meter from the
detector, producing the images shown in Figure 14.
While there was some gamma sensitivity, Figure 14 suggest that the
system can handle high gamma fields. There was an effect. However, it seems
to be easily manageable by consistently acquiring flatfield and background
images for the correction. If gamma intensity does become a problem, one
possibility would be to add a thin sheet of bismuth as a gamma filter in front
of the detector due to its high Z and low total absorption and scattering
neutron cross section.
Figure 14: Mixed Antimony Source Result (left) Versus no Source (right)

34
DL DL
DB DB
DH
DT
DB: Film densities measured through the images of the
boron nitride disks.
DL: Film densities measured through the images of the lead
disks.
DH: Film density measured at the center of the hole in the
BPI.
DT: Film density measured through the image of the
polytetrafluoroethylene.
∆DL: Difference between the DL values.
∆DB: Difference between the two DB values.
Top View
Side View
3.5 Standards
There are two objects that were used as image quality indicator (IQI)
standards as described in the ASTM standard E545. The first was the Beam
Purity Indicator (BPI), which was used to determine the relative quality of
radiographs obtained by thermal neutron detection. The BPI is a
polytetrafluoroethylene block with two boron nitride disks, two lead disks,
and two cadmium wires. Its purpose is to allow visual analysis of the
radiograph for thermal neutron content of the beam, gamma content, and
overall image quality (1). This standard is illustrated below in Figure 15.
Figure 15: BPI Schematic and Quantitative Definitions

35
The second object in this standard was the Sensitivity Indicator (SI).
The purpose of the SI is to pull information from the radiograph regarding
overall sensitivity of the detector in both spatial resolution and density
discrimination. The SI is a step wedge shaped object containing gaps and
holes. This standard is shown in Figure 16.
Figure 16: ASTM Standard S1 Schematic (Units In Inches) (26)

36
Using the objects imaged for this standard, the Table 1 was used to
determine the category of the detector.
Table 1: Neutron Radiography Standards
Category NC H G S P
I 65 6 6 5 3 3
II 60 6 6 6 4 4
III 55 5 5 7 5 5
IV 50 4 5 8 6 6
V 45 3 5 9 7 7
This table was tabulated using the following values:
Effective thermal neutron content, NC, where
Effective scattered content, S, where
The effective gamma content, γ, where
The pair production content, P, where

37
The largest visible numbered hole in the SI, H, where
Table 2: ASTM Standard Value "H"
Value of H 1 2 3 4 5 6 7 8 9 10 11 12
Shim C C C C B B B B A A A A
And the smallest gap that is visible at all absorber thicknesses, G, where
Table 3: ASTM Standard Value "G"
Value of G 1 2 3 4 5 6 7
Gap T U V W X Y Z
In order to collect these radiographs, the BPI and SI should be
optimally placed next to one another in the same plane as the detector face in
the same image. However, due to size constraints from the detector area and
the parallel beam, separate radiographs were taken. The BPI, images shown in
Figure 17, were acquired through the recording of a unique flatfield, later
divided by the raw image of the BPI, both at one minute exposure times and
normalized following the ASTM standard guide.

38
Shown in Figure 18, radiographs of the SI were also taken with their
own unique flatfield. However, due to the lower contrast of the material,
larger exposure times were required. The raw image was normalized by the
flatfield. Once it was normalized, the histogram was equalized to better
distinguish characteristics.
Figure 17: BPI pictured face-on (left) and at 90 degrees (right)

39
Due to the longer exposure times, the contrast gains were lost because
of the dynamic background inherent to the detector system; as the exposure
times grow the flatfield is no longer able to properly normalize the image,
causing the blur and static in the Figure 18. Through extensive thresholding
Figure 18: Flatfield (top left) SI (top right), Normalized SI (bottom)

40
of the electronics and varying the voltage bias across the detector, a clearer
version was obtained and is shown in Figure 19. On the left is the normalized
image, and on the right is a high contrast threshold done post collection in
order to sharpen the characteristics of the SI standard.
Using these radiographs the standards were analyzed to calculate the
data required of Table 1, the results of which can be found in Table 4. The
results suggest that the detector falls into a class II radiography system by the
ASTM E545 standard.
Table 4: Calculated ASTM Values For MCP Detector
NC H G S P
Value 65 6 5 7 4 3
Class I II III III II I
Figure 19: SI Standard (left) Heavily Thresholded (right)

41
From these standard measurements, primarily the shim thickness
visible, the spatial resolution of the detector was estimated to be between 25
and 38 µm depending upon the contrast of object being imaged. This was
done by using the SI standard and the information in Figure 16.
3.6 Tomography Reconstruction
When an x-ray passes through a material, it is attenuated. This
attenuation is what is used in all x-ray reconstruction. Similarly with
neutrons, we look for the loss of neutrons due to absorption and scattering.
The concept of reconstruction remains very similar. Both cases result in
measuring an intensity drop from the initial beam. Prior to reconstruction it
is first required that a large number of projections must be taken over a set of
degrees. For a parallel beam, radiographs must be taken over 180 degrees
around the object (27).
The next step is to setup the reconstruction process. At every angle, the
same pixel will be analyzed. Below, a basic four pixel problem is illustrated.

42
In this problem, we have a value for every sum from the radiographs,
however, the true values, f1-f4, within the object are unknown (A). The first
step is assuming a solution exists, typically this value is zero to start (B). By
taking the difference between the assumed value and the actual recorded
value and averaging them over the row pixels (C), a new value can be
assumed (D). From there, this is repeated over every recorded angle to find a
solution for every plane of the object. While this is a simplistic view of the
Figure 20: Four Pixel Reconstruction (29)

43
problem it illustrates it well. In practice, when dealing with hundreds of row
pixels and projections, this approach is not practical, but the idea remains.
The filtered backprojection algorithm is a way to represent this in a
much more encompassing way. Like in the simple problem, it is assumed that
each projection represents an independent measurement of the object by using
a Dirac Delta function. These independent measurements are placed together
to map a single row of pixels into a sinogram. Recall the BPI standard from the
previous section. Using the filtered backprojection algorithm, each level can
be represented with its own sinogram, illustrated in Figure 21.

44
In Figure 21, it can be seen that as the object rotates, a sinogram can be
formed in order to map every level of the object. The disk (marked in red and
green) in the BPI, was mapped at every degree of rotation in order to construct
its respective sinogram (bottom left). These sinograms represent the solution
to the backprojection method. By inputting them into such an algorithm, it
Figure 21: BPI and Respective Sinograms

45
was possible to generate an accurate representation of an object. Figure 22
shows two slices from a computed tomograph of the BPI.
Because a full tomograph cannot be viewed more than one slice at a
time, an isosurface can be rendered by outlining the different features in the
tomographic slices. This outlining, or skeleton, of the wire in the BPI is shown
in Figure 23.
Figure 22: tomograph slices of BPI disk (left) and wire (right)

46
The final step in reconstruction was to combine the skeleton
representation from every slice into a full isosurface shown in Figure 24. This
results in a 3-dimensional representation of the BPI. From such an image,
accurate measurements can be taken on the geometry.
Figure 23: Skeleton of BPI wire
Figure 24: Isosurface of the BPI

47
3.7 Applications And The AFIP7 Fuel Element
This same tomographic reconstruction technique can be applied to
more sophisticated objects. One object of particular interest was the AFIP7
reactor fuel element. This is a long element made up of four seperate fuel
plates held together in a bowing congfiguration. This is illustrated in Figure 25
from a front view (top) and a side view (bottom).
This mockup is made of aluminum. In order to view it using neutron
radiography, as aluminum is nearly transparent, a coating of gadolinium
oxide was painted along the surface to provide contrast. The images shown in
Figure 26 are radiographs taken at 0 an 90 degrees respectively, taken from the
side of the element as shown in Figure 25.
Front view
Side view
1 2
3
4
5
6
5
Figure 25: AFIP 7 Mockup

48
From these radiographs, a set of sinograms were able to be created.
Two of which are shown in Figure 27. It is important to note how much more
complicated the sinograms can get when referencing a complicated geometry
instead of a simple object such as the BPI.
Figure 26: Radiographs of AFIP7 element

49
From this set of sinograms, a tomograph was able to be rendered.
However, unlike the previous tomograph, the detail was lacking due to
contrast issues. To counter this, the tomographs slices were superimposed
onto one another to improve contrast. Figure 28 shows the reconstruction of
the element from the front view, and another reconstruction from the side
view. Due to this combination of slices, measurements are still able to be
taken; however, they will have a larger uncertainty with the seperate locations
being condensed into one plane.
Figure 27: AFIP 7 Sinograms

50
From these slices, gap width measurements were taken ranging from
0.135 to 0.16 inches depending up upon the location of the measurement. In
order to properly test these measurements, a gap width probe was used to
check the gap widths in an already proved manner. This probe works as a
parallel plate capacitor with the object being measured. By using electrodes
placed on the probe and running a constant current through the object, the
electrode-object combination record a voltage that is proportional to the gap
between the two. These gap measurements yielded the results shown in
Figures 29-31.
4
1 2
5
3
6
Front view Side view
Figure 28: Tomogrpahic Slices of AFIP 7 Euel Element

51
Figure 29:Top AFIP 7 Gap Measurements.
Figure 30: Center AFIP 7 Gap Measurements
0
0.02
0.04
0.06
0.08
0.1
0.12
0.14
0.16
0.18
0 5 10 15 20 25 30 35
Gap
Siz
e [
INC
HES
]
Distance From Entrance [INCHES}
TOP GAP
GAP1
GAP4
0
0.02
0.04
0.06
0.08
0.1
0.12
0.14
0.16
0 5 10 15 20 25 30 35
Gap
Siz
e [
INC
HES
]
Distance From Entrance [INCHES}
CENTER GAP
GAP2
GAP5

52
Figure 31: AFIP 7 Bottom Gap Measurements
0
0.02
0.04
0.06
0.08
0.1
0.12
0.14
0.16
0.18
0 5 10 15 20 25 30 35
Gap
Siz
e [
INC
HES
]
Distance From Entrance [INCHES}
BOTTOM GAP
GAP3
GAP6

53
4 Discussion And Conclusion
The MCP detector developed by NOVA Scientific used for neutron
detection uses the reaction 10B(n,α)7Li to detect neutrons. This reaction occurs
within the few micron thick glass MCP channel walls doped with 10B. The α
and 7Li products, moving 180 degrees apart to conserve momentum, pass
from the channel wall surfaces into an open MCP channel. These particles,
primarily the α, generate a strong electron avalanche and output pulse in the
detector. Under the condition that the electronics are properly configured, the
probability of initiating an electron avalanche is assumed to be 1. By using a
stack of MCPs, the neutron event detection efficiency is near 100%.
By making corrections for distortions, caused by timing issues, using a
pinhole masks and imaging objects of known dimensions, it is possible to take
accurate measurements of objects being imaged. The spatial resolution has
been determined to be maximized at approximately 25 µm. However, the
contrast of the material plays a large role in the final resolution and must be
taken into account as materials vary. By performing extensive measurements
of ASTM standards, it is shown that the detector ranges from category one to a
category three neutron sensitive detector.

54
Because of the extremely high speed, it is possible to perform
tomography of specific objects. Due to the small active area of the detector, it
is not practical at this time to perform tomography on larger objects. However
when viewing objects within the active area, it is not only possible, but much
faster than previous attempted methods. While typical tomography
procedures require that the images are collected simultaneously and
normalized with the same set of background images, this is not feasible with
this system. The reasoning for this is the dynamic background intrinsic to the
detector. This is countered by segmenting the image collection as much as
possible and providing a unique flatfield, or background image, for as many
radiographs as can be achieved. Previous methods for normalization work
well on objects of smaller sizes. However, when an object is larger than the
active area of the detector the dynamic background cannot be corrected post
processing due to the subsequent loss of vital information which causes the
misrepresentation of geometry.
After comparing the results of the tomography measurements to those
of the gap probe measurements, the tomographic measurements resulted in
slightly higher values of an overall average of 0.145 Inches versus the gap
probe measurements averaging 0.115±0.005 Inches. While this is a 26%

55
increase, the uncertainty in the tomography measurements can be reduced to
obtain better accuracy with his method. One of the main reconstruction issues
here is the incorrect normalization of the radiographs prior to the building of
the sinograms. This goes back to the dynamic background of the system.
Because we are imaging an object with larger area than the active detector
area, the normalizing that has worked in previous reconstruction no longer
can work here. This is because the normalization assumes that the rescaling is
equally represented throughout every image. Where in fact, as the object is
viewed at different angles, more of the object is within the active detector area.
This causes an intensity shift based upon a different neutron absorption rate
along with a shift due to the fluctuation of the detectors background. Because
the normalization is being done to counter the latter of the two changes, the
first change is lost and indistinguishable after the fact. Thus, once a sinogram
is created for reconstruction, the true intensity is lost for some areas and
misrepresented in the later steps. This seemingly small change in the view on
intensity can largely affect the reconstruction of an object that is thicker or
thinner than the actual object being imaged.
In conclusion, the MCP detector used in this study has the resolution
and speed required to capably produce both radiographs and tomographs of

56
useful and competitive quality. The inconsistency of the radiographs caused
by the dynamic background forces twice the amount of images to be collected
to perform tomography of objects fully viewable in the radiographs. This
MCP based detector has a lower efficiency than other systems, approximately
20%, but has already been improved by adding more MCPs.
Future work with this detector is to be done at Idaho National
Laboratory. This work will consist of imaging spent nuclear fuel to better test
the gamma resistivity and tomography capabilities while viewing materials
with high cross sections for neutron interaction. These high cross sections will
allow for better contrast. With higher contrast, it may be possible to cut down
the number of radiographs required to produce a useful tomograph from
hundreds to approximately thirty. Subsequently, this would allow for much
faster acquisition times. The dynamic nature of the detector may be
drastically improved, or minimized, by pulling a lower vacuum allowing for
off gassing within the MCP to be lowered.

57
5 Appendix A: Thermal Neutron Linear Attenuation Coefficients Using
Average Scattering And Thermal Absorption Cross Sections For Naturally
Occurring Elements (28)

58

59
6 Appendix B: Gap Measurements Using Gap Probe
LEFT SIDE OF FUEL ELEMENT
INCHES
FROM
ENTRANCE
Mean of Gap 1
Measurements
Mean of Gap 2
Measurements
Mean of Gap 3
Measurements
1 0.09268 0.12744 0.11624
2 0.08756 0.119725 0.118
3 0.08578 0.11775 0.1191
4 0.0858333 0.1148 0.11972
5 0.08615 0.11388 0.1231
6 0.0885 0.11494 0.1222
7 0.09062 0.11222 0.12546
8 0.09566 0.11124 0.12668
9 0.0998 0.110775 0.1266
10 0.10126 0.1119 0.1266
11 0.1045 0.1088 0.126
12 0.10636 0.1057 0.1288
13 0.10812 0.10656 0.13288
14 0.10872 0.10466 0.12998
15 0.10862 0.10354 0.1302

60
16 0.10836 0.1067 0.12978
17 0.1091 0.10738 0.13042
18 0.1125 0.104875 0.12908
19 0.11686 0.10155 0.13274
20 0.11768 0.1004 0.1333
21 0.11786 0.1007 0.133325
22 0.118775 0.1014 0.13068
23 0.12098 0.1012 0.13108
24 0.12542 0.1033 0.12744
25 0.12848 0.1071 0.12606
26 0.13118 0.1075 0.12444
27 0.1298 0.10928 0.12262
28 0.12878 0.111 0.1213
29 0.12562 0.11278 0.12014
30 0.125 0.1129 0.12054
STDV 0.014602414 0.006138713 0.004844853

61
RIGHT SIDE OF FUEL ELEMENT
INCHES
FROM
ENTRANCE
Mean of Gap 4
Measurements
Mean of Gap 5
Measurements
Mean of Gap 6
Measurements
1 0.11156 0.10582 0.1143
2 0.112375 0.10836 0.1166
3 0.1112 0.10864 0.1176
4 0.1101 0.107483333 0.1192
5 0.1102 0.106575 0.1199
6 0.1107 0.10695 0.1209
7 0.11162 0.1057 0.1218
8 0.1125 0.10432 0.1223
9 0.114775 0.10286 0.12134
10 0.114233333 0.1032 0.12046
11 0.1127 0.105 0.11746
12 0.1121 0.10744 0.1153
13 0.11126 0.11028 0.11358
14 0.1106 0.10926 0.11512
15 0.1095 0.1059 0.1196
16 0.10776 0.0988 0.12548

62
17 0.10762 0.0896 0.1357
18 0.10706 0.0841 0.14726
19 0.10654 0.08818 0.141
20 0.1067 0.0895 0.1369
21 0.106825 0.0968 0.1295
22 0.1153 0.1056 0.12752
23 0.12324 0.115 0.1108
24 0.13436 0.1203 0.104
25 0.14578 0.12116 0.1013
26 0.14616 0.1226 0.0993
27 0.14782 0.12212 0.0998
28 0.15352 0.1196 0.1047
29 0.14136 0.12008 0.1099
30 0.1329 0.11784 0.1144
STDV 0.014279857 0.01014826 0.011406643

63
7 Appendix C: Standards And Equipment
Figure 32: BPI Standard (Left) SI Standard (Right)
Figure 33: Vacuum Pump

64
Figure 34: MCP Detector
Figure 35: AFIP 7 Mock Element in Front of MCP Detector

65
Figure 36: AFIP 7 Element on Rotational Stage
Figure 37: Electronic Process
Voltage Applied to
Plates
Pulse Registered at
Anode
Pulse Adjsuted at Pre
Amplifier
Pulse Shaped at Constant
Fraction Discriminator
Pulses Shaped in CFD
Time Delay Card Maps
Counts
Cobold (PC) writes data
Cobold (PC) generates
Image
Output: Raw Radiographs

66
8 Bibliography
1. INTERNATIONAL, ASTM. Standard Test Method for Determining Image Quality
in Direct Thermal Neutron Radiogrpahic Examination. 2010. E5454-05.
2. E Rutherford, proc Roy soc, a 97, 374-400, 1970.
3. W.D. Harkins, Natural systems for the classification of isotopes…,J Am Chem soc,
43, 10038-1060,1921.
4. J C, possible existence of a neutron, nature 129, 312, 1932.
5. JC. The Existence of a Neutron proc roy soc. 1932. 692-708.
6. Kallman, H. Neutron Radiography Research 1. 1948. 254.
7. Klann, Raymond T. A System for Fast Neutron Radiogrpahy. Crete, Greece : Fifth
International Conference on Applications of Nuclear Techniques , June 1996 .
8. Barton, JP. Proceedings of the ‘World Conferences on Neutron radiography’. Paris,
France : s.n., 1986.
9. Peter, Oz. Neutronen-Durchleuchtung, Naturforsch. 1946. Vol. 1. 557.
10. Thewlis, J. Neutron Radiography. British Journal of Applied Physics. Harwell
England : s.n., 1956. Vol. 7.
11. Berger, H. Proceedings Symposium on Physics and Non-Destructive Testing.
Argonne Illinois : Argonne National Laboratory, 1960. Vols. Anl-6346.
12. Neutron Radiography: Methods, Capabilities, and Applications. new York :
Elsevier publishing company, 1965.
13. Hawkesworth, M.R. Radiography With Neutrons Conference September, 1973.
s.l. : British Nuclear Energy Society, 1975.
14. Berger, H. Practical Applications Of Neutron Radiography And Gauging. 1976.
ASTM STP 586.
15. JP Barton, J Farny, J Person, H Rottger. Introductory Remarks Neutron
Radiography: Proceedings At The Second World Conference On Neutron
Radiography, Paris, France. Dordrecht, Holland : s.n., 1987.

67
16. Sulcoski, Js Brenizer and MF. Real Time Neutron Radiography at the University
of Virginia in use and Development of Low and Medium Flux Reactors. Harling, OK :
s.n., 1984.
17. Domanus, J.C. Neutron Radiography, Techniques and Applications . Roskilde,
Denmark : Risø National Laboratory, October 1987 .
18. Mesot, J. Neutron News. New York : Taylor & Francis, 1992. Vol. Vol. 3 No. 3.
19. Anderson, Ian. Neutron Imaging and Applications. New York, NY: Springer
Science, 2009. p50. Print.
20. Leeman, E.H. Nuclear Instrumentation Methods. 2007.
21. D.S Husey, D.L Jackson, et al. New neutron imaging facility at the NIST.
Gaithersburg, MD : National Institute of Standards and Technology, 2008. Vol. 542,
1-3.
22. S. Sutiarso, B. Bharoto, and A. Fahrurrozi. Development of Three Dimensional
Neutron Tomography at BATAN’s RSG-GAS Reactor. s.l. : National Nuclear Energy
Agency of Indonesia (BATAN) , 2012.
23. Oswald H. Siegmund, John V. Vallerga, Anton S. Tremsin, Jason Mcphate, Bruce
Feller. High spatial resolution neutron sensing microchannel plate detectors. Nuclear
Instruments and Methods in Physics Research Section A: Accelerators, Spectrometers,
Detectors and Associated Equipment. 2007. Vol. 576, 1.
24. Anton S. Tremsin, W. Bruce Feller, R. Gregory Downing. Efficiency optimization
of microchannel plate (MCP) neutron imaging detectors. Nuclear Instruments and
Methods in Physics Research Section A: Accelerators, Spectrometers, Detectors and
Associated Equipment. 2005. Vol. 539, 1-2.
25. The IAEA Technical Meeting on Regional Research Reactor Users’ Networks
(RRUNs): Advances in Neutron Imaging. Serpong, Jakarta, Indonesia : IAEA, 2013.
26. INTERNATIONAL, ASTM. Standard Practice for Fabrication of Neutron
Radiographic Sensitivity Indicators. 2013. Vol. 3.03. E2023-99.
27. inCT. Octopus Manual. Ghent, Belgium : s.n., 2008. Vol. 8.5.
28. International, ASTM. Standard Practices for Thermal Neutron Radiography of
Materials. 2008. E748 – 02.

68
29. Bruyant, Philippe P. Analytic and Iterative Reconstruction Algorithms. Nuclear
Methods. Lyon, France : Nuclear Spectroscopy and Image Processing Research
Group, 2002.