ams copyright notice but before the system becomes elevated, yet another distinct behavior emerges....
TRANSCRIPT

AMS Copyright Notice
© Copyright 2008 American Meteorological Society (AMS). Permission to use figures, tables, and brief excerpts from this work in scientific and educational works is hereby granted provided that the source is acknowledged. Any use of material in this work that is determined to be "fair use" under Section 107 or that satisfies the conditions specified in Section 108 of the U.S. Copyright Law (17 USC, as revised by P.L. 94-553) does not require the Society's permission. Republication, systematic reproduction, posting in electronic form on servers, or other uses of this material, except as exempted by the above statements, requires written permission or license from the AMS. Additional details are provided in the AMS Copyright Policies, available from the AMS at 617-227-2425 or [email protected].
Permission to place a copy of this work on this server has been provided by the AMS. The AMS does not guarantee that the copy provided here is an accurate copy of the published work.

Response of Simulated Squall Lines to Low-Level Cooling
MATTHEW D. PARKER
Department of Marine, Earth, and Atmospheric Sciences, North Carolina State University, Raleigh, North Carolina
(Manuscript received 1 May 2007, in final form 31 July 2007)
ABSTRACT
Organized convection has long been recognized to have a nocturnal maximum over the central UnitedStates. The present study uses idealized numerical simulations to investigate the mechanisms for themaintenance, propagation, and evolution of nocturnal-like convective systems. As a litmus test for the basicgoverning dynamics, the experiments use horizontally homogeneous initial conditions (i.e., they includeneither fronts nor low-level jet streams).
The simulated storms are allowed to mature as surface-based convective systems before the boundarylayer is cooled. In this case it is then surprisingly difficult to cut the mature convective systems off from theirsource of near-surface inflow parcels. Even when 10 K of the low-level cooling has been applied, thepreexisting system cold pool is sufficient to lift boundary layer parcels to their levels of free convection. Thepresent results suggest that many of the nocturnal convective systems that were previously thought to beelevated may actually be surface based. With additional cooling, the simulated systems do, indeed, becomeelevated. First, the CAPE of the near-surface air goes to zero: second, as the cold pool’s temperature deficitvanishes, the lifting mechanism evolves toward a bore atop the nocturnal inversion. Provided that air abovethe inversion has CAPE, the system then survives and begins to move at the characteristic speed of the bore.Interestingly, as the preconvective environment is cooled and approaches the temperature of the convectiveoutflow, but before the system becomes elevated, yet another distinct behavior emerges. The comparativelyweaker cold pool entails slower system motion but also more intense lifting, apparently because it is morenearly balanced by the lower-tropospheric shear. This could explain the frequent observation of intensifyingconvective systems in the evening hours without the need for a nocturnal low-level jet. The governingdynamics of the simulated systems, as well as the behavior of low-level tracers and parcel trajectories, areaddressed for a variety of environments and degrees of stabilization.
1. Introduction
Thunderstorms and mesoscale convective systems(MCSs) have long been recognized to have a nocturnalmaximum over the central United States (e.g., Wallace1975; Maddox 1980). As well, MCSs commonly occuron the cold side of midlatitude warm and stationaryfronts [e.g., the “type-1 events” reviewed by Fritsch andForbes (2001)]. It has frequently been assumed thatconvection is “elevated” when it occurs at night or onthe cold side of a front, and Colman (1990) claimed thatmost cold season thunderstorms (outside of Florida)were likely of the elevated type.
For the purposes of this paper, a convective system is
said to be elevated if it is not ingesting air from thenear-surface layer (e.g., the lowest 500 m or so). Othercolloquial definitions for elevated convection abound,but this one is physically robust and closely follows thedefinition in the Glossary of Meteorology (Glickman2000). Conversely, a system that is ingesting air fromthe lowest levels is here called surface based, regardlessof whether that air has the greatest potential buoyancy(i.e., the “most unstable” CAPE) in the sounding ornot. The present study focused on the conditions inwhich long-lived convective systems may be elevatedversus surface based, and the dynamics distinguishingand governing the two phases.
Elevated MCSs are thought to be decoupled from thestable planetary boundary layer air that lies beneaththem. Previous authors have commented on the likeli-hood that the stable nocturnal or postfrontal boundarylayer would inhibit deep penetrative downdrafts fromaloft (e.g., Trier and Parsons 1993), and would create a
Corresponding author address: Dr. Matthew Parker, CampusBox 8208, North Carolina State University, Raleigh, NC 27695-8208.E-mail: [email protected]
APRIL 2008 P A R K E R 1323
DOI: 10.1175/2007JAS2507.1
© 2008 American Meteorological Society
JAS2507

regime more favorable for the propagation of trappedinternal gravity waves or bores (e.g., Carbone et al.1990). In such cases, the classical propagation mecha-nism of lifting by a surface cold pool (e.g., Rotunno etal. 1988) does not seem to apply. Indeed, some ex-amples (e.g., Maddox 1980; Trier and Parsons 1993)reveal that the passage of an elevated MCS may bemarked by minimal changes in the surface temperature.Even so, at least a subset of MCSs are known to pro-duce severe winds at night and on the cold side of fronts(e.g., Johns and Hirt 1987; Kuchera and Parker 2006).One possibility is that such systems are still cold pooldriven and surface based, despite their comparativelystable boundary layers. For example, the simulations ofConiglio and Stensrud (2001), in a composite derechoenvironment, appear to exemplify this behavior.
Numerous case studies, extending back throughthose by Maddox (1983) and Wetzel et al. (1983), havedocumented the basic synoptic meteorological patternsand mesoscale flow regimes associated with nocturnalMCSs, including the frequent presence of a nocturnaltemperature inversion, a low-level jet with significantattendant warm advection, and an elevated maximumin equivalent potential temperature (�e). Fritsch andForbes (2001) dubbed such cases “type 1” convectivesystems, and noted that a synoptic front often is presentto assist in lifting warm sector air parcels. Indeed, intheir review they point out numerous examples inwhich lower-tropospheric warm advection and isen-tropic ascent are fundamental to the environments ofMCSs.
There are a wide variety of case study simulationsthat have included elevated convection on the cool sideof fronts [i.e., the type-1 systems of Fritsch and Forbes(2001)]. For example, Trier et al. (2006) provided adetailed study of the role of mesoscale features (fronts,low-level jets, etc.) in fashioning the environment forsimulated elevated convective storms. However, asshown by Cotton et al. (1983) and Wetzel et al. (1983),nighttime convective systems over the central UnitedStates often develop as surface-based storms earlier inthe day over the high terrain to the west. As a litmustest for the basic dynamics governing such convection,the present numerical experiments use horizontally ho-mogeneous initial conditions (i.e., they include neitherfronts nor low-level jet streams). A cold-pool-drivenconvective system develops in the base-state environ-ment [i.e., the “type 2” systems of Fritsch and Forbes(2001)]; low-level cooling is then applied, mimickingthe evolution of an MCS as the sun sets (or, as the MCScrosses a front). Subsequent convection could possiblybe maintained by lifting air from above the stabilizedlayer; or, if the surface cold pool persists, convection
could possibly be maintained by air from within thestabilized layer, provided that it has convective avail-able potential energy (CAPE) and that the cold poolprovides sufficient lifting to overcome any convectiveinhibition (CIN) that is present.
Within a typical statically stable environment, con-vectively generated mass and momentum perturbationslead to tropospheric gravity waves. For example, con-vective systems produce internal gravity waves withboth high and low frequencies; Fovell et al. (2006) re-cently provided a nice review of both sorts of convec-tively generated waves, while analyzing their forms andimpacts within the troposphere. In addition to thesetropospheric internal waves, convective systems alsoproduce low-level outflow as a result of convectivecooling. The form taken by this outflow is an importantelement of the present experiments that include bound-ary layer cooling. For example, Raymond and Rotunno(1989) and Haertel et al. (2001) have shown thatchanges to the low-level stability impact whether anoutflow is mainly in the form of a density current orgravity waves. In statically neutral conditions (i.e., theafternoon boundary layer), the lower-tropospheric re-sponse to cooling is a density current. Such density cur-rent outflows are often the mechanism for self-regenerating convective systems (e.g., Rotunno et al.1988). However, the response of a statically stableboundary layer to cooling is at least partly in the formof gravity waves along the stable layer. Even though thesimulations of Raymond and Rotunno (1989) andHaertel et al. (2001) did not include actual self-regenerating convective systems, a reasonable infer-ence from their studies is that low-level gravity waveoutflows could become the primary mechanism for con-vective redevelopment if the waves both (i) move intothe environment more quickly than the density currentresponse, and (ii) produce enough vertical displace-ment to lift low-level air to its level of free convection(LFC).
Schmidt and Cotton (1990) modeled an elevated con-vective system whose rapid speed they attributed tosuch wave propagation. In essence, the system’s mainupdraft region was directly above the hump in the isen-tropes associated with the gravity wave. Buzzi et al.(1991) also simulated a squall line with a stable bound-ary layer and noted the presence of a “large amplitudesolitary gravity wave” in the low levels. In these twostudies, as well as in some of the simulations of Dudhiaet al. (1987), boundary layer parcels underwent verticalexcursions but then descended again without reachingtheir LFCs; the convective updrafts were fed from aloftand appeared to be decoupled from the low-level flow.Although the gravity waves did not raise near-surface
1324 J O U R N A L O F T H E A T M O S P H E R I C S C I E N C E S VOLUME 65
parcels to their LFCs, the hump in the isentropes asso-ciated with the wave provided lifting for air parcelsabove the stable layer. Schmidt and Cotton (1990) em-phasized the phasing between upper- and lower-tropospheric gravity waves in shear and they also re-viewed some other historical theories about the rela-tionship of gravity waves to squall line propagation. Inthe present paper, low-level gravity wave outflows aretreated somewhat simply as mechanisms for the liftingof lower-tropospheric air parcels to their LFCs, withoutreference to some of the more extravagant feedbacksthat may occur thereafter.
When a well-developed density current encounters astable layer, an internal bore can also result (e.g.,Klemp et al. 1997). Carbone et al. (1990) discussed re-generation of nocturnal convection by an undular boreand noted that the bore response lay in the middle of acontinuum between pure density current outflows(dominated by mass transport) and pure gravity waveoutflows (having no mass transport). They noted evo-lution in time from the density current mode towardinternal bores, and finally solitary gravity waves as en-ergy was dissipated from the disturbance within thestable boundary layer. Recent high-resolution observa-tions by Knupp (2006) showed a very similar progres-sion. Liu and Moncrieff (2000) noted that these variousoutflow modes can coexist in environments with inter-mediate stratification, and simulated complex multi-headed density currents with “solitary wave-like orbore-like disturbances” propagating out ahead of thecurrent. Haertel et al. (2001) also discussed scenarios inwhich convective outflow may be expressed in terms ofcombinations of the density current and gravity waveprocesses. In effect, bore dynamics can resemble thoseof either phenomenon. For example, Klemp et al.(1997) noted that, as the depth of the prebore stablelayer decreases, the speed of the bore approaches thedensity current speed and, as depth of the preborestable layer increases, the speed of the bore approachesthe intrinsic gravity wave speed.
For such reasons, Haertel et al. (2001) eschewed theterm “bore” (they found it to be ambiguous). In thepresent study, wavelike disturbances are accompaniedby a “sudden, and relatively permanent change” in ve-locity and in the height of the stable layer’s top [i.e., thedefinition of Locatelli et al. (1998)]. Fluid passesthrough the disturbances, rather than being lifted upand over them [i.e., as described and analyzed byKlemp et al. (1997)]. Thus, the disturbances will bereferred to as bores, although they share some proper-ties with solitary gravity waves.
Both Dudhia et al. (1987) and Buzzi et al. (1991)found that the lower-tropospheric shear was important
to the sustenance of wave-driven convection in thepresence of a lower-tropospheric stable layer. Further-more, the vertical wind shear helped determine wheth-er the gravity wave or density current mode of liftingpredominated in the simulations of Dudhia et al.(1987). In the present simulations, the vertical windshear was not varied among the experiments, but wassimply set to an intermediate value (section 3) so thatattention could be focused elsewhere.
The principal goal of this study is to understand theevolution of the convection as the boundary layerslowly becomes more stable with time. The novelty ofthe present simulations, when compared to those re-viewed above, is in the slow introduction of the low-level cooling. As well, the present simulations are 3D,permitting a more realistic variety of convective stormtypes and trajectories than the preceding studies. Fi-nally, the present simulations may be the first with suf-ficient vertical and horizontal resolution [on the orderof that recommended by Bryan et al. (2003)] to depictthe differing internal processes associated with surface-based versus elevated storms. These simulations aremeant primarily to mimic the evolution of organizedconvection as the sun sets, a situation that is frequentlyrealized in nature [e.g., the scenario of Cotton et al.(1983) and Wetzel et al. (1983)].
2. Method
This work incorporated 2D and 3D simulations usingversion 1.10 of the nonhydrostatic cloud model de-scribed by Bryan and Fritsch (2002). Because it was notpossible to perform every simulation at high resolutionin 3D, the 2D simulations were used to explore theparameter space for this study. The 2D sensitivity ex-periments, along with several 3D control runs, werethen used to select a subset of 3D “production runs.”The 2D and 3D simulations were very similar in termsof the convective structures and systems’ evolutions;even so, the limitations of 2D simulations are wellknown. Therefore, all of the detailed analyses that fol-low are strictly from the 3D simulations.
To represent convective clouds, the simulations usedice microphysics [the Lin et al. (1983) scheme, withmodifications as described by Braun and Tao (2000)].All simulations had horizontal grid spacings of 250 mand a maximum vertical grid spacing of 250 m, whichdecreased progressively to 100 m below z � 3500 m.The condensed grid in the lower troposphere improvedthe depiction of “nocturnal” stable layers in the model.The 2D simulations used a grid that was 800 � 20 km;the 3D simulations used a grid that was 400 � 60 � 20km. In both cases, the along-line dimension was peri-
APRIL 2008 P A R K E R 1325
odic. The model had free-slip upper and lower bound-aries with a Rayleigh damping layer above 14 km tominimize the impacts of reflections from the model top.
The simulations were meant to isolate the fundamen-tal dynamical processes that govern convection on shorttime scales. Therefore, the model was configured in ahighly idealized way, and mesoscale features such asfronts and low-level jets were excluded. The Coriolisacceleration was neglected, and the initial conditionswere horizontally homogeneous. To initiate convectionthe model included an infinitely long, north–south, lin-ear warm bubble (�2 K, with a relative humidity of0.85); in the 3D simulations random temperature per-turbations of up to 0.1 K were added to ensure that 3Dmotions developed.
All of the simulations used one of three idealizedinitial soundings: the convection sounding of Weismanand Klemp (1982, hereafter “WK82”); the mean mid-latitude MCS sounding of Parker and Johnson (2004,
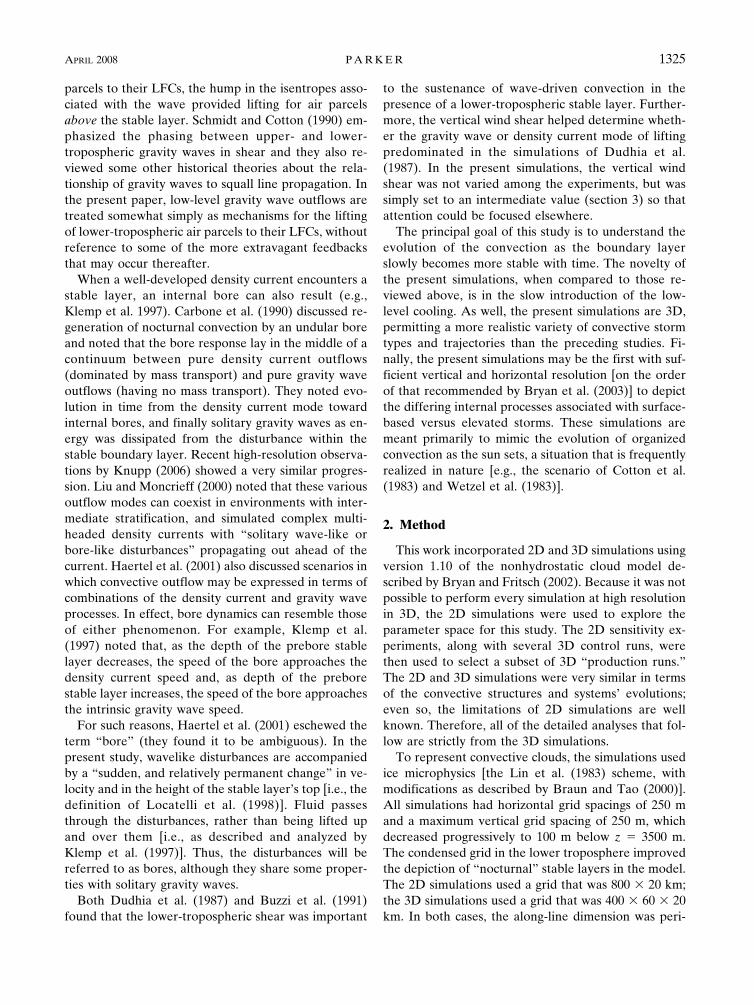
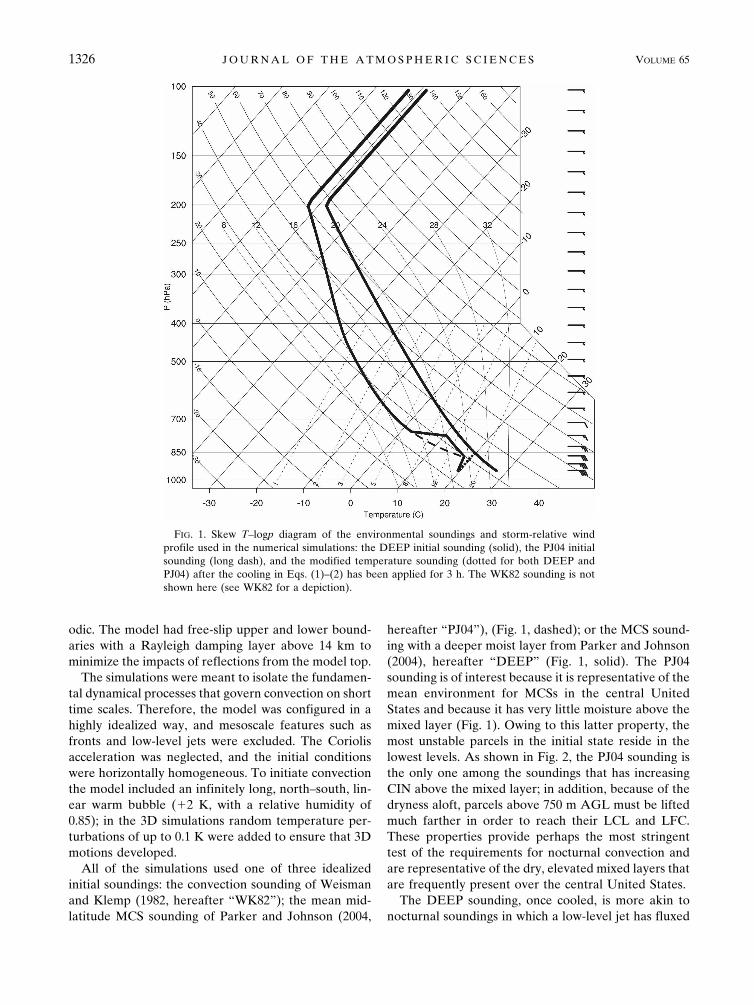
hereafter “PJ04”), (Fig. 1, dashed); or the MCS sound-ing with a deeper moist layer from Parker and Johnson(2004), hereafter “DEEP” (Fig. 1, solid). The PJ04sounding is of interest because it is representative of themean environment for MCSs in the central UnitedStates and because it has very little moisture above themixed layer (Fig. 1). Owing to this latter property, themost unstable parcels in the initial state reside in thelowest levels. As shown in Fig. 2, the PJ04 sounding isthe only one among the soundings that has increasingCIN above the mixed layer; in addition, because of thedryness aloft, parcels above 750 m AGL must be liftedmuch farther in order to reach their LCL and LFC.These properties provide perhaps the most stringenttest of the requirements for nocturnal convection andare representative of the dry, elevated mixed layers thatare frequently present over the central United States.
The DEEP sounding, once cooled, is more akin tonocturnal soundings in which a low-level jet has fluxed
FIG. 1. Skew T–logp diagram of the environmental soundings and storm-relative windprofile used in the numerical simulations: the DEEP initial sounding (solid), the PJ04 initialsounding (long dash), and the modified temperature sounding (dotted for both DEEP andPJ04) after the cooling in Eqs. (1)–(2) has been applied for 3 h. The WK82 sounding is notshown here (see WK82 for a depiction).
1326 J O U R N A L O F T H E A T M O S P H E R I C S C I E N C E S VOLUME 65
higher �e air into place above the boundary layer.Therefore, the working hypothesis was that the DEEPenvironment would better support elevated convection.The WK82 sounding was also used for the preliminary2D experiments simply because of its prevalence in thehistory of convection simulations. Its basic lower-tropospheric properties are similar to the DEEP sound-ing; the principal difference is that it is moister in themiddle and upper troposphere, which should slightlyfavor stronger, longer-lived storms. The control simu-lations had linear u wind shear totaling 18 m s�1 below3 km, with constant wind above (e.g., Fig. 1); this isroughly the same shear vector magnitude as the pre-ferred value for strong squall lines highlighted by Bryanet al. (2006).
Finally, the model included no boundary layer or ra-diative transfer parameterizations. Instead, it was peda-gogically more valuable to add artificial cooling withinsome of the model runs. The cooling was added afterthree hours of simulated time (around the time whenthe simulated squall lines reached maturity). It was ac-complished by defining a reference temperature
Tref � 301 K � �t � 3 h� � 3 K h�1, �1�
and at each time step setting the temperature at allpoints below 1 km AGL to be
T � min�T, Tref�. �2�
The net effect was the creation of an isothermal layerwhose temperature decreased from the initial surfacetemperature (301 K) at a rate of 3 K h�1; because Tdecreased with height in the initial condition, the stable
layer was initially shallow and grew slowly to its maxi-mum depth of 1 km over the course of roughly 3 h (Fig.1, dotted).
The artificial cooling technique is a simple way ofenabling the convection to mature in an afternoon-likesounding and then to evolve as a nocturnal-like sound-ing develops. It might also represent the gradual tran-sition experienced by a mature MCS crossing over tothe cool side of a warm or stationary front. In variousexperiments, the cooling was applied until Tref hadreached between 280 and 291 K (net surface coolingbetween 10 and 21 K) in order to create stable layers ofdiffering densities. Although, in reality, a fog wouldeventually form as the saturation vapor pressure de-creased with Tref, this was not well handled by the ide-alized microphysical parameterization. Therefore,when the artificial cooling was applied, the relative hu-midity was reset to be no larger than 0.98 through theinstantaneous removal of water vapor (without any la-tent heat release).
As Tref falls in time [Eq. (1)], the application of Eq.(2) causes the temperature difference between the out-flow and the environment to decrease with time, as longas the outflow’s temperature is lower than Tref. There-fore, in order to isolate the possible importance of out-flow strength versus environmental stability, an alter-nate cooling technique was also constructed (section3d). The cooling to Tref via Eq. (2) was applied betweenhours 3 and 5 of the simulation, after which all of the airbelow 1 km AGL was cooled at a constant rate of 3 Kh�1 (including the convective outflow). This alternateconfiguration preserved the temperature difference be-tween the outflow and the environment even as theboundary layer became increasingly stable.
Finally, in order to understand the response of low-level inflow air to the various imposed cooling profiles,passive tracers and massless parcels were inserted intothe lowest 500–2500 m of the model domain and wereintegrated forward during the model time steps. Theparcel trajectories were based on translation by thegridscale winds, whereas the passive tracers were alsosubject to the subgrid turbulent and numerical diffusionschemes. For all of the 3D runs that follow, the passivetracer was inserted in the 0–500-m AGL layer. There-fore, the presence of low-level air in convective up-drafts can be inferred from the concentration of thistracer at midlevels.
3. Results
The early stages of this work involved a survey ofover forty 2D simulations using the three initial sound-ings with multiple model configurations. There were
FIG. 2. CAPE and CIN for parcels at each level in the threeinitial soundings, using line styles as shown. For example, thesurface parcel in the WK82 sounding has 2000 J kg�1 of CAPEand �40 J kg�1 of CIN. The curves are truncated at the levelabove which no other parcels have CAPE.
APRIL 2008 P A R K E R 1327
several preliminary sensitivity tests (not shown) thathelped to qualify and guide the final control runs’ con-figurations. First, in order to determine the ability ofthe environments to support convection that was totallydecoupled from the near-surface air in the base state,pilot simulations used soundings with the lowest 1 kmtruncated (but with no cooling applied). In the“chopped” experiments, as anticipated, the WK82 andDEEP soundings supported long-lived convection,whereas the PJ04 sounding did not. The results for thethree soundings were the same in “initial inversion”simulations, which had a 1-km-deep isothermal layer of291 K (i.e., 10 K of surface cooling) present in the initialcondition.
Once grounded by the preceding initial tests, theprincipal battery of 2D simulations permitted an assess-ment of the importance of the initial sounding to thebehavior of the convection (WK82 versus PJ04 versusDEEP) when various amounts of lower-troposphericcooling were applied. Most of the run-to-run sensitivi-ties were similar for the various soundings, and the gen-eral impact of the cooling was the same in all three ofthe environmental soundings in the 2D simulation ma-trix. The robustness of the sensitivities within this pilotexperiment provides some assurance that the resultsare not solely a function of the sounding used. There-fore, in order to complete the model runs in a reason-able amount of time, the 3D simulations focused onsensitivities within PJ04 and DEEP MCS environ-ments. There was strong agreement between corre-sponding 2D and 3D runs. However, the followinganalyses of governing dynamics are based only uponthe fully 3D simulations.
a. Control runs
The control simulations in both of the MCS environ-ments (DEEP-ctl and PJ04-ctl) produced squall lineswith evolutions typifying organized convection in themidlatitudes. The environments have ample CAPE, thevertical wind shear is appropriate for strong long-livedconvective systems, and there is sufficient dry air aloftfor the generation of cold downdrafts and surface out-flow.
The two control simulations were very similar incharacter. The great resemblance of PJ04-ctl to DEEP-ctl stems from the identical wind profiles and low-levelCAPE values (i.e., below 750 m AGL in Fig. 2). Bothsimulations produce a long-lived convective line (withtrailing stratiform precipitation) that is cold pool drivenand surface based. The supporting figures for this sec-tion depict the DEEP-ctl simulation in order to facili-tate a more direct comparison with the other DEEPsimulations reported in sections 3b and 3d. However,
the discussion applies equally to the PJ04-ctl results,which are not depicted for brevity.
After 1 h in which the initial convective trigger leadsto weakly organized storms, the systems’ surface out-flows begin to intensify. This initial stage will be re-ferred to as “strengthening,” because the systems’ sizeand outflow temperature perturbations are increasingduring the period. By the end of the stage, the systems’eastward motion commences, as is readily apparentfrom the Hovmöller diagram of updraft speed andtracer concentration aloft (middle panel of Fig. 3).
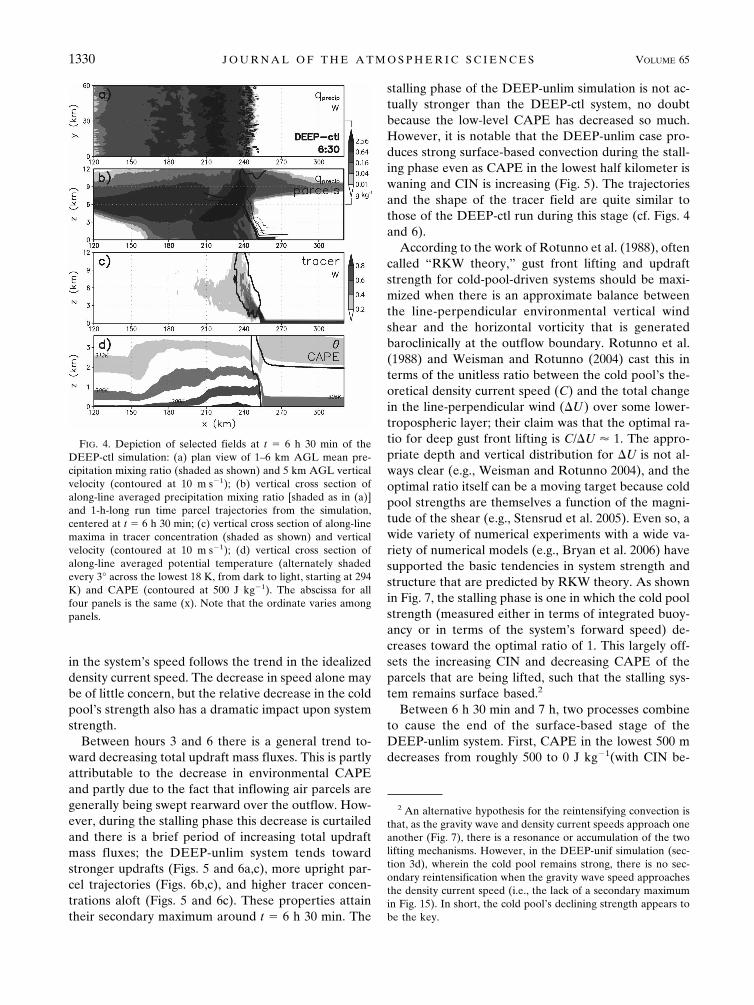
After roughly t � 2 h 30 min, the simulations’ surfaceoutflows have a nearly constant temperature deficit ofroughly 14 K (left panel of Fig. 3). This second stagewill be referred to as “quasi steady,” because the sys-tems’ speeds and typical updrafts’ strengths are roughlyconstant. Throughout this quasi-steady phase the sys-tems’ updrafts comprise air from the lowest part of thetroposphere. The lifting of these low-level parcels isaccomplished by the surface cold pool (Fig. 4d). As thesystems move forward, the inflowing lower-tropo-spheric air is swept rearward over their cold pools (Figs.4b,c), leading to the development of trailing stratiformprecipitation (Figs. 4a,b).
Although the 3D simulations were halted after 8 h, in2D the systems remain quasi steady for as long as thesimulations run. Based upon outflow temperature andsystem motion speed, the period of quasi-steady behav-ior begins sometime between 2 and 3 h into the simu-lation. Therefore, the experiments with artificial low-level cooling were configured to allow the convectivesystems to develop for 3 h, after which the model en-vironment was slowly modified. In this configuration,any subsequent changes in system speed, cold pool tem-perature, tracer concentration, or the like are thereforeattributable to modifications of the environment, not tothe maturation of the squall line itself.
b. Addition of unlimited cooling
Given that simulations using the initial inversion and“chopped” versions of the PJ04 sounding did not pro-duce long-lived convective systems, it is not surprisingthat, when unlimited cooling is introduced into themodel (i.e., Tref is allowed to decrease indefinitely), thesimulated PJ04-unlim squall line decays into a veryweak and disorganized precipitation system (notshown). By t � 10 h, it bears no resemblance to themature squall lines in the control runs. However, aweak but organized convective system does survivewhen limited cooling is applied to the PJ04 simulations.Thus, the PJ04 simulations are set aside for now and areexplored in the next section. The following results arefrom the DEEP sounding for the case of unlimited
1328 J O U R N A L O F T H E A T M O S P H E R I C S C I E N C E S VOLUME 65

cooling. Because the DEEP sounding has elevated par-cels with CAPE, it remains healthy and well organizedthrough the full 10-h simulation. The DEEP-unlim sys-tem’s transition from a surface-based to an elevatedsystem is therefore more instructive because it is notsimultaneously disintegrating.
The first three hours of the DEEP-unlim run areidentical to those of the DEEP-ctl run with the systempassing through the strengthening stage and into thequasi-steady stage (cf. Figs. 3 and 5). Once cooling isapplied below 1 km after t � 3 h, the lower-tropospheric CAPE begins to decrease (right panel ofFig. 5), and the cold pool’s temperature deficit (relativeto the environment) begins to diminish (Fig. 5). Despitethese facts, the system’s middle-tropospheric updraftspeeds and tracer concentrations are very similar to thosein the control run through roughly t � 5 h 30 min. Al-though the two simulations are not identical, it is fair tosay that the addition of roughly 7–8 K of surface coolinghas relatively little impact, and the DEEP-unlim simu-lation continues to exhibit its quasi-steady behavior.Notably, because the cooling via Eqs. (1) and (2) cre-ates an increasingly deep isothermal layer, it takes timebefore the CAPE farther aloft decreases (Fig. 5).
From roughly t � 5 h 30 min to 7 h 30 min, theDEEP-unlim system then enters a third stage that is notexhibited by the DEEP-ctl simulation. The system’sspeed decreases as the environment’s temperature be-gins to approach that of the convective outflow; hence,the period will be referred to as “stalling” (Fig. 5). Thatthe updraft forcing is still driven by density current dy-namics is apparent from a cross section of potentialtemperature (Fig. 6d), as well as the upward displace-ment of all inflow parcels at the gust front (Figs. 6b,c).The slowing of the cold-pool-driven system is in keep-ing with the basic dynamics of density currents, whosespeeds are proportional to the square root of the tem-perature difference across the outflow boundary. Asshown in Fig. 7, the system’s speed is not quite as largeas the theoretical density current speed1; but, the trend
1 The speed of the system’s outflow may be diminished becauseof the quasi-static impacts of positively buoyant air aloft (as dis-cussed by Trier et al. 2006) as well as by the opposing low-levelvertical wind shear. However, Bryan and Rotunno (2008) havealso reviewed other theoretical reasons why the classical densitycurrent speed may overestimate the motion of realistic atmo-spheric density currents.
FIG. 3. Depiction of the DEEP-ctl simulation over time: (left) values vs time for the refer-ence temperature used in Eq. (2) (Tref) and the minimal surface temperature on the domain(Tmin), using line styles as shown; (center) Hovmöller diagram for 5 km AGL, with along-linemaxima in tracer concentration (shaded as shown) and vertical velocity (contoured at 10, 15,20, and 25 m s�1); (right) vertical profile of environmental CIN (shaded as shown) and CAPE(contoured at 500, 1000, and 2000 J kg�1, with bold contour at 0) vs time. The ordinate for allthree panels is the same (time).
APRIL 2008 P A R K E R 1329
in the system’s speed follows the trend in the idealizeddensity current speed. The decrease in speed alone maybe of little concern, but the relative decrease in the coldpool’s strength also has a dramatic impact upon systemstrength.
Between hours 3 and 6 there is a general trend to-ward decreasing total updraft mass fluxes. This is partlyattributable to the decrease in environmental CAPEand partly due to the fact that inflowing air parcels aregenerally being swept rearward over the outflow. How-ever, during the stalling phase this decrease is curtailedand there is a brief period of increasing total updraftmass fluxes; the DEEP-unlim system tends towardstronger updrafts (Figs. 5 and 6a,c), more upright par-cel trajectories (Figs. 6b,c), and higher tracer concen-trations aloft (Figs. 5 and 6c). These properties attaintheir secondary maximum around t � 6 h 30 min. The
stalling phase of the DEEP-unlim simulation is not ac-tually stronger than the DEEP-ctl system, no doubtbecause the low-level CAPE has decreased so much.However, it is notable that the DEEP-unlim case pro-duces strong surface-based convection during the stall-ing phase even as CAPE in the lowest half kilometer iswaning and CIN is increasing (Fig. 5). The trajectoriesand the shape of the tracer field are quite similar tothose of the DEEP-ctl run during this stage (cf. Figs. 4and 6).
According to the work of Rotunno et al. (1988), oftencalled “RKW theory,” gust front lifting and updraftstrength for cold-pool-driven systems should be maxi-mized when there is an approximate balance betweenthe line-perpendicular environmental vertical windshear and the horizontal vorticity that is generatedbaroclinically at the outflow boundary. Rotunno et al.(1988) and Weisman and Rotunno (2004) cast this interms of the unitless ratio between the cold pool’s the-oretical density current speed (C) and the total changein the line-perpendicular wind (�U) over some lower-tropospheric layer; their claim was that the optimal ra-tio for deep gust front lifting is C/�U 1. The appro-priate depth and vertical distribution for �U is not al-ways clear (e.g., Weisman and Rotunno 2004), and theoptimal ratio itself can be a moving target because coldpool strengths are themselves a function of the magni-tude of the shear (e.g., Stensrud et al. 2005). Even so, awide variety of numerical experiments with a wide va-riety of numerical models (e.g., Bryan et al. 2006) havesupported the basic tendencies in system strength andstructure that are predicted by RKW theory. As shownin Fig. 7, the stalling phase is one in which the cold poolstrength (measured either in terms of integrated buoy-ancy or in terms of the system’s forward speed) de-creases toward the optimal ratio of 1. This largely off-sets the increasing CIN and decreasing CAPE of theparcels that are being lifted, such that the stalling sys-tem remains surface based.2
Between 6 h 30 min and 7 h, two processes combineto cause the end of the surface-based stage of theDEEP-unlim system. First, CAPE in the lowest 500 mdecreases from roughly 500 to 0 J kg�1(with CIN be-
2 An alternative hypothesis for the reintensifying convection isthat, as the gravity wave and density current speeds approach oneanother (Fig. 7), there is a resonance or accumulation of the twolifting mechanisms. However, in the DEEP-unif simulation (sec-tion 3d), wherein the cold pool remains strong, there is no sec-ondary reintensification when the gravity wave speed approachesthe density current speed (i.e., the lack of a secondary maximumin Fig. 15). In short, the cold pool’s declining strength appears tobe the key.
FIG. 4. Depiction of selected fields at t � 6 h 30 min of theDEEP-ctl simulation: (a) plan view of 1–6 km AGL mean pre-cipitation mixing ratio (shaded as shown) and 5 km AGL verticalvelocity (contoured at 10 m s�1); (b) vertical cross section ofalong-line averaged precipitation mixing ratio [shaded as in (a)]and 1-h-long run time parcel trajectories from the simulation,centered at t � 6 h 30 min; (c) vertical cross section of along-linemaxima in tracer concentration (shaded as shown) and verticalvelocity (contoured at 10 m s�1); (d) vertical cross section ofalong-line averaged potential temperature (alternately shadedevery 3° across the lowest 18 K, from dark to light, starting at 294K) and CAPE (contoured at 500 J kg�1). The abscissa for allfour panels is the same (x). Note that the ordinate varies amongpanels.
1330 J O U R N A L O F T H E A T M O S P H E R I C S C I E N C E S VOLUME 65
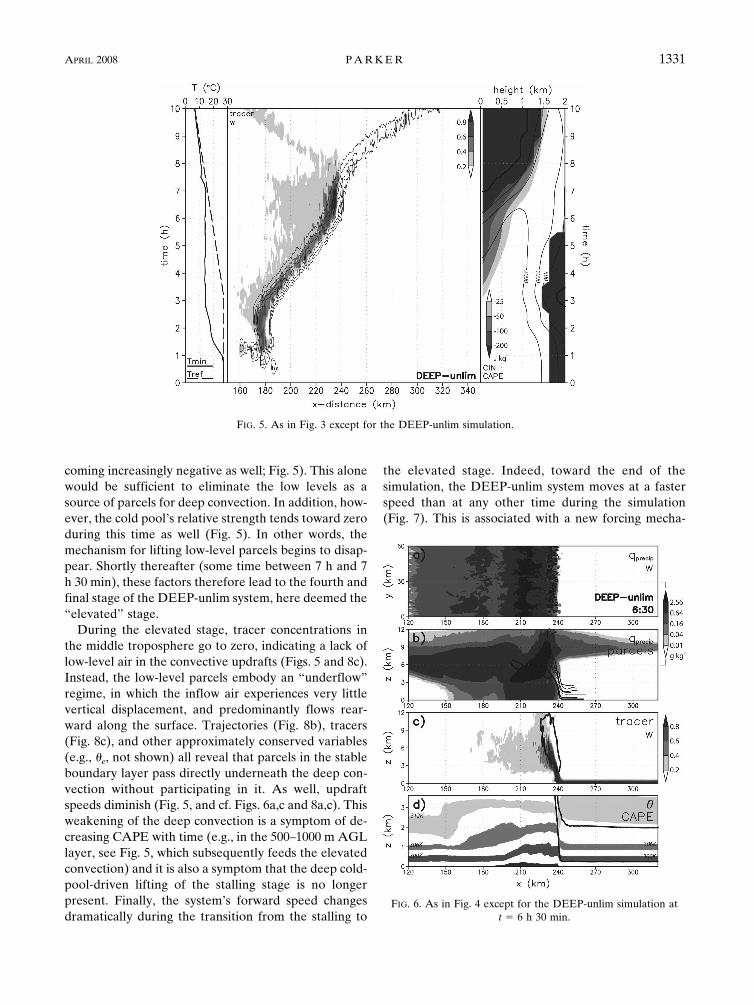
coming increasingly negative as well; Fig. 5). This alonewould be sufficient to eliminate the low levels as asource of parcels for deep convection. In addition, how-ever, the cold pool’s relative strength tends toward zeroduring this time as well (Fig. 5). In other words, themechanism for lifting low-level parcels begins to disap-pear. Shortly thereafter (some time between 7 h and 7h 30 min), these factors therefore lead to the fourth andfinal stage of the DEEP-unlim system, here deemed the“elevated” stage.
During the elevated stage, tracer concentrations inthe middle troposphere go to zero, indicating a lack oflow-level air in the convective updrafts (Figs. 5 and 8c).Instead, the low-level parcels embody an “underflow”regime, in which the inflow air experiences very littlevertical displacement, and predominantly flows rear-ward along the surface. Trajectories (Fig. 8b), tracers(Fig. 8c), and other approximately conserved variables(e.g., �e, not shown) all reveal that parcels in the stableboundary layer pass directly underneath the deep con-vection without participating in it. As well, updraftspeeds diminish (Fig. 5, and cf. Figs. 6a,c and 8a,c). Thisweakening of the deep convection is a symptom of de-creasing CAPE with time (e.g., in the 500–1000 m AGLlayer, see Fig. 5, which subsequently feeds the elevatedconvection) and it is also a symptom that the deep cold-pool-driven lifting of the stalling stage is no longerpresent. Finally, the system’s forward speed changesdramatically during the transition from the stalling to
the elevated stage. Indeed, toward the end of thesimulation, the DEEP-unlim system moves at a fasterspeed than at any other time during the simulation(Fig. 7). This is associated with a new forcing mecha-
FIG. 5. As in Fig. 3 except for the DEEP-unlim simulation.
FIG. 6. As in Fig. 4 except for the DEEP-unlim simulation att � 6 h 30 min.
APRIL 2008 P A R K E R 1331
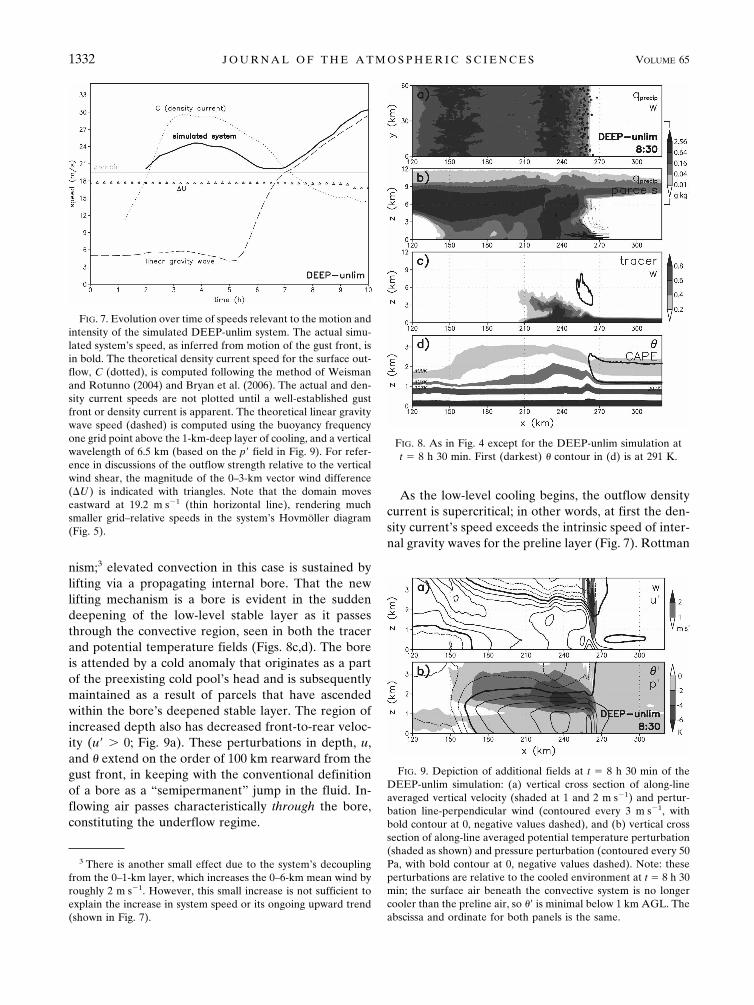
nism;3 elevated convection in this case is sustained bylifting via a propagating internal bore. That the newlifting mechanism is a bore is evident in the suddendeepening of the low-level stable layer as it passesthrough the convective region, seen in both the tracerand potential temperature fields (Figs. 8c,d). The boreis attended by a cold anomaly that originates as a partof the preexisting cold pool’s head and is subsequentlymaintained as a result of parcels that have ascendedwithin the bore’s deepened stable layer. The region ofincreased depth also has decreased front-to-rear veloc-ity (u � 0; Fig. 9a). These perturbations in depth, u,and � extend on the order of 100 km rearward from thegust front, in keeping with the conventional definitionof a bore as a “semipermanent” jump in the fluid. In-flowing air passes characteristically through the bore,constituting the underflow regime.
As the low-level cooling begins, the outflow densitycurrent is supercritical; in other words, at first the den-sity current’s speed exceeds the intrinsic speed of inter-nal gravity waves for the preline layer (Fig. 7). Rottman
3 There is another small effect due to the system’s decouplingfrom the 0–1-km layer, which increases the 0–6-km mean wind byroughly 2 m s�1. However, this small increase is not sufficient toexplain the increase in system speed or its ongoing upward trend(shown in Fig. 7).
FIG. 7. Evolution over time of speeds relevant to the motion andintensity of the simulated DEEP-unlim system. The actual simu-lated system’s speed, as inferred from motion of the gust front, isin bold. The theoretical density current speed for the surface out-flow, C (dotted), is computed following the method of Weismanand Rotunno (2004) and Bryan et al. (2006). The actual and den-sity current speeds are not plotted until a well-established gustfront or density current is apparent. The theoretical linear gravitywave speed (dashed) is computed using the buoyancy frequencyone grid point above the 1-km-deep layer of cooling, and a verticalwavelength of 6.5 km (based on the p field in Fig. 9). For refer-ence in discussions of the outflow strength relative to the verticalwind shear, the magnitude of the 0–3-km vector wind difference(�U ) is indicated with triangles. Note that the domain moveseastward at 19.2 m s�1 (thin horizontal line), rendering muchsmaller grid–relative speeds in the system’s Hovmöller diagram(Fig. 5).
FIG. 9. Depiction of additional fields at t � 8 h 30 min of theDEEP-unlim simulation: (a) vertical cross section of along-lineaveraged vertical velocity (shaded at 1 and 2 m s�1) and pertur-bation line-perpendicular wind (contoured every 3 m s�1, withbold contour at 0, negative values dashed), and (b) vertical crosssection of along-line averaged potential temperature perturbation(shaded as shown) and pressure perturbation (contoured every 50Pa, with bold contour at 0, negative values dashed). Note: theseperturbations are relative to the cooled environment at t � 8 h 30min; the surface air beneath the convective system is no longercooler than the preline air, so � is minimal below 1 km AGL. Theabscissa and ordinate for both panels is the same.
FIG. 8. As in Fig. 4 except for the DEEP-unlim simulation att � 8 h 30 min. First (darkest) � contour in (d) is at 291 K.
1332 J O U R N A L O F T H E A T M O S P H E R I C S C I E N C E S VOLUME 65

and Simpson (1989) note that, when a shallow layer ofstable fluid is encountered by a supercritical densitycurrent, the typical result is a “type C” bore, whosespeed is the same as the density current driving it andwhose properties are very similar to density currents.This regime prevails in the DEEP-unlim simulationthrough roughly t � 5 h. As the preline cooled air be-comes comparable in depth to the density current butthe outflow air is still colder than the environmental air,the situation becomes akin to a lock release problem inwhich a denser fluid intrudes into a slightly less densefluid of comparable depth (e.g., Fig. 7 of Rottman andSimpson 1989; cf. Fig. 6d herein). Finally, as the con-tinuing cooling causes the preline air to be the sametemperature as the outflow air, the situation becomesakin to a simple internal bore (e.g., Fig. 1 of Klemp etal. 1997; cf. Fig. 8d herein) in which the stable fluiddepth abruptly changes across a jump at which there isno appreciable density discontinuity. According totheory (e.g., Fig. 8 of Klemp et al. 1997), in such ascenario the speed of the bore (and hence the convec-tive system) tends toward the gravity wave speed as theprebore stable layer’s depth is increased. This evolutionof outflow from density current dynamics to gravitywave dynamics is similar to what Carbone et al. (1990)and Knupp (2006) observed.
The perturbation wind, potential temperature, andpressure fields during the elevated, bore-driven stage(Fig. 9) suggest that the propagation of the bore isthrough a gravity-wave-like process, with a quasi-staticpressure maximum in the stable layer (Fig. 9b), and anin-phase maximum in the rear-to-fore wind perturba-tion (Fig. 9a), beneath the cold anomaly in the head ofthe bore (Fig. 9b). The forward speed of the convectivesystem after roughly t � 7 h (Fig. 7) is also very close tothe theoretical speed for linear gravity waves (e.g., Hol-ton 2004). As the low-level stability increases, so doesthe gravity wave speed and, hence, the system’s speed(Fig. 7). Even as the convection weakens (after 8 h inFig. 5) the system’s rapid motion is maintained, princi-pally because the gravity wave speed is not a function ofthe wave amplitude.
In keeping with the findings of Raymond and Ro-tunno (1989), the bore’s gravity-wave-like forcing doesnot take over until it becomes faster moving than theoriginal cold pool forcing (Fig. 7). This occurs in thelater part of the stalling phase, when there is negligibleremaining surface temperature gradient across the gustfront and the pre-gust-front environment constitutes adeep layer of high stability. Of course, as mentionedpreviously, this is also around the time that the surface-based CAPE vanishes. But, the bore’s forcing appearsto take over around t � 7 h (based on the change in
system motion), which is before the 0–1-km layer iscompletely devoid of CAPE (some parcels below 1 kmretain CAPE � 0 J kg�1 through 8 h, Fig. 5). Theexperiment in section 3d revisits in more detail the pos-sible roles of CAPE versus the forcing mechanism.
The fact that convection in the DEEP-unlim simula-tion can survive for an additional 3� h without low-level CAPE is a somewhat novel result. The transitionthrough the strengthening, quasi-steady, stalling, andelevated stages occurred in an environment with in-creasing low-level stability (such as would occur duringthe late afternoon and evening). Furthermore, the el-evated convection was sustained without the presenceof a low-level jet, synoptic-scale front, or other hori-zontal heterogeneity. In the present case, the mecha-nism for maintenance is a propagating bore atop theimposed stable layer. If a surface-based storm can beinitiated, then there is an intrinsic process for sustainingstorms as the boundary layer cools (e.g., at night). Aninteresting result is that, just before the transition to theelevated state, the system experiences a brief windowof intensification as the cold pool’s temperature deficitdecreases with respect to the preline environment.
c. Addition of limited cooling
Having learned from the DEEP simulations, whichhave appreciable elevated CAPE, it becomes worth-while to return to the PJ04 environment. As mentionedabove, the squall line in the PJ04 environmentdwindled into an unorganized, weak precipitation sys-tem before the end of the 10-h simulation when unlim-ited cooling was applied. This sounding is the only oneamong the three that has minimal CAPE for parcelsabove the lowest 1 km (due to the sounding’s drynessaloft, Fig. 2). It is therefore instructive to explore thefundamental processes within the PJ04 environment af-ter intermediate amounts of cooling. How much cool-ing is needed in order to cut the system off from itssupply of near-surface air?
In the first experiment, Tref was only allowed to de-crease by 10 K, to 291 K (“PJ04-291K”). The system inthe stabilized environment continues to produce strongupdrafts, and remains surface based (Fig. 10). It con-tinues to have a temperature gradient across the out-flow’s leading edge, and the low-level tracers are alllifted abruptly at the outflow boundary (not shown). Inshort, the initial 10 K of surface cooling applied be-tween 3 and 6 h does not hinder the squall line much.
Although the net 10 K surface cooling may not be aslarge as the full nocturnal temperature range on manyevenings, it is sufficient to appreciably increase the sur-face-based CIN and to remove most of the surface-based CAPE (Fig. 10). Despite this fact, the convec-
APRIL 2008 P A R K E R 1333

tively generated cold pool remains and is sufficient tolift air parcels to their LFCs. In fact, an interesting re-sult is that the updraft strength and tracer concentra-tions in the middle troposphere remain almost constantwith a slight increase after several hours of cooling,much as was observed during the stalling phase of theDEEP-unlim simulation.
A cursory examination of the environment after t �6 h, with its highest CAPE values aloft (Fig. 10), mightgive the mistaken impression that the convection is el-evated. However, because the near-surface parcels con-tinue to possess CAPE and because the cold-pool-driven lifting persists (and even intensifies), the PJ04-291K simulation produces a long-lived, surface-basedconvective system. This result has several implications.First, a substantial amount of cooling (for the PJ04sounding, more than 10 K) is needed in order to cut offthe low-level inflow stream of a mature convective sys-tem. And second, if a cold pool of convective outflowcan be established before boundary layer stabilizationensues, then the cold-pool-driven lifting can overcomesurprising amounts of CIN, as long as there is someCAPE remaining. Taken together, the results suggestthat many of the nocturnal convective systems that werepreviously thought to be elevated may actually be surfacebased.
In the next experiment, Tref was allowed to decreaseby 12 K to 289 K (“PJ04-289K”). This second simula-tion is identical to the PJ04 291-K simulation through
6 h 20 min, after which it begins to diverge due to theadditional cooling that is applied between 6 h 20 minand 7 h. Through 7 h of simulation, however, the grossbehaviors are the same in the 291-K and 289-K simu-lations (cf. Figs. 10 and 11). The updraft speeds andtracer concentrations increase slightly as the cold pool’stemperature perturbation weakens (Fig. 11). Differ-ences become evident after 7 h, however. The PJ04-289K convective system continues sporadically to ingestsome near-surface air, and its updrafts remain strong(peaking above 20 m s�1, Fig. 11). However, themidlevel concentration of tracer is clearly much lowerthan in the 291-K simulation, and than in the earlierstages of the 289-K simulation (Figs. 11, 12c).
At the system’s leading edge, a very weak cold poolpersists with a temperature deficit of roughly 1 K (notvisible given the contour interval in Fig. 12d). However,the surface parcels now have no CAPE (Fig. 11), andthe parcels around 500 m AGL have very little CAPE(�500 J kg�1; Figs. 11, 12d), along with CIN of roughly�150 J kg�1. In other words, many of the parcels in thelowest 500 m have no LFCs, and those that do requireappreciable lifting. But, in the lower troposphere thesurfaces of potential temperature are nearly horizontal(Fig. 12d), implying only small vertical excursions forthe low-level parcels. A quasi-static pressure maximumremains as a result of the pocket of outflow air aloft(above the cooled layer) such that the inflowing near-surface air parcels are slowed on passing through the
FIG. 10. As in Fig. 3 except for the PJ04-291K simulation.
1334 J O U R N A L O F T H E A T M O S P H E R I C S C I E N C E S VOLUME 65

gust front (not shown). The net result is a localizedregion in which the layer of 0–500-m inflowing parcelscollect and weakly ascend (Fig. 12c). However, theLFCs for these parcels are either quite high or nonex-istent, so very few become positively buoyant. Thosethat do typically have rather shallow total displace-ments (Fig. 12b), because their CAPE is small, and theybegin to constitute the lower and middle levels of thesimulated convective system’s trailing stratiform pre-cipitation region. The air parcels feeding the strong,deep updrafts are from farther aloft (i.e., above 500 mAGL, Fig. 12b). In short, the PJ04-289K simulation rep-resents a quasi-steady, long-lived system that sits righton the threshold between being surface based and el-evated.
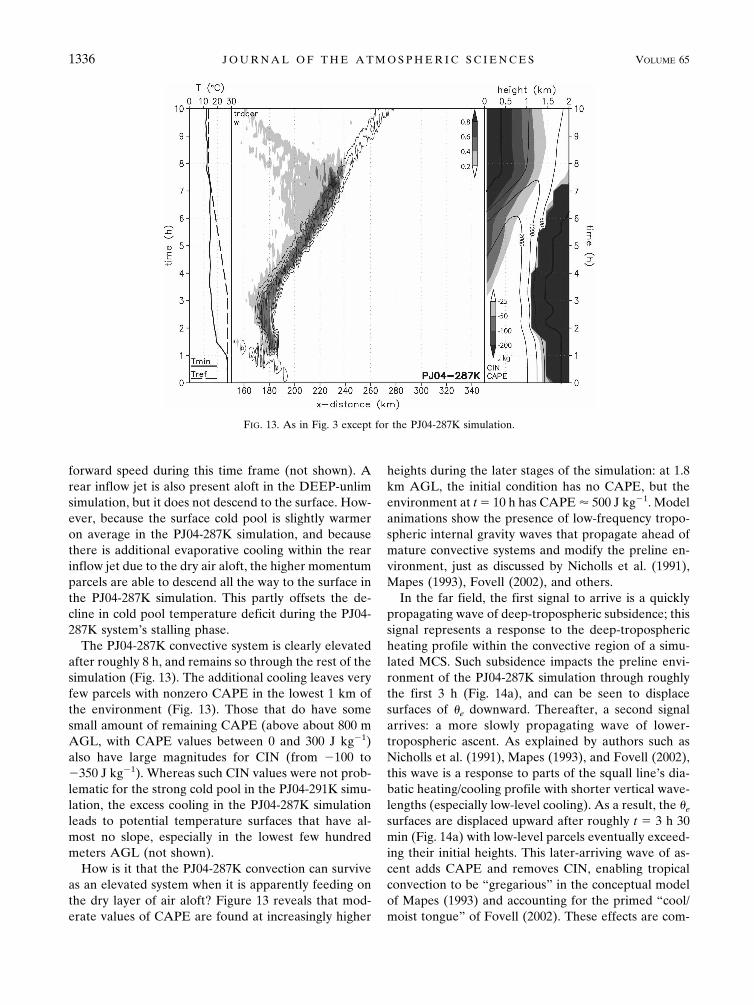
In the third PJ04 experiment, Tref was allowed todecrease by 14 K to 287 K (“PJ04-287K”). This run is ofparticular interest because 287 K is the approximatetemperature of the near-surface outflow air in the PJ04control simulation. The PJ04-287K simulation is iden-tical to the PJ04-289K simulation through 7 h, afterwhich it begins to diverge due to the additional coolingthat is applied between 7 h and 7 h 40 min. After 7 h 40min, the surface outflow is no longer colder than thecooled preline environment because Tref has reachedthe outflow temperature (Fig. 13).
The PJ04-287K simulation exhibits one symptom ofthe “stalling” phase, in that it has a brief secondarymaximum in midlevel updraft strength and tracer con-
centration around t � 7 h 30 min (Fig. 13). But, unlikein the DEEP-unlim simulation, the system’s speed de-creases by only a few meters per second. Descending airfrom the system’s rear inflow jet adds to the system’s
FIG. 12. As in Fig. 4 except for the PJ04-289K simulation at t �8 h 30 min. The first (darkest) � contour in (d) is at 297 K.
FIG. 11. As in Fig. 3 except for the PJ04-289K simulation.
APRIL 2008 P A R K E R 1335
forward speed during this time frame (not shown). Arear inflow jet is also present aloft in the DEEP-unlimsimulation, but it does not descend to the surface. How-ever, because the surface cold pool is slightly warmeron average in the PJ04-287K simulation, and becausethere is additional evaporative cooling within the rearinflow jet due to the dry air aloft, the higher momentumparcels are able to descend all the way to the surface inthe PJ04-287K simulation. This partly offsets the de-cline in cold pool temperature deficit during the PJ04-287K system’s stalling phase.
The PJ04-287K convective system is clearly elevatedafter roughly 8 h, and remains so through the rest of thesimulation (Fig. 13). The additional cooling leaves veryfew parcels with nonzero CAPE in the lowest 1 km ofthe environment (Fig. 13). Those that do have somesmall amount of remaining CAPE (above about 800 mAGL, with CAPE values between 0 and 300 J kg�1)also have large magnitudes for CIN (from �100 to�350 J kg�1). Whereas such CIN values were not prob-lematic for the strong cold pool in the PJ04-291K simu-lation, the excess cooling in the PJ04-287K simulationleads to potential temperature surfaces that have al-most no slope, especially in the lowest few hundredmeters AGL (not shown).
How is it that the PJ04-287K convection can surviveas an elevated system when it is apparently feeding onthe dry layer of air aloft? Figure 13 reveals that mod-erate values of CAPE are found at increasingly higher
heights during the later stages of the simulation: at 1.8km AGL, the initial condition has no CAPE, but theenvironment at t � 10 h has CAPE 500 J kg�1. Modelanimations show the presence of low-frequency tropo-spheric internal gravity waves that propagate ahead ofmature convective systems and modify the preline en-vironment, just as discussed by Nicholls et al. (1991),Mapes (1993), Fovell (2002), and others.
In the far field, the first signal to arrive is a quicklypropagating wave of deep-tropospheric subsidence; thissignal represents a response to the deep-troposphericheating profile within the convective region of a simu-lated MCS. Such subsidence impacts the preline envi-ronment of the PJ04-287K simulation through roughlythe first 3 h (Fig. 14a), and can be seen to displacesurfaces of �e downward. Thereafter, a second signalarrives: a more slowly propagating wave of lower-tropospheric ascent. As explained by authors such asNicholls et al. (1991), Mapes (1993), and Fovell (2002),this wave is a response to parts of the squall line’s dia-batic heating/cooling profile with shorter vertical wave-lengths (especially low-level cooling). As a result, the �e
surfaces are displaced upward after roughly t � 3 h 30min (Fig. 14a) with low-level parcels eventually exceed-ing their initial heights. This later-arriving wave of as-cent adds CAPE and removes CIN, enabling tropicalconvection to be “gregarious” in the conceptual modelof Mapes (1993) and accounting for the primed “cool/moist tongue” of Fovell (2002). These effects are com-
FIG. 13. As in Fig. 3 except for the PJ04-287K simulation.
1336 J O U R N A L O F T H E A T M O S P H E R I C S C I E N C E S VOLUME 65

mon to all of the present simulations and can be seen inFigs. 3, 5, 10, 11, 13, and 15; the symptoms are thedecrease and rebound of the CAPE values aboveroughly 1 km AGL between t � 0 and 6 h and thesubsequent disappearance of CIN above 1.5 km AGLafter approximately t � 5.5–7 h. In short, the low-fre-
quency waves are partly responsible for the presence ofhigher �e parcels above the 0–1-km layer of artificialcooling. Because the preline air is closer to its LCL andLFC, relatively less lifting is then needed in the con-vective region.
A second effect also supplements the environmentalCAPE in the immediate vicinity of the convective re-gion. As shown in Fig. 14b, �e decreases with heightabove its maximal value at roughly 1.3 km AGL. Inother words, the inflow above the stable layer has littleCAPE but it is potentially unstable. Lifting in the im-mediate vicinity of the propagating bore (i.e., betweenx � 260 and 280 km in Fig. 14b) realizes some of thispotential instability. The inflowing layer is slightly de-stabilized and CAPE values increase, exceeding 750 Jkg�1 just as the parcels enter the convective region. ThePJ04 sounding is representative of many MCS environ-ments in the central United States, which often possessa dry, elevated mixed layer. Therefore, �e decreaseswith height on many convective days, and the conver-sion of potential instability by lifting at the convectivesystem’s leading edge becomes yet another viable in-gredient for the sustenance of convection as nocturnalcooling ensues.
d. Unlimited uniform cooling
The preceding analyses suggest that there are twocritical components in the maintenance of a convectivesystem as the lower troposphere is stabilized. First, air
FIG. 14. Equivalent potential temperature (�e) and related fieldsfor the PJ04-287K simulation: (a) profile vs time of mean envi-ronmental �e (alternately shaded from dark to light every 4°, from324 to 348 K) and vertical velocity (contoured from �0.06 to 0.06m s�1, every 0.02 m s�1, with bold contour at 0, negative valuesdashed); values are for the far field (along the eastern domainedge); and (b) vertical cross section at t � 9 h of along-line aver-aged �e [shaded as in panel (a)] and CAPE (contoured at 250, 500,and 750 J kg�1, with bold contour at 0).
FIG. 15. As in Fig. 3 except for the DEEP-unif simulation.
APRIL 2008 P A R K E R 1337

parcels must exist with CAPE and, second, there mustbe a dome in the isentropes, whether in the form of asurface-based cold pool or a bore atop the stable layer,that is capable of lifting the parcels with CAPE to theirLFCs. With low-level cooling, surface-based cold-pool-driven systems evolve to become elevated, bore-drivensystems. However, one artifact of the artificial coolingin the above experiments is that the CAPE of near-surface air disappears at roughly the same time that theoutflow’s near-surface temperature perturbation disap-pears. The following test isolated the role of the coldpool versus the role of CAPE by cooling the outflow atthe same rate as the environment after five simulatedhours. In other words, cooling is applied according toEq. (2) from 3 to 5 h in the following runs, after whichevery grid point below 1 km AGL is cooled at a rate of3 K h�1. Therefore, the outflow’s temperature pertur-bation remains the same after 5 h.
The result was somewhat surprising. Updrafts in theuniform cooling (“unif”) experiments weaken and be-came elevated much earlier than in the unlimited cool-ing (“unlim”) experiments (again, only the results fromthe DEEP environment are shown, Fig. 15). As well,despite removal of environmental CAPE at an identicalrate, the PJ04-unif convective system dies beforecompletion of eight simulated hours (not shown), al-most two full hours sooner than in the PJ04-unlim ex-periment. Several differences from the “unlim” simula-tions are apparent.
Neither the PJ04-unif nor the DEEP-unif simulationsexperienced the stalling phase, with its reintensified up-drafts. Because the outflow’s temperature deficit re-mained constant, both the PJ04-unif and DEEP-unifsystems moved at constant speed through roughly t � 6h 30 min. Thereafter, as the gravity wave speed ex-ceeded the density current speed, the systems began toaccelerate (e.g., Fig. 15). Indeed, the DEEP-unif simu-lation had to be stopped after 9 h because the convec-tion so quickly approached the eastern lateral bound-ary.
The “uniform” cooling also prevents the outflowfrom returning to a condition that is more nearly inbalance with the environmental shear. This has severaleffects. First, there is no secondary maximum in deeplifting as was observed in the other cooled simulations(sections 3b and 3c, cf. Figs. 5 and 15) and, second,because the lifting of near-surface air is far from opti-mal in the uniform cooling experiments, the simulatedsystems become elevated more rapidly (cf. Figs. 5 and15). In other words, despite the same chronology ofenvironmental CAPE and CIN, the convective systemsin uniform cooling are much sooner unable to get near-surface parcels to their LFCs.
For the DEEP-unif simulation, it is difficult to deter-mine from system speed alone when the transition fromdensity-current-like lifting to gravity-wave-like liftingoccurs. However, cross sections reveal that the coldpool lifting gives way to the bore during the 5 h 30 min–7 h 30 min window (Fig. 16). Initially, the bore’s speedis very close to that of the preexisting density current(as in section 3b). However, by t � 7 h 30 min the borebegins to outrun the density current; as the preoutflowstable layer becomes deeper and more stable, thebore’s speed approaches that of a gravity wave, whosespeed in turn continues to increase with increasing sta-bility. In the “unif” simulations, the surface cold poolremains due to the uniform cooling technique; thus, thebore continually resembles the “lock release” (or intru-sive density current) model. By roughly t � 7 h 30 min,this intrusive density current is subcritical, with internalgravity waves propagating ahead of it and an undularcharacter to the bore (Fig. 16d).
In the case of the PJ04 environment, as reviewedpreviously, the transition to the elevated phase soonresulted in the demise of the system. In the DEEP en-vironment, the system persisted as a weak, elevated,
FIG. 16. As in Fig. 4d except for the DEEP-unif simulation attimes (a) t � 5 h 30 min, (b) t � 6 h 30 min, (c) t � 7 h 30 min, and(d) t � 8 h 30 min. The contour levels change among panels.Potential temperature is alternately shaded every 3° across thelowest 24 K, from dark to light, starting at the following values: (a)294, (b) 291, (c) 288, and (d) 285 K.
1338 J O U R N A L O F T H E A T M O S P H E R I C S C I E N C E S VOLUME 65
fast-moving, bore-driven system through the remainderof the simulation. The overall interpretation is that, inorder for the simulated convection to remain surfacebased, both CAPE and deep cold pool lifting need topersist. An important result is that this deep lifting maybe best accomplished by somewhat weaker cold pools,which provide more upright trajectories for air parcelsin the gust front updraft.
4. Synthesis
The present simulations are part of an ongoing effortto understand nocturnal convective systems, which arecommon in the United States. As a first attempt, arti-ficial low-level cooling was added to simulations withinenvironments that favor long-lived, quasi-steady con-vective systems. In the control simulations, these simu-lated convective systems are cold pool driven and sur-face based.
To varying degrees, the simulations that include con-tinual low-level cooling evolve through four basicstages: strengthening, quasi steady, stalling, and el-evated. During the strengthening stage, the surface coldpool develops and intensifies, the system speed in-creases, and the simulated convective systems becomewell organized. Then, during the quasi-steady stage,continued convective development along the system’soutflow boundary leads to a surface-based squall linewith nearly constant forward motion. During the quasi-steady stage, the outflow propagates and lifts environ-mental air as a density current. The strengthening andquasi-steady stages are common to all of the simula-tions, including the control runs.
Whereas the control and limited-cooling (e.g., 291 K)simulations remain within the quasi-steady stage, in thepresence of continued cooling (the “unlim” experi-ment) the simulations progress into the stalling stage.As the low-level cooling renders a smaller cold pooltemperature deficit (relative to the preline environ-ment), a system’s forward speed often decreases. Also,as the cold pool’s strength (C) decreases in relation tothe vertical wind shear (�U), a stalling system oftenexhibits a secondary peak in updraft strength and in themidlevel concentration of boundary layer tracers. Thisis consistent with the theory for strong gust front liftingdeveloped by Rotunno et al. (1988). In simulationswhere the cold pool’s temperature deficit is preservedduring the cooling (the “unif” experiment), the stallingstage and its secondary maximum in system intensityare absent. Lifting during the stalling stage is by a borein the stable layer, although the bore’s speed and struc-ture remain akin to those of a density current, and thebore’s position is that of the original outflow’s gustfront.
For the simulations with unlimited cooling, the finalstage is the transition to elevated convection. In thisstage, surface parcels are no longer lifted to their LFC,either because of the extinction of CAPE (in the “un-lim” experiments) or because of the lack of deep gustfront lifting (in the “unif” experiments). As the low-level environment becomes increasingly stable, the out-flow dynamics become akin to that of a gravity wave,and the system’s speed increases. The near-surface flowbranch is best described as “underflow”; despite somesmall vertical excursions in the vicinity of the bore, airin the stable layer mainly passes beneath the systemwithout participating in the convection. In simulationswith moist air above the stable layer (e.g., the DEEPexperiments), the propagating bore is more than suffi-cient to lift elevated parcels to their LFC. In simulationswith dry air above the stable layer (e.g., the PJ04 ex-periments), preline lifting and the release of potentialinstability also contribute, as the airmass aloft initiallyhas low CAPE, high CIN, and requires significant lift-ing in order to achieve saturation and positive buoy-ancy.
There are no doubt many other pathways for el-evated convective storms, especially those that occurabove frontal inversions in the cold sectors of midlati-tude cyclones (e.g., the “type 1” MCSs of Fritsch andForbes 2001). The present results are somewhat novelin that no larger-scale front or low-level jet stream isrequired in order to sustain the simulated storms in anenvironment with a stable boundary layer. In the casewhere a surface-based squall line matures before it ex-periences low-level cooling, several key conceptsemerge:
• A mechanism exists for the perpetuation of the squallline as the boundary layer stability increases. Theevolution from a density current, to a density-current-like bore, and then to a gravity-wave-likebore provides continual lifting as the system becomeselevated. This evolution also entails changes in thesquall line’s forward speed.
• Some cooling of the preline environment can actuallylead to an increase in the system’s intensity, as theenvironmental shear can better offset the tendencyfor parcels to be swept rearward over the outflow.
• The lower troposphere can be cooled by a surprisingamount (roughly 10 K) without disturbing the flow ofsurface-based parcels into a mature, cold-pool-drivensquall line. Even when CAPE is small and CIN islarge, the surface cold pool is sufficient to lift low-level parcels to their LFC.
The present simulations are meant to mimic the im-pacts of nocturnal cooling upon existing squall lines.
APRIL 2008 P A R K E R 1339

The implications are that active convective systems cansurvive after sunset, and can even intensify. Further-more, many of the nocturnal convective systems thatwere previously thought to be elevated may actually besurface based.
5. Future avenues
This study isolated one particular aspect of a noctur-nal-like evolution in the convective environment. How-ever, over the central United States, low-level jets alsofrequently develop at night. Future studies might con-sider the role of the changing wind profile (and, thus,changing vertical wind shear) in addition to the role oflow-level cooling. Another interesting question iswhether supercellular thunderstorms are more or lessable to survive and remain surface based into the night-time hours. Although they do not generally possessstrong, deep mesoscale cold pools, supercells often pro-duce minimized pressure aloft (e.g., Klemp 1987),which can contribute to the dynamic lifting of air thathas appreciable CIN. Whether or not supercells canremain surface based in the presence of low-level cool-ing has profound impacts for the tornado forecast prob-lem.
Although this paper’s primary emphasis is not theproduction of severe winds, it is worthwhile to note thatsevere surface wind production ceased around the sametime that the simulated systems became elevated. Theproblem of severe convective winds in stable environ-ments continues to be a challenge. Even in the absenceof surface-based CAPE, elevated convective systemsmay produce negatively buoyant downdrafts that arestrong enough to penetrate to the surface. Alterna-tively, as suggested by Schmidt and Cotton (1989) andBernardet and Cotton (1998), stable surface air that ispresent near an elevated convective system can be dy-namically lifted and cooled at the system’s gust front,after which it returns rapidly to the surface owing to itsnegative buoyancy. Finally, a mature elevated systemmight produce a sufficiently perturbed pressure field(e.g., Fig. 9) such that the subinversion air, even if de-coupled from the convective overturning, can yet beaccelerated to severe speed. Recent preliminary workby Bryan and Weisman (2006) has also shown that ini-tially elevated squall lines can produce cold pools thatbuild downward to the surface over time, eventuallyproducing severe surface winds in much the same waythat surface-based systems do. Still other preliminaryresults from Atkins and Cunningham (2006) haveshown that stable layers can inhibit formation of theembedded low-level mesovortices that may often be thedirect cause of a squall line’s severe surface winds (e.g.,
Trapp and Weisman 2003; Atkins et al. 2005). Goingforward, it is important to understand these severewind mechanisms, and to assess the generality of thecurrent and previous findings.
In the central United States, a large fraction of con-vective storms occur at night. Future advances in ourunderstanding of the dynamics that govern nocturnalstorms, and their likelihood of producing severeweather, will be important additions to the knowledgebase.
Acknowledgments. The author would like to thank N.Atkins, G. Bryan, R. Fovell, P. Haertel, R. Johnson, K.Knupp, E. Kuchera, P. Markowski, and the ConvectiveStorms Group at NC State for beneficial discussionsand suggestions related to this work. Both R. Fovelland M. Weisman provided constructive reviews of theoriginal manuscript. G. Bryan also kindly assisted byproviding and supporting the numerical model used forthis work. This research was supported by the NationalScience Foundation under Grant ATM-0552154.
REFERENCES
Atkins, N. T., and J. J. Cunningham, 2006: The influence of low-level stable layers on damaging surface winds within bowechoes. Preprints, 23rd Conf. on Severe Local Storms, St.Louis, MO, Amer. Meteor. Soc., 6.4.
——, C. S. Bouchard, R. W. Przybylinski, R. J. Trapp, and G.Schmocker, 2005: Damaging surface wind mechanisms withinthe 10 June 2003 Saint Louis bow echo during BAMEX.Mon. Wea. Rev., 133, 2275–2296.
Bernardet, L. R., and W. R. Cotton, 1998: Multiscale evolution ofa derecho-producing mesoscale convective system. Mon.Wea. Rev., 126, 2991–3015.
Braun, S. A., and W.-K. Tao, 2000: Sensitivity of high-resolutionsimulations of Hurricane Bob (1991) to planetary boundarylayer parameterizations. Mon. Wea. Rev., 128, 3941–3961.
Bryan, G. H., and J. M. Fritsch, 2002: A benchmark simulation formoist nonhydrostatic numerical models. Mon. Wea. Rev., 130,2917–2928.
——, and M. L. Weisman, 2006: Mechanisms for the production ofsevere surface winds in a simulation of an elevated convectivesystem. Preprints, 23rd Conf. on Severe Local Storms, St.Louis, MO, Amer. Meteor. Soc., 7.5.
——, and R. Rotunno, 2008: Gravity currents in a deep anelasticatmosphere. J. Atmos. Sci., 65, 536–556.
——, J. C. Wyngaard, and J. M. Fritsch, 2003: Resolution require-ments for the simulation of deep moist convection. Mon.Wea. Rev., 131, 2394–2416.
——, J. C. Knievel, and M. D. Parker, 2006: A multimodel assess-ment of RKW theory’s relevance to squall-line characteris-tics. Mon. Wea. Rev., 134, 2772–2792.
Buzzi, A., M. Fantini, and G. Lippolis, 1991: Quasi-stationaryorganized convection in the presence of an inversion near thesurface: Experiments with a 2-D numerical model. Meteor.Atmos. Phys., 45, 75–86.
Carbone, R. E., J. W. Conway, N. A. Crook, and M. W. Moncri-eff, 1990: The generation and propagation of a nocturnal
1340 J O U R N A L O F T H E A T M O S P H E R I C S C I E N C E S VOLUME 65
squall line. Part I: Observations and implications for meso-scale predictability. Mon. Wea. Rev., 118, 26–49.
Colman, B. R., 1990: Thunderstorms above frontal surfaces in en-vironments without positive CAPE. Part I: A climatology.Mon. Wea. Rev., 118, 1103–1121.
Coniglio, M. C., and D. J. Stensrud, 2001: Simulation of a progres-sive derecho using composite initial conditions. Mon. Wea.Rev., 129, 1593–1616.
Cotton, W. R., R. L. George, P. J. Wetzel, and R. L. McAnelly,1983: A long-lived mesoscale convective complex. Part I: Themountain-generated component. Mon. Wea. Rev., 111, 1893–1918.
Dudhia, J., M. W. Moncrieff, and D. W. K. So, 1987: The two-dimensional dynamics of West African squall lines. Quart. J.Roy. Meteor. Soc., 113, 121–146.
Fovell, R. G., 2002: Upstream influence of numerically simulatedsquall-line storms. Quart. J. Roy. Meteor. Soc., 128, 893–912.
——, G. L. Mullendore, and S.-H. Kim, 2006: Discrete propaga-tion in numerically simulated nocturnal squall lines. Mon.Wea. Rev., 134, 3735–3752.
Fritsch, J. M., and G. S. Forbes, 2001: Mesoscale convective sys-tems. Severe Convective Storms, Meteor. Monogr., No. 50,Amer. Meteor. Soc., 323–357.
Glickman, T. S., Ed., 2000: Glossary of Meteorology. 2nd ed.American Meteorological Society, 855 pp.
Haertel, P. T., R. H. Johnson, and S. N. Tulich, 2001: Some simplesimulations of thunderstorm outflows. J. Atmos. Sci., 58, 504–516.
Holton, J. R., 2004: An Introduction to Dynamic Meteorology. 4thed. International Geophysical Series, Vol. 88, AcademicPress, 535 pp.
Johns, R. H., and W. D. Hirt, 1987: Derechos: Widespread con-vectively induced windstorms. Wea. Forecasting, 2, 32–49.
Klemp, J. B., 1987: Dynamics of tornadic thunderstorms. Annu.Rev. Fluid Mech., 19, 369–402.
——, R. Rotunno, and W. C. Skamarock, 1997: On the propaga-tion of internal bores. J. Fluid Mech., 331, 81–106.
Knupp, K. R., 2006: Observational analysis of a gust front to boreto solitary wave transition within an evolving nocturnalboundary layer. J. Atmos. Sci., 63, 2016–2035.
Kuchera, E. L., and M. D. Parker, 2006: Severe convective windenvironments. Wea. Forecasting, 21, 595–612.
Lin, Y.-L., R. D. Farley, and H. D. Orville, 1983: Bulk parameter-ization of the snow field in a cloud model. J. Climate Appl.Meteor., 22, 1065–1092.
Liu, C., and M. W. Moncrieff, 2000: Simulated density currents inidealized stratified environments. Mon. Wea. Rev., 128, 1420–1437.
Locatelli, J. D., M. T. Stoelinga, P. V. Hobbs, and J. Johnson,1998: Structure and evolution of an undular bore on the highplains and its effect on migrating birds. Bull. Amer. Meteor.Soc., 79, 1043–1060.
Maddox, R. A., 1980: Mesoscale convective complexes. Bull.Amer. Meteor. Soc., 61, 1374–1387.
——, 1983: Large-scale meteorological conditions associated withmidlatitude mesoscale convective complexes. Mon. Wea.Rev., 111, 1475–1493.
Mapes, B. E., 1993: Gregarious tropical convection. J. Atmos. Sci.,50, 2026–2037.
Nicholls, M. E., R. A. Pielke, and W. R. Cotton, 1991: Thermallyforced gravity waves in an atmosphere at rest. J. Atmos. Sci.,48, 1869–1884.
Parker, M. D., and R. H. Johnson, 2004: Structures and dynamicsof quasi-2D mesoscale convective systems. J. Atmos. Sci., 61,545–567.
Raymond, D. J., and R. Rotunno, 1989: Response of a stablystratified flow to cooling. J. Atmos. Sci., 46, 2830–2837.
Rottman, J. W., and J. E. Simpson, 1989: The formation of inter-nal bores in the atmosphere: A laboratory model. Quart. J.Roy. Meteor. Soc., 115, 941–963.
Rotunno, R., J. B. Klemp, and M. L. Weisman, 1988: A theory forstrong, long-lived squall lines. J. Atmos. Sci., 45, 463–485.
Schmidt, J. M., and W. R. Cotton, 1989: A high plains squall lineassociated with severe surface winds. J. Atmos. Sci., 46, 281–302.
——, and W. R. Cotton, 1990: Interactions between upper andlower tropospheric gravity waves on squall line structure andmaintenance. J. Atmos. Sci., 47, 1205–1222.
Stensrud, D. J., M. C. Coniglio, R. P. Davies-Jones, and J. S.Evans, 2005: Comments on “‘A theory for strong long-livedsquall lines’ revisited.” J. Atmos. Sci., 62, 2989–2996.
Trapp, R. J., and M. L. Weisman, 2003: Low-level mesovorticeswithin squall lines and bow echoes. Part II: Their genesis andimplications. Mon. Wea. Rev., 131, 2804–2823.
Trier, S. B., and D. B. Parsons, 1993: Evolution of environmentalconditions preceding the development of a nocturnal meso-scale convective complex. Mon. Wea. Rev., 121, 1078–1098.
——, C. A. Davis, D. A. Ahijevych, M. L. Weisman, and G. H.Bryan, 2006: Mechanisms supporting long-lived episodes ofpropagating nocturnal convection within a 7-day WRF modelsimulation. J. Atmos. Sci., 63, 2437–2461.
Wallace, J. M., 1975: Diurnal variations in precipitation and thun-derstorm frequency over the conterminous United States.Mon. Wea. Rev., 103, 406–419.
Weisman, M. L., and J. B. Klemp, 1982: The dependence of nu-merically simulated convective storms on vertical wind shearand buoyancy. Mon. Wea. Rev., 110, 504–520.
——, and R. Rotunno, 2004: “A theory for strong long-livedsquall lines” revisited. J. Atmos. Sci., 61, 361–382.
Wetzel, P. J., W. R. Cotton, and R. L. McAnelly, 1983: A long-lived mesoscale convective complex. Part II: Evolution andstructure of the mature complex. Mon. Wea. Rev., 111, 1919–1937.
APRIL 2008 P A R K E R 1341