amphidrome - university of...
TRANSCRIPT

AAmmpphhiiddrroommee®®**
WASTEWATER TREATMENT SYSTEM MANUAL
Product Listing: Category B (high-strength sewage) Product File No: 2011-004 Treatment Level C (cBOD5 of 125 mg/L, TSS of 60 mg/L and Oil &
Grease of 25 mg/L)
www.amphidrome.com
Requests for information should be directed to:
F. R. Mahony & Associates, Inc. 273 Weymouth Street Rockland, MA 02370
Phone (781) 982-9300 (800) 791-6132
*Manufactured under license from Severn Trent Services

CONTENTS BROCHURE SYSTEM BENEFITS SYSTEM NARRATIVE SYSTEM DESIGN TYPICAL DRAWINGS SAMPLING FREQUENCY OF MINNESOTA SYSTEMS O&M PROCESS CONTROLS TROUBLESHOOTING

AmphidromeWaste Water Treatment System
High Level of Nitrogen Removal
Low Visual Site Impact
Your Economical Treatment Solution
®
tel. 781-982-9300fax. 781-982-1056www.amphidrome.com
Typical ApplicationsCondominiums
Cluster System DevelopmentsHealth Care facilities
ResortsShopping Malls
SchoolsOffice Parks
Single Family HomesLagoon Nitrification
813
CUSTOMIZED TOUCH SCREEN CONTROLS
AmphidromeLicensed By®

The Amphidrome® System is a Submerged Attached Growth Biological Reactor (SAGB)operating in a batch mode providing BOD reduction, superior nitrification, denitrificationand filtration of suspended solids in a single reactor.
A specially selected spherical sand media provides maximum surface area for microorgan-isms to attach themselves. The microorganism environment is manipulated with intermit-tent aeration. The result is an energy efficient superior treatment system with a very smallfootprint.
Amphidrome System
With the addition of an Amphidrome® Plus™ reactor, nitrogen is reduced to thelowest level biologically attainable. The Amphidrome® ColdNite® process nitrify atwastewater temperaturs of 3.3 C.
A small building houses a control panel, air blowers, and any other ancillaryequipment as may be required for a specific application such as ultraviolet (UV)disinfection or a membrane.
®
BenefitsSuperior Treatment
High Level of Nitrogen RemovalRe-Use Quality Effluent - Turbidity & TOCSmall Footprint - Low Visual Site Impact
Energy Efficient
Anoxic Tank Amphidrome ® ReactorClearwell Plus™ Reactor Effluent Pumps
Control Building
Amphidrome-MF™ System
Integrates a 0.1 Micron Membrane
MBR Quality Effluent
Substantially Lower Costs Capital Operating Life Cycle

System Benefits Low Visual Site Impact
• System below grade Low Audible Site Impact
• Kaeser premium sound enclosed blowers Easy To Operate
• Touch screen with SCADA like equipment screens, data trending and built in troubleshooting guide
• Remote access provided for BOTH control and monitoring Energy Efficient
• Intermittent aeration - Process air runs 3-5 hours per day at 20-30 Hz • Backwash blowers run 10 min per day • Primary and waste solids are digested in anoxic tank – no aeration required
Low Chemical Costs
• Anoxic environment created to denitrify and reclaim alkalinity required for nitrification • Intermittent aeration provides simultaneous nitrification-denitrification
Consistent Treatment
• Fixed film reactor with high biomass responds well to low and shock loads • Anoxic tank equalizes mixes and dilutes incoming shock loads of chemicals dumped into
the system Filtered Effluent
• Effluent is filtered through our deep media bed filter
Upgradable • Easily upgraded for phosphorus reduction without adding additional filtration • Easily upgraded for UV disinfection by adding an enclosed UV and using the discharge
pumps to pump through it.

SYSTEM NARRATIVE
The Amphidrome® system is a BNR process utilizing a submerged attached growth bioreactor operating in a batch mode. The deep, bed sand filter is designed for the simultaneous removal of soluble organic matter, nitrogen and suspended solids, within a single reactor.
To achieve simultaneous: oxidation of soluble material, nitrification, and denitrification in a single reactor, the process must provide aerobic and anoxic environments for the two different populations of microorganisms. The Amphidrome® system utilizes two tanks and one submerged attached growth bioreactor, subsequently called Amphidrome® reactor. The first tank, the anoxic/equalization tank, is where the raw wastewater enters the system. The tank has an equalization section, a settling zone, and a sludge storage section. It serves as a primary clarifier before the Amphidrome® reactor.
This Amphidrome® reactor consists of the following three items: underdrain, support gravel, and filter media. The underdrain, constructed of stainless steel, is located at the bottom of the reactor. It provides support for the media and even distribution of air and water into the reactor. The underdrain has a manifold and laterals to distribute the air evenly over the entire filter bottom. The design allows for both the air and water to be delivered simultaneously, or separately, via individual pathways, to the bottom of the reactor. As the air flows up through the media the bubbles are sheared by the sand; producing finer bubbles as they rise through the filter. On top of the underdrain is 18”, (five layers), of four different sizes of gravel. Above the gravel is a deep bed of coarse, round, silica sand media. The media functions as a filter; significantly reducing suspended solids, and provides the surface area for which an attached growth biomass can be maintained.
To achieve the two different environments required for the simultaneous removal of soluble organics and nitrogen, aeration of the reactor is intermittent, rather than continuous. Depending on the strength and the volume of the wastewater, a typical aeration scheme may be three to five minutes of air and ten to fifteen minutes without air. Concurrently, return cycles are scheduled every hour, regardless of the aeration sequence. During a return, water from the clear well is pumped back up through the filter and overflows into the return flow/backwash pipe. A check valve in the influent line prevents the flow from returning to the anoxic/equalization tank, via that route. The return flow/backwash is set at a fixed height above both the media and the influent line; and the flow is by gravity back to the front of the anoxic/equalization tank.
The cyclical forward and reverse flow of the waste stream, and the intermittent aeration of the filter, achieve the required hydraulic retention time and create the necessary aerobic and anoxic conditions to maintain the required level of treatment.
Biochemical Reactions
The removal of SOM is achieved by the oxidation of carbonaceous matter, which is accomplished by the aerobic growth of heterotrophic bacteria. The biochemical transformation is described by the following normalized mass based stoichiometric equation in which the carbonaceous matter is a carbohydrate (CH2O) and the nitrogen source for the bacteria is

ammonium (NH+
4).
CH2O+ 0.309 O2 + 0.085 NH+
4 + 0.289 HCO3 → 0.535 C5H7O2N + 0.633 CO2 + 0.515 H2O
The oxidation of ammonia to nitrate is accomplished by the aerobic growth of chemolithotrophic, autotrophic bacteria and is described by the following normalized mass based stoichiometric equation. The overall equation describes the two-step process in which ammonia is converted to nitrite by Nitrosifyers, and nitrite is converted to nitrate by Nitrifyers.
NH4++ 3.30 O2 + 6.708 HCO3 → 0.129 C5H7O2N + 3.373 NO
-3 + 1.041 H2O + 6.463 H2CO3
The final step in the removal of nitrogen from the waste stream occurs when carbonaceous matter is oxidized by the growth of heterotrophic bacteria utilizing nitrate as the terminal electron accepter. The equation describing the biochemical transformation depends on the organic carbon source utilized. The following is the normalized mass based stoichiometric equation with the influent waste stream as the organic carbon source.
NO-
3 + 0.324 C10H19O3N → 0.226 N2 + 0.710 CO2 + 0.087 H2O + 0.027 NH3 + 0.274 OH-
Biological removal of nitrogen has been the focus of much attention and many of today’s wastewater treatment plants incorporate it. However, the difficultly in promoting these biochemical transformations in one reactor is the different environmental conditions required for each transformation.
This Amphidrome® process is designed to achieve the above reactions simultaneously within one reactor. The aerobic environment within the filter promotes the first two reactions. The return flow, to the anoxic/equalization tank, mixes the nitrates with organic carbon in the raw influent, and with organic carbon that has been released from the stored sludge. The anoxic environment within the filter promotes denitrification, the third reaction.
The Amphidrome® system is a BNR process utilizing a submerged attached growth bioreactor operating in a batch mode. The deep, bed sand filter is designed for the simultaneous removal of soluble organic matter, nitrogen and suspended solids, within a single reactor.
The system operates as a sequencing batch reactor in which the waste water is cycled back and forth through the filter. The Amphidrome reactor is intermittently aerated to achieve both the aerobic environment required for the oxidation of organics and nitrification and the anoxic environment required for denitrification.

Figure 1. Section View of Amphidrome® System
The reactor consists of: 1) an underdrain, 2) support gravel, 3) filter media, and 4) a backwash trough. The underdrain, located at the bottom of the reactor, can be constructed of concrete blocks encased with high-density polyethylene and stainless steel piping or entirely out of stainless steel. It provides support for the media and even distribution of air and water into the reactor. The underdrain includes a manifold and laterals to distribute the air evenly over the entire filter bottom. The design allows for both the air and water to be delivered simultaneously--or separately--via individual pathways to the bottom of the reactor.
Concrete Block Underdrain Stainless Steel Underdrain
On top of the underdrain is 1.51 ft (five layers) of four different sizes of gravel. Above the gravel is a deep bed of coarse, round silica sand media. The media functions as a filter, reducing suspended solids while providing the surface area on which an attached growth biomass can be maintained. The media specific surface area of 250 ft.2/ft.3 results in a high concentration of biomass within the reactor, which means that the hydraulic retention time (HRT) is short; therefore the reactor requires a significantly smaller volume to treat a given waste strength than would be required by some other reactors.

Reactor Quiescent Flow Reactor During Aeration The influent wastewater enters the system through the anoxic/equalization tank, which has an equalization zone, a settling zone, and a sludge storage zone and serves as a primary clarifier for the SAGB. The wastewater then flows by gravity into the reactor. The driving force of the forward flow is the hydrostatic pressure created by the differential liquid levels within the tanks. Operation of the SAGB alternates between down-flow (forward flow) and up-flow (reverse flow) modes. The up-flow is accomplished by pumping from the clear well back up through the filter. To achieve the required aerobic and anoxic conditions within the biofilm, process air to the reactor is supplied intermittently-via the underdrain at the bottom of the reactor and is independent of the return flow cycles. During a return, water from the clear well is pumped back through the filter, following the exact same path through the reactor as it did in the forward flow cycle. However, a check valve in the influent line of the reactor prevents the flow from returning to the anoxic/equalization tank via the same route. Instead, the flow fills the reactor until it overflows into the return flow/backwash trough and flows back to the front of the anoxic/equalization tank by gravity. The recycled flow, which contains nitrates, mixes with the incoming raw influent, which contains organic carbon, and starts to flow forward again when the pump shuts off. The cyclical forward and reverse flow of the waste stream and the intermittent aeration of the filter achieve the required hydraulic retention time and create the necessary aerobic and anoxic conditions to achieve the required level of biological nitrogen removal.

Controls: The control system is PLC based with a user friendly operator touch screen interface
Wireless Process Control Access (WPCA) Amphidrome systems are now provided with one year of online and phone technical support. The system will be supplied with a WPCA module that will allow the operator and FRMA to log into the system. This allows real time control and observation of the system remotely via the internet. Remote access to stored system trending data, alarm history etc. provides valuable insight on system operation and any adjustments that may need to be made to optimize performance. These adjustments can be made remotely in real time.

SYSTEM DESIGN

DESIGN
Product Listing: Category B (high-strength sewage) Product File No: 2011-004 Treatment Level C (cBOD5 of 125 mg/L, TSS of 60 mg/L and Oil & Grease of 25 mg/L) It is important to note that the system is not designed or presented by “MODEL NUMBER”. Systems are specifically configured for both flow and waste strength. The system designs presented in Tables 1 & 2 can be used for preliminary design. Final design must be reviewed by F.R. Mahony & Associates All Amphidrome reactors are designed on a mass loading, typically 150 lbs.-BOD5/1,000 ft.3 of media and 40 lbs.-N/1,000 ft.3 of media. Therefore, influent waste strength (both BOD5 and ammonia- nitrogen) both influence the size (in depth and square feet) of the reactor.
In accordance with Minnesota Rules Chapter 7080 through 7083, the Minnesota Pollution Control Agency (MPCA) has reviewed F.R. Mahoney and Associates submitted materials requesting registration for Category B (high strength sewage) treatment product listing of the Amphidrome Wastewater Treatment System in this application. Based on the submitted documentation, the MPCA finds that the Amphidrome Wastewater Treatment System is eligible for Interim Conditional Product Registration as meeting the following treatment level:
• Treatment Level C (cBOD5 of 125 mg/L, TSS of 60 mg/L and Oil & Grease of 25 mg/L) All Amphidrome reactors are designed on a mass loading, typically 150 lbs.-BOD5/1,000 ft.3 of media and 40 lbs.-N/1,000 ft.3 of media. Therefore, influent waste strength whether high BOD5, high ammonia- nitrogen or both influences the size of the reactor. The second parameter of importance is the effluent requirement. The system can be designed to treat to very low levels or to pretreatment levels prior to discharge to the soil treatment and dispersal component. Subject to this determination, the Amphidrome Wastewater Treatment System will be placed on the List of Registered Subsurface Sewage Treatment System (SSTS) Products for High Strength Wastewater. The product information listed in this Notice of Interim Conditional Product Registration for Proprietary Treatment Product Listing will be maintained on the MPCA website and may not be altered or misrepresented by the manufacturer or any other person without permission by the MPCA.
1. The design loading for all Amphidrome systems is: 150 lbs. -BOD5 per day per 1,000 ft.3 of media and 40 lbs.-N per day per 1,000 ft.3 of media. The manufacturer’s designated representative(s) is required to review all designs provided by Advanced Designers (i.e.: evaluation worksheets for high strength wastewaters) for treatment systems proposed to use the Amphidrome Wastewater Treatment System. Advanced Designers need to work directly with the manufacturer to ensure the wastewater is properly characterized and that the Amphidrome wastewater treatment products, and other related components used in treatment train (i.e.: anoxic

tanks, clear well, and grease interceptors), are properly sized and compatible to meet designed performance requirements.
2. The manufacturer’s designated representative will issue a review letter to the Advanced Designer documenting: a) details of the manufacturer’s review, and 2) agreement that the product is an appropriate fit for the planned system at the facility. The review letter will be signed by the manufacturer’s designated representative (Mr. Philip Pedros or designated replacement).
3. Anoxic tank capacity shall meet the manufacturer’s size requirements. All sewage tank(s) shall
be designed to withstand the pressures to which it will be subjected. Tanks and all pipe penetrations, risers, and other connections to tanks shall be watertight. The external grease interceptor (also known as external grease trap and grease tank) shall be sized according the MPCA Design Guidance or provide at least 24 hours of detention time.
4. The Amphidrome system can be designed to treat to low levels of BOD5, nitrogen and
phosphorus.
5. To protect for potential system malfunction, all systems shall be designed and operated with (a) suitable alarm device(s).
6. The treatment products are considered a Minnesota-registered product for Type IV systems. 7. When the Amphidrome system is used to achieve Treatment Level C, effluent loading rates to
the soil, method of distribution, and vertical separation requirements shall meet the minimum requirements contained in Minnesota Rules Chapter 7080.2150 for flows less than 5000 GPD. For flows greater than 5,000 GPD, final treatment and dispersal must also meet Minnesota Rules Chapter 7081.0270.
8. When the Amphidrome system is used to achieve a higher treatment level than Treatment Level C, effluent loading rates to the soil, method of distribution, and vertical separation requirements shall meet the minimum requirements contained in Minnesota Rules Chapter 7080.2350 for flows less than 5000 GPD. For flows greater than 5,000 GPD, final treatment and dispersal must also meet the requirements contained in Minnesota Rules Chapter 7081.0270.
9. Systems may only be designated as Type IV systems when designed and installed per the drawings submitted as part of the Application for Registration, dated May 2, 2011 and October 12, 2011, and subsequent documents submitted prior to this registration.
10. As a Type IV system, the system must be constructed and operated under the required local
permits.
11. As specified in the Owner’s Manual, limitations of the product are identified. The manufacturer is responsible to provide a listing of other known limitations, made available on the company’s website or other means.
12. Training shall be provided to MPCA-licensed Subsurface Sewage Treatment System practitioners before designing, installing, or providing service to the Amphidrome wastewater treatment systems registered for use in Minnesota.

Table 1
Amphidrome System for Treatment Level C
Flow (gpd) Anoxic/EQ (gal.)
Reactor Clearwell (gal.)
<400 - 800 2,000 2.0 ft. Diameter 1,000 700 – 1,200 2,000 2.5 ft. Diameter 1,000 900 – 1,800 2,500 3.0 ft. Diameter 1,500
1,200 – 2,500 2,000 - 3,000 3.5 ft. Diameter 1,500 1,600 – 3,250 2,500 - 4,000 4.0 ft. Diameter 1,500 2,500 – 5,200 4,000 - 6,000 5.0 ft. Diameter 2,000 3,600 -7,200 5,500 - 9,000 6.0 ft. Diameter 2,600 - 3,200
6,000 -10,000 9,000 - 13,000 8.0 ft. Diameter 4,500 - 5,200 * Third-party testing showed Amphidrome effluent achieved the Total Nitrogen [TN] level of
15 mg/L [mean TN = 15 mg/L TN with 59% removed]; CBOD5 was 5 mg/L; TSS was 5 mg/L. Fecal coliform bacteria are expected to be greater than10,000 cfu/100mL. Total nitrogen removal is highly dependent upon BOD and TKN loading, adequate alkalinity, temperature and toxicity; site specific alkalinity levels in the source water supply should be evaluated and homeowners should be well educated in order to achieve optimal total nitrogen reduction.
The flow range for each reactor listed is the result of the ability to vary the media depth from 4 ft. to 8ft.
Table 2
Amphidrome Plus System for Effluent Total Nitrogen Amphidrome System for Treatment Level C and (TN) of less than 10 mg/L**
Flow (gpd) Anoxic/EQ (gal.)
Reactor Clearwell (gal.) Plus
<400 - 800 2,000 2.0 ft. Diameter 1,000 2.0 ft. Diameter 700 – 1,200 2,000 2.5 ft. Diameter 1,000 2.0 ft. Diameter 900 – 1,800 2,500 3.0 ft. Diameter 1,500 2.0 ft. Diameter
1,200 – 2,500 2,000 - 3,000 3.5 ft. Diameter 1,500 2.0 ft. Diameter 1,600 – 3,250 2,500 - 4,000 4.0 ft. Diameter 1,500 2.0 ft. Diameter 2,500 – 5,200 4,000 - 6,000 5.0 ft. Diameter 2,000 2.5 ft. Diameter 3,600 -7,200 5,500 - 9,000 6.0 ft. Diameter 2,600 - 3,200 2.5 ft. Diameter 6,000 -10,000 9,000 - 13,000 8.0 ft. Diameter 4,500 - 5,200 3.0 ft. Diameter
** The Amphidrome Plus system is utilized when the effluent total nitrogen must be less than
10 mg/l or when effluent phosphorus limits exist. The flow range for each reactor listed is the result of the ability to vary the media depth
from 4 ft. to 8ft.

TYPICAL DRAWINGS


This Management Plan identifies some basic requirements for proper operation and maintenance of the Amphidrome and Amphidrome Plus biological nutrient removal (BNR) system operated in batch mode for residential use. Refer to the manufacturer’s Operation and Maintenance Manual for the Amphidrome wastewater treatment products for detailed instructions on proper system operation and maintenance. SYSTEM COMPONENT
TASK FREQUENCY
RESPONSIBLE PARTY
Amphidrome and Amphidrome Plus
Monitor control center alarms. On-going User & Service Provider
Keep vented lid free from obstruction.
On-going User & Service Provider
Record equipment run times.
Bi-Annually <1,500 gpd
Quarterly
>1,500 gpd <5,000 gpd
Monthly
>5,000 gpd <10,000 gpd
Service Provider & Maintainer
Check mechanical and electrical components to ensure proper operation. Monitor flow and perform operational field tests on influent/effluent quality including odor, color, turbidity, temperature, dissolved oxygen ammonia and nitrate and pH as appropriate. Check sludge level in all sewage tanks; follow manufacturer’s recommendations for solids removal and sludge wasting. Sample effluent as required in the local Operating Permit.
See Operating Permit and Table on following page
For seasonal use, follow manufacturer’s guidelines.
As required based on seasonal usage
Service Provider
At the time of each service visit, Form 7-2: Aerobic Treatment Unit should be completed. See http://www.onsiteconsortium.org/omspchecklists.html Items not permitted in the Amphidrome wastewater systems are specified in the Amphidrome Manual for Minnesota. The protocol for collection of wastewater samples is specified in the Amphidrome Manual for Minnesota. Minimum sampling frequencies* Amphidrome Treatment Goal Design Flow (gpd) Parameter Minimum Sampling
Requirement* A2 < 1,500 BOD and TSS Bi-annually

A2 > 1,500 – <5,000 BOD and TSS Quarterly A2 >5,000 – < 10,000 BOD and TSS Monthly Amphidrome Plus Treatment Goal Design Flow (gpd) Parameter Minimum Sampling
Requirement* TN < 1,500 BOD and TSS
Total Nitrogen = TKN + NO3
-+ NO2-
Bi-annually
TN > 1,500 – <5,000 BOD and TSS Total Nitrogen = TKN + NO3
-+ NO2-
Quarterly
TN >5,000 – < 10,000 BOD and TSS Total Nitrogen = TKN + NO3
-+ NO2-
Monthly
*These minimum sampling requirements assume a system that is operated year round. These values may be reduced if the system is not used year round.

Amphidrome®
OOppeerraattiioonn && MMaaiinntteennaannccee MMaannuuaall AAmmpphhiiddrroommee SSyysstteemm &&
AAmmpphhiiddrroommee PPlluuss SSyysstteemm

i
Table of Contents
Forward ..................................................................... 1 Introduction ............................................................... 2 The Amphidrome Process ...................................... 3 Biochemical Reactions .............................................. 5 Wastewater Characteristics ....................................... 6 Wastewater Flow ..................................................... 6 pH, Alkalinity and Temperature .............................. 6 BOD, COD and Suspended Solids .......................... 7 Nitrogen................................................................... 7
Controls Desctription ................................................ 9 Process Control ....................................................... 36 Trouble Shooting ..................................................... 39

1
Forward This manual has been prepared to help meet the objectives of long equipment life, minimal equipment maintenance, and cost-effective performance. This manual must be read and understood by those responsible for the operation and maintenance of an Amphidrome Wastewater Treatment System. Non-recommended or unauthorized operating or maintenance procedures may result in: damage to the equipment, down time, substandard treatment, and voidance of any warranties. Included in this manual is a brief summary of biological nutrient removal, a description of the Amphidrome process, and a detailed description of the control programming. Operation and maintenance procedures for all of the equipment used in an Amphidrome system are also included. The specific manufacturer’s literature should always be referenced when performing any maintenance or troubleshooting. This manual should be used in conjunction with the design or the “As-built” plans, when provided. All standard safety procedures must be observed. If any special information, regarding the care and operation of the Amphidrome Wastewater Treatment System, is desired, F.R. Mahony will furnish it upon request. Requests for information should be directed to: F. R. Mahony & Associates, Inc. 273 Weymouth Street Rockland, MA 02370 Phone (781) 982-9300 (800) 791-6132

2
Introduction The removal of soluble organic matter (SOM) from wastewater streams has been the major application of biochemical operations for many years. For typical domestic waste streams, which have a biodegradable chemical oxygen demand (COD) range between 50 - 4,000 mg/l, aerobic cultures of microorganisms are especially suitable. Removal occurs as microorganisms use a portion of the carbon in the waste stream as a food source, converting it to new biomass and converting the remaining into carbon dioxide (CO2). The (CO2) is released as a gas and the biomass is removed by sedimentation. To accomplish the removal of soluble organics, a culture of heterotrophic bacteria must be maintained in suitable environmental conditions. The microorganisms are classified as hetertrophic because they derive their carbon from an organic source, such as the incoming waste stream, or from supplemental methanol or ethanol. Since the effect of eutrophication have been shown to be detrimental to receiving waters, the removal of inorganic nutrients from wastewater has become a consideration in the design of wastewater treatment plants. The prime causes of eutrophication are the inorganic nutrients, nitrogen and phosphorus. In sea water and in tidal estuaries, nitrogen is typically the limiting nutrient. Therefore, nitrogen discharge limits in coastal areas have been made especially stringent in recent years. Biological removal of nitrogen to very low levels is easily accomplished. Biological removal of phosphorus is also possible; however, it is more difficult and has a limit, after which, chemical removal is required. In domestic wastewater, nitrogen is present as ammonia (NH3) and as organic nitrogen (NH2
-) in the form of amino groups. The organic nitrogen is released as ammonia, in the process of ammonification, as the organic matter containing it undergoes biodegradation. Two groups of bacteria are responsible for converting ammonia nitrogen to the innocuous form, nitrogen gas (N2). The completion of this process occurs in two steps, by completely different bacteria, in very different environments. In the first step, nitrifying bacteria oxidize ammonia to nitrate (NO3
-) in a process called nitrification. The bacteria responsible for nitrification are chemolithotrophic autotrophs that are also obligate aerobes, therefore, requiring an aerobic environment. Chemolithotrophic bacteria obtain energy from the oxidation of inorganic compounds, which in the nitrogen cycle are ammonia (NH3) and nitrate (NO3
-). Autotrophic bacteria obtain their carbon source from inorganic carbon, such as carbon dioxide. In the second step, denitrification, facultative heterotrophic bacteria convert nitrate to nitrogen gas, which is released to the atmosphere. This is accomplished only in an anoxic environment in which the bacteria use NO3
- as the final electron acceptor. The ultimate electron acceptor being nitrogen as it undergoes a stepwise conversion from an oxidation state of +5 in NO3
- to 0 in N2. This process may be carried on by some of the same facultative, heterotrophic bacteria that oxidize the soluble organic matter under aerobic conditions. However, the presence of any dissolved oxygen will inhibit denitrification, since the preferential path for electron transfer is to oxygen instead of to nitrate.

3
Since biological removal of nitrogen is both possible and economically viable, many of today’s wastewater treatment plants require the removal of both soluble organic matter and nitrogen. To achieve this requires: a heterotrophic population of bacteria operating in an aerobic environment to remove the SOM, a chemolithotrophic autotrophic population of bacteria also operating in an aerobic environment to convert the ammonia to nitrate and finally, a facultative heterotrophic population of bacteria to convert nitrate to nitrogen gas in an anoxic environment. Therefore, typical treatment plant designs approach the removal of organics and nutrients in one of three ways. The first method is to combine the aerobic steps, (i.e. SOM removal and nitrification), into one operation and design the anoxic denitrification process as a separate unit operation. The second method is to design three separate unit operations for each step. The third method to is to design a sequencing batch reactor (SBR), which has both aerobic zones and anoxic zones. The type of technology utilized greatly influences the number of unit operations to reach the desired effluent treatment level. Biochemical operations have been classified according to the bioreactor type because the completeness of the biochemical transformation is influenced by the physical configuration of the reactor. Bioreactors fall into two categories, depending on how the biological culture is maintained within, suspended growth or attached growth, also called fixed film. In a suspended growth reactor, the biomass is suspended in the liquid being treated. Examples of suspended growth reactors include activated sludge and lagoon. In a fixed film reactor the biomass attaches itself to a fixed media in the reactor and the wastewater flows over it. Examples of attached growth reactors include rotating biological contactor (RBC), trickling filter, and submerged attached growth bioreactor (SAGB), also called biological aerated filter (BAF). Extensive research has been conducted on both the activated sludge process and the RBC process but to a lesser degree on the other types of treatment. During the last twenty years, different configurations of SAGBs have been conceived and modest advances in the understanding of the systems have been made. The advantages of biological aerated filters are that they may operate without a solids separation unit process after biological treatment and with high concentrations of viable biomass. Removal of sludge is usually achieved by backwashing the filter. In such bioreactors, the hydraulic retention time (HRT) is less than the minimum solids retention time (SRT) required for microbial growth on the substrates provided. This means that the growth of suspended microorganisms is minimized and the growth of attached microorganisms is maximized. The low hydraulic retention time results in a significantly smaller required volume, to treat a given waste stream, than would be achieved with either a different fixed film reactor or a suspended growth reactor for the same waste stream. The Amphidrome Process The Amphidrome system is a submerged attached growth bioreactor process operating in a batch mode. It is a deep-bed sand filter designed for the simultaneous removal of soluble organic matter, nitrogen and suspended solids within a single reactor. However,

4
if stringent total nitrogen limits, (i.e. less than 10 mg/l), are required, a second smaller polishing reactor is required. Since it removes nitrogen, it is also a biological nutrient removal (BNR) process. To achieve simultaneous oxidation of soluble material, nitrification and denitrification in a single reactor, the process must provide aerobic and anoxic environments for the two different populations of microorganisms. The Amphidrome system utilizes two tanks and one submerged attached growth bioreactor, subsequently called Amphidrome reactor. The first tank, the anoxic/equalization tank, is where the raw wastewater enters the system. The tank has an equalization section, a settling zone, and a sludge storage section. It serves as a primary clarifier before the Amphidrome reactor.
Figure 1. Cross Section View Of Amphidrome™ Reactor and Tanks
This Amphidrome reactor consists of the following four items: underdrain, support gravel, filter media, and backwash trough. The underdrain, constructed of stainless steel, or HDPE encased concrete block, is located at the bottom of the reactor. It provides support for the media and even distribution of air and water into the reactor. The underdrain has a manifold and laterals to distribute the air evenly over the entire filter bottom. The design allows for both the air and water to be delivered simultaneously, or separately, via individual pathways to the bottom of the reactor. As the air flows up through the media, the bubbles are sheared by the sand--producing finer bubbles as they rise through the filter. On top of the underdrain is 18”, (five layers), of four different sizes of gravel. Above the gravel is a deep bed of coarse, round, silica sand media. The media functions as a filter, significantly reducing suspended solids, and provides the surface area for which an attached growth biomass can be maintained. To achieve the two different environments required for the simultaneous removal of soluble organics and nitrogen, aeration of the reactor is intermittent, rather than continuous. Depending on the strength and the volume of the wastewater, a typical aeration scheme may be three to five minutes of air and ten to fifteen minutes without air.
5
Concurrently, return cycles are scheduled every hour, regardless of the aeration sequence. During a return, water from the clear well is pumped back up through the filter and overflows into the trough. A check valve in the influent line prevents the flow from returning to the anoxic/equalization tank, via that route. The trough is set at a fixed height above both the media and the influent line; and the flow is by gravity back to the front of the anoxic/equalization tank. The cyclical forward and reverse flow of the waste stream and the intermittent aeration of the filter achieve the required hydraulic retention time and create the necessary aerobic and anoxic conditions to maintain the required level of treatment. Biochemical Reactions The removal of SOM is achieved by the oxidation of carbonaceous matter, which is accomplished by the aerobic growth of heterotrophic bacteria. The biochemical transformation is described by the following normalized mass based stoichiometric equation in which the carbonaceous matter is a carbohydrate (CH2O) and the nitrogen source for the bacteria is ammonium (NH+
4). CH2O + 0.309 O2 + 0.085 NH+
4 + 0.289 HCO3- + 0.535 C5H7O2N + 0.633 CO2 + 0.515 H2O
The oxidation of ammonia to nitrate is accomplished by the aerobic growth of chemolithotrophic, autotrophic bacteria and is described by the following normalized mass based stoichiometric equation. The overall equation describes the two-step process in which ammonia is converted to nitrite by Nitrosifyers and nitrite is converted to nitrate by Nitrifyers. NH+
4 + 3.30 O2 + 6.708 HCO-3 + 0.129 C5H7O2N + 3.373 NO-
3 + 1.041 H2O + 6.463 H2CO3 The final step in the removal of nitrogen from the waste stream occurs when carbonaceous matter is oxidized by the growth of heterotrophic bacteria utilizing nitrate as the terminal electron accepter. The equation describing the biochemical transformation depends on the organic carbon source utilized. The following is the normalized mass based stoichiometric equation with the influent waste stream as the organic carbon source. NO-
3 + 0.324 C10H19O3N + 0.226 N2 + 0.710 CO2 + 0.087 H2O + 0.027 NH3 + 0.274 OH- Biological removal of nitrogen has been the focus of much attention and many of today’s wastewater treatment plants incorporate it. However, the difficultly in promoting these biochemical transformations in one reactor is the different environmental conditions required for each transformation.

6
This Amphidrome® process is designed to achieve the above reactions simultaneously within one reactor. The aerobic environment within the filter promotes the first two reactions. The return flow, to the anoxic/equalization tank, mixes the nitrates with organic carbon in the raw influent and with organic carbon that has been released from the stored sludge. The anoxic environment within the filter promotes denitrification, the third reaction. Wastewater Characteristics The Amphidrome® process, like all wastewater processes, is designed to operate within design parameters for flow and wastewater characteristics. The first step to successful operation of any treatment facility is to characterize the wastewater through various analyses, which include: BOD5, total suspended solids, settleable solids, COD, pH, alkalinity, DO, temperature, total solids, dissolved solids, nitrogen and phosphorus. Some of these parameters may not be specified by any imposed discharge limits; however, occasional sampling may prove prudent should any problems arise. Maintaining a history of these analyses will prove helpful in following trends or anticipating changes in the treatment efficiency. Samples should be taken in the same locations and testing should follow “Standard Methods” or other approved regulatory testing procedures. Consistent techniques will provide more useful and valid information. Wastewater Flow Large fluctuations in wastewater flow may effect the treatment process; however, daily flows will fluctuate and should be expected. Major changes should be limited to the design capabilities of the treatment process. Wastewater flows may be monitored through water meter or pump run time. However, effluent flow metering is the most common and will provide an accurate measure of the flow actually processed at the facility. Treatment plants are often designed based on expected flow rates from established literature or from regulatory standards. These standards usually result in design flows that are greater than the actual flows. Once the facility is constructed, operating parameters must be set to treat actual flows; therefore, some adjustment may be required. Flows should not exceed the design permit flow. pH, Alkalinity and Temperature Typical domestic wastewater has a pH between 6.5 and 8.0. Biological microorganisms are affected by extreme variations in pH and in temperature. It has been shown experimentally that the reactions, of both nitrification and denitrification, are optimized at pH values in the range of 8. Therefore, it is recommended that supplemental alkalinity be used to maintain such a pH, as long as this does not put the plant in violation of any effluent limits. Maintaining such a pH will also insure that sufficient alkalinity is present for nitrification. The bacteria responsible for nitrification consume the inorganic carbon

7
supplied by the bicarbonate dissolved in the wastewater. Therefore, bicarbonate alkalinity is an important parameter in the treatment process and should, therefore, be monitored in an Amphidrome® system. Two general rules may be used as operational guidelines: first, 7.4 mg/l of alkalinity is needed for each mg of ammonia to be nitrified, and second, a residual alkalinity value of 100 mg/l should be left after complete nitrification. Typically, both these conditions will be met if supplemental alkalinity is used to maintain the pH level at approximately 8. Temperature fluctuations from weather conditions should not effect the Amphidrome process since the process tanks are all underground. The anoxic/equalization tank provides buffering of influent temperature prior to the reactor. This should serve to permit reasonable temperature fluctuations in the waste stream. BOD, COD and Suspended Solids Organic and solids loading are fundamental characteristics governing the size of treatment processes. BOD and COD are measures of the strength of the wastewater. BOD (biochemical oxygen demand) measures the rate of oxygen uptake from the wastewater by microorganisms in biological reactions. These microorganisms are converting the waste materials to carbon dioxide, water and inorganic nitrogen compounds. The oxygen demand is related to the rate of increase in microorganism activity resulting from the presence of food, organic waste, and nutrients. COD (chemical oxygen demand) measures the presence of carbon and hydrogen but not amino nitrogen in organic materials. COD does not differentiate between biologically stable and unstable compounds. COD tests can be inhibited by chloride. Thus, wastewater containing high salt concentrations, such as brine, cannot be readily analyzed without modification. Suspended solids measure the solids in wastewater that floats or suspends in the liquid stream. This does not measure the total solids loading to the facility that includes settleable and dissolved solids. The settleable solids are normally removed in the anoxic/equalization tank while suspended and dissolved solids are to be treated in the filtering and biological processes in the Amphidrome reactor. As solids breakdown and are backwashed from the reactor, they settle and form a layer of sludge at the bottom of the anoxic/equalization tank. Periodic removal of the sludge is required. Nitrogen In domestic wastewater, nitrogen is present as ammonia (NH3) and as organic nitrogen (NH2
-) in the form of amino groups. The organic nitrogen is released as ammonia, in the process of ammonification, as the organic matter containing it undergoes biodegradation. To achieve biological nitrogen removal, bacteria must convert ammonia to the innocuous form, nitrogen (N2) gas. However the stepwise process produces nitrate (NO3
-) as an intermediate compound. Nitrate in drinking water is of concern to infants because it has

8
been widely stated in literature to be linked to “methemaoglobinemia,” which may result in death for infants. Monitoring of both ammonia and nitrate is extremely useful for process control and should be done once or twice weekly after the plant is in compliance.

9
Controls Description Touch Screen
Touch Screen Operation
The Amphidrome™ process control utilizes an analog positive 12-bit resolution touch screen HMI (human/machine interface). Several sizes of touch screen panels are available with the Amphidrome control panel. This screen is generally mounted on the front face of the control panel and provides access to system operating readouts and allows the operator to access and modify operation settings. The touch screen panel has a battery back up to store calendar-month/day/year. The replaceable battery –ADC Part #D2-BAT-1 (Manufacturer Part # CR2354) Operator settings are based on a real time clock built into the panel. The touch screen panel will display current operation status and provides access to additional screens which display system component status and settings. The pathways to each screen are menu driven with common menu buttons such as “Main”, “Back”, “Home”, and “Menu”. This manual is intended to demonstrate pathways to the menu screens and will show values such as 0 (zero) or some entered values based on general system operating parameters. Specific settings for each system should be taken from the program settings and operator adjustments as may be required for the specific treatment plant operation. References to operator settings in this manual are therefore used as an example.
→

10
Main Screen
The “Main Screen” provides access to each system component. Access to component screens may be obtained through the menu buttons at the bottom of the Main Screen, or by touching on a component with a blue outline. Status indicators on the Main Screen will display if a float is raised or if a particular piece of equipment is in operation. Floats in each of the system tanks appear as a black dot when down, and will light as green when raised (made). Example: The system display above demonstrates the float and pump status with running pumps in “green” and idle pumps “red”. The real time clock display in the top center right displays the current time and date as HH:MM:SS Military Time. The time shown in this image is 17:08 which would be 5:08 PM. The date is shown as 07-SEP-10 or September 7, 2010. Adjusting the clock settings will be discussed later in this manual. Below the time and date is the version number of this touch screen program (currently v10.09.xx). Touching the version number will display a pop-up with details on the current version (e.g. modifications and enhancements.)

11
Lift Station Screen
Touching on the Lift Station will open the Lift Station Screen. The Lift Station pumps raw wastewater to the Anoxic Tank.
The pumps are demand-driven and controlled by the floats in the Lift Station Tank. The current status of the floats and pumps are shown on the screen. Notice that the menu bar at the bottom of the screen highlights the current screen being displayed.

12
Flow Equalization Tank (FET) Screens Touching on the FET Tank will open the FET Screen.
The Flow Equalization Tank receives raw waste from the Lift Station as well as the return and backwash water from the Amphidrome® and Amphidrome® Plus. Two Amphidrome Feed Pumps are located in this tank. The pumps are controlled by a combination of the floats and an operator-defined on and off time. Selecting the “Amphidrome Feed Control” button on this screen will pop-up the feed control dialog.

13
Using this dialog, you may define two separate start and end times during which the feed pumps will run. You will also define the two on-off cycles at which the pumps operate. The pumps will operate at the “Normal” cycle any time the water level is above the “Off” float (the lowest float in the tank) and below the “High Rate” float (the 3rd float in the tank). The feed pumps will begin to ‘cycle’ on-and-off at the “Normal” rate when the “Enable” float (2nd float) is raised. It will continue operations at this rate until: 1) the “Off” float drops out and the pumps stop, or 2) the “High Rate” float is raised and the pumps cycle at the “High” feed rate. Optimal settings for the “Normal” cycle would be to set the “ON” time to displace one half ( ½ ) of the volume of water in the reactor and have the “OFF” time at least as long as the time it takes for one complete ON/OFF cycle. For example: if the reactor is 9.5’x10.5’ with 6 feet of media, the volume to displace would be: 9.5’ x 10.5’ x 3’ x 7.48 gallons/cuft x 0.4 = 895 gallons per dose. If pumps run at 200 gpm, then the pump ON time would be 4-5 minutes. If the process air is setup to run around 3-mins ON/ 8 mins OFF (11 minutes per cycle0, then the OFF time for the pumps would be would be Select “DONE” to exit this dialog.

14
Reactor Screens Touching on the Amphidrome will open the Amphidrome Reactor Screen.
The Current Status box shows the status of key components such as floats and pump operations associated with the Amphidrome Reactor. Operator adjustable process controls are “Process Air Control”, “Backwash Control” and “Return Control” (green buttons upper right). Manual startup buttons for “Return”, “Backwash”, and “Bump” cycles are provided on this screen as well. Once the “cycle” is initiated, it must be permitted to complete the full cycle and can not be stopped from this screen. Therefore this button is colored yellow as a caution to be used sparingly. The current time and date are displayed at the top right of the Amphidrome Reactor Screen. By pressing the “Main” button you will be returned to the Main Screen. You may also jump to any component along the flow train by pressing on the appropriate button or “Menu” button at the bottom of the screen

15
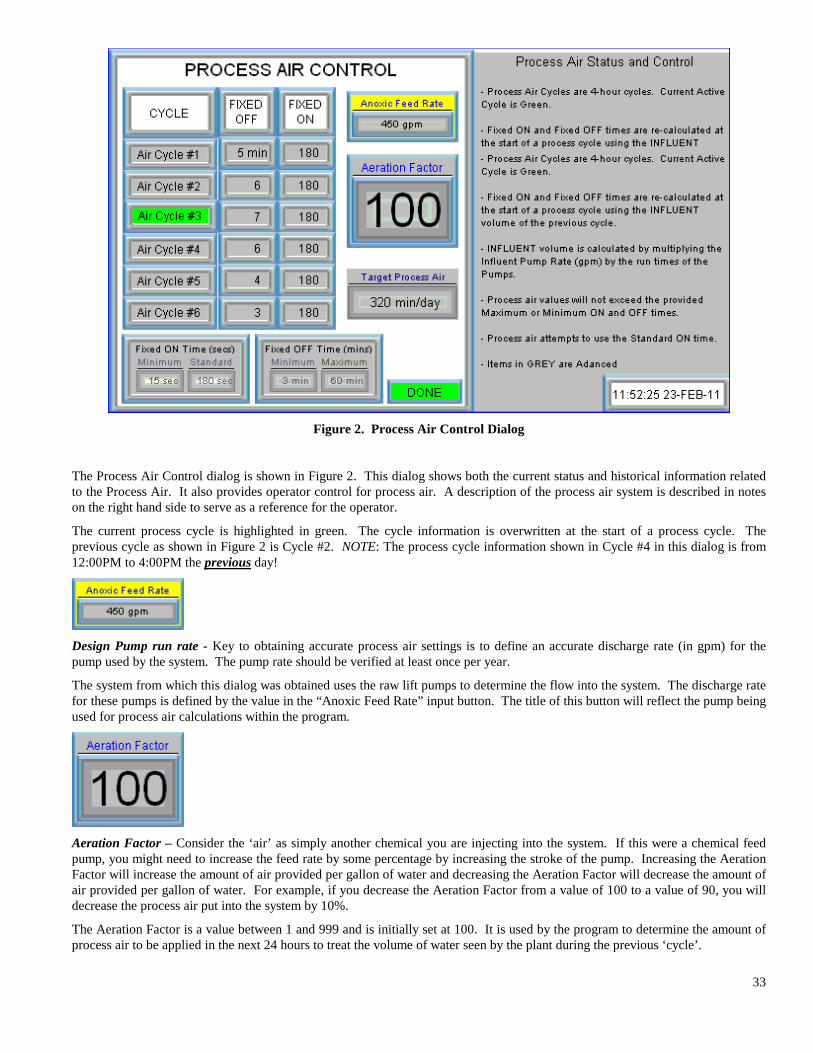
Process Air Control Screen The process control screen, like all pop-up dialog screens in this system provides some operator notes and guides. These help guides describe the controls found on the screen and their application.
Process air settings (fixed off and fixed on times) are automatically recomputed every four hours using the flow to the treatment system. The Aeration Factor at startup is set to a value of 100. This value may be viewed as a percentage of the calculated “design process air’ that is required to treat the waste stream. If the wastewater strength is lower or higher than the design parameters, this number will need to be decreased or increased, as necessary to provide adequate process air. The Aeration factor may be in the range of (1 – 999), however, if it rises above 300, or drops below 40, FRMA should be consulted in order to verify the program operations and possibly re-calibrate the system an Aeration Factor of 100. Figure 1 presents a plot demonstrating how the total minutes of process air varies based on volume of wastewater. The slope of the line is calculated based on the design influent constituent and flow volume. On this graph, 615 minutes of process air (in 24 hours) is required to treat 57,000 gallons of wastewater. The required “minutes of process air” is then used to calculate the fixed ON and fixed OFF time for the process air blowers. The fixed off and fixed on times for each process air cycle are shown on the Process Air Control dialog. The current (active) process air cycle is shown in green.

16
Until a colony is fully established in the reactor, the Aeration Factor should be set to around 150. This setting would provide excess air to the system and should promote the rapid growth of nitrifying bacteria. As the bacteria colony becomes established, the ammonia level in the clearwell will drop to (near) zero. Once the ammonia level is fractional, the operator will need to reduce the Aeration Factor (trim back air) until the ammonia level just start to rise (remaining below 1.0 mg/L). Since the results of reducing or increasing the process air is typically seen within a few days, initial changes of the aeration factor may be large. Example: Initial aeration factor = 150, Ammonia is fractional; nitrates are > 10 mg/L. Reduce Aeration factor to 90. Test for ammonia & nitrates 24 and 48hrs later. Ammonia is now 1.8mg/L, nitrates are 4. Increase Aeration factor to 95, test again for ammonia & nitrates 24 and 48hrs later. Repeat process until ammonia is fractional, and nitrates are low.

17
Backwash and Return Control The Backwash / Return Screen is shown below.
Both return volumes and reactor backwash times may be adjusted from this screen. You schedule a backwash by simply touching on the time under the desired reactor. The selected time will be shown as a green box around the time. For example, on the above screen, Amphidrome #2 has a backwash scheduled for 12:15 AM (00:15). Selecting the time again, will remove the backwash time. If a backwash is not scheduled, a return will occur at the time shown. You may define the time over the trough for each return. As seen on the screen, a return will occur every hour. Set “Time Over Trough” to ‘0’ to disable that return. Note that disabling a return ‘time over trough’ will disable returns for all reactors in that row. To change the return times in this screen, touch the ‘Time Over Trough” entry to modify to open the keypad entry screen. This screen will appear much like a calculator screen and allows entry of the new value. You may then accept the change by pressing “Enter” or stop the change by pressing “Cancel”. When you are completed making these changes, press “Done” to return to the reactor screen. NOTE that the time values are clock times in military time. To set a backwash for 4:00PM, you would enter 1600 on the keypad.

18
Backwash Control Screen
The Backwash Control Screen is displayed above. This screen allows you to define the day of the week to institute a backwash as well as modify the time the blowers and pumps run in the event that the default backwash settings are not adequate. It also allows you to run a manual backwash of each reactor. In order to modify the blower and pump times shown in grey, you must first enter the supervisor password and then will be taken to the ‘change entry’ screen. The default run setup should NOT be modified without first consulting FRMA.

19
Clear Well Status Screen This screen is accessed by pressing on the Clear Well image on the Main Screen or from the “Clearwell” button at the bottom of the component screens.
The Clear Well Status screen will show the float status either “up”, “down” or “alarm”. The alarm float status is a time delayed float that may be “up” for a period of time in the operation before an alarm is signaled. Pump status conditions are also shown on this screen. These pumps will indicate as “OFF” on “ON” and light green when running. The time and date are displayed at the top right of the Clear Well Status Screen. The discharge block over the clearwell discharge pumps allow you to define up to six (6) times during the day that the clear well will discharge to the Plus feed tank. A discharge will ONLY occur if the 2nd float in the clear well is elevated, and the pumps will run until the 2nd float drops out.

20
Plus Feed Tank The Plus Feed tank receives flow from each Clear Well discharge and acts as a flow equalization tank for the Plus® Reactor. The Plus Feed tank then discharges to the Plus Reactor at pre-defined intermittent “on” and “off” cycles.
The float indicators will light green when the float is raised and each pump run status will show as “OFF” or “ON” and light green when the pump is on. The time and date are displayed at the top right of the Clear Well Status Screen. Selecting the Plus Feed Control button will pull up the following Plus Feed Control dialog screen.
Plus® Feed Control Dialog The “Plus Feed Control” button will open the Plus® Feed Control Dialog. Controls for this screen are discussed in the section on the Amphidrome Plus® Reactor.

21
Plus® Reactor Screen The Plus Reactor is the final denitrification polishing filter in the process. This screen shows system status conditions such as Feed Pump run times, High Level alarms, Backwash Cycle counts, etc.
Operator adjustable system controls for this reactor are accessible from the “Plus Feed Control” button (upper left) and “Backwash Control” (upper right). Manual override buttons for a system “bump” cycle (used to clear the underdrain and reactor of trapped nitrogen bubbles) and to start a backwash may be made from this screen as well. The operator should inspect this Reactor daily and observe the presence of gas bubbles. If the filter is showing a prevalence of gas bubbles on the surface, a “bump” may be needed to release them from the filter and the frequency of the system “bump” may need to be increased. Once the “bump” cycle is initiated, it must be permitted to complete the full cycle and can not be stopped from this screen. Therefore this button is colored yellow as a caution to be used sparingly. Manual backwashes may also be initiated from this screen if the filter requires a backwash for sampling or other filter condition that can not be managed through the system backwash schedule discussed later in this manual. Like the “bump” the backwash once initiated must be permitted to complete the full cycle and can not be stopped from this screen. Therefore this button is colored yellow as a caution to be used sparingly.

22
Plus® Feed Control Dialog
Using this dialog, you may define two separate start and end times during which the feed pumps will run. You will also define the two on-off cycles at which the pumps operate. The pumps will operate at the “Normal” cycle any time the water level is above the “Off” float (the low float in a dedicated Plus Feed tank, the 2nd float in a clearwell feeding a Plus) and below the “High Rate” float (the 3rd float in the tank). The feed pumps will begin to ‘cycle’ on-and-off at the “Normal” rate when the “Enable” float (2nd float in a dedicated Plus Feed tank, the 3rd float in a clearwell feeding a Plus) is raised. It will continue operating at this on-off cycle until: 1) the “Off” float drops out and the pumps stop, or 2) the “High Rate” float is raised and the pumps cycle at the “High” feed rate. Select “DONE” to exit this dialog.

23
Plus® Reactor Backwash Dialog This screen is opened by pressing on the “Backwash Control” button in the top right of the screen
You may set up to two backwashes per day. Under normal conditions this filter should only require one daily backwash. The image above shows the values of 0000 in the screen. The actual display will show the values such as 1830 or 4:30 pm. The second cycle will normally be disabled with the value of 9999. You may also enable or disable backwashes each day. At start up backwashes may be scheduled at certain days of the week or every other day to permit the filter to establish biological population. This may be adjusted depending on the performance of the filter and other variables such as swings in flow from weekday highs to weekend lows. Observance of the final effluent and filter drain time after scheduled backwashes will provide an indication of these times require adjustment. Controls for the blowers and pumps for the Plus® backwash are, like the controls for the Amphidrome® backwash, advanced operations and require a password in order to modify. They are shown in grey on the screen. Chemical feed of supplemental carbon is controlled at the Main Control panel and each carbon feed pump station. Chemical feed is not controlled by the touch screen. These controls are discussed elsewhere in the manual.

24
Plus Clear Well & Final Discharge Pump Station
The Final Effluent Tank stores sufficient volumes of clean water to be used for the backwash of the Plus. The remainder of the volume is discharged to the final effluent receiving system. There are a wide variety of effluent receiving options available which are dependent on the specific site conditions and discharge permit. Generally these discharges are to sub-surface systems but may on occasion be to surface or other treatment systems. In the majority of applications the final discharges may go to any of the following systems:
• Discharge to Leachfield • Discharge to Leaching trenches • Discharge to Drip Dispersal system
These systems may be preceded by other treatment steps such as:
• UV Disinfection • Membrane Filtration and UV Disinfection • Chemical precipitation for Phosphorous or other waste prior to membrane filtration and UV
disinfection or direct to UV disinfection. This facility uses a combination of discharges directly from the Plus Clear Well & Final Discharge Pumping Station to Leaching Trenches. The pumps alternate and pump operation is demand-driven. That is, the effluent pump will start when the “Final Effluent Pump ON” float (3rd float) is raised and stops when the “Final Effluent Pump OFF” float (2nd float) drops out.
25
The final discharge pumps will show as “OFF” or “ON” and will light green when running. A pump may be disabled, if necessary. The tank also has a High Level Alarm float that will signal a priority alarm when the alarm float is tipped. The time and date are displayed at the top right of the Final Discharge Screen. The Menu Screen will open a list of drop down options
Menu Screen Located on the Reactor Screens, Clear Well Screens and the Plus Reactor Screens as well as the Main Screen there is a Menu Screen Tab.
This button will open access to Menu Screen which will present operator enabled tabs which provide access to items such as Equipment Run Times and Event Counters.
Pressing any of these tabs will open that next screen or press “Back”, “Home” or “Menu” to return to those main screens. The time and date are displayed at the bottom right of the Menu Screen.
Equipment Run Time Screen

26
Run times are accumulated in hours and minutes for each piece of process equipment. Times recorded by the operator based on the daily inspections of the facility and used to determine if run times are within acceptable ranges. Run times are also used to schedule service intervals such as oil changes to blowers and so forth. Consult the applicable equipment manufacturer’s sections of this manual for those recommended service intervals.
The operator should record these values with notation of the date taken and the Time shown in the bottom left of the screen. Taking these readings at the same time of day will provide more accurate evaluation of run time variables. These readings may be observed more often if the operator wishes to observe trends that might be linked to flow patterns or other system variables.

27
Event Counters
Pressing the Event Counter button will open this screen which shows the specific number of events such as alarms or failed backwashes. These values can be recorded each day, week or month depending on the frequency and compared to previous totals stored in operator log sheets. Example: If backwashes are scheduled daily for Amphidrome # 1 the total should show one more each day and match with the program settings. The operator may return to the Menu Screen or the previous screen by pressing “Back” or “Menu” or return to the Main Screen by pressing “Home”. The time and date are displayed at the bottom right of the Event Counter Screen.
28
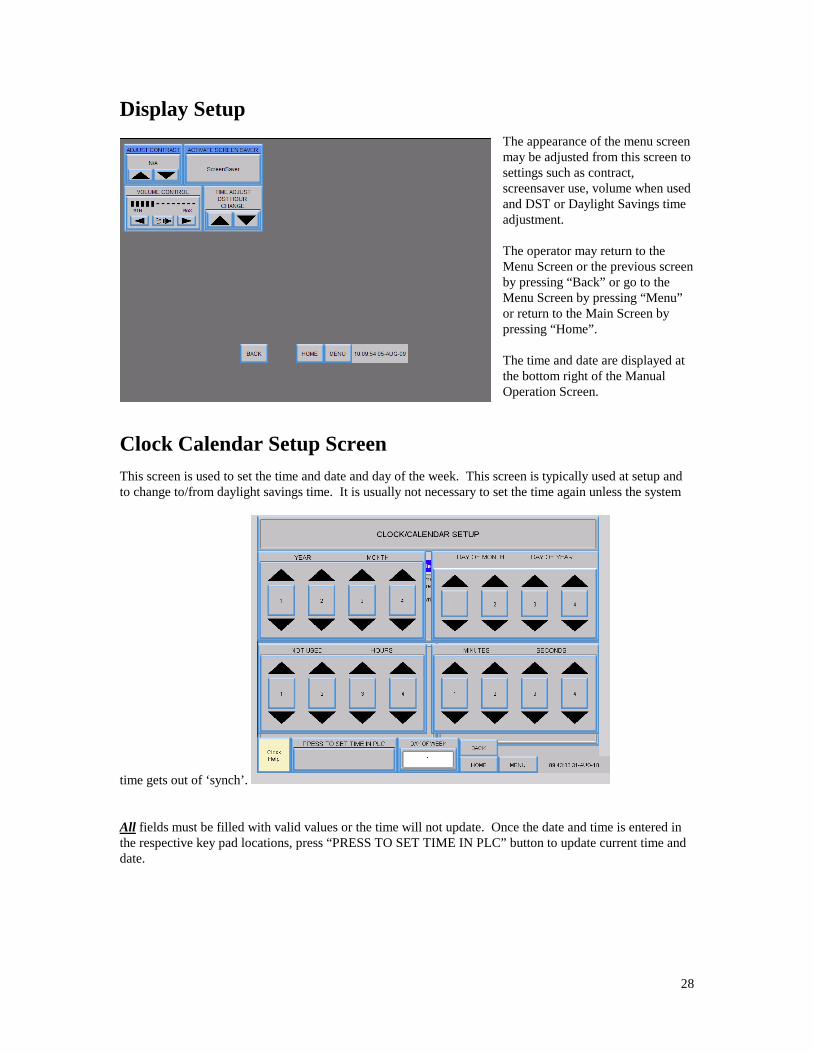
Display Setup The appearance of the menu screen may be adjusted from this screen to settings such as contract, screensaver use, volume when used and DST or Daylight Savings time adjustment. The operator may return to the Menu Screen or the previous screen by pressing “Back” or go to the Menu Screen by pressing “Menu” or return to the Main Screen by pressing “Home”. The time and date are displayed at the bottom right of the Manual Operation Screen.
Clock Calendar Setup Screen This screen is used to set the time and date and day of the week. This screen is typically used at setup and to change to/from daylight savings time. It is usually not necessary to set the time again unless the system
time gets out of ‘synch’. All fields must be filled with valid values or the time will not update. Once the date and time is entered in the respective key pad locations, press “PRESS TO SET TIME IN PLC” button to update current time and date.

29
Alarm History Screen
Pressing the Alarm History tab will drop down a record of system alarms and a count of the number of times these have occurred. This Screen totals the alarms and accumulates the total alarms. The operator may chose to clear these alarms after they are recorded in operation logs. This will permit the operator to view alarms for this specified period of time for monitoring. The alarms will also be stored in the Event Counter Screen accessed from the Menu Screen.
Troubleshooting Tab A Troubleshooting tutorial is stored in the Touch Screen for ready access to the operator and should be used in conjunction with the operations and maintenance manual troubleshooting section to follow in this document.
Pressing the Troubleshooting tab on the MENU Screen will take you to the first troubleshooting screen. These troubleshooting tips are also available in the O&M appendix, but are presented on the touch screen for convenience. This manual will not attempt to demonstrate each drop down but will show an example of the access instructions and demonstrate typical information found there. Example: By choosing the “Automatic Valves” tab a screen will drop down with a list of “Problem”, “Probable Cause” and “Solution” options.

30
The operator may select another topic by pressing the options at the bottom of this screen or return to the Main Screen by pressing “Main”.
Advanced Settings V-Registers Operator adjustable registers (V-Registers) are the program address for command settings used in the operating program. Operators may make changes to the operating program directly via the V-Register values. Program changes made via the V-registers should only be performed by authorized personnel. The operator should refer to the printed “OPERATOR ADJUSTABLE REGISTERS” spreadsheet provided with the system. This instruction will be generic as each system is tailored to include specific equipment for each treatment plant. The V-Register screen will open with a list of V-Register in the white box with the present setting in the blue shaded box below. This screen allows the operator to go “Back” or to the “Next” screen as well as “Home” or back to the “Menu” Screen. To change a register, tap on the address on the Touch Screen to open the next screen.

31
The “Numeric Entry” screen will open. Using the keypad the operator may type in the desired change and
press “Enter” to accept the change. If an error is made the operator may press “Cancel” and type in a new value. Once the operator presses “Enter” the change will be logged into the program and saved.
________________________________________________________________

32
Automated Process Air
Process Air Computation:
The program will re-calculate the fixed ON and fixed OFF times based on the flow, the slope of the design curve, and the air that has already been placed into the system during the previous cycle.
1 There are six (6) Process Cycles in a 24-hour period. The Fixed ON / Fixed OFF times (process air) is re-calculated every four (4) hours, at the start of a new Process Cycle.
2 The “Volume to Treat” is determined from:1) Influent Pumps; 2) Plus Feed Pumps; or 3) Final Effluent Pumps. IN THAT ORDER of preference. If a pump (e.g. influent pump) does not exist, then the next pump in order is used.
3 The “Total Process Air” required in 24 hours for the given “Volume to Treat” is calculated using a linear equation, similar to that shown in Figure 1.
Figure 1. Minutes of process air required per 24 hours per gallon of flow.
The curve for each system is calculated based on the assumed influent load (BOD, TKN), the reactor volume and process air delivered. For the shown system, at the design flow of 57,309 gpd, a total of 615 minutes of process air would be required over the next 24 hours.
Operator Controls:
33
Figure 2. Process Air Control Dialog
The Process Air Control dialog is shown in Figure 2. This dialog shows both the current status and historical information related to the Process Air. It also provides operator control for process air. A description of the process air system is described in notes on the right hand side to serve as a reference for the operator.
The current process cycle is highlighted in green. The cycle information is overwritten at the start of a process cycle. The previous cycle as shown in Figure 2 is Cycle #2. NOTE: The process cycle information shown in Cycle #4 in this dialog is from 12:00PM to 4:00PM the previous day!
Design Pump run rate - Key to obtaining accurate process air settings is to define an accurate discharge rate (in gpm) for the pump used by the system. The pump rate should be verified at least once per year.
The system from which this dialog was obtained uses the raw lift pumps to determine the flow into the system. The discharge rate for these pumps is defined by the value in the “Anoxic Feed Rate” input button. The title of this button will reflect the pump being used for process air calculations within the program.
Aeration Factor – Consider the ‘air’ as simply another chemical you are injecting into the system. If this were a chemical feed pump, you might need to increase the feed rate by some percentage by increasing the stroke of the pump. Increasing the Aeration Factor will increase the amount of air provided per gallon of water and decreasing the Aeration Factor will decrease the amount of air provided per gallon of water. For example, if you decrease the Aeration Factor from a value of 100 to a value of 90, you will decrease the process air put into the system by 10%.
The Aeration Factor is a value between 1 and 999 and is initially set at 100. It is used by the program to determine the amount of process air to be applied in the next 24 hours to treat the volume of water seen by the plant during the previous ‘cycle’.

34
Figure 2 illustrates how changing the Aeration Factor affects the amount of air that will be placed into the system. Note that increasing the Aeration Factor above 300, or below 50 should signal a potential problem and you should contact FRMA to discuss the plant operations after taking a raw influent BOD and TKN sample.
Figure 3. Effect of Aeration Factor changes on slope of process air control graph
Increasing the Aeration factor from 100 to 200 will DOUBLE the amount of air put into the system for a given volume of water.
Target Process Air – This is the total number of minutes of Process Air that will be applied to the system in the next 24 hours. This value is re-calculated at the start of a new process cycle and is determined based on the flow through the system and the time applied during the previous cycle.
Fixed ON and OFF controls:
Process air is provided to the system by a cycling the blower on and off. These on and off times are called the Fixed ON time and Fixed OFF time, respectively.
Four values are defined within the program to control the calculation of the Fixed ON and OFF times. These values are set at startup and the should NOT be modified by the operator without first consulting FRMA.
Standard Fixed ON Time – This value is the standard blower run time (in seconds) that is used for process air. It is NOT the maximum time for process air to be on.
Minimum Fixed ON Time. – This value is the minimum blower Fixed ON run time (in seconds).
Minimum Fixed OFF Time – This is the minimum Fixed OFF time (in minutes).
Maximum Fixed OFF Time. – This is the maximum Fixed OFF time (in minutes).

35
PROCESS CONTROL

36
Sampling Since the Amphidrome system operates as a sequencing batch reactor, effluent grab samples from each batch should be taken. Therefore, if a system discharges twice a day, two samples should be collected, one for each batch treated. If local regulations require a composite sample, then the grab samples from each batch should be blended together in proportionate amounts. The volumes may be apportioned based directly on the volume discharged for each batch, or based on the discharge pump run for each batch. Operation The Amphidrome system is a submerged attached growth bioreactor (SAGB) process designed around a deep-bed sand filter. The Amphidrome® system has all tanks located below grade with access hatches or manhole covers at grade level to allow for inspection and maintenance of the system. To ensure proper operation of the system, the operator must do inspection of the system internals to ensure proper operation. Start Up and Initial Tests Upon taking over operation of an Amphidrome system, the operator should conduct three tests on each Amphidrome filter in the plant and two tests on each Amphidrome Plus filter in the plant. The tests are designed to determine the volume flow rates of water through the filters, one in the forward direction and two or one in the reverse direction, depending on which filter is being tested. Test 1: Forward Flow Test: The purpose of the test is to determine the flow rate through the filter (i.e. hydraulic loading). This test must be conducted at the end of an automatically scheduled return flow cycle or after a manually initiated return flow. After the return flow pump shuts off, the liquid level in the Amphidrome filter decreases and should be measured over equal increments of time until the forward flow slows down to less than a 1 inch change in ten minutes. (If the filter being tested is an Amphidrome Plus filter, the Amphidrome Plus feed pump must be used to raise the level in the filter). During the first portion of the test in which the liquid level in the filter is high and the flow rate through the filter is also high, measurements should be taken every 1 –2 minutes. As the flow rate slows down, the measurements may be recorded every 5 – 10 minutes. The total time, the total change in height and the surface area of the reactor, can be used to calculate the flow rate through the filter. The data should be recorded on a table similar to that labeled Filter Flow Through Rate, and shown in Appendix A. Test 2: Return Flow Test: The purpose of this test is to estimate the average volume flow rate for a return cycle. This value is necessary to control the amount of wastewater returned during each return cycle. This test must be conducted at the beginning of an automatically scheduled return flow cycle or at the beginning of a manually initiated return flow cycle. The level in the Amphidrome filter should be low before the start of this test. After an initial measurement of the liquid level in the filter is recorded, the return flow pump should start or be started. Only the return flow pump is used for this test. During the test, the liquid level in the filter should be measured and recorded every minute. Once the liquid starts to flow over the return flow/backwash trough, the test may be stopped. The total time to reach the trough should be recorded. The data should be recorded on a table similar to that labeled Filter Flow Through Rate, and shown in Appendix A. Test 3: Backwash Flow Test: The purpose of this test is to estimate the average volume flow rate for a backwash. This value is necessary to control the amount of sludge that is removed from the reactor during a backwash. For the Amphidrome

37
reactor, test 3 is a repeat of test 2, but with both the return flow pump and the backwash pump running. There is no test 2 for the Amphidrome Plus reactor because the reactor does not have return cycles; and therefore, there is no return pump only a backwash pump. As in test 2, the level in the filter should be low before the start of this test. After an initial measurement of the liquid level in the filter is recorded, the return flow pump and the backwash pump should start. For the Amphidrome Plus reactor, only the backwash pump is started. During the test, the liquid level in the filter should be measured and recorded every minute. Once the liquid starts to flow over the return flow/backwash trough, the test may be stopped. The total time to reach the trough should be recorded. The data should be recorded on a table similar to that labeled Filter Flow Through Rate, and shown in Appendix A. Process Control Efficient operation and effective process control of an Amphidrome System, as with any wastewater treatment plant, requires comprehensive methods for collecting and recording all pertinent information regarding plant performance and equipment maintenance. This is accomplished with an equipment log, a sampling and analysis plan for both the required sampling and all field sampling and meticulous records of all observations regarding the daily operation of the plant. Examples of equipment logs are included in this manual. Sampling and Analysis: During the initial start up period (approximately 30-90 days), sampling and analysis, (both laboratory and field), should be performed more frequently than during routine operation. Since the typical treatment goals are the removal of BOD5, TSS, TKN, NH3, and NO3
-, these parameters, as well as pH, alkalinity, and flow should be closely monitored. Test kits for both NH3, and NO3
- are recommended so that the operator can test these parameters once or twice weekly for process control. Equipment Run Times: All the equipment run times are recorded and stored by the PLC. These values are totals; therefore, the operator should record both the total time and the difference between the previous and the current readings, (i.e. the daily average). By averaging the daily run time of equipment it is possible to detect any potential problems and to verify that the equipment is operating for the approximate prescribed time in the program. For example in the process blower, daily average run time can be used to confirm that aeration is occurring, as programmed. Additionally, averaging equipment run time shows trends in the process. For example, the duration of the aeration is a function of the fixed air on time and the flow based multiplier; therefore, aeration times vary with flow. Meticulous records of actual aeration times that may be compared with the results of sample analyses will allow for accurate process control decisions. Recording of equipment run time is a critical and necessary part of operations and maintenance and should be performed diligently by the operator. Flow: Typically, recording daily flow is a permit requirement on all systems over 10,000 gpd. Flow recording equipment (flow meter, totalizer and chart recorder) are typically supplied with these plants. In addition to the total and average daily flow, the operator should also record flow per batch. For plants with chart recorders, this is simply done by reviewing the flow chart. For plants set up to treat more than one batch per day, the operator should compare the flow per batch to ensure that each batch treats the same volume of wastewater. For example, if flow through a facility is 10,000 gpd and two batches per day are used, the flow per batch should be as close to 5,000 gpd as possible. This is accomplished by setting the PLC reset time to the appropriate time of day to split the diurnal flow. See section in controls regarding the clock. The flow chart also indicates the time of discharge, which should be periodically compared to the programmed time for discharge. Since the facility is programmed to discharge due to high water level in the clear well, the chart will also indicate any discharges that have occurred out of sequence due to a high water level in the clear well.

38
Sludge Wasting and Sludge Removal: Sludge wasting refers to the removal of sludge from either the Amphidrome reactor or the Amphidrome Plus reactor and is achieved by backwashing. Both the frequency and duration of the backwash is operator adjustable. Unlike an activated sludge system in which the amount of viable biomass within the vessel is controlled by monitoring the MLVSS, no such single parameter exists for monitoring biomass in a submerged attached growth bioreactor. Therefore, determining whether or not enough biomass exists must be judged by four parameters: one, an effluent ammonia, (NH3) analysis, two, the forward and reverse flow rates, three, the aeration pattern, and finally, both a visual and a laboratory analysis of the TSS in the backwash stream. The first parameter that is influenced by insufficient biomass is the ammonia level in the effluent. Therefore, if all the other factors effecting nitrification, (i.e. alkalinity, air, pH…) are sufficient and nitrification is incomplete, the quantity of biomass within the filter must be suspect. A significant decrease in the forward and reverse flow rates, from the original tests conducted by operator, may indicate that the filter is plugging. This may be resolved by increasing the frequency and/or duration of the backwashes. The aeration pattern in the filter should be inspected with approximately 3 - 6 inches of water covering the media. Even bubbles over the entire surface area should be observed. Air bubbles that occur in separate discreet areas may indicate that the reactor is plugging or is plugged. In severe cases, air may be seen escaping several minutes after the blowers have been shut off. This may be resolved by increasing the frequency and/or duration backwash cycles. Finally, to gauge the quantity of solids within the reactor, a sample at the beginning and ending of a backwash cycle should be collected and examined both visually and analytically for TSS. The first sample should be collected during a backwash just as the water starts to flow over the return flow/backwash trough. The second sample should be collected at the end of the backwash, just before the pumps shut off. Typically TSS values for the second sample range from 200 mg/l to 500 mg/l. However, it must be stressed that these numbers are typical, not absolute. Therefore, if a plant is meeting all discharge requirements with different values, than those specific values should be used for a guideline at that particular plant. Sludge wasting is achieved by pumping stored sludge from the anoxic/equalization tank. The level of sludge within the anoxic/equalization tank should be checked every month. Observation: Several operational parameters may be determined by simple observation, which in conjunction with field-testing, can be extremely useful for process control. The Amphidrome process should not have suspended solids in the effluent, nor should strong offensive odors be present in any of the tanks. Therefore, visual inspection of effluent turbidity and color may be an indication of process problems. It is recommended that along with the field sampling (i.e. test kit sampling), that the color and clarity of the effluent be noted in the operator’s log. Strong odors indicating a highly septic environment should not be present in the Amphidrome system. Any odor present in any of the tanks should also be noted in the operator’s log and should be investigated, as this indicates a potential problem.

39
TROUBLE SHOOTING
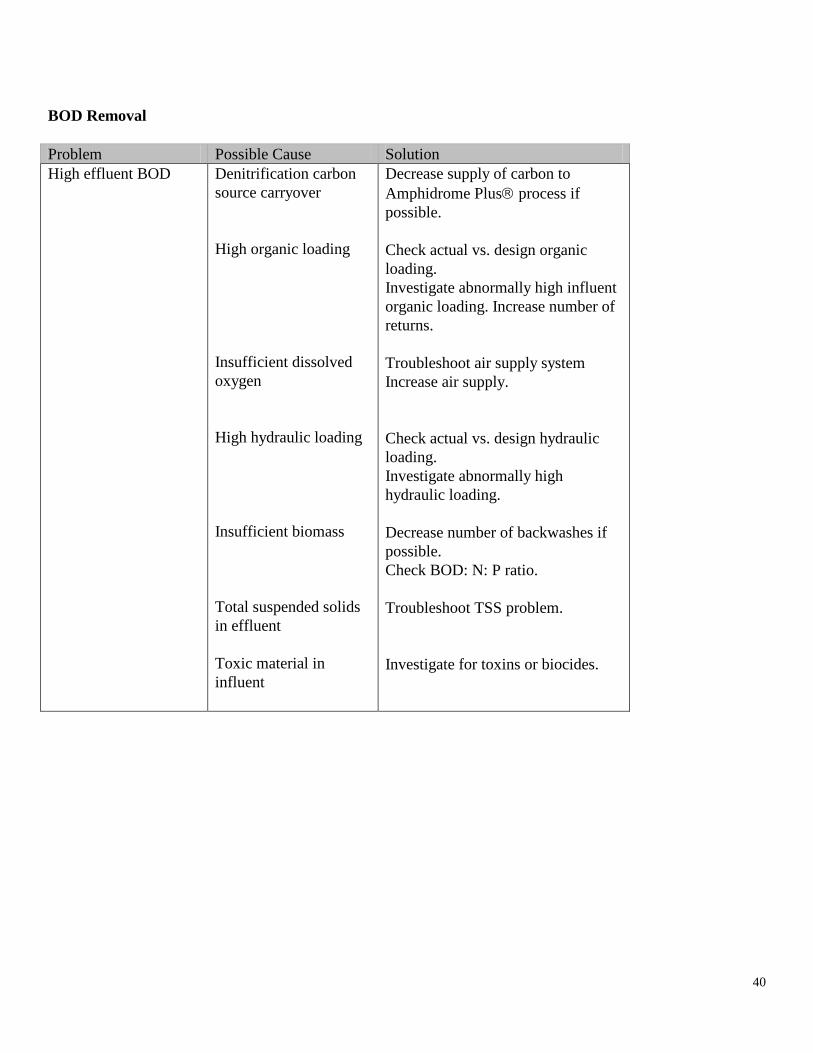
40
BOD Removal Problem Possible Cause Solution High effluent BOD Denitrification carbon
source carryover High organic loading Insufficient dissolved oxygen High hydraulic loading Insufficient biomass Total suspended solids in effluent Toxic material in influent
Decrease supply of carbon to Amphidrome Plus process if possible. Check actual vs. design organic loading. Investigate abnormally high influent organic loading. Increase number of returns. Troubleshoot air supply system Increase air supply. Check actual vs. design hydraulic loading. Investigate abnormally high hydraulic loading. Decrease number of backwashes if possible. Check BOD: N: P ratio. Troubleshoot TSS problem. Investigate for toxins or biocides.

41
TSS Removal Problem Possible Cause Solution High Effluent TSS High influent TSS
Excess Solids in reactor Dirty Amphidrome reactor Dirty Amphidrome Plus reactor
Check depth of blanket in anoxic tank – if within two feet of bottom of outlet tee, pump out anoxic tank. Evaluate the reactor backwash. Increase backwash of Amphidrome. Increase backwash of Plus® reactor.
EVALUATING THE REACTOR BACKWASH
The reactor backwash cycles are set to maintain proper filter solids. A simple test is used to monitor the effectiveness of the backwash. Monitoring backwash solids using the chart below may be a way to determine the need to add backwashes if filter backwash solids reach undesirable levels. This chart provides a guide to monitor reactor solids before and after backwash cycles. Backwash Solids
0
100
200
300
400
500
600
700
800
Backwash
TSS
(m
g/l)
Reactor Plugging Complete Nitrification Incomplete Nitrification
Start Finish

42
Nitrogen Removal -TKN Problem Possible Cause Solution High effluent TKN Insufficient D.O
Alkalinity Deficient High influent TKN loading Insufficient biomass Low return frequency Toxic material in influent Low pH and or temperature
Increase air supply either by adjusting the fixed or the multiplier. Check alkalinity in main clearwell. Verify it is above 80 mg/L Check actual vs. design TKN loading. Decrease Amphidrome backwash if possible. Check BOD: N: P ratio. Increase number of returns if possible. Investigate influent for toxins or biocides. Check pH and temperature of process.

43
Nitrogen Removal – NH3
Problem Possible Cause Solution High effluent ammonia Insufficient dissolved
oxygen Insufficient alkalinity High influent ammonia loading Insufficient biomass Low temperature Excessively high return rate over trough Toxic material present in process wastewater of influent High hydraulic loading
Increase air supply. Troubleshoot air system if necessary. Check effluent alkalinity. If less that 100 mg/l, begin addition of alkaline source. Check actual vs. design ammonia loading. Investigate abnormally high loading. Decrease backwash of Amphidrome if possible. Check BOD: N: P ratio. Check temperature of process. If abnormally low, investigate cause. Check the return flow to influent flow ratio. Investigate influent and process water for toxins and or biocides. Check actual vs. design hydraulic loading. Investigate abnormally high hydraulic loading..

44
Nitrogen Removal – NO3-
Problem Possible Cause Solution High nitrate in effluent and fractional ammonia level
Excess dissolved oxygen in system Insufficient biomass in Amphidrome Plus Low application rate to Amphidrome Plus filter Insufficient carbon source –Amphidrome Plus filter or Amphidrome
Decrease air supply and recheck both nitrate and ammonia. Check anoxic tank, maintain anoxic conditions. Check return flow volume to influent ratio, adjust accordingly (i.e. DO ≤ .5 mg/e). Decrease backwashing frequency of Amphidrome Plus filter (if applicable). Check the start and stop times of feed pumps to determine the overall total operational time, and compare this against the actual run times of the Amphidrome Plus feed pump. Check forward flow rate through filter. Increase backwash of Amphidrome Plus filter to improve flow through rate. Troubleshoot Amphidrome Plus feed pump. Increase carbon source supply to Amphidrome Plus.

45
Supplemental BOD Problem Possible Cause Solution Supplemental BOD carryover causing elevated effluent BOD
Excessive addition of supplemental BOD Insufficient mixing of BOD source and process wastewater Improper programmed run time for chemical feed system
Check feed rate of supplemental BOD – adjust feed rate down to obtain lower effluent BOD level while maintaining proper nitrate removal. Check chemical feed line location – ensure located for sufficient mixing. Check programmed run times and adjust accordingly.
Insufficient nitrate removal
Inadequate supplemental BOD feed rate
Increase feed rate. Troubleshoot chemical feed system. Ensure correct concentration or solution of BOD source.
Alkalinity Problem Possible Cause Solution Effluent alkalinity less than 100 mg/l
Low pH in influent to anoxic tank Insufficient alkalinity in influent wastewater Insufficient supplemental alkalinity feed
Adjust pH on influent Supplement alkalinity in process by using alkalinity chemical feed system. Increase alkalinity feed or solution strength. Troubleshoot feed system to ensure proper feed rates.