amphibian phylogeography in the antipodes: refugia and postglacial colonization explain...
TRANSCRIPT
Molecular Phylogenetics and Evolution 58 (2011) 343–352
Contents lists available at ScienceDirect
Molecular Phylogenetics and Evolution
journal homepage: www.elsevier .com/ locate /ympev
Amphibian phylogeography in the Antipodes: Refugia and postglacialcolonization explain mitochondrial haplotype distribution in the Patagonian frogEupsophus calcaratus (Cycloramphidae)
José J. Nuñez a,⇑, Nicole K. Wood b, Felipe E. Rabanal a, Frank M. Fontanella b, Jack W. Sites Jr. b
a Instituto de Zoología, Universidad Austral de Chile, Casilla 567, Valdivia, Chileb Department of Biology and Bean Life Science Museum, Brigham Young University, Provo, UT 84602, USA
a r t i c l e i n f o a b s t r a c t
Article history:Received 7 September 2010Revised 22 November 2010Accepted 28 November 2010Available online 8 December 2010
Keywords:PhylogeographyLast glacial maximumRecolonizationValdivian forestEupsophus calcaratusmtDNA
1055-7903/$ - see front matter � 2010 Elsevier Inc. Adoi:10.1016/j.ympev.2010.11.026
⇑ Corresponding author.E-mail addresses: [email protected] (J.J. Nuñez
Wood), [email protected] (F.E. Rabanal), [email protected] (J.W. Sites).
Climatic oscillations, heterogeneity in elevation, topographical position, and isolation time in southwest-ern Patagonia have been important in promoting diversification of the biota. Geological studies haveshown that this region had wide ice-free areas during periods of the last glacial maximum and providedforested refugia for the biota during Pleistocene glaciations. In this study, we sampled the endemic frogEupsophus calcaratus from 20 localities, covering most of its distribution and including glaciated and non-glaciated regions. We collected DNA sequences for three mitochondrial regions (D-loop, cyt b, 16S), anddescribe patterns of variation consistent with a history of both the displacement to glacial refugia andrecent recolonization to extensively glaciated regions. The inferred demographic history and divergencetimes of the lineages of E. calcaratus suggest that the Pleistocene had profound effects on the genetic pat-terns within this taxon in which some populations were able to survive in refugia within colder regionsfollowed by demographic increases but without evidence of significant range expansion. The mtDNAgene tree recovers six major haploclades of E. calcaratus, which we consider diagnostic of species lineages.These results contribute to our understanding of how geological events, predominately glacial oscilla-tions, have influenced current population structure of a broad-ranging, ectothermic vertebrate in the Val-divian Forest region of southern South America.
� 2010 Elsevier Inc. All rights reserved.
1. Introduction
The Andean and adjacent regions in southern South Americahave a rich history of geological and climatic changes along broadaltitudinal and latitudinal gradients, and the highly endemic biotahas distributional patterns strongly linked to these histories(Hinojosa and Villagrán, 1997; Veblen, 2007). Although the Andesbegan to rise at the end of Cretaceous, more than 65 million yearsago (Ma), it was not until the middle Miocene (11–14 Ma) thatelevations exceeded 1000 m above sea level (a.s.l.; Potts andBehrensmeyer, 1992; Gregory-Wodzicki, 2000). Major orogeniesoccurred in the last 10 Ma, causing uplift to current elevations ofgreater than 4000 m a.s.l. (Gregory-Wodzicki, 2000), and forminggeographic barriers with pronounced effects on the distributionand diversification of flora and fauna (Smith-Ramírez, 2004; Muell-ner et al., 2005; Ruzzante et al., 2006; Yoke et al., 2006). On a morerecent time scale, glaciations in southernmost Patagonia began as
ll rights reserved.
), [email protected] ([email protected] (F.M. Fontanella),
early as the Middle Pliocene (Rabassa, 2008), in which a series ofglacial advances and retreats characterized the Patagonian land-scape. During the Early Pleistocene, a single, continuous montaneice sheet developed for the first time and covered broad areas ofAndean South America from �36�S to 56�S (Hulton et al., 1994;McCulloch et al., 2000). However, parts of the coastal range of wes-tern Chile remained ice free.
The dates of the recent Pleistocene glaciations in South Americaare well known (Rabassa and Clapperton, 1990; Ruzzante et al.,2008), and include: (1) the most extensive Andean glaciation(�1.1 Ma); (2) the coldest Pleistocene glaciation (�0.7 Ma); (3)the last southern Patagonian glaciation (180 kya); and (4) the lastglacial maximum (LGM, �25–23 Ka). These glaciers changed drain-age patterns, lake distributions, and even the position of the conti-nental divide, displacing plant and animal populations and thusproviding a natural theater for examining the effects of glacierson biodiversity patterns in this region. For example, strong geneticstructure concordant with paleoclimatic shifts has been reportedfor endemic freshwater crabs (Xu et al., 2009), while repeatedexpansion and contraction events and subsequent population mix-ing were detected in percichthyid and galaxiid fishes (Ruzzanteet al., 2006; Zemlak et al., 2008). Historical signatures are also

344 J.J. Nuñez et al. / Molecular Phylogenetics and Evolution 58 (2011) 343–352
evident in the phylogeographic patterns of various groups of liz-ards of the genus Liolaemus (Avila et al., 2006; Morando et al.,2003, 2004, 2007, 2008; Victoriano et al., 2008). Genetic diver-gence between eastern and western populations of the long-tailedrodent Oligoryzomys longicaudatus emphasizes the role of the An-des as an effective geographic barrier to gene flow, and in rangeexpansion from multiple interglacial refugia (González-Ittig et al.,2010). Likewise, using mtDNA sequences of 14 species of sigm-odontine rodents, Lessa et al. (2010) show that postglacial coloni-zation from lower latitudes is an important component of currentPatagonian–Fuegian diversity, with in situ differentiation also con-tributing to the rodent species diversity.
In this context of a geological history of episodic orogenies, gla-ciations, marine introgressions and vulcanism, the Patagonian re-gion is now being intensively studied from biogeographic andphylogeographic perspectives as a southern-hemisphere analog oftemperate continental regions of Europe and North America (Avilaet al., 2006; Cosacov et al., 2010; Zemlak et al., 2010; Patterson,2010). Across the entire ‘‘cone’’ of temperate South America, how-ever, few phylogeographic studies of broadly distributed terrestrialvertebrates have been conducted in the mesic southwestern regionof the Valdivian Forest (37�450S–43�200S). This region was exten-sively glaciated (see below), and the degree to which populationswere reduced in size, the extent to which they survived within refu-gia, and the routes through which recolonizations occurred remainunknown.
Frogs are an excellent taxon for studies of phylogeographicdiversification and speciation because restricted dispersal capabil-ities tend to promote differentiation (Duellman, 1999; Pröhl et al.,2010), and they often show significantly greater population-geneticstructure relative to species without such limitations (Johns andAvise, 1998; Semlitsch et al., 2009). In fact, one of the most signif-icant contributions to our understanding of the genetic structuringof amphibian populations was Ward et al.’s (1992) comparativestudy, which demonstrated that, of all the major classes of verte-brates, amphibians exhibit the highest degree of population subdi-vision, as measured by allozyme markers. Later studies based onmicrosatellite markers have confirmed that amphibians generallydisplay a high degree of genetic structuring at all scales (Voset al., 2001; Palo et al., 2004). Further, they are highly sensitiveto climatic changes owing to complex life histories, permeable skinand exposed eggs (Fitzpatrick et al., 2009), and past climatic re-cords from southwestern South America have the potential to shedlight on population divergence and speciation processes. For exam-ple, Nuñez and Formas (2000), hypothesized that the MioceneAndean orogeny was crucial in driving divergence and adaptationof the mountain frog genus Telmatobufo. Uncertainties remainabout the origin and diversification of endemic genera such asBatrachyla, Eupsophus, and Rhinoderma, but it is possible that theglacial and interglacial events from Miocene to early Holocene,with the reduction in precipitation during glacial episodes(McCulloch et al., 2000), may have been the primary drivers ofpopulation differentiation, speciation, and the evolution of somespecialized breeding strategies (degrees of terrestriality such asthose that occur in Eupsophus species; Úbeda and Núñez, 2006).
In this study, we reconstruct the phylogeographic history ofEupsophus calcaratus (Günther, 1881), an endemic frog of the tem-perate Nothofagus forests of southwestern Patagonia. This specieshas one of the broadest distributions of any Chilean frog (Rabanaland Nuñez, 2009), and ranges from sea level to at least 600 m, andfrom 39� to 55� latitude. Eupsophus calcaratus inhabits streamedges where it hides in holes leading to water-filled chambers.Its larvae are distinctive in being endotrophic and developing inthese water-filled chambers, which connect to small streams orpermanent pools (Vera Candioti et al., 2005). Eupsophus calcaratusis a good candidate for phylogeographic research because its
distribution includes both glaciated and non-glaciated regions, isstrongly ecologically linked to forest environments, has a high tol-erance to cold, and a relatively old origin as inferred from Oligo-cene fossils (fossils assigned to this genus are known from� 40 mya; Schaeffer, 1949).
The goals of this study are to: (1) describe the lineage diversityand phylogeographic patterns of E. calcaratus; and (2) evaluate theeffects of Pleistocene glaciation on the population demography inglaciated and un-glaciated regions. We are aware of the limitationsof using only mtDNA, but for many reasons (Zink and Barrowclough,2008), we consider this a good ‘‘first pass’’ marker with which toinvestigate phylogeographic history of poorly known taxa. We con-sider this a valid ‘‘hypothesis generating’’ approach (Avila et al.,2006; Morando et al., 2007; Galbreath et al., 2010), and details ofthe historical demography of the female E. calcaratus revealed in thisstudy provide insight into how southwestern Patagonian speciesmay have responded to climatic fluctuations of the last 20,000–25,000 years.
2. Material and methods
2.1. Sampling
Populations of Eupsophus calcaratus were sampled across thetemperate Nothofagus forests of Southern Chile (Fig. 1; Table 1).Animals were euthanized in the field with benzocaine, followingthe protocol of the Animal Experimentation Ethics Committee ofthe Universidad Austral de Chile. Samples of liver and muscle ofeach specimen were stored in 95% ethanol at �80 �C, and depositedin the Amphibian Collection, Institute of Zoology (Universidad Aus-tral de Chile), and M.L. Bean Life Science Museum (BYU, Provo, UT).Specimens of E. roseus (Lago Pellaifa, 39�3600700S; 72�0105800W) andE. septentrionalis (Los Queules, 39�3600700S; 72�0105800W) were usedas outgroups.
2.2. DNA extraction, amplification, and sequence alignment
Whole genomic DNA was extracted using the QIAGEN DNeasykit (Qiagen, Valencia, CA) according to the standard protocol. Air-dried DNA pellets were eluted in distilled water, followed by elec-trophoresis of 5.0 lL of extraction product on 1% agarose gel toestimate the quality and amount of genomic DNA. Sample dilu-tions were performed, when necessary, prior to polymerase chainreaction (PCR) amplifications. Three mitochondrial gene regionswere amplified via PCR in a cocktail containing 2.0 lL of templateDNA, 8 lL dNTPs (1.25 mM), 4 lL 10 � Taq buffer, 4 lL each primer(10 lM), 4 lL MgCl2 (25 mM), 22 lL distilled water, and 0.25 lLTaq DNA polymerase (5 U/ll; Promega Corp., Madison, WI). Cyclingprofile for PCR amplifications was 3 min at 94 �C (1 cycle), 30 s,94 �C, 1 min 47–53 �C and 60 s, 72 �C (35 cycles), followed by a fi-nal extension of 7 min at 72 �C. Sequence and PCR annealing tem-perature for each primer pair are given in Table 2. PCR productswere checked by electrophoresis on a 1% agarose gel stained withSYBR-Safe (Invitrogen), purified using a MultiScreen PCR 96 (Milli-pore Corp., Billerica, MA) and directly sequenced using the BigDyeTerminator v3.1 Cycle Sequencing Ready Reaction (Applied Biosys-tems, Foster City, CA). Excess of Dye Terminator was removed withCentriSep spin columns (Princeton Separations, Inc., Adelphia, NJ),and sequences were generated on an ABI Prism 3730 capillaryautosequencer at the DNA Sequencing Center at Brigham YoungUniversity.
Complementary chromatograms were assembled and anno-tated in Sequencher™ v4.7. Sequences were aligned using MAFFTv.6.0 (Katoh et al., 2005) under the iterative method of global pair-wise alignment (G-INS-i), and default settings were chosen for allthe parameters involved. The data set was collapsed to unique
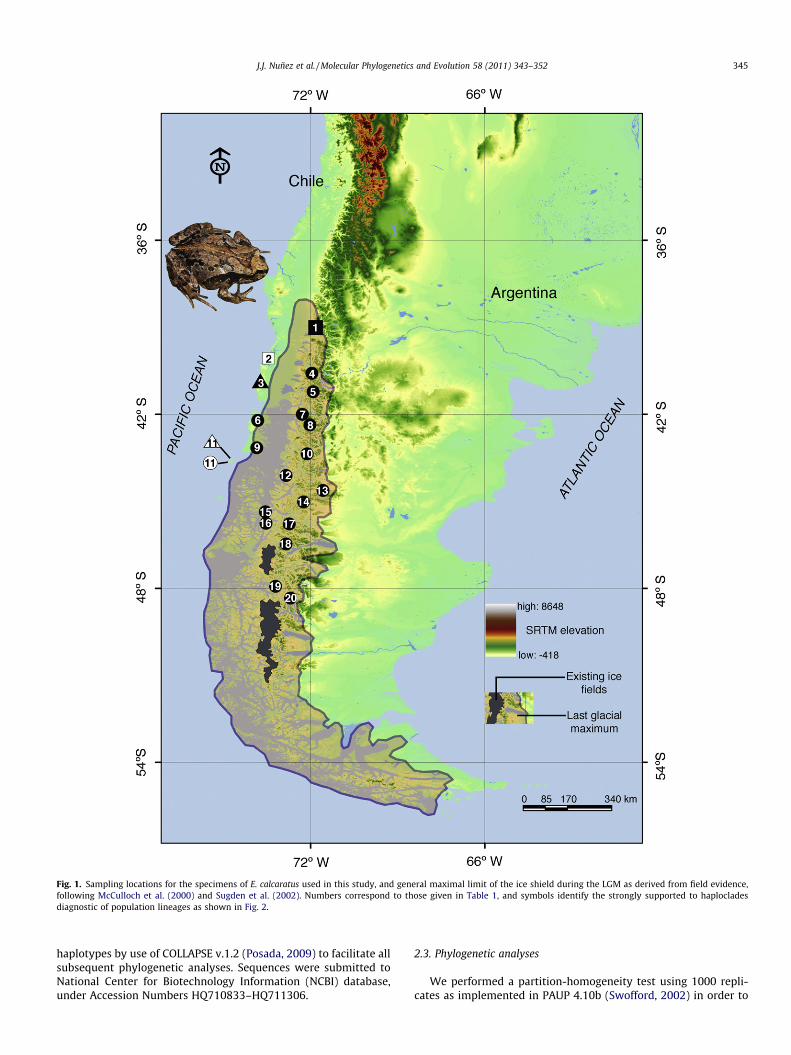
Fig. 1. Sampling locations for the specimens of E. calcaratus used in this study, and general maximal limit of the ice shield during the LGM as derived from field evidence,following McCulloch et al. (2000) and Sugden et al. (2002). Numbers correspond to those given in Table 1, and symbols identify the strongly supported to haplocladesdiagnostic of population lineages as shown in Fig. 2.
J.J. Nuñez et al. / Molecular Phylogenetics and Evolution 58 (2011) 343–352 345
haplotypes by use of COLLAPSE v.1.2 (Posada, 2009) to facilitate allsubsequent phylogenetic analyses. Sequences were submitted toNational Center for Biotechnology Information (NCBI) database,under Accession Numbers HQ710833–HQ711306.
2.3. Phylogenetic analyses
We performed a partition-homogeneity test using 1000 repli-cates as implemented in PAUP 4.10b (Swofford, 2002) in order to

Table 1Sampling sites of Eupsophus calcaratus specimens. N, sample size; H, number of haplotypes; G and NG correspond to glaciated and non-glaciated areas by the last glacialmaximum, respectively; localities and lineages as shown in Fig. 1.
Point/label Collection site Latitude (S) Longitude (W) N H Clade Region
1 Villarrica 39�1604400 71�5801700 12 12 Lineage A G2 Reserva Valdivia 40�0209.300 73�2904000 4 4 Lineage B NG3 Bahía Mansa 40�3304700 73�4305400 5 4 Lineage C NG4 Antillanca 40�4503100 72�0903700 9 8 Lineage F G5 Alerce Andino 41�2103000 72�2001000 7 7 Lineage F G6 Puntra 42�0700900 73�4901200 11 11 Lineage F NG7 Pumalín 42�4902800 72�4100900 2 1 Lineage F G8 El Amarillo 42�5304000 72�2800600 10 1 Lineage F G9 Yaldad 43�0603000 73�4302500 8 8 Lineage F G
10 La Junta 43�2400800 72�3002100 1 1 Lineage F G11 Isla Guafo 43�3601000 74�4301500 23 21 Lineage D, E NG12 Marín Balmaceda 43�4700000 72�5400100 1 1 Lineage F G13 Lago Verde 44�1203000 71�5200800 13 13 Lineage F G14 Queulat 44�2200000 72�2504000 6 6 Lineage F G15 Pto Aguirre 45�0900000 73�3200000 1 1 Lineage F G16 Isla Vergara 45�1000000 73�3102500 1 1 Lineage F G17 Pto Aysén 45�2502500 72�4101600 2 2 Lineage F G18 Bahía Murta 46�2702500 72�4002000 7 7 Lineage F G19 Caleta Tortel 47�4704500 73�3105500 28 28 Lineage F G20 Lago Quetru 48�0.502800 73�0700300 7 4 Lineage F G
Table 2Mitochondrial DNA region, primer sequence, time and annealing temperatures used in this study, and amplicon size and variation.
mtDNAregion
Primer Sequence 50–30 Time/temperature ofannealing (s/�C)
Size of theamplicon (nt)
%Polymorphism
Reference
D-loop ControlJ2-L
GCATTACGTTCACGAAGWTGG 45/50 582 22.3 Goebel et al., 1999
ControlP-H GTCCATAGATTCASTTCCGTCAGCyt b MVZ15-L GAACTAATGGCCCACACWWTACGNAA 60/47–52 698 26.6 Moritz et al. (1992, this
study)EUPCB180-H
CATGAAATGGTACTTTATC
16S ND1met TTGGGGTATGGGCCCAAAAGCT 60/53 934 27.4 Camargo et al. (2006)ND116S TTACCCT(A/G)GGGATAACAGCGCAA
346 J.J. Nuñez et al. / Molecular Phylogenetics and Evolution 58 (2011) 343–352
examine whether the three analyzed regions (D-loop, Cyt b, and16S) could be combined into a larger data matrix (Farris et al.,1995). Because the result of the partition-homogeneity test wasnot significant, further analyses were performed on the combineddata.
For phylogenetic analyses, the best-fitting model of nucleotidesubstitution was selected using the Akaike information criterion(AIC) following the procedure outlined by Posada and Buckley(2004), and implemented in jModelTest v0.1.1 (Posada, 2008).These results give a best fit for the general time-reversible (GTR)nucleotide substitution model with gamma-distributed rate heter-ogeneity among sites (gamma shape = 0.723), and a proportion ofinvariable sites (p-inv = 0.554). Likelihood analyses (ML) were per-formed using GARLI 0.96 (Zwickl, 2006), and were terminated after10,000 generations without an improvement in the overall treetopology. Two ML analyses were performed to ensure convergence.Support was evaluated using 300 bootstrap repetitions (Felsenstein,1985), with each repetition terminated after 5000 generationswithout a topology improvement. We also conducted partitionedBayesian analyses using MrBAYES v.3.1.2b (Ronquist andHuelsenbeck, 2003) in which the GTR + C + I model was applied toeach gene fragment. Each Markov chain was started from a randomtree and run for 1.0 � 107generations with every 1000th treesampled from the chain. Stationarity was checked as suggested inNylander et al. (2004). All sample points prior to reaching theplateau phase were discarded as ‘‘burn in’’ and the remaining treescombined to find the a posteriori probability estimate of phylogeny.Branch lengths were estimated as means of the posterior probability
density. Trees were visualized using the FigTree v1.1.2 program,available at http://tree.bio.ed.ac.uk/software/figtree/. Eupsophusroseus and E. septentrionalis were used as outgroups in all analyses,based on their sister-group relationship to E. calcaratus (Correa et al.,2006).
2.4. Divergence dating and historical demography
Haplotype (Hd) and nucleotide (p) diversity as well as the num-ber of segregating sites (S) were calculated to estimate DNA poly-morphism using DnaSP v.5.0 (Librado and Rozas, 2009). To inferthe date of origin for each lineage without relying on a strictmolecular clock and considering uncertainty in tree topology andbranch length (i.e. the relaxed phylogenetic method) we usedBEAST 1.5.4 (Drummond and Rambaut, 2007). Partitioned phyloge-netic estimates were constructed using the best-fitting model ofnucleotide substitution, which was selected using the AIC withan uncorrelated lognormal tree prior and the Yule speciation pro-cess. Analyses were run for 20 million generations and sampledevery 1000th iteration, following a pre-burnin of 2000 generations.No independent fossil or geological evidence is available to cali-brate a local molecular clock for populations of Eupsophus, soexternal calibrations were used. Estimates of amphibian protein-coding mtDNA mutation rates have been shown to vary slightlydepending on gene regions and taxonomic group (Tan and Wake,1995; Macey et al., 1998; Crawford, 2003). For anurans, Crawford(2003) estimated ND2 to evolve at a rate of 0.957% per lineageper million years, based on a recalibration of Macey et al.’s

J.J. Nuñez et al. / Molecular Phylogenetics and Evolution 58 (2011) 343–352 347
(1998) Eurasian Bufo dataset. We used this divergence rate (with astandard deviation of 0.05) as it is in agreement with estimates forseveral other vertebrate species (Moritz et al., 1987). An implicitassumption is that our study species has comparable DNA diver-gence rates to those estimated by Crawford (2003) for Bufo. Wefully recognize that this approach is far from ideal (Graur andMartin, 2004), but a beginning exploration of phylogeographic his-tories of the endemic Patagonian species will in our view benefitfrom provisional estimates.
To examine whether E. calcaratus populations are at equilibrium,we calculated Fu’s Fs (Fu, 1997) implemented in DnaSP v.5.0. Wechose this test because of the increased statistical power in detectingsignificant changes in population size when using small sample sizes(Ramos-Onsins and Rozas, 2002). Under the assumption of neutral-ity, negative values are expected in populations that have undergonerecent expansion because rare alleles are more numerous thanexpected. Positive values occur if rare alleles are eliminated frompopulations following genetic bottlenecks (Tajima, 1989).
The validity of the assumed stepwise expansion model and thesignificance of Fs values were calculated by constructing 1000 coa-lescent simulations in DnaSP. Mismatch distributions were alsocalculated for each diagnosed population lineage to infer changesin population size. Under an infinite sites model, populationexpansion would be depicted as a unimodal distribution whereasthe distribution expected for population stability is ragged andmulti-modal (Harpending et al., 1998). The fit of the observed datawas compared using the sum of squared deviations betweenobserved and expected values estimated from 10,000 coalescentsimulations in DnaSP. Although the raggedness index (r) is oftenused to assess significance of mismatch plots, multi-modal distri-butions that fit sudden-expansion models indicate structuringwithin populations or populations that are stable or shrinking(Excoffier and Schneider, 1999; Rogers and Harpening, 1992;Rogers et al., 1996). Therefore we do not consider the good fit ofsudden-expansion models to unimodal mismatch distributionsstrong evidence of population expansion. However, multi-modaldistributions can be inferred for populations that have undergonerecent expansion but were recently subdivided, subjected to sub-stantial migration, and/or have undergone historical contractions(Bertorelle and Slatkin, 1995; Marjoram and Donnelly, 1994; Rayet al., 2003; Castoe et al., 2007).
Although Fu’s Fs and mismatch distributions can provide in-sights into whether or not populations have undergone expansion,they do not provide information about the shape of populationgrowth over time. Non-significant negative values of Fs and mul-ti-modal mismatch distributions are indications that populationshave not undergone expansive growth relative to a null hypothesisof population stability. However, such values are agnostic as towhether populations are expanding slowly, contracting or remain-ing relatively constant in size. Therefore, to estimate the shape ofpopulation growth through time we constructed Bayesian skylineplots (BSP) implemented in BEAST 1.5.4 (Drummod and Rambaut,2007). For each BSP, the appropriate model of nucleotide substitu-tion was determined using jModeltest. Genealogies and modelparameters for each lineage were sampled every 1000th iterationfor 20 million generations under a strict molecular clock with uni-formly distributed priors and a pre-burnin of 2000. Demographicplots for each analysis were visualized in Tracer v 1.5 (Rambautand Drummond, 2007).
3. Results
3.1. Phylogeny of Eupsophus calcaratus
One hundred sixty-two sequences of 2224 aligned base pairswere obtained for Eupsophus calcaratus and two outgroup taxa.
The absence of any internal stop codons in the Cyt b gene re-gion suggested that the sequences were mitochondrial and notnuclear-integrated copies or pseudogenes (Zhang and Hewitt,1996). The combined partitioned analyses produced a 50%majority-rule consensus tree with a harmonic mean of Log like-lihood (LogL) of �13329.46 following a burnin of 20,000 gener-ations. Because ML and BI analyses produced highly congruentestimates of the phylogenetic relationships, only the Bayesianconsensus phylogram is presented with the posterior probabili-ties (P) and non-parametic ML bootstrap values for the sharedbranches (Fig. 2).
Six strongly-supported haplotype lineages were recoveredwithin the E. calcaratus complex (Fig. 2), all with P = 1.0. Samplesfrom the northern Villarrica region (lineage A; locality 1, Fig. 1)formed the sister group to all others, with the next interior lineageB, including all haplotypes from Reserva Valdivia (loc. 2). Lineage Ccomprised all haplotypes from Bahía Mansa (loc. 3), while samplescollected from Guafo Island (loc. 11) were recovered as two lin-eages (D and E), which together formed the sister group of cladeF. This clade includes all samples from the glaciated areas (locali-ties 4–5, 6–10, and 12–20), and the most southern haplotypes, par-ticularly from localities 7 to 20 (see Table 1), were randomlydistributed with no geographic structure.
3.2. Divergence times and historical demography
Genetic diversity indices (Hd, S, and p) for the well-supportedlineages are summarized in Table 3. Among all lineages,Hd = 0.999 and p = 0.048, indicating a high haplotype but relativelylow nucleotide diversity. No haplotypes were shared among lin-eages A, B, C, E, and F, and most haplotypes are confined to a singlelocality within A, B, C, or E.
Results of the dating analysis suggest that each of the diver-gences occurred during the Pleistocene with the initial splitoccurring 188 kya with a 95% credible interval of 96–290 kya(Fig. 2). Subsequently, each of the extant lineages shared amost recent common ancestor during the early Pleistoceneranging from 16.7 to 70 kya (Table 3). The recent dates forthese lineages suggest that the LGM may have played a majorrole in generating the extensive genetic diversity within E.calcaratus. Additionally, each of the lineages would haveresponded to the retreat of the most recent Patagonian glacialcycle. Despite the high level of nodal support, the small sam-ples size (n = 2) prevented us from conducting demographicanalysis on lineage D.
Fu’s Fs statistic was significant and negative (p = 0.05) for lin-eages A, E and F, indicating an excess of low-frequency haplotypeswhile lineages B and C were not signficant. Likewise, the mismatchdistributions showed relatively unimodal patterns with low rag-gedness values for lineages A and E and multi-modal distributionsand high raggedness values for lineages B and C (Fig. 3). The mis-match distribution for lineage F appears multi-modal, but the rag-gedness index is low (r = 0.009). Multi-modal distributions that fitsudden-expansion models can be an indication of structuringwithin populations (Castoe et al., 2007), a pattern consistent withthe substructuring present in the tree (Fig. 2). The effective samplesize (ESS) for each of the Bayesian skyline analyses was greaterthan 200, suggesting that the 50 million generations were suffi-cient to estimate the demographic history for each lineage. Noneof the plots showed any evidence of genetic bottlenecks, recentsubdivisions or signficant historical population contractions(Fig. 3). Significantly negative Fs values, low raggedness indexesfor the mismatch distributions, and Bayesian skyline plotsdepicting growth provide evidence that lineages A, E and F haveundergone recent expansions.

Fig. 2. Bayesian tree of mitochondrial haplotypes rooted with E. septentrionalis. Strongly supported clades are labeled as lineages A–F. Branch support is based on Bayesianposterior probabilities and bootstrap resampling above the branch, and point estimates of selected divergence estimates are below. Labels correspond to sampling localitiesas indicated in Fig. 1 and Table 1.
Table 3Sample size (N), haplotype diversity (Hd), number of segregating sites (S), nucleotide diversity (p), Fu’s Fs, raggedness index (r), and time to most recent common ancestor(TMRCA, years) for five of the six lineages of Eupsophus calcaratus. Lineage labels correspond to clades in Fig. 2.
Lineage N Hd S p Fs Raggedness index TMRCA
B 4 1.00 91 0.021 2.001 0.1 25,900 (7.62�3–5.10�2)C 5 0.900 66 0.015 3.703 0.19 19,700 (7.86�3–3.48�2)A 12 1.00 39 0.006 �3.87* 0.02* 70,700 (3.64�3–1.16�2)E 21 0.995 34 0.003 �14.156* 0.03* 16,700 (6.63�3–2.98�2)F 114 0.998 316 0.024 �34.073* 0.009* 38,750 (2.49�2–5.35�2)
* P = 0.05.
348 J.J. Nuñez et al. / Molecular Phylogenetics and Evolution 58 (2011) 343–352
4. Discussion
4.1. Phylogeography of E. calcaratus
This study currently represents the most comprehensive analy-sis of the phylogeographic history of an endemic Patagonian frogthroughout most of its distributional range. The mtDNA gene tree(Fig. 2) recovers six major haploclades of E. calcaratus, which we
consider diagnostic of species lineages. Four of these lineages occurat lower elevations along the coastal areas and outside the extentof the major ice sheet during the LGM (lineages B, C, D, and E),and two (A and F) are confined to higher previously glaciated mon-tane environments (Fig. 1). A general pattern of greater geneticdiversity along the coastal regions of Chile coupled with larger,more homogeneous population lineages throughout the Andes(Table 3) is consistent with previous phylogeographic studies of
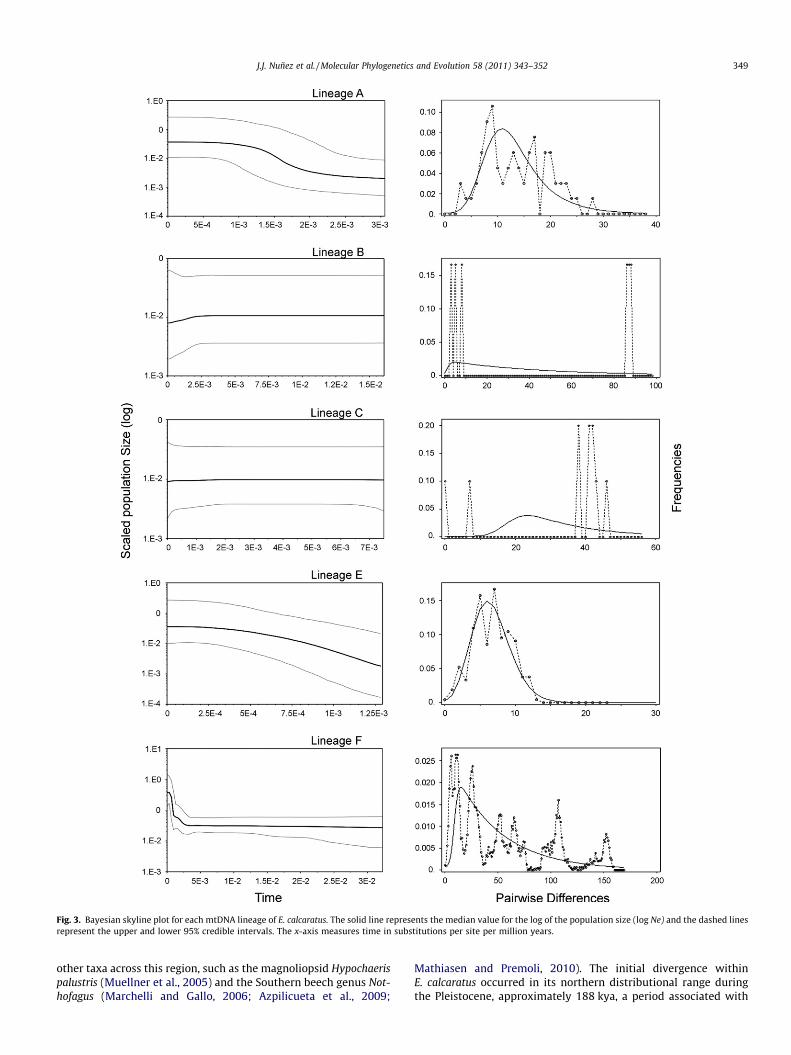
Fig. 3. Bayesian skyline plot for each mtDNA lineage of E. calcaratus. The solid line represents the median value for the log of the population size (log Ne) and the dashed linesrepresent the upper and lower 95% credible intervals. The x-axis measures time in substitutions per site per million years.
J.J. Nuñez et al. / Molecular Phylogenetics and Evolution 58 (2011) 343–352 349
other taxa across this region, such as the magnoliopsid Hypochaerispalustris (Muellner et al., 2005) and the Southern beech genus Not-hofagus (Marchelli and Gallo, 2006; Azpilicueta et al., 2009;
Mathiasen and Premoli, 2010). The initial divergence withinE. calcaratus occurred in its northern distributional range duringthe Pleistocene, approximately 188 kya, a period associated with
350 J.J. Nuñez et al. / Molecular Phylogenetics and Evolution 58 (2011) 343–352
a time of global cooling (Bonan, 2002). The position of this deeplineage (clade A, Fig. 2) within the inferred boundaries of theLGM, suggests the possible existence of a small refugium withinthe ice field, a phenomenon found in similarly heterogeneous envi-ronments in other temperate regions (Rowe et al., 2004; Andersonet al., 2006). The subsequent divergence events, concordant with atime within the Llanquihue Glaciation (Llanquihue I,�70,000 yearsago; Rabassa and Clapperton, 1990), occurred southward along theChilean coast, followed by an eastward expansion into the Andespresumably following glacial retreat. Lineages B and C are confinedto the Valdivian Coastal range, an area considered to be one of themost important refugia during Pleistocene glaciations (Premoli,2005). For example, fossils indicate that some tree species (Nothof-agus, Fitzroya) survived locally in this area throughout the Pleisto-cene, and subsequent increases in the pollen record at 11,000 YBPindicate a rapid expansion of these species after ice retreat(Villagrán and Armesto, 2005). Thus, Valdivian forests that cur-rently occur in these areas should all be early Holocene in age(10,000 YBP). Alternatively, if ice sheets in Patagonia were not soextensive and continuous as has been proposed (Fig. 1), we can in-fer that the Coastal range populations of E. calcaratus may havesurvived locally in ice-free environments. This scenario of multiplerefugia is consistent with the deep genetic divergence among thenorthern lineages of E. calcaratus.
An unexpected discovery was the documentation of twowell-supported lineages (D and E) co-occurring on the previouslyun-glaciated and relatively small Guafo Island (Fig. 1). Althoughlineage D contains only two samples, the deep genetic splitbetween it and lineage E suggests a complex history of divergencein isolation, perhaps over a broad geographic area during sea-leveldeclines during or prior to the LGM, followed by secondary contact.Lineage F consists entirely of identical or minimally divergent hap-lotypes from localities in previously glaciated regions, extendingfrom southern Chile north through the southern Andes toAntillanca (latitude of 40�4503100). This scenario is also consistentwith the levels of divergence and genetic variation detected forthe lizard Liolaemus tenuis (widely distributed in central-southernChile), which showed lower values both for the haplotype andnucleotide diversity for the clade distributed from 38�S to thesouthern edge of its distribution (Victoriano et al., 2008).
4.2. Historical population demography
During the Pleistocene, glacial advances affected the physical andbiological environments of the Southern Hemisphere (Villagrán andArmesto, 2005). These glaciers and the associated climatic changesdrove high-latitude populations into more southern habitats in theNorthern Hemisphere (Hewitt, 1999, 2004). In Patagonia the con-traction–expansion model predicts that populations affected bythese habitat shifts would have undergone rapid populationexpansion as previously unsuitable habitat became colonized, butthis would occur along predominantly east–west axes due to theN–S orientation of the historical ice sheets (Fig. 1). Despite differ-ences in geography, rapid or step-wise colonizations would becharacterized by low levels of genetic diversity as each new foundingpopulation represented only a fraction of the ancestral population’sgenetic diversity (Nichols and Hewitt, 1994; Hewitt, 2000).
The various demographic analyses show that the intra-clade ge-netic structure of E. calcaratus contains signatures of demographicexpansion consistent with Pleistocene glacial retreat. Specifically,the demographic analysis and genetic variation for the A, E and Flineages show strong support for recent population expansions rep-resented by significantly negative Fs values, unimodal mismatchdistributions with low raggedness indexes, and BSPs (Fig. 3) consis-tent with estimated times of these expansions range from �71 to�18 kya, but with sufficient overlap in error terms to permit precise
assessments (Table 3). Additionally, the high haplotype diversityand low nucleotide diversity for each of these lineages is consistentwith population expansion, and for lineage F, this expansion is con-sistent with a history of colonization of previously glaciated or peri-glacial regions. The topology of this clade, with shallow branches,little internal resolution (Fig. 2), and low sequence divergence isalso suggestive of a recent population expansion.
In contrast, the inferred demographic histories, current distri-butions, and divergence times of lineages A and E suggest thatthese populations were able to survive in refugia within colder re-gions, followed by demographic increases but without evidence ofsignificant range expansion. It is probable that some ecological bar-riers, perhaps the Valdivia and Osorno paleobasins, sediment-depository since late Oligocene–early Miocene times (Muñozet al., 2000; Jordan et al., 2001) have maintained the isolation ofthese populations (Premoli, 2005; Hinojosa et al., 2006). A non-mutually exclusive alternative that is the abrupt beginning of aremarkable series of glacially-deepened lake basins at this latitude(Clapperton, 1994) probably inhibited the population expansion toother latitudes. The climate of this region is currently dominatedby the seasonal winter northward migration of the austral PolarFront, which largely accounts for mean annual precipitation totalsof ca. 3000–4000 mm. Despite the abundant precipitation, the lowterrain and generally mild temperature inhibit the development ofice caps, and modern glaciers are confined to mountains above2500 m (Clapperton, 1994).
The leading-edge model of population expansion predicts thatlineages located at or near the edge of glacial margins should un-dergo rapid population expansion associated with glacial retreat.The demographic analyses for lineages B and C revealed multi-modal mismatch distributions, non-signficant Fs statistics and flatBSPs, suggesting that these lineages have remained relatively sta-ble through time, but small sample sizes for both lineages requirecautious interpretation. It is possible, given the low vagility andecological specificity of E. calcaratus, that these two lineages didnot undergo demographic expansion following the retreat of thePatagonian glacier. However, given (1) the strong evidence of pop-ulation expansion for the other lineages, (2) the periglacial geo-graphic position of lineages B and C, and (3) patterns ofpopulation expansion for other periglacial taxa in other parts ofPatagonia (Xu et al., 2009; Mathiasen and Premoli, 2010), we sug-gest that further sampling is needed in these localities beforedefinitive statements about the demographic histories of these lin-eages can be made.
4.3. Taxonomic implications
It is clear from the phylogeographic patterns within E. calcaratusthat the climatic changes throughout the Pleistocene have had pro-found effects on the genetic patterns within this taxon, but the rolethese processes may have played in the formation of new speciesis uncertain. For example, the high levels of mtDNA sequence diver-gence between the Villarrica population (lineage A) and the rest ofthe E. calcaratus populations raises questions regarding the inclusionof this population within E. calcaratus. Elsewhere in the genus, thesister species E. roseus and E. migueli are separated by a smallermtDNA uncorrected genetic distance (p = 0.1021) than that betweenlineages A and the other lineages of E. calcaratus (p = 0.1228). Cer-tainly, genetic divergence alone is a poor metric of taxonomic rank,so formal integrative taxonomic studies (sensu Dayrat, 2005) shouldbe conducted before species boundaries can be reassessed.
Acknowledgments
This work was supported by Grants DID-UACh 2010-06 toUniversidad Austral de Chile, and a NSF-PIRE Award (Establishing

J.J. Nuñez et al. / Molecular Phylogenetics and Evolution 58 (2011) 343–352 351
Sustainable International Collaborations in Evolution, Ecology, andConservation Biology; OISE 0530267) for supporting collaborativeresearch on Patagonian Biodiversity granted to the following insti-tutions (alphabetically): Brigham Young University, Centro Nacion-al Patagónico (AR), Dalhousie University, Instituto BotánicoDarwinion (AR), Universidad Austral de Chile, Universidad de Con-cepción, Universidad Nacional del Comahue, Universidad Nacionalde Córdoba, and University of Nebraska.
References
Anderson, L.L., Hu, F., Nelson, D.M., Petit, R.J., Paige, K.N., 2006. Ice-age endurance.DNA evidence of a white spruce refugium in Alaska. Proc. Natl. Acad. Sci. USA103, 12447–12450.
Avila, L.J., Morando, M., Sites Jr., J.W., 2006. Congeneric phylogeography:hypothesizing species limits and evolutionary processes in Patagonian lizardsof the Liolaemus boulengeri group (Squamata: Liolaemini). Biol. J. Linn. Soc. 89,241–275.
Azpilicueta, M.M., Marchelli, P., Gallo, L., 2009. The effects of Quaternary glaciationsin Patagonia as evidenced by chloroplast DNA phylogeography of Southernbeech Nothofagus obliqua. Tree Genet. Genomes 5, 561–571.
Bertorelle, G., Slatkin, M., 1995. The number of segregating sites in expandinghuman populations, with implications for estimates of demographicparameters. Mol. Biol. Evol. 12, 887–892.
Bonan, G., 2002. Ecological Climatology: Concepts and Applications. CambridgeUniversity Press, Cambridge.
Camargo, A., De Sa, R.O., Heyer, W.R., 2006. Phylogenetic analyses of mtDNAsequences reveal three cryptic lineages in the widespread neotropical frogLeptodactylus fuscus (Schneider, 1799) (Anura, Leptodactylidae). Biol. J. Linn.Soc. 87, 325–341.
Castoe, T.A., Spencer, C.L., Parkinson, C.L., 2007. Phylogeographic structure andhistorical demography of the western diamondback rattlesnake (Crotalus atrox):a perspective on North American desert biogeography. Mol. Phylogenet. Evol.42, 193–212.
Clapperton, C.M., 1994. The quaternary glaciation of Chile. Rev. Chil. Hist. Nat. 67,369–384.
Correa, C., Veloso, A., Iturra, P., Méndez, M.A., 2006. Phylogenetic relationships ofChilean leptodactylids: a molecular approach based on mitochondrial genes 12Sand 16S. Rev. Chil. Hist. Nat. 79, 435–450.
Cosacov, A., Sérsic, A., Sosa, V., Johnson, L.A., 2010. Multiple periglacial refugia in thePatagonian steppe and post-glacial colonization of the Andes: thephylogeography of Calceolaria polyrhiza. J. Biogeog. 37, 1463–1477.
Crawford, A., 2003. Relative rates of nucleotide substitution in frogs. J. Mol. Evol. 57,636–641.
Dayrat, B., 2005. Towards integrative taxonomy. Biol. J. Linn. Soc. 85, 407–415.Drummond, A.J., Rambaut, A., 2007. BEAST: Bayesian evolutionary analysis
sampling trees. BMC Evol. Biol. 7, 214.Duellman, W.D., 1999. Patterns of Distribution in Amphibians: A Global Perspective.
Johns Hopkins University Press. 648 pp.Excoffier, L., Schneider, S., 1999. Why hunter–gatherer populations do not show
signs of Pleistocene demographic expansions? Proc. Natl. Acad. Sci, USA 96,10597–10602.
Farris, J.S., Källersjö, M., Kluge, A.G., Bult, C., 1995. Constructing a significance testfor incongruence. Syst. Biol. 44, 570–572.
Felsenstein, J., 1985. Confidence limits on phylogenies: an approach using thebootstrap. Evolution 39, 783–791.
Fitzpatrick, S.W., Brasileiro, C.A., Haddad, C.F., Zamudio, K.R., 2009. Geographicalvariation in genetic structure of an Atlantic coastal forest frog reveals regionaldifferences in habitat stability. Mol. Ecol. 18, 2877–2896.
Fu, Y.-X., 1997. Statistical tests of neutrality of mutations against populationgrowth, hitchhiking and background selection. Genetics 147, 915–925.
Galbreath, K.E., Hafner, D.J., Zamudio, K.R., Agnew, K., 2010. Isolation andintrogression in the intermountain west: contrasting gene genealogies revealthe complex biogeographic history of the American pika (Ochotona princeps). J.Biogeog. 37, 344–362.
Goebel, A.M., Donnelly, J.M., Atz, M.E., 1999. PCR primers and amplificationmethods of 12S Ribosomal DNA, control region, cytochrome oxidase I,cytochrome b in bufonids and other frogs, and an overview of PCR primerswhich have amplified DNA in amphibians successfully. Mol. Phylogenet. Evol.11, 163–199.
González-Ittig, R.E., Rossi-Fraire, H.J., Cantoni, G.E., Herrero, E.R., Benedetti, R.,Gallardo, M.H., Gardenal, C.N., 2010. Population genetic structure of long-tailedpygmy rice rats (Oligoryzomys longicaudatus) from Argentina and Chile based onthe mitochondrial control region. Can. J. Zool. 88, 23–35.
Graur, D., Martin, W., 2004. Reading the entrails of chickens: molecular timescalesof evolution and the illusion of precision. Trends Genet. 20, 80–86.
Gregory-Wodzicki, K.M., 2000. Andean paleoelevation estimates: a review andcritique. Geol. Soc. Amer. Bull. 112, 1091–1105.
Harpending, H.C., Batzer, M.A., Gurven, M., Jorde, L.B., Rogers, A.R., Sherry, S.T., 1998.Genetic traces of ancient demography. Proc. Natl. Acad. Sci. USA 95, 1961–1967.
Hewitt, G.M., 1999. Post-glacial re-colonization of European biota. Biol. J. Linn. Soc.68, 87–112.
Hewitt, G.M., 2000. The genetic legacy of the Quaternary ice ages. Nature 405, 907–913.
Hewitt, G.M., 2004. Genetic consequences of climatic oscillations in the Quaternary.Philos. Trans. Roy. Soc. Lond. B 359, 183–195.
Hinojosa, L.F., Villagrán, C., 1997. Historia de los bosques del sur de Sudamérica, I:antecedentes paleobotánicos, geológicos y climáticos del Terciario del cono surde América. Rev. Chil. Hist. Nat. 70, 225–239.
Hinojosa, L.F., Armesto, J.J., Villagrán, C., 2006. Are Chilean coastal forest pre-Pleistocene relicts? Evidence from foliar physiognomy, paleoclimate, andphytogeography. J. Biogeog. 33, 331–341.
Hulton, N.R.J., Sugden, D.E., Payne, A., Clapperton, C.M., 1994. Glacier modeling andthe climate of Patagonia during the last glacial maximum. Quaternary Res. 42,1–19.
Johns, G.C., Avise, J.C., 1998. A comparative summary of genetic distances in thevertebrates from the mitochondrial cytochrome b gene. Mol. Biol. Evol. 15,1481–1490.
Jordan, T.E., Burns, W.M., Veiga, R., Pángaro, F., Copeland, P., Kelley, S., Mpodozis, C.,2001. Extension and basin formation southern Andes caused by increasedconvergence rate: Cenozoic trigger for the Andes. Tectonics 20, 308–324.
Katoh, K., Kuma, K., Toh, H., Miyata, T., 2005. MAFFT version 5: improvementin accuracy of multiple sequence alignment. Nucleic Acids Res. 33, 511–518.
Lessa, E.P., D’Elía, G., Pardiñas, U.F.J., 2010. Genetic footprints of late Quaternaryclimate change in the diversity of Patagonian–Fueguian rodents. Mol. Ecol. 19,3031–3037.
Librado, P., Rozas, J., 2009. DnaSP v5: a software for comprehensive analysis of DNApolymorphism data. Bioinformatics 25, 1451.
Macey, J.R., Schulte, J.A., Larson, A., Fang, Z., Wang, Y., Tuniyev, B.S., Papenfuss, T.J.,1998. Phylogenetic relationships of toads in the Bufo bufo species group fromthe eastern escarpment of the Tibetan Plateau: a case of vicariance anddispersal. Mol. Phylogenet. Evol. 9, 80–87.
Marchelli, P., Gallo, L.A., 2006. Multiple ice-age refugia in a southern beech fromsouthern South America as revealed by chloroplast DNA markers. Conserv.Genet. 7, 591–603.
Marjoram, P., Donnelly, P., 1994. Pairwise comparisons of mitochondrial-DNAsequences in subdivided populations and implications for early human-evolution. Genetics 136, 673–683.
Mathiasen, P., Premoli, A.C., 2010. Out in the cold: genetic variation of Nothofaguspumilio (Nothofagaceae) provides evidence for latitudinally distinct evolutionaryhistories in austral South America. Mol. Ecol. 19, 371–385.
McCulloch, R.D., Bentley, M.J., Purves, R.S., 2000. Climatic inferences from glacialand palaeoecological evidence at the last glacial termination, southern SouthAmerica. J. Quaternary Sci. 15, 409–417.
Morando, M., Avila, L.J., Sites Jr., J.W., 2003. Sampling strategies for delimitingspecies: genes, individuals, and populations in the Liolaemus elongatus-kriegicomplex (Squamata: Liolaemidae) in Andean–Patagonian South America. Syst.Biol. 52, 159–185.
Morando, M., Avila, L.J., Sites Jr., J.W., 2004. Phylogeny and phylogeography of theLiolaemus darwinii complex (Squamata: Liolaemidae): evidence forintrogression and incomplete lineage sorting. Evolution 58, 842–861.
Morando, M., Avila, L.J., Turner, C., Sites Jr., J.W., 2007. Molecular evidence forspecies complex in the Patagonian lizard Liolaemus bibronii and phylogeographyof the closely related Liolaemus gracilis (Squamata: Liolaemini). Mol.Phylogenet. Evol. 43, 952–973.
Morando, M., Avila, L.J., Turner, C., Sites Jr., J.W., 2008. Phylogeography betweenmountains and valleys: a history of populations of Liolaemus koslowskyi(Squamata: Liolaemini). Zool. Scripta 37, 603–618.
Moritz, C., Dowling, T.E., Brown, W.M., 1987. Evolution of animal mitochondrialDNA: relevance for population biology and systematics. Ann. Rev. Ecol. Syst.187, 269–292.
Moritz, C., Schneider, C., Wake, D.B., 1992. Evolutionary relationships within theEnsatina eschscholtzii complex confirm the ring species interpretation. Syst.Biol. 41, 273–291.
Muellner, A.N., Tremetsberger, K., Stuessy, T., Baeza, C.M., 2005. Pleistocene refugiaand recolonization routes in the southern Andes: insights from Hypochaerispalustris (Astraceae, Lactuceae). Mol. Ecol. 14, 203–212.
Muñoz, J., Troncoso, R., Duhart, P., Crignola, P., Farmer, L., Stern, C.R., 2000. Therelation of the mid-Tertiary coastal magmatic south-central Chile to the lateOligocene increase convergence rate. Rev. Geol. Chile. 27, 177–203.
Nichols, R.A., Hewitt, G.M., 1994. The genetic consequences of long distancedispersal during colonization. Heredity 72, 312–317.
Nuñez, J.J., Formas, J.R., 2000. Evolutionary history of the Chilean frog genusTelmatobufo (Leptodactylidae): an immunological approach. Amphibia–Reptilia21, 351–356.
Nylander, J.A., Ronquist, F., Huelsenbeck, J.P., Nieves Aldrey, J.L., 2004. Bayesianphylogenetic analysis of combined data. Syst. Biol. 53, 47–67.
Palo, J.U., Schmeller, D.S., Laurila, A., Primmer, C.R., Kuzmins, S.L., Merilä, J., 2004.High degree of population subdivision in a widespread amphibian. Mol. Ecol.13, 2631–2644.
Patterson, B.D., 2010. Climate change and faunal dynamics in the uttermost part ofthe earth. Mol. Ecol. 19, 3019–3021.
Posada, D., 2008. JModelTest: phylogenetic model averaging. Mol. Biol. Evol. 25,1253–1256.
Posada, D., 2009. Collapse Ver. 1.2: A Tool for Collapsing Sequences to Haplotypes.<http://darwin.uvigo.es>.
Posada, D., Buckley, T.R., 2004. Advantages of AIC and Bayesian approaches overlikelihood ratio tests for model selection in phylogenetics. Syst. Biol. 53, 793–808.
352 J.J. Nuñez et al. / Molecular Phylogenetics and Evolution 58 (2011) 343–352
Potts, R., Behrensmeyer, A.K., 1992. Late Cenozoic terrestrial ecosystems. In:Behrensmeyer, A.K., Damuth, J.D., DiMichele, W.A., Potts, R., Sues, H.-D., Wing,S.L. (Eds.), Evolutionary Paleoecology of Terrestrial Plants and Animals.University of Chicago Press, Chicago, pp. 419–541.
Premoli, A.C., 2005. Biodiversity refugia: can they be found outside the coastalrange? In: Smith-Ramírez, C., Armesto, J., Valdovinos, C. (Eds.), Historia,Biodiversidad y Ecología de los Bosques Templados de Chile. EditorialUniversitaria, pp. 117–119.
Pröhl, H., Ron, S.R., Ryan, M.J., 2010. Ecological and genetic divergence between twolineages of Middle American túngara frogs Physalaemus (=Engystomops)pustulosus. BMC Evol. Biol. 10, 146 (<http://www.biomedcentral.com/1471-2148/10/146>).
Rabanal, F.E., Nuñez, J.J., 2009. Anfibios de los Bosques Templados de Chile.Universidad Austral de Chile, Valdivia, Chile. 206 pp.
Rabassa, J., 2008. Late Cenozoic glaciations in Patagonia and Tierra del Fuego. In:Rabassa, J. (Ed.), The Late Cenozoic in Patagonia and Tierra del Fuego,Developments in Quaternary Sciences, vol. 11. Elsevier, Amsterdam, pp. 151–204.
Rabassa, J., Clapperton, C.H., 1990. Quaternary glaciations of the Southern Andes.Quaternary Sci. Rev. 9, 153–174.
Rambaut, A., Drummond, A.J., 2007. Tracer v1.4. <http://beast.bio.edsac.uk/tracer>.Ramos-Onsins, S.E., Rozas, J., 2002. Statistical properties of new neutrality tests
against population growth. Mol. Biol. Evol. 19, 2092–2100.Ray, N., Currat, M., Excoffier, L., 2003. Intra-deme molecular diversity spatially
expanding populations. Mol. Biol. Evol. 20, 76–86.Rogers, A.R., Harpening, H., 1992. Population growth makes waves in the
distribution of pairwise genetic differences. Mol. Biol. Evol. 9, 552–569.Rogers, A.R., Fraley, A.E., Bamshad, M.J., Watkins, W.S., Jorde, L.B., 1996.
Mitochondrial mismatch analysis is insensitive to the mutational process.Mol. Biol. Evol. 13, 895–902.
Ronquist, F., Huelsenbeck, J.P., 2003. MRBAYES 3: Bayesian phylogenetic inferenceunder mixed models. Bioinformatics 9, 1572–1574.
Rowe, K., Heske, E., Brown, P., Paige, K., 2004. Surviving northern refugiaand postglacial colonization. Proc. Natl. Acad. Sci. USA 101, 10355–10359.
Ruzzante, D.E., Walde, S.J., Cussac, V., Dalebout, M.E., Siebert, J., Ortubay, S., Habit, E.,2006. Phylogeography of the Percichthyidae (Pisces) in Patagonia: roles oforogeny, glaciation, and volcanism. Mol. Ecol. 15, 2949–2968.
Ruzzante, D.E., Walde, S.J., Gosse, J.C., Cussac, V.E., Habit, E., Zemlak, T.S., Adams,E.D.M., 2008. Climate control on ancestral population dynamics: insight fromPatagonian fish phylogeography. Mol. Ecol. 17, 2234–2244.
Schaeffer, B., 1949. Anurans from the early tertiary of Patagonia. Bull. Am. Mus. Nat.Hist. 93, 47–68.
Semlitsch, R.D., Todd, B.D., Blomquist, S.M., Calhoun, A.J.K., Gibbons, J.W., Gibbs, J.P.,Graeter, G.J., Harper, E.B., Hocking, D.J., Hunter Jr., M.L., Patrick, D.A.,Rittenhouse, T.A.G., Rothermel, B.B., 2009. Effects of timber harvest onamphibian populations: understanding mechanisms from forest experiments.Bioscience 59, 853–862.
Smith-Ramírez, C., 2004. The Chilean coastal range: a vanishing center ofbiodiversity and endemism in South American temperate rain forests.Biodivers. Conserv. 13, 373–393.
Sugden, D.E., Hulton, N.R.J., Purves, R.S., 2002. Modelling the inception of thePatagonian ice-sheet. Quaternary Int. 95–96, 55–64.
Swofford, D.L., 2002. PAUP⁄. Phylogenetic Analysis Using Parsimony (⁄and OtherMethods). Sinauer Associates, Sunderland MA.
Tajima, F., 1989. Statistical methods to test for nucleotide mutation hypothesis byDNA polymorphism. Genetics 123, 585–595.
Tan, A.M., Wake, D.B., 1995. MtDNA phylogeography of the California newt, Tarichatorosa (Caudata: Salamandridae). Mol. Phylogenet. Evol. 4, 383–394.
Úbeda, C.A., Núñez, J.J., 2006. New parental care behaviours in two telmatobiinegenera from temperate Patagonian forests: Batrachyla and Eupsophus (Anura:Leptodactylidae). Amphibia–Reptilia 27, 441–444.
Veblen, T.T., 2007. Temperate forests of the Southern Andean region. In: Veblen,T.T., Orme, A., Young, K. (Eds.), Physical Geography of South America. OxfordUniversity Press, pp. 217–231.
Vera Candioti, M.F., Úbeda, C.A., Lavilla, E.O., 2005. Morphology and metamorphosisof Eupsophus calcaratus tadpoles (Anura: Leptodactylidae). J. Morphol. 262,161–177.
Victoriano, P.F., Ortíz, J.C., Benavides, E.R., Adams, B.J., Sites Jr., J.W., 2008.Comparative phylogeography of codistributed species of Chilean Liolaemus(Squamata: Tropiduridae) from the central-southern Andean range. Mol. Ecol.17, 2397–2416.
Villagrán, C., Armesto, J.J., 2005. Fitogeografía histórica de la Cordillera de la Costade Chile. In: Smith, C., Armesto, J.J., Valdovinos, C. (Eds.), Biodiversidad yEcología de los Bosques de la Cordillera de la Costa de Chile. EditorialUniversitaria, Santiago, pp. 99–115.
Vos, C.C., Antonisse-De Jong, A.G., Goedhart, P.W., Smulders, M.J.M., 2001. Geneticsimilarity as a measure for connectivity between fragmented populations of themoor frog (Rana arvalis). Heredity 86, 598–608.
Ward, R.D., Skibinski, D.O.F., Woodwark, M., 1992. Protein heterozygosity, proteinstructure, and taxonomic differentiation. Evol. Biol. 26, 73–159.
Xu, J., Perez-Losada, M., Jara, C., Crandall, K.A., 2009. Pleistocene glaciation leavesdeep signature on the freshwater crab Aegla alacalufi in Chilean Patagonia. Mol.Ecol. 18, 904–918.
Yoke, M.M., Morando, M., Avila, L.J., Sites Jr., J.W., 2006. Phylogeography and geneticstructure in the Cnemidophorus longicauda complex (Squamata: Teiidae).Herpetologica 62, 424–438.
Zemlak, T.S., Habit, E.M., Walde, S.J., Battini, M.A., Adams, E., Ruzzante, D.E., 2008.Across the southern Andes on fin: glacial refugia, drainage reversals and asecondary contact zone revealed by the phylogeographical signal of Galaxiasplatei in Patagonia. Mol. Ecol. 17, 5049–5061.
Zemlak, T.S., Habit, E., Walde, S.J., Carrea, C., Ruzzante, D.E., 2010. Survivinghistorical Patagonian landscapes and climate: molecular insights from Galaxiasmaculatus. BMC Evol. Biol. 10, 67 (<http://www.biomedcentral.com/1471-2148/10/67>).
Zhang, D.-X., Hewitt, G.M., 1996. Nuclear integrations: challenges for mitochondrialDNA markers. Trends Ecol. Evol. 11, 247–251.
Zink, R.M., Barrowclough, G.F., 2008. Mitochondrial DNA under siege in avianphylogeography. Mol. Ecol. 17, 2107–2121.
Zwickl, D.J., 2006. Genetic algorithm approaches for the phylogenetic analysis oflarge biological sequence datasets under the maximum-likelihood criterion.PhD Dissertation, The Graduate School of The University of Texas, Austin, USA.