amount of information and consumers’ willingness to...
TRANSCRIPT

Amount of information and consumers’ willingness to pay
for food traceability in China By Shaosheng Jin
a, Yan Zhang
b, and Yining Xu
b,c
a Center for Agriculture and Rural Development, Zhejiang University, China
b School of Management, Zhejiang University, China
c Faculty of Economics and Business, University of Groningen, Netherlands
This study employs random nth price auction to investigate consumers’ willingness to pay
(WTP) for food traceability system with both abbreviated and detailed information. Results
show that consumers have a positive WTP for both kind of food traceability systems, and on
average the premium for apples with detailed information is 10 percent higher than that of
apples with abbreviated information. Males, the married and those with relatively low level of
education have high premiums for detailed traceability information, while the self-reported
healthy consumers would not like to pay much more premium for detailed information. The
results also show that consumers show much interest in information of quality certificate and
chemical fertilizers/pesticides used in food production provided by food traceability system.
Implications for implementing food traceability system were discussed.
Keywords: Consumer, information, food traceability system, willingness to pay, China
JEL codes: L15, Q18, D1
1. Introduction
The information asymmetry often leads to consumers’ increasing anxiety, uncertainty and
sharply declining of confidence (Akerlof, 1970; Nelson, 1970; De Jonge et al., 2004; Hobbs,
2004; Halawany et al., 2007; Houghton et al., 2008). To restore and consumer confidence, it is
essential and effective to provide more information (Golan et al., 2004; van Rijswijk & Frewer,
2012; Resende-Filho &Buhr, 2010; Kher et al., 2013), which can be achieved by traditional food
labels (e.g., Kehagia et al., 2007) and food traceability system with modern technology as well
(e.g. Liddell & Bailey, 2001; Golan et al., 2004; Hobbs et al., 2005; Liao et al., 2011).
Labelling is a conventional means of food information provision and it still plays an
important role in communicating with consumers (Kehagia et al., 2007). While space limitations
on the simple hand-written or printed labels place limits on how much information can be
conveyed (Verbeke& Ward, 2006; Halawany et al., 2007; Cornelisse-Vermaat et al., 2008; Jin &
Zhou, 2014). As technologies and devices are improved continuously, IT enabled food
traceability systems such as barcode, radio frequency identification (RFID) devices and optical
systems are widely developed and used (Chrysochou et al., 2009; Dabbene et al., 2014). Due to
the increased efficiency, effectiveness, security, reliability, the increasing amount of information
included as well as more precision, IT-based traceability system are rapidly replacing labels
gradually (Food Standards Agency, 2002; Dabbene et al., 2014).
In terms of the amount of information conveyed, there are two types of food traceability
systems. Taking beef traceability system as example, the first type is a kind of relatively simple
traceability system, for example, the voluntary United Stated beef traceability systems which are
mainly private and motivated by economic incentives (Monjardino de Souza Monteiro& Caswell,
2004). The US beef traceability systems1 are record-keeping systems for the purpose of
controlling supply-chain, facilitating food safety control, differentiating foods attributes and
monitoring animal diseases (Golan et al., 2004; Schulz & Tonsor, 2010). In terms of the amount
of information provided, the US beef traceability system lags far behind those of Japanese and
1 The National Animal Identification System (NAIS) is a voluntary program, it is the most comprehensive effort in the United
States to implement food traceability (Schroeder et al., 2009).

EU (Smith et al., 2005). The other is a kind of detailed traceability system, e.g. Japanese beef
traceability system. The mandatory system has more depth and breadth than the EU2 traceability
system (Monjardino de Souza Monteiro& Caswell, 2004). According to Jin & Zhou (2014), the
Japanese Beef Traceability Law3 requires the following information to be recorded in the beef
traceability system: an Individual Identification Number, the date of birth or country of origin,
the sex, the Individual Identification Number of the maternal parent, the location (prefecture
name) of the raising facilities, the start and end of the breeding in the breeding facilities, the date
of slaughter, the breed of the cattle, the name of the exporting country (for imported cattle), the
title and location of the abattoir where the cattle were slaughtered, and the country of origin (for
imported cattle). Except the information required by law, beef retailers4 could provide more
additional information voluntarily for better assurance of food safety and quality (Clemens,
2003).
However, it is not the case that the more information provided the better, many barriers
such as the participating producers’ liability (Breiner, 2007; Schulz & Tonsor, 2010), reliability
of technology (Schroeder et al., 2009; Schulz & Tonsor, 2010) and willingness of information
provision (Golan et al., 2004) exist in the process of implementing food traceability system when
providing detailed information. And the most concerning issue is that providing information
comes at costs (Golan et al., 2003; FMRIC, 2008). Relatively speaking, the more amounts of
information and more detailed a traceability system is, the higher the costs (Monjardino de Souza
Monteiro & Caswell, 2004). Food producers concern the critical issue (Breiner, 2007) that who
will pay for the cost (Monjardino de Souza Monteiro & Caswell, 2004), they would not like to
provide detailed information if cost totally imposed on their burden.
2 According to Monjardino de Souza Monteiro & Caswell (2004), EU is a main driver in establishing world standards and leads
the introduction of traceability system worldwide.
3 Law for Special Measures Concerning the Management and Relay of Information for Individual Identification of Cattle
(abbreviated as Beef Traceability Law, Law No. 72) put in force to implement full traceability from farm to fork in 2004.
Japanese beef traceability system was implemented by the National Livestock Breeding Center with the support of the Ministry
of Agriculture, Forestry and Fisheries (Clemens, 2003; Jin& Zhou, 2014)
4 For example, Jusco Supermarkets (Aeon Company, Ltd) constructed the most comprehensive assurance system, providing
consumers with the story of how the meat was produced, the photos and name of the producers on product package, BSE testing,
an official stamp of Aeon, etc. (Clemens, 2003).

Therefore, to clarify whether the consumers want to pay for the traceability information is
of great importance to implement food traceability system; however, scarcely any related
researches yet. Amount of researches have been conducted related to food traceability systems
just mainly focus on the premiums consumers pay for the traceability attribute or associated
quality assurance attributes (e.g. Dickinson & Bailey, 2002; Hobbs et al., 2005; Verbeke & Ward,
2006; Loureiro & Umberger, 2007; Ubilava & Foster, 2009; Cicia & Colantuoni, 2010; Xu &
Wu, 2010; Lee et al., 2011; Ortega et al., 2011; Wu et al., 2011&2012; Zhang et al., 2012; Bai et
al., 2013). Based on experimental auction in Hangzhou, China, this study compares two kinds of
systems, i.e. the abbreviated one with some basic information and the detailed one with more
amount of precise information, aimed to
1) reveal and compare Chinese consumers’ WTP and preference for two types of food
traceability systems;
2) investigate the factors affecting consumers’ WTP for food traceability system, and
3) identify what kinds of information do consumers show interest in.
Our research focuses on China for the reason that China is a typical emerging country and
still at a preliminary stage of implementing food traceability system, the government and food
industry have been endeavoring to implement food traceability system in recent years. It is of
great importance to identify consumers’ attitudes and preference for food traceability
information to guide the development, implementation and maintaining of food traceability
system in China. And Hangzhou is among the first batch of pilot cities to implement meat and
vegetables traceability systems sponsored by the Ministry of Commerce and the Ministry of
Finance, so it is a good representative.
The remainder of the paper was organized as follows. Following the introduction is the
background and process of implementing food traceability system in China. The third part is the
methodology and data description, then following the result and discussion part including bids
analyzing, affiliation test, bids model and regression result, and identifying information demand,
the final comes along with the conclusion and implications.

2. Background on food traceability system in China
China began to explore the implementation of food traceability system at the beginning of
new century. On May 24th, 2002, the Ministry of Agriculture released Management Regulations
for Animal Vaccination Identification Tag and stipulates that pigs, cattle, and sheep must wear
immunity ear tags and the immunity archives management system must be established, which
indicated that China started to construct food safety traceability system.
In 2004, Regulation of Exit Aquatic Products Traceability, Beef Products Tracing and
Tracking Guidelines, and Vegetables and Fruits Traceability Guidelines were released, for the
reason that, the European Union imposed a mandatory traceability on imported beef, aquatic
products and vegetables etc. after the outbreak of BSE. To improve the export exchange of such
agricultural products and regain consumer confidence, the Chinese General Administration for
Quality Supervision, Inspection and Quarantine, the Article Numbering Center of China enacted
these guidelines and regulations in succession.
In addition, to ensure the quality and safety of agricultural products, Law of the People’s
Republic of China on Agricultural Product Quality Safety5 and Food Safety Law of the People’s
Republic of China6 were enacted in 2006 and 2009 respectively. Both of them require the food
5 Law of Agricultural Product Quality Safety requires that food enterprise shall set up records on production of agricultural
products and the required information is as follows (Article 24): The names, sources, usage, dosage of agricultural input products
in use, the date of using it and the date disusing it; The information on occurrence, prevention and control of animal epidemic
diseases as well as plant diseases, pests and disasters; and The date of harvest, slaughter or fishing.
6 Food Safety Law stipulates that food producers, processers, packers, and retailers must implement record systems which
should be preserved for at least two years for all inputs and outputs (Article 35-41 & Article 53).
Food producer should record the state, use pesticides, fertilizers, growth regulators, veterinary medicines, feeds, feed
additives and other agricultural inputs, etc.;
In terms to raw materials, food additives and food-related products, contents as the names, specifications and quantities of
the food raw materials, food additives and food-related products, names and contact information of the suppliers, and purchase
dates should be recorded.
A food ex-factory check record system should include the name, specifications, quantity, production date, production batch
number and inspection compliance certificate number of food, name and contact information of purchasers, date of sale, etc.
Record for an enterprise engaging in the business operation of food should convey the name, specifications, quantity,
production batch number, shelf-life of the food, name and contact information of the supplier, purchase date, etc.

enterprises to establish information record for the procurement, production, processing,
packaging, circulation link of the supply chain.
However, due to the high cost and technical constraint, only limited food categories were
covered by food traceability system and food safety events broke out frequently in China last
decade (Wu et al., 2012; Bai et al., 2013). To avoid and reduce the harm of unsafe food,
Management Regulations for Food Recall was released in 2007. The same year, Certificate and
Invoice Asking System and Purchase and Sale Ledger System were encouraged to establish by
the State Administration for Industry and Commerce to improve the management of food
circulation; and 9 categories 69 kinds of major products (among which 45 kinds are food
products) were listed to implement electronic supervision, electronic supervision code must be
attached to the package before sale. These efforts promote the establishment of the traceability
system.
In order to further E-enabled ‘Certificate and Invoice Asking System’ and ‘Purchase and
Sale Ledger System’, and to improve the level of circulation and package of meat and vegetables,
the Ministry of Commerce and the Ministry of Finance began to fund ten capable cities including
Shanghai, Chongqing, Dalian, Qingdao, Ningbo, Nanjing, Hangzhou, Chengdu, Kunming and
Wuxi as the first batch of pilot cites to establish food circulation traceability system in 2010.
This project focuses on meat and vegetables because they are among the highest consumption
varieties in ‘shopping basket’ in China. However, it is difficult to identify the origin of meat and
vegetables in case of food safety problem. With the purpose of realizing the informatization of
traceability system nationwide, the pilot cities should be unified in acquisition index, coding
rules, transmission format, interface specification and traceability procedures, to ensure the
information communication between different modes of traceability technology and seamless
joint cross-regionally. At the initial stage, large wholesaling markets, large and medium-sized
supermarket chains and mechanized designated slaughterhouses are the main targets. From 2011
to 2014, another four batches of 48 pilot cities7 in all were included in this project to expand the
7 Another 48 pilot cities sponsored by the Ministry of Commerce and the Ministry of Finance are the following:
The second batch of pilot cities (2011): Tianjin, Shijiazhuang, Harbin, Hefei, Nanchang, Jinan ( in Shandong province ),
Haikou, Lanzhou, Yinchuan and Urumchi.
The third batch of pilot cities (2012): Beijing, Taiyuan, Hohhot, Changchun, Zhengzhou, Changsha, Nanning, Guiyang, Xi’an,

implementation of food traceability system across the country. The meat and vegetables
circulation traceability system can serve as an example to drive the implementation of
traceability system for other agricultural products. Following the establishment of meat-
vegetable traceability system, China began to establish traceability systems for tea, milk powder,
aquatic products etc. in different regions.
The Chinese food traceability system can provide much more information after the
implementation of E-enabled ‘Certificate and Invoice Asking System’. However, whether the
food traceability system being constructed in China should record detailed information like EU
and Japan or just convey abbreviated information like the U.S. system simply to improve the
supply-side management is controversial topic and has not reached an agreement yet. It is an
issue of great importance because China is still at a preliminary stage of implementing food
traceability system with limited food categories covered.
3. Methodology & Data
3.1. Methodology
Taking apples research carrier8, we design two treatments, i.e., the first scenario is apple
with abbreviated information including ‘Brand Name, Producer, Place of Origin, Size, On-sale
Date, Shelf Life, Storage Instructions and E-business website’; and the second scenario is apple
with detailed information including ‘Brand Name, Producer, Place of Origin, Size, Date of
Picking, On-sale Date, Shelf Life, E-business Website, Storage Instructions, Contact Way,
Pesticide Residuals, Logistics Information, Nutrient Content (Calorie, Fat, Fietary fiber, Protein,
Carbohydrate, Carotene, Vitamin A, Vitamin B1, B2, B3, Vitamin C, Vitamin E; Cholesterol ,
RAE ,K, Ca, Fe, Zn, P, Na, Mg, Mn, Cu, Se). In order to compare consumers’ preference for two
types of food traceability systems with different amounts of information, experimental auction is
Xining, Suzhou, Wuhu, Weifang, Yichang and Mianyang.
The fourth batch of pilot cities (2013): Qinhuangdao, Baotou, Shenyang, Jilin, Mudanjiang, Xuzhou, Fuzhou, Yantai, Zibo,
Luohe, Xiangyang, Xiangtan, Zhongshan, Zunyi and Tianshui.
The fifth batch of pilot cities (2014): Lhasa, Jinzhong, Haidong, Tongren, Shihezi, Wuzhong, Weihai and Linyi.
8 Apple is a most common kind of fruits that is familiar to almost every one, it is easy to store and available nearly all the year
round, there is little heterogeneity for the experiment respondents in understanding the products.

employed, which is incentive compatible and popular in non-market valuation elicitation (Lusk,
2003; Lusk et al., 2007; Lust & Shogren, 2007). We selected the random nth9 (Shogren et al.,
2001) price sealed-bid auction, it works as follows: in quiet experimental environment, each
participant submits a sealed bid and then all bids are ranked in descending order; the experiment
monitor selects a uniformly-distributed random integer n, n ∈ {2, 3, . . . , k}(k bidders); then all the
n-1 highest participants buy a unit of the auctioned good at the nth price.
The experiment was divided into two stages. An initial ‘gel pen auction’ was conducted as
pre-experiment to familiarize subjects with the auction mechanic. Afterwards, formal auction
experiment was conducted following the steps:
Step one: At the beginning, the experiment instructions was explained both in written and
oral form10
. Then a unique ID number and 500g apples with no traceable information together
with 10 CNY experiment budget were endowed to each participant.
Step two: Another 500g apple was showed with a barcode but the other else characteristics
are the same. Inputting the barcode into a website, the abbreviated information shows up. Each
subject submitted his/her sealed truthful WTP for exchanging the traceable apples with the
endowment ones with no traceability information on the bidding sheet. Then experiment
assistant collected the sealed bids and ranked them from highest to lowest and drew a random
number n. Soon afterwards, the highest bid, the lowest bid, the random nth bid (market price)
and winners’ ID in that trial were posted on the blackboard. Three additional rounds were
repeated.
Step three: The monitor showed another 500g apples nearly the same as those with
abbreviated information and endowed ones, with a barcode carries much detailed information,
then four rounds of auction were conducted the same as ‘step two’.
9 The random nth price auction (Shogren et al., 2001) shares the characteristics of both BDM (Becker et al., 1964) and the
Vickrey second price auction mechanism (Vickrey, 1961) that all participants including off-margin bidders bid against other
people in an active market environment.
10 During the experiment progress, all participants should keep quiet and not communicate with each other.

Step four: A post-questionnaire followed the auction including subjects’ demographic
information, fruit purchasing behavior, information needed in traceability system, etc. And then
the only binding round was selected randomly from all the eight trials of the experiment session
to determine the traceable apple would be purchased. The only binding round was randomly
selected from a cage with labelled balls (#1-8), each ball was marked with a number that
represented one round of the session. The winner of the randomly selected binding round paid
the market price (the random nth price of that round). The binding selection process was
introduced at the beginning of the auction experiment and the likelihood of each round being
selected was the same, all the participants received the participation fee but would not pay for the
other 7 non-binding rounds.
3.2. Data
The experiment was conducted in January to February, 2013. All subjects signed up
randomly and voluntarily, and recruited by leaflet and on-site recruiting from Hangzhou which is
among the first batch of pilot cities sponsored by the Ministry of Commerce and is one of the
forefront cities in implementing food traceability system in China. Ninety nine people signed up
for auction experiment and 88 consumers showed up finally. The auction design had nine
sessions and each consisted of six to twelve adult participants, three of the nine sessions are
university students. The summary statistics on selected sample characteristics is reported in
Table 1.
[insert Table 1 here]
From table 1, the female ratio of the sample is 60 per cent, higher than the ratio in China
(48.73 per cent), considering that females often play the role of buying food for the household,
so we recruited relatively a larger proportion of female. The ratio of university students and
higher is relatively high (about 61.4 per cent) for the reason that university students are an major
group of fruits consumers, and concerning that the elders (over 60 years old) could not

understand the auction mechanism very well so that the proportion of elders is accordingly low.
About 63 per cent of participants got married and nearly 85 per cent of participants’ household
monthly income below 11000 CNY. The majority of participants are self-reported healthy and
about 89 per cent of subjects are fond of apples, and 46 per cent of subjects care about news on
food safety. While but in terms of risk perception, 28.4 per cent of participants cannot perceive
the risk that apple they consume may contain chemical residues (score less than 4) and 58 per
cent per cent of subjects can perceive the risk of apple quality and safety; with respect to risk
attitude, the average score is 3.49, which shows that the subjects are generally risk avoiding; on
average most subjects (62.5 per cent) are risk averse (score less than 4), and about 26 per cent of
subjects are risk taking when they consume apple (score larger than 4).
4. Results & Discussion
In this part, the comparison of bids between the two treatments, factors influencing
consumers’ WTP, as well as what type of information do consumers prefer are analyzed.
4.1. Bids comparison between treatment
Table 2 shows the average bids of subjects in each round. Consumers’ WTPs for apples
with abbreviated traceability information range from about 1.85 CNY to 2.22 CNY and average
WTPs for apples with detailed traceability information is around 2.7 CNY. The stabilize indexof
last two rounds in the treatment of abbraviated information and detailed information is 1.28 &
1.35 and 1.47 &1.42 respectively, which shows that the bids tend to stabilise11
.
[insert Table 2 here]
Table 3 shows the mean bids across the two treatments. Based on average price of ordinary
apples sold in market (6 CNY/500g) without traceability, results indicate that consumers would
like to pay a 34.3 and 44.5 per cent premium for apples with abbreviated traceability information
11 The stabilize index was calculated by dividing the mean bid prices by the standard deviation in each round (Lee et al., 2011).

and detailed traceability information over similar apple without traceability respectively. Results
also suggest that detailed traceable information resulted in higher WTP values. The significant
estimate of simple mean equality t-test indicates that consumers response sensitively to
information treatment, on everage they would like to pay 10 percent more premium (about 0.61
CNY/500g) for apples with detailed information over similar apples with abbreviated
information.
[insert Table 3 here]
4.2. Affiliation test, Bids model & Regression result
Before the model introduction and analyzing regression result, bids affiliation test is conducted
first.
4.2.1. Test of bids affiliation
In experiment auction, posting market price can cause learning effect which could provide
participants experience and enable them to incorporate market information into their bidding and
valuation (List & Shogren, 1999; Corrigan et al., 2012), while it can also cause consumers’
private bids get affiliated (Milgrom & Weber, 1982; List & Shogren, 1999).12
It is essential to
test whether bids affiliation exists (List & Shogren, 1999) and the model follows Alfnes &
Rickertsen (2003) and Chern & Chang (2012):
∆Bi,t = β1 + β2t + β3Pi,t−1 + εi,t
where ∆Bi,t is participant i’s bid in round t minus bid in round t-1; Pi,t−1 denotes the difference
between the posted price and participant i’s bid in round t-1, and ε is an error term. β3 measures
the affiliation, if β3> 0, there was a trend that the participant would increase his/her bid in later
rounds and if his/her bid was lower than the posted price. The explanatory variable round
12 Refer to Milgrom and Weber (1982) for better understanding about affiliated private values in auctions.

number t is to test whether there is a trend that the participant bids increased (if β2>0) or
decreased (if β2<0) throughout the repeated trials. The parameters can be estimated by ordinary
least squares (OLS). The test result is showed in the Table 4.
[Insert Table 4 here]
The affiliation test shows that the bids influenced by the round variable t in the treatment of
abbreviated information but not in the treatment of detailed information,. It suggests that there is
not obvious increasing or decreasing trend of the bids during the whole auction. The posted
prices significantly influence the bids in both treatments, which means that the participant would
like to increase his/her bid if his/her last bid was lower than the posted bid but the amount of
premium they would like to increase (the coefficient of Pi,t−1, 0.25 and 0.15 CNY respectively) is
not large. One likely explanation for the positive trend is that it takes some time for participants
to fully understand the auction mechanism (List & Shogren, 1999). It is somewhat an evidence
that participants engaged in the auction attentively and they submitted their truthful WTP by
adjusting bids slightly in different rounds taking revealed market price as reference.
4.2.2. Bids models
A regression model was developed to investigate how various factors affecting consumers’
preference for different amounts of information recorded by food traceability system. We assume
that the bid premium for food with traceability information is a function of demographic and
individual characteristics of subjects as well as information treatments. Consider that the
assumption of linearity would not be held because there existed some zero bidders for apples
with traceability information, and for the panel nature of our data, it is a typical censoring
problem, so we adopted a random effect tobit model.
The Tobit model can be defined as (Wooldridge, 2006):
𝑦𝑖∗ = 𝛽0 + 𝛽′𝑥𝑖 + 𝜇𝑖 , 𝜇𝑖~𝑁(0, 𝜎2)

𝑦𝑖 = {𝑦𝑖
∗ 𝑖𝑓 𝑦𝑖∗ > 0
0 𝑓 𝑦𝑖∗ ≤ 0
Where 𝑦𝑖∗ is a latent variable, it has a normal, homoskedastic distribution with a linear
conditional mean. 𝑦𝑖 is the observed censored variable, 𝑥𝑖 is a vector of independent variables
and 𝜇𝑖 is the error term assumed to have normal distribution. Because 𝑦𝑖∗ is normally
distributed,𝑦𝑖 has a continuous distribution over strictly positive values. 𝛽′ measures the partial
effects of the 𝑥𝑖 on 𝐸(𝑦𝑖∗|𝑥).
In our study, the subjects’ WTP (𝑦𝑖) is non-negative, the probability density fucntion is shown
as:
𝑝𝑟𝑜𝑏(𝑦𝑖∗ > 0) = 𝑓(𝑦𝑖|𝑦𝑖 > 0) = ∅𝑖(
𝛽′𝑥𝑖
𝜎)
Where ∅𝑖(𝛽′𝑥𝑖
𝜎) is a cumulative standard normal distribution function. The expected WTP for
consumer i can be computed as:
𝐸(𝑦𝑖∗) = 𝐸(𝑦𝑖|𝑦𝑖 > 0, 𝑥) × 𝑓(𝑦𝑖|𝑦𝑖 > 0, 𝑥) + 𝐸(𝑦𝑖|𝑦𝑖 = 0) × 𝐹(𝑦𝑖 = 0)
Where 𝐸(𝑦|𝑦 > 0, 𝑥) = 𝑥′𝛽 + 𝜎𝜆 (𝛽′𝑥
𝜎)
Then
𝐸(𝑦𝑖∗) = 𝛽′𝑥𝑖∅ (
𝛽′𝑥𝑖
𝜎) + 𝜎𝜑 (
𝛽′𝑥𝑖
𝜎)
Where 𝜆(𝛽′𝑥 𝜎⁄ ) = 𝜑(𝛽′𝑥 𝜎⁄ )/∅(𝛽′𝑥 𝜎⁄ ) is called the inverse Mills ratio.
4.2.3. Regression results
Table 5 exhibits the parameter estimates of our WTP model. The log likelihood=-1016.8483
and Prob>chi2=0.0000. Overall, these appear to be reasonably good results.
13
13
According to Lusk & Shogren (2007), data from repeated sealed-bid auction can be considered as panel data.

[Insert Table 5 here]
The significantly positive sign for treatment indicates that consumers are willing to pay
more for apples with detailed traceability information over similar apples with abbreviated
traceable information. The possible reason may be that due to the information asymmetry in food
market, consumers desire detailed information and value such detailed information.
Compared with female, Chinese male consumers would like to pay more premium for food
with traceability information. And according to Jin & Zhou (2014), Japanese male consumers are
more likely to retrieve information through food traceability system. This may indicate that male
cared more about food safety and interpret why male consumers value traceability informtion
much than the female.
Marital status significantly influence the WTP for food with traceability information. Those
married would like to pay more premium on apples with detailed traceability information
probably for the reason that they are aware of the benefits of a food traceability system with
detailed information and they may take more responsibility on family and care more about food
safety than the singles.
Education level is also a very important factor affecting consumers’ WTP on food with
traceability information. As previous studies mentioned, the impacts of education on consumers’
WTP are not definitive (Chakraborty, 2005; Froehlich et al., 2009). In this study, compared with
consumer who have received junior high school or lower level of education, those who have
higher education or even master degree or higher would not like to pay more premium for apples
with traceability information, although their bids are nearly all positive, the result is in line with
Lee et a. (2011). The probable reasons as follows, firstly, education is a key to changing
consumers’ perceptions (Nayga et al., 2006), as Sckokai et al. (2014) claimed, mycotoxins and
GMP are elusive to the general consumers, it is likely the same case to food traceability system,
the general public especially the less educated consumers may consider this elusive concept as a
general proxy for safer food and the associated “safer apples” WTP is higher than the actual
marginal value of food traceability. Secondly, in the experiment, the detailed information
treatment with more information especially in nutritional content, the high educated consumers
are more rational, although they are highly educated, they may not have the necessary nutritional
knowledge to process such nutritional information such that the given product is enriched by and
the related amount, so they would not want to pay for such information beyond their power. And
also, highly educated consumers may not trust the detailed information provided by the food
traceability in context of China.. Our finding is similar to Chakraborty (2005) and Boccaletti &
Nardella (2000), who found that the U.S. and Italy consumers with higher education were less
likely to pay a premium for rBST-free milk and pesticide free fresh fruit- and-vegetables
respectively.
The self-reported healthy consumers do not want to pay more premium for apples with
traceability information. In fact, food traceability system was originally designed as one element
of a firm’s supply side management systemand production strategyfor tracing and tracking food
information about production, logistic and retail (Golan et al., 2004). The self-reported healthy
consumers probably think that it is safe as long as the food traceability system exists no matter
how much information it provides and it is the government and food firms to bear the cost of
establishing food traceability system instead of the consumers.
4.3. Demand for specific food safety and quality information
Information recorded by food traceability system should be of the type that consumers show
interest in (Verbeke, 2005) because it can affect consumers’ perception toward food they
consumed significantly (Dickinson & Bailey, 2002). In this study, respondents were asked to
rank their preference for 8 different kinds of information and the statistical result shows in Figure
1.
[Insert Figure 1 here]
The results show that consumers show interest in almost all the information surveyed, as
food traceability system is of credence attribute, consumers with higher degree of confidence
often show less satisfaction with the amount of information available and desire for more amount
of additional information (Grunert, 2000), thus the result may be a symbol that consumers have
confidence in food traceability system and the effort gonverment has been taken to establish food
traceability system has significant effect.
Among all the information provided, consumers are most interested in quality certificate,
only 5.68 per cent consumers do not care about this information and no one does not want to
know it. Quality certificate is readily interpretable indications of quality and quick to process,
thus consumers prefer this kind of information well much (Hobbs et al., 2005; van Rijswijk et al.,
2008), especially in the case of food safety incidents, consumers trust more on quality
certification marks and eager to know such information (Hobbs et al., 2005). The second kind of
information respondents always want to know is chemical fertilizers and pesticides used in
production process, the proportion is about 91 per cent. For the reason that the abuse of chemical
fertilizers and pesticides is very serious and excessive pesticide residues are detected is of
common occurrence in China, many kinds of fruits have high content of heavy metals residuals
from various sources (Fang & Zhu, 2014), so consumers are more concerned about the
information about of fertilizers and pesticides. Whether the food products meet production
standards and the on–sale-date rank highly at the third place (86.36 per cent) concerning about
the freshness and shelf life.
From this study, the top four kinds information that Chinese consumers are interested in are
quality certificate, chemical fertilizer and pesticides, production standard, and on sale date. And
in line with Jin & Zhou (2014), who find that harvest date, production method, certification of
production method and pesticide (drug) used in production are the top four kinds of information
Japanese consumers care about. The finding of these two studies is somewhat similar, probably
because consumers in East Asia may have similar preference for food information.
While relatively low interest in ‘nutrition’ content (73 per cent) and place of origin (64 per
cent) may due to consumers are usually familiar with daily food they consume or they just follow
their consumption habit. Chinese consumers are identified to show least interest in the circulation
process and the name of producer, the probable reason may be that the circulation system in
China have not been perfectly constructed, information about food circulation and producer is
difficult to obtain and the reliability is questionable either.

5. Conclusion and implications
Information asymmetry in the food market can be reduced effectively by means of food
traceability system to restore consumer confidence. Food traceability system is originally
designed to control the supply chain management by providing traceability assurance with
abbreviated information; it can also serve as an effective tool of information provision about
product credence attributes besides traceability assurance. As the cost is the main obstacle for
producers’ information provision, whether consumers have WTP for traceability information to
share the cost is very important in developing food traceability system. In this study, we
conducted random nth price auction to reveal consumers’ WTP for food with both abbreviated
and detailed traceability information in China. To our best knowledge, there are no such similar
studies conducted before. The seminal idea and Chinese context have many implications not only
for China and even for developed countries.
The results showed that consumers have a positive WTP for both kinds of information, in
accordance with Yang & Wu (2009) and Zhang et al. (2012), who found that Chinese consumers
have a positive WTP premium for food traceability system. The premiums consumers want to
pay are significantly different. Generally speaking, apples with no traceability information,
consumers want to pay higher for apples with detailed traceability information (the average
premium is 44.5 per cent) than those with abbreviated traceability information (the average
premium is 34.3 per cent), the premium difference is about 10 per cent. This result suggests that
consumers value much for detailed information, and detailed information is beneficial to
producers to achieve extra gain and expand the market. The amount of the premium and the
difference of premium can also serve as a reference for the pricing products with different
amount of traceability information, that is, the price of fresh produce with detailed information
can have about 10 per cent higher price than those with abbreviated information.
In terms of the factors affecting consumers WTP, males and the married would like to pay
more for food traceability system than the females and the singles respectively. While although
the self-reported healthy consumers and consumers who received higher level education all
submitted nonnegative WTP for both abbreviated and detailed information, they would not like
to pay much more premium for food traceability system. The result suggests that when

implementing food traceability system, social demographic characteristics and market
segmentation should be taken into consideration because consumers with different social
demographic characteristics have different information preference, this is also emphasized by Jin
& Zhou (2014), Kehagia et al. (2007) and Pieniak et al. (2007). When new products are
introduced to market mainly targeted the males, the self-reported healthy, the married, those with
low level of education, food traceability system should be established to attract such kinds of
consumers. Moreover, distrust in food traceability information is a probable reason for the low
premium from consumers with high level of education, so it is urgent for government and food
firms to solve the distrust problem.
The survey result shows that consumers prefer the quality certificate, which is the most
popular information. This confirms that quality certificate associated with food traceability
system is of more value (e.g. Hobbs et al., 2005; Verbeke & Ward, 2006). Consumers also
concern about the chemical fertilizer and pesticides used in the process of food production and
processing. By comparison, the information of food producer and food circulation and logistic
information are the two least popular ones. This can serve as reference for the policy makers and
food firms when deciding what kinds of information should be recorded by food traceability
system. Under the limited cost budget, the quality certificate is the most important and following
the fertilizer and pesticides information, and others information is superior.
What is more, with rapid development of electronic technology and widespread use of
mobile phone, it takes less cost to retrieve information, so it is likely that more and more
consumers will show interest in various kinds of information. Besides, taking the limited time
and capability of processing information into consideration, the philosophy of ‘more information
is better’ takes the risk of ‘information overload’ (Jacoby et al., 1974), because excess or
irrelevant information may prevent consumers making optimal choices (Teisl & Roe, 1998;
Salaün & Flores, 2001). So it is worth studying the appropriate amount of information should be
recorded by food traceability system in future researches basing on larger samples.

Acknowledgements
The authors gratefully acknowledge the funding support from the Fundamental Research
Funds for the Central Universities (SSEYI201102), the National Natural Science Foundation of
China (NNSFC-71273233, 71333011) and Collaborative Innovation Center for Rural Reform
and Development, Zhejiang University.

Tables and Figures
Table 1. Summary statistics on select sample characteristics
Variables Definition and coding Mean Sd
Information treatment 0=abbreviated information group; 1=detailed information group
Gender 0 = female; 1 = male 0.40 0.49
Age Age of the participant (not less than 18 years old). Real age 39.14 18.01
Marital status 0=Unmarried; 1=married 0.63 0.49
Education Education level.
1 = Junior high school or lower; 20.45%
2 = Senior high school or technical secondary school; 18.18%
3 = Bachelor or college degree; 47.73%
4 = Master or above. 13.64%
Income Household income per month (CNY)
1=less than 5000; 25.00%
2=5000-6999; 23.86%
3=7000-8999; 18.18%
4=9000-10999; 18.18%
5=11000 and above. 14.77%
Self-reported Health 1=healthy, 0=others. 0.93 0.254
Preference for apple Degree of preference for apple.1=like, 0=others. 0.89 0.318
News Care about the news about safety of agricultural product.
1=care, 0=others.
0.46 0.498
Risk Perception14 Consumers’ perception towards food safety.
17 Cannot perceive risk completelyCan perceive risk absolutely
4.44 1.065
Risk Attitude15 Consumers’ attitude towards food safety.
17 risk aversionrisk preference
3.49 1.044
14
The Risk Perception interprets the chance to be exposed to the risk related to food safety, it was tested by the following three
questions, and the Mean is the average sum-score of the three indicators’ mean, and Sd is the average sum of the three indicators’
standard deviation (Pennings et al., 2002).
Q1. At present, the fruit market is generally safe although incidents like excessive pesticide residues, illegal use of preservative
and industrial wax happened occasionally. (1=Disagree completely, 7=Agree completely)
Q2. At present, fruits containing above chemical substances make up a large proportion of the fruit market and do harm a lot.
(1=Disagree completely, 7=Agree completely) reverse (1= Agree completely, 7= Disagree completely)
Q3. At present, fruits containing above chemical substances do little harm to consumers’ health.(1=Disagree completely,7=Agree
completely) 15 The Risk Attitude reflects a consumer’s predisposition to risk or how much a consumer dislike the risk, it was tested by the
following three questions, and the Mean is the average sum-score of the three indicators’ mean, and Sd is the average sum of the
three indicators’ standard deviation (Pennings et al., 2002).
Q4. Although I often hear about the bad news such as excessive pesticide residues, illegal use of preservative and industrial wax,
it doesn’t affect my purchasing behavior of fruits.(1=Disagree completely,7=Agree completely)

Table 2. Mean bids by the round and stabilization index for bid price
Treatment Abbreviated information Detailed information
Trial Trial
1 2 3 4 1 2 3 4
Min 0 0 0 0 0 0 0 0
Max 6.8 6.5 6.5 6.0 9.0 8.0 8.0 8.0
Median 1.5 2.0 2.0 2.0 2.5 2.2 2.0 2.2
Mean 1.85 2.04 2.13 2.22 2.67 2.71 2.69 2.63
SD 1.43 1.40 1.66 1.64 1.72 1.80 1.84 1.85
Mean/SD 1.29 1.46 1.28 1.35 1.55 1.51 1.47 1.42
Unit: CNY, the number of subjects is 88.16
Table 3. Mean bids and T-test for equality of WTP means across the information treatments
mean median SD mean WTP difference t-value
information abbreviated 2.06 2.0 1.537
0.61*** 9.30 detailed 2.67 2.2 1.796
***Denote significance at 1% level.
Q5. I never worry about the residue of pesticide, preservative and industrial wax when eating fruits.(1=Disagree
completely,7=Agree completely)
Q6. I completely cannot accept the risk unacceptable of the health risk by eating fruits which have the above chemical substances.
(1=Disagree completely, 7=Agree completely) reverse (1= Agree completely, 7= Disagree completely) 16 At the time of auction, market price of apples without traceable information was 6 CNY/500g, and 1$= 6.30 CNY roughly.

Table 4. Bid affiliation test results
Variable
Treatment
Abbreviated information Detailed information
Constant 0.393* -0.489
(0.205) (0.462)
t -0.112* 0.053
(0.066) (0.065)
P 0.251*** 0.149***
(0.034) (0.029)
N 264 264
Adj-R2 0.167 0.089
Notes: the symbols numbers in parentheses are estimated standard errors. N is the number of
observations, and the sample size is 88.
*, **, *** Significant at the 10% , 5%, 1% level respectively.
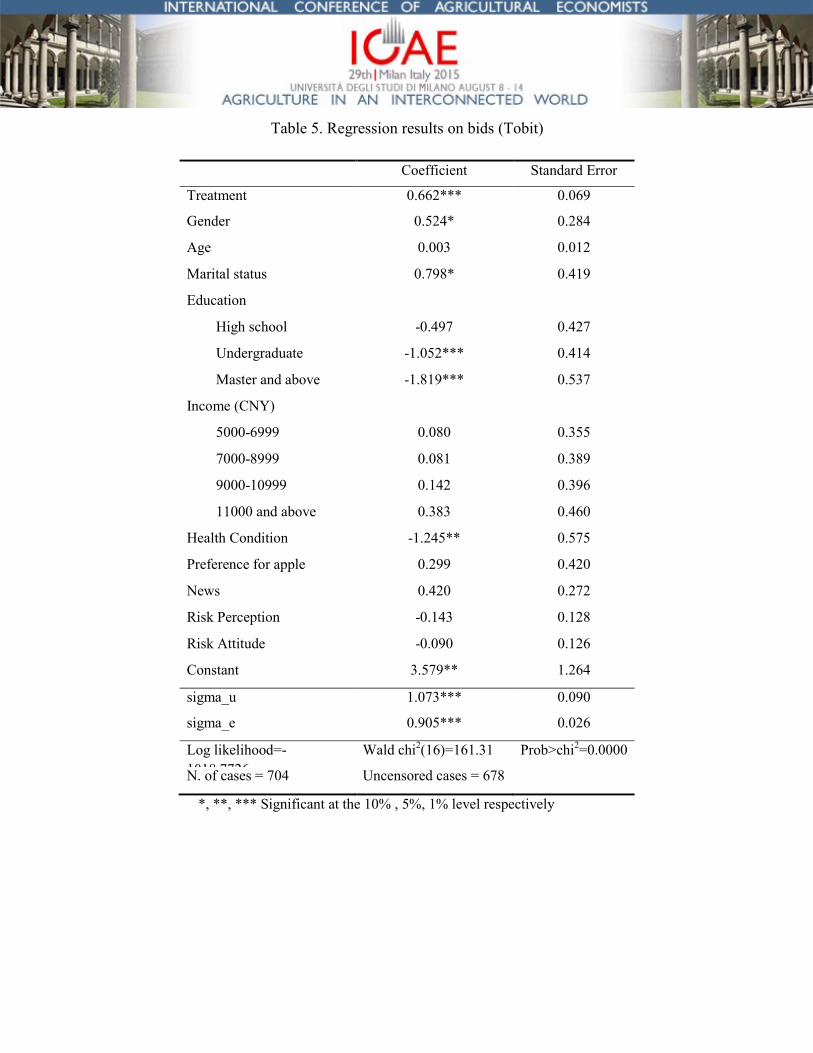
Table 5. Regression results on bids (Tobit)
Coefficient Standard Error
Treatment 0.662*** 0.069
Gender 0.524* 0.284
Age 0.003 0.012
Marital status 0.798* 0.419
Education
High school -0.497 0.427
Undergraduate -1.052*** 0.414
Master and above -1.819*** 0.537
Income (CNY)
5000-6999 0.080 0.355
7000-8999 0.081 0.389
9000-10999 0.142 0.396
11000 and above 0.383 0.460
Health Condition -1.245** 0.575
Preference for apple 0.299 0.420
News 0.420 0.272
Risk Perception -0.143 0.128
Risk Attitude -0.090 0.126
Constant 3.579** 1.264
sigma_u 1.073*** 0.090
sigma_e 0.905*** 0.026
Log likelihood=-
1018.7726
Wald chi2(16)=161.31 Prob>chi
2=0.0000
N. of cases = 704 Uncensored cases = 678
*, **, *** Significant at the 10% , 5%, 1% level respectively
References
Akerlof, G. A., 1970. The market for "lemons": Quality uncertainty and the market
mechanism. The Quarterly Journal of Economics. 84(3), 488-500.
Alfnes, F., Rickertsen, K., 2003. European consumers’ willingness to pay for US beef in
experimental auction markets. American Journal of Agricultural Economics. 85(2), 396-405.
Bai, J., Zhang, C., Jiang, J., 2013. The role of certificate issuer on consumers’ willingness-
to-pay for milk traceability in China. Agricultural Economics. 44, 537-544.
Becker, G., DeGroot, M., Marschak, J., 1964. Measuring utility by a single response
sequential method. Behavioral Science. 9, 226-236.
Boccaletti, S., Nardella, M., 2000. Consumer willingness to pay for pesticide-free fresh fruit
and vegetables in Italy. The International Food and Agribusiness Management Review. 3(3),
297-310. Breiner, S. J., 2007. Perceptions and Attitudes of Cow-Calf Producers toward Emerging
Technologies and Policy Issues in the Beef Cattle Industry. MS thesis, Kansas State
University.
Chakraborty, K., 2005. Consumers’ attitude towards hormone-free milk: What have we
learned? Applied Economic Letters. 12, 633-637.
Chern, W. S., Chang, C., 2012. Benefit evaluation of the country of origin labeling in
Taiwan: Results from an auction experiment. Food Policy. 37(5), 511-519.
Chrysochou, P., Chryssochoids, G., Kehagia, O., 2009. Traceability information carriers.
The technology backgrounds and consumers’ perceptions of the technological solutions.
Appetite. 53, 322-331.
Cicia, G., Colantuoni, F., 2010. Willingness to pay for traceable meat attributes: A meta-
analysis. International Journal on Food System Dynamics. 3, 252-263.
Clemens, R., 2003. Meat traceability and consumer assurance in Japan (MATRIC Briefing
Paper). Iowa: Midwest Agribusiness Trade and Information Center, Iowa State University.
Cornelisse-Vermaat, J. R., Voordouw, J., Yiakoumaki, V., Theodoridis, G., Frewer, L. J.
(2008). Food-allergic consumers’ labelling preferences: A cross-cultural comparison. The
European Journal of Public Health, 182, 115–120.
Corrigan, J. R., Drichoutis, A. C., Lusk, J. L., Nayga, Jr. R. M., Rousu, M. C., 2012.
Repeated rounds with price feedback in experimental auction valuation: An adversarial
collaboration. American Journal of Agricultural Economics. 94(1), 97-115.
Dabbene, F., Gay, P., Tortia, C., 2014. Traceability issues in food supply chain management:
a review. Biosystems Engineering. 120, 65-80.
De Jonge, J., Frewer, L., Van Trijp, H., et al., 2004. Monitoring consumer confidence in
food safety: an exploratory study. British Food Journal. 106, 837-849.
Dickinson, D. L., Bailey, D. V., 2002. Meat traceability: Are U.S. consumers willing to pay
for it? Journal of Agricultural and Resource Economics. 27(2), 348-364.
Fang, B., Zhu, X., 2014. High content of five heavy metals in four fruits: Evidence from a
case study of Pujiang County, Zhejiang Province, China. Food Control. 39, 62-67.
Food Standards Agency, 2002. Traceability in the food chain: A preliminary study. Food
Standards Agency: Food Chain Strategy Division.
Food Marketing Research and Information Center (FMRIC), 2008. Handbook for
Introduction of Food Traceability Systems.

Froehlich, E. J., Carlberg, J. G., Ward, C. E., 2009. Willingness-to-pay for fresh brand name
beef. Canadian Journal of Agricultural Economics. 57, 119-137.
Golan, E., Krissoff, B., Kuchler, F., Nelson, K., Price, G., 2004. Traceability in the US food
supply: economic theory and industry studies. US Department of Agriculture, Economic
Research Service.
Golan, E., Krissoff, B., Kuchler, F., Nelson, K., Price, G., Calvin, L., 2003. Traceability in
the US food supply: dead end or superhighway? Choices. 2, 17-20.
Grunert, K. G., Bech-Larsen, T., Bredahl, L., 2000. Three issues in consumer quality
perception and acceptance of dairy products. International Dairy Journal. 10(8), 575-584.
Halawany, R., Bauer, C., Giraud, G., Schaer, B., 2007. Consumers' acceptability and
rejection of food traceability systems, a French-German cross-comparison. Innovation and
System Dynamics in Food Networks. Officially endorsed by EAAE, Innsbruck-Igls, Austria.
Hobbs, J. E., 2004. Information asymmetry and the role of traceability systems. Agribusiness.
20(4), 397-415.
Hobbs, J. E., Bailey, D. V., Dickinson, D. L., Haghiri, M., 2005. Traceability in the
Canadian red meat sector: do consumers care? Canadian Journal of Agricultural Economic.
53(1), 47-65.
Houghton, J. R., Rowe, G., Frewer, L. J., Van Kleef, E., Chryssochoidis, G. M., Kehagia, O.,
2008. The quality of food risk management in Europe: Perspectives and priorities. Food
Policy. 33(1), 13-26.
Jacoby, J., Speller, D. E., Kohn, C. A., 1974. Brand choice behavior as a function of
information load. Journal of Marketing Research. 11(1), 63-69.
Jin, S., Zhou, L., 2014. Consumer interest in information provided by food traceability
systems in Japan. Food Quality and Preference. 36, 144-152.
Kehagia, O., Chrysochou, P., Chryssochoidis, G., Krystallis, A., Linardakis, M., 2007.
European consumers’ perceptions, definitions, and expectations of traceability and the
importance of labels, and the differences in these perceptions by product type. Sociologica
Ruralis. 47, 400-416.
Kher, S. V., De Jonge, J., Wentholt, M. T. A., et al., 2013. Consumer perceptions of risks of
chemical and microbiological contaminants associated with food chains: a cross-national
study. International Journal of Consumer Studies. 37(1), 73-83.
Lee, J. Y., Han, D. B., Nayga, R. M., et al., 2011. Valuing traceability of imported beef in
Korea: an experimental auction approach. Australian Journal of Agricultural and Resource
Economics. 55(3), 360-373.
Liao, P., Chang, H., Chang, C., 2011. Why is the food traceability system unsuccessful in
Taiwan? Empirical evidence from a national survey of fruit and vegetable farmers. Food
Policy. 36, 686-693.
Liddell, S., Bailey, D., 2001. Market opportunities and threats to the U.S. pork industry
posed by traceability systems. International Food and Agribusiness Management Review. 4,
287-302.
List, J. A., Shogren, J. F., 1999. Price information and bidding behavior in repeated second-
price auctions. American Journal of Agricultural Economics. 81, 942-949.
Loureiro, M. L., Umberger, W. J., 2007. A choice experiment model for beef: What US
consumer responses tell us about relative preferences for food safety, country-of-origin
labeling and traceability. Food Policy. 32, 496-514.
Lusk, J. L., Alexander, C., Rousu, M. C., 2007. Designing experimental auctions for
marketing research: The effect of values, distributions, and mechanisms on incentives for
truthful bidding. Review of Marketing Science. 5.
Lusk, J. L., 2003. Using experimental auctions for marketing applications. Journal of
Agricultural and Applied Economics. 35(2), 349-360.
Lusk, J. L., Shogren, J., 2007. Experimental Auctions: Methods and Applications in
Economic and Marketing Research. New York: Cambridge University Press.
Milgrom, P., Weber, R., 1982. A theory of auctions and competitive bidding. Econometrica.
50(5), 1089-1122.
Monjardino de Souza Monteiro, D., Caswell, J. A., 2004. The economics of implementing
traceability in beef supply chains: Trends in major producing and trading countries.
University of Massachusetts, Amherst Working Paper.
Nayga, R., Woodward, R,. Aiew, W., 2006. Willingness to pay for reduced risk of
foodborne illness: a nonhypothetical field experiment. Canadian Journal of Agricultural
Economics. 54, 461–475.
Nelson, P., 1970. Information and consumer behavior. The Journal of Political Economy.
78(2), 311-329.
Ortega, D. L., Wang, H. H., Wub, L., Olynk N. J., 2011. Modeling heterogeneity in
consumer preferences for select food safety attributes in China. Food policy. 36(2), 318-324.
Pennings, J. M. E., Wansink, B., Meulenberg, M. T. G., 2002. A note on modeling consumer
reactions to a crisis: The case of the mad cow disease. International Journal of Research in
Marketing. 19(1), 91-100.
Pieniak, Z., Verbeke, W., Vermeir, I., Brunsø, K., Olsen, S. O., 2007. Consumer interest in
fish information and labelling: Exploratory insights. Journal of International Food & Agri-
Business Marketing. 19, 117-141.
Resende-Filho, M. A., Buhr, B. L., 2007. Economics of traceability for mitigation of food
recall costs. Available at http://mpra.ub.uni-muenchen.de/3650/1/MPRA_paper_3650.pdf
Salaün, Y., Flores, K., 2001. Information quality: meeting the needs of the consumer.
International Journal of Information Management. 21(1), 21-37.
Schroeder, T. C., Blasi, D. A., Brester, G. W., Crosby, C., Dhuyvetter, K. C., Freeborn, J.,
Pendell, D. L., Smith, G. C., Stroade, J., Tonsor, G. T., 2009. Benefit cost analysis of the
national animal identification system. Report for U.S. Department of Agriculture, Animal
and Plant Health Inspection. Internet site:
http://animalid.aphis.usda.gov/nais/naislibrary/documents/plans_reports/Benefit_Cost_Anal
ysis_NAIS.pdf (Accessed August 7, 2014).
Schulz, L. L., Tonsor, G. T., 2010. Cow-calf producer perceptions regarding individual
animal traceability. Journal of Agricultural and Applied Economics. 4(42), 659-677.
Sckokai, P., Veneziani, M., Moro, D., Castellari, E., 2014. Consumer willingness to pay for
food safety: the case of mycotoxins in milk. Bio-based and Applied Economics. 3(1), 63-81.
Shogren, J. F., Margolis, M., Koo, C., List, J. A., 2001. A random nth-price auction. Journal
of Economic Behavior & Organization. 46, 409-421.
Schroeder, T. C., Tonsor, G. T., Pennings, J. M., Mintert, J., 2007. Consumer food safety
risk perceptions and attitudes: impacts on beef consumption across countries. The BE
Journal of Economic Analysis & Policy. 7(1).
Smidts, A., 1997. The relationship between risk attitude and strength of preference: A test of

intrinsic risk attitude. Management Science. 43, 357-370.
Smith, G. C., Tatum, J. D., Belk, K. E., Scanga, J. A., Grandin, T., Sofos, J. N., 2005.
Traceability from a US perspective. Meat Science. 71, 174-193.
Teisl, M. F., Roe, B., 1998. The economics of labelling: an overview of issues for health and
environmental disclosure. Agricultural and Resource Economics Review. 27, 140-149.
Ubilava, D., Foster, K., 2009. Quality certification vs. product traceability: Consumer
preferences for informational attributes of pork in Georgia. Food Policy. 34, 305-310.
van Rijswijk, W., Frewer, L. J., 2012. Consumer needs and requirements for food and
ingredient traceability information. International Journal of Consumer Studies. 36(3), 282-
290.
van Rijswijk, W., Frewer, L. J., Menozzi, D., Faioli, G., 2008. Consumer perceptions of
traceability: A cross-national comparison of the associated benefits. Food Quality and
Preference. 19, 452-464.
Verbeke, W., 2005. Agriculture and the food industry in the information age. European
Review of Agricultural Economics. 32(3), 347-368.
Verbeke, W., Ward, R. W., 2006. Consumer interest in information cues denoting quality,
traceability and origin: An application of ordered probit models to beef labels. Food Quality
and Preference. 17(6), 453-467.
Vickrey, W., 1961. Counterspeculation, auctions, and competitive sealed tenders. The
Journal of finance. 16(1), 8-37.
Wooldridge, J. M., 2006. Introductory Econometrics, third ed. Thomson Higher Education.
Wu, L., Xu, L., Gao, J., 2011. The acceptability of certified traceable food among Chinese
consumers. British Food Journal. 113 (4), 519-534.
Wu, L., Xu, L., Zhu, D., Wang X., 2012. Factors affecting consumer willingness to pay for
certified traceable food in Jiangsu province of China. Canadian Journal of Agricultural
Economics. 60, 317-333.
Xu, L., Wu, L., 2010. Food safety and consumer willingness to pay for certified traceable
food in China. Journal of the Science of Food and Agriculture. 90, 1368-1373.
Yang, B., Wu, X., 2009. Consumers’ willingness to pay for traceability agricultural
commodities. Rural Econ. 8, 57-59.
Zhang, C., Bai, J., Wahl, T., 2012. Consumers’ willingness to pay for traceable pork, milk,
and cooking oil in Nanjing, China. Food Control. 27, 21-28.