amide proton transfer weighted imaging: advancement in
TRANSCRIPT

3D APT whitepaper
MR clinical applications
Amide Proton Transfer weighted imaging:
Advancement in molecular tumor diagnosis Kim van de Ven, PhD 1; Jochen Keupp, PhD 2
Today, although MR is the gold standard in neuro-oncological imaging, its accuracy in tumor grading and treatment follow up assessment can be further improved. Amide Proton Transfer weighted (APTw) MRI is a new, unique, contrast-agent free brain MR imaging method that addresses the need for a more confident diagnosis in neuro oncology. It uses the presence of endogenous cellular proteins to produce an MR signal that directly correlates with cell proliferation, a marker of tumor activity.This white paper explains the main principles and general acquisition mechanism of APTw imaging as initially pioneered by the group of Dr. van Zijl and Dr. Zhou1-4. It highlights how the Philips 3D APT product enables fast and robust APTw image acquisition by leveraging Philips unique patient adaptive MultiTransmit 4D and mDIXON XD TSE technologies, as well as supports easy viewing by using a dedicated color scale. Lastly, it explores how APTw imaging can support trained medical professionals in differentiating low grade from high grade gliomas and in distinguishing tumor progression from treatment effects in clinical practice.
1 Senior Clinical Scientist, Philips MR, 2 Senior Scientist, Philips Research
2 3
Why is a new technique in neuro-oncology needed?
37% of non-enhancing gliomas are malignant5, and although MRI is the gold standard for brain tumor treatment follow-up, current techniques are still not reliable enough to separate true progression from pseudo-progression.
MR imaging of brain tumors remains a challenge in radiological practice6. To help alleviate this, the Philips 3D APT implementation offers a unique molecular image contrast that aims to facilitate the characterization of gliomas, a specific subset of brain tumors that are often malignant. While conventional MR imaging - using FLAIR, DWI, T2w and gadolinium contrast-enhanced (Gd-CE) T1w MRI - reveals the location and appearance of the tumor, as well as the presence of edema around the lesion and the breakage of the blood-brain barrier, it does not provide sufficient information to conclusively assess tumor grade.
Currently, contrast enhancement is an important indication for a high grade tumor. Unfortunately, this is not conclusive: 37% of non-enhancing tumors are found to be of high grade on histopathological assessment of tumor samples5. Therefore, according to the current standard of care, pathology assessment on excised tumor tissue is always required for a definitive diagnosis. However, tissue sampling also has limitations. Due to tumor heterogeneity, the sampled tissue does not necessarily represent the most malignant part of the tumor tissue, which may hamper the treatment decision.
In the treatment pathway subsequent to the diagnosis of a brain tumor, conventional MRI is regarded as the gold standard to evaluate treatment response. However, accurate classification of responders, non-responders or stable disease is a difficult task in radiology. One reason is that Gd-CE T1w MRI is a contrast based on blood-brain-barrier (BBB) disruption. Contrast-enhancement is a marker for aggressive tumor tissue, but also for many other non-tumorous processes, such as treatment-related inflammation, seizure activity, postsurgical changes, ischemia, acute radiation effects, and radiation necrosis7-9. For example, conventional MRI often fails in differentiating necrotic tissue, e.g. as a radiation therapy treatment side effect, from recurring cancerous tissue4,10, because the BBB is disrupted in both cases.
Thus, an imaging marker that can non-invasively assess glioma grade, comprehensively characterize tumor heterogeneity, and discriminate treatment related necrosis from tumor recurrence in follow-up imaging examinations is highly desirable for an improved clinical practice. Amide Proton Transfer-weighted (APTw) imaging1-4, in addition to conventional multi-parametric MRI, has the potential to become such a molecular imaging marker.
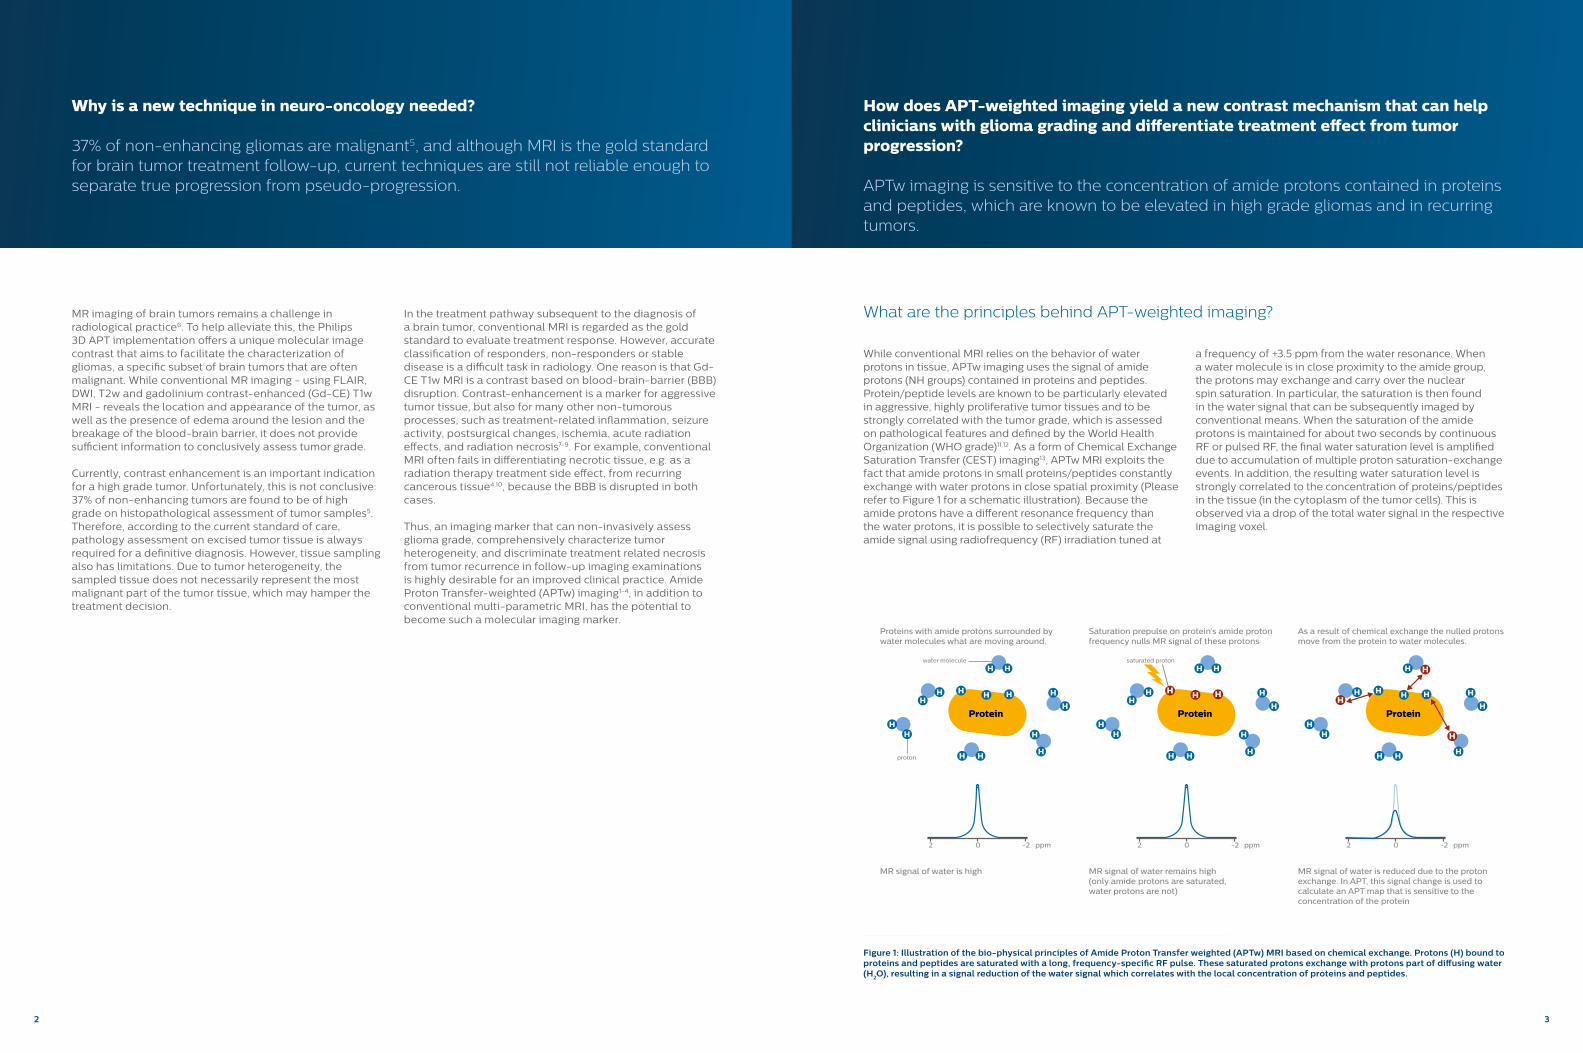
While conventional MRI relies on the behavior of water protons in tissue, APTw imaging uses the signal of amide protons (NH groups) contained in proteins and peptides. Protein/peptide levels are known to be particularly elevated in aggressive, highly proliferative tumor tissues and to be strongly correlated with the tumor grade, which is assessed on pathological features and defined by the World Health Organization (WHO grade)11,12. As a form of Chemical Exchange Saturation Transfer (CEST) imaging13, APTw MRI exploits the fact that amide protons in small proteins/peptides constantly exchange with water protons in close spatial proximity (Please refer to Figure 1 for a schematic illustration). Because the amide protons have a different resonance frequency than the water protons, it is possible to selectively saturate the amide signal using radiofrequency (RF) irradiation tuned at
a frequency of +3.5 ppm from the water resonance. When a water molecule is in close proximity to the amide group, the protons may exchange and carry over the nuclear spin saturation. In particular, the saturation is then found in the water signal that can be subsequently imaged by conventional means. When the saturation of the amide protons is maintained for about two seconds by continuous RF or pulsed RF, the final water saturation level is amplified due to accumulation of multiple proton saturation-exchange events. In addition, the resulting water saturation level is strongly correlated to the concentration of proteins/peptides in the tissue (in the cytoplasm of the tumor cells). This is observed via a drop of the total water signal in the respective imaging voxel.
Figure 1: Illustration of the bio-physical principles of Amide Proton Transfer weighted (APTw) MRI based on chemical exchange. Protons (H) bound to proteins and peptides are saturated with a long, frequency-specific RF pulse. These saturated protons exchange with protons part of diffusing water (H2O), resulting in a signal reduction of the water signal which correlates with the local concentration of proteins and peptides.
What are the principles behind APT-weighted imaging?
How does APT-weighted imaging yield a new contrast mechanism that can help clinicians with glioma grading and differentiate treatment effect from tumor progression?
APTw imaging is sensitive to the concentration of amide protons contained in proteins and peptides, which are known to be elevated in high grade gliomas and in recurring tumors.
Protein
water molecule saturated proton
proton
ProteinProtein
H H HH
H
H
Proteins with amide protons surrounded by water molecules what are moving around.
Saturation prepulse on protein’s amide protonfrequency nulls MR signal of these protons
As a result of chemical exchange the nulled protonsmove from the protein to water molecules.
MR signal of water is high
2 0 -2 ppm
MR signal of water is reduced due to the protonexchange. In APT, this signal change is used to calculate an APT map that is sensitive to theconcentration of the protein
2 0 -2 ppm 2 0 -2 ppm
MR signal of water remains high (only amide protons are saturated, water protons are not)

4 5
How does the Philips imaging platform enable APT-weighted imaging?
Patient-adaptive MultiTransmit 4D delivers long and continuous RF saturation for optimal APTw contrast, mDIXON XD TSE enables an integrated B
0 map for accurate
and fast data acquisition, and color-coded scaled maps facilitate easy reading.
The saturation of the water signal as described is the first step to obtain an APTw image. Subsequently, to generate reliable APTw imaging contrast, the so-called MTR asymmetry (MTR
asym(%)) is assessed. This requires the
acquisition of a Z-spectrum, where a series of water signal levels is measured as a function of different frequency offsets, ∆ɷ (Figure 2). In such a spectrum, the water signal saturation is measured as a function of saturation frequency. For convenience, the water frequency (normally around 4.75ppm in the proton MR spectrum) is placed at 0 ppm in the Z-spectrum. It is found that the signal is saturated partly when the RF frequency is at +3.5 ppm relative to water protons, and drops to a minimum at ∆ɷ= 0 ppm, since at this point, the RF pulse directly saturates the water protons. In order to distinguish the APT signal from several background effects (e.g. direct water saturation and magnetization transfer contributions from semi-solid tissue components such as membranes) an MTR
asym analysis (asymmetry with
respect to the water frequency) is performed based on a voxel-by-voxel analysis.
First, the Z-spectrum is aligned per voxel using information on local magnetic field variation (B
0 field map) such that the
maximum direct water saturation is found exactly at 0 ppm. Next, the asymmetry is evaluated by subtracting the positive frequency side S[+∆ɷ] from the negative side S[-∆ɷ] and normalized to an unsaturated image S
0 (See equation 1).
The resulting MTRasym
value at +3.5 ppm is displayed as percent level (relative to S
0) in the final APTw images, and
referred to as APTw% (Equation 2).
APTw imaging creates a molecular image contrast, which relies on very delicate imaging principles and correct parameter settings. Using the Philips unique dual transmit system with patient adaptive RF shimming14, optimal contrast is achieved between tumor tissue and brain parenchyma by continuously saturating the proton spins at a selective frequency for about two seconds using an RF pulse train15. In conventional imaging, two independent RF sources are used simultaneously and adjusted by phase and amplitude (A1, A2) to homogenize the image intensity in a patient adaptive way. In Philips APTw imaging, the patient-adaptive RF shimming mechanism is used to drive the RF amplifiers in an
alternating fashion by carefully tuning the source amplitudes A1 and A2 for each patient, such that continuous and uniform two-second long RF saturation is achieved (Figure 3). The contributions of the two channels add up over time and lead to spatially homogeneous saturation. In APTw sequences, two different RF shims settings are used in parallel, one for image homogeneity via the imaging pulses like excitation or refocusing, and a different shim set for RF saturation, building a robust and homogeneous APTw contrast. Without dual-transmit, RF saturation pulses for APTw MRI are typically limited to 800 ms or less16.
Figure 2: The Z-spectrum (green) represents the water signal saturation (S/S0) as a function of the frequency offset ∆ɷ of the RF saturation pulse. In the presence of amide groups, there is a signal drop at 3.5 ppm. Furthermore, there is full signal saturation at 0 ppm, because the RF saturation pulse directly saturates the proton spins in the water molecules. From the Z-spectrum, the so-called magnetization transfer asymmetry (MTRasym) (blue) is assessed and measured in percent (%). For APTw imaging, MTRasym is calculated as difference between the Z-spectrum at ∆ɷ=-3.5 ppm and at ∆ɷ=+3.5 ppm, normalized to the S0 image (measured without RF saturation). This specific MTRasym is being referred to as APTw%.
Figure 3: RF transmission with two independent sources RF1 and RF2, alternated over time, is used to create continuous RF saturation for multiple seconds. Patient adaptive RF scanning is used to generate the same level of RF saturation for each channel, by modulating the source amplitudes separately. The contributions of the two channels add up uniformly over time and lead to spatially homogeneous saturation.
MTRasym
(%)=(S-∆ɷ-S∆ɷ)/S
0 Equation 1
MTRasym
(%) = Magnetization Transfer Ratio asymmetry in percent, S-∆ɷ = signal at negative frequency
offset -∆ɷ, S∆ɷ = signal at positive frequency offset ∆ɷ, S0 = signal without RF saturation.
APTw%=MTRasym
[∆ɷ=+3.5ppm](%) Equation 2
APTw% = Amide Proton Transfer weighted percentage, MTRasym
[∆ɷ = +3.5ppm] (%) = Magnetization Transfer Ratio asymmetry at +3.5ppm offset frequency.
How are APT-weighted images acquired?
How is optimal APT-weighted imaging enabled by patient-adaptive MultiTransmit 4D?
APTw imaging requires several ingredients to be able to achieve good image quality on a standard clinical MRI system. First there is the need to have continuous RF saturation for the duration of two seconds. This can only be achieved using a dual transmit system because of RF amplifier limitations. The application of patient-adaptive RF shimming (MultiTransmit 4D) provides equal RF transmission when switching between the two channels. Second, it is
important to use B0 information to correct for frequency
offsets in the Z-spectrum; for this an integrated approach was developed leveraging the mDIXON XD TSE algorithms to derive the B
0 map from the APT acquisition. This facilitates
accurate and fast data acquisition. Third, reading of APTw images is standardized, using an optimized color-coded scale that emphasizes high APTw percentages that can indicate lesions.
S/S0
1
MTRasym (%)
3.5 -3.5 ∆ω (ppm)0
Z-spectrum
APTw(%)t
t
A1
A2
timeRF 1 RF 2 RF 1 RF 2 RF 1 RF 2 RF 1 RF 2
RF1
RF2
RF Source 1
RF Source 1

6 7
Fast integrated B0 correction
APTw MRI examinations in 3D may be very time consuming, because multiple imaging volumes need to be acquired for different RF saturation frequency offsets. Keeping the acquisition time within a clinically acceptable duration of 3-5 minutes while providing suitable robustness, signal-to-noise ratio and spatial resolution further guide the choice of APT imaging parameters. The Philips implementation leverages two major principles to allow an acceptable scan time. First it does not acquire an extensive Z-spectrum, but only nine image volumes at critical frequencies for the Z-spectrum. Second, a B
0 map acquisition for the asymmetry calculation
can be derived from three acquisitions at +3.5ppm using the mDIXON algorithm17,18.
Figure 4 contains a schematic representation of the Philips implementation; in total nine image volumes are acquired at seven different frequency offsets, using a 3D TSE read-out that allows volumetric coverage as well as geometrically undistorted images. We found that nine volumes are the minimum required to precisely assess APTw%, including magnetic field (B
0) field homogeneity correction via a
Lagrange interpolation19 among the different saturation frequency offsets ∆ɷ on both sides of the Z-spectrum. The non-saturated S
0 image is acquired with a large offset of
the RF pulses to allow normalization of APTw%, which is measured in percent (%). The three acquisitions at +3.5 ppm are performed with slightly different echo shifts on the order of 0.5 milliseconds. This allows calculation of a B
0 field map
directly from the APTw image acquisition based on mDIXON algorithms. This B
0 field map is used for the B
0 correction
to allow calculation of APTw% on a voxel-by-voxel basis. With this approach, no separate B
0 field map or separate
Z-spectrum acquisition (WASSR20) is needed because the B0
field information was obtained simultaneously. As B0 fields
may change due to physiological or drift effects during or after the APT image acquisition, the integrated B
0 mapping
approach using mDIXON approach provides enhanced robustness to these B
0 field alterations.
Figure 4: Z-spectrum acquisition as implemented on the Philips platform for APTw MRI. Nine Z-spectral images are acquired (blue dots); eight of those are used to assess the Z-spectrum itself (1-8). Image 9 is the S0 image, acquired at a large ∆ɷ which is used for normalization of APTw%. At 3.5 ppm, three of the Z-spectral images (1,2,3) are acquired using a different echo time shift. This allows calculating a magnetic field (B0) map, via the mDIXON algorithm, known from water-fat turbo spin echo (TSE) imaging. The B0 map is used to correct the Z-spectrum origin on a voxel-by-voxel basis.
How does mDIXON XD TSE shorten the acquisition of APT-weighted images? How does the dedicated APT-weighted image color scale simplify interpretation?
APTw images are shown in a rainbow-type color scale ranging from green (0% APTw%) to red (5% APTw%). This scale is standardized across all APTw images to facilitate fast and easy reading, as well as to enable comparison among hospitals or between pre- and post-treatment images. The advanced reconstruction algorithm combines all information and generates the final color-coded APTw image volumes, using APTw% and a standardized scale of ±5% for display. As additional anatomical reference, image reconstruction also provides an S
0 image volume.
For tumor grading, normal white and grey matter typically appears green, while areas of APTw hyper intensities, appearing yellow or red, may indicate solid tissue areas of grade III and IV gliomas. For treatment follow-up, normal white and grey matter and treatment necrosis typically appear green, while areas of APTw hyper intensities, appearing yellow or red may indicate tumor recurrence in solid tissue areas. Adhering to routine radiology procedures, all acquired image contrasts are viewed in concert, aiding identification of potential solid tumor areas via anatomical T1w, T2w and/or fluid-enhanced FLAIR images that can be scored for APTw hyper-intensity (yellow/red) to assist tumor grading.
In the literature on APTw MRI, it is common to show brain images in which the skull and the fat around the skull have been removed. Skull stripping is not performed for APTw imaging on the system, because such algorithms are often not reliable and could potentially conceal tumor tissue for example near the cortex. Thus, a colored rim related to fatty tissue in the skull may be visible around the brain, which is visually distinct from the relevant brain areas and is easily disregarded during the radiological reading process.
For ROI-based measurements on APTw images it is important to note that the contrast should be assessed using the difference between normal appearing brain (white or grey matter, preferably contra-lateral to the lesion) and tumor tissue values, which is called ∆MTR
asym21-24. The APTw
technique may show a small overall offset - less than 0.5% APTw% - if comparing absolute APTw% values, therefore it is important to follow the procedures described in the literature for ROI definitions in grading applications. Furthermore the highest tumor grade found in sub-regions of the lesion is the determinant for the overall grade. Thus, in the literature21-24, several small regions of interest (ROI) were defined on APTw images guided by the highest levels of APTw contrast observed in solid parts of the lesion. Alternatively, a histogram can be calculated within a large ROI including the tumor region and the highest grade shown by APTw contrast is assessed via the 90-percentile of the signal distribution25.
Besides gliomas, other lesion types - in particular meningiomas, lymphomas26, and metastases27 - may be depicted as APTw hyper-intensity, however to date there is insufficient evidence to understand the implications of high APTw signals in these pathologies. Furthermore, fatty tissues or tissue fluids, for example cysts, blood vessels or hemorrhage, may show up as APTw hyper-intensity due to their high protein content. It is therefore of utmost importance to read the APTw images carefully and always in combination with images from a standard multi-parametric tumor protocol.
3.5 0 -3.5 ∆ω (ppm)
S/S0
1
123
4 5
6 7 8
9Z-spectrum

8 9
What are the clinical benefits of APT-weighted imaging?
APTw imaging helps to differentiate between low grade and high grade gliomas and to differentiate between treatment effect and tumor progression.
APTw imaging is a new MR imaging contrast in brain tumor imaging. Because of its unique capability to assess the molecular composition of the tissue, it provides new information in addition to regular, multi-parametric tumor imaging protocols.
Some of the clinical studies using APTw imaging address pre-operative characterization of gliomas, focusing on imaging-based assessment of the tumor grade. It has been demonstrated that APTw imaging correlates with the histopathological grade of a tumor specimen, often in conjunction to conventional imaging, perfusion and diffusion MRI23-25,28,29. Case 1 shows examples of the appearance of APTw images in different tumor grades. One should also be aware that histopathological grading according to the 2007 WHO guidelines for classification of tumors of the central nervous system11 has been used in all of these studies. In the 2016 update of these guidelines12 the advice is to predominantly classify brain tumors based on genetic profile (IDH status) rather than on histopathological features. The first study with APTw imaging based on these new guidelines shows promising results in being able to discriminate IDH wild-type from IDH mutation in histopathology based grade II tumors30.
In addition to pre-operative grading, some studies used APTw imaging to assess the tumor heterogeneity and therewith guide surgical procedures to remove the most malignant parts of the tumor for further analysis31. This assessment will decrease the chance that the malignancy of a tumor is underestimated due to an inappropriate biopsy location. Case 2 demonstrates the use of APTw imaging for biopsy guidance, as well as the correlation between the histopathological assessment (cell count and Ki-67 staining) of excised tumor tissue with APTw values.
Very important applications of APTw imaging are expected in the post-treatment domain. It is standard practice to perform surgical resection of the tumor, followed by chemo and radiation therapy. Subsequently the patient receives MRI scans as part of treatment follow-up. However, there can be significant changes to the tumor area and the surrounding brain tissue due to the treatment. Thus, it is difficult to discriminate treatment-induced effects, such as pseudo-progression and radiation necrosis, from tumor recurrence. Several studies have shown that APTw imaging is superior in discriminating between treatment-induced effects and true tumor progression, whether or not in conjunction with conventional MR imaging contrasts as well as more advanced methods such as perfusion (DSC and DCE) and spectroscopy22,32,33. Cases 3, 4 and 5 are exemplary for the added value of APTw imaging in the post-surgical phase.
CASE 1: Differentiation of low-grade from high-grade gliomas is facilitated by APTw imagingCourtesy: Kyushu University Hospital, Kyushu, Japan. Dr. Togao. APTw images have been shown to become increasingly hyperintense with higher tumor grade. These findings are consistent with Togao et al., Grading diffuse gliomas without intense contrast enhancement by amide proton transfer MR imaging: comparisons with diffusion- and perfusion-weighted imaging25.
T2w
T2w
T2w
FLAIR
FLAIR
FLAIR
Gd-T1w
Gd-T1w
Gd-T1w
APTw
APTw
APTw
9
Patient 1: 38-year-old patient with confirmed diffuse astrocytoma, WHO grade II, IDH-1 mutant, MIB-1 index 4.4%. In this case, both conventional and APTw images indicated low-grade glioma. APTw images were useful for the confirmation. The tumor was surgically resected, and the patient is still alive without a recurrence for 3 years.
Patient 2: 47-year-old patient, anaplastic astrocytoma, WHO grade III, IDH-1 mutant, MIB-1 index 7.1%. In this case, preoperative grading by conventional MRI was difficult since the lesion showed only a slight enhancement after a Gd administration. However, APTw images showed high APTw signals, which indicated high-grade glioma. This was a recent case and no follow-up studies were performed yet.
Patient 3: 56-year-old patient, glioblastoma, WHO grade IV, IDH-wild type, MIB-1 index 39.7%. The APTw image was useful for the determination of the location of biopsy. Since the tumor showed high signal intensity throughout the tumor on APTw images, it was considered that biopsy can be performed in any parts of the lesion. This was a recent case and no follow-up studies were performed yet.

10 11
CASE 3: APTw imaging helps to assess treatment effectiveness Courtesy: ASAN Medical Center, Seoul, South-Korea. Dr. J.E. Park & Dr. H.S. Kim
CASE 2: APTw signal correlates with histopathology of biopsy sitesCourtesy: Johns Hopkins University, Baltimore, USA. Dr. S. Jiang, Dr. J. Zhou & Dr. P.C.M. van Zijl.
Two cases of patients with different types of tumors, pre- and post-treatment. Patient 1: APTw imaging can depict tumor progression: A 34-year old patient diagnosed with anaplastic astrocytoma, IDH-mutant. A contrast-enhancing mass located at the posterior aspect of the surgical cavity. The patient received temozolomide as the second line treatment, but the tumor progressed. Note prominent increase in the APTw value on APTw imaging on the follow up.
Patient 2: APTw imaging can become an early biomarker for antiangiogenic treatment: A 30-year old patient diagnosed with glioblastoma, IDH-wildtype from the stereotactic biopsy. There is an irregular-shaped, contrast-enhancing mass in the bilateral hypothalamus. The patient has treated with three cycles of antiangiogenic treatment (bevacizumab, Avastin). Though conventional MR imaging showed equivocal decrease in the contrast-enhanced T1-weighted imaging or fluid-attenuated inversion recovery, APTw imaging showed prominent decrease in the value within the tumor solid portion. The tumor stabilized during the follow-ups.
Conventional MR, APTw MR, and microscopic images for a patient with a histopathologically confirmed glioblastoma in the right parietal lobe. (A) Conventional MR images demonstrate a peripherally Gd-enhancing mass with central coagulative necrosis (showing T2w hyperintensity and substantially suppressed water signals on FLAIR image), as well as mild adjacent vasogenic oedema. The APTw image shows hyperintensity in the Gd-enhancing area, compared to contralateral, normal appearing tissues. (B) Stereotactic site on the clinically obtained Gd-T1w images. One specimen was obtained from the rim of the tumour (with Gd enhancement
and clear APTw hyperintensity). (C) Microscopic examination revealed extremely high cellularity (2468/FOV), prominent proliferation, and mitotic activity (Ki-67 of 22.3%), as well as the vascular proliferation typical of glioblastoma. APTw imaging intensities of individual specimens and correlation analysis with histopathology indices: the correlation analysis results (C) between APTw intensities and cell count, as well as (D) between APTw intensities and Ki-67 index32. This graph is reproduced from Jiang et al.31 with permission of the publisher.
Pre-treatment
Pre-treatment
Post-treatment
(three cycles of bevacizumab)
Post-treatment
(temozolomide)
APTw
APTw
Gd-T1w
Gd-T1w
Gd-T1w
Gd-T1w
FLAIR
FLAIR
FLAIR
FLAIR
APTw
Ki-67H&E
Biopsy Site
Gd-T1wT1wT2wA
B
D
C
FLAIR
APTw
APTw
10 11
Patient 1
Patient 2
5
4
3
2
1
00 0600
Cell count (Cells/FOV)
AP
Tw (
%)
1200 1800 2400 20 40 60
R = 0.757P < 0.001
n = 70
5
4
3
2
1
0
Ki-67 (%)
AP
Tw (
%)
R = 0.538P < 0.001
n = 57
5
4
3
2
1
00 0600
Cell count (Cells/FOV)
AP
Tw (
%)
1200 1800 2400 20 40 60
R = 0.757P < 0.001
n = 70
5
4
3
2
1
0
Ki-67 (%)
AP
Tw (
%)
R = 0.538P < 0.001
n = 57

12 13
CASE 5: Glioblastoma recurrence after surgery detected on APTw imagesCourtesy: Technical University Munich, Klinikum Rechts der Isar, Munich, Germany. Dr. B. Wiestler & Dr. F. Liesche.
CASE 4: APTw imaging shows post-surgical tumor recurrence in a metastatic brain lesionCourtesy: Phoenix Childrens Hospital, Phoenix, USA. Dr. J.G. Curran & Dr. J.H. Miller.
A 52-year-old male patient had a progressive impairment in his right field of vision. Upon neurological examination, a hemianopsia to the right and mild psychomotor slowing was noted. Otherwise, clinical examination was normal.
MRI demonstrated a centrally necrotic tumor in the left occipital lobe with extensive perifocal FLAIR-hyperintense edema. CBV was markedly increased, speaking to a high-grade glioma (pre-operative MRI).
Following gross total resection of the contrast-enhancing tumor, a pathological diagnosis of a WHO grade IV glioblastoma, IDHwt, MGMT promoter methylated was made. According to the Stupp protocol, a combined radio-chemo-therapy with temozolomide was begun, which was well tolerated.
However, the MRI routinely taken four weeks after completion of the radiotherapy showed a strong linear enhancement along the resection cavity as well as a newly occurred, contrast-enhancing nodule just lateral to it. CBV here was only slightly increased. APTw imaging on the other hand showed a strong hyperintensity in this area (see post-treatment images). In our interdisciplinary tumor board, a decision for surgery was made. In good agreement with the APTw imaging, pathological analysis found many vital glioblastoma cells and only minor (therapy-associated) necrosis. This clinical case demonstrated the importance of APTw imaging in distinguishing necrosis caused by treatment effect from tumor progression.
A ten-year-old patient underwent Ewing’s sarcoma tumor resection 7 years ago, but was found to now have a large metastatic lesion in the brain. This lesion shows clearly increased APTw signal.
Immediately post-resection, MRI was again performed. T2-weighted and post-contrast T1-weighted images are quite inconclusive for distinguishing residual tumor tissue from postoperative tissue changes. On the APTw image some high signal is still seen, which would suggest residual tumor tissue.
In later follow-up scans the post-contrast T1-weighted images suggest recurrent tumor growth. It would be interesting to study the predictive value of APTw imaging in a large patient group.
Immediate post op
Gd-T1w
Gd-T1w
2 months later
T2w
T2w
10 monhts later
APTw
APTw
MRI with APT post resection
Immediately post resection MRI was again performed. T2-
weighted and postcontrast T1-weighted images are quite
inconclusive for distinguishing residual tumor tissue from
postoperative tissue changes. On the APTw image some high
signal is still seen, which would suggest residual tumor tissue.
Large metastatic brain lesion
This 10-year-old patient underwent Ewings’s sarcome tumor
resection 7 years ago, but was found to now have a large
metastatic lesion in the brain. This lesion shows clearly
increased APTw signal.
Follow-up over time
In later follow-up scans the post-contrast T1-weighted images
suggest recurrent tumor growth. So, it would be interesting to
study the predictive value of APTw in a large patient group.
12 13
Post-treatment MRI
(recurrence)
Pre-surgical MRI
(tumor detection)
FLAIR
FLAIR
Gd-T1w
Gd-T1w
CBV (on top of Gd-T1w)
CBV (on top of Gd-T1w)
APTw

14 15
Conclusion By generating a contrast-agent free MRI contrast, which is based on the concentration levels of endogenous cellular proteins in tissue that are typically present in brain tumors, 3D APT can differentiate between low-grade and high-grade tumor tissues. For glial tumors of the brain, this ability has been already proven in many clinical investigations using equivalent research prototype implementations of APTw MRI. Post-treatment, APTw imaging also has been shown to aid clinicians in differentiating treatment-related effects like treatment necrosis from true tumor progression. The Philips 3D APT implementation leverages unique features of the Philips platform to enable the use of this unique imaging contrast in clinically achievable scan times. The patient-adaptive MultiTransmit 4D implementation is used to saturate amide groups for 2 seconds, allowing optimal exchange with water protons. Furthermore, the smart Z-spectrum acquisition with an integrated, mDIXON-based, B
0 map allows for robustness against B
0 field fluctuations
during the measurement. Lastly, APTw image reading is simplified by a standardized, fixed, color scale.
Future of APT-weighted imagingIn the future, APTw imaging may become beneficial in pediatric tumor exams as an alternative to contrast-enhanced scans that are frequently used for long term disease management, which are under scrutiny for possible negative side effects, especially in young subjects. It remains to be shown for this young patient cohort that APTw MRI can reliably detect tumor recurrence or progression for the relevant tumor sub-species and therewith replace post-contrast scans.
In addition to APTw imaging of brain tumors, there are other promising applications of this new MR contrast mechanism. In particular, stroke tissue may be characterized based on pH effects of ischemic acidosis, which was the very first proposed application of APTw imaging1,34. For APTw tumor imaging of anatomies in the body, motion compensation as well as compensation techniques for fatty tissues need to be further developed to generate robust and reliable APTw images. That being said, early results in liver, breast and prostate have been encouraging.
15
References
1 Zhou, J., Payen, J. F., Wilson, D. A., Traystman, R. J. & Van Zijl, P. C. M.
Using the amide proton signals of intracellular proteins and peptides to
detect pH effects in MRI. Nature Medicine. 2003. 9(8):1085-1090.
2 Zhou, J., Lal, B., Wilson, D. A., Laterra, J. & van Zijl, P. C. Amide proton
transfer (APT) contrast for imaging of brain tumors. Magn Reson Med.
2003. 50(6):1120-1126.
3 Jones, C. K., Schlosser, M. J., van Zijl, P. C., Pomper, M. G., Golay, X. &
Zhou, J. Amide proton transfer imaging of human brain tumors at 3T.
Magn Reson Med. 2006. 56(3):585-592.
4 Zhou, J., Tryggestad, E., Wen, Z., Lal, B., Zhou, T., Grossman, R., ..., van
Zijl, P. C. Differentiation between glioma and radiation necrosis using
molecular magnetic resonance imaging of endogenous proteins and
peptides. Nature Medicine. 2011. 17(1):130-134.
5 Scott, N. J., Brasher, M. A. P., Sevick, J. R., Rewcastle, B. N. & Forsyth, A.
P. How often are nonenhancing supratentorial gliomas malignant? A
population study. Neurology. 2002. 59(6):947-949.
6 TMTG Market Survey 2016.
7 Rees, J. Advances in magnetic resonance imaging of brain tumours.
Current opinion in neurology. 2003. 16(6):643-650.
8 Wen, P. Y., Macdonald, D. R., Reardon, D. A., Cloughesy, T. F., Sorensen, A.
G., Galanis, E., ..., Chang, S. M. Updated response assessment criteria for
high-grade gliomas: response assessment in neuro-oncology working
group. Journal of clinical oncology. 2010. 28(11):1963-1972.
9 Waldman, A. D., Jackson, A., Price, S. J., Clark, C. A., Booth, T. C., Auer,
D. P., ..., Rees, J. H. Quantitative imaging biomarkers in neuro-oncology.
Nature Reviews Clinical Oncology. 2009. 6(8):445-454.
10 Kumar, A. J., Leeds, N. E., Fuller, G. N., Van Tassel, P., Maor, M. H., Sawaya,
R. E. & Levin, V. A. Malignant gliomas: MR imaging spectrum of radiation
therapy- and chemotherapy-induced necrosis of the brain after
treatment. Radiology. 2000. 217(2):377-384.
11 Louis, D. N., Ohgaki, H., Wiestler, O. D., Cavenee, W. K., Burger, P. C.,
Jouvet, A., ..., Kleihues, P. The 2007 WHO classification of tumours of the
central nervous system. Acta Neuropathologica. 2007. 114(2):97-109.
12 Louis, D. N., Perry, A., Reifenberger, G., von Deimling, A., Figarella-
Branger, D., Cavenee, W. K., ..., Ellison, D. W. The 2016 World Health
Organization Classification of Tumors of the Central Nervous System: a
summary. Acta Neuropathologica. 2016. 131(6):803-820.
13 Van Zijl, P. C. M. & Yadav, N. N. Chemical exchange saturation transfer
(CEST): What is in a name and what isn't? Magnetic Resonance in
Medicine. 2011. 65(4 DOI - 10.1002/mrm.22761):927.
14 Harvey, P. & Hoogeveen, R. MultiTransmit parallel RF transmission
technology. Setting the benchmark in clinical high-field imaging. 2009.
15 Zhao, X., Wen, Z., Huang, F., Lu, S., Wang, X., Hu, S., ..., Zhou, J. Saturation
power dependence of amide proton transfer image contrasts in human
brain tumors and strokes at 3 T. Magn Reson Med. 2011. 66(4):1033-1041.
16 Togao, O., Hiwatashi, A., Keupp, J., Yamashita, K., Kikuchi, K., Yoshiura, T.,
..., Honda, H. Amide Proton Transfer Imaging of Diffuse Gliomas: Effect of
Saturation Pulse Length in Parallel Transmission-Based Technique. PLoS
One. 2016. 11(5):e0155925.
17 Perkins, T. G., Duijndam, A., Eggers, H., de Weerdt, E. & Rijckaert, Y. H. E.
The next generation fat-free imaging. 2015.
18 Eggers, H., Brendel, B., Duijndam, A. & Herigault, G. Dual‐echo Dixon
imaging with flexible choice of echo times. Magnetic Resonance in
Medicine. 2011. 65(1 DOI - 10.1002/mrm.22578):96.
19 Togao, O., Keupp, J., Hiwatashi, A., Yamashita, K., Kikuchi, K., Yoneyama,
M. & Honda, H. Amide proton transfer imaging of brain tumors using
a self-corrected 3D fast spin-echo dixon method: Comparison With
separate B0 correction. Magn Reson Med. 2017. 77(6):2272-2279.
20 Kim, M., Gillen, J., Landman, B. A., Zhou, J. & van Zijl, P. C. Water
saturation shift referencing (WASSR) for chemical exchange saturation
transfer (CEST) experiments. Magn Reson Med. 2009. 61(6):1441-1450.
21 Wen, Z., Hu, S., Huang, F., Wang, X., Guo, L., Quan, X., ..., Zhou, J. MR
imaging of high-grade brain tumors using endogenous protein and
peptide-based contrast. Neuroimage. 2010. 51(2):616-622.
22 Ma, B., Blakeley, J. O., Hong, X., Zhang, H., Jiang, S., Blair, L., ..., Zhou,
J. Applying amide proton transfer-weighted MRI to distinguish
pseudoprogression from true progression in malignant gliomas.(Report).
Journal of Magnetic Resonance Imaging. 2016. 44(2 DOI - 10.1002/
jmri.25159):456-462.
23 Zhou, J., Zhu, H., Lim, M., Blair, L., Quinones-Hinojosa, A., Messina,
S. A., ..., Blakeley, J. O. Three-dimensional amide proton transfer MR
imaging of gliomas: Initial experience and comparison with gadolinium
enhancement. J Magn Reson Imaging. 2013. 38(5):1119-1128.
24 Togao, O., Yoshiura, T., Keupp, J., Hiwatashi, A., Yamashita, K., Kikuchi,
K., ..., Honda, H. Amide proton transfer imaging of adult diffuse gliomas:
correlation with histopathological grades. Neuro Oncol. 2014. 16(3):441-
448.
25 Togao, O., Hiwatashi, A., Yamashita, K., Kikuchi, K., Keupp, J., Yoshimoto,
K., ..., Honda, H. Grading diffuse gliomas without intense contrast
enhancement by amide proton transfer MR imaging: comparisons with
diffusion- and perfusion-weighted imaging. Eur Radiol. 2017. 27(2):578-
588.
26 Jiang, S., Yu, H., Wang, X., Lu, S., Li, Y., Feng, L., ..., Wen, Z. Molecular MRI
differentiation between primary central nervous system lymphomas
and high-grade gliomas using endogenous protein-based amide proton
transfer MR&hellip. European Radiology. 2016. 26(1):64-71.
27 Yu, H., Lou, H., Zou, T., Wang, X., Jiang, S., Huang, Z., ..., Wen, Z. Applying
protein-based amide proton transfer MR imaging to distinguish solitary
brain metastases from glioblastoma. European Radiology. 2017.
27(11):4516-4524.
28 Zhao, X., Wen, Z., Zhang, G., Huang, F., Lu, S., Wang, X., ..., Zhou, J.
Three-dimensional turbo-spin-echo amide proton transfer MR imaging
at 3-Tesla and its application to high-grade human brain tumors. Mol
Imaging Biol. 2013. 15(1):114-122.
29 Choi, Y. S., Ahn, S. S., Lee, S.-K. H., Chang, J. H., Kang, S.-G. H., Kim, S. H. &
Zhou, J. H. Amide proton transfer imaging to discriminate between low-
and high-grade gliomas: added value to apparent diffusion coefficient
and relative cerebral blood&hellip. European Radiology. 2017. 27(8):3181-
3189.
30 Jiang, S., Zou, T., Eberhart, C. G., Villalobos, M. A. V., Heo, H. Y., Zhang, Y.,
..., Zhou, J. Predicting IDH mutation status in grade II gliomas using amide
proton transfer‐weighted (APTw) MRI. Magnetic Resonance in Medicine.
2017. 78(3 DOI - 10.1002/mrm.26820):1100-1109.
31 Jiang, S., Eberhart, C. G., Zhang, Y., Heo, H.-Y., Wen, Z., Blair, L., ..., Zhou,
J. Amide proton transfer-weighted magnetic resonance image-guided
stereotactic biopsy in patients with newly diagnosed gliomas. European
Journal of Cancer. 2017. 839-18.
32 Park, J. E., Kim, H. S., Park, K. J., Kim, S. J., Kim, J. H. & Smith, S. A. Pre- and
Posttreatment Glioma: Comparison of Amide Proton Transfer Imaging
with MR Spectroscopy for Biomarkers of Tumor Proliferation. Radiology.
2016. 278(2):514-523.
33 Park, K. J., Kim, H. S., Park, J. E., Shim, W. H., Kim, S. J. & Smith, S. A. Added
value of amide proton transfer imaging to conventional and perfusion
MR imaging for evaluating the treatment response of newly diagnosed
glioblastoma. Eur Radiol. 2016. 26(12):4390-4403.
34 Heo, H. Y., Zhang, Y., Burton, T. M., Jiang, S., Zhao, Y., Van Zijl, P. C. M.,
..., Zhou, J. Improving the detection sensitivity of pH‐weighted amide
proton transfer MRI in acute stroke patients using extrapolated semisolid
magnetization transfer&hellip. Magnetic Resonance in Medicine. 2017.
78(3 DOI - 10.1002/mrm.26799):871-880.
Abbreviations
Abbreviation Explanation
APTw Amide Proton Transfer weighted
B0
Static magnetic field
BBB Blood Brain Barrier
CBV Cerebral Blood Volume
CE Contrast Enhanced
CEST Chemical Exchange Saturation Transfer
DCE Dynamic Contrast Enhanced
DSC Dynamic Susceptibility Contrast
DWI Diffusion Weighted Imaging
FLAIR Fluid Attenuation Inversion Recovery
Gd Gadolinium
GFAP Glial Fibrillary Acidic Protein, histological staining to determine if tumor is of glial origin
H&E Hematoxylin and Eosin stain, standard histological staining to identify cell nuclei
IDH Isocitrate Dehydrogenase, enzyme that can be mutated in gliomas
Ki-67 Monoclonal antibody, targeting cell proliferation-related antigen. In clinical practice MIB-1 is preferred to target the same process.
MGMT O6-methylguanine-DNA-methyltransferase, enzyme that can be mutated in gliomas
MIB-1 Monoclonal antibody, targeting cell proliferation-related antigen.MIB-1 is in clinical practice preferred over Ki-67.
MRI Magnetic Resonance Imaging
MTR Magnetization Transfer Ratio
ppm Parts per million
RF Radiofrequency
ROI Regions of Interest
S0
Equilibrium magnetization
SWI Susceptibility Weighted Imaging
TSE Turbo Spin Echo
WHO World Health Organization
wt Wild Type
∆ɷ Frequency offset
ɷ Frequency

© 2018 Koninklijke Philips N.V. All rights reserved. Specifications are subject to change without notice. Trademarks are the property of Koninklijke Philips N.V. or their respective owners.
4522 991 36891 * JUN 2018
How to reach usPlease visit [email protected]