amgen inc 2012 annual report
TRANSCRIPT
7/27/2019 Amgen Inc 2012 Annual Report
http://slidepdf.com/reader/full/amgen-inc-2012-annual-report 1/150
Dear Shareholders,
2012 was an exceptional year or Amgen.
We delivered or shareholders, positioned
the company or long-term growth, andcontinued to ulill our mission to serve
patients. Revenues rose 11 percent to
$17.3 billion. Adjusted earnings per share
increased 22 percent to $6.51.* Total
shareholder return in 2012 was 36 percent,
outperorming the S&P 500 and our peer
group. Our perormance in 2012 relects
strength across our product portolio, eective
commercial execution, commitment to
operational eiciency, dedication o sta, and
sound capital allocation decisions. Building on
this success, we entered 2013 with momentum
and conidence in our ability to execute our
long-term strategy o reaching more patients
in more markets around the world.
Delivering for Shareholders
More than a year ago, we made a commitment
to return signicant capital to shareholders
in the orm o dividends and share buybacks,
and we have delivered on that promise. In
early 2013, we completed the $10-billion
stock repurchase program announced in
October 2011. Since January 2011, we have
repurchased more than 20 percent o our
outstanding shares. In addition, since the
initiation o our rst dividend in July 2011,
we have raised the dividend twice over the
previous quarterly amount by an average o
30 percent.
Continued Product Momentum
Amgen’s product sales grew 9 percent in
2012. Sales growth was led by Enbrel®
(etanercept), with solid contributions rom
Prolia® (denosumab), XGEVA® (denosumab),
Sensipar® (cinacalcet), Nplate® (romiplostim),
and Vectibix® (panitumumab). In 2012, two o
our products achieved more than $4 billion in
sales; three other products achieved more
than $1 billion in sales, as did our recently
launched denosumab ranchise. We also saw
our European business continue to grow in a
challenging economic environment.
Our products continue to show strong
opportunities or growth. In terms o value,
ENBREL remains the leading biologic in the
ast-growing rheumatology and dermatology
segments, with a proven track record. In addition,
by the end o 2013, the prot share we have in
place with Pzer Inc. or ENBREL transitions to
a signicantly lower royalty. As a result, the
contributions to Amgen’s protability rom ENBREL
will grow substantially starting in 2014.
There are also continued unmet medical needs
that can be addressed by Neulasta®
(peglgrastim)/NEUPOGEN® (Filgrastim), including
many breast cancer patients undergoing
myelosuppressive therapy associated with a
clinically signicant risk o ebrile neutropenia.
We continue to launch XGEVA® in Europe and
expand access or Prolia® in the U.S. We expect
that EPOGEN® (epoetin ala) and Aranesp®
(darbepoetin ala) will remain important therapiedue to a long history o use by physicians in the
treatment o anemia. Sensipar® /Mimpara®,
indicated or the treatment o secondary
hyperparathyroidism in patients with chronic
kidney disease who are on dialysis, is on track
to exceed $1 billion in sales in 2013.
Emerging Late-Stage Pipeline
In 2012, we made clear progress in advancing
our pipeline. Our pipeline ocuses on innovative
biological targets and molecules that address
serious illnesses and areas o high unmet medi
need; and this refects our strategic ocus o
unlocking the potential o biology or patients. A
Amgen, we take a “biology rst” approach, whic
means that we examine the undamental
mechanisms o human biology to unravel the
complexities o disease in order to interdict them
with our medicines. From 2013 to 2016, we
expect to generate pivotal data or eight o our
pipeline molecules. As o early 2013, we have
six investigational molecules in phase 3 trials
and ve investigational molecules in phase 2 tri
to treat diseases in areas including cardiovascu
disease, bone disease, infammation, nephrolog
oncology, and neuroscience.
AMG 145 is one o many therapies in our pipeli
that shows great promise. Consistent with
Amgen’s strategic ocus on combating serious
Letter toShareholders
*“Adjusted” earnings per share is a non-GAAP nancial measure. See back page or reconciliation to U.S. generally accepted accounting principles (GAAP).
Robert A. Bradway, Chairman and Chief Executive Officer, Amgen Inc.
7/27/2019 Amgen Inc 2012 Annual Report
http://slidepdf.com/reader/full/amgen-inc-2012-annual-report 2/150
illnesses, AMG 145 has tremendous potential to
impact the incidence o cardiovascular disease, aleading cause o death in the U.S. and around the
world. Although there are medicines on the market
today or people with hypercholesterolemia,
millions o people are not currently meeting their
treatment goals and could benet rom additional
reduction o low-density lipoprotein cholesterol
(LDL-C), a known contributor to cardiovascular
disease. AMG 145 could be one o the rst
molecules to address this unmet need.
Greater Combined Value through Acquisitionsand Partnership
In 2012, we made a number o acquisitions that
improved our discovery research capabilities and
advanced our global expansion eorts. The
acquisition o deCODE Genetics, a global leader in
human genetics, headquartered in Reykjavik,
Iceland, greatly enhanced our ability to identiy
and validate human disease targets. We believe
that incorporating genetic research into our
research and development eorts will enhance
our ability to develop meaningul therapies or
patients. Using detailed genetic and medical
inormation rom hundreds o thousands o
individuals, deCODE has discovered key genetic
risk actors or dozens o common diseases
ranging rom cardiovascular disease to cancer.
This expanded capability at Amgen to correlate
two large sets o data—variations in the sequence
o the genome and variations in phenotype (such
as a disease or a physical trait)—will enable us to
more eciently pursue development o moleculesthat combat serious illnesses. Given that two
molecules already in our pipeline—AMG 145 and
romosozumab (AMG 785)—were identied and
validated by human genetics, we are very
enthusiastic about what we can achieve as a
result o this new addition to Amgen.
Amgen’s acquisition o Micromet, announced in
early 2012, has already become an important
complement to our oncology pipeline. The
acquisition included blinatumumab, an innovativeoncology molecule in phase 2 clinical
development or acute lymphoblastic leukemia
(ALL), and a validated technology platorm known
as BiTE® (bispecic T-cell engager) with broad
potential clinical applications. We are excited to
see how this antibody technology could be
applied to additional cancers.
Adding to our porto lio o therapies to combat
kidney disease, Amgen’s 2012 acquisition o
KAI Pharmaceuticals included the lead product
candidate AMG 416. This novel peptide is being
studied initially as an intravenous treatment o
secondary hyperparathyroidism in patients with
chronic kidney disease who are on dialysis.
In support o global expansion, Amgen announced
in 2012 the acquisition o Mustaa Nevzat
Pharmaceuticals, one o the oldest pharmaceutical
companies in Turkey and one o the country’s
rst manuacturers o injectable products. The
acquisition signicantly expands Amgen’s
presence in Turkey and the surrounding region,
including several ast-growing, priority markets
or Amgen.
Amgen also entered into an agreement with
AstraZeneca Plc to jointly develop and
commercialize ve monoclonal antibodies rom
Amgen’s clinical infammation portolio including
brodalumab (AMG 827), currently in phase 3
clinical studies or the treatment o psoriasis.This collaboration will provide us with additional
resources to optimally advance our portolio.
Transforming Biologics Manufacturing
We have grown to be a leading biotechnology
company not just by discovering and developing
innovative molecules but also by playing a
leading role in manuacturing and delivering them
to patients. The manuacturing process or
large-molecule biologics is highly complex
and contains greater variability compared withthe manuacture o small molecule medicines
that come in pill orm. Continuing to lead the
way in biologics manuacturing, we announced
in early 2013 plans to construct an innovative
new acility in Singapore. The acility will initially
ocus on expanding Amgen’s capability or
manuacturing monoclonal antibodies through
a new manuacturing process that will require
lower capital investment and deliver greater
fexibility while maintaining our commitment to
reliably deliver our medicines to every patient,
every time.
Entering a Growing Biosimilars Market
In early 2013, we announced plans to develop
and manuacture six biosimilar molecules: our in
the oncology disease area and two in
infammation. With expectations to launch our rst
biosimilar product in 2017, we will be entering a
rapidly growing segment o the biologics market.
Further Differentiation through Patient-
Friendly Delivery Devices
Another important initiative under way at Amgen
involves combining our innovative medicines with
patient-riendly delivery devices. While innovative
medicines or patients with serious illnesses will
remain a key dierentiator or Amgen, we are
conident that the increasing use o delivery
devices to improve the patient experience will be
a urther dierentiator or physicians and
patients in an increasingly competitive globalmarketplace.
Momentum in Global Expansion
We recently advanced our strategy or global
expansion on a number o ronts and will
continue to grow internationally. As o 2012, we
were selling our products in 56 countries and
expect to reach 75 countries by 2015. Plans are
under way to enter Japan, the second-largest

7/27/2019 Amgen Inc 2012 Annual Report
http://slidepdf.com/reader/full/amgen-inc-2012-annual-report 3/150
pharmaceutical market in the world, through
partnership; and we are pursuing an entry intoChina, where we expect to be launching our irst
product by 2015.
As Amgen grows global ly, we expect to reach
more patients with the medicines we currently
have on the market and with therapies rom our
late-stage pipeline. A great example o the latter
is rilotumumab (AMG 102), a medicine in phase
3 development or the treatment o gastric
cancer. Every year, more than hal a million
people die o this disease in Asia. Bringing this
new therapy to this region o the world could
represent a very big opportunity to serve a large
unmet medical need.
Smooth Leadership Transition
In 2012, Amgen began the execution o a
planned leadership transition with the retirement
o Kevin Sharer, Amgen’s third chairman and
chie executive oicer. I would like to recognize
the extraordinary leadership o my riend and
predecessor. Kevin retired rom Amgen ater a
20-year career with the company, which included
12 years as chie executive oicer. Simply put,
Amgen would not be the company it is today
were it not or Kevin’s leadership and
determination to make Amgen the world’s best
human therapeutics company. One o the ways
we will honor Kevin’s legacy is by building upon
his many accomplishments—and by maintaining
ocus on our mission to serve patients.
In my irst year as chie executive oicer, I have
had the opportunity to speak with hundreds o
our sta around the world; and regardless o
which acility I visit, my impression is the same:
we are strongly aligned with our mission to serve
patients. Having also spent time with doctors,
other healthcare providers, and patients, I have
ound that our constituents see the beneits o
our approach to unlocking the potential o
biology or patients through advancing break-
through medicines and manuacturing thosemedicines saely and eectively.
Looking ahead, I am conident that we will
deliver or patients and shareholders. Our
strategy is sound, our sta members are aligned,
and our culture—rooted in science and
innovation—is strong, having enabled us to
reach more than 25 million patients around the
world with our medicines.
Robert A. Bradway
Chairman and Chie Executive Ofcer
Awards and Accolades
• R&D Directions : For the second year in a row
Amgen received Best Biotech Pipeline honors
rom R&D Directions .
• Most Innovative Drug of the Year : Amgen
Poland was awarded the title or Prolia®
(denosumab) in a competition organized by the
Working Group or Innovation in Healthcare.
• Prix Galien : Prolia® (denosumab) was award
the Prix Galien in Switzerland, judged by a pan
o eminent clinicians, toxicologists, pharmacolo
gists, and pharmacists.
• Panorama Award : Prolia® (denosumab)
received top honors in Spain in 2012 by receiv
the Panorama Award or The Most Innovative
Treatment o 2011.
• NORD Partners in Progress Corporate Award
Amgen received the National Organization or
Rare Diseases (NORD) Partners in Progress
Corporate Award or our role in bringing
Sensipar® (cinacalcet) to patients or the
treatment o severe hypercalcemia in patients
with primary hyperparathyroidism (PHPT) who
unable to undergo parathyroidectomy. The ann
award is presented to companies that have
developed new treatments or rare diseases.
• Great Place to Work Institute : Amgen’s Dutc
afliate was recognized as one o the top place
to work in the Netherlands.

7/27/2019 Amgen Inc 2012 Annual Report
http://slidepdf.com/reader/full/amgen-inc-2012-annual-report 4/150
Amgen Inc.
One Amgen Center Drive
Thousand Oaks, CA 91320-1799 www.amgen.com
© 2013 Amgen Inc. All rights rese
Forward-looking statements: This communication contains orward-looking statements that are based on Amgen management’s current expectations and belies and are subject to a number o risks, uncertainties, and assumpti
that could cause actual results to dier materially rom those described. All statements, other than statements o historical act, are statements that could be deemed orward-looking statements, including plans or the growth o ou
business and other fnancial metrics; expected clinical or regulatory results or practices; development o Amgen’s product candidates, including anticipated regulatory flings; our manuacturing capabilities; and planned international
expansion. Forward-looking statements involve signifcant risks and uncertainties, including those more ully described in the Risk Factors ound in the Form 10-K or the year ended December 31, 2012 (provided with this
communication) and in the most recent periodic reports on Form 10-Q and Form 8-K fled by Amgen with the U.S. Securities and Exchange Commission, and actual results may vary materially. Except where otherwise indicated, Amg
is providing this inormation as o March 19, 2013, and does not undertake any obligation to update any orward-looking statements contained in this Annual Report as a result o new inormation, uture events, or otherwise.
Reconciliation of GAAP Earnings Per Share to “Adjusted” Earnings Per Share (Unaudited)
(a) The above adjustments are presented net o their related per-share tax impact o $0.42 and $0.38 or 2012 and 2011, respectively.
(b) Includes tax expense /(bene ft) related to certain prior-period items excluded rom “Adjusted” earnings.
Results or the years ended December 31, 2012 2011
GAAP earnings per share (diluted) $5.52 $4.04
Adjustments to GAAP earnings per share(a):
Restructuring/cost-savings initiatives 0.31 0.12
Non-cash amortization o product technology rights acquired in a prior year business combination 0.24 0.20 Acquisition-related expenses 0.18 0.04
Non-cash interest expense associated with our convertible notes 0.11 0.10
Expenses related to various legal proceedings 0.07 0.78
Stock option expense 0.05 0.06
Tax net expense/(beneft)(b) 0.03 (0.01)
“Adjusted” earnings per share (diluted) $6.51 $5.33
7/27/2019 Amgen Inc 2012 Annual Report
http://slidepdf.com/reader/full/amgen-inc-2012-annual-report 5/150
UNITED STATES
SECURITIES AND EXCHANGE COMMISSIONWashington, D.C. 20549
Form10-K (Mark One)
ANNUAL REPORT PURSUANT TO SECTION13 OR 15(d) OF THESECURITIES EXCHANGE ACT OF 1934
For the fiscal year ended December31, 2012
OR
TRANSITION REPORT PURSUANT TO SECTION13 OR 15(d) OF THESECURITIES EXCHANGE ACT OF 1934
Commission file number 000-12477
Amgen Inc.(Exact name of registrant as specified in its charter)
Delaware 95-3540776
(State or other jurisdiction of incorporation or organization)
(I.R.S. Employer Identification No.)
One Amgen Center Drive, 91320-1799
Thousand Oaks, California (Zip Code)
(Address of principal executive offices)
(805) 447-1000
(Registrant’s telephone number, including area code)
Securities registered pursuant to Section12(b)of the Act:
Title of Each Class Name of Each Exchange on Which Registered
Common stock, $0.0001 par value The NASDAQ Global Select Market
Securities registered pursuant to Section12(g) of the Act: NoneIndicate by check mark if the registrant is a well-known seasoned issuer, as defined in Rule405 of the Securities
Act.Yes No
Indicate by check mark if the registrant is not required to file reports pursuant to Section13 or Section15(d)of the
Act.Yes No
Indicate by check mark whether the registrant (1)has filed all reports required to be filed by Section13 or Section15
(d)of the Securities Exchange Act of 1934 during the preceding 12 months (or for such shorter period that the registrant was
required to file such reports), and (2)has been subject to such filing requirements for the past 90 days.Yes No
Indicate by check mark whether the registrant has submitted electronically and posted on its corporate Web site, if any,
every Interactive Data File required to be submitted and posted pursuant to Rule 405 of Regulation S-T (§ 232.405 of this
chapter) during the preceding 12 months (or for such shorter period that the registrant was required to submit and post such
files).Yes No
Indicate by check mark if disclosure of delinquent filers pursuant to Item405 of Regulation S-K is not contained herein,and will not be contained, to the best of registrant’s knowledge, in definitive proxy or information statements incorporated by
reference in PartIII of this Form10-K or any amendment to this Form10-K.
Indicate by check mark whether the registrant is a large accelerated filer, an accelerated filer, a non-accelerated filer, or a
smaller reporting company. See definitions of “large accelerated filer,” “accelerated filer” and “smaller reporting company” in
Rule12b-2 of the Exchange Act. (Check one):
Large accelerated filer Accelerated filer Non-accelerated filer Smaller reporting company
(Do not check if a smaller reporting company)
Indicate by check mark whether the registrant is a shell company (as defined in Rule12b-2 of the Act)Yes No

7/27/2019 Amgen Inc 2012 Annual Report
http://slidepdf.com/reader/full/amgen-inc-2012-annual-report 6/150
The approximate aggregate market value of voting and non-voting stock held by non-affiliates of the registrant was
$56,028,159,915 as of June30, 2012(A)
(A) Excludes 771,532 shares of common stock held by directors and executive officers at June30, 2012. Exclusion of shares held by any person should not
be construed to indicate that such person possesses the power, directly or indirectly, to direct or cause the direction of the management or policies of the
registrant, or that such person is controlled by or under common control with the registrant.
748,430,018
(Number of shares of common stock outstanding as of February19, 2013)
DOCUMENTS INCORPORATED BY REFERENCE
Specified portions of the registrant’s Proxy Statement with respect to the 2013 Annual Meeting of stockholders to be heldMay22, 2013, are incorporated by reference into PartIII of this annual report.
7/27/2019 Amgen Inc 2012 Annual Report
http://slidepdf.com/reader/full/amgen-inc-2012-annual-report 7/150
i
INDEX
PageNo.
Item1.
Item1A.
Item1B.
Item2.
Item3.
Item4.
Item5.
Item6.
Item7.
Item7A.Item8.
Item9.
Item9A.
Item9B.
Item10.
Item11.
Item12.
Item13.
Item14.
Item15.
PART I 1
BUSINESS 1
Overview 1
Significant Developments 2
Marketed Products 3Marketing and Distribution 15
Reimbursement 15
Manufacturing, Distribution and Raw Materials 20
Government Regulation 22
Research and Development and Selected Product Candidates 26
Business Relationships 31
Human Resources 33
Executive Officers of the Registrant 33
Geographic Area Financial Information 34
Investor Information 34
RISK FACTORS 35
UNRESOLVED STAFF COMMENTS 54
PROPERTIES 55
LEGAL PROCEEDINGS 56
MINE SAFETY DISCLOSURES 56
PART II 56
MARKET FOR REGISTRANT’S COMMON EQUITY, RELATED STOCKHOLDER MATTERSAND ISSUER PURCHASES OF EQUITY SECURITIES 56
SELECTED FINANCIAL DATA 59
MANAGEMENT’S DISCUSSION AND ANALYSIS OF FINANCIAL CONDITION ANDRESULTS OF OPERATIONS 60
QUANTITATIVE AND QUALITATIVE DISCLOSURES ABOUT MARKET RISK 76FINANCIAL STATEMENTS AND SUPPLEMENTARY DATA 78
CHANGES IN AND DISAGREEMENTS WITH ACCOUNTANTS ON ACCOUNTING ANDFINANCIAL DISCLOSURES 78
CONTROLS AND PROCEDURES 78
OTHER INFORMATION 79
PART III 80
DIRECTORS, EXECUTIVE OFFICERS AND CORPORATE GOVERNANCE OF THEREGISTRANT 80
EXECUTIVE COMPENSATION 80
SECURITY OWNERSHIP OF CERTAIN BENEFICIAL OWNERS AND MANAGEMENT ANDRELATED STOCKHOLDER MATTERS 80
CERTAIN RELATIONSHIPS AND RELATED TRANSACTIONS AND DIRECTOR INDEPENDENCE 80
PRINCIPAL ACCOUNTANT FEES AND SERVICES 80
PART IV 81
EXHIBITS AND FINANCIAL STATEMENT SCHEDULES 81
SIGNATURES 89

7/27/2019 Amgen Inc 2012 Annual Report
http://slidepdf.com/reader/full/amgen-inc-2012-annual-report 8/150
1
PART I
Item1. BUSINESS
Overview
Amgen Inc. (including its subsidiaries, referred to as “Amgen,” “the Company,” “we,” “our” or “us”) is a global
biotechnology pioneer that discovers, develops, manufactures and delivers innovative human therapeutics. Our medicines help
millions of patients in the fight against cancer, kidney disease, rheumatoid arthritis (RA), bone disease, and other serious illnesses.We operate in one business segment: human therapeutics.
We were incorporated in 1980 and organized as a Delaware corporation in 1987. Our public website is www.amgen.com.
On our website, investors can find press releases, financial filings and other information about the Company. The U.S. Securities
and Exchange Commission (SEC) website, www.sec.gov, also offers access to reports and documents we have electronically filed
with or furnished to the SEC. These website addresses are not intended to function as hyperlinks, and the information contained
in our website and in the SEC’s website is not intended to be a part of this filing.
Our principal products are Neulasta® (pegfilgrastim), a pegylated protein, based on the Filgrastim molecule, and
NEUPOGEN® (Filgrastim), a recombinant-methionyl human granulocyte colony-stimulating factor (G-CSF), both of which
stimulate the production of neutrophils (a type of white blood cell that helps the body fight infection); Enbrel ® (etanercept), an
inhibitor of tumor necrosis factor (TNF), a substance that plays a role in inflammatory diseases; Aranesp® (darbepoetin alfa) and
EPOGEN®
(epoetin alfa), erythropoiesis-stimulating agents (ESAs) that stimulate the production of red blood cells; and XGEVA®
/Prolia® (denosumab), two products that contain the same active ingredient but which are approved for different indications, patient
populations, doses and frequencies of administration. Denosumab is a human monoclonal antibody that specifically targets
RANKL, an essential regulator of osteoclasts (the cells that break down bone). Our principal products represented 89%, 90% and
92% of our sales in 2012, 2011 and 2010, respectively. Our other marketed products include primarily Sensipar ®/Mimpara®
(cinacalcet), a small molecule calcimimetic that lowers serum calcium levels; Vectibix® (panitumumab), a monoclonal antibody
that binds specifically to the epidermal growth factor receptor (EGFr); and Nplate® (romiplostim), a thrombopoietin (TPO) receptor
agonist that mimics endogenous TPO, the primary driver of platelet production.
We maintain sales and marketing forces primarily in the United States, Europe and Canada. We have also entered into
agreements with third parties to assist in the commercialization and marketing of certain of our products in specified geographic
areas. (See Business Relationships.) Together with our partners, we market our products to healthcare providers, including
physicians or their clinics, dialysis centers, hospitals and pharmacies.
In addition to our marketed products, we have various product candidates in mid- to late-stage development in a variety of
therapeutic areas, including oncology, hematology, inflammation, bone health, nephrology, cardiovascular and general medicine,
which includes neuroscience. Our research and development (R&D) organization has expertise in multiple treatment modalities,
including large molecules (such as proteins, antibodies and peptibodies) and small molecules.
Our manufacturing operations consist of bulk manufacturing, formulation, fill and finish and distribution activities for all
of our principal products as well as most of our product candidates. We operate a number of commercial and/or clinical
manufacturing facilities, and our primary manufacturing facilities are located in the United States, Puerto Rico and the Netherlands.
See Item2. Properties.
Drug development in our industry is complex, challenging and risky; and failure rates are high. Product development cycles
are very long—approximately 10 to 15 years from discovery to market. A potential new medicine must undergo many years of
preclinical and clinical testing to establish its safety and efficacy for use in humans at appropriate dosing levels and with an
acceptable benefit-risk profile. Biological products, which are produced in living systems, are inherently complex due to naturallyoccurring molecular variations. Highly specialized knowledge and extensive process and product characterization are required to
transform laboratory-scale processes into reproducible commercial manufacturing processes. Upon approval, marketed products
in our industry generally face substantial competition.
Our industry is highly regulated, and various U.S. and foreign regulatory bodies have substantial authority over how we
conduct our business. Government authorities in the United States and other countries regulate the manufacturing and marketing
of our products as well as our ongoing R&D activities. In recent years, regulators have placed a greater scrutiny on drug safety.
This has led to, and may in the future lead to: fewer products being approved by the U.S. Food and Drug Administration (FDA)
or other regulatory bodies; delays in receiving approvals; additional safety-related requirements; restrictions on the use of products,
including expanded safety labeling, or required risk management activities.

7/27/2019 Amgen Inc 2012 Annual Report
http://slidepdf.com/reader/full/amgen-inc-2012-annual-report 9/150
2
Significant Developments
Following is a summary of significant developments that occurred in 2012 affecting our business.
Products/Pipeline
AMG 145
• In November 2012, we presented data from four phase 2 studies evaluating AMG 145 as monotherapy, in combination
with statin therapy, in heterozygous familial hypercholesterolemia, and in statin-intolerant subjects. In each of these
studies, treatment with AMG 145 resulted in statistically significant reductions in low-density lipoprotein cholesterolcompared to the control arms at 12 weeks. Based on the study results, phase 3 enrollment is underway in these populations.
Sensipar ® /Mimpara®
• In November 2012, we presented at American Society of Nephrology's (ASN) Kidney Weekthe results of the phase 3
E.V.O.L.V.E™(EValuation Of Cinacalcet HCl Therapy to Lower CardioVascular Events) trial. As previously reported,
the primary analysis showed that the trial did not reach its primary endpoint (time to composite event comprising all-
cause mortality or first non-fatal cardiovascular event, including myocardial infarction, hospitalization for unstable
angina, heart failure or peripheral vascular event) in the intent-to-treat analysis. See Significant Developments in our
Quarterly Report on Form 10-Q for the period ended June 30, 2012.
Rilotumumab
• In November 2012, we initiated a phase 3 study for the treatment of gastric cancer.
Brodalumab (AMG 827)
• In October 2012, we announced the start of a phase 3 program in moderate-to-severe psoriasis. The program consists
of three phase 3 studies, with ustekinumab and/or placebo controls.Brodalumab is one of five inflammation monoclonal
antibodies being jointly developed in the collaboration with AstraZeneca Plc. (AstraZeneca).
XGEVA®
• In April 2012, we announced that the FDA issued a Complete Response Letter for the supplemental Biologics License
Application (sBLA) for XGEVA® to treat men with castration-resistant prostate cancer at high risk of developing bone
metastases. The Complete Response Letter states that the FDA cannot approve the application in its present form. The
FDA determined that the effect on bone metastases-free survival was of insufficient magnitude to outweigh the risks
(including osteonecrosis of the jaw) of XGEVA
®
in the intended population.
Romosozumab (AMG 785)
• In April 2012, we along with our partner UCB announced the start of two phase 3 clinical studies in postmenopausal
osteoporosis (PMO). The registrational study is a placebo-controlled trial that will evaluate incidence of new vertebral
fractures at 12 and 24 months in 6,000 patients. We are also conducting an active-controlled trial versus alendronate
that will evaluate the incidence of clinical fracture and new vertebral fracture at 12 and 24 months in 4,000 patients.
Acquisitions/Collaborations
• In June 2012, we acquired substantially all of the outstanding stock of Mustafa Nevzat Pharmaceuticals (MN), a privately
held company that is a leading supplier of pharmaceuticals to the hospital sector and a major supplier of injectable
medicines in Turkey. The acquisition provides us with the opportunity to expand our presence in Turkey and the
surrounding region.• In March 2012, we entered into a collaboration agreement with AstraZeneca to jointly develop and commercialize certain
monoclonal antibodies from Amgen's clinical inflammation portfolio including brodalumab, AMG 139, AMG 157, AMG
181 and AMG 557. The agreement covers the worldwide development and commercialization except for certain Asian
countries for brodalumab and Japan for AMG 557, which are licensed to other third parties.
• In March 2012, we acquired Micromet, Inc. (Micromet), a publicly held biotechnology company focused on the discovery,
development and commercialization of innovative antibody-based therapies for the treatment of cancer.
7/27/2019 Amgen Inc 2012 Annual Report
http://slidepdf.com/reader/full/amgen-inc-2012-annual-report 10/150
3
Marketed Products
We market our principal products, Neulasta®, NEUPOGEN®, ENBREL, Aranesp®, EPOGEN®, XGEVA® and Prolia®, in
supportive cancer care, inflammation, nephrology and bone disease. Certain of our marketed products face — and our product
candidates, if approved, are also expected to face — substantial competition. Our products’ competitive positions among other
biological and pharmaceutical products may be based on, among other things, safety, efficacy, reliability, availability, patient
convenience/delivery devices, price, reimbursement, timing of market entry and patent position and expirations.
Over the next several years, certain of the existing patents on our principal products will expire, and we expect to face
increasing competition thereafter, including from biosimilars. A biosimilar is another version of a biological product for which
marketing approval is sought or has been obtained based on a demonstration that it is “biosimilar” to the original reference product.
This demonstration will typically consist of comparative analytical, preclinical and clinical data from the biosimilar to show that
it has similar safety and efficacy as the reference product. The 2010 U.S. healthcare reform legislation authorized the FDA to
approve biosimilars under a new, abbreviated pathway. In February2012, the FDA released three draft guidance documents that
provide insight into the FDA’s current thinking on the development of biosimilars and broad parameters for the scientific assessment
of biosimilar applications. The FDA guidance documents leave room for the FDA to consider, on a case-by-case basis, the specifics
of what evidence would be required for a biosimilar to gain approval. (See Government Regulation.) In the European Union (EU),
there is already an established regulatory pathway for biosimilars and we are facing increasing competition from biosimilars. In
the United States after patent expiration, we expect to face greater competition than today, including from manufacturers with
biosimilars approved in Europe, that may seek to obtain U.S. approval. In some cases we may experience additional competition
prior to the expiration of our patents as a result of agreements we have made in connection with the settlement of patent litigation
with companies developing potentially competing products.See the discussions of Neulasta®/NEUPOGEN® and Aranesp® later
in this section.
Further, the introduction of new products or the development of new processes or technologies by competitors or new
information about existing products may result in increased competition for our marketed products, even for those protected by
patents, or in a reduction of price that we receive from selling our products. In addition, the development of new treatment options
or standards of care may reduce the use of our products or may limit the utility and application of ongoing clinical trials for our
product candidates.
In addition to the challenges presented by competition, our existing products and product candidates are also subject to
increasing regulatory compliance requirements that could be imposed as conditions of approval or after a product has been approved.
This is increasingly true of new therapies with novel mechanisms of action. While such therapies may offer important benefits
and/or better treatment alternatives, they may also involve relatively new or higher levels of scientific complexity and may therefore
generate increased safety concerns. We design and implement comprehensive proactive pharmacovigilance programs for all of
our products to help ensure the detection, assessment and communication of adverse effects. When deemed necessary and
appropriate, additional measures for risk communication and mitigation are designed and implemented in consultation with
regulatory agencies. As a condition of approval or due to safety concerns after a product has been approved, we may be required
to perform additional clinical trials or studies, including postmarketing requirements (PMRs) and postmarketing commitments
(PMCs). A PMR is a trial or study that a sponsor company is required by statute or regulation to conduct. A PMC is a trial or study
that a sponsor company agrees to in writing, but is not required by law, to conduct. In addition, we may be required to implement
risk management plans for our products in the various regions in which they are approved. The FDA requires risk evaluation and
mitigation strategies (REMS) for various approved products to ensure that the benefits of the drugs outweigh the risks. A REMS
may also be imposed as a condition of approval or after a product has been on the market. A REMS may include a medication
guide or a patient package insert, a healthcare provider communication plan or elements to assure safe use that the FDA deems
necessary. While the elements of REMS may vary, all REMS require the sponsor company to submit periodic assessment reports
to the FDA to demonstrate that the goals of the REMS are being met. The FDA evaluates such assessments and may require
additional modifications to the REMS elements. REMS may also be modified as the FDA and companies gain more experience
with REMS and how they are implemented, operated and monitored. We currently have REMS for a number of our marketed products. See discussion on PMRs, PMCs and REMS in Government Regulation.
Most patients receiving our principal products for approved indications are covered by either government or private payer
healthcare programs, which influence demand. The reimbursement environment continues to evolve with greater emphasis on
both cost containment and demonstration of the economic value of products. In addition, the current worldwide economic conditions
have also contributed to increasing pressures on cost containment.
Neulasta® (pegfilgrastim)/NEUPOGEN ® (Filgrastim)
We were granted an exclusive license to manufacture and market Neulasta® and NEUPOGEN® in the United States, Europe,
Canada and Australia under a licensing agreement with Kirin-Amgen, Inc. (K-A), a joint venture between Kirin Holdings Company,
Limited (Kirin), and Amgen. See Business Relationships—Kirin-Amgen, Inc.
7/27/2019 Amgen Inc 2012 Annual Report
http://slidepdf.com/reader/full/amgen-inc-2012-annual-report 11/150
4
Neulasta® and NEUPOGEN® stimulate production of neutrophils, a type of white blood cell important in the body’s fight
against infection. Both the treatments for various diseases and the diseases themselves can result in extremely low numbers of
neutrophils, a condition called neutropenia. Myelosuppressive chemotherapy, one treatment option for individuals with certain
types of cancers, targets cell types that grow rapidly, such as tumor cells. Normal cells that divide rapidly, such as those in the
bone marrow that become neutrophils, are also vulnerable to the cytotoxic effects of myelosuppressive chemotherapy, resulting
in neutropenia with an increased risk of severe infection. NEUPOGEN® is our registered trademark for Filgrastim, our recombinant-
methionyl human G-CSF. Neulasta® is our registered trademark for pegfilgrastim, a pegylated protein based on the Filgrastim
molecule. A polyethylene glycol molecule is added to the Filgrastim molecule to make pegfilgrastim. Because pegfilgrastim is
eliminated from the body through binding to its receptor on neutrophils and neutrophil precursor cells, pegfilgrastim remains in
circulation in the body until neutrophil recovery has occurred. This neutrophil-mediated clearance allows for administration as asingle dose per chemotherapy cycle, compared with NEUPOGEN®, which requires more frequent dosing.
We market Neulasta® and NEUPOGEN® primarily in the United States and Europe. Neulasta® was launched in the United
States and Europe in 2002 and is indicated to decrease the incidence of infection associated with chemotherapy-induced febrile
neutropenia in cancer patients with non-myeloid malignancies. Administration of Neulasta® in all cycles of chemotherapy is
approved for patients receiving myelosuppressive chemotherapy associated with a clinically significant risk of febrile neutropenia.
NEUPOGEN® was launched in the United States and Europe in 1991. NEUPOGEN® is indicated for reducing the incidence of
infection as manifested by febrile neutropenia for patients with non-myeloid malignancies undergoing myelosuppressive
chemotherapy associated with a significant incidence of severe neutropenia with fever; reducing the duration of neutropenia and
neutropenia-related consequences for patients with non-myeloid malignancies undergoing myeloablative chemotherapy followed
by bone marrow transplantation; reducing the incidence and duration of neutropenia-related consequences in symptomatic patients
with congenital neutropenia, cyclic neutropenia or idiopathic neutropenia (collectively, severe chronic neutropenia); mobilizing
peripheral blood progenitor cells (PBPC) in cancer patients who have undergone myeloablative chemotherapy for stem celltransplantation; and reducing the recovery time of neutrophils and the duration of fever following induction or consolidation
chemotherapy treatment in adult patients with acute myeloid leukemia (AML).
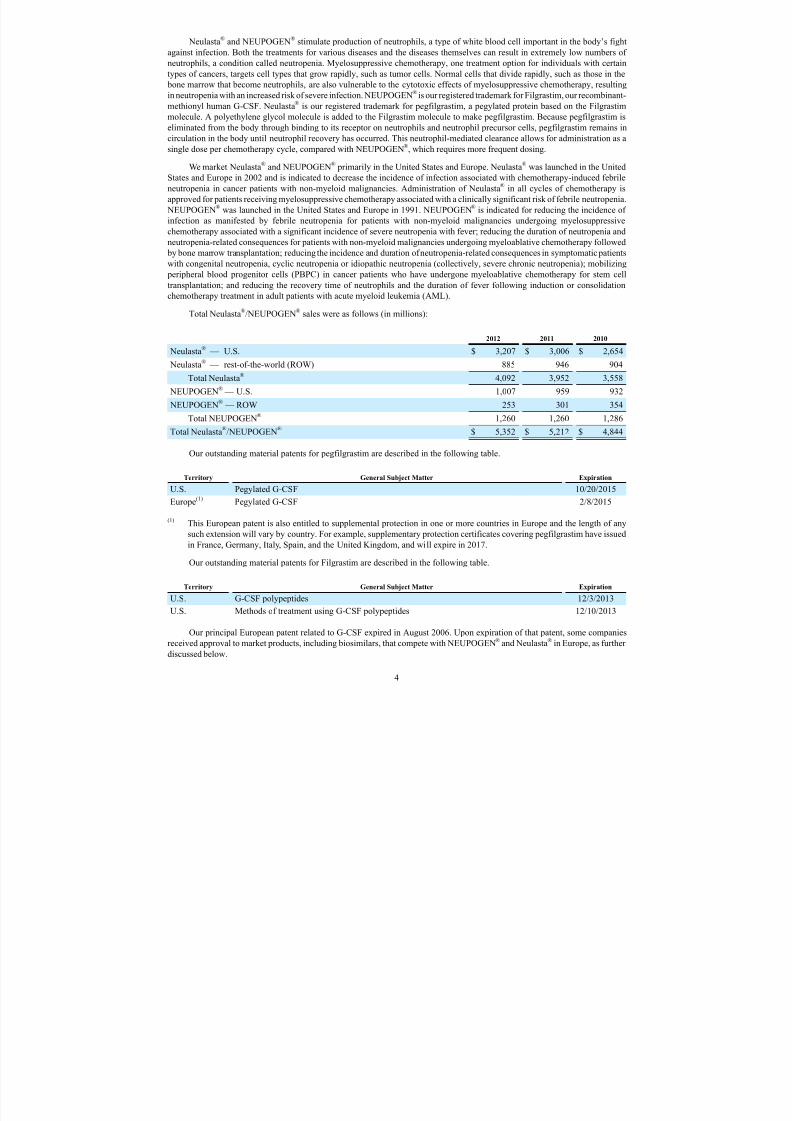
Total Neulasta®/NEUPOGEN® sales were as follows (in millions):
2012 2011 2010
Neulasta®—U.S. $ 3,207 $ 3,006 $ 2,654
Neulasta®—rest-of-the-world (ROW) 885 946 904
Total Neulasta® 4,092 3,952 3,558
NEUPOGEN®—U.S. 1,007 959 932
NEUPOGEN®—ROW 253 301 354
Total NEUPOGEN® 1,260 1,260 1,286
Total Neulasta®/NEUPOGEN® $ 5,352 $ 5,212 $ 4,844
Our outstanding material patents for pegfilgrastim are described in the following table.
Territory General Subject Matter Expiration
U.S. Pegylated G-CSF 10/20/2015
Europe(1) Pegylated G-CSF 2/8/2015
(1) This European patent is also entitled to supplemental protection in one or more countries in Europe and the length of any
such extension will vary by country. For example, supplementary protection certificates covering pegfilgrastim have issued
in France, Germany, Italy, Spain, and the United Kingdom, and will expire in 2017.
Our outstanding material patents for Filgrastim are described in the following table.
Territory General Subject Matter Expiration
U.S. G-CSF polypeptides 12/3/2013
U.S. Methods of treatment using G-CSF polypeptides 12/10/2013
Our principal European patent related to G-CSF expired in August 2006. Upon expiration of that patent, some companies
received approval to market products, including biosimilars, that compete with NEUPOGEN® and Neulasta® in Europe, as further
discussed below.

7/27/2019 Amgen Inc 2012 Annual Report
http://slidepdf.com/reader/full/amgen-inc-2012-annual-report 12/150
5
Our outstanding material U.S. patents for Filgrastim (NEUPOGEN®) expire in December 2013. We expect to face competition
in the United States beginning in the fourth quarter of 2013, which may have a material adverse impact over time on future sales
of NEUPOGEN® and, in turn, Neulasta®. See discussion of Teva below.
Any products or technologies that are directly or indirectly successful in treating neutropenia associated with chemotherapy,
for bone marrow and PBPC transplant patients, severe chronic neutropenia and AML could negatively impact Neulasta ® and/or
NEUPOGEN® sales. Neulasta® and/or NEUPOGEN® sales may also be impacted by increases or decreases in the use of
myelosuppressive chemotherapy, which may result from changes in the number of patients being treated, changes to treatment
protocols or the introduction of new cancer treatments that may not be myelosuppressive. Further, NEUPOGEN® competes with
Neulasta®
in the United States and Europe, and NEUPOGEN®
sales have been adversely impacted by conversion to Neulasta®
,which we believe is substantially complete.
The following table reflects companies and their currently marketed products that compete with Neulasta® and/or
NEUPOGEN® in the United States and Europe in the supportive cancer care setting. The table below and the following discussion
of competitor marketed products and products in development may not be exhaustive.
Territory Competitor Marketed Product Competitor
U.S. Leukine® Bayer HealthCare Pharmaceuticals (Bayer)
Europe Granocyte® Chugai Pharmaceuticals Co., Ltd./Sanofi-Aventis (Sanofi)
Europe Ratiograstim®(1)/Biograstim®(1) ratiopharm GmbH (ratiopharm)(2)/CT Arzneimittel GmbH (CT Arzneimittel)
Europe Tevagrastim®(1) Teva Pharmaceutical Industries Ltd. (Teva Pharmaceutical)
Europe Zarzio®(1)/Filgrastim Hexal®(1) Sandoz GmbH (Sandoz)/Hexal Biotech Forschungs GmbH (Hexal)
Europe Nivestim®(1) Hospira Inc. (Hospira)
(1) Approved via the EU biosimilar regulatory pathway.(2) A subsidiary of Teva Pharmaceutical.
In August 2012, the FDA approved Sicor Biotech's (Teva Corporation) tbo-filgrastim product to reduce the time that certain
patients receiving cancer chemotherapy experience severe neutropenia. The approval was on the basis of a full BLA rather than
under the FDA's new biosimilar approval pathway. This drug may compete with NEUPOGEN® subject to the terms of the injunction
and settlement agreement discussed below.
In November2009, Teva Pharmaceutical filed a declaratory judgment action against us alleging that certain of our
NEUPOGEN® patents are invalid and not infringed by its tbo-filgrastim product, and in January2010, we filed an answer and
counterclaims seeking a declaratory judgment that our patents are valid and infringed. In July2011, we announced that the U.S.District Court in Pennsylvania entered final judgment and a permanent injunction against Teva Pharmaceutical and Teva
Pharmaceuticals USA, Inc. (together defined as Teva) prohibiting them from infringing our patents relating to human G-CSF
polypeptides and methods of treatment. The court’s injunction extends until November10, 2013, after which date Teva will no
longer be prohibited by the injunction from selling its tbo-filgrastim product in the United States. Teva also agreed not to sell
balugrastim, a long-acting product candidate, in the United States before November10, 2013, unless it first obtains a final court
decision that our patents are not infringed by balugrastim. Pursuant to the parties’ settlement, the launch date for either product
could be sooner if certain unexpected events occur: a third party launches a similar G-CSF polypeptide product and we fail to sue
that third party, or the patents are held invalid or unenforceable in a final court decision in an action brought by a third party.
Several companies have short-acting filgrastim product candidates in phase 3 clinical development, including:
• Merck& Company, Inc. (Merck) (MK-4214)
• Intas/Apotex Inc. (Neukine)
• Reliance Life Sciences Pvt. Ltd. (ReliGrast)
• Biocon Ltd./Celgene Corporation (Celgene) (Nufil)
In addition, several companies have long-acting filgrastim product candidates in phase 3 clinical development, including:
• Teva Pharmaceutical (balugrastim and Lonquex)
• Sandoz (LA-EP2006)
• Intas/Apotex Inc. (Neupeg)

7/27/2019 Amgen Inc 2012 Annual Report
http://slidepdf.com/reader/full/amgen-inc-2012-annual-report 13/150
6
Enbrel ® (etanercept)
ENBREL is our registered trademark for etanercept, our TNF receptor fusion protein that inhibits the binding of TNF to its
receptors, which can result in a significant reduction in inflammatory activity. TNF is one of the chemical messengers that help
regulate the inflammatory process. When the body produces too much TNF, it overwhelms the immune system’s ability to control
inflammation of the joints or of psoriasis-affected skin areas. ENBREL binds certain TNF molecules before they can trigger
inflammation.
ENBREL was launched in the United States in November 1998 and in Canada in March 2001. ENBREL is indicated for the
treatment of adult patients with the following conditions: moderate to severe active RA; chronic moderate to severe plaque psoriasis
patients who are candidates for systemic therapy or phototherapy; active psoriatic arthritis; and active ankylosing spondylitis. It
is also indicated for reducing signs and symptoms of moderately to severely active polyarticular juvenile idiopathic arthritis in
patients ages two and older.
We market ENBREL under a collaboration agreement with Pfizer Inc. (Pfizer) in the United States and Canada, which
expires October 31, 2013. (See Business Relationships—Pfizer Inc.) The rights to market and sell ENBREL outside the United
States and Canada are reserved to Pfizer.
Total ENBREL sales were as follows (in millions):
2012 2011 2010
Total ENBREL $ 4,236 $ 3,701 $ 3,534
Our outstanding material patents for etanercept are described in the following table.
Territory General Subject Matter Expiration
U.S. Methods of treating psoriasis 8/13/2019
U.S. Aqueous formulation and methods of treatment using the formulation(1) 6/8/2023
U.S. Fusion protein, and pharmaceutical compositions 11/22/2028
U.S. DNA encoding fusion protein, and methods of making fusion protein 4/24/2029
(1) This formulation patent relates to the currently approved liquid formulation of ENBREL, which formulation accounts for
the majority of ENBREL sales in the United States. However, ENBREL is also sold as an alternative lyophilized formulation
that requires reconstituting before it can be administered to the patient.
Any products or technologies that are directly or indirectly successful in treating rheumatologic conditions, which includes
moderate to severe RA; moderate to severe polyarticular juvenile idiopathic arthritis; ankylosing spondylitis and psoriatic arthritis;
and dermatologic conditions, which includes moderate to severe plaque psoriasis, could negatively impact ENBREL sales. Certain
of the treatments for these indications include generic methotrexate and other products.
The following table reflects companies and their currently marketed products that compete with ENBREL in the United
States and Canada in the inflammatory disease setting. The table below and the following discussion of competitor marketed
products and products in development may not be exhaustive.
Territory Therapeutic Area
CompetitorMarketedProduct Competitor
U.S.& Canada Rheumatology&Dermatology REMICADE® Janssen Biotech, Inc. (Janssen)(1)/Merck
U.S.& Canada Rheumatology & Dermatology HUMIRA® Abbott Laboratories (Abbott) (2)
U.S.& Canada Rheumatology & Dermatology Simponi® Janssen (1)
U.S.& Canada Rheumatology Cimzia® UCB/Nektar Therapeutics (Nektar)
U.S.& Canada Rheumatology Orencia® Bristol-Myers Squibb Company (BMS)
U.S.& Canada Rheumatology Rituxan® F. Hoffmann-La Roche Ltd (Roche)
U.S. Rheumatology Actemra® Roche
U.S.& Canada Dermatology Stelara® Janssen (1)
U.S. Rheumatology Xeljanz® Pfizer

7/27/2019 Amgen Inc 2012 Annual Report
http://slidepdf.com/reader/full/amgen-inc-2012-annual-report 14/150
7
(1) A subsidiary of Johnson& Johnson (J&J).
(2) In January 2013, Abbott announced that it completed the separation of its research-based pharmaceuticals business, which
became AbbVie, Inc. (AbbVie), a new independent biopharmaceutical company which now owns the rights to this product.
In November 2012, the FDA approved Pfizer's Xeljanz® (tofacitinib), an oral treatment for patients with moderate to severe
RA who have had an inadequate response or intolerance to methotrexate. In addition, a number of companies have product
candidates in phase 3 clinical development which may compete with ENBREL in the future, including:
• Celgene (apremilast), in both psoriasis and psoriatic arthritis
• AstraZeneca and Rigel Pharmaceuticals Inc. (fostamatinib) in RA
• Eli Lilly and Company (Eli Lilly) (ixekizumab) for moderate to severe plaque psoriasis
• UCB/Nektar’s Cimzia® in psoriatic arthritis
• Janssen’s Simponi® IV in RA and Stelara® in psoriatic arthritis
• Roche’s Actemra® SC in RA
ESAs
Aranesp® and EPOGEN® are our registered trademarks for darbepoetin alfa and epoetin alfa, respectively, both of which
are proteins that stimulate red blood cell production in a process known as erythropoiesis. Red blood cells transport oxygen to all
cells of the body. Without adequate amounts of a protein called erythropoietin, the red blood cell count is reduced. A deficient red blood cell count can result in anemia, a condition in which insufficient oxygen is delivered to the body’s organs and tissues. Anemia
can be associated with chronic kidney disease (CKD) in patients either on or not on dialysis. Individuals with CKD may suffer
from anemia because they do not produce sufficient amounts of erythropoietin, which is normally produced in healthy kidneys
and stimulates erythropoiesis. Anemia can also result from chemotherapy treatments for patients with non-myeloid malignancies.
ESAs, including ours, have faced and continue to face challenges. For example, based on adverse safety results observed
beginning in late 2006 in various studies, performed by us and by others, that explored the use of ESAs in settings different from
those outlined in the FDA approved label, the product labeling of our ESAs in the United States and the EU has been updated
several times to reflect those safety concerns. In addition, due in part to certain of these developments, reimbursement of our ESAs
in the United States was also revised. These regulatory and reimbursement changes have led to changes in the way ESAs are used
in clinical practice, including by decreasing the number of patients treated with ESAs as well as the average dose and duration of
ESA therapy.
In 2010 and 2011, the FDA and Centers for Medicare & Medicaid Services (CMS) took a number of actions with respect
to the label for and the reimbursement of ESAs:
• Effective January 1, 2011, CMS implemented the Final Rule on Bundling in Dialysis, providing a single payment for
all dialysis services (with the exception of oral drugs without intravenous equivalents).
• In June 2011, the FDA approved ESA label changes impacting both patients on dialysis and those not on dialysis. While
the previous label language specified a hemoglobin (Hb) target range of 10-12 grams per deciliter (g/dL) for patients
in both populations, the new label advises physicians treating patients on dialysis to initiate ESA therapy when the Hb
level is less than 10 g/dL and to reduce or interrupt the dose when the Hb approaches or exceeds 11 g/dL. For CKD
patients not on dialysis receiving ESA treatment, the new label advises physicians to initiate ESA therapy when the Hb
level is less than 10 g/dL and to reduce or interrupt the dose when the Hb exceeds 10 g/dL.
• In November2011, CMS finalized a rule to update various provisions of its bundled-payment system for dialysis servicesand the related end stage renal disease (ESRD) Quality Incentive Program (QIP). The final rule eliminated for payment
year 2013 and beyond the QIP's measure that tracks the percent of a provider's Medicare patients with a Hb level below
10 g/dL.
• In June2010, CMS opened a National Coverage Analysis (NCA) to examine the use of ESAs to manage anemia in
patients with CKD and dialysis-related anemia. Following further analysis, in June 2011, CMS issued a Final Decision
Memorandum (FDM) in which it determined that it would not issue a National Coverage Determination (NCD) at that
time for ESAs for treatment of anemia in adults with CKD.In the absence of an NCD, Local Coverage Determinations
(LCDs) may be made byregional contractors called Medicare Administrative Contractors (MACs). Since CMS issued
their FDM, three MACs have issued a revised LCD relating to anemia in patients with CKD not on dialysis. These three
MACs provide ESA coverage no more restrictive than the revised label.
7/27/2019 Amgen Inc 2012 Annual Report
http://slidepdf.com/reader/full/amgen-inc-2012-annual-report 15/150
8
Certain of these developments have had a material adverse impact on sales of our ESAs.
In addition, in November 2011, we entered into a seven-year supply agreement with DaVita Inc. (DaVita), commencing
January1, 2012, to supply EPOGEN® in amounts necessary to meet no less than 90% of DaVita’s and its affiliates’ requirements
for ESAs used in providing dialysis services in the United States and Puerto Rico.
We have an ongoing oncology pharmacovigilance program in place for Aranesp®. The five clinical trials originally included
in the program explored the use of ESAs in settings different from those outlined in the FDA approved label and were designated
by the FDA as PMCs. Of the five studies, one was sponsored by Amgen while the other four were investigator-sponsored. Four
of the studies are complete and analysis of the results from the fifth study is currently ongoing. The results of certain of those
studies contributed to safety-related product labeling changes for our ESAs and changes in reimbursement, as noted above. In
addition, Janssen Research& Development, LLC (JRD), a subsidiary of J&J, and/or its investigators have conducted numerous
studies that contribute to the understanding of ESA safety. Results of the JRD studies were submitted to the FDA.
Additionally, based on discussions with the FDA, we and JRD have carefully considered potential new study designs to
determine the effects of ESAs on survival and tumor outcomes in anemic patients with metastatic cancer receiving concomitant
myelosuppressive chemotherapy. Based on those discussions, we are conducting a randomized, double-blind, placebo-controlled,
phase 3 non-inferiority study evaluating overall survival when comparing advanced non small cell lung cancer (NSCLC) patients
on Aranesp® to patients receiving placebo (Study '782) as part of our Aranesp® pharmacovigilance program. In addition, JRD’s
EPO-ANE-3010 study in breast cancer is ongoing. Both studies are designated by the FDA as PMR clinical trials. For the nephrology
setting, we have been engaged in ongoing discussions with the FDA regarding additional PMRs to explore alternative ESA dosing
strategies in CKD patients on dialysis and not on dialysis. In July 2012 we initiated study '226 to evaluate Aranesp® use in CKD
patients not on dialysis. We expect to discuss further with the FDA a potential study in CKD patients on dialysis.
In January 2013, we announced the top-line results of the phase 3 Aranesp® RED-HF® (Reduction of Events With Darbepoetin
Alfa in Heart Failure) Trial. The trial was initiated in 2006, and a total of 2,278 patients with symptomatic systolic heart failure
and anemia (Hb levels ranging from 9.0-12.0 g/dL) were randomized to receive either treatment with Aranesp® to achieve a target
Hb of at least 13.0 g/dL (not to exceed 14.5 g/dL), or placebo. The study did not meet its primary endpoint of reducing the composite
endpoint of time to death from any cause or first hospital admission for worsening heart failure.There were no new safety findings
identified in the study. These summary results will be followed by full efficacy and safety analyses, which will be shared and
discussed with global regulatory agencies and submitted for presentation at an upcoming medical meeting.
Adverse events or results of any of these studies could further affect product labeling, healthcare provider prescribing
behavior, regulatory or private healthcare organization medical guidelines and/or reimbursement practices related to Aranesp® or
EPOGEN®.
Aranesp
®
(darbepoetin alfa)
We were granted an exclusive license by K-A to manufacture and market Aranesp® in the United States, all European
countries, Canada, Australia, New Zealand, Mexico, all Central and South American countries and certain countries in Central
Asia, Africa and the Middle East.
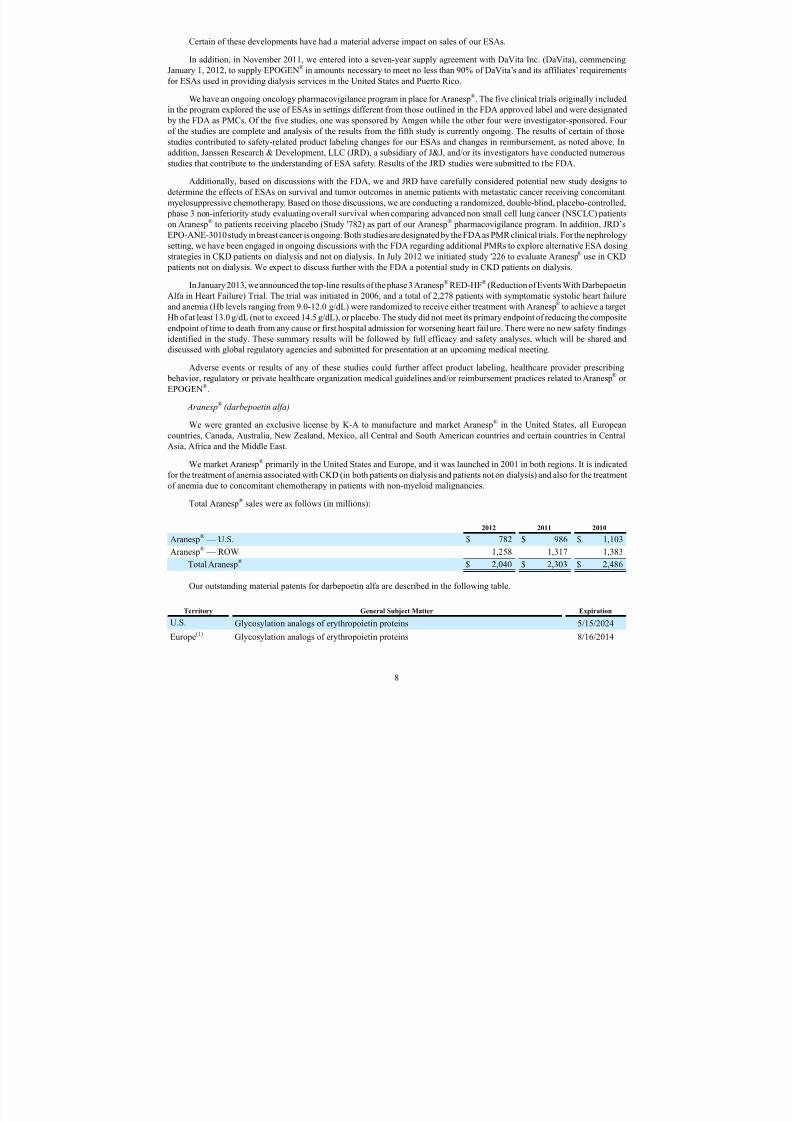
We market Aranesp® primarily in the United States and Europe, and it was launched in 2001 in both regions. It is indicated
for the treatment of anemia associated with CKD (in both patients on dialysis and patients not on dialysis) and also for the treatment
of anemia due to concomitant chemotherapy in patients with non-myeloid malignancies.
Total Aranesp® sales were as follows (in millions):
2012 2011 2010
Aranesp®—U.S. $ 782 $ 986 $ 1,103
Aranesp®— ROW 1,258 1,317 1,383
Total Aranesp® $ 2,040 $ 2,303 $ 2,486
Our outstanding material patents for darbepoetin alfa are described in the following table.
Territory General Subject Matter Expiration
U.S. Glycosylation analogs of erythropoietin proteins 5/15/2024
Europe(1) Glycosylation analogs of erythropoietin proteins 8/16/2014

7/27/2019 Amgen Inc 2012 Annual Report
http://slidepdf.com/reader/full/amgen-inc-2012-annual-report 16/150
9
(1) This European patent is also entitled to supplemental protection in one or more countries in Europe and the length of any
such extension will vary by country. For example, supplementary protection certificates covering darbepoetin alfa have
issued in France, Germany, Italy, Spain, and the United Kingdom, and will expire in 2016.
Our principal European patent related to epoetin alfa expired in December 2004. Although we do not market EPOGEN® in
Europe, upon expiration of this patent, some companies received approval to market products, including biosimilars, that compete
with Aranesp® in Europe, as further discussed below.
Any products or technologies that are directly or indirectly successful in addressing anemia associated with chemotherapy
and/or renal failure could negatively impact Aranesp® sales. In the United States, Aranesp® competes with EPOGEN®, primarily
in the U.S. hospital dialysis clinic setting.
The following table reflects companies and their currently marketed products that compete with Aranesp® in the United
States and Europe in the supportive cancer care and nephrology segments, unless otherwise indicated. The table below and the
following discussion of competitor products in development may not be exhaustive.
Territory Competitor Marketed Product Competitor
U.S. PROCRIT®(1) Janssen(2)
Europe EPREX®/ERYPO® Janssen-Cilag(2)
Europe NeoRecormon® Roche
Europe Retacrit™(3)/Silapo®(3) Hospira/Stada Arzneimittel AG
Europe Binocrit®(3)
/epoetin alfa Hexal®(3)
/Abseamed®(3)
Sandoz/Hexal/Medice Arzneimittel Pütter GmbH & Co. KGEurope MIRCERA®(4) Roche
Europe Eporatio®/Biopoin® ratiopharm (5)/CT Arzneimittel
(1) PROCRIT® competes with Aranesp® in the supportive cancer care and pre-dialysis settings.
(2) A subsidiary of J&J.
(3) Approved via the EU biosimilar regulatory pathway.
(4) Competes with Aranesp® in the nephrology segment only. Pursuant to a December 2009 settlement agreement between
Amgen and Roche, Roche is allowed to begin selling MIRCERA® in the United States in mid-2014 under terms of a limited
license agreement. MIRCERA® has been approved by the FDA for the treatment of anemia associated with chronic renal
failure (CRF) in patients on and not on dialysis.(5) A subsidiary of Teva Pharmaceutical.
Several companies have short-acting ESA candidates in late stage clinical development, some of which may be pursued as
biosimilars with U.S.-sourced epoetin alfa as the comparator product, including:
• APOTEX Inc. (APO-EPO)
• Hospira (Retacrit)
• Sandoz (HX-575)
EPOGEN ® (epoetin alfa)
We were granted an exclusive license to manufacture and market EPOGEN
®
in the United States under a licensing agreementwith K-A. We have retained exclusive rights to market EPOGEN ® in the United States for dialysis patients. We granted Ortho
Pharmaceutical Corporation, a subsidiary of J&J (which has assigned its rights under the Product License Agreement to Janssen),
a license to commercialize recombinant human erythropoietin as a human therapeutic in the United States in all indications other
than dialysis.
We market EPOGEN® in the United States and it was launched in 1989. EPOGEN® is indicated to treat a lower than normal
number of red blood cells (anemia) caused by CKD in patients on dialysis to lessen the need for red blood cell transfusions.

7/27/2019 Amgen Inc 2012 Annual Report
http://slidepdf.com/reader/full/amgen-inc-2012-annual-report 17/150
10
Total EPOGEN® sales were as follows (in millions):
2012 2011 2010
EPOGEN®—U.S. $ 1,941 $ 2,040 $ 2,524
Our outstanding material patents for epoetin alfa are described in the following table.
Territory General Subject Matter Expiration
U.S. Product claims to erythropoietin 8/20/2013U.S. Pharmaceutical compositions of erythropoietin 8/20/2013
U.S. Pharmaceutical erythropoietin formulation with certain stabilizers 9/24/2014
U.S. Cells that make certain levels of erythropoietin 5/26/2015
Any products or technologies that are directly or indirectly successful in addressing anemia associated with renal failure
could negatively impact EPOGEN® sales. In the United States, as noted above, EPOGEN® and Aranesp® compete with each other,
primarily in the U.S. hospital dialysis clinic setting.
In March 2012, the FDA approved OMONTYS® (peginesatide), a synthetic, PEGylated peptidic compound that binds to
and stimulates the erythropoietin receptor and thus acts as an ESA. OMONTYS® was co-developed by Affymax, Inc. and Takeda
Pharmaceutical Company Limited (Takeda) and competes with EPOGEN® in the United States in the nephrology segment in
patients with CKD who are on dialysis. On February 23, 2013, Affymax, Inc. and Takeda announced that they had decided to
voluntarily recall all lots of OMONTYS® Injection to the user level as a result of new postmarketing reports regarding serioushypersensitivity reactions, including anaphylaxis, which can be life-threatening or fatal.
XGEVA® /Prolia
®(denosumab)
In 2010, we launched XGEVA® and Prolia®, both of which contain the same active ingredient but which are approved for
different indications, patient populations, doses and frequencies of administration. We have a collaboration agreement with Glaxo
Group Limited (Glaxo), a wholly owned subsidiary of GlaxoSmithKline plc (GSK), for the commercialization of denosumab in
certain countries. See Business Relationships—Glaxo Group Limited.
Total XGEVA® and Prolia® sales were as follows (in millions):
2012 2011 2010
XGEVA®—U.S. $ 644 $ 343 $ 8XGEVA®—ROW 104 8 —
Total XGEVA® 748 351 8
Prolia®—U.S. 292 130 26
Prolia®—ROW 180 73 7
Total Prolia® 472 203 33
Total XGEVA®/Prolia® $ 1,220 $ 554 $ 41
XGEVA®
In November 2010, the FDA approved XGEVA® for the prevention of skeletal-related events (SREs) (pathological fracture,
radiation to bone, spinal cord compression or surgery to bone) in patients with bone metastases from solid tumors. XGEVA ® is
not indicated for the prevention of SREs in patients with multiple myeloma.
In July 2011, we announced that the European Commission (EC) granted marketing authorization for XGEVA® for the
prevention of SREs in adults with bone metastases from solid tumors. The EC also granted XGEVA® an additional year of data
and market exclusivity in the EU since the indication was considered new for denosumab and based on the significant clinical
benefit of XGEVA® in comparison with existing therapies.
Any products or technologies that are directly or indirectly successful in treating for the prevention of SREs in patients with
bone metastases from solid tumors could negatively impact XGEVA® sales.

7/27/2019 Amgen Inc 2012 Annual Report
http://slidepdf.com/reader/full/amgen-inc-2012-annual-report 18/150
11
The following table reflects currently marketed products that compete with XGEVA®. The table below and the following
discussion of competitor products in development may not be exhaustive.
Territory Competitor Marketed Product Competitor
U.S.& Europe Zometa®(1) Novartis AG (Novartis)
U.S.& Europe Aredia®(2) Novartis
(1) Novartis has indicated that patent protection on the active ingredient for Zometa® will expire in 2013 in the United States.
At such time, we expect that generic forms of zoledronic acid may become commercially available and compete with Zometa®
and XGEVA®. Generic forms of zoledronic acid became available in other major markets in 2012.
(2) This product has lost its patent protection and generic versions of this product are available.
In addition, Bayer has filed with the FDA for approval of alpharadin for the treatment of castration-resistant prostate cancer
patients with bone metastases, that may compete with XGEVA® in the future.
Prolia®
In June2010, the FDA approved Prolia® for the treatment of postmenopausal women with osteoporosis at high risk for
fracture, defined as a history of osteoporotic fracture, or multiple risk factors for fracture, or patients who have failed or are
intolerant to other available osteoporosis therapy. In September2011, we announced that the FDA approved two additional
indications for Prolia® as a treatment to increase bone mass in women at high risk for fracture receiving adjuvant aromatase
inhibitor therapy for breast cancer and as a treatment to increase bone mass in men at high risk for fracture receiving androgendeprivation therapy for non-metastatic prostate cancer. In September 2012, the FDA approved Prolia® for a treatment to increase
bone mass in men with osteoporosis at high risk for fracture.
In May 2010, the EC granted marketing authorization for Prolia® for the treatment of osteoporosis in postmenopausal women
at increased risk of fractures and for the treatment of bone loss associated with hormone ablation in men with prostate cancer at
increased risk of fractures.
Any products or technologies that are directly or indirectly successful in treating osteoporosis in patients at high risk for
fracture could negatively impact Prolia® sales.
The following table and discussion reflect other companies and their currently marketed products that compete with Prolia®.
The table below and the following discussion of competitor marketed products and products in development may not be exhaustive.
Territory Competitor Marketed Product Competitor
U.S.& Europe FOSAMAX®(1) Merck
U.S.& Europe Actonel®/Atelvia™ Warner Chilcott PLC
U.S.& Europe Boniva®(1)/Bonviva®(1) Roche
U.S.& Europe Evista® Eli Lilly
U.S.& Europe Forteo®/Forsteo™ Eli Lilly
U.S.& Europe Miacalcin® Novartis
U.S.& Europe Aclasta®(1)/Reclast® Novartis
Europe Conbriza® Pfizer
Europe Fablyn® Pfizer
(1) This product has lost its patent protection and generic versions of this product are available.
We expect several additional marketed products noted above to lose patent protection over the next several years.
Merck (odanacatib) and Radius Health, Inc. (BA058) have product candidates in phase 3 clinical development for PMO.
7/27/2019 Amgen Inc 2012 Annual Report
http://slidepdf.com/reader/full/amgen-inc-2012-annual-report 19/150
12
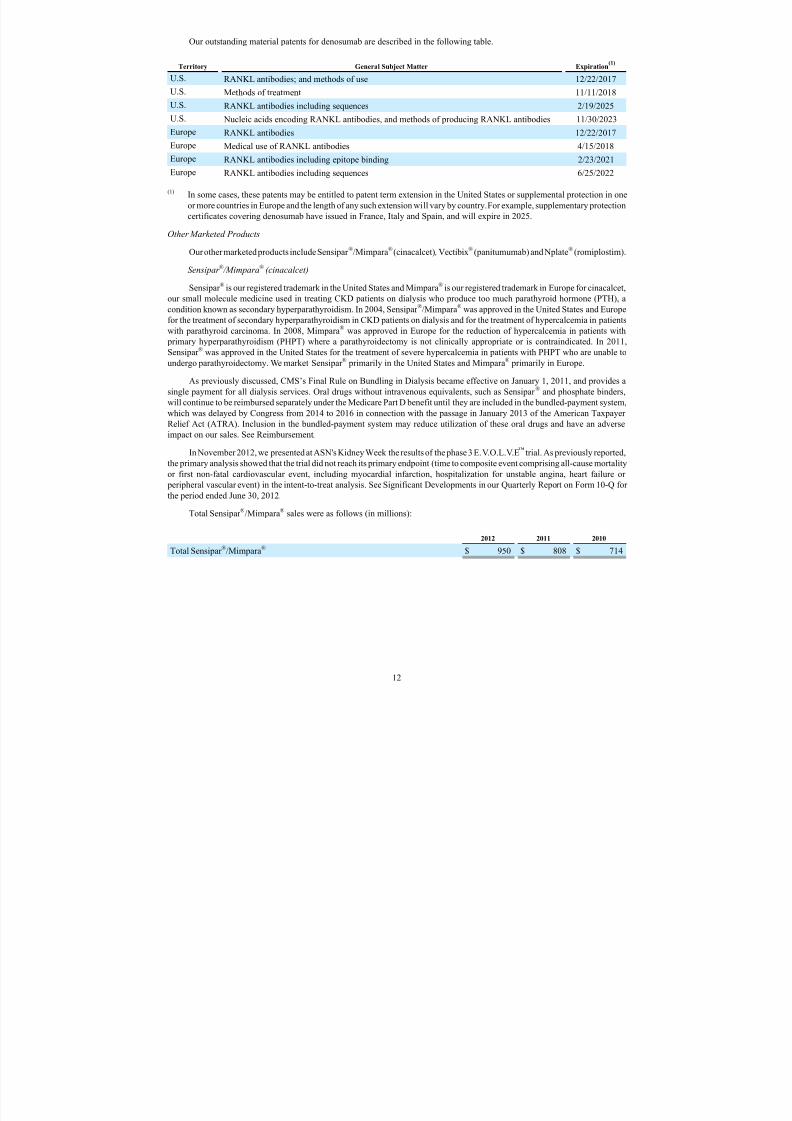
Our outstanding material patents for denosumab are described in the following table.
Territory General Subject Matter Expiration(1)
U.S. RANKL antibodies; and methods of use 12/22/2017
U.S. Methods of treatment 11/11/2018
U.S. RANKL antibodies including sequences 2/19/2025
U.S. Nucleic acids encoding RANKL antibodies, and methods of producing RANKL antibodies 11/30/2023
Europe RANKL antibodies 12/22/2017Europe Medical use of RANKL antibodies 4/15/2018
Europe RANKL antibodies including epitope binding 2/23/2021
Europe RANKL antibodies including sequences 6/25/2022
(1) In some cases, these patents may be entitled to patent term extension in the United States or supplemental protection in one
or more countries in Europe and the length of any such extension will vary by country.For example, supplementary protection
certificates covering denosumab have issued in France, Italy and Spain, and will expire in 2025.
Other Marketed Products
Our other marketed products include Sensipar ®/Mimpara®(cinacalcet) , Vectibix® (panitumumab) and Nplate® (romiplostim).
Sensipar
®
/Mimpara
®
(cinacalcet)
Sensipar ® is our registered trademark in the United States and Mimpara® is our registered trademark in Europe for cinacalcet,
our small molecule medicine used in treating CKD patients on dialysis who produce too much parathyroid hormone (PTH), a
condition known as secondary hyperparathyroidism. In 2004, Sensipar ®/Mimpara® was approved in the United States and Europe
for the treatment of secondary hyperparathyroidism in CKD patients on dialysis and for the treatment of hypercalcemia in patients
with parathyroid carcinoma. In 2008, Mimpara® was approved in Europe for the reduction of hypercalcemia in patients with
primary hyperparathyroidism (PHPT) where a parathyroidectomy is not clinically appropriate or is contraindicated. In 2011,
Sensipar ® was approved in the United States for the treatment of severe hypercalcemia in patients with PHPT who are unable to
undergo parathyroidectomy. We market Sensipar ® primarily in the United States and Mimpara® primarily in Europe.
As previously discussed, CMS’s Final Rule on Bundling in Dialysis became effective on January1, 2011, and provides a
single payment for all dialysis services. Oral drugs without intravenous equivalents, such as Sensipar ® and phosphate binders,
will continue to be reimbursed separately under the Medicare Part D benefit until they are included in the bundled-payment system,
which was delayed by Congress from 2014 to 2016 in connection with the passage in January 2013 of the American Taxpayer Relief Act (ATRA). Inclusion in the bundled-payment system may reduce utilization of these oral drugs and have an adverse
impact on our sales. See Reimbursement.
In November 2012, we presented at ASN's Kidney Weekthe results of the phase 3 E.V.O.L.V.E™ trial. As previously reported,
the primary analysis showed that the trial did not reach its primary endpoint (time to composite event comprising all-cause mortality
or first non-fatal cardiovascular event, including myocardial infarction, hospitalization for unstable angina, heart failure or
peripheral vascular event) in the intent-to-treat analysis. See Significant Developments in our Quarterly Report on Form 10-Q for
the period ended June 30, 2012.
Total Sensipar ®/Mimpara® sales were as follows (in millions):
2012 2011 2010
Total Sensipar ®/Mimpara® $ 950 $ 808 $ 714

7/27/2019 Amgen Inc 2012 Annual Report
http://slidepdf.com/reader/full/amgen-inc-2012-annual-report 20/150
13
Our outstanding material patents for cinacalcet are described in the following table.
Territory General Subject Matter Expiration
U.S. Calcium receptor-active molecules including species 10/23/2015
U.S. Calcium receptor-active molecules 3/8/2018
U.S. Methods of treatment 12/14/2016
Europe(1) Calcium receptor-active molecules 10/23/2015
(1) This European patent is also entitled to supplemental protection in one or more countries in Europe and the length of any
such extension will vary by country. For example, supplementary protection certificates covering cinacalcet have issued in
France, Germany, Italy, Spain, and the United Kingdom, and will expire in 2019.
Any products or technologies that are directly or indirectly successful in treating secondary hyperparathyroidism in patients
with CKD on dialysis and/or hypercalcemia in patients with parathyroid carcinoma could negatively impact Sensipar ®/Mimpara®
sales.
The following table reflects companies and their currently marketed products that compete with Sensipar ® in the United
States and with Mimpara® in Europe in the nephrology segment for patients with CKD on dialysis and may not be exhaustive.
Territory Competitor Marketed Product Competitor
U.S. Hectorol® GenzymeCorporation(Genzyme)
U.S. Rocaltrol® Roche
U.S. Calcijex® Abbott (1)
U.S. Calcium Acetate® Roxane Laboratories/Sandoz
U.S.& Europe Zemplar ® Abbott (1)
U.S.& Europe Renagel® Genzyme
U.S.& Europe Renvela® Genzyme
U.S.& Europe PhosLo®/Rephoren® Fresenius Medical Care AG& Co. KGaA (Fresenius Medical Care)
U.S.& Europe OsvaRen® Fresenius Medical Care
U.S.& Europe Fosrenol® Shire Pharmaceuticals Group Plc
(1) In January 2013, Abbott announced that it completed the separation of its research-based pharmaceuticals business, which became AbbVie, a new independent biopharmaceutical company which now owns the rights to this product.
In July2008, we filed a lawsuit against Teva and Barr Pharmaceuticals Inc. (Barr) for infringement of four Sensipar ® patents.
The lawsuit was based on Abbreviated New Drug Applications (NDA) filed by Teva and Barr that sought approval to market
generic versions of Sensipar ®. Following trial, in January 2011, the U.S. District Court for the District of Delaware granted an
injunction prohibiting Teva and Barr from commercializing generic versions of Sensipar ® in the United States until expiration of
three of those patents. These generic versions could compete with Sensipar ® in the future.
Vectibix® (panitumumab)
Vectibix® is our registered trademark for panitumumab, our monoclonal antibody for the treatment of patients with EGFr
expressing metastatic colorectal cancer (mCRC) after disease progression on, or following fluoropyrimidine-, oxaliplatin- and
irinotecan- containing chemotherapy regimens. EGFr is a protein that plays an important role in cancer cell signaling and is over-
expressed in many human cancers. Vectibix® binds with high affinity to EGFrs and interferes with signals that might otherwisestimulate growth and survival of the cancer cell. In September 2006, Vectibix® received FDA accelerated approval in the United
States, based upon clinical trial data from a study demonstrating a statistically significant improvement in progression-free survival
and with the condition that Amgen conduct a confirmatory trial to verify the clinical benefit of panitumumab through demonstration
of an improvement in overall survival. (See discussion of the '181 trial below.) In the EU, the conditional approval of Vectibix ®
as monotherapy, for the treatment of patients with EGFr expressing metastatic colorectal carcinoma with non-mutated (wild-type)
KRAS genes after failure of fluoropyrimidine-, oxaliplatin-, and irinotecan-containing chemotherapy regimens, was received in
December2007 and is reviewed annually by the Committee for Medicinal Products for Human Use (CHMP). Each year thereafter,
the EU conditional marketing authorization was renewed with an additional specific obligation to conduct a clinical trial in the
approved monotherapy indication. In 2010, we began enrollment for this additional clinical trial which compares the effect of
Vectibix® versus Erbitux® (cetuximab) on overall survival for chemorefractory mCRC patients with wild-type KRAS genes. KRAS
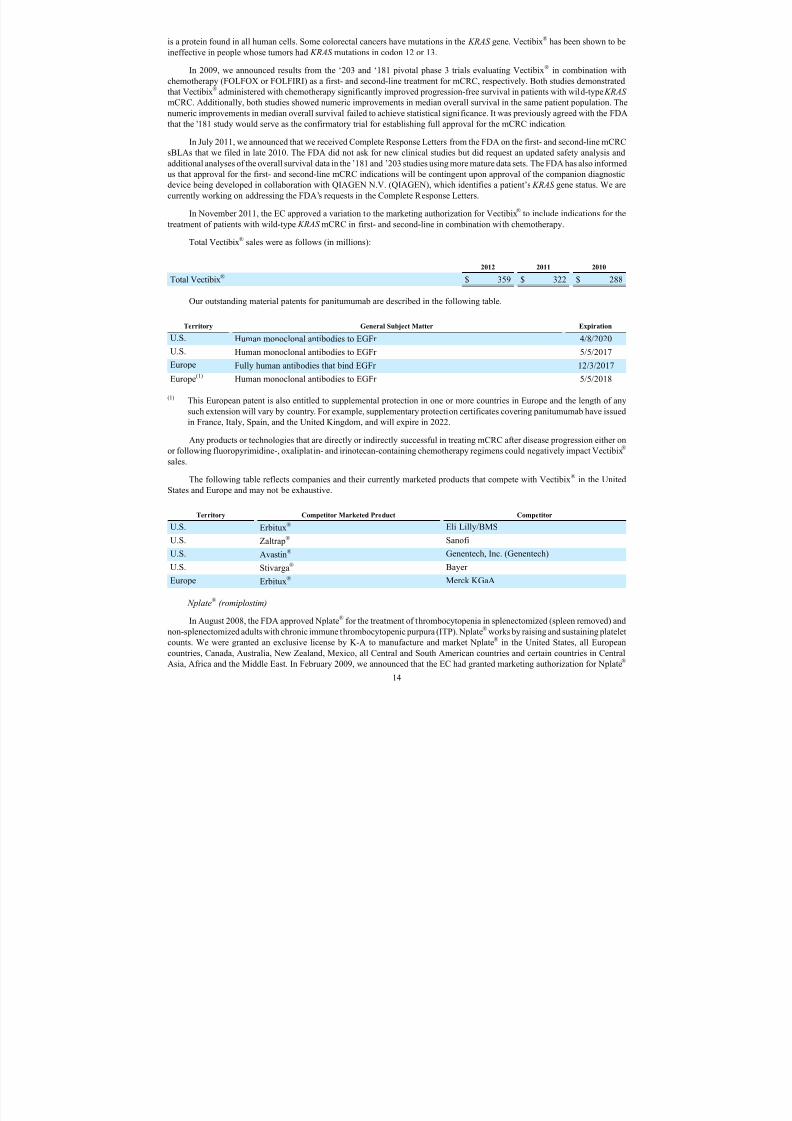
7/27/2019 Amgen Inc 2012 Annual Report
http://slidepdf.com/reader/full/amgen-inc-2012-annual-report 21/150
14
is a protein found in all human cells. Some colorectal cancers have mutations in the KRAS gene. Vectibix® has been shown to be
ineffective in people whose tumors had KRAS mutations in codon 12 or 13.
In 2009, we announced results from the ‘203 and ‘181 pivotal phase 3 trials evaluating Vectibix ® in combination with
chemotherapy (FOLFOX or FOLFIRI) as a first- and second-line treatment for mCRC, respectively. Both studies demonstrated
that Vectibix® administered with chemotherapy significantly improved progression-free survival in patients with wild-type KRAS
mCRC. Additionally, both studies showed numeric improvements in median overall survival in the same patient population. The
numeric improvements in median overall survival failed to achieve statistical significance. It was previously agreed with the FDA
that the '181 study would serve as the confirmatory trial for establishing full approval for the mCRC indication.
In July 2011, we announced that we received Complete Response Letters from the FDA on the first- and second-line mCRC
sBLAs that we filed in late 2010. The FDA did not ask for new clinical studies but did request an updated safety analysis and
additional analyses of the overall survival data in the ’181 and ’203 studies using more mature data sets. The FDA has also informed
us that approval for the first- and second-line mCRC indications will be contingent upon approval of the companion diagnostic
device being developed in collaboration with QIAGEN N.V. (QIAGEN), which identifies a patient’s KRAS gene status. We are
currently working on addressing the FDA’s requests in the Complete Response Letters.
In November2011, the EC approved a variation to the marketing authorization for Vectibix® to include indications for the
treatment of patients with wild-type KRAS mCRC in first- and second-line in combination with chemotherapy.
Total Vectibix® sales were as follows (in millions):
2012 2011 2010
Total Vectibix® $ 359 $ 322 $ 288
Our outstanding material patents for panitumumab are described in the following table.
Territory General Subject Matter Expiration
U.S. Human monoclonal antibodies to EGFr 4/8/2020
U.S. Human monoclonal antibodies to EGFr 5/5/2017
Europe Fully human antibodies that bind EGFr 12/3/2017
Europe(1) Human monoclonal antibodies to EGFr 5/5/2018
(1) This European patent is also entitled to supplemental protection in one or more countries in Europe and the length of any
such extension will vary by country. For example, supplementary protection certificates covering panitumumab have issuedin France, Italy, Spain, and the United Kingdom, and will expire in 2022.
Any products or technologies that are directly or indirectly successful in treating mCRC after disease progression either on
or following fluoropyrimidine-, oxaliplatin- and irinotecan-containing chemotherapy regimens could negatively impact Vectibix®
sales.
The following table reflects companies and their currently marketed products that compete with Vectibix ® in the United
States and Europe and may not be exhaustive.
Territory Competitor Marketed Product Competitor
U.S. Erbitux® Eli Lilly/BMS
U.S. Zaltrap® Sanofi
U.S. Avastin® Genentech, Inc. (Genentech)
U.S. Stivarga® Bayer
Europe Erbitux® Merck KGaA
Nplate®
(romiplostim)
In August2008, the FDA approved Nplate® for the treatment of thrombocytopenia in splenectomized (spleen removed) and
non-splenectomized adults with chronic immune thrombocytopenic purpura (ITP). Nplate® works by raising and sustaining platelet
counts. We were granted an exclusive license by K-A to manufacture and market Nplate® in the United States, all European
countries, Canada, Australia, New Zealand, Mexico, all Central and South American countries and certain countries in Central
Asia, Africa and the Middle East. In February2009, we announced that the EC had granted marketing authorization for Nplate®
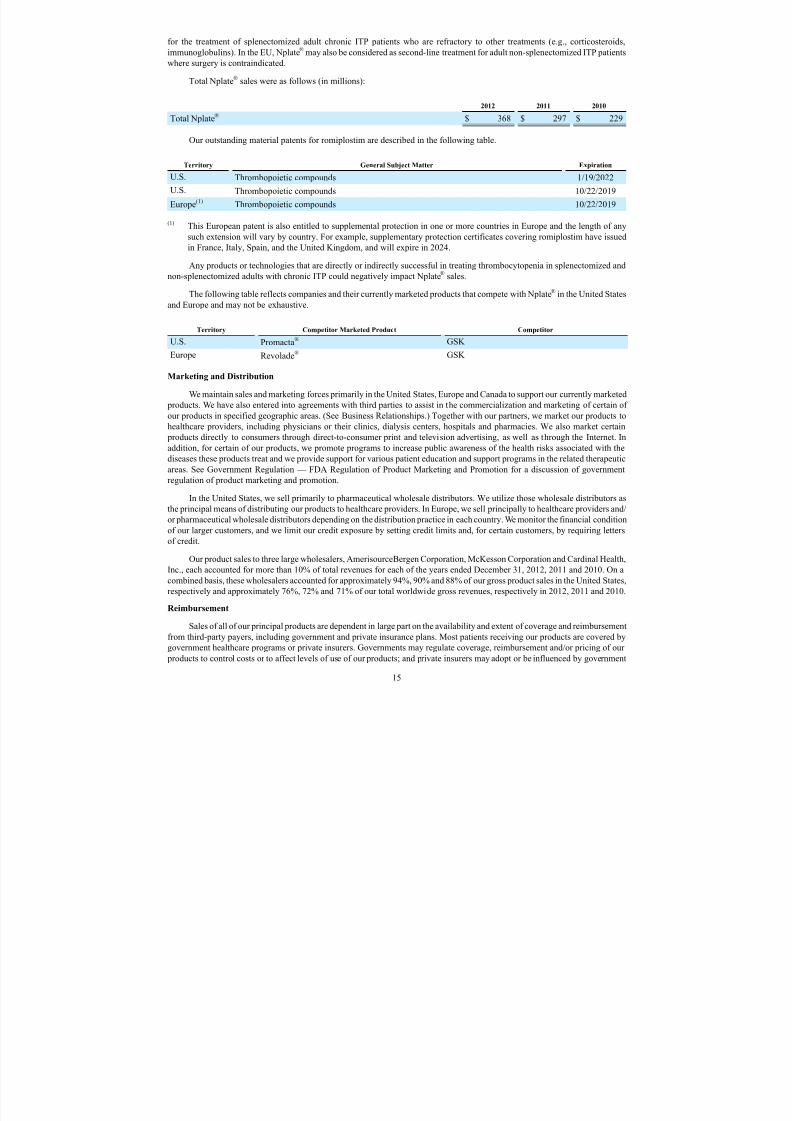
7/27/2019 Amgen Inc 2012 Annual Report
http://slidepdf.com/reader/full/amgen-inc-2012-annual-report 22/150
15
for the treatment of splenectomized adult chronic ITP patients who are refractory to other treatments (e.g., corticosteroids,
immunoglobulins). In the EU, Nplate® may also be considered as second-line treatment for adult non-splenectomized ITP patients
where surgery is contraindicated.
Total Nplate® sales were as follows (in millions):
2012 2011 2010
Total Nplate® $ 368 $ 297 $ 229
Our outstanding material patents for romiplostim are described in the following table.
Territory General Subject Matter Expiration
U.S. Thrombopoietic compounds 1/19/2022
U.S. Thrombopoietic compounds 10/22/2019
Europe(1) Thrombopoietic compounds 10/22/2019
(1) This European patent is also entitled to supplemental protection in one or more countries in Europe and the length of any
such extension will vary by country. For example, supplementary protection certificates covering romiplostim have issued
in France, Italy, Spain, and the United Kingdom, and will expire in 2024.
Any products or technologies that are directly or indirectly successful in treating thrombocytopenia in splenectomized and
non-splenectomized adults with chronic ITP could negatively impact Nplate® sales.
The following table reflects companies and their currently marketed products that compete with Nplate® in the United States
and Europe and may not be exhaustive.
Territory Competitor Marketed Product Competitor
U.S. Promacta® GSK
Europe Revolade® GSK
Marketing and Distribution
We maintain sales and marketing forces primarily in the United States, Europe and Canada to support our currently marketed
products. We have also entered into agreements with third parties to assist in the commercialization and marketing of certain of
our products in specified geographic areas. (See Business Relationships.) Together with our partners, we market our products to
healthcare providers, including physicians or their clinics, dialysis centers, hospitals and pharmacies. We also market certain
products directly to consumers through direct-to-consumer print and television advertising, as well as through the Internet. In
addition, for certain of our products, we promote programs to increase public awareness of the health risks associated with the
diseases these products treat and we provide support for various patient education and support programs in the related therapeutic
areas. See Government Regulation—FDA Regulation of Product Marketing and Promotion for a discussion of government
regulation of product marketing and promotion.
In the United States, we sell primarily to pharmaceutical wholesale distributors. We utilize those wholesale distributors as
the principal means of distributing our products to healthcare providers. In Europe, we sell principally to healthcare providers and/
or pharmaceutical wholesale distributors depending on the distribution practice in each country. We monitor the financial condition
of our larger customers, and we limit our credit exposure by setting credit limits and, for certain customers, by requiring letters
of credit.
Our product sales to three large wholesalers, AmerisourceBergen Corporation, McKesson Corporation and Cardinal Health,
Inc., each accounted for more than 10% of total revenues for each of the years ended December31, 2012, 2011 and 2010. On a
combined basis, these wholesalers accounted for approximately 94%, 90% and 88% of our gross product sales in the United States,
respectively and approximately 76%, 72% and 71% of our total worldwide gross revenues, respectively in 2012, 2011 and 2010.
Reimbursement
Sales of all of our principal products are dependent in large part on the availability and extent of coverage and reimbursement
from third-party payers, including government and private insurance plans. Most patients receiving our products are covered by
government healthcare programs or private insurers. Governments may regulate coverage, reimbursement and/or pricing of our
products to control costs or to affect levels of use of our products; and private insurers may adopt or be influenced by government
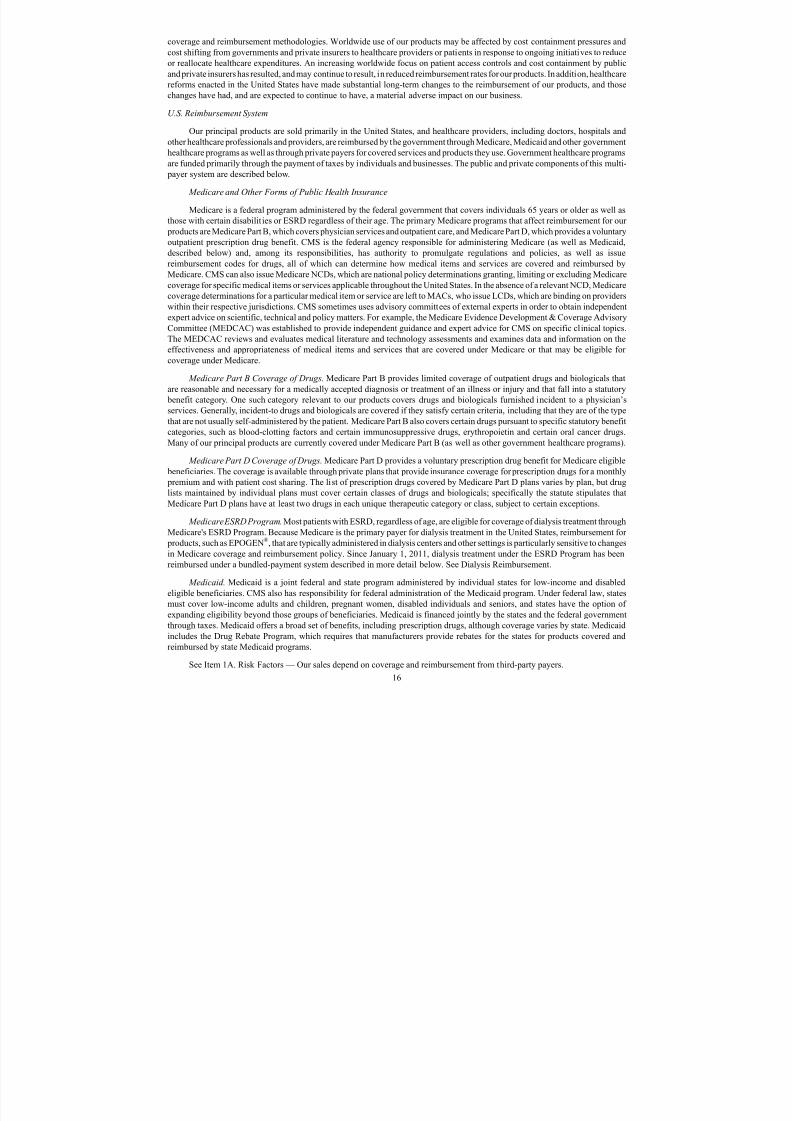
7/27/2019 Amgen Inc 2012 Annual Report
http://slidepdf.com/reader/full/amgen-inc-2012-annual-report 23/150
16
coverage and reimbursement methodologies. Worldwide use of our products may be affected by cost containment pressures and
cost shifting from governments and private insurers to healthcare providers or patients in response to ongoing initiatives to reduce
or reallocate healthcare expenditures. An increasing worldwide focus on patient access controls and cost containment by public
and private insurers has resulted, and may continue to result, in reduced reimbursement rates for our products. In addition, healthcare
reforms enacted in the United States have made substantial long-term changes to the reimbursement of our products, and those
changes have had, and are expected to continue to have, a material adverse impact on our business.
U.S. Reimbursement System
Our principal products are sold primarily in the United States, and healthcare providers, including doctors, hospitals and
other healthcare professionals and providers, are reimbursed by the government through Medicare, Medicaid and other government
healthcare programs as well as through private payers for covered services and products they use. Government healthcare programs
are funded primarily through the payment of taxes by individuals and businesses. The public and private components of this multi-
payer system are described below.
Medicare and Other Forms of Public Health Insurance
Medicare is a federal program administered by the federal government that covers individuals 65 years or older as well as
those with certain disabilities or ESRD regardless of their age. The primary Medicare programs that affect reimbursement for our
products are Medicare Part B, which covers physician services and outpatient care, and Medicare Part D, which provides a voluntary
outpatient prescription drug benefit. CMS is the federal agency responsible for administering Medicare (as well as Medicaid,
described below) and, among its responsibilities, has authority to promulgate regulations and policies, as well as issue
reimbursement codes for drugs, all of which can determine how medical items and services are covered and reimbursed by
Medicare. CMS can also issue Medicare NCDs, which are national policy determinations granting, limiting or excluding Medicarecoverage for specific medical items or services applicable throughout the United States. In the absence of a relevant NCD, Medicare
coverage determinations for a particular medical item or service are left to MACs, who issue LCDs, which are binding on providers
within their respective jurisdictions. CMS sometimes uses advisory committees of external experts in order to obtain independent
expert advice on scientific, technical and policy matters. For example, the Medicare Evidence Development & Coverage Advisory
Committee (MEDCAC) was established to provide independent guidance and expert advice for CMS on specific clinical topics.
The MEDCAC reviews and evaluates medical literature and technology assessments and examines data and information on the
effectiveness and appropriateness of medical items and services that are covered under Medicare or that may be eligible for
coverage under Medicare.
Medicare Part B Coverage of Drugs. Medicare Part B provides limited coverage of outpatient drugs and biologicals that
are reasonable and necessary for a medically accepted diagnosis or treatment of an illness or injury and that fall into a statutory
benefit category. One such category relevant to our products covers drugs and biologicals furnished incident to a physician’s
services. Generally, incident-to drugs and biologicals are covered if they satisfy certain criteria, including that they are of the typethat are not usually self-administered by the patient. Medicare Part B also covers certain drugs pursuant to specific statutory benefit
categories, such as blood-clotting factors and certain immunosuppressive drugs, erythropoietin and certain oral cancer drugs.
Many of our principal products are currently covered under Medicare Part B (as well as other government healthcare programs).
Medicare Part D Coverage of Drugs. Medicare Part D provides a voluntary prescription drug benefit for Medicare eligible
beneficiaries. The coverage is available through private plans that provide insurance coverage for prescription drugs for a monthly
premium and with patient cost sharing. The list of prescription drugs covered by Medicare Part D plans varies by plan, but drug
lists maintained by individual plans must cover certain classes of drugs and biologicals; specifically the statute stipulates that
Medicare Part D plans have at least two drugs in each unique therapeutic category or class, subject to certain exceptions.
Medicare ESRD Program. Most patients with ESRD, regardless of age, are eligible for coverage of dialysis treatment through
Medicare's ESRD Program. Because Medicare is the primary payer for dialysis treatment in the United States, reimbursement for
products, such as EPOGEN
®
, that are typically administered in dialysis centers and other settings is particularly sensitive to changesin Medicare coverage and reimbursement policy. Since January1, 2011, dialysis treatment under the ESRD Program has been
reimbursed under a bundled-payment system described in more detail below. See Dialysis Reimbursement.
Medicaid. Medicaid is a joint federal and state program administered by individual states for low-income and disabled
eligible beneficiaries. CMS also has responsibility for federal administration of the Medicaid program. Under federal law, states
must cover low-income adults and children, pregnant women, disabled individuals and seniors, and states have the option of
expanding eligibility beyond those groups of beneficiaries. Medicaid is financed jointly by the states and the federal government
through taxes. Medicaid offers a broad set of benefits, including prescription drugs, although coverage varies by state. Medicaid
includes the Drug Rebate Program, which requires that manufacturers provide rebates for the states for products covered and
reimbursed by state Medicaid programs.
See Item1A. Risk Factors—Our sales depend on coverage and reimbursement from third-party payers.
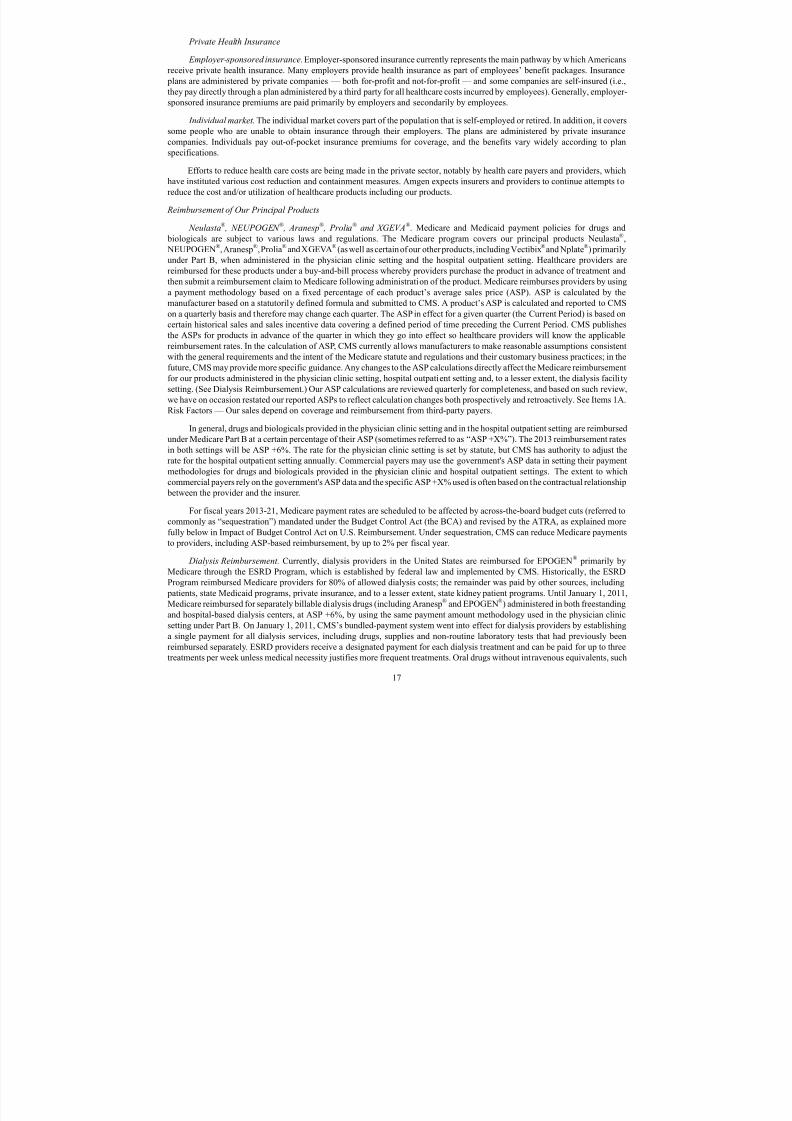
7/27/2019 Amgen Inc 2012 Annual Report
http://slidepdf.com/reader/full/amgen-inc-2012-annual-report 24/150
17
Private Health Insurance
Employer-sponsored insurance. Employer-sponsored insurance currently represents the main pathway by which Americans
receive private health insurance. Many employers provide health insurance as part of employees’ benefit packages. Insurance
plans are administered by private companies — both for-profit and not-for-profit — and some companies are self-insured (i.e.,
they pay directly through a plan administered by a third party for all healthcare costs incurred by employees). Generally, employer-
sponsored insurance premiums are paid primarily by employers and secondarily by employees.
Individual market. The individual market covers part of the population that is self-employed or retired. In addition, it covers
some people who are unable to obtain insurance through their employers. The plans are administered by private insurance
companies. Individuals pay out-of-pocket insurance premiums for coverage, and the benefits vary widely according to plan
specifications.
Efforts to reduce health care costs are being made in the private sector, notably by health care payers and providers, which
have instituted various cost reduction and containment measures. Amgen expects insurers and providers to continue attempts to
reduce the cost and/or utilization of healthcare products including our products.
Reimbursement of Our Principal Products
Neulasta® , NEUPOGEN
® , Aranesp
® , Prolia
®and XGEVA
®. Medicare and Medicaid payment policies for drugs and
biologicals are subject to various laws and regulations. The Medicare program covers our principal products Neulasta®,
NEUPOGEN®, Aranesp®, Prolia® and XGEVA® (as well as certain of our other products, including Vectibix®and Nplate®) primarily
under Part B, when administered in the physician clinic setting and the hospital outpatient setting. Healthcare providers are
reimbursed for these products under a buy-and-bill process whereby providers purchase the product in advance of treatment andthen submit a reimbursement claim to Medicare following administration of the product. Medicare reimburses providers by using
a payment methodology based on a fixed percentage of each product’s average sales price (ASP). ASP is calculated by the
manufacturer based on a statutorily defined formula and submitted to CMS. A product’s ASP is calculated and reported to CMS
on a quarterly basis and therefore may change each quarter. The ASP in effect for a given quarter (the Current Period) is based on
certain historical sales and sales incentive data covering a defined period of time preceding the Current Period. CMS publishes
the ASPs for products in advance of the quarter in which they go into effect so healthcare providers will know the applicable
reimbursement rates. In the calculation of ASP, CMS currently allows manufacturers to make reasonable assumptions consistent
with the general requirements and the intent of the Medicare statute and regulations and their customary business practices; in the
future, CMS may provide more specific guidance. Any changes to the ASP calculations directly affect the Medicare reimbursement
for our products administered in the physician clinic setting, hospital outpatient setting and, to a lesser extent, the dialysis facility
setting. (See Dialysis Reimbursement.) Our ASP calculations are reviewed quarterly for completeness, and based on such review,
we have on occasion restated our reported ASPs to reflect calculation changes both prospectively and retroactively. See Items 1A.
Risk Factors—Our sales depend on coverage and reimbursement from third-party payers.
In general, drugs and biologicals provided in the physician clinic setting and in the hospital outpatient setting are reimbursed
under Medicare Part B at a certain percentage of their ASP (sometimes referred to as “ASP +X%”). The 2013 reimbursement rates
in both settings will be ASP +6%. The rate for the physician clinic setting is set by statute, but CMS has authority to adjust the
rate for the hospital outpatient setting annually. Commercial payers may use the government's ASP data in setting their payment
methodologies for drugs and biologicals provided in the physician clinic and hospital outpatient settings. The extent to which
commercial payers rely on the government's ASP data and the specific ASP +X% used is often based on the contractual relationship
between the provider and the insurer.
For fiscal years 2013-21, Medicare payment rates are scheduled to be affected by across-the-board budget cuts (referred to
commonly as “sequestration”) mandated under the Budget Control Act (the BCA) and revised by the ATRA, as explained more
fully below in Impact of Budget Control Act on U.S. Reimbursement. Under sequestration, CMS can reduce Medicare payments
to providers, including ASP-based reimbursement, by up to 2% per fiscal year. Dialysis Reimbursement. Currently, dialysis providers in the United States are reimbursed for EPOGEN ® primarily by
Medicare through the ESRD Program, which is established by federal law and implemented by CMS. Historically, the ESRD
Program reimbursed Medicare providers for 80% of allowed dialysis costs; the remainder was paid by other sources, including
patients, state Medicaid programs, private insurance, and to a lesser extent, state kidney patient programs. Until January1, 2011,
Medicare reimbursed for separately billable dialysis drugs (including Aranesp® and EPOGEN®) administered in both freestanding
and hospital-based dialysis centers, at ASP +6%, by using the same payment amount methodology used in the physician clinic
setting under Part B. On January1, 2011, CMS’s bundled-payment system went into effect for dialysis providers by establishing
a single payment for all dialysis services, including drugs, supplies and non-routine laboratory tests that had previously been
reimbursed separately. ESRD providers receive a designated payment for each dialysis treatment and can be paid for up to three
treatments per week unless medical necessity justifies more frequent treatments. Oral drugs without intravenous equivalents, such
7/27/2019 Amgen Inc 2012 Annual Report
http://slidepdf.com/reader/full/amgen-inc-2012-annual-report 25/150
18
as Sensipar ® and phosphate binders, will continue to be reimbursed separately under the Medicare Part D benefit until they are
included in the bundled-payment system in 2016. Inclusion in the bundled-payment system may reduce utilization of these oral
drugs and have an adverse impact on our sales.
To encourage dialysis providers to continue to provide quality dialysis treatment under the new bundled-payment system,
CMS also implemented the ESRD QIP. Under the QIP, beginning in 2012, ESRD facilities are subject to a payment penalty of up
to 2% of amounts reimbursed for failure to meet or exceed CMS’s quality performance standards, including performance standards
related to anemia management and dialysis adequacy. In November 2011, following our June 2011 announcement of changes to
the labels for the use of ESAs in patients with CKD, CMS finalized a rule to update various provisions of its bundled-payment
system for dialysis services and the related ESRD QIP. The final rule eliminated for payment year 2013 and beyond one of theQIP's measures that tracks the percent of a provider's Medicare patients with a Hb level below 10 g/dL. CMS indicated that removal
of this quality measure from the QIP was being done in response to the June 2011 ESA label changes. We believe that the
implementation of these various changes in the dialysis setting has resulted and could result in a material adverse impact on the
reimbursement, use and sales of EPOGEN® and on our business and results of operations. Data available through October 2012
indicates a stabilization of Hb levels.
ENBREL Reimbursement. The majority of prescription claims for ENBREL are paid through private insurance companies.
Under Medicare, ENBREL is reimbursed through the Part D program, although less than 10% of all ENBREL U.S. prescriptions
are reimbursed by Medicare.
Mandatory Government Rebates and Discounts
Since 1991, we have participated in the Medicaid drug rebate program established in Section1927 of the Social Security
Act by the Omnibus Budget Reconciliation Act of 1990 and subsequent amendments of that law. Under the Medicaid drug rebate program, we pay a rebate to the states for each unit of our product reimbursed by state Medicaid programs. The amount of the
rebate for each of our products is currently set by law as a minimum of 23.1% of the Average Manufacturer Price (AMP) of that
product, or if it is greater, the difference between AMP and the best price available from us to any non-government customer. The
rebate amount is determined for each quarter based on our reports to CMS of the quarter’s AMP and best price for each of our
products. The rebate amount also includes an inflation adjustment if AMP increases faster than inflation. The statutory definition
of AMP changed in 2010 as a result of the U.S. healthcare reform law, and in January 2012, CMS issued a proposed rule further
defining the new AMP definition. Until that rule is finalized, we are required to make reasonable assumptions when calculating
AMP. Once CMS’s proposed rule is finalized, we will have to determine whether our calculations should be amended and whether
we will need to restate our prior AMPs. The terms of our participation in the Medicaid drug rebate program impose an obligation
to correct the prices reported in previous quarters, as may be necessary. Any such corrections could result in an overage or underage
in our rebate liability for past quarters, depending on the direction of the correction. In addition to retroactive rebates, if we were
found to have knowingly submitted false information to the government, in addition to other penalties available to the government,
the statute provides for civil monetary penalties in the amount of $100,000 per item of false information.
Related to our participation in the Medicaid drug rebate program is a requirement that we extend comparable discounts
under the Public Health Service (PHS) drug pricing program to eligible community health clinics and other entities that receive
health services grants from the PHS, as well as hospitals that serve a disproportionate share of Medicare and Medicaid beneficiaries.
We also make our products available to authorized users of the Federal Supply Schedule (FSS) of the General Services
Administration. Since 1993, as a result of the Veterans Health Care Act of 1992 (VHC Act), federal law has required that we offer
deeply discounted FSS contract pricing for purchases by the Department of Veterans Affairs, the Department of Defense, the Coast
Guard and the PHS (including the Indian Health Service) in order for federal funding to be available for reimbursement of our
products under the Medicaid program or purchase of our products by those four federal agencies and certain federal grantees. FSS
pricing to those four federal agencies must be equal to or less than the Federal Ceiling Price (FCP), which is 24% below the Non-
Federal Average Manufacturer Price (Non-FAMP) for the prior fiscal year. The accuracy of our reported Non-FAMPs, FCPs and
our FSS contract prices may be audited by the government under applicable federal procurement laws and the terms of our FSScontract. Among the remedies available to the government for inaccuracies in calculation of Non-FAMPs and FCPs is recoupment
of any overcharges to the four specified federal agencies based on those inaccuracies. Also, if we were found to have knowingly
reported a false Non-FAMP, in addition to other penalties available to the government, the VHC Act provides for civil monetary
penalties of $100,000 per item that is incorrect. Finally, we are required to disclose in our FSS contract proposal all commercial
pricing that is equal to or less than our proposed FSS pricing, and subsequent to award of an FSS contract, we are required to
monitor certain commercial price reductions and extend commensurate price reductions to the government, under the terms of the
FSS contract price reductions clause. Among the remedies available to the government for any failure to properly disclose
commercial pricing and/or to extend FSS contract price reductions is recoupment of any FSS overcharges that may result from
such omissions.
7/27/2019 Amgen Inc 2012 Annual Report
http://slidepdf.com/reader/full/amgen-inc-2012-annual-report 26/150
19
U.S. Healthcare Reform. In March 2010, the Patient Protection and Affordable Care Act (PPACA) and the companion Health
Care and Education Reconciliation Act, which made certain changes and adjustments to the PPACA, primarily with respect to the
PPACA’s financial and budgetary impacts, were signed into law. We refer to those two laws collectively as the “U.S. healthcare
reform law.” The U.S. healthcare reform law imposes additional costs on and reduces the revenue of companies in the biotechnology
and pharmaceutical industries. The following paragraphs describe certain provisions of the healthcare reform law that are affecting
and will affect our business.
The U.S. healthcare reform law also imposed a new fee (the U.S. healthcare reform federal excise fee) on manufacturers
and importers of “branded prescription drugs,” which includes drugs approved under section 505(b) of the Federal Food, Drug
and Cosmetic Act (FDCA) or biological products licensed under section 351(a) of the Public Health Service Act. The U.S. healthcarereform law set an aggregate annual fee, to be paid by these manufacturers and importers, totaling $28 billion over 10 years beginning
in 2011. This annual fee is apportioned among the participating companies, including us, based on each company’s sales of
qualifying products to, and utilization by, certain U.S. government programs during the preceding calendar year. The additional
fee is not deductible for U.S. federal income tax purposes. Manufacturers and importers of generic or biosimilar drugs are not
subject to the fee.
Other changes under the U.S. healthcare reform law that became effective in 2010 include: (i) an increase in the rebates we
pay to the states for our products that are covered and reimbursed by state Medicaid programs, (ii) the extension of the Medicaid
drug rebate program to patients in Medicaid managed care insurance plans for whom rebates were not previously required and
(iii) the expansion of the list of provider institutions to which we must extend discounts under the PHS 340B drug-pricing program.
When the Medicare Part D drug benefit took effect in 2006, standard benefit Part D plan enrollees were required to pay
100% of their prescription drug costs after their total drug spending exceeded an initial coverage limit and until they qualified for
catastrophic coverage. This coverage gap is sometimes referred to as the Part D “doughnut hole.” Then the PPACA directed CMS
to phase out up to 50% of this coverage gap from 2011 to 2020. Under the standard benefit, cost sharing for both brand and generic
drugs will be reduced each year until 2020, when the coverage gap will be eliminated and beneficiaries will pay 25% cost sharing
for all drugs until they reach the out-of-pocket threshold. Manufacturers like Amgen are presently required to provide a 50% cost
sharing discount for beneficiaries in the doughnut hole.
The U.S. healthcare reform law also expands Medicaid eligibility to include those with incomes up to 133% of the federal
poverty level (FPL), from 100% of the FPL. This provision becomes effective January1, 2014.
Impact of Budget Control Act on U.S. Reimbursement
The Budget Control Act of 2011, signed into law in the United States in August 2011, mandated a 2% reduction in government
payments for all Medicare services (including the administration of separately billable drugs and payment for drugs in all Medicare
programs) for federal fiscal years 2013-21. The impact of sequestration remains subject to administrative implementation of theBudget Control Act, as updated by the more recent ATRA, or future statutory revision by Congress, which could block, limit or
otherwise modify the automatic spending cuts. Several alternative deficit reduction proposals have been put forth by President
Obama and/or congressional committees, including proposals designed to further limit federal healthcare expenditures. We cannot
predict whether any deficit reduction actions will be approved by Congress and/or whether a budget sequestration will ultimately
occur for Medicare services. A reduction in reimbursement for drugs and biologics for U.S. healthcare programs as a result of
changes such as those that have been proposed or as a result other changes designed to achieve similar federal budget savings
could have a material adverse effect on the sales of our products, our business and results of operations.
Reimbursement Outside the United States
Generally, in Europe and other countries outside the United States, government-sponsored healthcare systems have
traditionally been the primary payers of all healthcare costs, including payment for drugs and biologicals. Over the past several
years, the reimbursement environment in Europe has become very challenging. The proliferation of Health Technology Assessment
(HTA) organizations (e.g., National Institute for Health and Clinical Excellence (NICE) in the UK and the German Institute for Quality and Efficiency in Health Care (IQWiG) in Germany) has led to recommendations and/or determinations of coverage and
reimbursement based on both the clinical as well as the economic value of a product. Although the methods employed by different
HTA agencies vary from country to country, the use of formal economic metrics has been increasing across Europe as well as in
several emerging markets throughout the world. In addition to determining whether or not a new product will be reimbursed, these
agencies are becoming increasingly involved in setting the maximum price at which the product will be reimbursed-the “value-
based” price for a product.
With increased budgetary constraints, payers in many countries employ a variety of measures to exert downward price
pressure. Mandatory price controls continue to be a significant aspect of business for the pharmaceutical and biotechnology
industries in most countries outside the United States. In some countries, international price referencing is the primary mechanism
for price control, whereby the ceiling price of a pharmaceutical or biological product is set based on prices in particular benchmark
7/27/2019 Amgen Inc 2012 Annual Report
http://slidepdf.com/reader/full/amgen-inc-2012-annual-report 27/150
20
countries. These price-referencing rules are increasing in complexity as payers seek lower-price benchmarks against which to
compare themselves. Trends across Europe are also leading toward increased price transparency, with the development of databases
to include prices across Europe and requests from specific national payers that manufacturers provide commercially confidential
net price information. Additional cost-containment measures can include therapeutic reference pricing (e.g., setting the
reimbursement rate for a given class of agents at the lowest price within the class), increasing mandates or incentives for generic
substitution and biosimilar usage, and government-mandated price cuts. In addition, healthcare reform and related legislative
proposals in such countries as France, Germany, and Poland, as well as austerity plans in a number of countries, including Spain,
Greece, Italy, Ireland and Portugal, have targeted the pharmaceutical sector with multiple mechanisms to reduce government
healthcare expenditures. We expect that countries will continue to take aggressive actions to reduce expenditures on drugs and
biologics, including mandatory price reductions, clawbacks of payments made to companies when drug spending thresholds areexceeded, preferences for biosimilars, changes in international price referencing, price transparency to achieve prices similar to
those in lower-priced countries, and reductions in the amount of reimbursement, sometimes with the imposition of patient
copayments.Similarly, fiscal constraints may also impact the extent to which countries are willing to reward new innovative
therapies and/or allow access to new technologies. This could impact coverage, price, time to achieve reimbursement, and ultimate
level of reimbursement.
In many countries, the influence of regional and hospital payers also contributes to whether patients have access to certain
products. For example, a product may be listed successfully on a national formulary, but may also be subject to further evaluations
or competitive bidding by payers at a regional or hospital level. The impact of multiple layers of assessment can result in delay
or failure to secure access and/or net price pressure.
Payers in some countries are using and others are beginning to experiment with alternative payment mechanisms (e.g.,
payment caps, risk sharing) as a means to achieve or maintain access to innovative therapies while increasing their budget certainty.Requirements for such payment mechanisms can adversely impact Amgen’s business through increased net price concessions and
added administrative burden.
While we cannot fully predict either the extent of further price reductions and/or reimbursement restrictions taken by
governmental payers outside the United States or the impact such actions will have on our business, such reductions in price and/
or the coverage and reimbursement for our products could have a material adverse effect on the sales of our products, our business
and results of operations.
Fraud and Abuse Regulations Related to Reimbursement
As participants in government reimbursement programs, we are subject to various U.S. federal and state laws, as well as
foreign laws, pertaining to healthcare “fraud and abuse,” including anti-kickback laws and false claims laws. (See Government
Regulation — Other .) Violations of fraud and abuse laws can result in stringent enforcement penalties up to and including complete
exclusion from federal healthcare programs (including Medicare and Medicaid).
Manufacturing, Distribution and Raw Materials
Manufacturing
Biological products, which are produced in living systems, are inherently complex due to naturally-occurring molecular
variations. Highly specialized knowledge and extensive process and product characterization are required to transform laboratory-
scale processes into reproducible commercial manufacturing processes. Our manufacturing operations consist of bulk
manufacturing, formulation, fill and finish and distribution activities. Bulk manufacturing includes fermentation and/or cell culture
— processes by which our proteins are produced — and also includes purification of the proteins to a high quality. The proteins
are then formulated into stable forms. The fill process dispenses the formulated bulk protein into vials or syringes. Finally, in the
finish process, our products are packaged for distribution.
We operate a number of commercial and/or clinical manufacturing facilities, and our primary facilities are located in theUnited States, Puerto Rico and the Netherlands. (See Item2. Properties.) We also use and expect to continue to use third-party
contract manufacturers to produce or assist in the production of certain of our large molecule marketed products as well as a
number of our clinical product candidates. Manufacturing of Sensipar ®/Mimpara®, our small molecule product, is currently
performed by third-party contract manufacturers, except for certain fill and finish activities performed by us in Puerto Rico.
The global supply of our products depends on actively managing the inventory produced at our facilities and by third-party
contract manufacturers and the uninterrupted and efficient operation of these facilities. During the manufacturing scale-up process,
and even after achieving sustainable commercial manufacturing, we may encounter difficulties or disruptions due to defects in
raw materials or equipment, contamination or other factors that could impact product availability. See Item1A. Risk
Factors—Manufacturing difficulties, disruptions or delays could limit supply of our products and limit our product sales and—We
rely on third-party suppliers for certain of our raw materials, medical devices and components.
7/27/2019 Amgen Inc 2012 Annual Report
http://slidepdf.com/reader/full/amgen-inc-2012-annual-report 28/150
21
Commercial Bulk Manufacturing
We operate commercial bulk manufacturing facilities in Puerto Rico and in several locations throughout the United States
for most of our products. (See Item2. Properties.) We have the option to supplement commercial bulk manufacturing for ENBREL,
Prolia®, XGEVA® and Vectibix® with a third-party contract manufacturer.
Commercial Formulation, Fill and Finish Manufacturing
We perform most of our commercial protein formulation, fill and finish manufacturing in our Puerto Rico facility.
Formulation, fill and finish manufacturing for Nplate® and Vectibix® is performed by third-party contract manufacturers. In addition
to the formulation, fill and finish of ENBREL performed by us in Puerto Rico, fill and finish of a certain portion of ENBREL isalso performed by third-party contract manufacturers. We also conduct finish activities in the Netherlands. See Item2. Properties.
Clinical Manufacturing
Clinical bulk, formulation, fill and finish manufacturing facilities are operated primarily in our Thousand Oaks, California,
location. We also utilize third-party contract manufacturers for certain clinical products.
See Item1A. Risk Factors—We perform a substantial amount of our commercial manufacturing activities at our Puerto
Rico manufacturing facility and a substantial amount of our clinical manufacturing activities at our Thousand Oaks, California
manufacturing facility; if significant natural disasters or production failures occur at the Puerto Rico facility, we may not be able
to supply these products or, at the Thousand Oaks facility, we may not be able to continue our clinical trials.
Distribution
We operate distribution centers in the United States, principally in Kentucky, California and the Netherlands for worldwide
distribution of the majority of our commercial and clinical products. In addition, we also use third-party distributors to supplement
distribution of our commercial and clinical products in certain areas of the world.
Other
In addition to the manufacturing and distribution activities noted above, our operations in the United States, Puerto Rico and
the Netherlands perform key manufacturing support functions, including quality control, process development, procurement,
distribution and production scheduling. Certain of those manufacturing and distribution activities are highly regulated by the FDA
as well as other international regulatory agencies. See Government Regulation—FDA Regulation of Manufacturing Standards.
Manufacturing Initiatives
We have multiple ongoing initiatives that are designed to optimize our manufacturing network and/or mitigate risks whilecontinuing to ensure adequate supply of our commercial products. The facilities impacted by each of these initiatives will require
qualification and licensure by various regulatory authorities. These initiatives include the construction of a formulation and fill
facility at our Puerto Rico site; and as part of a risk mitigation strategy, we plan modification and expansion of our recently acquired
formulation, fill and finish site in Ireland to manufacture our products.
In addition to these initiatives, we have projects designed to operate our facilities at appropriate production capacity over
the next few years, further optimize manufacturing asset utilization, continue our use of third-party contract manufacturers and
maintain a state of regulatory compliance. See Item1A. Risk Factors—Manufacturing difficulties, disruptions or delays could
limit supply of our products and limit our product sales.
Raw Materials and Medical Devices
Certain raw materials necessary for the commercial and clinical bulk manufacturing of our products are provided by
unaffiliated third-party suppliers, certain of which may be our only sources for such materials. Also, certain medical devices andcomponents necessary for the formulation, fill and finish of our products are provided by unaffiliated third-party suppliers, certain
of which may be the sole sources. Certain of the raw materials, medical devices and components are the proprietary products of
those unaffiliated third-party suppliers and are specifically cited in our drug application with regulatory agencies so that they must
be obtained from the specific sole source or sources and could not be obtained from another supplier unless and until the regulatory
agency approved such supplier. We currently attempt to manage the risk associated with such suppliers by inventory management,
relationship management and evaluation of alternative sources when feasible. We also monitor the financial condition of certain
suppliers and their ability to supply our needs.
Certain of the raw materials required in the commercial and clinical manufacturing of our products are sourced from other
countries and/or derived from biological sources, including mammalian tissues. In addition, one of our marketed products also
uses bovine serum and human serum albumin. Some countries in which we market our products may restrict the use of certain

7/27/2019 Amgen Inc 2012 Annual Report
http://slidepdf.com/reader/full/amgen-inc-2012-annual-report 29/150
22
biologically derived substances in the manufacture of drugs. We continue to investigate alternatives to certain biological sources
and alternative manufacturing processes that do not require the use of certain biologically derived substances because such raw
materials may be subject to contamination and/or recall. A material shortage, contamination, recall and/or restriction of the use of
certain biologically derived substances or other raw materials that may be sourced from other countries and that are used in the
manufacture of our products could adversely impact or disrupt the commercial manufacturing of our products or could result in
a mandated withdrawal of our products from the market. See Item1A. Risk Factors—We rely on third-party suppliers for certain
of our raw materials, medical devices and components.
We perform various procedures to assist in authenticating the source of raw materials, including intermediary materials used
in the manufacture of our products, which include verification of the country of origin. These procedures are incorporated intothe manufacturing processes we and our third-party contract manufacturers perform.
Government Regulation
Regulation by government authorities in the United States and other countries is a significant factor in the production and
marketing of our products and our ongoing R&D activities.
In order to clinically test, manufacture and market products for therapeutic use, we must satisfy mandatory procedures and
safety and effectiveness standards established by various regulatory bodies. In the United States, the Public Health Service Act,
the FDCA and the regulations promulgated thereunder, as well as other federal and state statutes and regulations govern, among
other things, the raw materials and components used in the production, research, development, testing, manufacture, quality control,
labeling, storage, record keeping, approval, advertising and promotion, and distribution of our products. Failure to comply with
the applicable regulatory requirements may subject us to a variety of administrative and/or judicially imposed sanctions. The
sanctions could include the FDA’s refusal to approve pending applications, withdrawals of approvals, delay or suspension of clinical trials, warning letters, product recalls, product seizures, total or partial suspension of our operations, injunctions, fines,
civil penalties and/or criminal prosecution.
Clinical Development. We must conduct extensive clinical trials designed to establish the safety and efficacy of product
candidates in order to file for regulatory approval to market a product. Product development and approval within that regulatory
framework take a number of years and involve our expenditure of substantial resources, and any approval we obtain remains costly
for us to maintain. After laboratory analysis and preclinical testing in animals, we file an Investigational New Drug Application
(IND) with the FDA to begin human testing. The IND automatically becomes effective 30 days after receipt by the FDA, unless
the FDA raises concerns or questions. In such a case, we and the FDA must resolve any outstanding concerns before the clinical
trial can begin.
Typically, we undertake a three-phase human clinical testing program. In phase 1, we conduct small clinical trials to investigate
the safety and proper dose ranges of our product candidates in a small number of human subjects. In phase 2, we conduct clinicaltrials to investigate side effect profiles and the efficacy of our product candidates in a larger number of patients who have the
disease or condition under study. In phase3, we conduct clinical trials to investigate the safety and efficacy of our product candidates
in a large number of patients who have the disease or condition under study. The time and expense required for us to perform this
clinical testing are substantial and may vary by product. For example, the phase 3 ongoing clinical trials for AMG 145 are large
and require substantial time and resources to recruit patients and significant expense to execute. Foreign studies performed under
an IND must meet the same requirements that apply to U.S. studies. The FDA will accept a foreign clinical study not conducted
under an IND only if the study is well-designed, well-conducted, performed by qualified investigators and conforms to good
clinical practice. Phase 1, 2 and 3 testing may not be completed successfully within any specified time period, if at all. (See
Item1A. Risk Factors—We may not be able to develop commercial products.) The FDA monitors the progress of each trial
conducted under an IND and may, at its discretion, re-evaluate, alter, suspend or terminate the testing based on the data accumulated
to that point and the FDA’s risk/benefit assessment with regard to the patients enrolled in the trial. See Item1A. Risk Factors—We
must conduct clinical trials in humans before we can commercialize and sell any of our product candidates or existing products
for new indications.
Applications. The results of preclinical and clinical trials are submitted to the FDA in the form of a BLA for biologic products
subject to the Public Health Service Act or an NDA for drugs subject to the approval provisions of the FDCA. Submission of the
application is no guarantee that the FDA will find it complete and accept it for filing. If an application is accepted for filing,
following the FDA’s review, the FDA may grant marketing approval, request additional information or deny the application if it
determines that the application does not provide an adequate basis for approval. We cannot take any action to market any new
drug or biologic product in the United States until our appropriate marketing application has been approved by the FDA.
Post-approval Phase. After we have obtained approval to market our products, we monitor adverse events from the use of
our products and report such events to regulatory agencies, along with information from post marketing surveillance or studies.
We may utilize other research approaches to learn or confirm information about our marketed products, including observational

7/27/2019 Amgen Inc 2012 Annual Report
http://slidepdf.com/reader/full/amgen-inc-2012-annual-report 30/150
23
studies and patient registries, and may engage in risk management activities such as physician education initiatives and patient
advocacy group initiatives. We may also conduct or be required by regulatory agencies to conduct further clinical trials to provide
additional information on our marketed products’ safety and efficacy. Those additional trials may include studying doses or
schedules of administration different from those used in previous studies, use in other patient populations or other stages of the
disease or use over a longer period of time. Additional trials of this nature are sometimes required by regulatory agencies as a
condition of their approval to market our products, and they might also request or require that we conduct specific studies, including
observational epidemiological studies, in order to identify or assess possible safety risks of our marketed products that are observed
or suggested by available scientific data and such trials are sometimes referred to as PMCs or PMRs. In the United States, if the
FDA becomes aware of new safety information after approval of a product, it may require us to conduct further clinical trials to
assess a known or potential serious risk. If we are required to conduct such a post-approval study, periodic status reports must besubmitted to the FDA. Failure to conduct such post-approval studies in a timely manner may result in substantial civil or criminal
penalties. Data resulting from these clinical trials may result in expansions or restrictions to the labeled indications for which our
products have already been approved and to the reimbursement provided by government and commercial payers for our products.
The FDA also has the authority to require companies to implement a REMS for a product to ensure that the benefits of the
drug outweigh the risks. The FDA may require the submission of a REMS before a product is approved or after approval based
on new safety information, including new analyses of existing safety information. In determining whether a product will require
a REMS before the product is approved, the FDA may consider a number of factors.
Each REMS is unique and varies depending on the specific factors required. While the elements of REMS may vary, all
REMS require the sponsor to submit periodic assessment reports to the FDA to demonstrate that the goals of the REMS are being
met. Failure to comply with a REMS, including submission of a required assessment or any modification to a REMS, may result
in substantial civil or criminal penalties and can result in additional limitations being placed on a product’s use and, potentially,withdrawal of the product from the market. We currently have approved REMS for our ESAs, Prolia® and Nplate®. The FDA and
sponsor companies continue to learn how best to implement, operate and monitor the effectiveness of REMS, and the requirements
of our REMS and those of other companies may change over time. The FDA published guidance intended to limit or remove
REMS requirements for certain products. The FDA will also be looking at ways to standardize REMS programs, with the intent
to make the establishment, review and assessment of these programs less burdensome on the agency and the sponsor. The FDA
will hold a series of public meetings on REMS over the next several years and will solicit stakeholder feedback in an effort to
continue to focus and improve their risk management oversight.
Adverse events that are reported after marketing approval also can result in additional limitations being placed on a product’s
use and, potentially, withdrawal of the product from the market. The FDA has authority to mandate labeling changes to products
at any point in a product’s lifecycle based on new safety information or as part of an evolving label change to a particular class
of products.
The FDA also uses various advisory committees of external experts to assist in its mission to protect and promote the public
health and to obtain independent expert advice on scientific, technical and policy matters. The committees are generally advisory
only and FDA officials are not bound to or limited by their recommendations. We have participated in meetings of the Oncology
Drug Advisory Committee, the Cardiovascular and Renal Drug Advisory Committee and the Advisory Committee for Reproductive
Health Drugs, among others, to address certain issues related to our products, including Aranesp ®, EPOGEN®, Prolia® and
XGEVA®.
FDA Approval of Biosimilars. The PPACA authorizes the FDA to approve biosimilars via a separate, abbreviated pathway.
The law establishes a period of 12 years of data exclusivity for reference products in order to preserve incentives for future
innovation and outlines statutory criteria for science-based biosimilar approval standards that take into account patient safety
considerations. Under this framework, data exclusivity protects the data in the innovator’s regulatory application by prohibiting
others, for a period of 12 years, from gaining FDA approval based in part on reliance on or reference to the innovator’s data in
their application to the FDA. The new law does not change the duration of patents granted on biologic products. In February 2012,
the FDA released three draft guidance documents as part of the implementation of the abbreviated approval pathway for biosimilars.While the FDA guidance documents are not legally binding on the public or on the FDA, they indicate the FDA’s current thinking
on the development of biosimilars. The draft guidance documents provide insight on a range of technical, scientific and regulatory
issues. The guidance documents generally provide that, for approval, a sponsor must demonstrate that the proposed product is
“biosimilar” (a term defined by statute) to a single reference product already licensed by the FDA. In assessing biosimilarity, the
FDA indicated that it intends to use a risk-based “totality of the evidence” approach to evaluate all available data submitted by
the applicant. Generally, a biosimilar application must include a clinical study or studies sufficient to demonstrate safety, purity
and potency in one or more indications for which the reference product is licensed and the biosimilar applicant seeks approval.
The scope and magnitude of clinical data needed will depend on the extent of uncertainty about the biosimilarity of the product
as well as the frequency and severity of safety risks associated with the reference product. The FDA indicated that it is still
7/27/2019 Amgen Inc 2012 Annual Report
http://slidepdf.com/reader/full/amgen-inc-2012-annual-report 31/150
24
evaluating a number of relevant issues, and additional guidance documents are expected to be released, including guidance on the
criteria for interchangeability (which the FDA has indicated would be a “higher standard” than biosimilarity).
FDA Regulation of Product Marketing and Promotion. The FDA closely reviews and regulates the marketing and promotion
of products. We are required to obtain the FDA approval before marketing or promoting a product as a treatment for a particular
indication. Our product promotion for approved product indications must comply with the statutory standards of the FDCA, and
the FDA’s implementing regulations and standards. The FDA’s review of marketing and promotional activities encompasses, but
is not limited to, direct-to-consumer advertising, healthcare provider-directed advertising and promotion, sales representative
communications to healthcare professionals, promotional programming and promotional activities involving the Internet. The
FDA may also review industry-sponsored scientific and educational activities. The FDA may take enforcement action against acompany for promoting unapproved uses of a product or for other violations of its advertising and labeling laws and regulations.
Enforcement action may include product seizures, injunctions, civil or criminal penalties or regulatory letters, which may require
corrective advertising or other corrective communications to healthcare professionals. Failure to comply with the FDA’s regulations
also can result in adverse publicity or increased scrutiny of company activities by the U.S. Congress or other legislators.
FDA Regulation of Manufacturing Standards. The FDA regulates and inspects equipment, facilities, laboratories and
processes used in the manufacturing and testing of products prior to providing approval to market products. If after receiving
approval from the FDA, we make a material change in manufacturing equipment, location or process, additional regulatory review
may be required. We also must adhere to current Good Manufacturing Practice regulations and product-specific regulations enforced
by the FDA through its facilities inspection program. The FDA also conducts regular, periodic visits to re-inspect our equipment,
facilities, laboratories and processes following an initial approval. If, as a result of those inspections, the FDA determines that our
equipment, facilities, laboratories or processes do not comply with applicable FDA regulations and conditions of product approval,
the FDA may seek civil, criminal or administrative sanctions and/or remedies against us, including suspension of our manufacturingoperations. Such issues may also delay the approval of new products undergoing FDA review.
Regulation of Combination Products. When our products are used with medical devices, they may be considered combination
products, which are defined by the FDA to include products comprised of two or more regulated components or parts (e.g., a
biologic and a device). When regulated independently, biologics and devices each have their own regulatory requirements. However,
the regulatory requirements for a combination product comprised of a biologic administered with a delivery device are more
complex, as in addition to the individual regulatory requirements for each component, additional combination product regulatory
requirements may apply. We expect that in the future a number of our pipeline products may meet this definition and be evaluated
for regulatory approval under this framework. In addition, due to regional differences in regulation structures and systems outside
the United States, the definition and regulatory requirements for combination products may differ significantly depending on the
region.
New Innovation Provisions Available to Regulatory Agencies Reviewing Drug Applications. In the United States, the FDA
may grant accelerated approval status to products that treat serious or life-threatening illnesses and that provide meaningful
therapeutic benefits to patients over existing treatments. Under accelerated approval regulations, the FDA may approve a product
based on a surrogate endpoint that is reasonably likely to predict clinical benefit or based on an effect on a clinical endpoint other
than survival or irreversible morbidity. The sponsor/marketing applicant will then be required to conduct additional, post-approval
confirmatory trials to verify and describe clinical benefit, and the product may have certain post-marketing restrictions as necessary
to assure safe use. The FDA is also given greater flexibility to withdraw approval granted under accelerated approval, if it is
warranted. Additional legislation has been approved in 2012 that could further expand the FDA's authority. For example, the FDA
may consider ways to more greatly use the accelerated approval pathway for rare or very rare diseases, and a new review designation
was created to help foster the innovation of promising new therapies with the potential to shorten the timeframe for conducting
pivotal trials and speed up patient access to the approved product.
In Europe, the preexisting conditional approval pathway provides for the European Medicines Agency (EMA) to apply
greater flexibility in terms of their benefit/risk evaluation in order to promote innovation. While no plans to revise or add to this
statutory provision have been announced, there are on-going discussions at the EMA to consider so-called “adaptive licensing”.It is not clear at this stage whether such proposals will result in meaningful changes to the EU regulatory approval pathway.
Approval and Post-Approval Regulation Outside the United States. In the EU countries, Switzerland, Canada and Australia,
regulatory requirements and approval processes are similar in principle to those in the United States. Additionally, depending on
the type of drug for which approval is sought, there are currently two potential tracks for marketing approval in the EU, including
a centralized procedure. In the centralized procedure, which is required of all products derived from biotechnology, a company
submits a single marketing authorization application to the EMA which conducts a thorough evaluation, drawing from its scientific
resources across Europe. If the drug product is proven to fulfill the requirements for quality, safety and efficacy, the CHMP adopts
a positive opinion, which is transmitted to the EC for final approval of the marketing authorization. While the EC generally follows
the CHMP's opinion, it is not bound to do so. In the EU, biosimilars have been approved under a sub-pathway of the centralized
procedure since 2006. The pathway allows sponsors of a biosimilar to seek and obtain regulatory approval based in part on the
7/27/2019 Amgen Inc 2012 Annual Report
http://slidepdf.com/reader/full/amgen-inc-2012-annual-report 32/150
25
clinical trial data of an originator product to which the biosimilar has been demonstrated to be “similar.” In many cases, this allows
biosimilars to be brought to market without conducting the full suite of clinical trials typically required of originators. After
evaluation and marketing authorization, various parties, including the national competent authorities, the EMA, the EC and the
marketing authorization holders share pharmacovigilance responsibilities regarding the detection, assessment and prevention of
adverse effects and other medicine-related problems. Healthcare professionals and patients are also encouraged to report adverse
effects and other medicine-related problems. This process includes the collection of adverse drug reaction reports as part of the
follow-up on any side effects of a product, and upon assessment, the authorities can decide to demand that product labels be
updated with safety data or warnings, that safety data or warnings be provided to healthcare professionals, or recommend the
temporary suspension or complete withdrawal of a product from the market. In 2012, new pharmacovigilance legislation became
effective in the EU that contains new and revised requirements for conducting pharmacovigilance, as well as codifying variousexisting requirements previously set out as guidance.The new legislation enhanced the authority of European regulators to require
pharmaceutical companies to conduct post-authorization efficacy and safety studies, both at the time of approval and at any time
afterwards in light of scientific developments. There are also additional requirements to include statements in product labeling
with regard to adverse drug reaction reporting and additional monitoring of products. There also is expected to be significantly
greater transparency of the safety review process as a result of the new legislation.
Other countries such as those in Latin America, Mexico, Brazil, Russia, Turkey and the Middle East have a less comprehensive
review process in terms of data requirements and for the most part rely on prior marketing approval (as demonstrated by a certificate
of pharmaceutical product) from a foreign regulatory authority in the United States or EU. The regulatory process in these countries
is less well defined than in the United States and frequently includes manufacturing/testing facility inspections, testing of drug
product on importation and other domestic requirements.
Other. We are also subject to various federal and state laws, as well as foreign laws, pertaining to healthcare “fraud andabuse,” including anti-kickback laws and false claims laws. Anti-kickback laws make it illegal to solicit, offer, receive or pay any
remuneration in exchange for or to induce the referral of business, including the purchase or prescription of a particular drug that
is reimbursed by a state or federal program. The federal government and the states have published regulations that identify “safe
harbors” or exemptions for certain arrangements that do not violate the anti-kickback statute. We seek to comply with the safe
harbors whenever possible. Due to the breadth of the statutory provisions and the absence of guidance in the form of regulations
or court decisions addressing some of our practices, it is possible that our practices might be challenged under anti-kickback or
similar laws. False claims laws prohibit knowingly and willingly presenting, or causing to be presented for payment to third-party
payers (including Medicare and Medicaid) any claims for reimbursed drugs or services that are false or fraudulent, claims for
items or services not provided as claimed or claims for medically unnecessary items or services. Our activities related to the sale
and marketing of our products may be subject to scrutiny under these laws. Violations of fraud and abuse laws may be punishable
by criminal and/or civil sanctions, including fines and civil monetary penalties, as well as the possibility of exclusion from federal
healthcare programs (including Medicare and Medicaid). On December 19, 2012, Amgen announced that it had finalized a
settlement agreement with the U.S. government, 49 states and the District of Columbia regarding allegations that Amgen's promotional, contracting, sales and marketing activities and arrangements caused the submission of various false claims under
the Federal Civil False Claims Act and various State False Claims Acts. In connection with entering into the settlement agreement,
Amgen also entered into a corporate integrity agreement with the Office of the Inspector General of the U.S. Department of Health
and Human Services that requires Amgen to maintain its corporate compliance program and to undertake a set of defined corporate
integrity obligations for a period of five years. See Note 18, Contingencies and commitments, to the Consolidated Financial
Statements for further information. Our activities could be subject to challenge for the reasons discussed above and due to the
broad scope of those laws and the increasing attention being given to them by law enforcement authorities.
We are also subject to regulation under the Occupational Safety and Health Act, the Toxic Substances Control Act, the
Resource Conservation and Recovery Act and other current and potential future federal, state or local laws, rules and/or regulations.
Our R&D activities involve the controlled use of hazardous materials, chemicals, biological materials and various radioactive
compounds. We believe our procedures comply with the standards prescribed by federal, state or local laws, rules and/or regulations;
however, the risk of injury or accidental contamination cannot be completely eliminated. While we are not required to do so, westrive to conduct our research and manufacturing activities in a manner that meets the intents and purposes of the National Institutes
of Health Guidelines for Recombinant DNA Research.
Additionally, the U.S.Foreign Corrupt Practices Act (FCPA) prohibits U.S. corporations and their representatives from
offering, promising, authorizing or making payments to any foreign government official, government staff member, political party
or political candidate in an attempt to obtain or retain business abroad. The scope of the FCPA includes interactions with certain
healthcare professionals in many countries. Other countries have enacted similar anti-corruption laws and/or regulations.
Our present and future business has been and will continue to be subject to various other U.S. and foreign laws, rules and/
or regulations.
7/27/2019 Amgen Inc 2012 Annual Report
http://slidepdf.com/reader/full/amgen-inc-2012-annual-report 33/150
26
Research and Development and Selected Product Candidates
We focus our R&D on novel human therapeutics for the treatment of grievous illness in the areas of oncology, hematology,
inflammation, bone health, nephrology, cardiovascular and general medicine, which includes neuroscience. We take a modality-
independent approach to R&D with a focus on biologics. Our discovery research programs may therefore yield targets that lead
to the development of human therapeutics delivered as large molecules, small molecules, or other combination or new modalities.
We have major R&D centers in several locations throughout the United States and in the United Kingdom, as well as smaller
research centers and development facilities globally. See Item2. Properties.
We conduct clinical trial activities using both our internal staff and third-party contract clinical trial service providers. Toincrease the number of patients available for enrollment in our clinical trials, we have opened clinical sites and will continue to
open clinical sites and to enroll patients in a number of geographic locations. See Item1A. Risk Factors — We must conduct
clinical trials in humans before we can commercialize and sell any of our product candidates or existing products for new indications.
Some of our competitors are actively engaged in R&D in areas where we have products or where we are developing product
candidates or new indications for existing products. For example, we compete with other clinical trials for eligible patients, which
may limit the number of available patients who meet the criteria for certain clinical trials. The competitive marketplace for our
product candidates is significantly dependent on the timing of entry into the market. Early entry may have important advantages
in gaining product acceptance, thereby contributing to the product’s eventual success and profitability. Accordingly, we expect
that in some cases, the relative speed with which we can develop products, complete clinical testing, receive regulatory approval
and supply commercial quantities of the product to the market will be important to our competitive position.
In addition to product candidates and marketed products generated from our internal R&D efforts, we acquire companies,acquire and license certain product and R&D technology rights and establish R&D arrangements with third parties to enhance our
strategic position within our industry by strengthening and diversifying our R&D capabilities, product pipeline and marketed
product base. Those licenses and arrangements generally provide for non-refundable, upfront license fees, R&D and commercial
performance milestone payments, cost sharing, royalty payments and/or profit sharing.
Various public and privately owned companies, research organizations, academic institutions and government agencies
conduct a significant amount of R&D in the biotechnology industry. In pursuing R&D arrangements and licensing or acquisition
activities, we face competition from other pharmaceutical and biotechnology companies that also seek to license or acquire
technologies, product candidates or marketed products from those entities. Accordingly, we may have difficulty entering into R&D
arrangements and licensing or acquiring technologies, product candidates and marketed products on acceptable terms.
See Government Regulation — Clinical Development for a discussion of government regulation over clinical development.
The following table is a selection of certain of our product candidates by phase of development in our therapeutic areas of focus as of February11, 2013, unless otherwise indicated. Each disease or condition for our product candidates in phase 3 is listed
separately. Additional product candidate (pipeline) information can be found on our website at http://www.amgen.com. (This
website address is not intended to function as a hyperlink, and the information contained on our website is not intended to be a
part of this filing.) The information in this section does not include other, non-registrational clinical trials, such as the Pegfilgrastim
and Anti-VEGF Evaluation Study (PAVES) trial evaluating Neulasta® (pegfilgrastim) use in patients receiving chemotherapy and
bevacizumab for the first-line treatment of locally-advanced or metastatic colorectal cancer, that we may conduct for purposes
other than for submission to regulatory agencies for their approval of a new product indication. We may conduct non-registrational
clinical trials for various reasons including to evaluate real-world outcomes or to collect additional safety information with the
use of our products. See, for example, the discussion of our ESA pharmacovigilance trials under — Marketed Products — ESAs.
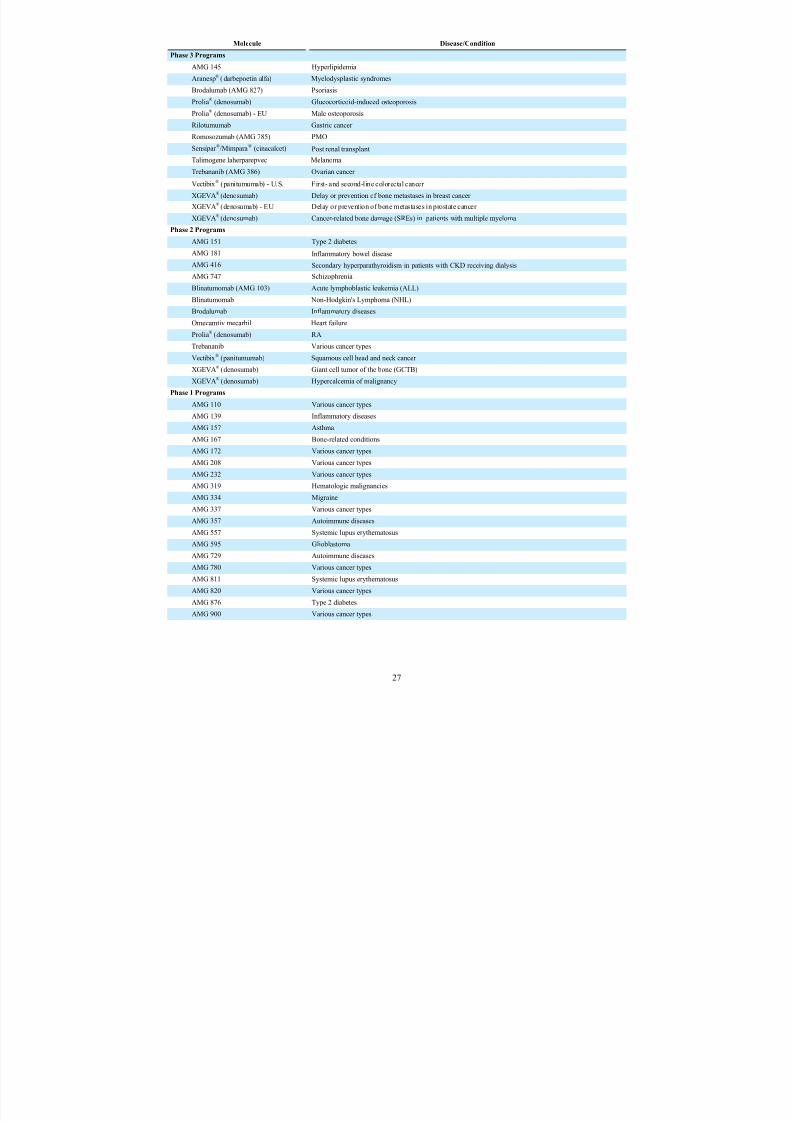
7/27/2019 Amgen Inc 2012 Annual Report
http://slidepdf.com/reader/full/amgen-inc-2012-annual-report 34/150
27
Molecule Disease/Condition
Phase 3 Programs
AMG 145 Hyperlipidemia
Aranesp® (darbepoetin alfa) Myelodysplastic syndromes
Brodalumab (AMG 827) Psoriasis
Prolia® (denosumab) Glucocorticoid-induced osteoporosis
Prolia® (denosumab) - EU Male osteoporosis
Rilotumumab Gastric cancer
Romosozumab (AMG 785) PMO
Sensipar ®/Mimpara® (cinacalcet) Post renal transplant
Talimogene laherparepvec Melanoma
Trebananib (AMG 386) Ovarian cancer
Vectibix® (panitumumab) - U.S. First- and second-line colorectal cancer
XGEVA® (denosumab) Delay or prevention of bone metastases in breast cancer
XGEVA® (denosumab) - EU Delay or prevention of bone metastases in prostate cancer
XGEVA® (denosumab) Cancer-related bone damage (SREs) in patients with multiple myeloma
Phase 2 Programs
AMG 151 Type 2 diabetes
AMG 181 Inflammatory bowel disease
AMG 416 Secondary hyperparathyroidism in patients with CKD receiving dialysis
AMG 747 Schizophrenia
Blinatumomab (AMG 103) Acute lymphoblastic leukemia (ALL)
Blinatumomab Non-Hodgkin's Lymphoma (NHL)
Brodalumab Inflammatory diseases
Omecamtiv mecarbil Heart failure
Prolia® (denosumab) RA
Trebananib Various cancer types
Vectibix® (panitumumab) Squamous cell head and neck cancer
XGEVA® (denosumab) Giant cell tumor of the bone (GCTB)
XGEVA® (denosumab) Hypercalcemia of malignancy
Phase 1 Programs
AMG 110 Various cancer types
AMG 139 Inflammatory diseases
AMG 157 Asthma
AMG 167 Bone-related conditions
AMG 172 Various cancer types
AMG 208 Various cancer types
AMG 232 Various cancer types
AMG 319 Hematologic malignancies
AMG 334 Migraine
AMG 337 Various cancer types
AMG 357 Autoimmune diseases
AMG 557 Systemic lupus erythematosus
AMG 595 GlioblastomaAMG 729 Autoimmune diseases
AMG 780 Various cancer types
AMG 811 Systemic lupus erythematosus
AMG 820 Various cancer types
AMG 876 Type 2 diabetes
AMG 900 Various cancer types
7/27/2019 Amgen Inc 2012 Annual Report
http://slidepdf.com/reader/full/amgen-inc-2012-annual-report 35/150
28
Phase1 clinical trials investigate safety and proper dose ranges of a product candidate in a small number of human subjects.
Phase2 clinical trials investigate side effect profiles and efficacy of a product candidate in a large number of patients who have the disease or conditionunder study.
Phase3 clinical trials investigate the safety and efficacy of a product candidate in a large number of patients who have the disease or condition under study.
The following text provides additional information about selected product candidates that have advanced into human clinical
trials.
AMG 145
AMG 145 is a human monoclonal antibody that inhibits Proprotein Convertase Subtilisin/Kexin Type 9 (PCSK9). It is being
investigated as a treatment for hyperlipidemia.
Phase 2 study results evaluating AMG 145 were reported at a medical meeting in November 2012 in the following four
areas: as monotherapy, in combination with statin therapy, in heterozygous familial hypercholesterolemia, and in statin-intolerant
subjects. Based on the study results, phase 3 enrollment is underway in these populations.
Aranesp®
(darbepoetin alfa)
Aranesp® is a recombinant human protein agonist of the erythropoietin receptor.
The phase 3 study of Aranesp® for the treatment of low risk myelodysplastic syndromes is ongoing.
Brodalumab
Brodalumab is a human monoclonal antibody that inhibits the interleukin-17 receptor. It is being investigated as a treatment
for a variety of inflammatory diseases. Brodalumab is one of five inflammation monoclonal antibodies being jointly developed
in collaboration with AstraZeneca.
In 2012, we initiated three phase 3 studies for the treatment of psoriasis. We completed our phase 2 study in psoriatic arthritis
in 2012. Brodalumab is also being evaluated for the treatment of asthma.
Denosumab
Denosumab is a human monoclonal antibody that specifically targets a ligand known as RANKL (that binds to a receptor
known as RANK) which is a key mediator of osteoclast formation, function, and survival. It is being investigated across a range
of conditions including osteoporosis, treatment-induced bone loss, RA and numerous tumor types across the spectrum of cancer-
related bone diseases, including hypercalcemia of malignancy.
Prolia® (denosumab)
In September 2012, Prolia® was approved by the FDA for the treatment to increase bone mass in men with osteoporosis at
high risk for fracture in the US. A phase 3 study of Prolia® for the treatment of glucocorticoid-induced osteoporosis was initiated
in 2012.
XGEVA® (denosumab)
In June 2012, we submitted a marketing application to the EMA for XGEVA® to treat men with castration-resistant prostate
cancer at high risk of developing bone metastases.
In December 2012, we submitted marketing applications to the FDA and EMA for XGEVA® for the treatment of GCTB in
adults or skeletally mature adolescents.
Phase 3 studies for the delay or prevention of bone metastases in patients with adjuvant breast cancer and prevention of SRE
in patients with multiple myeloma are ongoing.
Rilotumumab
Rilotumumab is a human monoclonal antibody that inhibits the action of hepatocyte growth factor/scatter factor. It is being
investigated as a cancer treatment.
In 2012, we initiated a phase 3 study for the treatment of gastric cancer.
7/27/2019 Amgen Inc 2012 Annual Report
http://slidepdf.com/reader/full/amgen-inc-2012-annual-report 36/150
29
Romosozumab
Romosozumab is a humanized monoclonal antibody that inhibits the action of sclerostin. Romosozumab is being developed
in collaboration with UCB for PMO.
In 2012, we initiated two phase 3 studies for the treatment of PMO in women.
After reviewing the 52-week tibia data and recent regulatory guidance that deemed acceleration of fracture healing a non-
viable endpoint for a phase 3 program, it was determined that we would not pursue this indication. This decision is based on the
regulatory guidance and on the efficacy results from the acceleration of fracture healing endpoint in the tibia trial, not on safety.The
safety profile remains consistent with what has been seen in the PMO program.
Sensipar ® /Mimpara® (cinacalcet)
Sensipar ®/Mimpara® is an orally-administered small molecule that lowers PTH levels in blood by increasing sensitivity of
the calcium-sensing receptor (CaSR) to extracellular calcium. It is being evaluated in post renal transplant patients.
Talimogene laherparepvec
Talimogene laherparepvec is an oncolytic immunotherapy derived from HSV-1. It is being investigated as a cancer treatment.
The phase 3 study for the treatment of melanoma is ongoing.
Trebananib
Trebananib is a peptibody that inhibits the interaction between the endothelial cell-selective Tie2 receptor and its ligandsAng1 and Ang2. It is being investigated as a cancer treatment.
Phase 3 studies of trebananib for the treatment of first-line and recurrent ovarian cancer are ongoing. Phase 2 studies of
trebananib for treatment of renal cell carcinoma, hepatocellular carcinoma and NSCLC are ongoing.
Vectibix®
(panitumumab)
Vectibix® is a human monoclonal antibody antagonist of the EGFr pathway. It is being investigated as a cancer treatment.
In July 2011, we announced that we received Complete Response Letters from the FDA on the first- and second-line line
mCRC sBLAs requesting additional information from the '181 and '203 studies. We are currently working on addressing the
FDA's requests in the Complete Response Letters.
AMG 151
AMG 151 is a small molecule glucokinase activator. It is being investigated as a treatment for type 2 diabetes. We completed
our phase 2 study in 2012.
AMG 181
AMG 181 is a human monoclonal antibody that inhibits the action of alpha4/beta7. It is being investigated as a treatment
for ulcerative colitis and Crohn's disease, with phase 2 studies initiated in 2012. AMG 181 is one of five inflammation monoclonal
antibodies being jointly developed in collaboration with AstraZeneca.
AMG 416
AMG 416 is a peptide agonist of the human cell surface CaSR. It is being investigated as a treatment for secondary
hyperparathyroidism in patients with CKD receiving dialysis.
We completed two phase 2 studies in 2012. Phase 3 initiation is planned in 2013.
AMG 747
AMG 747 is a small molecule inhibitor of glycine transporter type-1 (GlyT-1). It is being investigated as a treatment for
negative symptoms and cognitive deficits associated with schizophrenia, with two phase 2 studies initiated in 2012.
Blinatumomab
Blinatumomab is an anti-CD19 x anti-CD3 (BiTE®) bispecific antibody. It is being investigated as a cancer treatment.
7/27/2019 Amgen Inc 2012 Annual Report
http://slidepdf.com/reader/full/amgen-inc-2012-annual-report 37/150
30
In December 2012, we reported the results from a phase 2 adult ALL relapsed refractory study at a medical meeting. Phase
2 studies in adult patients with relapsed/refractory and minimal residual disease of ALL and a phase 2 study in adult patients with
NHL are ongoing.
Omecamtiv mecarbil
Omecamtiv mecarbil is a small molecule activator of cardiac myosin. It is being investigated for the treatment of heart
failure.We are developing this product in collaboration with Cytokinetics, Inc.
A phase 2 study of an intravenous formulation of omecamtiv mecarbil in patients with left ventricular systolic dysfunction,
who are hospitalized with acute heart failure, is ongoing.
Amgen Development of Biosimilars
As previously announced, we are collaborating with Actavis, Inc. (formerly Watson Pharmaceuticals, Inc.) to develop and
commercialize, on a worldwide basis, several oncology antibody biosimilar medicines. The products our collaboration is pursuing
include biosimilar versions of bevacizumab (sold by Genentech/Roche under the brand name Avastin®), trastuzumab (sold by
Genentech/Roche under the brand names Herceptin®/Herclon®), rituximab (sold by Roche under the brand names Rituxan®/
Mabthera®) and cetuximab (sold by Eli Lilly/BMS under the brand name Erbitux®).
We are also working to develop biosimilar versions of adalimumab (sold by AbbVie under the brand name HUMIRA®) and
infliximab (sold by Janssen/Merck under the brand name REMICADE®).
Our biosimilar product candidates are in varying stages of regulatory development. We expect that any revenue contribution
from these biosimilar programs, if successful, would not occur for a number of years.
Phase 3 Product Candidate Program Changes
As of February10, 2012, we had 12 phase 3 programs. As of February11, 2013, we had 14 phase 3 programs, as six programs
had advanced into phase 3 trials, three programs had concluded and all rights to one program were out-licensed. These changes
are set forth in the following table:
Molecule Disease / Condition Program Change
AMG 145 Hyperlipidemia Advanced to phase 3
Aranesp® Anemia in heart failure Concluded - failed to meet primary endpoint(s)
Brodalumab (AMG 827) Psoriasis Advanced to phase 3
Ganitumab Pancreatic cancer Concluded - failed to meet primary endpoint(s)
Prolia® (denosumab) Glucocorticoid-induced osteoporosis Advanced to phase 3
Sensipar ®/Mimpara® (cinacalcet)
Cardiovascular disease in patients withsecondary hyperparathyroidism and CKDundergoing maintenance dialysis
Concluded - failed to meet primary endpoint(s)
Rilotumumab Gastric cancer Advanced to phase 3
Romosozumab (AMG 785) PMO Advanced to phase 3
Motesanib First-line NSCLC Licensed all rights to this program to Takeda(1)
XGEVA® (denosumab) Cancer-related bone damage (SREs) in patients with multiple myeloma
Advanced to phase 3
(1) See Business Relationships.

7/27/2019 Amgen Inc 2012 Annual Report
http://slidepdf.com/reader/full/amgen-inc-2012-annual-report 38/150
31
Phase 3 Product Candidate Patent Information
The following table describes our outstanding composition of matter patents that have issued thus far for our product
candidates in phase 3 development that have yet to be approved for any indication. Patents for products already approved for one
or more indications but currently undergoing phase 3 clinical trials for additional indications are previously described. See Marketed
Products.
Molecule Territory General Subject Matter EstimatedExpiration*
AMG 145 U.S. Polypeptides 2029Brodalumab (AMG 827) U.S. Polynucleotides and polypeptides 2027
Romosozumab (AMG 785) U.S. Polypeptides 2026
Talimogene laherparepvec U.S. Modified HSV1 compounds and strains 2021
Europe Modified HSV1 compounds and strains 2021
Trebananib (AMG 386) U.S. Polynucleotides and polypeptides 2025
Europe Polynucleotides and polypeptides 2022
* Patent expiration estimates are based on issued patents which may be challenged, invalidated, or circumvented by competitors.
The patent expiration estimates do not include any term adjustments, extensions or supplemental protection certificates that
may be obtained in the future and extend these dates. Corresponding patent applications are pending in other jurisdictions.
Additional patents may be filed or issued in the future and may provide additional exclusivity for the product candidate or
its use.
Business Relationships
From time to time, we enter into business relationships, including joint ventures and collaborative arrangements, for the
R&D, manufacture and/or commercialization of products and/or product candidates. In addition, we also acquire product and
R&D technology rights and establish R&D collaborations with third parties to enhance our strategic position within our industry
by strengthening and diversifying our R&D capabilities, product pipeline and marketed product base. These arrangements generally
provide for non-refundable, upfront license fees, development and commercial performance milestone payments, cost sharing,
royalty payments and/or profit sharing. The activities under these collaboration agreements are performed with no guarantee of
either technological or commercial success, and each is unique in nature.
Trade secret protection for our unpatented confidential and proprietary information is important to us. To protect our trade
secrets, we generally require counterparties to execute confidentiality agreements upon the commencement of the businessrelationship with us. However, others could either develop independently the same or similar information or obtain access to our
information.
Kirin-Amgen, Inc.
K-A is a 50-50 joint venture with Kirin. K-A develops and then out licenses to third parties certain product rights which
have been transferred to this joint venture from Amgen and Kirin.
K-A has given us exclusive licenses to manufacture and market: (i) G-CSF and pegfilgrastim in the United States, Europe,
Canada and Australia, (ii) darbepoetin alfa, romiplostim and brodalumab in the United States, Europe, Canada, Australia, New
Zealand, Mexico, all Central and South American countries and certain countries in Central Asia, Africa and the Middle East, and
(iii) recombinant human erythropoietin in the United States. We currently market pegfilgrastim, G-CSF, darbepoetin alfa,
recombinant human erythropoietin and romiplostim under the brand names Neulasta®, NEUPOGEN®/GRANULOKINE®,Aranesp®, EPOGEN® and Nplate®, respectively. Under these agreements, we pay K-A royalties based on product sales. In addition,
we also receive payments from K-A for milestones earned and for conducting certain R&D activities on its behalf. See Note 7,
Related party transactions, to the Consolidated Financial Statements.
K-A has also given Kirin exclusive licenses to manufacture and market: (i) G-CSF and pegfilgrastim in Japan, Taiwan and
South Korea, (ii) darbepoetin alfa, romiplostim and brodalumab in Japan, China, Taiwan, South Korea and in certain other countries
and/or regions in Asia and (iii) recombinant human erythropoietin in Japan. K-A also gave Kirin and Amgen co-exclusive licenses
to manufacture and market G-CSF, pegfilgrastim and recombinant human erythropoietin in China, which Amgen subsequently
assigned to Kirin, and as a result, Kirin now exclusively manufactures and markets G-CSF and recombinant human erythropoietin
in China. Kirin markets G-CSF, pegfilgrastim, darbepoetin alfa, romiplostim and recombinant human erythropoietin under the
7/27/2019 Amgen Inc 2012 Annual Report
http://slidepdf.com/reader/full/amgen-inc-2012-annual-report 39/150
32
brand names GRAN®/Grasin®, Neulasta®, NESP®, ROMIPLATE® and ESPO®, respectively. Under these agreements, Kirin pays
K-A royalties based on product sales. In addition, Kirin also receives payments from K-A for conducting certain R&D activities
on its behalf.
K-A has also given J&J exclusive licenses to manufacture and market recombinant human erythropoietin for all geographic
areas of the world outside the United States, China and Japan. K-A has also given Roche exclusive licenses to market pegfilgrastim
and G-CSF in all territories not licensed to Amgen and Kirin. Under these agreements, J&J and Roche pay royalties to K-A based
on product sales.
Pfizer Inc.
We are in a collaboration with Pfizer to co-promote ENBREL in the United States and Canada. The rights to market ENBREL
outside the United States and Canada are reserved to Pfizer. Under the agreement, a management committee comprised of equal
representation from Amgen and Pfizer is responsible for overseeing the marketing and sales of ENBREL, including strategic
planning, the approval of an annual marketing plan, product pricing and the establishment of a brand team. Amgen and Pfizer
share in the agreed-upon selling and marketing expenses approved by the joint management committee. We currently pay Pfizer
a percentage of annual gross profits on our ENBREL sales in the United States and Canada attributable to all approved indications
on a scale that increases as gross profits increase; however, we maintain a majority share of ENBREL profits. After expiration of
the co-promotion term on October 31, 2013, we will be required to pay Pfizer residual royalties based on a declining percentage
of annual net ENBREL sales in the United States and Canada for three years, ranging from 12% to 10%. The amounts of such
payments are anticipated to be significantly less than what would be owed based on the terms of the current ENBREL profit share.
Effective November 1, 2016, there will be no further royalty payments.
Glaxo Group Limited
We are in a collaboration with Glaxo for the commercialization of denosumab for osteoporosis indications in Europe,
Australia, New Zealand and Mexico (the Primary Territories). We have retained the rights to commercialize denosumab for all
indications in the United States and Canada and for oncology indications in the Primary Territories. Under a related agreement,
Glaxo will commercialize denosumab for all indications in countries, excluding Japan, where we did not have a commercial
presence at the commencement of the agreement, including China, Brazil, India, Taiwan and South Korea (the Expansion
Territories). In the Expansion Territories, Glaxo is responsible for all development and commercialization costs and will purchase
denosumab from us to meet demand. We have the option of expanding our role in the commercialization of denosumab in the
Primary Territories and certain of the Expansion Territories. In the Primary Territories, we share equally in the commercialization
profits and losses related to the collaboration after accounting for expenses, including an amount payable to us in recognition of
our discovery and development of denosumab. Glaxo is also responsible for bearing a portion of the cost of certain specifieddevelopment activities in the Primary Territories.
Takeda Pharmaceutical Company Limited
In 2008, we entered into an arrangement with Takeda, that provided Takeda both: (i) the exclusive rights to develop and
commercialize for the Japanese market up to 12 molecules from our portfolio across a range of therapeutic areas, including oncology
and inflammation (collectively the “Japanese market products”) and (ii) the right to collaborate with us on the worldwide (outside
Japan) development and commercialization of our product candidate, motesanib. The Japanese market products include Vectibix®
and certain product candidates.
In 2011, we announced that the motesanib pivotal phase 3 trial (MONET1) did not meet its primary objective of demonstrating
an improvement in overall survival.
In June 2012, the parties materially modified this arrangement such that Amgen licensed all of its rights to motesanib to
Takeda which now has control over the worldwide development and commercialization of motesanib.
AstraZeneca Plc.
We are in a collaboration with AstraZeneca to jointly develop and commercialize certain monoclonal antibodies from Amgen's
clinical inflammation portfolio, including brodalumab, AMG 139, AMG 157, AMG 181 and AMG 557. The agreement covers
the worldwide development and commercialization, except for certain Asian countries for brodalumab and Japan for AMG 557,
that are licensed to other third parties.

7/27/2019 Amgen Inc 2012 Annual Report
http://slidepdf.com/reader/full/amgen-inc-2012-annual-report 40/150
33
Under the terms of the agreement, approximately 65% of related development costs for the 2012-2014 periods will be funded
by AstraZeneca; thereafter, the companies will share costs equally. If approved for sale, Amgen would receive a low-single-digit
royalty rate for brodalumab and a mid-single-digit royalty rate for the rest of the portfolio, after which the worldwide
commercialization profits and losses related to the collaboration products would be shared equally.
UCB
We are in a collaboration with UCB for the development and commercialization of romosozumab. We have the rights to
commercialize romosozumab for all indications in the United States, Canada, Mexico and Japan. UCB has the rights for all EU
members at the time of first regulatory approval, Australia and New Zealand. Prior to commercialization, countries that have not been initially designated will be designated to Amgen or UCB in accordance with the terms of the agreement.
Generally, development costs are shared equally and we will share equally in the worldwide commercialization profits and
losses related to the collaboration after accounting for expenses.
DaVita Inc.
We are in a seven-year supply agreement with DaVita that commenced January 1, 2012. Pursuant to this agreement, we will
supply EPOGEN® in amounts necessary to meet no less than 90% of DaVita's and its affiliates' requirements for ESAs used in
providing dialysis services in the United States and Puerto Rico. The agreement may be terminated by either party before expiration
of its term in the event of certain breaches of the agreement by the other party.
Human Resources
As of December 31, 2012, Amgen had approximately 18,000 staff members. We consider our staff relations to be good.
Executive Officers of the Registrant
The executive officers of the Company as of February13, 2013, are as follows:
Mr. Robert A. Bradway, age 50, has served as a director of the Company since October 2011 and Chairman of the Board of
Directors since January 1, 2013. Mr. Bradway has been the Company's President since May 2010 and Chief Executive Officer
since May 2012. From May 2010 to May 2012, Mr. Bradway served as the Company's President and Chief Operating Officer.
Mr. Bradway joined the Company in 2006 as Vice President, Operations Strategy, and served as Executive Vice President and
Chief Financial Officer from April 2007 to May 2010. Prior to joining the Company, he was a Managing Director at Morgan
Stanley in London where he had responsibility for the firm's banking department and corporate finance activities in Europe and
focused on healthcare.
Mr. Madhavan (Madhu) Balachandran, age 62, became Executive Vice President, Operations in August 2012. Mr.
Balachandran joined the Company in 1997 and has held leadership positions in engineering, information systems and operations.
From October 2007 to August 2012, Mr. Balachandran was Senior Vice President, Manufacturing. From February 2007 to October
2007, Mr. Balachandran was Vice President, Site Operations. From May 2002 to February 2007, Mr. Balachandran was Vice
President, Puerto Rico Operations. Prior to 2002, Mr. Balachandran served as Associate Director, Capital Projects, before his
promotion to Director, Engineering, and then to Vice President, Information Management.
Dr. Sean E. Harper, age 50, became Executive Vice President, Research and Development in February 2012. Dr. Harper
joined the Company in 2002 and has held leadership roles in early development, medical sciences and global regulatory and safety.
Dr. Harper served as Senior Vice President, Global Development and Corporate Chief Medical Officer from March 2007 to
February 2012. Prior to joining the Company, Dr. Harper worked for five years at Merck Research Laboratories.
Mr. Anthony C. Hooper, age 58, became Executive Vice President, Global Commercial Operations, in October 2011. FromMarch 2010 to October 2011, Mr. Hooper was Senior Vice President, Commercial Operations and President, U.S., Japan and
Intercontinental of BMS, a pharmaceutical company. From January 2009 to March 2010, Mr. Hooper was President, Americas of
BMS. From January 2004 to January 2009, Mr. Hooper was President, U.S. Pharmaceuticals, Worldwide Pharmaceuticals Group,
a division of BMS. Prior to that, Mr. Hooper held various senior leadership positions at BMS. In his roles at BMS, Mr. Hooper
led commercial operations in mature and emerging markets. Prior to joining BMS, Mr. Hooper was Assistant Vice President of
Global Marketing for Wyeth Laboratories.
Mr. Brian McNamee, age 56, became Senior Vice President, Human Resources in June 2001. From November 1999 to June
2001, Mr. McNamee served as Vice President of Human Resources at Dell Computer Corp. From 1998 to 1999, Mr. McNamee
served as Senior Vice President, Human Resources for the National Broadcasting Corporation, a division of GE. From July 1988

7/27/2019 Amgen Inc 2012 Annual Report
http://slidepdf.com/reader/full/amgen-inc-2012-annual-report 41/150
34
to November 1999, Mr. McNamee held human resources positions at GE.
Ms. Cynthia M. Patton, age 51, became Senior Vice President and Chief Compliance Officer in October 2012. Ms. Patton
joined the Company in 2005. From September 2010 to October 2012, Ms. Patton was Vice President, Law. From July 2005 to
September 2010, Ms. Patton was Associate General Counsel. Previously, Ms. Patton served as Senior Vice President, General
Counsel and Secretary of SCAN Health Plan from 1999 to 2005.
Mr. Jonathan M. Peacock, age 54, became Executive Vice President and Chief Financial Officer in September 2010. Prior
to joining Amgen and beginning in 2005, Mr. Peacock served as Chief Financial and Administration Officer of Novartis
Pharmaceuticals AG, a healthcare company based in Switzerland. From 1998 to 2005, Mr. Peacock was a partner at McKinseyand Co., where he co-led the firm's European Corporate Finance Practice. Mr. Peacock was also a partner at Price Waterhouse in
London and New York from 1993 to 1998.
Mr. David J. Scott, age 60, became Senior Vice President, General Counsel and Secretary in March 2004. From May 1999
to February 2004, Mr. Scott served as Senior Vice President and General Counsel of Medtronic, Inc., and also as Secretary from
January 2000. From December 1997 to April 1999, Mr. Scott served as General Counsel of London-based United Distillers &
Vintners. Mr. Scott also served in executive roles at Grand Metropolitan plc and RJR Nabisco, Inc., and was an attorney in private
practice.
Geographic Area Financial Information
For financial information concerning the geographic areas in which we operate, see Note 19, Segment information —
Geographic information, to the Consolidated Financial Statements.Investor Information
Financial and other information about us is available on our website (http://www.amgen.com) (This website address is not
intended to function as a hyperlink, and the information contained in our website is not intended to be a part of this filing). We
make available on our website, free of charge, copies of our Annual Report on Form 10-K, Quarterly Reports on Form 10-Q,
current reports on Form 8-K and amendments to those reports filed or furnished pursuant to Section13(a) or 15(d) of the Exchange
Act as soon as reasonably practicable after filing or submitting such material electronically or otherwise furnishing it to the SEC.
In addition, we have previously filed registration statements and other documents with the SEC. Any document we file may be
inspected, without charge, at the SEC’s public reference room at 100 F Street NE, Washington, DC 20549, or at the SEC’s internet
address at http://www.sec.gov. (This website address is not intended to function as a hyperlink, and the information contained in
the SEC’s website is not intended to be a part of this filing). Information related to the operation of the SEC’s public reference
room may be obtained by calling the SEC at 800-SEC-0330 (800-732-0330).

7/27/2019 Amgen Inc 2012 Annual Report
http://slidepdf.com/reader/full/amgen-inc-2012-annual-report 42/150
35
Item1A. RISK FACTORS
This report and other documents we file with the SEC contain forward-looking statements that are based on current
expectations, estimates, forecasts and projections about us, our future performance, our business or others on our behalf, our beliefs
and our management's assumptions. These statements are not guarantees of future performance and involve certain risks,
uncertainties and assumptions that are difficult to predict. You should carefully consider the risks and uncertainties facing our
business. The risks described below are not the only ones facing us. Our business is also subject to the risks that affect many other
companies, such as employment relations, general economic conditions, geopolitical events and international operations. Further,
additional risks not currently known to us or that we currently believe are immaterial may in the future materially and adversely
affect our business, operations, liquidity and stock price.
Our sales depend on coverage and reimbursement from third-party payers.
Sales of all of our principal products are dependent on the availability and extent of coverage and reimbursement from third-
party payers, including government healthcare programs and private insurance plans. Governments and private payers may regulate
prices, reimbursement levels and/or access to our products to control costs or to affect levels of use. We rely in large part on the
reimbursement of our principal products through government programs such as Medicare and Medicaid in the United States and
similar programs in foreign countries, and a reduction in the coverage and/or reimbursement for our products could have a material
adverse effect on our product sales, business and results of operations.
In the United States, there is an increased focus by the federal government and others on analyzing the impact of various
regulatory programs on the federal deficit, which could result in increased pressure on federal programs to reduce costs. For example, the Budget Control Act of 2011 mandated a two percent reduction in government payments for all Medicare services
(including the administration of separately-billable drugs and payment for drugs in all Medicare programs) for federal fiscal years
2013 through 2021. This payment “sequestration” is currently scheduled to begin in 2013 and continue through 2021. The
sequestration remains subject to administrative implementation of the Budget Control Act or future statutory revision by Congress,
who could block, limit or otherwise modify the automatic spending cuts. Several alternative deficit reduction proposals have been
put forth by President Obama and/or Congressional committees, including proposals designed to further limit federal healthcare
expenditures. While we cannot predict whether any deficit reduction actions will be approved by Congress and/or whether a budget
sequestration will ultimately occur for Medicare services, a reduction in the availability or extent of reimbursement for drugs and
biologics for U.S. healthcare programs as a result of changes such as those that have been proposed or from other changes designed
to achieve similar federal budget savings could have a material adverse effect on the sales of our products, our business and results
of operations.
In March 2010 the United States adopted significant healthcare reform through the enactment of the PPACA and theHealthcare and Education Reconciliation Act (See Item 1. Business — Reimbursement — U.S. Healthcare Reform.) A major goal
of the healthcare reform law is to provide greater access to healthcare coverage for more Americans. Accordingly, the healthcare
reform law requires individual U.S. citizens and legal residents to maintain qualifying health coverage, imposes certain requirements
on employers with respect to offering health coverage to employees, amends insurance regulations regarding when coverage can
be provided and denied to individuals, and expands existing government healthcare coverage programs to more individuals in
more situations, with most of these changes going into effect by January 2014. We do not expect a significant increase in sales of
our products as a result of the 2014 expansions in healthcare coverage. While we cannot fully predict the ultimate impact the
healthcare reform law will have on us, or how the law may change due to statutory revision or judicial review, we expect that the
new law will continue to have a material adverse effect on our business and results of operations.
Public and private insurers have pursued, and continue to pursue, aggressive cost containment initiatives, including increased
focus on comparing the effectiveness, benefits and costs of similar treatments, which could result in lower reimbursement rates
for our products. A substantial portion of our U.S. business relies on reimbursement from the U.S. federal government under Medicare Part B coverage. Any deterioration in the timeliness or certainty of payment by Medicare to physicians, including as a
result of changes in policy or regulations, or as a result of operational difficulties, could negatively impact the willingness of
physicians to prescribe our products for patients relying on Medicare for their medical coverage. Most of our products furnished
to Medicare beneficiaries in both a physician office setting and hospital outpatient setting are reimbursed under the Medicare Part
B ASP payment methodology. (See Item1. Business — Reimbursement — Reimbursement of Our Principal Products.) ASP- based
reimbursements of products under Medicare may be below or could fall below the cost that some medical providers pay for such
products, which could materially and adversely affect sales of our products. Private payers also continue to seek to reduce their
costs. Insurance plans administered by private companies frequently adopt their own payment or reimbursement reductions.
Consolidation among managed care organizations may increase the negotiating power of these entities, potentially resulting in
lower reimbursement rates for our products. Private third-party payers increasingly employ formularies to control costs by
7/27/2019 Amgen Inc 2012 Annual Report
http://slidepdf.com/reader/full/amgen-inc-2012-annual-report 43/150
36
negotiating discounted prices in exchange for formulary inclusion and/or favorable formulary positioning. Private health insurance
companies also are increasingly adopting utilization management tools, such as prior authorization in order to limit payment to
uses of the product that are in accordance with the FDA approved labeling or step therapy to ensure that payment for a branded
product is only made if the patient has first failed a cheaper generic product. Consistent with recent healthcare reforms, we anticipate
that future trends will include greater reliance upon comparative effectiveness to make formulary decisions. Additionally, private
payers are experimenting with new models of payment whereby reimbursement for health care providers may be linked to bundled
or capitated payments. Under these payment systems, providers would get a fixed payment amount to cover a broad range of
products and services provided to each patient and would be significantly incentivized to utilize the lowest cost product or service,
regardless of its overall benefit to the patient, or to minimize the provision of services. To the extent that such changes affect the
price we receive for our products or the level of coverage and reimbursement available when healthcare providers prescribe our products, they could have a material adverse effect on the sales of our products, our business and results of operations.
We also face risks relating to the reporting of pricing data that affects the U.S. reimbursement of and discounts for our
products. ASP data are calculated by the manufacturer based on a formula defined by statute and regulation and are then submitted
to CMS. CMS uses those ASP data to determine the applicable reimbursement rates for our products under Medicare Part B.
However, the statute, regulations and CMS guidance do not define specific methodologies for all aspects of the reporting of ASP
data. For example, CMS has not provided specific guidance regarding the treatment of “bundled sale arrangements” or
administrative fees paid to Group Purchasing Organizations in the ASP calculation. CMS directs that manufacturers make
“reasonable assumptions” in their calculation of ASP data in the absence of specific CMS guidance on a topic, and requires that
any such reasonable assumptions be consistent with the general requirements and the intent of the Medicare statute, federal
regulations and the manufacturer's customary business practices. As a result, we are required to apply our reasonable judgment to
certain aspects of calculating ASP data. We also submit AMP and BP data to the government on a periodic basis. The formulas
for those price figures also are defined by statute and regulation and CMS similarly has directed manufacturers to make reasonable
assumptions in the absence of specific guidance on a topic relating to the calculation of those pricing figures. We are also required
to pay rebates to state Medicaid programs, when our products are paid for by Medicaid, at a rate of 23.1% of the product's AMP,
or if it is greater, the difference between the product's AMP and the BP, subject to various adjustments. The AMP and BP regulations
require a manufacturer to update previously submitted data for a period not to exceed three years. Our ASP, AMP, and BP data
calculations are reviewed on at least a quarterly basis, and based on such reviews we have on occasion restated previously reported
ASP, AMP, and BP data to reflect changes in calculation methodology, reasonable assumptions, and/or underlying data. If our
submitted ASP, AMP, or BP data are incorrect, we may become subject to substantial fines and penalties or other government
enforcement actions, which could have a material adverse impact on our business and results of operations. In addition, if our
calculations of AMP and/or BP are incorrect, we also may be required to make additional rebate payments to state Medicaid
programs. In addition, the PPACA revised the definition of AMP, effective with submissions for the fourth quarter 2010, and in
February 2012 CMS issued a proposed rule further clarifying the new AMP definition and other aspects of the AMP and BP
calculations, and subsequently accepted public comments on the proposed rule. Until that rule is final, which is expected to occur later in 2013, we will be required to apply our reasonable judgment in certain aspects of the AMP and BP calculations. A significant
change in the final rule regarding the AMP definition or the AMP and BP calculations could require us to pay higher rebates to
state Medicaid programs in the future, which could have a material adverse impact on our business and results of operations.
Other initiatives reviewing the coverage or reimbursement of our products could result in less extensive coverage or lower
reimbursement rates. For example, in July 2007, CMS issued an NCD where it determined that ESA treatment was not reasonable
and necessary for certain clinical conditions and established Medicare coverage parameters for the FDA-approved ESA use in
oncology. Generally, an NCD is a national policy statement granting, limiting or excluding Medicare coverage or reimbursement
for a specific medical item or service. We believe the restrictions in the 2007 NCD changed the way ESAs are used in clinical
practice, for example, by decreasing the number of treated patients, the average ESA dose and the duration of ESA therapy in the
oncology setting. As a result, we believe these restrictions have had a material adverse effect on the use, reimbursement and sales
of Aranesp®, which in turn had a material adverse effect on our business and results of operations. The reimbursement of ESAs
in the nephrology setting has also been reviewed by CMS. On June 16, 2010, CMS opened an NCA to examine the use of ESAsto manage anemia in patients with CKD and dialysis-related anemia. Following further analysis, on June 16, 2011, CMS issued
a FDM in which it determined that it would not issue an NCD at that time for ESAs for treatment of anemia in adults with CKD.
In the absence of an NCD, Medicare determinations are made by regional MACs, three of which have issued revised LCDs relating
to anemia in patients with CKD not on dialysis. All of the revised LCDs restrict reimbursement of ESAs to use in accordance with
the revised FDA label. Other MACs could also issue LCDs that similarly or further restrict reimbursement for ESAs in this setting,
and physician behavior may change to be consistent with the revised label even before formal LCDs are implemented, all of which
could have a further material adverse effect on the reimbursement, use and sales of Aranesp®. Additionally, CMS could still further
review or change the reimbursement of ESAs in the nephrology setting at some point in the future and/or propose an NCD for
ESAs or other drug topics that could result in less extensive coverage for our products. For example, CMS periodically identifies
topics for potential future NCDs, and while there were no drug products included on the 2012 CMS topic list, in prior years that

7/27/2019 Amgen Inc 2012 Annual Report
http://slidepdf.com/reader/full/amgen-inc-2012-annual-report 44/150
37
list has included the category of thrombopoiesis stimulating agents (platelet growth factors), the category of drugs that includes
Nplate®.
In the dialysis setting, the reimbursement rates for our products are also subject to downward pressure. In the United States,
dialysis providers are reimbursed for EPOGEN® primarily by the federal government through Medicare's ESRD Program. (See
Item 1. Business — Reimbursement — Reimbursement of Our Principal Products — Dialysis Reimbursement.) Until January 1,
2011, Medicare reimbursed for separately billable dialysis drugs (including Aranesp® and EPOGEN®) administered in both
freestanding and hospital-based dialysis centers at ASP +6%, using the same ASP payment amount methodology used in the
physician clinic setting under Part B. On January 1, 2011, CMS's bundled-payment system went into effect for dialysis providers
which provides a single payment for all dialysis services including drugs, supplies, and non-routine laboratory tests that were previously reimbursed separately. On November 1, 2011, following our June 2011 announcement of changes to the labels for the
use of ESAs in patients with CKD (See Item 1. Business — Marketed Products — ESAs), CMS finalized a rule to update various
provisions of its bundled-payment system for dialysis services and the related ESRD QIP. The final rule eliminated for payment
year 2013 and beyond one of the QIP's measures which tracks the percent of a provider's Medicare patients with an Hb level below
10 g/dL. (See Item 1. Business — Reimbursement - Reimbursement of Our Principal Products — Dialysis Reimbursement.) CMS
indicated that removal of this quality measure from the QIP was being done in response to the June 2011 ESA label changes. We
believe that the implementation of these various changes in the dialysis setting has resulted and may continue to result in a material
adverse impact on the reimbursement, use and sales of EPOGEN® and on our business and results of operations. Under the ATRA
enacted in January 2013, CMS was directed to reduce the ESRD payment bundle amount effective January 1, 2014 to account for
changes in the utilization of drugs and biologics (including Aranesp® and EPOGEN®) since the bundle was first implemented in
2011. Oral drugs without intravenous equivalents, such as Sensipar ® and phosphate binders, will continue to be reimbursed
separately under the Medicare Part D benefit until they are included in the bundled-payment system in 2016. However, efforts are
underway to get Congress to repeal the provision of the ATRA that postponed the entry of these oral-only drugs into the bundled-
payment system; if such efforts are successful, these oral drugs could enter into the bundled-payment system before 2016. Inclusion
in the bundled-payment system may reduce utilization of these oral drugs and have an adverse impact on our sales.
The government-sponsored healthcare systems in Europe and many other foreign countries are the primary payers for
healthcare expenditures, including payment for drugs and biologics, in those regions. Mandatory price controls continue to be a
significant aspect of business for the pharmaceutical and biotechnology industries outside the United States. Healthcare reform
and related legislative proposals in France, Germany and Poland, as well as austerity plans in a number of countries, including
Spain, Italy, Greece, Ireland and Portugal, have targeted the pharmaceutical sector with multiple mechanisms to reduce government
healthcare expenditures. We expect that countries will continue to take aggressive actions to reduce expenditures on drugs and
biologics, including mandatory price reductions, clawbacks of payments made to companies when drug spending thresholds are
exceeded, preferences for biosimilars, changes in international price referencing, price transparency to achieve prices similar to
those in lower-priced countries, and reductions in the amount of reimbursement, sometimes with the imposition of patientcopayments. Similarly, fiscal constraints may also impact the extent to which countries are willing to reward new innovative
therapies and/or allow access to new technologies or the speed with which they make approval or reimbursement decisions. The
proliferation of HTA organizations (e.g., NICE in the UK and IQWiG in Germany) has led to determinations of coverage and
reimbursement based on both the clinical as well as the economic value of a product; these agencies are also increasingly setting
the maximum price at which products will be reimbursed. While we cannot fully predict the extent of further price reductions and/
or reimbursement restrictions taken by governmental payers outside the United States or the impact such actions will have on our
business, such reductions in price and/or the coverage and reimbursement for our products could have a material adverse effect
on the sales of our products, our business and results of operations.
Additional initiatives addressing the coverage or reimbursement of our products could result in less extensive coverage or
lower reimbursement, which could negatively affect sales of our products. If, for any of these or other reasons, reimbursement
rates are reduced, or if healthcare providers anticipate reimbursement being reduced, providers may narrow the circumstances in
which they prescribe or administer our products, which could reduce the use and/or sales of our products. A reduction in the useand sales of our products could have a material adverse effect on our business and results of operations.
Our current products and products in development cannot be sold if we do not maintain or gain regulatory approval.
Our business is subject to extensive regulation by numerous state and federal governmental authorities in the United States,
including the FDA, and by foreign regulatory authorities, including the EMA. We are required in the United States and in foreign
countries to obtain approval from regulatory authorities before we can manufacture, market and sell our products. Once approved,
the FDA and other U.S. and foreign regulatory agencies have substantial authority to require additional testing, perform inspections,
change product labeling or mandate withdrawals of our products. Also, legislative bodies or regulatory agencies could enact new
laws or regulations or change existing laws or regulations at any time, which could affect our ability to obtain or maintain approval
of our products. For example, the 2007 creation of the Food and Drug Administration Amendments Act of 2007 (FDAAA)
7/27/2019 Amgen Inc 2012 Annual Report
http://slidepdf.com/reader/full/amgen-inc-2012-annual-report 45/150
38
significantly added to the FDA's authority, allowing the FDA to (i)require sponsors of marketed products to conduct post-approval
clinical studies; (ii)mandate labeling changes to products and (iii)require sponsors to implement a REMS for a product. Failure
to comply with FDAAA requirements could result in significant civil monetary penalties, reputational harm and increased product
liability risk.In 2012, new pharmacovigilance legislation became effective in the EU that enhanced the authority of European
regulatory authorities to require companies to conduct additional post-approval clinical efficacy and safety studies and increased
the burden on sponsor companies in terms of adverse event management and reporting and safety data analyses. As with FDAAA,
failure to comply with the new EU pharmacovigilance legislation could result in significant monetary penalties as well as
reputational and other harms. We are unable to predict when and whether any further changes to laws or regulatory policies
affecting our business could occur, such as efforts to reform medical device regulation or the pedigree requirements for medical
products or implement new requirements for combination products, and whether such changes could have a material adverse effecton our business and results of operations.
Obtaining and maintaining regulatory approval has been and will continue to be increasingly difficult, time-consuming and
costly. For example, in October 2009 we received Complete Response Letters from the FDA for the BLA for Prolia® in the treatment
and prevention of PMO and in the treatment and prevention of bone loss due to hormone ablation therapy (HALT) in breast and
prostate cancer patients. The Complete Response Letter related to the PMO indication requested several items, including further
information on the design of our previously submitted post-marketing surveillance program. The FDA also requested a new clinical
program to support the approval of Prolia® for the prevention of PMO, updated safety data and stated that a REMS is necessary
for Prolia®. The Complete Response Letter related to the HALT indication requested additional information regarding the safety
of Prolia® in patients with breast cancer receiving aromatase inhibitor therapy and patients with prostate cancer receiving Androgen
Deprivation Therapy. The FDA specifically requested results from additional adequate and well-controlled clinical trials
demonstrating that Prolia® has no detrimental effects on either time to disease progression or overall survival. Following the
submission of further information, including clinical trial data from a number of trials evaluating denosumab in various oncology
indications, in September 2011 the FDA approved Prolia® as a treatment to increase bone mass in women at high risk for fracture
receiving adjuvant aromatase inhibitor therapy for breast cancer and as a treatment to increase bone mass in men at high risk for
fracture receiving androgen deprivation therapy for non-metastatic prostate cancer. In addition, there may be situations in which
demonstrating the efficacy and safety of a product candidate may not be sufficient to gain regulatory approval unless superiority
to comparative products can be shown.
In addition to our innovative products, we are working to develop and commercialize biosimilar versions of six products
currently manufactured, marketed and sold by other pharmaceutical companies. (See Item1. Research and Development and
Selected Product Candidates —Amgen Development of Biosimilars.) In many markets there is not yet a legislative or regulatory
pathway for the approval of biosimilars. In the United States, the U.S. healthcare reform law provided for such a pathway; while
the FDA is working to establish regulations to implement it, significant questions remain as to how products will be approved
under the pathway. (See We expect to face increasing competition from biosimilars.) Delays or uncertainties in the developmentof such pathways could result in delays or difficulties in getting our products approved by regulatory authorities, subject us to
unanticipated development costs or otherwise reduce the value of the investments we have made in the biosimilars area.
Some of our products are approved by U.S. and foreign regulatory authorities on a conditional basis with full approval
conditioned upon fulfilling the requirements of regulators. Regulatory authorities are placing greater focus on monitoring products
originally approved on an accelerated or conditional basis and on whether the sponsors of such products have met the conditions
of the accelerated or conditional approvals. Vectibix®, for example, received accelerated approval in the United States and
conditional approval in the EU, with full approval conditioned on conducting additional clinical trials of the use of Vectibix ® as
a therapy in treating mCRC. (See Item 1. Business — Marketed Products — Other Marketed Products — Vectibix® (panitumumab).)
If we are unable to fulfill the requirements of regulators that were conditions of our products' accelerated or conditional approval
and/or if regulators re-evaluate the data or risk-benefit profile of our product in connection with a renewal assessment, our
conditional approval may not be renewed or we may not receive full approval for these products or may be required to change the
products' labeled indications or even withdraw the products from the market.
Following recent FDA and FDA advisory committee discussions and actions with respect to other therapeutic oncology
products previously granted accelerated approval by the FDA, questions remain about regulatory authorities' views regarding the
adequacy for approval of therapeutic oncology products that have demonstrated a statistically significant improvement in
progression-free survival but have not shown a statistically significant improvement in overall survival. A number of our products
and product candidates have used endpoints other than overall survival, such as progression-free survival and bone-metastasis-
free survival (BMFS), in clinical trials. The use of endpoints such as progression-free survival or BMFS, in the absence of other
measures of clinical benefit, may not be sufficient for approval even when such results are statistically significant. For example,
our pivotal phase 3 Study '147 evaluated XGEVA® for its ability to improve BMFS in men with castration-resistant prostate cancer
that has not yet spread to bone. The '147 trial demonstrated that XGEVA ®significantly improved median bone metastasis-free
survival by 4.2 months compared to placebo and significantly prolonged median time to first bone metastases. However, overall
7/27/2019 Amgen Inc 2012 Annual Report
http://slidepdf.com/reader/full/amgen-inc-2012-annual-report 46/150
39
survival (a secondary endpoint) was similar between the XGEVA®and placebo arms. On February 8, 2012, the FDA convened
the ODAC to discuss our sBLA filing for XGEVA® to delay bone metastases in prostate cancer. During its presentation to the
ODAC, the FDA questioned the magnitude of the improvement in BMFS demonstrated in Study '147, and indicated that a further
clinical trial might help address some of the remaining unresolved questions regarding the clinical significance of the benefit
achieved by XGEVA® in this setting. The ODAC panel concluded that the magnitude of benefit demonstrated with early treatment
with XGEVA® to delay bone metastases was not sufficient to conclude a positive risk-benefit ratio for XGEVA ® in the absence
of additional measures impacting quality of life or other disease outcomes. On April 26, 2012, the FDA issued a Complete Response
Letter to us citing the same conclusion.
In addition to the clinical trials that we choose to or are required to conduct, other organizations may also conduct clinicaltrials that use our products. Such clinical trials may evaluate our products in areas in which we do not have and are not seeking
an approved indication. However, negative results or safety signals arising in other organizations' clinical trials may nonetheless
prompt regulatory agencies to take regulatory actions that affect our approved indications, including requiring the addition of
relevant safety data to the approved labeling or even withdrawing approval for our products.
The occurrence of a number of high profile safety events has caused an increased public and governmental concern about
potential safety issues relating to pharmaceutical and biological products and certain of our products and product candidates. (See
Our ESAs continue to be under review and receive scrutiny by regulatory authorities.) As a result of this increased concern in
recent years, the U.S. regulatory environment has evolved and safety signals and safety concerns resulting from preclinical data,
clinical trials (including sub-analyses and meta-analyses), market use or other sources are receiving greater scrutiny. For example,
a number of regulatory agencies around the world, including the FDA and the EMA, have initiated programs to directly monitor
for safety issues rather than wait for patients, providers or manufacturers to report safety problems with products or medical
devices. And at least one private, for-profit company has begun aggregating and analyzing FDA adverse event data on its website
using its own independent methodology, which could highlight new perceived risks of our products and product candidates. We
are required to communicate to regulatory agencies adverse events reported to us by patients taking our products. Regulatory
agencies may periodically perform inspections of our pharmacovigilance processes, including our adverse event reporting. If
regulatory agencies determine that we have not complied with the applicable reporting or other pharmacovigilance requirements,
we may become subject to additional inspections, warning letters or other enforcement actions, including monetary fines and other
penalties. Actual or perceived safety problems or signals could lead to revised or restrictive labeling of our approved products or
a class of products, potentially including limitations on the use of approved products in certain patients because of:
• the identification of actual or theoretical safety or efficacy concerns with respect to any of our products by regulatory
agencies;
• an increased rate or number of previously-identified safety-related events;
• the discovery of significant problems or safety signals or trends with a similar product that implicates an entire class of
products;
• subsequent concerns about the sufficiency of the data or studies underlying the label or changes to the underlying safety/
efficacy analysis related to results from clinical trials, including sub-analyses, or meta-analysis (a meta-analysis is the
review of studies using various statistical methods to combine results from previous separate but related studies) of
clinical trials or clinical data performed by us or others; and
• new legislation or rules by regulatory agencies.
For example, in December 2009, based on the Trial to Reduce Cardiovascular Events with Aranesp® Therapy (TREAT)
results, we updated the boxed warning in the labeling information for ESAs, to reflect an increased risk of stroke when ESAs areadministered to CRF patients to target Hb levels of 13 g/dL and above. In October 2010, we submitted additional proposed labeling
changes regarding the use of ESAs in CRF patients not on dialysis that would limit treatment to patients who are most likely to
benefit, specifically those with significant anemia (<10 g/dL), and who are at high risk for transfusion and for whom transfusion
avoidance is considered clinically important, including those in whom it is important to preserve kidney transplant eligibility. In
June 2011, we announced that the FDA had approved further changes to the labels for the use of ESAs, including Aranesp® and
EPOGEN®, in patients with CKD. (With the June 2011 label changes, the FDA changed the term CRF to CKD in the ESA labels.
We use CRF when referring to labels prior to June 2011 for historical accuracy.) See Our ESAs continue to be under review and
receive scrutiny by regulatory authorities.
7/27/2019 Amgen Inc 2012 Annual Report
http://slidepdf.com/reader/full/amgen-inc-2012-annual-report 47/150
40
In addition to revised labeling for our products, discovery of new safety information or previously unknown safety concerns
and/or safety signals with our products or similar products could also lead to:
• requirement of risk management activities (including a REMS) or other FDA compliance actions related to the promotion
and sale of our products;
• mandated PMCs/PMRs or pharmacovigilance programs for our approved products;
• product recalls of our approved products;
• revocation of approval for our products from the market completely, or within particular therapeutic areas;
• increased timelines or delays in being approved by the FDA or other regulatory bodies; and/or
• fewer treatments or product candidates being approved by regulatory bodies.
Product safety concerns could cause regulatory agencies to impose risk management activities upon us (including a REMS),
which may require substantial costs and resources to negotiate, develop, implement and administer. The results of these risk
management activities could:
• impact the ability of healthcare providers to prescribe, dispense or use our products;
• limit patient access to our products;
• reduce patient willingness to use our products;
• place administrative burdens on healthcare providers in prescribing our products; and/or
• affect our ability to compete against products that do not have a REMS or similar risk management activities.
We currently have approved REMS for our ESAs, Prolia® and Nplate®, and we use third-party service providers to assist in
the administration of our REMS that include elements to assure safe use. For example, our ESA REMS requires applicable
healthcare providers and institutions to enroll in the program, receive education about the product and the REMS and document
and report certain information to us over time. We are responsible for tracking and documenting certain elements of healthcare
provider and institution compliance with the ESA REMS and providing the FDA with periodic assessment reports to demonstratethat the goals of the REMS are being met. The FDA may modify our REMS based on the results of the periodic assessment reports.
Also, if we or third-party service providers acting on our behalf fail to effectively implement and/or administer the REMS for our
products, we may be required to modify such REMS, and we may be subject to FDA enforcement actions or to civil penalties.
Further, if new medical data or product quality issues suggest an unacceptable or potential safety risk or previously
unidentified side-effects, we may withdraw some or all affected product-either voluntarily or by regulatory mandate-in certain
therapeutic areas, or completely recall a product presentation from the market for some period or permanently. For example, in
September 2009, we initiated a voluntary recall of a limited number of ENBREL SureClick ® lots due to a defect in the glass syringe
barrel which resulted in a small number of broken syringes following assembly of the autoinjector device. In October 2010, we
initiated a voluntary recall of certain lots of ENBREL due to identification of cracks in a small number of the glass syringes which
may have resulted in product leakage and syringe breakage. Further, beginning in September 2010, we initiated a voluntary recall
of certain lots of EPOGEN® and J&J voluntarily recalled certain lots of PROCRIT®, manufactured by us, because a small number
of vials in each lot were found to contain glass lamellae (extremely thin, barely visible glass flakes) which we believed was aresult of the interaction of the product formulation with glass vials during the shelf life of the product. The recalls were executed
in close cooperation with the FDA. We may experience the same or other problems in the future, resulting in broader product
recalls, adverse event trends, delayed shipments, supply constraints, contract disputes and/or stock-outs of our products, which
may materially and adversely affect the sales of our products, our business and results of operations. Additionally, if we or other
parties (including our independent clinical trial investigators or our licensees, such as J&J, Pfizer, Glaxo and Takeda) report or
fail to effectively report to regulatory agencies side effects or other safety concerns that occur from their use of our products in
clinical trials or studies or from marketed use, resulting regulatory action, including monetary fines and other penalties, could
materially and adversely affect the sales of our products, our business and results of operations.
7/27/2019 Amgen Inc 2012 Annual Report
http://slidepdf.com/reader/full/amgen-inc-2012-annual-report 48/150
41
Global economic conditions may negatively affect us and may magnify certain risks that affect our business.
Our operations and performance have been, and may continue to be, affected by economic conditions in the United States
and throughout the world. Sales of our principal products are dependent, in part, on the availability and extent of reimbursement
from third-party payers, including government programs such as Medicare and Medicaid and private payer healthcare and insurance
programs. (See Our sales depend on coverage and reimbursement from third-party payers.) As more fully explained below, financial
pressures may cause government or other third-party payers to more aggressively seek cost containment through mandatory
discounts on our products, policies requiring the automatic substitution of generic or biosimilars, higher hurdles for initial
reimbursement approval for new products or other similar measures. (See We expect to face increasing competition from
biosimilars.) Additionally, as a result of the current or a future global economic downturn, our third-party payers may delay or beunable to satisfy their reimbursement obligations. A reduction in the availability or extent of reimbursement from government
and/or private payer healthcare programs or increased competition from lower cost biosimilars could have a material adverse effect
on the sales of our products, our business and results of operations. In addition, as a result of the economic conditions and/or
employer decisions regarding the insurance coverage mandate that goes into effect in the United States in 2014, some employers
may seek to reduce costs by reducing or eliminating employer group healthcare plans or transferring a greater portion of healthcare
costs to their employees. Job losses or other economic hardships may also result in reduced levels of coverage for some individuals,
potentially resulting in lower levels of healthcare coverage for themselves or their families. These economic conditions may affect
patients' ability to afford healthcare as a result of increased co-pay or deductible obligations, greater cost sensitivity to existing
co-pay or deductible obligations, lost healthcare insurance coverage or for other reasons. We believe such conditions have led and
could continue to lead to changes in patient behavior and spending patterns that negatively affect usage of certain of our products,
including delaying treatment, rationing prescription medications, leaving prescriptions unfilled, reducing the frequency of visits
to healthcare facilities, utilizing alternative therapies and/or foregoing healthcare insurance coverage. In addition to its effects on
consumers, the economic downturn may have also increased cost sensitivities among medical providers in the United States, such
as oncology clinics, particularly in circumstances where providers may experience challenges in the collection of patient co-pays
or be forced to absorb treatment costs as a result of coverage decisions or reimbursement terms. Collectively, we believe these
changes have resulted and may continue to result in reduced demand for our products, which could materially and adversely affect
the sales of our products, our business and results of operations. Any resulting decrease in demand for our products could also
cause us to experience excess inventory write-offs and/or excess capacity or impairment charges at certain of our manufacturing
facilities.
In Europe, economic conditions across the region could potentially be impacted by countries of key concern, particularly
countries in Southern Europe. Economic conditions continue to affect our operations and performance outside the United States
as well, particularly in countries where government-sponsored healthcare systems are the primary payers for healthcare
expenditures, including drugs and biologics. In Southern Europe, credit and economic conditions have adversely impacted the
timing of collections of our trade receivables in this region. Global economic conditions may continue to impact the average lengthof time it takes to collect payments in Greece, Italy, Spain, Portugal or other countries, or we may never collect some or all of
these receivables, which could have a material adverse impact on our operating cash flows and a material adverse effect on our
financial position, liquidity or results of operations. See Our sales depend on coverage and reimbursement from third-party payers.
We also rely upon third parties for certain parts of our business, including licensees and partners, wholesale distributors of
our products, contract clinical trial providers, contract manufacturers and single third-party suppliers. Because of the recent volatility
in the financial markets, there may be a disruption or delay in the performance or satisfaction of commitments to us by these third
parties which could have a material adverse effect on the sales of our products, our business and results of operations. Current
economic conditions may adversely affect the ability of our distributors, customers and suppliers to obtain liquidity required to
buy inventory or raw materials and to perform their obligations under agreements with us, which could disrupt our operations.
Further, economic conditions appear to have affected, and may continue to affect, the business practices of our wholesale distributors
in a manner that contributes to lower sales of our products. Although we monitor our distributors', customers' and suppliers' financial
condition and their liquidity in order to mitigate our business risks, some of our distributors, customers and suppliers may becomeinsolvent, which could have a material adverse effect on the sales of our products, our business and results of operations. These
risks may be elevated with respect to our interactions with third parties with substantial operations in countries where current
economic conditions are the most severe, particularly where such third parties are themselves exposed to sovereign risk from
business interactions directly with fiscally-challenged government payers.
We maintain a significant portfolio of investments disclosed as cash equivalents and marketable securities on our Consolidated
Balance Sheet. The value of our investments may be adversely affected by interest rate fluctuations, downgrades in credit ratings,
illiquidity in the capital markets and other factors that may result in other than temporary declines in the value of our investments.
Any of those events could cause us to record impairment charges with respect to our investment portfolio or to realize losses on
the sale of investments.

7/27/2019 Amgen Inc 2012 Annual Report
http://slidepdf.com/reader/full/amgen-inc-2012-annual-report 49/150
42
Some of our products are used with drug delivery or companion diagnostic devices which have their own regulatory,
manufacturing, reimbursement and other risks.
Some of our products or product candidates may be used in combination with a drug delivery device, such as an injector or
other delivery system. Our product candidates or expanded indications of our products used with such drug delivery devices may
not be approved or may be substantially delayed in receiving regulatory approval if such devices do not gain or maintain regulatory
approval or clearance. Where approval of the product and device is sought under a single marketing drug application, the increased
complexity of the review process may also delay receipt of regulatory approval. In addition, some of these drug delivery devices
may be provided by single-source unaffiliated third-party companies. We are dependent on the sustained cooperation and effort
of those third-party companies both to supply the devices and, in some cases, to conduct the studies required for approval or clearance by the applicable regulatory agencies. We are also dependent on those third-party companies continuing to meet the
applicable regulatory and other requirements to maintain that approval or clearance once it has been received. Failure to supply
the devices, delays in or failure of the Amgen or third-party studies, or failure of the third-party company to obtain or maintain
regulatory approval or clearance of the devices could result in increased development costs, delays in or failure to obtain regulatory
approval and/or associated delays in a product candidate reaching the market or the expansion of existing product labels for new
indications. Loss of regulatory approval or clearance of a device that is used with our product may also result in the removal of
our product from the market.
Similarly, some of our products or product candidates may be used in combination with an in vitro companion diagnostic
device, such as a test kit. In some cases, our product candidates or expanded indications of our products used with in vitro companion
diagnostic devices may not be approved or may be substantially delayed in receiving regulatory approval if such devices do not
gain or maintain regulatory approval or clearance. For example, the FDA has informed us that its approval of Vectibix ® for the
first- and second-line mCRC indications we are seeking will be contingent upon approval of the companion diagnostic device
being developed in collaboration with QIAGEN, which identifies a patient's KRAS gene status. As with drug delivery devices used
with our products, our ability to get and maintain the necessary regulatory approvals for our products or product candidates used
with in vitro companion diagnostic devices can be substantially dependent on whether the manufacturers of such devices meet
their contractual responsibilities to us and/or their obligations to regulatory authorities. Failures by these manufacturers can also
result in the significant delays and added costs described above, or even result in the removal of our product from the market.
The in vitro companion diagnostic and drug delivery devices used with our products are also subject to many of the same
reimbursement risks and challenges to which our products are subject. (See Our sales depend on coverage and reimbursement
from third-party payers.) A reduction in the availability of, or the coverage and/or reimbursement for, in vitro companion diagnostic
or drug delivery devices used with our products could have a material adverse effect on our product sales, business and results of
operations.
Our ESAs continue to be under review and receive scrutiny by regulatory authorities.
Beginning in 2006, adverse safety results involving ESAs were observed and since that time our ESAs have been the subject
of ongoing review and scrutiny by regulatory authorities and other agencies. In the United States, over this time frame the FDA
has reviewed the benefit-risk profile of ESAs, which has resulted in changes to ESA labeling and usage in both the oncology and
nephrology clinical settings. Over this same time period, CMS has also evaluated the use of ESAs and has made substantial
reimbursement changes in the oncology and nephrology clinical settings. (See Our sales depend on coverage and reimbursement
from third-party payers.) Together, these labeling and reimbursement changes, along with the approved REMS for ESAs, have
had and may continue to have a material adverse effect on sales of our ESAs, our business and results of operations, and further
labeling or reimbursement changes by these regulatory authorities could increase the severity of that effect.
We have also agreed with the FDA to conduct a number of PMCs for our ESAs. In 2004, we agreed with the FDA to a robust
pharmacovigilance program to continue to study the safety surrounding the use of darbepoetin alfa in the oncology setting. Of thefive studies originally included in that pharmacovigilance program, four are complete and analysis of the results from the fifth
study, LHN03-6B, is currently ongoing. The results of certain of those studies contributed to safety-related product labeling changes
for our ESAs and changes in reimbursement, as noted above. Other trials have subsequently been initiated to inform on the safety
of ESAs. In 2009 we initiated Study '782, a phase 3 non-inferiority study evaluating overall survival when comparing NSCLC
patients on Aranesp® to patients receiving placebo, as part of our Aranesp® pharmacovigilance program. In addition, JRD's EPO-
ANE-3010 study, which evaluates the use of epoetin alfa in patients with breast cancer, is ongoing. Both of these studies are
designated by the FDA as PMRs and must be conducted to maintain regulatory approval and marketing authorization. For the
nephrology setting, we have been engaged in ongoing discussions with the FDA regarding additional PMRs to explore alternative
ESA dosing strategies in CKD patients on dialysis and not on dialysis. In July 2012 we initiated study '226 to evaluate Aranesp®
use in CKD patients not on dialysis. We expect to discuss further with the FDA another potential study in CKD patients on dialysis.
Although we cannot predict the results or the outcomes of ongoing clinical trials, or the extent to which regulatory authorities may

7/27/2019 Amgen Inc 2012 Annual Report
http://slidepdf.com/reader/full/amgen-inc-2012-annual-report 50/150
43
require additional labeling changes as a result of these or other trials, we cannot exclude the possibility that unfavorable results
from clinical trials, including PMCs, could have a material adverse effect on the reimbursement, use and sales of our ESAs and
on our business and results of operations.
Regulatory authorities outside the United States have also reviewed and scrutinized the use of ESAs. In June 2008, the EMA
recommended updating the product information for ESAs with a new warning for their use in cancer patients, which was approved
by the EC in October 2008. Following the October 2008 revision, we experienced a reduction of Aranesp® sales in the supportive
cancer care setting in the EU. In addition, following the June 2011 ESA label changes in the United States, regulatory agencies
outside the United States have sought additional information from us about the use and safety of ESAs in the CKD setting.
Additional labeling or reimbursement changes by these regulatory authorities could materially and adversely affect thereimbursement, use and sales of our ESAs, our business and results of operations.
We continue to receive results from meta-analyses or previously initiated clinical trials using ESAs, including PMCs. For
example, in May 2009, the Cochrane Collaboration published its independent meta-analysis of patient-level data from previously
conducted, randomized, controlled, clinical studies evaluating ESAs in cancer patients which we submitted to the FDA and the
EMA. This Cochrane meta-analysis of patient-level data from previous studies corroborates prior analyses indicating that the use
of ESAs may increase the risk of death in cancer patients. The studies in the analysis all predate the current label, which advises
using the least amount of ESA necessary to avoid transfusion, but they do not exclude the potential for adverse outcomes when
ESAs are prescribed according to the current label. In addition, in January 2013 we announced data from the RED-HF® trial
evaluating the effect of treatment of anemia with darbepoetin alfa on morbidity and mortality in patients with symptomatic left
ventricular heart failure. The trial did not meet its primary endpoint of reducing the composite endpoint of time to death from any
cause or first hospital admission for worsening heart failure. While there were no new safety findings identified in the RED-HF®
trial, unfavorable results from similar trials or meta-analyses of previous clinical trials could materially and adversely affect the
use and sales of our ESAs, our business and results of operations.
We must conduct clinical trials in humans before we can commercialize and sell any of our product candidates or existing
products for new indications.
Before we can sell any products, we must conduct clinical trials to demonstrate that our product candidates are safe and
effective for use in humans. The results of those clinical trials are used as the basis to obtain approval from regulatory authorities
such as the FDA and EMA. (See Our current products and products in development cannot be sold if we do not maintain or gain
regulatory approval.) We are required to conduct clinical trials using an appropriate number of trial sites and patients to support
the product label claims. The length of time, number of trial sites and patients required for clinical trials vary substantially and
therefore, we may spend several years and incur substantial expense in completing certain clinical trials. We may have difficulty
finding a sufficient number of clinical trial sites and subjects to participate in our clinical trials, particularly if competitors areconducting similar clinical trials in certain patient populations. Delays in planned clinical trials can result in increased development
costs, delays in regulatory approvals, associated delays in product candidates reaching the market and revisions to existing product
labels.
In addition, in order to increase the number of patients available for enrollment for our clinical trials, we have and will
continue to open clinical sites and enroll patients in a number of new geographic locations where our experience conducting
clinical trials is more limited, including Russia, India, China, South Korea, the Philippines, Singapore and some Central and South
American countries either through utilization of third-party contract clinical trial providers entirely or in combination with local
staff. Conducting clinical trials in locations where we have limited experience requires substantial time and resources to identify
and understand the unique regulatory environments of individual countries. Further, we must ensure the timely production,
distribution and delivery of the clinical supply of our product candidates to the numerous and varied clinical trial sites. If we fail
to adequately manage the design, execution and regulatory aspects of our large, complex and regulatorily diverse clinical trials or
manage the production or distribution of our clinical supply, corresponding regulatory approvals may be delayed or we may failto gain approval for our product candidates or could lose our ability to market existing products in certain therapeutic areas or
altogether. If we are unable to market and sell our product candidates or are unable to obtain approvals in the timeframe needed
to execute our product strategies, our business and results of operations could be materially and adversely affected. Additional
information on our clinical trials can be found on our website at www.amgen.com. (This website address is not intended to function
as a hyperlink, and the information contained on our website is not intended to be a part of this filing.)
We rely on independent third-party clinical investigators to recruit subjects and conduct clinical trials in accordance with
the applicable study protocols and laws and regulations. We also may acquire companies that have ongoing clinical trials. These
trials may not be conducted to the same standards as ours; however, once an acquisition has been completed we assume responsibility
for the conduct of the trial, including any potential risks and liabilities associated with the past and prospective conduct of those
trials. If regulatory authorities determine that we or others, including our licensees or the independent investigators selected by
7/27/2019 Amgen Inc 2012 Annual Report
http://slidepdf.com/reader/full/amgen-inc-2012-annual-report 51/150
44
us or by a company we have acquired, have not complied with regulations in the R&D of a product candidate, a new indication
for an existing product or information to support a current indication, they may refuse to accept trial data from the site, not approve
the product candidate or new indication or maintain approval of the current indication in its current form or at all, and we would
not be able to market and sell it. If we were unable to market and sell our products or product candidates, our business and results
of operations could be materially and adversely affected.
Further, we rely on unaffiliated third-party vendors to perform certain aspects of our clinical trial operations. In addition,
some of our clinical trials involve drugs manufactured and marketed by other pharmaceutical companies. These drugs may be
administered in a clinical trial in combination with one of our product candidates or in a head-to-head study comparing the products'
relative efficacy and safety. In the event that any of these vendors or pharmaceutical companies have unforeseen issues thatnegatively impact the quality of their work or creates a shortage of supply, our ability to complete our applicable clinical trials
and/or evaluate clinical results may also be negatively impacted. As a result, this could adversely affect our ability to file for, gain
or maintain regulatory approvals worldwide on a timely basis, if at all.
Patients may also suffer adverse medical events or side effects in the course of our, our licensees, partners or independent
investigators' clinical trials which could:
• delay the clinical trial program;
• require additional or longer trials to gain approval;
• prohibit regulatory approval of our product candidates or new indications for existing products; and
• render the product candidate commercially unfeasible or limit our ability to market existing products completely or in
certain therapeutic areas.
Safety signals, trends, adverse events or results from clinical trials or studies performed by us or by others (including our
licensees or independent investigators) or from the marketed use of our drugs or similar products that result in revised safety-
related labeling or restrictions on the use of our approved products could negatively impact healthcare provider prescribing behavior,
use and sales of our products, regulatory or private health organization medical guidelines and reimbursement for our products,
all of which could have a material adverse effect on our business and results of operations.
Clinical trials must be designed based on the current standard of medical care. However in certain diseases, such as cancer,
the standard of care is evolving rapidly. In these diseases, the duration of time needed to complete certain clinical trials may result
in the design of such clinical trials being based on an out of date standard of medical care, limiting the utility and application of such trials. We may not obtain favorable clinical trial results and may not be able to obtain regulatory approval for new product
candidates, new indications for existing products or maintenance of our current labels on this basis. Further, clinical trials conducted
by others, including our licensees, partners or independent investigators, may result in unfavorable clinical trials results that may
call into question the safety of our products in off-label or on label uses that may result in label restrictions and/or additional trials.
Even after a product is on the market, safety concerns may require additional or more extensive clinical trials as part of a
pharmacovigilance program of our product or for approval of a new indication. For example, we initiated Study '782 as part of
our Aranesp® oncology pharmacovigilance program. (See Our ESAs continue to be under review and receive scrutiny by regulatory
authorities.) In connection with the June 2011 ESA label changes, we also agreed to conduct additional clinical trials examining
the use of ESAs in CKD. Additional clinical trials we initiate, including those required by the FDA, could result in substantial
additional expense and the outcomes could result in additional label restrictions or the loss of regulatory approval for an approved
indication, each of which could have a material adverse effect on the sales of our products, our business and results of operations.
Additionally, any negative results from such trials could materially affect the extent of approvals, the use, reimbursement and salesof our products.
We expect to face increasing competition from biosimilars.
We currently face competition in Europe from biosimilars, and we expect to face increasing competition from biosimilars
in the future. In 2010, lawmakers in the United States enacted healthcare reform legislation which included an abbreviated regulatory
pathway for the approval of biosimilars. The EU is already approving biosimilars under such a regulatory pathway. To the extent
that governments adopt more permissive approval frameworks and competitors are able to obtain broader marketing approval for
biosimilars, our products will become subject to increased competition. Expiration or successful challenge of applicable patent
rights could trigger such competition, and we could face more litigation regarding the validity and/or scope of our patents. Our
7/27/2019 Amgen Inc 2012 Annual Report
http://slidepdf.com/reader/full/amgen-inc-2012-annual-report 52/150
45
products may also experience greater competition from lower-cost generic or biosimilars that come to market as branded products
that compete with our products lose patent protection.
In the EU, the EC has granted marketing authorizations for several biosimilars pursuant to a set of general and product class-
specific guidelines for biosimilar approvals issued over the past few years. In 2006, the EMA developed and issued regulatory
guidelines related to the development and approval of biosimilars. The guidelines included clinical trial guidance for certain
biosimilars, including erythropoietins and G-CSFs, recommending that applicants seeking approval of such biosimilars conduct
pharmacodynamic, toxicological and clinical safety studies as well as a pharmacovigilance program. Some companies have received
and other companies are seeking approval to market erythropoietin and G-CSF biosimilars in the EU, presenting additional
competition for our products. (See Our marketed products face substantial competition.) For example, following the expirationof the principal European patent relating to recombinant G-CSF in August 2006, the EC issued marketing authorizations for the
first G-CSF biosimilars and the products were launched in certain EU countries in 2008 and 2009. There are now several G-CSF
biosimilars available in the EU marketed by different companies and these G-CSF biosimilars compete with NEUPOGEN® and
Neulasta®. In December 2012, EMA guidelines on the approval process for monoclonal antibody biosimilars became effective.
In an effort to spur biosimilar utilization and/or increase potential health care savings, countries in the EU may adopt biosimilar
uptake measures such as requiring physician prescribing quotas or automatic substitution by pharmacists of biosimilars for the
corresponding reference products. We cannot predict to what extent the entry of biosimilars or other competing products will
impact future sales of our products in the EU. Our inability to compete effectively could reduce sales, which could have a material
adverse effect on our business and results of operations.
In the United States, with the adoption of the healthcare reform law the FDA was authorized to approve biosimilars under
a separate, abbreviated pathway. (See Our sales depend on coverage and reimbursement from third-party payers.) The law
established a period of 12 years of data exclusivity for reference products in order to preserve incentives for future innovation and
outlined statutory criteria for science-based biosimilar approval standards that take into account patient safety considerations.
Under this framework, data exclusivity protects the data in the innovator's regulatory application by prohibiting, for a period of
12 years, others from gaining FDA approval based in part on reliance or reference to the innovator's data in their application to
the FDA. The law does not change the duration of patents granted on biologic products. On February 9, 2012, the FDA released
three draft guidance documents that provide insight into the FDA's current thinking on the development of biosimilars and broad
parameters for the scientific assessment of biosimilar applications. The documents provide guidance in the development of
biosimilar versions of currently approved biological products and indicate that the clinical trials and other steps required for
approval of each biosimilar will depend on a variety of factors, including the complexity of the protein, the degree of analytical
similarity with the reference product and the potential risks of the product. A growing number of companies have announced their
intentions to develop biosimilar versions of existing biotechnology products, including a number of our products. Further, biosimilar
manufacturers with approved products in Europe may seek to obtain U.S. approval now that the regulatory pathway for biosimilars
has been enacted. In addition, critics of the 12-year exclusivity period in the biosimilar pathway law will likely seek to shortenthe data exclusivity period. President Obama's proposed 2013 budget included a proposal to lower the data exclusivity period to
seven years, but this would require new legislation be passed by Congress. Critics may also encourage the FDA to interpret narrowly
the law's provisions regarding which new products receive data exclusivity. While we are unable to predict the precise impact of
the pending introduction of biosimilars on our products, or the degree to which the FDA's 2012 biosimilar guidelines will contribute
to that impact, we expect in the future to face greater competition in the United States as a result of biosimilars and downward
pressure on our product prices and sales, subject to our ability to enforce our patents. (See Item 7A. Management's Discussion
and Analysis of Financial Condition and Results of Operations — Financial Condition, Liquidity and Capital Resources.) This
additional competition could have a material adverse effect on our business and results of operations.
With respect to the biosimilars we are working to develop (see Item1. Research and Development and Selected Product
Candidates —Amgen Development of Biosimilars), a number of other companies have announced their intention to develop
biosimilar versions of the same reference products that we are pursuing. Some of these companies may be ahead of us in their
biosimilar development timelines, have certain technical or other advantages over us or have more experience producing or marketing generic or biosimilar products. Even if we are able to successfully get our biosimilar product candidates approved by
regulatory authorities, this additional competition could limit the ability of our biosimilars to gain market acceptance with
prescribers or payors or otherwise affect the sales of our biosimilars.
We may not be able to develop commercial products.
Successful product development in the biotechnology industry is highly uncertain, and very few R&D projects produce a
commercial product. We intend to continue to make significant R&D investments. Product candidates or new indications for
existing products (collectively, “product candidates”) that appear promising in the early phases of development may fail to reach
the market for a number of reasons, such as:
7/27/2019 Amgen Inc 2012 Annual Report
http://slidepdf.com/reader/full/amgen-inc-2012-annual-report 53/150
46
• the product candidate did not demonstrate acceptable clinical trial results even though it demonstrated positive preclinical
trial results, for reasons that could include changes in the standard of care of medicine;
• the product candidate was not effective or more effective than currently available therapies in treating a specified
condition or illness;
• the product candidate is not cost effective in light of existing therapeutics;
• the product candidate had harmful side effects in humans or animals;
• the necessary regulatory bodies, such as the FDA or EMA, did not approve our product candidate for an intended use;
• the product candidate was not economical for us to manufacture and commercialize;
• the biosimilar product candidate fails to demonstrate the requisite bioequivalence to the applicable reference product,
or is otherwise determined to be unacceptable for purposes of safety or efficacy, to gain approval under the biosimilar
pathway;
• other parties have or may have proprietary rights relating to our product candidate, such as patent rights, and will not
let us sell it on reasonable terms, or at all;
• we and certain of our licensees, partners or independent investigators may fail to effectively conduct clinical development
or clinical manufacturing activities; and
• the regulatory pathway to approval for product candidates is uncertain or not well-defined.
Several of our product candidates have failed or been discontinued at various stages in the product development process.
For example, in June 2004, we announced that the phase 2 study of Glial Cell Lined-Derived Neurotrophic Factor (GDNF) for
the treatment of advanced Parkinson's disease did not meet the primary study endpoint upon completion of nine months of the
double-blind treatment phase of the study. The conclusion was reached even though a small phase 1 pilot investigator-initiated
open-label study over a three-year period appeared to result in improvements for advanced Parkinson's disease patients.
Subsequently, we discontinued clinical development of GDNF in patients with advanced Parkinson's disease.
Inability to bring a product to market or a significant delay in the expected approval and related launch date of a new product
for any of the reasons discussed could potentially have a negative impact on our net sales and earnings and could result in asignificant impairment of in-process research and development (IPR&D) or other intangible assets.
Our marketed products face substantial competition.
We operate in a highly competitive environment. Our products compete with other products or treatments for diseases for
which our products may be indicated. Our competitors market products or are actively engaged in R&D in areas where we have
products, where we are developing product candidates or new indications for existing products. In the future, we expect that our
products will compete with new drugs currently in development, drugs currently approved for other indications that may later be
approved for the same indications as those of our products and drugs approved for other indications that are used off-label. Large
pharmaceutical companies and generics manufacturers of pharmaceutical products are expanding into the biotechnology field
with increasing frequency, and some pharmaceutical companies and generics manufacturers have formed partnerships to pursue
biosimilars. In addition, some of our competitors may have technical, competitive or other advantages over us for the development
of technologies and processes. These advantages may make it difficult for us to compete with them to successfully discover,develop and market new products and for our current products to compete with new products or new product indications that these
competitors may bring to market. As a result, our products may compete against products that have lower prices (including new
generics or biosimilars that come to market as branded products that compete with our products lose patent protection), equivalent
or superior performance, better safety profile, are easier to administer, achieve earlier entry into the market or that are otherwise
competitive with our products.
Concentration of sales at certain of our wholesaler distributors and consolidation of free-standing dialysis clinic businesses
may negatively impact our bargaining power and profit margins.
The substantial majority of our U.S. product sales are made to three pharmaceutical product wholesaler distributors,
AmerisourceBergen Corporation, Cardinal Health, Inc. and McKesson Corporation. These distributors, in turn, sell our products

7/27/2019 Amgen Inc 2012 Annual Report
http://slidepdf.com/reader/full/amgen-inc-2012-annual-report 54/150
47
to their customers, which include physicians or their clinics, dialysis centers, hospitals and pharmacies. One of our products,
EPOGEN®, is sold primarily to free-standing dialysis clinics, which have experienced significant consolidation. Two organizations,
DaVita and Fresenius Medical Care North America, own or manage a large number of the outpatient dialysis facilities located in
the United States and account for a substantial majority of all EPOGEN® sales in the free-standing dialysis clinic setting. Due to
this concentration, these entities have substantial purchasing leverage, which may put pressure on our pricing by their potential
ability to extract price discounts on our products or fees for other services, correspondingly negatively impacting our bargaining
position and profit margins.
Our business may be affected by litigation and government investigations.
We and certain of our subsidiaries are involved in legal proceedings. (See Note 18, Contingencies and commitments, to the
Consolidated Financial Statements.) Civil and criminal litigation is inherently unpredictable, and the outcome can result in excessive
verdicts, fines, penalties, exclusion from the federal healthcare programs and/or injunctive relief that affect how we operate our
business. Defense of litigation claims can be expensive, time-consuming and distracting and it is possible that we could incur
judgments or enter into settlements of claims for monetary damages or change the way we operate our business, which could have
a material adverse effect on our business and results of operations. In addition, product liability is a major risk in testing and
marketing biotechnology and pharmaceutical products. We may face substantial product liability exposure in human clinical trials
and for products that we sell after regulatory approval. Product liability claims, regardless of their merits, could be costly and
divert management's attention and adversely affect our reputation and the demand for our products. Amgen and Immunex have
previously been named as defendants in product liability actions for certain of our products.
We are also involved in government investigations that arise in the ordinary course of our business. As we announced on
December 19, 2012, we finalized a settlement agreement with the U.S. government, 49 states and the District of Columbia to settle
certain allegations regarding our sales and marketing practices arising out of ongoing civil and criminal investigations conducted
by the U.S. Attorney's Offices for the Eastern District of New York and the Western District of Washington (the “Federal
Investigations”). As more fully described in Note 18, Contingencies and commitments, to the Consolidated Financial Statements,
this settlement resolved the Federal Investigations, the related state Medicaid claims (except for those of the State of South Carolina)
and the claims of ten civil qui tam actions that had been pending against us. However, the settlement does not resolve certain of
other litigation matters that will continue to be pending against us, and we may also be subject to actions by governmental entities,
including those not participating in the settlement, and may in the future become subject to claims by other parties, in each case
with respect to the alleged conduct which is the subject of the settlement. We may see new governmental investigations of or
actions against us citing novel theories of recovery. Any of these results could have a material adverse effect on our business and
results of operations.
We rely on third-party suppliers for certain of our raw materials, medical devices and components.
We rely on unaffiliated third-party suppliers for certain raw materials, medical devices and components necessary for the
manufacturing of our commercial and clinical products. Certain of those raw materials, medical devices and components are the
proprietary products of those unaffiliated third-party suppliers and are specifically cited in our drug application with regulatory
agencies so that they must be obtained from that specific sole source or sources and could not be obtained from another supplier
unless and until the regulatory agency approved such supplier.
Among the reasons we may be unable to obtain these raw materials, medical devices and components include:
• regulatory requirements or action by regulatory agencies or others;
• adverse financial or other strategic developments at or affecting the supplier;
• unexpected demand for or shortage of raw materials, medical devices or components;
• labor disputes or shortages, including the effects of a pandemic flu outbreak, natural disaster, or otherwise;
• failure to comply with our quality standards which results in quality and product failures, product contamination and/
or recall; and
• discovery of previously unknown or undetected imperfections in raw materials, medical devices or components.
These events could negatively impact our ability to satisfy demand for our products, which could materially and adversely
affect our product use and sales and our business and operating results. For example, in prior years we have experienced shortages

7/27/2019 Amgen Inc 2012 Annual Report
http://slidepdf.com/reader/full/amgen-inc-2012-annual-report 55/150
48
in certain components necessary for the formulation, fill and finish of certain of our products in our Puerto Rico facility. Further
quality issues which result in unexpected additional demand for certain components may lead to shortages of required raw materials
or components (such as we have experienced with EPOGEN® glass vials). We may experience or continue to experience these or
other shortages in the future resulting in delayed shipments, supply constraints, contract disputes and/or stock-outs of our products.
Also, certain of the raw materials required in the commercial and clinical manufacturing of our products are sourced from other
countries and/or derived from biological sources, including mammalian tissues. In addition, one of our marketed products also
uses bovine serum and human serum albumin. Some countries in which we market our products may restrict the use of certain
biologically derived substances in the manufacture of drugs. We continue to investigate alternatives to certain biological sources
and alternative manufacturing processes that do not require the use of certain biologically derived substances because such raw
materials may be subject to contamination and/or recall.
A material shortage, contamination, recall and/or restriction of the use of certain biologically derived substances or other
raw materials, which may be sourced from other countries and that are used in the manufacture of our products could adversely
impact or disrupt the commercial manufacturing of our products or could result in a mandated withdrawal of our products from
the market. This could negatively impact our ability to satisfy demand for our products, which could materially and adversely
affect our product sales, business and operating results. Further, any disruptions or delays by us or by third-party suppliers or
partners in converting to alternatives to certain biologically derived substances and alternative manufacturing processes or our
ability to gain regulatory approval for the alternative materials and manufacturing processes could increase our associated costs
or result in the recognition of an impairment in the carrying value of certain related assets, which could have a material and adverse
effect on our business and results of operations.
Manufacturing difficulties, disruptions or delays could limit supply of our products and limit our product sales.
Manufacturing biologic human therapeutic products is difficult, complex and highly regulated. We currently are involved
in the manufacture of all of our principal products and plan to manufacture many of our product candidates. In addition, we
currently use third-party contract manufacturers to produce or assist in the production of ENBREL, Prolia®, Sensipar ®/Mimpara®,
Nplate®, XGEVA® and Vectibix® and plan to use contract manufacturers to produce or assist in the production of a number of our
late-stage product candidates. Our ability to adequately and timely manufacture and supply our products is dependent on the
uninterrupted and efficient operation of our facilities and those of our third-party contract manufacturers, which may be impacted
by:
• availability or contamination of raw materials, components and equipment used in the manufacturing process, particularly
those for which we have no other source or supplier;
• capacity of our facilities and those of our contract manufacturers;
• contamination by microorganisms or viruses;
• natural or other disasters, including hurricanes, earthquakes, volcanoes or fires;
• labor disputes or shortages, including the effects of a pandemic flu outbreak, natural disaster, or otherwise;
• degree of compliance with regulatory requirements;
• changes in forecasts of future demand;
• timing and actual number of production runs;
• updating of manufacturing specifications;
• production success rates and yields; and
• timing and outcome of product quality testing.
If the efficient manufacture and supply of our products is interrupted, we may experience delayed shipments, supply
constraints, stock-outs and/or recalls of our products. For example, over the past several years we have initiated a number of
voluntary recalls of certain lots of our products. (See Our current products and products in development cannot be sold if we do
not maintain or gain regulatory approval.) If we are at any time unable to provide an uninterrupted supply of our products to
7/27/2019 Amgen Inc 2012 Annual Report
http://slidepdf.com/reader/full/amgen-inc-2012-annual-report 56/150
49
patients, we may lose patients and physicians may elect to prescribe competing therapeutics instead of our products, which could
materially and adversely affect our product sales, business and results of operations.
Our manufacturing processes and those of our third-party contract manufacturers must undergo a potentially lengthy FDA
or other regulatory approval process and are subject to continued review by the FDA and other regulatory authorities. It can take
longer than five years to build, validate and license a new manufacturing plant and it can take longer than three years to qualify
and license a new contract manufacturer. For example, in order to mitigate the risk associated with the majority of our formulation
and fill operations being performed in a single facility, we are completing the construction and qualification of a new formulation
and filling facility at our Puerto Rico site, and we are modifying and expanding our recently acquired formulation, fill and finish
manufacturing site in Ireland. Upon completion, these facilities will require licensure by the various regulatory authorities.
If regulatory authorities determine that we or our third-party contract manufacturers or certain of our third-party service
providers have violated regulations or if they restrict, suspend or revoke our prior approvals, they could prohibit us from
manufacturing our products or conducting clinical trials or selling our marketed products until we or the affected third-party
contract manufacturers or third-party service providers comply, or indefinitely. Because our third-party contract manufacturers
and certain of our third-party service providers are subject to the FDA and foreign regulatory authorities, alternative qualified
third-party contract manufacturers and third-party service providers may not be available on a timely basis or at all. If we or our
third-party contract manufacturers or third-party service providers cease or interrupt production or if our third-party contract
manufacturers and third-party service providers fail to supply materials, products or services to us, we may experience delayed
shipments, supply constraints, stock-outs and/or recalls of our products. Additionally, we distribute a substantial volume of our
commercial products through our primary distribution centers in Louisville, Kentucky for the United States and in Breda, the
Netherlands for Europe and much of the rest of the world. We also conduct all the labeling and packaging of our products distributed
in Europe and much of the rest of the world in Breda, the Netherlands. Our ability to timely supply products is dependent on the
uninterrupted and efficient operations of our distribution and logistics centers, our third-party logistics providers and our labeling
and packaging facility in Breda. Further, we rely on commercial transportation for the distribution of our products to our customers
which may be negatively impacted by natural disasters or security threats.
We perform a substantial amount of our commercial manufacturing activities at our Puerto Rico manufacturing facility and
a substantial amount of our clinical manufacturing activities at our Thousand Oaks, California manufacturing facility; if
significant natural disasters or production failures occur at the Puerto Rico facility, we may not be able to supply these
products or, at the Thousand Oaks facility, we may not be able to continue our clinical trials.
We currently perform all of the formulation, fill and finish for Neulasta®, NEUPOGEN®, Aranesp®, EPOGEN®, Prolia® and
XGEVA® and substantially all of the formulation, fill and finish operations for ENBREL at our manufacturing facility in Juncos,
Puerto Rico. We also currently perform all of the bulk manufacturing for Neulasta
®
, NEUPOGEN
®
and Aranesp
®
, all of the purification of bulk EPOGEN® material and substantially all of the bulk manufacturing for Prolia® and XGEVA® at this facility.
We perform substantially all of the bulk manufacturing and formulation, fill and finish, and packaging for product candidates to
be used in clinical trials at our manufacturing facility in Thousand Oaks, California. The global supply of our products and product
candidates is significantly dependent on the uninterrupted and efficient operation of these facilities. A number of factors could
materially and adversely affect our operations, including:
• power failures and/or other utility failures;
• breakdown, failure or substandard performance of equipment;
• improper installation or operation of equipment;
• labor disputes or shortages, including the effects of a pandemic flu outbreak;
• inability or unwillingness of third-party suppliers to provide raw materials and components;
• natural or other disasters, including hurricanes, earthquakes or fires; and
• failures to comply with regulatory requirements, including those of the FDA.
In the past, the Puerto Rico facility has experienced manufacturing component shortages and there was evidence of adverse
trends in the microbial bioburden of the production environment that reduced the production output. The same or other problems
may result in our being unable to supply these products, which could materially and adversely affect our product sales, business
and operating results. Although we have obtained limited insurance to protect against certain business interruption losses, there

7/27/2019 Amgen Inc 2012 Annual Report
http://slidepdf.com/reader/full/amgen-inc-2012-annual-report 57/150
50
can be no assurance that such coverage will be adequate or that such coverage will continue to remain available on acceptable
terms, if at all. The extent of the coverage of our insurance could limit our ability to mitigate for lost sales and such losses could
materially and adversely affect our product sales, business and operating results. Our Puerto Rico facility is also subject to the
same difficulties, disruptions or delays in manufacturing experienced in our other manufacturing facilities. For example, the limited
number of lots of ENBREL and EPOGEN® voluntarily recalled in 2009 and 2010 were manufactured at our Puerto Rico facility.
In future inspections, our failure to adequately address the FDA's expectations could lead to further inspections of the facility or
regulatory actions. (See Manufacturing difficulties, disruptions or delays could limit supply of our products and limit our product
sales.)
Our intellectual property positions may be challenged, invalidated, circumvented or expire, or we may fail to prevail in present and future intellectual property litigation.
Our success depends in part on our ability to obtain and defend patent rights and other intellectual property rights that are
important to the commercialization of our products and product candidates. The patent positions of pharmaceutical and
biotechnology companies can be highly uncertain and often involve complex legal, scientific and factual questions. Third parties
may challenge, invalidate or circumvent our patents and patent applications relating to our products, product candidates and
technologies. In addition, our patent positions might not protect us against competitors with similar products or technologies
because competing products or technologies may not infringe our patents. For certain of our product candidates, there are third
parties who have patents or pending patent applications that they may claim necessitate payment of a royalty or prevent us from
commercializing these product candidates in certain territories. Patent disputes are frequent, costly and can preclude, delay or
increase the cost of commercialization of products. We have been in the past, and may be in the future, involved in patent litigation.
A determination made by a court, agency or tribunal concerning infringement, validity, enforceability, injunctive or economic
remedy, or the right to patent protection, for example, are typically subject to appellate or administrative review. Upon review,
such initial determinations may be afforded little or no deference by the reviewing tribunal and may be affirmed, reversed, or
made the subject of reconsideration through further proceedings. A patent dispute or litigation may not discourage a potential
violator from bringing the product that is alleged to infringe to market prior to a final resolution of the dispute or litigation. For
example, until the Pennsylvania District Court entered final judgment and a permanent injunction against Teva on July 15, 2011
pursuant to a joint stipulation and settlement agreement between the parties, Teva had announced that it intended to sell its filgrastim
product, upon approval from the FDA, in the United States without a license from us and prior to the expiration of our G-CSF
patents. The period of time from inception until resolution of a patent dispute or litigation is subject to the availability and schedule
of the court, agency or tribunal before which the dispute or litigation is pending. We may be subject to competition during this
period and may not be able to fully recover for the losses, damages, and harms we incur from infringement by the competitor
product even if we prevail. Moreover, if we lose or settle current or future litigations at certain stages or entirely, we could be
subject to competition and/or significant liabilities, be required to enter into third-party licenses for the infringed product or
technology or be required to cease using the technology or product in dispute. In addition, we cannot guarantee that such licenseswill be available on terms acceptable to us, or at all.
Further, under the Hatch-Waxman Act, our products approved by the FDA under the FDCA may be the subject of patent
litigation with generic competitors before expiry of the five year period of data exclusivity provided for under the Hatch-Waxman
Act and prior to the expiration of the patents listed for the product. Likewise, our innovative biologic products may be the subject
of patent litigation prior to the expiration of our patents and, with respect to competitors seeking approval as a biosimilar or
interchangeable version of our products, prior to the twelve year exclusivity period provided under the Biologics Price Competition
and Innovation Act of 2009.
Over the next several years, certain of the existing patents on our principal products will expire. (See Item 1. Business —
Marketed Products.) As our patents expire, competitors may be able to legally produce and market similar products or technologies,
including biosimilars, which may have a material adverse effect on our product sales, business and results of operations. (See Item
7A. Management's Discussion and Analysis of Financial Condition and Results of Operations — Financial Condition, Liquidityand Capital Resources.) We have received, and we continue to seek, additional patent protection relating to our products, including
patents on our products, specific processes for making our products, formulations and particular uses of our products. However,
competitors may be able to invalidate, design around or otherwise circumvent our patents and sell competing products. For example,
there are a number of competing therapies currently on the market and more in clinical development that are different from
ENBREL but are used to treat the same inflammatory diseases treated by ENBREL. Although we continue to develop new
products, and obtain patent protection for these new product candidates, we may not be able to replace the revenue lost upon the
expiration of the patents on our current products.
From time to time, U.S. and other policymakers have proposed reforming the patent laws and regulations of their countries.
In September 2011, after years of Congressional debate regarding patent reform legislation, President Obama signed into law the
America Invents Act (the Act) considered by many to be the most substantial revision of U.S. patent law since 1952. The Act's

7/27/2019 Amgen Inc 2012 Annual Report
http://slidepdf.com/reader/full/amgen-inc-2012-annual-report 58/150
51
various provisions take effect over an 18-month period. The Act changes the current “first-to-invent” system to a system that
awards a patent to the “first-inventor-to-file” for an application for a patentable invention. This change alters the pool of available
materials that can be used to challenge patents and eliminates the ability to rely on prior research work in order to lay claim to
patent rights. Disputes as to whether the first filer is in fact the true inventor will be resolved through newly implemented derivation
proceedings. The Act also creates mechanisms to allow challenges to newly issued patents in the patent office in post-grant
proceedings and new inter partes reexamination proceedings. Although many of the changes bring U.S. law into closer harmony
with European and other national patent laws, the new bases and procedures may make it easier for competitors to challenge our
patents, which could result in increased competition and have a material adverse effect on our product sales, business and results
of operations. The changes may also make it harder to challenge third-party patents and place greater importance on being the
first inventor to file a patent application on an invention.
Our stock price is volatile.
Our stock price, like that of our peers in the biotechnology and pharmaceutical industries, is volatile. Our revenues and
operating results may fluctuate from period to period for a number of reasons. Events such as a delay in product development or
even a relatively small revenue shortfall may cause financial results for a period to be below our expectations or projections. As
a result, our revenues and operating results and, in turn, our stock price may be subject to significant fluctuations.
We may not be able to access the capital and credit markets on terms that are favorable to us, or at all.
The capital and credit markets may experience extreme volatility and disruption which may lead to uncertainty and liquidity
issues for both borrowers and investors. We may access the capital markets to supplement our existing funds and cash generated
from operations in satisfying our needs for working capital; capital expenditure and debt service requirements; our plans to pay
dividends and repurchase stock; and other business initiatives we plan to strategically pursue, including acquisitions and licensing
activities. In the event of adverse capital and credit market conditions, we may be unable to obtain capital market financing on
similar favorable terms, or at all, which could have a material adverse effect on our business and results of operations. Changes
in credit ratings issued by nationally recognized credit rating agencies could adversely affect our cost of financing and have an
adverse effect on the market price of our securities.
Guidelines and recommendations published by various organizations can reduce the use of our products.
Government agencies promulgate regulations and guidelines directly applicable to us and to our products. However,
professional societies, HTA organizations, practice management groups, insurance carriers, physicians, private health/science
foundations and organizations involved in various diseases from time to time may also publish guidelines or recommendations to
healthcare providers, administrators and payers, and patient communities. Recommendations by government agencies or thoseother groups/organizations may relate to such matters as usage, dosage, route of administration and use of related therapies as
well as reimbursement of our products by government and private payers. Recommendations or guidelines that are followed by
patients, healthcare providers and payers could result in decreased use and/or dosage of our products. Some examples of agency
and organizational guidelines include:
• In August 2012, the Kidney Disease: Improving Global Outcomes group (KDIGO), a not-for-profit foundation managed
by the National Kidney Foundation (NKF), published its updated global anemia guidelines in light of new study results,
particularly the data from the TREAT trial, which had become available since the NKF-Kidney Disease Outcomes
Quality Initiative (KDOQI™) clinical practice guidelines and clinical practice recommendations for anemia in CKD
were released in 2007. The new guidelines recommend, among other things, that ESAs not be used to maintain Hb
concentrations above 11.5 g/dL in adult patients with CKD. KDOQI has announced that it is preparing a U.S. commentary
on the KDIGO global anemia guidelines which is expected to be released in 2013.
• In April 2012, the American Society of Clinical Oncology (ASCO) published a review in which it identified the top five
opportunities to improve the quality and value of cancer care by curbing use of common tests and treatments that are
not supported by clinical evidence.Among ASCO's suggestions in this review was that oncologists should avoid
administering white blood cell stimulating factors (such as NEUPOGEN® and Neulasta®) to patients who have a very
low risk for febrile neutropenia, a position consistent with ASCO's existing guidelines for the use of white blood cell
stimulating factors.
In addition, HTA organizations, such as NICE in the UK and the Canadian Agency for Drugs and Technologies in Health,
make reimbursement recommendations to payers in their jurisdictions based on the clinical effectiveness, cost-effectiveness and
service impact of new, emerging and existing medicines and treatments.
7/27/2019 Amgen Inc 2012 Annual Report
http://slidepdf.com/reader/full/amgen-inc-2012-annual-report 59/150
52
Any recommendations or guidelines that result in decreased use, dosage or reimbursement of our products could materially
and adversely affect our product sales, business and operating results. In addition, the perception by the investment community
or stockholders that such recommendations or guidelines will result in decreased use and dosage of our products could adversely
affect the market price for our common stock.
The commercialization of certain of our product candidates and the marketing of certain of our products is dependent in
part on our partners.
We have entered into agreements with third parties to assist in the commercialization of certain of our product candidates
and the marketing of certain of our products in specified geographic areas. (See Item 1. Business — Business Relationships.)Many of these agreements involve the sharing of certain decisions and a division of responsibilities, costs and benefits. If our
partners fail to effectively deliver on their marketing and commercialization commitments to us or if we and our partners fail to
coordinate our efforts effectively, sales of our products may be materially and adversely affected.
Our risk mitigation measures and corporate compliance program cannot guarantee that we effectively manage all
operational risks and that we are in compliance with all potentially applicable U.S. federal and state regulations and all
potentially applicable foreign regulations and/or other requirements.
The development, manufacturing, distribution, pricing, sales, marketing and reimbursement of our products, together with
our general operations, are subject to extensive federal and state regulation in the United States and to extensive regulation in
foreign countries. (See Our current products and products in development cannot be sold if we do not maintain or gain regulatory
approval and Manufacturing difficulties, disruptions or delays could limit supply of our products and limit our product sales.) In
addition, our business is complex and involves significant operational risks. While we have implemented numerous risk mitigation
measures to comply with such regulations in this complex operating environment, we cannot guarantee that we will be able to
effectively mitigate all operational risks. Further, we are now operating under a corporate integrity agreement with the U.S.
Department of Health and Human Services, Office of Inspector General, which requires us to maintain our corporate compliance
program and to undertake a set of defined corporate integrity obligations. The corporate integrity agreement requires us to make
periodic attestations that we are implementing and following the provisions of the corporate integrity agreement, and provides for
an independent third-party review organization to assess and report on our compliance. While we have developed and instituted
a corporate compliance program, we cannot guarantee that we, our employees, our consultants or our contractors are or will be
in compliance with all potentially applicable U.S. federal and state regulations and/or laws, all potentially applicable foreign
regulations and/or laws and/or all requirements of the corporate integrity agreement. If we fail to adequately mitigate our operational
risks or if we or our agents fail to comply with any of those regulations, laws and/or requirements of the corporate integrity
agreement, a range of actions could result, including, but not limited to, the termination of clinical trials, the failure to approve a
product candidate, restrictions on our products or manufacturing processes, withdrawal of our products from the market, significantfines, exclusion from government healthcare programs or other sanctions or litigation. Such occurrences could have a material
and adverse effect on our product sales, business and results of operations.
Cost savings initiatives may result in the carrying value of certain existing manufacturing facilities or other assets becoming
impaired or other related charges being incurred.
Our business continues to face many challenges. In response to these challenges, we have worked and continue to work to
improve cost efficiencies and to reduce discretionary expenditures. As part of those efforts, we undertake cost savings initiatives
to evaluate our processes and procedures in order to identify opportunities for achieving greater efficiencies in how we conduct
our business. In particular, we evaluate our manufacturing operations to identify opportunities to increase production yields and/
or success rates as well as capacity utilization. Depending on the timing and outcomes of these cost savings initiatives, the carrying
value of certain manufacturing or other assets may not be fully recoverable and could result in the recognition of impairment and/
or other related charges. The recognition of such charges, if any, could have a material adverse effect on our results of operations.
The adoption of new tax legislation or exposure to additional tax liabilities could affect our profitability.
We are subject to income and other taxes in the United States and other jurisdictions in which we do business. As a result,
our provision for income taxes is derived from a combination of applicable tax rates in the various places we operate. Significant
judgment is required for determining our provision for income tax and our tax returns are periodically examined by various tax
authorities. We believe our accrual for tax liabilities is adequate for all open years based on past experience, interpretations of
tax law, and judgments about potential actions by tax authorities; however, due to the complexity of the provision for income
taxes, the ultimate resolution of any tax matters may result in payments greater or less than amounts accrued. Our provision for
income taxes and results of operations in the future could be adversely affected by changes to our operating structure, changes

7/27/2019 Amgen Inc 2012 Annual Report
http://slidepdf.com/reader/full/amgen-inc-2012-annual-report 60/150
53
in the mix of income and expenses in countries with differing tax rates, changes in the valuation of deferred tax assets and liabilities,
and changes in applicable tax laws, regulations or administrative interpretations thereof. For example, there are several proposals
under consideration in the United States to reform tax law, including proposals that may reduce or eliminate the deferral of U.S.
income tax on our unrepatriated foreign earnings. While it is uncertain how the U.S. Congress may address U.S. tax policy matters
in the future, reform of U.S. taxation, including taxation of income earned outside the United States, continues to be a topic of
discussion for the U.S. Congress and the Administration. A significant change to the U.S. tax system, such as a change to the
taxation of income earned outside the United States, could have a material and adverse effect on our business and on the results
of our operations.
There can be no assurance that we will continue to declare cash dividends or repurchase stock.
Our Board of Directors has declared quarterly dividends on our common stock since it adopted a dividend policy in 2011.
In addition, in December 2012, our Board of Directors approved an increase in the total authorization for repurchases of our
common stock in the amount of $2 billion. This amount was in addition to the approximately $0.5 billion then remaining under
the existing stock repurchase authorization. Whether we continue and the amount and timing of such dividends and/or stock
repurchases are subject to capital availability and periodic determinations by our Board of Directors that cash dividends and/or
stock repurchases are in the best interest of our stockholders and are in compliance with all respective laws and agreements of the
Company applicable to the declaration and payment of cash dividends and the repurchase of stock. Future dividends and stock
repurchases, including their timing and amount, may be affected by, among other factors: our views on potential future capital
requirements for strategic transactions, including acquisitions; debt service requirements; our credit rating; changes to applicable
tax laws or corporate laws; and changes to our business model. In addition, the amount we spend and the number of shares we
are able to repurchase under our stock repurchase program may further be affected by a number of other factors, including the
stock price and blackout periods in which we are restricted from repurchasing shares. Our dividend payments and/or stock
repurchases may change from time to time, and we cannot provide assurance that we will continue to declare dividends and/or
repurchase stock in any particular amounts or at all. A reduction in or elimination of our dividend payments and/or stock repurchases
could have a negative effect on our stock price.
The illegal distribution and sale by third parties of counterfeit versions of our products or of stolen or diverted products
could have a negative impact on our reputation and business.
Third parties may illegally distribute and sell counterfeit versions of our products, which do not meet the exacting standards
of our Company's development, manufacturing and distribution processes. Counterfeit medicines pose a significant risk to patient
health and safety because of the conditions under which they are manufactured and the lack of regulation of their contents.
Counterfeit products are frequently unsafe or ineffective and can be potentially life-threatening. Our reputation and business could
suffer harm as a result of counterfeit drugs sold under our brand name. In addition, products stolen from inventory, at warehouses, plants or while in transit or unlawfully diverted, which are not properly stored and which are sold through unauthorized channels,
could adversely impact patient safety, our reputation and our business. Public loss of confidence in the integrity of biologics and/
or pharmaceutical products as a result of counterfeiting or theft could have a material adverse effect on our product sales, business
and results of operations.
We are increasingly dependent on information technology systems and infrastructure.
We are increasingly dependent upon information technology systems and infrastructure. The multitude and complexity of
our computer systems make them inherently vulnerable to service interruption or destruction, malicious intrusion and random
attack. Likewise, data privacy or security breaches by employees or others may pose a risk that sensitive data, including intellectual
property, trade secrets or personal information belonging to the Company, its patients, customers or other business partners, may
be exposed to unauthorized persons or to the public. While we have in the past experienced cyber attacks and intrusions into our
computer systems, we do not believe that such attacks have had a material adverse effect on our operations. While we have investedheavily in the protection of data and information technology, there can be no assurance that our efforts will prevent service
interruptions, or identify breaches in our systems, that could adversely affect our business and operations and/or result in the loss
of critical or sensitive information, which could result in financial, legal, business or reputational harm to us.
Our efforts to acquire other companies or products and to integrate their operations may not be successful, and may
result in costs, delays or failures to realize the benefits of the transactions.
We have an ongoing process of evaluating potential merger, acquisition, partnering and in-license opportunities that we
expect will contribute to our future growth and expand our geographic footprint, product offerings and/or our R&D pipeline. Such
acquisitions may result in unanticipated costs, delays or other operational or financial problems related to integrating the acquired
company and business with our company, which may result in the diversion of our management's attention from other business

7/27/2019 Amgen Inc 2012 Annual Report
http://slidepdf.com/reader/full/amgen-inc-2012-annual-report 61/150
54
issues and opportunities. Failures or difficulties in integrating the operations of the businesses that we acquire, including their
personnel, technology, financial systems, distribution and general business operations and procedures, may affect our ability to
grow and may result in us incurring asset impairment or restructuring charges.
Item1B. UNRESOLVED STAFF COMMENTS
None.

7/27/2019 Amgen Inc 2012 Annual Report
http://slidepdf.com/reader/full/amgen-inc-2012-annual-report 62/150
55
Item2. PROPERTIES
The following table summarizes our significant properties and their primary functions as of December31, 2012. For additional
information regarding manufacturing initiatives, see Item1. Business—Manufacturing, Distribution and Raw Materials.
Our corporate headquarters are located in Thousand Oaks, California. In addition to the properties listed above, we have
undeveloped land at certain U.S. locations, principally in Thousand Oaks, California; Longmont, Colorado; Louisville, Kentucky;
Allentown, Pennsylvania; West Greenwich, Rhode Island; Seattle and Bothell, Washington; and Juncos, Puerto Rico, to
accommodate future expansion as required. Excluded from the table above are leased properties that have been abandoned and
certain buildings that we still own but are no longer used in our business. There are no material encumbrances on our properties.
7/27/2019 Amgen Inc 2012 Annual Report
http://slidepdf.com/reader/full/amgen-inc-2012-annual-report 63/150
56
We believe that our facilities are suitable for their intended use and, in conjunction with our third-party contracting
manufacturing agreements, provide adequate capacity. We also believe that our existing facilities, our third-party contract
manufacturing agreements and our anticipated additions are sufficient to meet our expected needs. See Item1A. Risk Factors—We
perform a substantial amount of our commercial manufacturing activities at our Puerto Rico manufacturing facility and a substantial
amount of our clinical manufacturing activities at our Thousand Oaks, California, manufacturing facility; if significant natural
disasters or production failures occur at the Puerto Rico facility, we may not be able to supply these products or, at the Thousand
Oaks facility, we may not be able to continue our clinical trials,—We rely on third-party suppliers for certain of our raw materials,
medical devices and components and—Manufacturing difficulties, disruptions or delays could limit supply of our products and
limit our product sales.
Item3. LEGAL PROCEEDINGS
Certain of the legal proceedings in which we are involved are discussed in Note 18, Contingencies and commitments, to
our Consolidated Financial Statements in this Annual Report on Form 10-K and are hereby incorporated by reference.
Item4. MINE SAFETY DISCLOSURES
Not applicable.
PART II
Item5. MARKET FOR REGISTRANT’S COMMON EQUITY, RELATED STOCKHOLDER MATTERS ANDISSUER PURCHASES OF EQUITY SECURITIES
Common stock
Our common stock trades on The NASDAQ Global Select Market under the symbol AMGN. As of February19, 2013, there
were approximately 8,466 holders of record of our common stock.
The following table sets forth, for the periods indicated, the range of high and low quarterly closing sales prices of the
common stock as quoted on The NASDAQ Global Select Market:
Year ended December31, 2012 High Low
Fourth quarter $ 90.17 $ 84.00
Third quarter 84.81 73.85
Second quarter 73.02 65.59
First quarter 69.84 63.76
Year ended December31, 2011
Fourth quarter $ 64.74 $ 53.90
Third quarter 58.28 48.27
Second quarter 61.17 53.08
First quarter 57.31 50.95
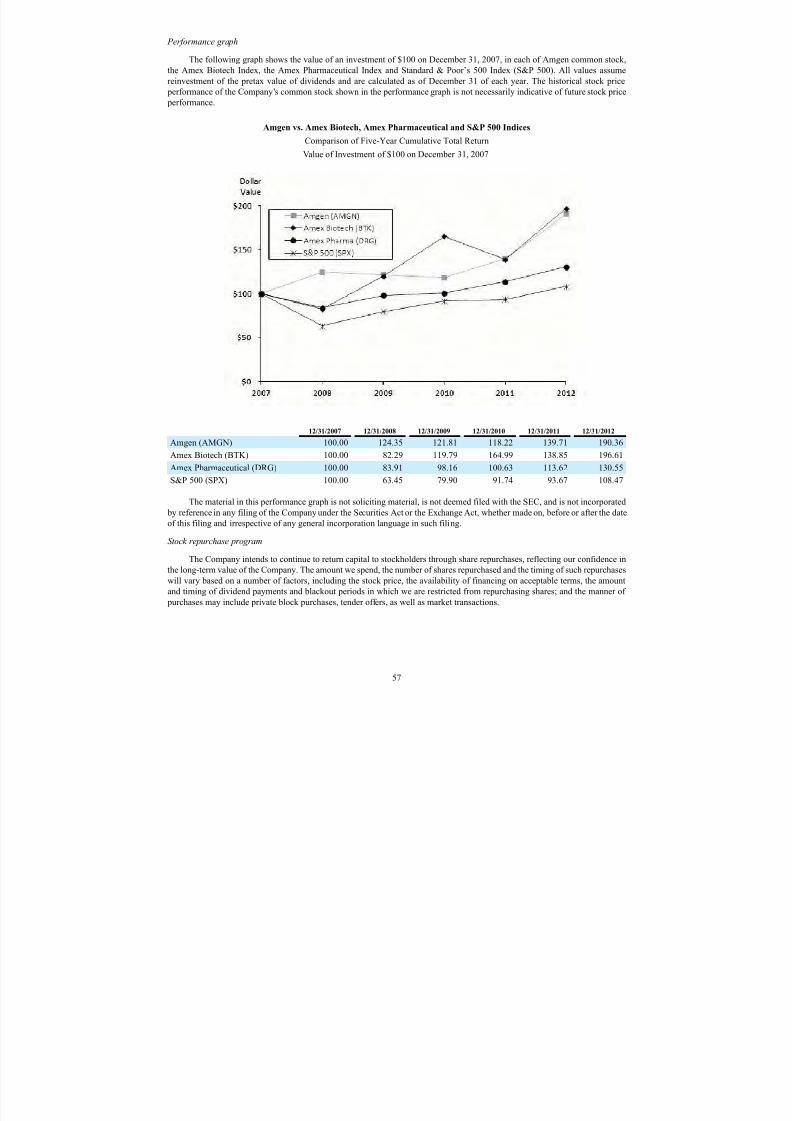
7/27/2019 Amgen Inc 2012 Annual Report
http://slidepdf.com/reader/full/amgen-inc-2012-annual-report 64/150
57
Performance graph
The following graph shows the value of an investment of $100 on December31, 2007, in each of Amgen common stock,
the Amex Biotech Index, the Amex Pharmaceutical Index and Standard& Poor’s 500 Index (S&P 500). All values assume
reinvestment of the pretax value of dividends and are calculated as of December31 of each year. The historical stock price
performance of the Company’s common stock shown in the performance graph is not necessarily indicative of future stock price
performance.
Amgen vs. Amex Biotech, Amex Pharmaceutical and S&P 500 Indices
Comparison of Five-Year Cumulative Total Return
Value of Investment of $100 on December 31, 2007
12/31/2007 12/31/2008 12/31/2009 12/31/2010 12/31/2011 12/31/2012
Amgen (AMGN) 100.00 124.35 121.81 118.22 139.71 190.36
Amex Biotech (BTK) 100.00 82.29 119.79 164.99 138.85 196.61
Amex Pharmaceutical (DRG) 100.00 83.91 98.16 100.63 113.62 130.55
S&P 500 (SPX) 100.00 63.45 79.90 91.74 93.67 108.47
The material in this performance graph is not soliciting material, is not deemed filed with the SEC, and is not incorporated
by reference in any filing of the Company under the Securities Act or the Exchange Act, whether made on, before or after the date
of this filing and irrespective of any general incorporation language in such filing.
Stock repurchase program
The Company intends to continue to return capital to stockholders through share repurchases, reflecting our confidence in
the long-term value of the Company. The amount we spend, the number of shares repurchased and the timing of such repurchases
will vary based on a number of factors, including the stock price, the availability of financing on acceptable terms, the amount
and timing of dividend payments and blackout periods in which we are restricted from repurchasing shares; and the manner of
purchases may include private block purchases, tender offers, as well as market transactions.
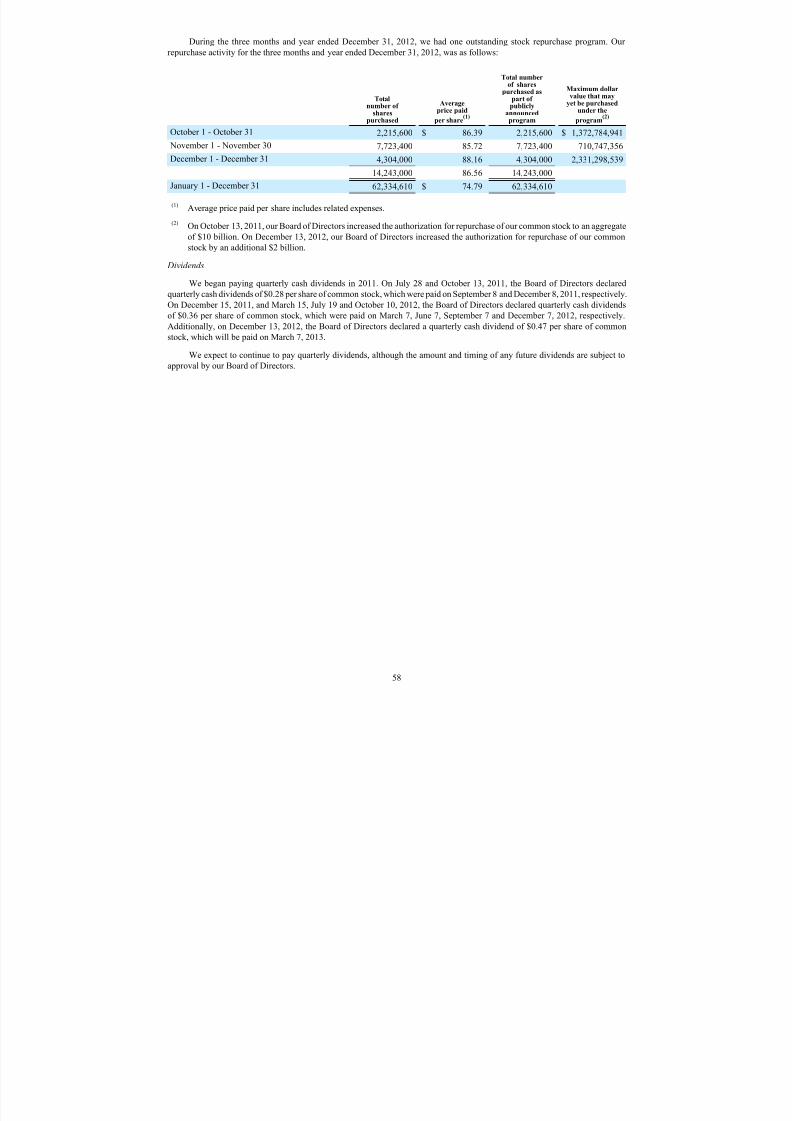
7/27/2019 Amgen Inc 2012 Annual Report
http://slidepdf.com/reader/full/amgen-inc-2012-annual-report 65/150
58
During the three months and year ended December31, 2012, we had one outstanding stock repurchase program. Our
repurchase activity for the three months and year ended December31, 2012, was as follows:
Totalnumber of
sharespurchased
Averagepricepaid
pershare(1)
Totalnumberof shares
purchased aspartof
publiclyannouncedprogram
Maximum dollarvalue that may
yet be purchasedunder the
program(2)
October1 - October31 2,215,600 $ 86.39 2,215,600 $ 1,372,784,941 November1 - November30 7,723,400 85.72 7,723,400 710,747,356
December1 - December31 4,304,000 88.16 4,304,000 2,331,298,539
14,243,000 86.56 14,243,000
January1 - December31 62,334,610 $ 74.79 62,334,610
(1) Average price paid per share includes related expenses.
(2) On October13, 2011, our Board of Directors increased the authorization for repurchase of our common stock to an aggregate
of $10 billion. On December13, 2012, our Board of Directors increased the authorization for repurchase of our common
stock by an additional $2 billion.
Dividends
We began paying quarterly cash dividends in 2011. On July 28 and October 13, 2011, the Board of Directors declared
quarterly cash dividends of $0.28 per share of common stock, which were paid on September 8 and December 8, 2011, respectively.
On December15, 2011, and March 15, July 19 and October 10, 2012, the Board of Directors declared quarterly cash dividends
of $0.36 per share of common stock, which were paid on March7, June 7, September 7 and December 7, 2012, respectively.
Additionally, on December 13, 2012, the Board of Directors declared a quarterly cash dividend of $0.47 per share of common
stock, which will be paid on March 7, 2013.
We expect to continue to pay quarterly dividends, although the amount and timing of any future dividends are subject to
approval by our Board of Directors.

7/27/2019 Amgen Inc 2012 Annual Report
http://slidepdf.com/reader/full/amgen-inc-2012-annual-report 66/150
59
Item6. SELECTED FINANCIAL DATA
Years ended December31,
Consolidated Statement of Income Data: 2012 2011 2010 2009 2008
(In millions, except per share data)
Revenues:
Product sales $ 16,639 $ 15,295 $ 14,660 $ 14,351 $ 14,687
Other revenues 626 287 393 291 316Total revenues 17,265 15,582 15,053 14,642 15,003
Operating expenses:
Cost of sales (excludes amortization of certainacquired intangible assets presented separately) 2,918 2,427 2,220 2,091 2,296
Research and development 3,380 3,167 2,894 2,864 3,030
Selling, general and administrative 4,801 4,486 3,983 3,820 3,789
Amortization of certain acquiredintangible assets 294 294 294 294 294
Other (1) 295 896 117 67 380
Net income 4,345 3,683 4,627 4,605 4,052Diluted earnings per share 5.52 4.04 4.79 4.51 3.77
Dividends paid per share 1.44 0.56 — — —
As of December31,
Consolidated Balance Sheet Data: 2012 2011 2010 2009 2008
(In millions)
Total assets $ 54,298 $ 48,871 $ 43,486 $ 39,629 $ 36,427
Total debt(2) 26,529 21,428 13,362 10,601 9,352
Total stockholders’ equity(3) 19,060 19,029 23,944 22,667 20,885
In addition to the following notes, see Item7. Management’s Discussion and Analysis of Financial Condition and Results
of Operations and the Consolidated Financial Statements and accompanying notes and previously filed Annual Reports on Form
10-K for further information regarding our consolidated results of operations and financial position for periods reported therein
and for known factors that will impact comparability of future results. Also, see Item5. Market for Registrant’s Common Equity,
Related Stockholder Matters and Issuer Purchases of Equity Securities for information regarding cash dividends declared per share
of common stock.
(1) In 2011, we recorded a $780 million legal settlement charge ($705 million, net of tax) in connection with an agreement in
principle to settle allegations related to our sales and marketing practices. In 2008, we recorded loss accruals for settlements
of certain commercial legal proceedings aggregating $288 million, related principally to the settlement of the Ortho Biotech
Products L.P. antitrust suit.
(2) See Note 14, Financing arrangements, to the Consolidated Financial Statements for discussion of our financing arrangements.
In addition, in 2009 and 2008, we issued $2.0 billion and $1.0 billion, respectively, aggregate principal amount of notes. In
2009 and 2008 we repaid $1.0 billion of fixed interest rate notes and $2.0 billion of floating-rate notes, respectively.
(3) Throughout the five years ended December31, 2012, we had a share repurchase program authorized by the Board of Directors
through which we repurchased $4.7 billion, $8.3 billion, $3.8 billion, $3.2 billion and $2.3 billion, respectively, of Amgen
common stock.

7/27/2019 Amgen Inc 2012 Annual Report
http://slidepdf.com/reader/full/amgen-inc-2012-annual-report 67/150
60
Item7. MANAGEMENT’S DISCUSSION AND ANALYSIS OF FINANCIAL CONDITION AND RESULTS OFOPERATIONS
Forward-looking statements
This report and other documents we file with the SEC contain forward-looking statements that are based on current
expectations, estimates, forecasts and projections about us, our future performance, our business or others on our behalf, our beliefs
and our management’s assumptions. In addition, we, or others on our behalf, may make forward-looking statements in press
releases or written statements, or in our communications and discussions with investors and analysts in the normal course of
business through meetings, webcasts, phone calls and conference calls. Such words as “expect,” “anticipate,” “outlook,” “could,”“target,” “project,” “intend,” “plan,” “believe,” “seek,” “estimate,” “should,” “may,” “assume” and “continue,” as well as variations
of such words and similar expressions are intended to identify such forward-looking statements. These statements are not guarantees
of future performance and involve certain risks, uncertainties and assumptions that are difficult to predict. We describe our respective
risks, uncertainties and assumptions that could affect the outcome or results of operations in Item1A. Risk Factors. We have based
our forward-looking statements on our management’s beliefs and assumptions based on information available to our management
at the time the statements are made. We caution you that actual outcomes and results may differ materially from what is expressed,
implied or forecast by our forward-looking statements. Reference is made in particular to forward-looking statements regarding
product sales, regulatory activities, clinical trial results, reimbursement, expenses, earnings per share (EPS), liquidity and capital
resources, trends and planned dividends and stock repurchases. Except as required under the federal securities laws and the rules
and regulations of the SEC, we do not have any intention or obligation to update publicly any forward-looking statements after
the distribution of this report, whether as a result of new information, future events, changes in assumptions or otherwise.
Overview
The following management’s discussion and analysis (MD&A) is intended to assist the reader in understanding Amgen’s
business. MD&A is provided as a supplement to, and should be read in conjunction with, our consolidated financial statements
and accompanying notes. Our results of operations discussed in MD&A are presented in conformity with accounting principles
generally accepted in the United States (GAAP).
We are a global biotechnology pioneer that discovers, develops, manufactures and delivers innovative human therapeutics.
Our medicines help millions of patients in the fight against cancer, kidney disease, RA, bone disease and other serious illnesses.
We operate in one business segment: human therapeutics. Therefore, our results of operations are discussed on a consolidated
basis.
We earn revenues and income and generate cash primarily from sales of human therapeutic products in the areas of supportive
cancer care, inflammation, nephrology and bone disease. Our principal products include Neulasta ®, NEUPOGEN®, ENBREL,
Aranesp®, EPOGEN®, XGEVA® and Prolia®. For additional information about our products, their approved indications and wherethey are marketed, see Item1. Business—Marketed Products.
In 2012, we had several notable accomplishments, including achieving 11% revenue growth driven by strong performance
across the portfolio. Product sales grew 9% in the United States and 7% in the ROW. We also continued paying quarterly dividends
in 2012, and in December, we declared a dividend of $0.47 per share of common stock payable in March 2013, representing a
31% increase over the quarterly dividend paid in each of the past four quarters. Additionally, we repurchased 62million shares of
our common stock at an aggregate cost of $4.7 billion in 2012. Under our $10 billion authorized stock repurchase program
announced in October 2011, we have repurchased a total of 146 million shares of our common stock for an aggregate cost of $9.7
billion at an average price of $66.37. Finally, we made significant advances in our product pipeline in 2012 including advancing
AMG 145, brodalumab, romosozumab and rilotumumab to phase 3 clinical trials.
We enter 2013 with various opportunities to continue growing our business. We believe the currently approved indications
for XGEVA
®
and Prolia
®
represent significant commercial opportunities. Longer-term growth may also be achieved by thesuccessful development of our later stage pipeline, by expansion into emerging markets and Japan, and through strategic business
development opportunities, such as our acquisitions of Micromet and MN in 2012. Our continued focus on increasing cost
efficiencies will assist in providing the necessary resources to fund many of these future opportunities.
Our business will, however, continue to face various challenges. Certain of our products will face increasing competitive
pressure as a result of competitive product launches. In the United States, ENBREL, EPOGEN® and XGEVA®, in particular, will
be facing increased competition. Additionally, over the next several years, starting in 2013, certain of the existing patents on our
principal products — including NEUPOGEN®, EPOGEN®and Aranesp® — will expire and, as a result, we expect to face increasing
competition from biosimilars. For additional information, including with regard to the expiration of the patents for various products,
see Item1. Business—Marketed Products.
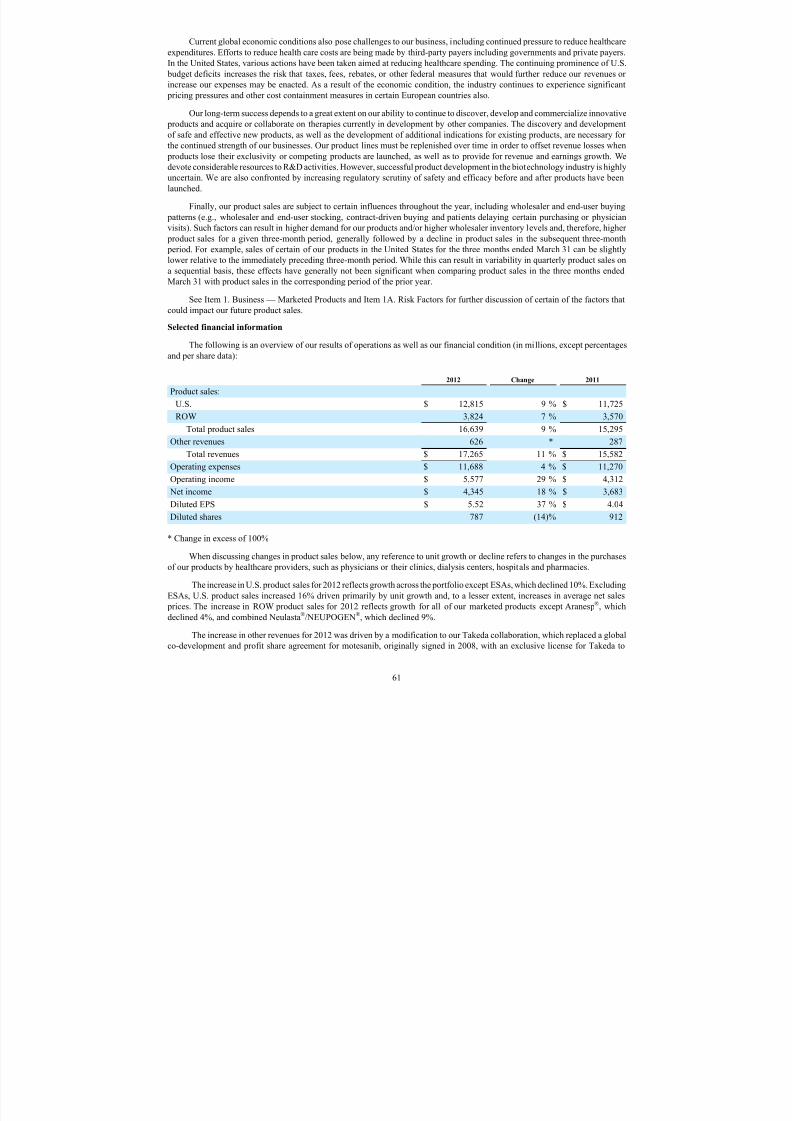
7/27/2019 Amgen Inc 2012 Annual Report
http://slidepdf.com/reader/full/amgen-inc-2012-annual-report 68/150
61
Current global economic conditions also pose challenges to our business, including continued pressure to reduce healthcare
expenditures. Efforts to reduce health care costs are being made by third-party payers including governments and private payers.
In the United States, various actions have been taken aimed at reducing healthcare spending. The continuing prominence of U.S.
budget deficits increases the risk that taxes, fees, rebates, or other federal measures that would further reduce our revenues or
increase our expenses may be enacted. As a result of the economic condition, the industry continues to experience significant
pricing pressures and other cost containment measures in certain European countries also.
Our long-term success depends to a great extent on our ability to continue to discover, develop and commercialize innovative
products and acquire or collaborate on therapies currently in development by other companies. The discovery and development
of safe and effective new products, as well as the development of additional indications for existing products, are necessary for the continued strength of our businesses. Our product lines must be replenished over time in order to offset revenue losses when
products lose their exclusivity or competing products are launched, as well as to provide for revenue and earnings growth. We
devote considerable resources to R&D activities. However, successful product development in the biotechnology industry is highly
uncertain. We are also confronted by increasing regulatory scrutiny of safety and efficacy before and after products have been
launched.
Finally, our product sales are subject to certain influences throughout the year, including wholesaler and end-user buying
patterns (e.g., wholesaler and end-user stocking, contract-driven buying and patients delaying certain purchasing or physician
visits). Such factors can result in higher demand for our products and/or higher wholesaler inventory levels and, therefore, higher
product sales for a given three-month period, generally followed by a decline in product sales in the subsequent three-month
period. For example, sales of certain of our products in the United States for the three months ended March31 can be slightly
lower relative to the immediately preceding three-month period. While this can result in variability in quarterly product sales on
a sequential basis, these effects have generally not been significant when comparing product sales in the three months endedMarch31 with product sales in the corresponding period of the prior year.
See Item 1. Business — Marketed Products and Item 1A. Risk Factors for further discussion of certain of the factors that
could impact our future product sales.
Selected financial information
The following is an overview of our results of operations as well as our financial condition (in millions, except percentages
and per share data):
2012 Change 2011
Product sales:
U.S. $ 12,815 9 % $ 11,725
ROW 3,824 7 % 3,570
Total product sales 16,639 9 % 15,295
Other revenues 626 * 287
Total revenues $ 17,265 11 % $ 15,582
Operating expenses $ 11,688 4 % $ 11,270
Operating income $ 5,577 29 % $ 4,312
Net income $ 4,345 18 % $ 3,683
Diluted EPS $ 5.52 37 % $ 4.04
Diluted shares 787 (14)% 912
* Change in excess of 100%
When discussing changes in product sales below, any reference to unit growth or decline refers to changes in the purchases
of our products by healthcare providers, such as physicians or their clinics, dialysis centers, hospitals and pharmacies.
The increase in U.S. product sales for 2012 reflects growth across the portfolio except ESAs, which declined 10%. Excluding
ESAs, U.S. product sales increased 16% driven primarily by unit growth and, to a lesser extent, increases in average net sales
prices. The increase in ROW product sales for 2012 reflects growth for all of our marketed products except Aranesp®, which
declined 4%, and combined Neulasta®/NEUPOGEN®, which declined 9%.
The increase in other revenues for 2012 was driven by a modification to our Takeda collaboration, which replaced a global
co-development and profit share agreement for motesanib, originally signed in 2008, with an exclusive license for Takeda to

7/27/2019 Amgen Inc 2012 Annual Report
http://slidepdf.com/reader/full/amgen-inc-2012-annual-report 69/150
62
develop, manufacture and commercialize motesanib. That modification resulted in revenue recognition of $232 million. The
increase also reflects milestone payments received from AstraZeneca and Astellas Pharma Inc.
Operating expenses in 2011 included a previously disclosed charge for a legal settlement reserve of $780 million.
The increase in net income for 2012 was due primarily to higher operating income, offset partially by higher interest expense,
net, and higher effective income tax rates.
The increase in diluted EPS for 2012 was driven primarily by increases in net income and by the favorable impacts of our
stock repurchase program, which reduced the number of shares used to compute diluted EPS.
Although changes in foreign currency exchange rates result in increases or decreases in our reported international product
sales, the benefit or detriment that such movements have on our international product sales is offset partially by corresponding
increases or decreases in our international operating expenses and our related foreign currency hedging activities. Our hedging
activities seek to offset the impacts, both positive and negative, that foreign currency exchange rate changes may have on our net
income by hedging our net foreign currency exposure, primarily with respect to product sales denominated in euros.
Commencing January1, 2011, Puerto Rico imposes a temporary excise tax on the purchase of goods and services from a
related manufacturer in Puerto Rico. The excise tax is imposed on the gross intercompany purchase price of the goods and services
and is effective for a six-year period beginning in 2011, with the excise tax rate declining in each year (4% in 2011, 3.75% in
2012, 2.75% in 2013, 2.5% in 2014, 2.25% in 2015 and 1% in 2016). In February 2013, the Puerto Rico government proposed an
amendment to the excise tax legislation which, if approved, would increase the excise tax rate to 4% effective July 1, 2013 through
2017. We account for the excise tax as a manufacturing cost that is capitalized in inventory and expensed in cost of sales when
the related products are sold. For U.S. income tax purposes, the excise tax results in foreign tax credits that are generally recognizedin our provision for income taxes in the year in which the excise tax is incurred. This excise tax has had and will continue to have
a significant adverse impact on our cost of sales and a significant favorable impact on our provision for income taxes. In addition,
the overall impact of the excise tax will vary from period to period as a result of the timing difference between recognizing the
expense and the applicable foreign tax credit. As a result of the excise tax in 2012, cost of sales increased by $343 million, the
provision for income taxes was reduced by $337 million and EPS was unfavorably impacted by $0.01. In 2011, cost of sales
increased by $211 million, the provision for income taxes was reduced by $321 million and EPS was favorably impacted by $0.12.
As of December31, 2012, our cash, cash equivalents and marketable securities totaled $24.1 billion, and total debt outstanding
was $26.5 billion. Of our total cash, cash equivalents and marketable securities balance as of December31, 2012, approximately
$18.9 billion was generated from operations in foreign tax jurisdictions and is intended to be invested indefinitely outside the
United States. Under current tax laws, if these funds were repatriated for use in our U.S. operations, we would be required to pay
additional income taxes at the tax rates then in effect.
Results of Operations
Product sales
Worldwide product sales were as follows (dollar amounts in millions):
2012 Change 2011 Change 2010
Neulasta®/NEUPOGEN ® $ 5,352 3 % $ 5,212 8 % $ 4,844
ENBREL 4,236 14 % 3,701 5 % 3,534
Aranesp® 2,040 (11)% 2,303 (7)% 2,486
EPOGEN® 1,941 (5)% 2,040 (19)% 2,524
XGEVA® 748 * 351 * 8
Prolia® 472 * 203 * 33
Other products 1,850 25 % 1,485 21 % 1,231
Total product sales $ 16,639 9 % $ 15,295 4 % $ 14,660
Total U.S. $ 12,815 9 % $ 11,725 4 % $ 11,254
Total ROW 3,824 7 % 3,570 5 % 3,406
Total product sales $ 16,639 9 % $ 15,295 4 % $ 14,660
* Change in excess of 100%
Future sales of our products will depend, in part, on the factors discussed in the Overview, Item 1. Business - Marketed
Products, Item 1A. Risk Factors and any additional factors discussed in the individual product sections below.

7/27/2019 Amgen Inc 2012 Annual Report
http://slidepdf.com/reader/full/amgen-inc-2012-annual-report 70/150
63
Neulasta® /NEUPOGEN ®
Total Neulasta® and total NEUPOGEN® sales by geographic region were as follows (dollar amounts in millions):
2012 Change 2011 Change 2010
Neulasta®—U.S. $ 3,207 7 % $ 3,006 13 % $ 2,654
Neulasta®—ROW 885 (6)% 946 5 % 904
Total Neulasta® 4,092 4 % 3,952 11 % 3,558
NEUPOGEN®—U.S. 1,007 5 % 959 3 % 932 NEUPOGEN®—ROW 253 (16)% 301 (15)% 354
Total NEUPOGEN® 1,260 — % 1,260 (2)% 1,286
Total Neulasta®/NEUPOGEN® $ 5,352 3 % $ 5,212 8 % $ 4,844
The increase in U.S. Neulasta® sales for 2012 was driven by an increase in the average net sales price. The decrease in
ROW Neulasta® sales for 2012 was due primarily to a decrease in unit demand from loss of share to biosimilars in Europe and a
decrease in the average net sales price.
The increase in U.S. NEUPOGEN® sales for 2012 was driven by an increase in the average net sales price. The decrease
in ROW NEUPOGEN® sales for 2012 was driven by a decrease in unit demand from loss of share to biosimilars in Europe.
The increase in U.S. Neulasta® sales for 2011 was driven by increases in both unit demand and the average net sales price.
The increase in ROW Neulasta® sales for 2011 was driven primarily by an increase in unit demand.
The increase in U.S. NEUPOGEN® sales for 2011 was driven by an increase in the average net sales price, offset partially
by a decrease in unit demand. The decrease in ROW NEUPOGEN® sales for 2011 was driven by a decrease in unit demand, in
part, from loss of share to biosimilars in Europe, and a decrease in the average net sales price.
Our outstanding material U.S. patents for Filgrastim (NEUPOGEN®) expire in December 2013. We expect to face
competition in the United States beginning in the fourth quarter of 2013, which may have a material adverse impact over time on
future sales of NEUPOGEN® and, in turn, Neulasta®. See Financial Condition, Liquidity and Capital Resources for further
discussion of the potential impact of patent expiration. Our outstanding material U.S. patent for pegfilgrastim (Neulasta®) expires
in 2015.
Future Neulasta®/NEUPOGEN® sales will also depend, in part, on the development of new protocols, tests and/or treatments
for cancer and/or new chemotherapy treatments or alternatives to chemotherapy that may have reduced and may continue to reducethe use of chemotherapy in some patients.
ENBREL
Total ENBREL sales by geographic region were as follows (dollar amounts in millions):
2012 Change 2011 Change 2010
ENBREL—U.S. $ 3,967 15% $ 3,458 5% $ 3,304
ENBREL—Canada 269 11% 243 6% 230
Total ENBREL $ 4,236 14% $ 3,701 5% $ 3,534
The increase in ENBREL sales for 2012 was driven primarily by an increase in the average net sales price and, to a lesser
extent, an increase in unit demand.
The increase in ENBREL sales for 2011 was driven primarily by an increase in the average net sales price.
ENBREL also faces increased competition. See Item 1. Business — Marketed Products.

7/27/2019 Amgen Inc 2012 Annual Report
http://slidepdf.com/reader/full/amgen-inc-2012-annual-report 71/150
64
Aranesp®
Total Aranesp® sales by geographic region were as follows (dollar amounts in millions):
2012 Change 2011 Change 2010
Aranesp®—U.S. $ 782 (21)% $ 986 (11)% $ 1,103
Aranesp®— ROW 1,258 (4)% 1,317 (5)% 1,383
Total Aranesp® $ 2,040 (11)% $ 2,303 (7)% $ 2,486
The decrease in U.S. Aranesp® sales for 2012 was driven by a decline in unit demand. The unit decline reflects changes in
practice patterns resulting from changes to the label and to the reimbursement environment that occurred during 2011 (2011
changes). The decrease in ROW Aranesp® sales for 2012 was due primarily to a decrease in the average net sales price.
Sequentially, global Aranesp® unit demand was down 5% in the quarter ended December 31, 2012, compared with the
quarter ended September 30, 2012.
The decrease in U.S. Aranesp® sales for 2011 was driven primarily by a decline in unit demand due to the impact of the
2011 changes, offset partially by an increase in the average net sales price. The decrease in ROW Aranesp ® sales for 2011 was
due to a decrease in the average net sales price and a unit decline, reflecting segment contraction.
EPOGEN ®
Total EPOGEN® sales were as follows (dollar amounts in millions):
2012 Change 2011 Change 2010
EPOGEN®—U.S. $ 1,941 (5)% $ 2,040 (19)% $ 2,524
The decrease in EPOGEN® sales for 2012 was driven by a 23% decrease in unit demand, driven by reductions in dose
utilization due to changes to the label and to the reimbursement environment that occurred in 2011. This decrease was offset
partially by reductions in customer discounts, as part of new provider contracts that became effective January 1, 2012, and by a
year-over-year favorable change in accounting estimates of $96 million.
The decrease in EPOGEN® sales for 2011 was due primarily to a decrease in unit demand due to the impact of the 2011
changes, offset partially by an increase in the average net sales price and patient population growth.
Future EPOGEN® sales will also depend, in part, on such factors as:
• increased competition in the U.S. dialysis setting;
• changes in dose utilization as healthcare providers continue to refine their treatment practices in accordance with approved
labeling;
• new or amended contracts with dialysis centers; and
• adoption of alternative therapies or development of new modalities to treat anemia associated with CKD.
XGEVA®
and Prolia®
Total XGEVA® and total Prolia® sales by geographic region were as follows (dollar amounts in millions):
2012 Change 2011 Change 2010
XGEVA®—U.S. $ 644 88% $ 343 * $ 8
XGEVA®—ROW 104 * 8 N/A —
Total XGEVA® 748 * 351 * 8
Prolia®—U.S. 292 * 130 * 26
Prolia®—ROW 180 * 73 * 7
Total Prolia® 472 * 203 * 33
Total XGEVA®/Prolia® $ 1,220 * $ 554 * $ 41
* Change in excess of 100%
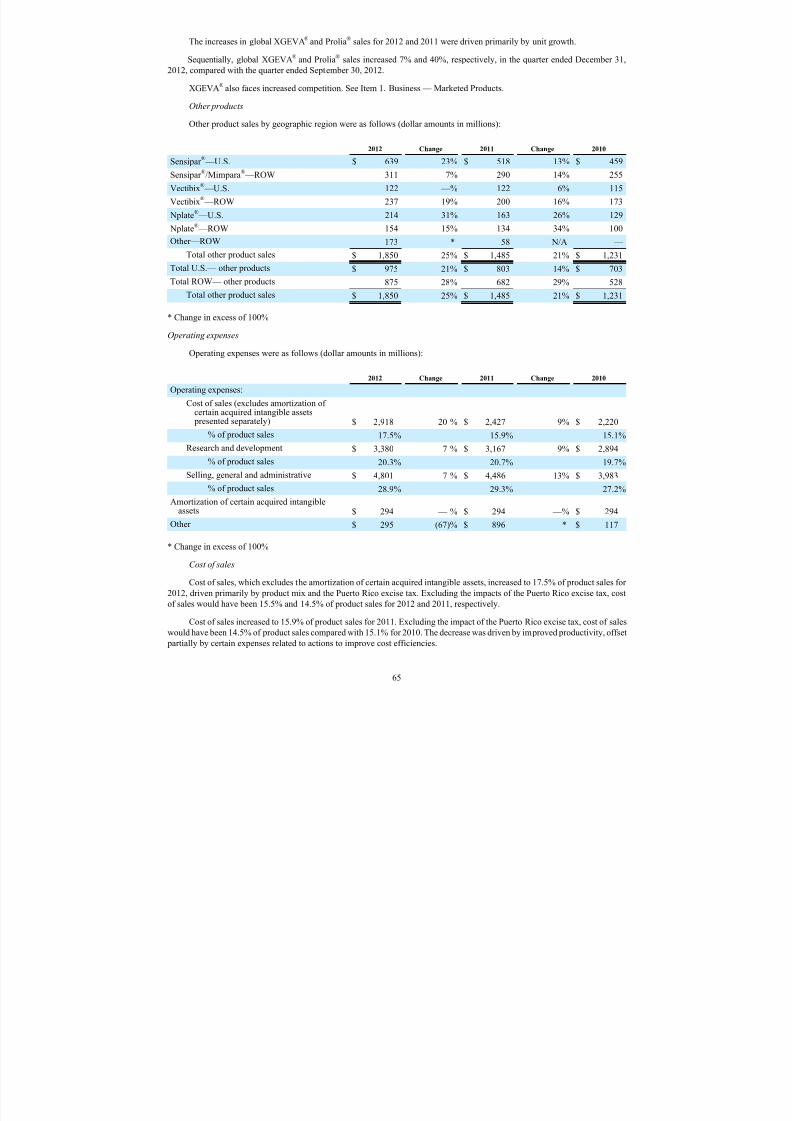
7/27/2019 Amgen Inc 2012 Annual Report
http://slidepdf.com/reader/full/amgen-inc-2012-annual-report 72/150
65
The increases in global XGEVA® and Prolia® sales for 2012 and 2011 were driven primarily by unit growth.
Sequentially, global XGEVA® and Prolia® sales increased 7% and 40%, respectively, in the quarter ended December 31,
2012, compared with the quarter ended September 30, 2012.
XGEVA® also faces increased competition. See Item 1. Business — Marketed Products.
Other products
Other product sales by geographic region were as follows (dollar amounts in millions):
2012 Change 2011 Change 2010
Sensipar ® —U.S. $ 639 23% $ 518 13% $ 459
Sensipar ®/Mimpara® —ROW 311 7% 290 14% 255
Vectibix® —U.S. 122 —% 122 6% 115
Vectibix® —ROW 237 19% 200 16% 173
Nplate® —U.S. 214 31% 163 26% 129
Nplate® —ROW 154 15% 134 34% 100
Other—ROW 173 * 58 N/A —
Total other product sales $ 1,850 25% $ 1,485 21% $ 1,231
Total U.S.— other products$ 975 21% $ 803 14% $ 703
Total ROW— other products 875 28% 682 29% 528
Total other product sales $ 1,850 25% $ 1,485 21% $ 1,231
* Change in excess of 100%
Operating expenses
Operating expenses were as follows (dollar amounts in millions):
2012 Change 2011 Change 2010
Operating expenses:
Cost of sales (excludes amortization of
certainacquired intangible assets presented separately) $ 2,918 20 % $ 2,427 9% $ 2,220
% of product sales 17.5% 15.9% 15.1%
Research and development $ 3,380 7 % $ 3,167 9% $ 2,894
% of product sales 20.3% 20.7% 19.7%
Selling, general and administrative $ 4,801 7 % $ 4,486 13% $ 3,983
% of product sales 28.9% 29.3% 27.2%
Amortization of certain acquired intangibleassets $ 294 — % $ 294 —% $ 294
Other $ 295 (67)% $ 896 * $ 117
* Change in excess of 100%
Cost of sales
Cost of sales, which excludes the amortization of certain acquired intangible assets, increased to 17.5% of product sales for
2012, driven primarily by product mix and the Puerto Rico excise tax. Excluding the impacts of the Puerto Rico excise tax, cost
of sales would have been 15.5% and 14.5% of product sales for 2012 and 2011, respectively.
Cost of sales increased to 15.9% of product sales for 2011. Excluding the impact of the Puerto Rico excise tax, cost of sales
would have been 14.5% of product sales compared with 15.1% for 2010. The decrease was driven by improved productivity, offset
partially by certain expenses related to actions to improve cost efficiencies.
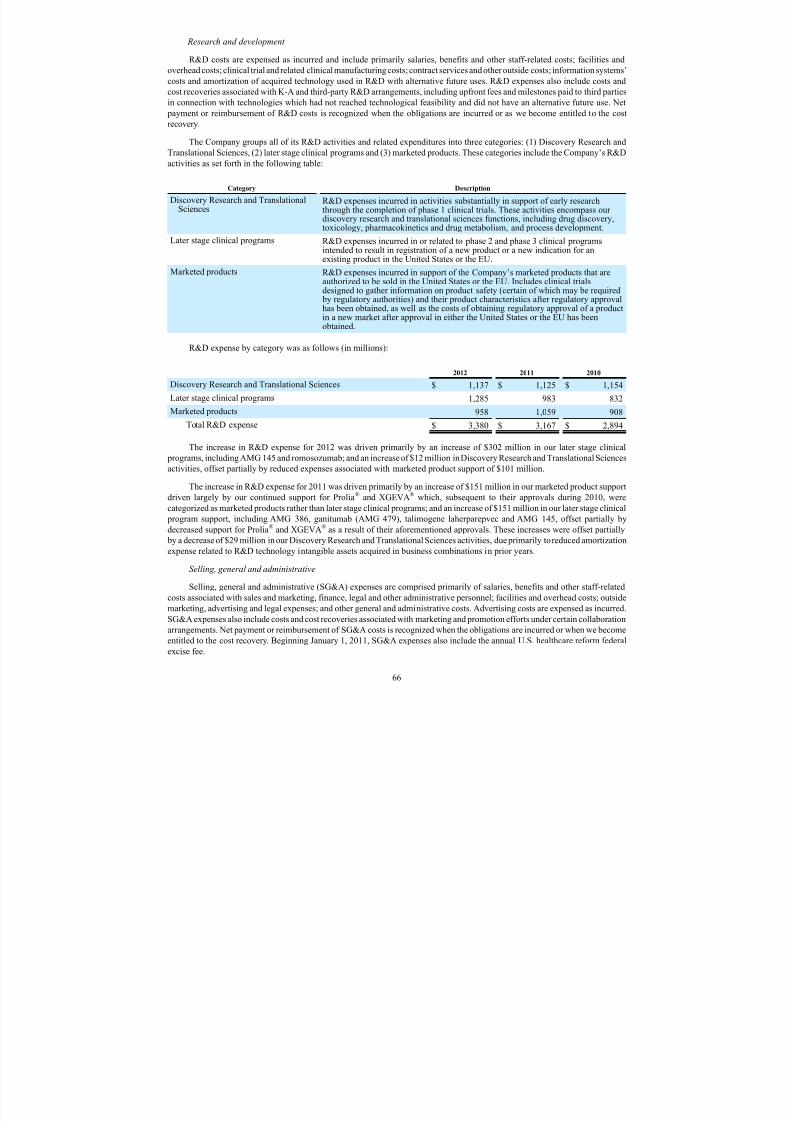
7/27/2019 Amgen Inc 2012 Annual Report
http://slidepdf.com/reader/full/amgen-inc-2012-annual-report 73/150
66
Research and development
R&D costs are expensed as incurred and include primarily salaries, benefits and other staff-related costs; facilities and
overhead costs; clinical trial and related clinical manufacturing costs; contract services and other outside costs; information systems’
costs and amortization of acquired technology used in R&D with alternative future uses. R&D expenses also include costs and
cost recoveries associated with K-A and third-party R&D arrangements, including upfront fees and milestones paid to third parties
in connection with technologies which had not reached technological feasibility and did not have an alternative future use. Net
payment or reimbursement of R&D costs is recognized when the obligations are incurred or as we become entitled to the cost
recovery.
The Company groups all of its R&D activities and related expenditures into three categories: (1)Discovery Research and
Translational Sciences, (2)later stage clinical programs and (3)marketed products. These categories include the Company’s R&D
activities as set forth in the following table:
Category Description
Discovery Research and TranslationalSciences
R&D expenses incurred in activities substantially in support of early researchthrough the completion of phase 1 clinical trials. These activities encompass our discovery research and translational sciences functions, including drug discovery,toxicology, pharmacokinetics and drug metabolism, and process development.
Later stage clinical programs R&D expenses incurred in or related to phase 2 and phase 3 clinical programsintended to result in registration of a new product or a new indication for anexisting product in the United States or the EU.
Marketed products R&D expenses incurred in support of the Company’s marketed products that areauthorized to be sold in the United States or the EU. Includes clinical trialsdesigned to gather information on product safety (certain of which may be required by regulatory authorities) and their product characteristics after regulatory approvalhas been obtained, as well as the costs of obtaining regulatory approval of a productin a new market after approval in either the United States or the EU has beenobtained.
R&D expense by category was as follows (in millions):
2012 2011 2010
Discovery Research and Translational Sciences $ 1,137 $ 1,125 $ 1,154
Later stage clinical programs 1,285 983 832
Marketed products 958 1,059 908
Total R&D expense $ 3,380 $ 3,167 $ 2,894
The increase in R&D expense for 2012 was driven primarily by an increase of $302 million in our later stage clinical
programs, including AMG 145 and romosozumab; and an increase of $12 million in Discovery Research and Translational Sciences
activities, offset partially by reduced expenses associated with marketed product support of $101 million.
The increase in R&D expense for 2011 was driven primarily by an increase of $151 million in our marketed product support
driven largely by our continued support for Prolia® and XGEVA® which, subsequent to their approvals during 2010, were
categorized as marketed products rather than later stage clinical programs; and an increase of $151 million in our later stage clinical
program support, including AMG 386, ganitumab (AMG 479), talimogene laherparepvec and AMG 145, offset partially by
decreased support for Prolia® and XGEVA® as a result of their aforementioned approvals. These increases were offset partially
by a decrease of $29 million in our Discovery Research and Translational Sciences activities, due primarily to reduced amortization
expense related to R&D technology intangible assets acquired in business combinations in prior years.
Selling, general and administrative
Selling, general and administrative (SG&A) expenses are comprised primarily of salaries, benefits and other staff-related
costs associated with sales and marketing, finance, legal and other administrative personnel; facilities and overhead costs; outside
marketing, advertising and legal expenses; and other general and administrative costs. Advertising costs are expensed as incurred.
SG&A expenses also include costs and cost recoveries associated with marketing and promotion efforts under certain collaboration
arrangements. Net payment or reimbursement of SG&A costs is recognized when the obligations are incurred or when we become
entitled to the cost recovery. Beginning January1, 2011, SG&A expenses also include the annual U.S. healthcare reform federal
excise fee.

7/27/2019 Amgen Inc 2012 Annual Report
http://slidepdf.com/reader/full/amgen-inc-2012-annual-report 74/150
67
The increase in SG&A expense for 2012 was driven primarily by higher ENBREL profit share expenses of $207 million as
well as international expansion of $87 million, offset partially by lower U.S. healthcare reform federal excise fee expense of $106
million in 2012 compared with 2011, which includes a $61 million favorable adjustment related to the 2011 fee.
The increase in SG&A expense for 2011 was driven primarily by the U.S. healthcare reform estimated federal excise fee of
$151 million; higher ENBREL profit share expense of $104 million; increased expenses related to the launches of Prolia® and
XGEVA® and expansion of our international operations of $89 million; and the unfavorable impact of foreign exchange of $67
million.
For the years ended December31, 2012, 2011 and 2010, the expenses associated with the ENBREL profit share were $1,495
million, $1,288 million and $1,184 million, respectively.
Other
Other operating expenses for 2012 included certain charges related to our cost savings initiatives of $175 million, which
includes severance and expenses associated with abandoning leased facilities, legal proceedings charges of $64 million and other
operating expenses of $56 million, which includes adjustments to our estimated contingent consideration liability related to a
prior-year business combination.
Other operating expenses for 2011 included primarily a legal settlement charge of $780 million and certain charges related
to cost savings initiatives, primarily severance, of $109 million.
In 2010, we recorded a $118 million asset impairment charge for our manufacturing operations located in Fremont, California,
associated with our efforts to optimize our network of manufacturing facilities and improve cost efficiencies.
See Note 18, Contingencies and commitments, to the Consolidated Financial Statements for further discussion of our 2011
legal settlement.
Non-operating expenses/income and provision for income taxes
Non-operating expenses/income and provisions for income taxes were as follows (dollar amounts in millions):
2012 2011 2010
Interest expense, net $ 1,053 $ 610 $ 604
Interest and other income, net $ 485 $ 448 $ 376
Provisions for income taxes $ 664 $ 467 $ 690
Effective tax rate 13.3% 11.3% 13.0%
Interest expense, net
Included in interest expense, net, for the years ended December31, 2012, 2011 and 2010, is the impact of non-cash interest
expense of $140 million, $143 million and $266 million, respectively, on our convertible debt. The increase of interest expense
in 2012 was due primarily to a higher average debt balance.
Interest and other income, net
The increase in interest and other income, net, for 2012 was due primarily to higher interest income due to a higher average
balance of cash, cash equivalents and marketable securities offset partially by lower yields and lower net gains realized on
investments.
The increase in interest and other income, net, for 2011 was due primarily to higher net realized gains on sales of investments.
Income taxes
The increase in our effective tax rate for 2012 was due primarily to the unfavorable tax impact of changes in the jurisdictional
mix of income and expenses and the exclusion of the federal R&D tax credit in 2012, offset partially by the favorable resolution
of certain state tax matters related to prior years. Because the ATRA of 2012 was not enacted until 2013, certain provisions of the
Act which will retroactively benefit the Company's 2012 federal taxes, including the reinstatement of the R&D tax credit for 2012,
cannot be recognized in the Company's 2012 financial results and instead will be reflected in the company's 2013 financial results
for the first quarter. The tax benefit of the retroactive reinstatement of the 2012 R&D tax credit that will be recognized in the first
quarter of 2013 is approximately $65 million. Subsequent to December 31, 2012, we also settled the examination of our U.S. tax
returns with the Internal Revenue Service relating to years ended December 31, 2007, 2008, and 2009. We will recognize the tax

7/27/2019 Amgen Inc 2012 Annual Report
http://slidepdf.com/reader/full/amgen-inc-2012-annual-report 75/150
68
impact of this settlement in the first quarter of 2013. We expect the settlement to result in a tax benefit of approximately $185
million.
The decrease in our effective tax rate for 2011 was due primarily to the foreign tax credits associated with the Puerto Rico
excise tax described below offset partially by the effect of the non-deductible U.S. healthcare reform federal excise fee in 2011,
the non-deductible portion of the legal settlement reached in principle in 2011 and the favorable resolution in 2010 of certain prior
years' non-routine transfer pricing matters with tax authorities.
Commencing January1, 2011, Puerto Rico imposes a temporary excise tax on the purchase of goods and services from a
related manufacturer in Puerto Rico. The excise tax is imposed on the gross intercompany purchase price of the goods and services
and is effective for a six-year period beginning in 2011, with the excise tax rate declining in each year (4% in 2011, 3.75% in
2012, 2.75% in 2013, 2.5% in 2014, 2.25% in 2015 and 1% in 2016). In February 2013, the Puerto Rico government proposed an
amendment to the excise tax legislation which, if approved, would increase the excise tax rate to 4% effective July 1, 2013 through
2017. We account for the excise tax as a manufacturing cost that is capitalized in inventory and expensed in cost of sales when
the related products are sold. For U.S. income tax purposes, the excise tax results in foreign tax credits that are generally recognized
in our provision for income taxes in the year in which the excise tax is incurred. The effective tax rates for 2012 and 2011 would
have been approximately 18.7% and 18.0%, respectively, without the impact of the tax credits associated with the Puerto Rico
excise tax.
As permitted under U.S. GAAP, we do not provide for U.S. income taxes on undistributed earnings of our foreign operations
that are intended to be invested indefinitely outside the United States.
See Summary of Critical Accounting Policies—Income taxes and Note 4, Income taxes, to the Consolidated Financial
Statements for further discussion.
Financial Condition, Liquidity and Capital Resources
Selected financial data was as follows as of December 31, 2012 and 2011 (in millions):
2012 2011
Cash, cash equivalents and marketable securities $ 24,061 $ 20,641
Total assets 54,298 48,871
Current portion of long-term debt 2,495 84
Long-term debt 24,034 21,344
Stockholders’ equity 19,060 19,029
The Company intends to continue to return capital to stockholders through share repurchases and the payment of cash
dividends, reflecting our confidence in the future cash flows of our business. The amount we spend, the number of shares repurchased
and the timing of such repurchases will vary based on a number of factors, including the stock price, the availability of financing
on acceptable terms, the amount and timing of dividend payments and blackout periods in which we are restricted from repurchasing
shares; and the manner of purchases may include private block purchases, tender offers, and market transactions. Whether and
when we declare dividends or repurchase stock, the size of any dividend and the amount of stock we repurchase could be affected
by a number of additional factors. (See Item1A. Risk Factors—There can be no assurance that we will continue to declare cash
dividends or repurchase stock). During 2011, we repurchased a total of 144 million shares of our common stock at an aggregate
cost of $8.3 billion. In October 2011, we announced our intent to accelerate our repurchase program and that our Board of Directors
had authorized an increase in our stock repurchase program to $10 billion. Subsequent to this authorization through December
31, 2011, we repurchased 83 million shares of our common stock at an aggregate cost of $5.0 billion. During 2012, we repurchased
62million shares of our common stock at an aggregate cost of $4.7 billion. This brings the total of shares repurchased under this
approved $10 billion authorization to 146 million at a total cost of $9.7 billion at an average cost of $66.37 per share. In December 2012, the Board of Directors approved an increase in the stock repurchase authorization by $2.0 billion, and as of December31,
2012, $2.3 billion remained available under this stock repurchase program, which is expected to cover our share repurchase activity
into 2014.
In February 2013, our 0.375% 2013 Convertible Notes matured/converted, and accordingly, the $2.5 billion principal amount
was settled in cash. We also elected to pay the note holders who converted their notes $99 million of cash for the excess conversion
value, as allowed by the original terms of the notes, which was offset by the receipt of the same amount of cash from the counterparty
to the related convertible note hedge. See Note 14, Financing arrangements, to the Consolidated Financial Statements for a
discussion of these convertible notes.

7/27/2019 Amgen Inc 2012 Annual Report
http://slidepdf.com/reader/full/amgen-inc-2012-annual-report 76/150
69
In April 2011, the Board of Directors approved a dividend policy related to our common stock and subsequently declared
quarterly cash dividends of $0.28 per share of common stock in July and October 2011, resulting in dividend payments aggregating
$500 million in 2011. In December 2011, the Board of Directors declared a 29% increase in our quarterly cash dividend to $0.36
per share of common stock, resulting in dividend payments aggregating $1.1 billion in 2012. In December 2012, the Board of
Directors declared a 31% increase in our quarterly cash dividend to $0.47 per share of common stock, payable in March 2013.
We believe that existing funds, cash generated from operations and existing sources of and access to financing are adequate
to satisfy our needs for working capital; capital expenditure and debt service requirements; our plans to pay dividends and repurchase
stock; and other business initiatives we plan to strategically pursue, including acquisitions and licensing activities, in each case
for the foreseeable future. We anticipate that our liquidity needs can be met through a variety of sources, including cash provided by operating activities, sales of marketable securities, borrowings through commercial paper and/or our syndicated credit facility
and access to other domestic and foreign debt markets and equity markets. With respect to our U.S. operations, we believe that
existing funds intended for use in the United States; cash generated from our U.S. operations, including intercompany payments
and receipts; and existing sources of and access to financing (collectively referred to as “U.S. funds”) are adequate to continue to
meet our U.S. obligations (including our plans to repurchase stock and pay dividends with U.S. funds) for the foreseeable future.
See Item1A. Risk Factors—Global economic conditions may negatively affect us and may magnify certain risks that affect our
business.
A significant portion of our operating cash flows is dependent on the timing of payments from our customers located in the
United States and, to a lesser extent, our customers outside the United States, which include government-owned or -supported
healthcare providers (government healthcare providers). Payments from these government healthcare providers are dependent in
part on the economic stability and creditworthiness of their applicable country.Historically, some payments from a number of
European government healthcare providers have extended beyond the contractual terms of sale, and regional economic uncertaintycontinues. In particular, credit and economic conditions in Southern Europe, particularly in Spain, Italy, Greece and Portugal,
continue to adversely impact the timing of collections of our trade receivables in this region. As of December31, 2012, accounts
receivable in these four countries totaled $400 million, of which $281 million was past due, with the past due receivables primarily
in Italy, Spain and Portugal. Although economic conditions in this region may continue to affect the average length of time it takes
to collect payments, to date we have not incurred any significant losses related to these receivables; and the timing of payments
in these countries has not had nor is it currently expected to have a material adverse impact on our overall operating cash flows.
However, if government funding for healthcare were to become unavailable in these countries or if significant adverse adjustments
to past payment practices were to occur, we might not be able to collect the entire balance of these receivables. We will continue
working closely with these customers, monitoring the economic situation and taking appropriate actions as necessary.
Over the next several years, certain of the existing patents on our principal products will expire. As a result, we expect to
face increasing competition thereafter, including from biosimilars, which may have a material adverse impact on our product sales,
results of operations and liquidity. In the EU, there is already an established regulatory pathway for biosimilars and we are facingincreasing competition from biosimilars. The 2010 U.S. healthcare reform legislation authorized the FDA to approve biosimilars
under a new, abbreviated pathway.(See Item 1. Business — Marketed Products.) In the United States after patent expiration, we
expect to face greater competition than today, including from manufacturers with biosimilars approved in Europe that may seek
to obtain U.S. approval. We have many opportunities to grow our business, including the continued commercialization of XGEVA®
and Prolia® and expansion into emerging markets and Japan, which we believe may offset the adverse financial impact of our
principal products' patent expiries.
Cash, cash equivalents and marketable securities
Of our total cash, cash equivalents and marketable securities balances as of December31, 2012, approximately $18.9 billion
was generated from operations in foreign tax jurisdictions and is intended to be invested indefinitely outside the United States.
Under current tax laws, if these funds were repatriated for use in our U.S. operations, we would be required to pay additional
income taxes at the tax rates then in effect.
The primary objective of our investment portfolio is to enhance overall returns in an efficient manner while maintaining
safety of principal, prudent levels of liquidity and acceptable levels of risk. Our investment policy limits debt security investments
to certain types of debt and money market instruments issued by institutions with primarily investment grade credit ratings and
places restrictions on maturities and concentration by asset class and issuer.
Financing arrangements
The current and noncurrent portions of our long-term borrowings at December31, 2012, were $2.5 billion and $24.0 billion,
respectively. The current and noncurrent portions of our long-term borrowings at December31, 2011, were $84 million and $21.3
billion, respectively.

7/27/2019 Amgen Inc 2012 Annual Report
http://slidepdf.com/reader/full/amgen-inc-2012-annual-report 77/150
70
We issued debt securities in various offerings during the three years ended December31, 2012, including $5.0 billion, $10.5
billion and $2.5 billion aggregate principal amounts of notes in 2012, 2011 and 2010, respectively.
In 2012, we repaid $123 million of debt, including the redemption of all of our outstanding zero-coupon convertible notes
due in 2032 and debt assumed in the acquisition of MN and deCODE Genetics. In February 2011, our 0.125% 2011 Convertible
Notes became due, and we repaid the $2.5 billion aggregate principal amount. No debt was due or repaid in 2010.
To achieve a desired mix of fixed and floating interest rate debt, we entered into interest rate swap contracts that effectively
converted a fixed-rate interest coupon for certain of our debt issuances to a floating London Interbank Offered Rates (LIBOR)-
based coupon over the life of the respective note. These interest rate swap contracts qualified and were designated as fair value
hedges. As of December 31, 2011, we had interest rate swap contracts on debt with an aggregate face value of $3.6 billion, which,
due to historically low interest rates, were terminated in May 2012. See Note 14, Financing arrangements, and Note 17, Derivative
instruments, to the Consolidated Financial Statements for further discussion of our interest rate swap contracts.
To hedge our exposure to foreign currency exchange rate risk associated with certain of our long-term notes denominated
in foreign currencies, we entered into cross-currency swap contracts, which effectively convert the interest payments and principal
repayment of the respective notes from euros/pounds sterling to U.S. dollars. These cross-currency swap contracts qualify and are
designated as cash flow hedges. As of December 31, 2012 and 2011, we had cross-currency swap contracts with aggregate notional
amounts of $2.7 billion and $748 million, respectively. See Note 17, Derivative instruments, to the Consolidated Financial
Statements for further discussion of our cross-currency swap contracts.
As of December31, 2012, we have a commercial paper program that allows us to issue up to $2.5 billion of unsecured
commercial paper to fund our working capital needs. At December 31, 2012 and 2011, we had no amounts outstanding under our
commercial paper program.
In December 2011, we entered into a $2.5 billion syndicated, unsecured, revolving credit agreement which is available for
general corporate purposes or as a liquidity backstop to our commercial paper program. The commitments under the revolving
credit agreement may be increased by up to $500 million with the agreement of the banks. Each bank which is a party to the
agreement has an initial commitment term of five years. This term may be extended for up to two additional one-year periods with
the agreement of the banks. Annual commitment fees for this agreement are 0.1% based on our current credit rating. Generally,
we would be charged interest at LIBOR plus 0.9% for any amounts borrowed under this facility. As of December 31, 2012 and
2011, no amounts were outstanding under this facility.
In March 2011, we filed a shelf registration statement with the SEC to replace an existing shelf registration statement that
was scheduled to expire in April 2011. This shelf registration statement allows us to issue unspecified amounts of debt securities;
common stock; preferred stock; warrants to purchase debt securities, common stock, preferred stock or depository shares; rights
to purchase common stock or preferred stock; securities purchase contracts; securities purchase units; and depository shares. Under this shelf registration statement, all of the securities available for issuance may be offered from time to time with terms to be
determined at the time of issuance. This shelf registration statement expires in March 2014.
In 1997, we established a $400 million medium-term note program under which medium-term debt securities may be offered
from time to time with terms to be determined at the time of issuance. As of December 31, 2012 and 2011, no securities were
outstanding under this medium-term note program.
Certain of our financing arrangements contain non-financial covenants. In addition, our revolving credit agreement includes
a financial covenant with respect to the level of our borrowings in relation to our equity, as defined. We were in compliance with
all applicable covenants under these arrangements as of December31, 2012.
See Note 14, Financing arrangements, to the Consolidated Financial Statements for further discussion of our financing
arrangements.
Cash flows
Our cash flow activity was as follows (in millions):
2012 2011 2010
Net cash provided by operating activities $ 5,882 $ 5,119 $ 5,787
Net cash used in investing activities (9,990) (786) (4,152)
Net cash provided by (used in) financing activities 419 (674) (1,232)

7/27/2019 Amgen Inc 2012 Annual Report
http://slidepdf.com/reader/full/amgen-inc-2012-annual-report 78/150
71
Operating
Cash provided by operating activities has been and is expected to continue to be our primary recurring source of funds. Cash
provided by operating activities increased during 2012 due primarily to the timing and amount of receipts from customers, an
increase in net income, timing of payments to vendors and taxing authorities, cash received in connection with the termination of
our interest rate swap agreements of $397 million and the impact of decreased inventory-related expenditures. These increases
were offset partially by a payment associated with the previously disclosed litigation settlement. Cash provided by operating
activities during 2011 decreased due primarily to increased interest payments, working capital increases related to the launch of
Prolia® and XGEVA® and the prepayment of certain royalties.
Investing
Capital expenditures, which were associated primarily with manufacturing capacity expansions in Ireland and Puerto Rico,
as well as other site developments, totaled $689 million, $567 million and $580 million in 2012, 2011 and 2010, respectively. We
currently estimate 2013 spending on capital projects and equipment to be approximately $700 million.
Cash used in investing activities during the years ended December31, 2012 and 2011, also included the cost of acquiring
certain businesses, net of cash acquired, which totaled $2.4 billion and $701 million, respectively.
Net purchases of marketable securities were $6.9 billion for 2012, compared to net proceeds of $437 million for 2011 and
net purchases of $3.5 billion for 2010.
Financing
Cash provided by financing activities during 2012 was due to net proceeds from the issuance of long-term debt of $4.9 billion and net proceeds from the issuance of common stock in connection with the Company's equity award programs of $1.3
billion, offset partially by repurchases of our common stock of $4.6 billion and the payment of dividends of $1.1 billion. Cash
used in financing activities during 2011 was due to the repurchases of our common stock of $8.3 billion, including $5 billion
purchased in a modified Dutch auction tender offer in December 2011; repayment of long-term debt of $2.5 billion; and payment
of dividends of $500 million, offset partially by net proceeds from the issuance of long-term debt of $10.4 billion, including $7.5
billion issued in November and December 2011, in part, to finance the repurchase of our common stock in the modified Dutch
auction tender offer. Cash used in financing activities during 2010 was due to the repurchases of our common stock of $3.8 billion,
offset partially by the net proceeds from issuance of long-term debt of $2.5 billion.
See Note 14, Financing arrangements, and Note 15, Stockholders’ equity, to the Consolidated Financial Statements for
further discussion.
Off-Balance Sheet Arrangements
We do not have any off-balance sheet arrangements that are material or reasonably likely to become material to our
consolidated financial position or consolidated results of operations.
Contractual Obligations
Contractual obligations represent future cash commitments and liabilities under agreements with third parties, and exclude
contingent liabilities for which we cannot reasonably predict future payment. Additionally, the expected timing of payment of the
obligations presented below is estimated based on current information. Timing of payments and actual amounts paid may be
different depending on the timing of receipt of goods or services or changes to agreed-upon terms or amounts for some obligations.
The following table represents our contractual obligations as of December31, 2012, aggregated by type (in millions):
Payments due by period Year Years Years Years
Contractual obligations Total 1 2 and 3 4 and 5 6andbeyond
Long-term debt obligations (1)(2) $ 44,885 $ 3,601 $ 4,114 $ 6,048 $ 31,122
Operating lease obligations 741 121 187 146 287
Purchase obligations (3) 2,921 832 681 393 1,015
Unrecognized tax benefits (UTBs) (4) — — — — —
Total contractual obligations $ 48,547 $ 4,554 $ 4,982 $ 6,587 $ 32,424

7/27/2019 Amgen Inc 2012 Annual Report
http://slidepdf.com/reader/full/amgen-inc-2012-annual-report 79/150
72
(1) Long-term debt obligations include contractual interest payments and principal repayment of our debt obligations. In order
to hedge our exposure to foreign currency exchange rate risk associated with certain of our pound sterling and euro
denominated long-term debt issued in 2012 and 2011, we entered into cross-currency swap contracts that effectively convert
interest payments and principal repayment on this debt from pounds sterling/euros to U.S. dollars. For purposes of this table,
we used the contracted exchange rates in the cross-currency swap contracts to compute the net amounts of future interest
payments and principal repayments on this debt. See Note 17, Derivative instruments, to the Consolidated Financial
Statements for further discussion of our cross-currency swap contracts.
(2) Interest payments and the repayment of principal on our 4.375% 2018 euro Notes were translated into U.S. dollars at the
foreign currency exchange rate in effect at December31, 2012. See Note 14, Financing arrangements, to the ConsolidatedFinancial Statements for further discussion of our long-term debt obligations.
(3) Purchase obligations relate primarily to (i)our long-term supply agreements with third-party manufacturers, which are based
on firm commitments for the purchase of production capacity; (ii)R&D commitments (including those related to clinical
trials) for new and existing products; (iii)capital expenditures; and (iv)open purchase orders for the acquisition of goods
and services in the ordinary course of business. Our obligation to pay certain of these amounts may be reduced based on
certain future events.
(4) Liabilities for UTBs (net of foreign tax credits and federal tax benefit of state taxes) and related accrued interest and penalties
totaling approximately $1.1 billion at December31, 2012, are not included in the table above because, due to their nature,
there is a high degree of uncertainty regarding the timing of future cash outflows and other events that extinguish these
liabilities.
In addition to amounts in the table above, we are contractually obligated to pay additional amounts, which in the aggregateare significant, upon the achievement of various development, regulatory and commercial milestones for agreements we have
entered into with third parties, including contingent consideration incurred with the acquisition of BioVex Group, Inc. (BioVex).
These payments are contingent upon the occurrence of various future events, substantially all of which have a high degree of
uncertainty of occurring. These contingent payments have not been included in the table above, and, except with respect to the
fair value of the BioVex contingent consideration, are not recorded on our Consolidated Balance Sheets. As of December31, 2012,
the maximum amount that may be payable in the future for agreements we have entered into with third parties is approximately
$2.5 billion, including $575 million in connection with the acquisition of BioVex. See Note 2, Business combinations, to the
Consolidated Financial Statements.
Summary of Critical Accounting Policies
The preparation of our consolidated financial statements in conformity with U.S. GAAP requires management to make
estimates and assumptions that affect the amounts reported in the financial statements and the notes to the financial statements.Some of those judgments can be subjective and complex, and therefore, actual results could differ materially from those estimates
under different assumptions or conditions.
Product sales and sales deductions
Revenues from sales of our products are recognized when the products are shipped and title and risk of loss have passed.
Product sales are recorded net of accruals for estimated rebates, wholesaler chargebacks, cash discounts and other deductions
(collectively, “sales deductions”) and returns, which are established at the time of sale.

7/27/2019 Amgen Inc 2012 Annual Report
http://slidepdf.com/reader/full/amgen-inc-2012-annual-report 80/150
73
We analyze the adequacy of our accruals for sales deductions quarterly. Amounts accrued for sales deductions are adjusted
when trends or significant events indicate that adjustment is appropriate. Accruals are also adjusted to reflect actual results. Amounts
recorded in Accrued liabilities in the Consolidated Balance Sheets for sales deductions were as follows (in millions):
Rebates Chargebacks Otherdeductions Total
Balance as of January1, 2010 $ 707 $ 128 $ 135 $ 970
Amounts charged against product sales 1,861 2,593 580 5,034
Payments (1,724) (2,548) (588) (4,860)
Balance as of December31, 2010 844 173 127 1,144
Amounts charged against product sales 1,795 2,626 670 5,091
Payments (1,592) (2,600) (717) (4,909)
Balance as of December31, 2011 1,047 199 80 1,326
Amounts charged against product sales 1,480 2,709 659 4,848
Payments (1,680) (2,741) (624) (5,045)
Balance as of December31, 2012 $ 847 $ 167 $ 115 $ 1,129
For the years ended December31, 2012, 2011 and 2010, total sales deductions were 23%, 25% and 25% of gross product
sales, respectively. Included in these amounts are immaterial adjustments related to prior-year sales due to changes in estimates.
Such amounts represent 3% or less of the aggregate sales deductions charged against product sales in each of the three years ended
December31, 2012.
In the United States, we utilize wholesalers as the principal means of distributing our products to healthcare providers, such
as physicians or their clinics, dialysis centers, hospitals and pharmacies. Products we sell in the EU are distributed principally to
hospitals and/or wholesalers depending on the distribution practice in each country where the product is sold. We monitor the
inventory levels of our products at our wholesalers by using data from our wholesalers and other third parties, and we believe
wholesaler inventories have been maintained at appropriate levels (generally two to three weeks) given end-user demand.
Accordingly, historical fluctuations in wholesaler inventory levels have not significantly impacted our method of estimating sales
deductions and returns.
Accruals for sales deductions are based primarily on estimates of the amounts earned or to be claimed on the related sales.
These estimates take into consideration current contractual and statutory requirements, specific known market events and trends,
internal and external historical data and forecasted customer buying patterns. Sales deductions are substantially product-specific
and, therefore, for any given year, can be impacted by the mix of products sold.
Rebates include primarily amounts paid to payers and providers in the United States, including those paid to state Medicaid
programs, and are based on contractual arrangements or statutory requirements which vary by product, by payer and individual
payer plans. We estimate the amount of rebate that will be paid based on the product sold, contractual terms, historical experience
and wholesaler inventory levels and accrue these rebates in the period the related sale is recorded. Additionally, for Medicaid
rebates, we consider the estimated patient population and the amount of unbilled managed Medicaid claims. We adjust the rebate
accruals as more information becomes available and to reflect actual experience. Estimating such rebates is complicated, in part,
due to the time delay between the date of sale and the actual settlement of the liability, which for certain rebates can take up to
one year and more than one year for certain government programs. Rebate accruals totaled $1.5 billion, $1.8 billion and $1.9
billion for the years ended December31, 2012, 2011 and 2010, respectively. We believe the methodology we use to accrue for
rebates is reasonable and appropriate given current facts and circumstances. However, actual results may differ. Changes in annual
estimates related to prior annual periods were less than 10% of the estimated rebate amounts charged against product sales for the
year ended December31, 2012, and less than 5% for the years ended December 31, 2011 and 2010. A 10% change in our rebateestimate attributable to rebates recognized in 2012 would have had an impact of approximately $150 million, or approximately
1% of our 2012 product sales and a corresponding impact on our financial condition and liquidity.
Wholesaler chargebacks relate to our contractual agreements to sell products to healthcare providers in the United States at
fixed prices that are lower than the prices we charge wholesalers. When healthcare providers purchase our products through
wholesalers at these reduced prices, wholesalers charge us for the difference between their purchase price and the contractual price
between Amgen and the healthcare providers. The provision for chargebacks is based on the expected sales by our wholesaler
customers to healthcare providers. Those chargebacks from wholesalers totaled $2.7 billion, $2.6 billion and $2.6 billion for the
years ended December31, 2012, 2011 and 2010, respectively. Accruals for wholesaler chargebacks are less difficult to estimate
than rebates and closely approximate actual results since chargeback amounts are fixed at the date of purchase by the healthcare
providers, and we generally settle the liability for these deductions within a few weeks.

7/27/2019 Amgen Inc 2012 Annual Report
http://slidepdf.com/reader/full/amgen-inc-2012-annual-report 81/150
74
Product returns
Returns are estimated through comparison of historical return data to their related sales on a production lot basis. Historical
rates of return are determined for each product and are adjusted for known or expected changes in the marketplace specific to each
product, when appropriate. Historically, sales return provisions have amounted to less than 1.5% of gross product sales. Changes
in estimates for prior year sales return provisions have historically been insignificant.
Income taxes
The Company provides for income taxes based on pretax income, applicable tax rates and tax planning opportunities available
in the various jurisdictions in which it operates.
We recognize the tax benefit from an uncertain tax position only if it is more likely than not that the tax position will be
sustained on examination by the taxing authorities based on the technical merits of the position. The tax benefits recognized in
the financial statements on a particular tax position are measured based on the largest benefit that is more likely than not to be
realized. The amount of UTBs is adjusted as appropriate for changes in facts and circumstances, such as significant amendments
to existing tax law, new regulations or interpretations by the taxing authorities, new information obtained during a tax examination,
or resolution of an examination. We believe our estimates for uncertain tax positions are appropriate and sufficient for any
assessments that may result from examinations of our tax returns. We recognize both accrued interest and penalties, where
appropriate, related to UTBs in income tax expense.
Certain items are included in the Company's tax return at different times than they are reflected in the financial statements
and cause temporary differences between the tax basis of assets and liabilities and their reported amount. Such temporary differences
create deferred tax assets and liabilities. Deferred tax assets are generally items that can be used as a tax deduction or credit in thetax return in future years but for which the Company has already recorded the tax benefit in the financial statements. The Company
establishes valuation allowances against its deferred tax assets when the amount of expected future taxable income is not likely
to support the use of the deduction or credit. Deferred tax liabilities are either: (i)tax expenses recognized in the financial statements
for which payment has been deferred; (ii)expenses for which the Company has already taken a deduction on the tax return, but
has not yet recognized the expense in the financial statements; or (iii) liabilities for the difference between the book basis and tax
basis of the intangible assets acquired in many business combinations, as future expenses associated with these assets most often
will not be tax deductible.
The Company is a vertically integrated enterprise with operations in the U.S. and various foreign jurisdictions. The Company
is subject to income tax in the foreign jurisdictions where it conducts activities based on the tax laws and principles of such
jurisdictions and the functions, risks and activities performed therein. The Company’s pretax income is therefore attributed to
domestic or foreign sources based on the operations performed in each location and the tax laws and principles of the respective
taxing jurisdictions. For example, the Company conducts significant operations outside the United States in Puerto Rico pertainingto manufacturing, distribution and other related functions to meet its worldwide product demand. Income from the Company’s
operations in Puerto Rico is subject to a tax incentive grant that expires in 2020.
Our effective tax rate reflects the impact of undistributed foreign earnings for which no U.S. income taxes or foreign
withholding taxes have been provided because such earnings are intended to be invested indefinitely outside the United States.
Substantially all of this benefit is attributable to the Company’s foreign income associated with the Company’s operations conducted
in Puerto Rico.
If future events, including material changes in cash, working capital and long-term investment requirements necessitate that
certain assets associated with these earnings be repatriated to the United States, under current tax laws an additional tax provision
and related liability would be required at the applicable income tax rates which could have a material adverse effect on both our
future effective tax rate and our financial results.
Our operations are subject to the tax laws, regulations and administrative practices of the United States, U.S. state jurisdictionsand other countries in which we do business. Significant changes in these rules could have a material adverse effect on the
Company's results of operations. See Item1A. Risk Factors— The adoption of new tax legislation or exposure to additional tax
liabilities could affect our profitability.
Contingencies
In the ordinary course of business, we are involved in various legal proceedings and other matters such as intellectual property
disputes, contractual disputes, governmental investigations and class action suits which are complex in nature and have outcomes
that are difficult to predict. Certain of these proceedings are discussed in Note 18, Contingencies and commitments, to the
Consolidated Financial Statements. We record accruals for loss contingencies to the extent that we conclude that it is probable

7/27/2019 Amgen Inc 2012 Annual Report
http://slidepdf.com/reader/full/amgen-inc-2012-annual-report 82/150
75
that a liability has been incurred and the amount of the related loss can be reasonably estimated. We consider all relevant factors
when making assessments regarding these contingencies.
While it is not possible to accurately predict or determine the eventual outcomes of these items, an adverse determination
in one or more of these items currently pending could have a material adverse effect on our consolidated results of operations,
financial position or cash flows.
Valuation of assets and liabilities in connection with business combinations
We have acquired and continue to acquire intangible assets in connection with business combinations. These intangible
assets consist primarily of technology associated with currently marketed human therapeutic products and IPR&D productcandidates. Discounted cash flow models are typically used to determine the fair values of these intangible assets for purposes of
allocating consideration paid to the net assets acquired in a business combination. These models require the use of significant
estimates and assumptions, including, but not limited to:
• determining the timing and expected costs to complete in-process projects taking into account the stage of completion
at the acquisition date;
• projecting the probability and timing of obtaining marketing approval from the FDA and other regulatory agencies for
product candidates;
• estimating the timing of and future net cash flows from product sales resulting from completed products and in-process
projects; and
• developing appropriate discount rates to calculate the present values of the cash flows.
Significant estimates and assumptions are also required to determine the acquisition date fair values of any contingent
consideration obligations incurred in connection with business combinations. In addition, we must revalue these obligations each
subsequent reporting period until the related contingencies are resolved and record changes in their fair values in earnings. The
acquisition date fair values of the various contingent consideration obligations incurred in the acquisition of BioVex (see Note 2,
Business combinations, to the Consolidated Financial Statements) were determined using a combination of valuation techniques.
Significant estimates and assumptions required for these valuations included, but were not limited to, the probability of achieving
regulatory milestones, product sales projections under various scenarios and discount rates used to calculate the present value of
the required payments. These estimates and assumptions are required to be updated in order to revalue these contingent consideration
obligations each reporting period. Accordingly, subsequent changes in underlying facts and circumstances could result in changes
in these estimates and assumptions, which could have a material impact on the estimated future fair values of these obligations.
We believe the fair values used to record intangible assets acquired and contingent consideration obligations incurred inconnection with business combinations are based upon reasonable estimates and assumptions given the facts and circumstances
as of the related valuation dates.
Impairment of long-lived assets
We review the carrying value of our property, plant and equipment and our finite-lived intangible assets for impairment
whenever events or changes in circumstances indicate that the carrying amount of an asset may not be recoverable. If such
circumstances exist, an estimate of undiscounted future cash flows to be generated by the long-lived asset is compared to the
carrying value to determine whether an impairment exists. If an asset is determined to be impaired, the loss is measured based
on the difference between the asset's fair value and its carrying value.
Indefinite-lived intangible assets, composed primarily of IPR&D projects acquired in a business combination which have
not reached technological feasibility, are reviewed annually for impairment and whenever events or changes in circumstances
indicate that the carrying amount may not be recoverable. We determine impairment by comparing the fair value of the asset toits carrying value. If the asset's carrying value exceeds its fair value, an impairment charge is recorded for the difference and its
carrying value is reduced accordingly.
Estimating future cash flows of an IPR&D product candidate for purposes of an impairment analysis requires us to make
significant estimates and assumptions regarding the amount and timing of costs to complete the project and the amount, timing
and probability of achieving revenues from the completed product similar to how the acquisition date fair value of the project was
determined, as described above. There are often major risks and uncertainties associated with IPR&D projects as we are required
to obtain regulatory approvals in order to be able to market these products. Such approvals require completing clinical trials that
demonstrate a product candidate is safe and effective. Consequently, the eventual realized value of the acquired IPR&D project
may vary from its estimated fair value at the date of acquisition, and IPR&D impairment charges may occur in future periods
which could have a material adverse effect on our results of operations.
7/27/2019 Amgen Inc 2012 Annual Report
http://slidepdf.com/reader/full/amgen-inc-2012-annual-report 83/150
76
We believe our estimations of future cash flows used for assessing impairment of long-lived assets are based on reasonable
assumptions given the facts and circumstances as of the related dates of the assessments.
Item7A. QUANTITATIVE AND QUALITATIVE DISCLOSURES ABOUT MARKET RISK
We are exposed to market risks that may result from changes in interest rates, foreign currency exchange rates and prices
of equity instruments as well as changes in general economic conditions in the countries where we conduct business. To reduce
certain of these risks, we enter into various types of foreign currency and interest rate derivative hedging transactions as part of
our risk management program. We do not use derivatives for speculative trading purposes.
In the capital and credit markets, strong demand for fixed-income instruments led to continued low interest rates on corporate
debt issuances during 2012. Short-term interest rates on U.S. Treasury instruments remained near historical lows due to a
combination of the Federal Reserve’s monetary policies and the challenging macroeconomic environment. As a result, in the
discussion that follows, we have assumed a hypothetical change in interest rates of 100 basis points from those at December31,
2012 and 2011. Continued uncertainty surrounding European sovereign debt resulted in ongoing volatility in the foreign exchange
markets, and we have consequently assumed a hypothetical 20% change in foreign currency exchange rates against the U.S. dollar
based on its position relative to other currencies as of December31, 2012 and 2011.
Interest rate sensitive financial instruments
Our portfolio of available-for-sale interest-bearing securities at December31, 2012 and 2011, was comprised of: U.S.
Treasury securities and other government-related debt securities; corporate debt securities; residential mortgage-backed and other
mortgage- and asset-backed securities; money market mutual funds; and additionally at December31, 2012, other short-term
interest-bearing securities, composed principally of commercial paper. The fair values of our investment portfolio of interest- bearing securities were $23.7 billion and $20.0 billion at December31, 2012 and 2011, respectively. Duration is a sensitivity
measure that can be used to approximate the change in the value of a security that will result from a 100 basis point change in
interest rates. Applying a duration model, a hypothetical 100 basis point increase in interest rates at December31, 2012 and 2011,
would not have resulted in a material effect on the fair values of these securities on these dates. In addition, a hypothetical 100
basis point decrease in interest rates at December31, 2012 and 2011, would not result in a material effect on the related income
or cash flows in the respective ensuing year.
As of December31, 2012, we had outstanding debt with a carrying value of $26.5 billion and a fair value of $29.9 billion.
As of December31, 2011, we had outstanding debt with a carrying value of $21.4 billion and a fair value of $23.0 billion. Our
outstanding debt at December31, 2012 and 2011, was comprised entirely of debt with fixed interest rates. Changes in interest
rates do not affect interest expense or cash flows on fixed-rate debt. Changes in interest rates would, however, affect the fair values
of fixed-rate debt. A hypothetical 100 basis point decrease in interest rates relative to interest rates at December31, 2012, would
have resulted in an increase of approximately $2.6 billion in the aggregate fair value of our outstanding debt on this date. Ahypothetical 100 basis point decrease in interest rates relative to the interest rates at December31, 2011, would have resulted in
an increase of approximately $2.1 billion in the aggregate fair value of our outstanding debt on this date. The analysis for the debt
does not consider the impact that hypothetical changes in interest rates would have on the related interest rate swap contracts,
while outstanding, and cross-currency swap contracts.
To achieve a desired mix of fixed and floating interest rate debt, we entered into interest rate swap contracts, which qualified
and were designated for accounting purposes as fair value hedges, for certain of our fixed-rate debt. These derivative contracts
effectively converted a fixed-rate interest coupon to a floating-rate LIBOR-based coupon over the life of the respective note. Due
to historically low interest rates, we terminated all of these swap contracts in May 2012. Interest rate swap contracts with notional
amounts totaling $3.6 billion were outstanding at December31, 2011. A hypothetical 100 basis point increase in interest rates
relative to interest rates at December31, 2011, would have resulted in a reduction in fair value of approximately $200 million on
our interest rate swap contracts on this date and would not result in a material effect on the related income or cash flows in the
respective ensuing year. The analysis for the interest rate swap contracts does not consider the impact that hypothetical changesin interest rates would have on the related fair values of debt that these interest rate sensitive instruments were designed to offset.
As of December31, 2012 and 2011, we had outstanding cross-currency swap contracts with aggregate notional amounts of
$2.7 billion and $748 million, respectively, that hedge certain of our foreign denominated debt and related interest payments.
These contracts effectively convert interest payments and principal repayment of this debt to U.S. dollars from euros/pounds
sterling and are designated for accounting purposes as cash flow hedges. A hypothetical 100 basis point adverse movement in
interest rates relative to interest rates at December31, 2012, would have resulted in approximately a $400 million reduction in
the fair value of our cross-currency swap contracts on this date but would have no effect on cash flows or income in the ensuing
year. A hypothetical 100 basis point adverse movement in interest rates relative to interest rates at December31, 2011, would have
resulted in approximately a $130 million reduction in the fair value of our cross-currency swap contracts on this date but would
have no effect on cash flows or income in the ensuing year.

7/27/2019 Amgen Inc 2012 Annual Report
http://slidepdf.com/reader/full/amgen-inc-2012-annual-report 84/150
77
Foreign currency sensitive financial instruments
Our international operations are affected by fluctuations in the value of the U.S. dollar as compared to foreign currencies,
predominantly the euro. Increases and decreases in our international product sales from movements in foreign currency exchange
rates are offset partially by the corresponding increases or decreases in our international operating expenses. Increases and decreases
in our foreign currency denominated assets from movements in foreign currency exchange rates are offset partially by the
corresponding increases or decreases in our foreign currency denominated liabilities. To further reduce our net exposure to foreign
currency exchange rate fluctuations on our results of operations, we enter into foreign currency forward, option and cross-currency
swap contracts.
As of December31, 2012, we had outstanding euro and pound sterling denominated debt with a carrying value and fair
value of $3.5 billion and $3.8 billion, respectively. As of December31, 2011, we had outstanding euro and pound sterling
denominated debt with both a carrying value and fair value of $1.5 billion. A hypothetical 20% adverse movement in foreign
currency exchange rates compared with the U.S. dollar relative to exchange rates at December31, 2012, would have resulted in
an increase in fair value of this debt of approximately $760 million on this date and a reduction in income in the ensuing year of
approximately $700 million, but would have no material effect on the related cash flows in the ensuing year. A hypothetical 20%
adverse movement in foreign currency exchange rates compared with the U.S. dollar relative to exchange rates at December31,
2011, would have resulted in an increase in fair value of this debt of approximately $290 million on this date with a corresponding
reduction in income in the ensuing year, but would have no material effect on the related cash flows in the ensuing year. The
analysis for this debt does not consider the offsetting impact that hypothetical changes in foreign currency exchange rates would
have on the related cross-currency swap contracts which are in place for the majority of the foreign currency denominated debt.
With regard to our $2.7 billion notional amount of cross-currency swap contracts that are designated as cash flow hedges
of certain of our debt denominated in euros and pound sterling as of December 31, 2012, a hypothetical 20% adverse movement
in foreign currency exchange rates compared with the U.S. dollar relative to exchange rates on this date, would have resulted in
a reduction in the fair value of these contracts of approximately $710 million on this date, but would have no material effect on
the related cash flows in the ensuing year. The impact on income in the ensuing year from these contracts of this hypothetical
adverse movement in foreign currency exchange rates would be fully offset by the corresponding hypothetical change in the
carrying amount of the related hedged debt. With regard to our $748 million notional amount of cross-currency swap contracts
that are designated as cash flow hedges of certain of our debt denominated in pounds sterling as of December 31, 2011, a hypothetical
20% adverse movement in foreign currency exchange rates compared with the U.S. dollar relative to exchange rates on this date,
would have resulted in a reduction in the fair value of these contracts of approximately $210 million on this date, but would have
no material effect on the related cash flows in the ensuing year. The impact on income in the ensuing year from these contracts of
this hypothetical adverse movement in foreign currency exchange rates would be fully offset by the corresponding hypothetical
change in the carrying amount of the related hedged debt.
We enter into foreign currency forward and options contracts that are designated for accounting purposes as cash flow hedges
of certain anticipated foreign currency transactions. As of December31, 2012, we had open foreign currency forward and options
contracts, primarily euro-based, with notional amounts of $3.7 billion and $200 million, respectively. As of December31, 2011,
we had open foreign currency forward and options contracts, primarily euro-based, with notional amounts of $3.5 billion and $292
million, respectively. As of December31, 2012 and 2011, the net unrealized gains on these contracts were not material. With
regard to foreign currency forward and option contracts that were open at December31, 2012, a hypothetical 20% adverse
movement in foreign currency exchange rates compared with the U.S. dollar relative to exchange rates at December31, 2012,
would have resulted in a reduction in fair value of these contracts of approximately $730 million on this date and, in the ensuing
year, a reduction in income and cash flows of approximately $350 million. With regard to contracts that were open at December31,
2011, a hypothetical 20% adverse movement in foreign currency exchange rates compared with the U.S. dollar relative to exchange
rates at December31, 2011, would have resulted in a reduction in fair value of these contracts of approximately $700 million on
this date and, in the ensuing year, a reduction in income and cash flows of approximately $330 million. The analysis does not
consider the impact that hypothetical changes in foreign currency exchange rates would have on anticipated transactions that theseforeign currency sensitive instruments were designed to offset.
As of December31, 2012 and 2011, we had open foreign currency forward contracts with notional amounts totaling $629
million and $389 million, respectively, that hedged fluctuations of certain assets and liabilities denominated in foreign currencies
but were not designated as hedges for accounting purposes. These contracts had no material net unrealized gains or losses at
December31, 2012 and 2011. With regard to these foreign currency forward contracts that were open at December31, 2012 and
2011, a hypothetical 20% adverse movement in foreign currency exchange rates compared with the U.S. dollar relative to exchange
rates on these dates would not have resulted in a material reduction in the fair value of these contracts on this date and would not
result in a material effect on the related income or cash flows in the respective ensuing year. The analysis does not consider the
impact that hypothetical changes in foreign currency exchange rates would have on assets and liabilities that these foreign currency
sensitive instruments were designed to offset.

7/27/2019 Amgen Inc 2012 Annual Report
http://slidepdf.com/reader/full/amgen-inc-2012-annual-report 85/150
78
Market price sensitive financial instruments
As of December31, 2012 and 2011, we were also exposed to price risk on equity securities included in our portfolio of
investments, which were acquired primarily for the promotion of business and strategic objectives. These investments are generally
in small capitalization stocks in the biotechnology industry sector. Price risk relative to our equity investment portfolio as of
December31, 2012 and 2011, was not material.
Counterparty credit risks
Our financial instruments, including derivatives, are subject to counterparty credit risk which we consider as part of the
overall fair value measurement. Our financial risk management policy limits derivative transactions by requiring transactions to be with institutions with investment grade credit ratings and requires placing exposure limits on the amount with any individual
counterparty. In addition, we have an investment policy that limits investments to certain types of debt and money market instruments
issued by institutions primarily with investment grade credit ratings and places restriction on maturities and concentrations by
asset class and issuer.
Item8. FINANCIAL STATEMENTS AND SUPPLEMENTARY DATA
The information required by this item is incorporated herein by reference to the financial statements and schedule listed in
Item15(a)1 and (a)2 of Part IV and included in this Annual Report on Form 10-K.
Item9. CHANGES IN AND DISAGREEMENTS WITH ACCOUNTANTS ON ACCOUNTING ANDFINANCIAL DISCLOSURES
None.
Item9A. CONTROLS AND PROCEDURES
We maintain “disclosure controls and procedures,” as such term is defined under Exchange Act Rule13a-15(e), that are
designed to ensure that information required to be disclosed in Amgen’s Exchange Act reports is recorded, processed, summarized
and reported within the time periods specified in the SEC’s rules and forms, and that such information is accumulated and
communicated to Amgen’s management, including its Chief Executive Officer and Chief Financial Officer, as appropriate, to
allow timely decisions regarding required disclosures. In designing and evaluating the disclosure controls and procedures, Amgen’s
management recognized that any controls and procedures, no matter how well designed and operated, can provide only reasonable
assurance of achieving the desired control objectives and in reaching a reasonable level of assurance Amgen’s management
necessarily was required to apply its judgment in evaluating the cost-benefit relationship of possible controls and procedures. We
have carried out an evaluation under the supervision and with the participation of our management, including Amgen’s Chief Executive Officer and Chief Financial Officer, of the effectiveness of the design and operation of Amgen’s disclosure controls
and procedures. Based upon their evaluation and subject to the foregoing, the Chief Executive Officer and Chief Financial Officer
concluded that our disclosure controls and procedures were effective as of December31, 2012.
Management determined that, as of December31, 2012, there were no changes in our internal control over financial reporting
that occurred during the fiscal quarter then ended that have materially affected, or are reasonably likely to materially affect, our
internal control over financial reporting.
Management’s Report on Internal Control over Financial Reporting
Management of the Company is responsible for establishing and maintaining adequate internal control over financial
reporting, as such term is defined in Rule 13a-15(f) under the Securities Exchange Act of 1934. The Company’s internal control
over financial reporting is designed to provide reasonable assurance regarding the reliability of financial reporting and the
preparation of financial statements for external purposes in accordance with generally accepted accounting principles in the UnitedStates. However, all internal control systems, no matter how well designed, have inherent limitations. Therefore, even those systems
determined to be effective can provide only reasonable assurance with respect to financial statement preparation and reporting.
Management assessed the effectiveness of the Company’s internal control over financial reporting as of December31, 2012.
In making this assessment, management used the criteria set forth by the Committee of Sponsoring Organizations of the Treadway
Commission (COSO) in Internal Control-Integrated Framework. Based on our assessment, management believes that the Company
maintained effective internal control over financial reporting as of December31, 2012, based on the COSO criteria.
The effectiveness of the Company’s internal control over financial reporting has been audited by Ernst& Young LLP, an
independent registered public accounting firm, as stated in their attestation report appearing below, which expresses an unqualified
opinion on the effectiveness of the Company’s internal control over financial reporting as of December31, 2012.

7/27/2019 Amgen Inc 2012 Annual Report
http://slidepdf.com/reader/full/amgen-inc-2012-annual-report 86/150
79
Report of Independent Registered Public Accounting Firm
The Board of Directors and Stockholders of Amgen Inc.
We have audited Amgen Inc.’s (the “Company”) internal control over financial reporting as of December31, 2012, based
on criteria established in Internal Control—Integrated Framework issued by the Committee of Sponsoring Organizations of the
Treadway Commission (the COSO criteria). Amgen Inc.’s management is responsible for maintaining effective internal control
over financial reporting, and for its assessment of the effectiveness of internal control over financial reporting included in the
accompanying Management’s Report on Internal Control over Financial Reporting. Our responsibility is to express an opinion on
the Company’s internal control over financial reporting based on our audit.
We conducted our audit in accordance with the standards of the Public Company Accounting Oversight Board (United
States). Those standards require that we plan and perform the audit to obtain reasonable assurance about whether effective internal
control over financial reporting was maintained in all material respects. Our audit included obtaining an understanding of internal
control over financial reporting, assessing the risk that a material weakness exists, testing and evaluating the design and operating
effectiveness of internal control based on the assessed risk, and performing such other procedures as we considered necessary in
the circumstances. We believe that our audit provides a reasonable basis for our opinion.
A company’s internal control over financial reporting is a process designed to provide reasonable assurance regarding the
reliability of financial reporting and the preparation of financial statements for external purposes in accordance with generally
accepted accounting principles. A company’s internal control over financial reporting includes those policies and procedures that
(1)pertain to the maintenance of records that, in reasonable detail, accurately and fairly reflect the transactions and dispositions
of the assets of the company; (2)provide reasonable assurance that transactions are recorded as necessary to permit preparation
of financial statements in accordance with generally accepted accounting principles, and that receipts and expenditures of thecompany are being made only in accordance with authorizations of management and directors of the company; and (3)provide
reasonable assurance regarding prevention or timely detection of unauthorized acquisition, use or disposition of the company’s
assets that could have a material effect on the financial statements.
Because of its inherent limitations, internal control over financial reporting may not prevent or detect misstatements. Also,
projections of any evaluation of effectiveness to future periods are subject to the risk that controls may become inadequate because
of changes in conditions, or that the degree of compliance with the policies or procedures may deteriorate.
In our opinion, Amgen Inc. maintained, in all material respects, effective internal control over financial reporting as of
December31, 2012, based on the COSO criteria.
We also have audited, in accordance with the standards of the Public Company Accounting Oversight Board (United States),
the Consolidated Balance Sheets as of December31, 2012 and 2011, and the related Consolidated Statements of Income,
Comprehensive Income, Stockholders’ Equity and Cash Flows for each of the three years in the period ended December31, 2012
of Amgen Inc. and our report dated February27, 2013 expressed an unqualified opinion thereon.
/s/Ernst& Young LLP
Los Angeles, California
February27, 2013
Item9B. OTHER INFORMATION
Not applicable.

7/27/2019 Amgen Inc 2012 Annual Report
http://slidepdf.com/reader/full/amgen-inc-2012-annual-report 87/150
80
PART III
Item10. DIRECTORS, EXECUTIVE OFFICERS AND CORPORATE GOVERNANCE OF THE REGISTRANT
Information about our Directors is incorporated by reference from the section entitled ITEM1—ELECTION OF
DIRECTORS in our Proxy Statement for the 2013 Annual Meeting of Stockholders to be filed with the SEC within 120 days of
December31, 2012 (the Proxy Statement). Information about compliance with Section16(a) of the Securities Exchange Act of
1934 is incorporated by reference from the section entitled OTHER MATTERS—Section16(a) Beneficial Ownership Reporting
Compliance in our Proxy Statement. Information about the procedures by which stockholders may recommend nominees for the
Board of Directors is incorporated by reference from Appendix A—AMGEN INC. BOARD OF DIRECTORS GUIDELINESFOR DIRECTOR QUALIFICATIONS AND EVALUATIONS in our Proxy Statement. Information about our Audit Committee,
members of the committee and our Audit Committee financial experts is incorporated by reference from the section entitled
CORPORATE GOVERNANCE—Board Committees and Charters—Audit Committee in our Proxy Statement. Information
about our executive officers is contained in the discussion entitled Item1. Business—Executive Officers of the Registrant.
Code of Ethics
We maintain a code of ethics applicable to our principal executive officer, principal financial officer, principal accounting
officer or controller, and other persons performing similar functions. To view this code of ethics free of charge, please visit our
website at www.amgen.com (This website address is not intended to function as a hyperlink, and the information contained in our
website is not intended to be a part of this filing). We intend to satisfy the disclosure requirements under Item5.05 of Form 8-K
regarding an amendment to, or waiver from, a provision of this code of ethics, if any, by posting such information on our website
as set forth above.
Item11. EXECUTIVE COMPENSATION
Information about director and executive compensation is incorporated by reference from the section entitled EXECUTIVE
COMPENSATION in our Proxy Statement. Information about compensation committee matters is incorporated by reference from
the sections entitled CORPORATE GOVERNANCE—Board Committees and Charters—Compensation and Management
Development Committee and CORPORATE GOVERNANCE—Compensation Committee Report in our Proxy Statement.
Item12. SECURITY OWNERSHIP OF CERTAIN BENEFICIAL OWNERS AND MANAGEMENT ANDRELATED STOCKHOLDER MATTERS
Securities Authorized for Issuance Under Existing Equity Compensation Plans
Information about securities authorized for issuance under existing equity compensation plans is incorporated by reference
from the section entitled SECURITIES AUTHORIZED FOR ISSUANCE UNDER EXISTING EQUITY COMPENSATION
PLANS in our Proxy Statement.
Security Ownership of Directors and Executive Officers and Certain Beneficial Owners
Information about security ownership of certain beneficial owners and management is incorporated by reference from the
sections entitled SECURITY OWNERSHIP OF DIRECTORS AND EXECUTIVE OFFICERS and SECURITY OWNERSHIP
OF CERTAIN BENEFICIAL OWNERS in our Proxy Statement.
Item13. CERTAIN RELATIONSHIPS AND RELATED TRANSACTIONS AND DIRECTOR INDEPENDENCE
Information about certain relationships and related transactions and directors independence is incorporated by referencefrom the sections entitled CERTAIN RELATIONSHIPS AND RELATED TRANSACTIONS and CORPORATE GOVERNANCE
— Board Independence in our Proxy Statement.
Item14. PRINCIPAL ACCOUNTANT FEES AND SERVICES
Information about the fees for professional services rendered by our independent registered public accountants is incorporated
by reference from the section entitled AUDIT MATTERS — Independent Registered Public Accountants in our Proxy Statement.

7/27/2019 Amgen Inc 2012 Annual Report
http://slidepdf.com/reader/full/amgen-inc-2012-annual-report 88/150
81
PART IV
Item15. EXHIBITS AND FINANCIAL STATEMENT SCHEDULES
(a)1. Index to Financial Statements
The following Consolidated Financial Statements are included herein:
Page
numberReport of Independent Registered Public Accounting Firm
Consolidated Statements of Income for each of the three years in the period ended December31,2012
Consolidated Statements of Comprehensive Income for each of the three years in the period endedDecember31,2012
Consolidated Balance Sheets at December31, 2012 and 2011
Consolidated Statements of Stockholders’ Equity for each of the three years in the period endedDecember31, 2012
Consolidated Statements of Cash Flows for each of the three years in the period ended
December31,2012
Notes to Consolidated Financial Statements
(a)2. Index to Financial Statement Schedules
The following Schedule is filed as part of this Annual Report on Form 10-K:
Page
number
II. Valuation and Qualifying Accounts
All other schedules are omitted because they are not applicable, not required or because the required information is includedin the consolidated financial statements or notes thereto.
(a)3. Exhibits
ExhibitNo. Description
3.1 Restated Certificate of Incorporation of Amgen Inc. (As Restated December 7, 2005). (Filed as an exhibitto Form 10-K for the year ended December 31, 2005 on March 10, 2006 and incorporated herein byreference.)
3.2 Certificate of Amendment to the Restated Certificate of Incorporation of Amgen Inc. (As Amended May24, 2007). (Filed as an exhibit to Form 10-Q for the quarter ended June 30, 2007 on August 9, 2007 andincorporated herein by reference.)
3.3 Certificate of Correction of Restated Certificate of Incorporation of Amgen Inc. (As Corrected May 24,2007). (Filed as an exhibit to Form 10-Q for the quarter ended June 30, 2007 on August 9, 2007 andincorporated herein by reference.)
3.4 Certificate of Elimination of the Certificate of Designations of the Series A Junior Participating PreferredStock (As Eliminated December 9, 2008). (Filed as an exhibit to Form 10-K for the year ended December 31, 2008 on February 27, 2009 and incorporated herein by reference.)
3.5* Certificate of Change of Location of Registered Office and of Registered Agent of Amgen Inc. (As ChangedJanuary 2, 2009).
F-1
F-2
F-3
F-4
F-5
F-6
F-7
F-51

7/27/2019 Amgen Inc 2012 Annual Report
http://slidepdf.com/reader/full/amgen-inc-2012-annual-report 89/150
82
ExhibitNo. Description
3.6 Certificate of Amendment of Restated Certificate of Incorporation of Amgen Inc. (As Amended May 11,2009). (Filed as an exhibit to Form 10-Q for the quarter ended June 30, 2009 on August 10, 2009 andincorporated herein by reference.)
3.7 Certificate of Correction of Restated Certificate of Incorporation of Amgen Inc. (As Corrected May 11,2009). (Filed as an exhibit to Form 10-Q for the quarter ended June 30, 2009 on August 10, 2009 andincorporated herein by reference.)
3.8 Certificate of Correction of Restated Certificate of Incorporation of Amgen Inc. (As Corrected May 13,2010). (Filed as an exhibit to Form 10-Q for the quarter ended June 30, 2010 on August 9, 2010 andincorporated herein by reference.)
3.9 Certificate of Amendment of Restated Certificate of Incorporation of Amgen Inc. (As Amended May 23,2012) (Filed as Appendix B to the Definitive Proxy Statement on Schedule 14A on April 12, 2012 andincorporated herein by reference.)
3.10 Amended and Restated Bylaws of Amgen Inc. (As Amended and Restated October 6, 2009). (Filed as anexhibit to Form 8-K filed on October 7, 2009 and incorporated herein by reference.)
3.11 First Amendment to the Amended and Restated Bylaws of Amgen Inc. (Filed as an exhibit to Form 8-K filed on May 24, 2012 and incorporated herein by reference.)
4.1 Form of stock certificate for the common stock, par value $.0001 of the Company. (Filed as an exhibit toForm 10-Q for the quarter ended March 31, 1997 on May 13, 1997 and incorporated herein by reference.)
4.2 Form of Indenture, dated January 1, 1992. (Filed as an exhibit to Form S-3 Registration Statement filedon December 19, 1991 and incorporated herein by reference.)
4.3 Agreement of Resignation, Appointment and Acceptance dated February 15, 2008. (Filed as an exhibit toForm 10-K for the year ended December 31, 2007 on February 28, 2008 and incorporated herein byreference.)
4.4 First Supplemental Indenture, dated February 26, 1997. (Filed as an exhibit to Form 8-K on March 14,1997 and incorporated herein by reference.)
4.5 8-1/8% Debentures due April 1, 2097. (Filed as an exhibit to Form 8-K filed on April 8, 1997 andincorporated herein by reference.)
4.6 Officer’s Certificate, dated as of January 1, 1992, as supplemented by the First Supplemental Indenture,dated as of February 26, 1997, establishing a series of securities entitled “8 1/8% Debentures due April 1,2097.” (Filed as an exhibit to Form 8-K filed on April 8, 1997 and incorporated herein by reference.)
4.7 Indenture, dated as of August 4, 2003. (Filed as an exhibit to Form S-3 Registration Statement on August4, 2003 and incorporated herein by reference.)
4.8 Form of 4.85% Senior Notes due 2014. (Filed as an exhibit to Form 8-K on November 19, 2004 andincorporated herein by reference.)
4.9 Officers’ Certificate, dated November 18, 2004, including forms of the 4.00% Senior Notes due 2009 and4.85% Senior Notes due 2014. (Filed as an exhibit to Form 8-K on November 19, 2004 and incorporatedherein by reference.)
4.10 Indenture, dated as of February 17, 2006 and First Supplemental Indenture, dated as of June 8, 2006(including form of 0.375% Convertible Senior Note due 2013). (Filed as exhibit to Form 10-Q for thequarter ended June 30, 2006 on August 9, 2006 and incorporated herein by reference.)
4.11 Corporate Commercial Paper - Master Note between and among Amgen Inc., as Issuer, Cede & Co., as Nominee of The Depository Trust Company, and Citibank, N.A., as Paying Agent. (Filed as an exhibit toForm 10-Q for the quarter ended March31, 1998 on May13, 1998 and incorporated herein by reference.)
4.12 Officers’ Certificate of Amgen Inc., dated as of May 30, 2007, including forms of the Company’s Senior Floating Rate Notes due 2008, 5.85% Senior Notes due 2017 and 6.375% Senior Notes due 2037. (Filedas an exhibit to Form 8-K on May 30, 2007 and incorporated herein by reference.)

7/27/2019 Amgen Inc 2012 Annual Report
http://slidepdf.com/reader/full/amgen-inc-2012-annual-report 90/150
83
ExhibitNo. Description
4.13 Officers’ Certificate of Amgen Inc., dated as of May 23, 2008, including forms of the Company’s 6.15%Senior Notes due 2018 and 6.90% Senior Notes due 2038. (Filed as exhibit to Form 8-K on May 23, 2009and incorporated herein by reference.)
4.14 Officers’ Certificate of Amgen Inc., dated as of January 16, 2009, including forms of the Company’s 5.70%Senior Notes due 2019 and 6.40% Senior Notes due 2039. (Filed as exhibit to Form 8-K on January 16,2009 and incorporated herein by reference.)
4.15 Officers’ Certificate of Amgen Inc., dated as of March 12, 2010, including forms of the Company’s 4.50%Senior Notes due 2020 and 5.75% Senior Notes due 2040. (Filed as exhibit to Form 8-K on March 15,2010 and incorporated herein by reference.)
4.16 Officers’ Certificate of Amgen Inc., dated as of September 16, 2010, including forms of the Company’s3.45% Senior Notes due 2020 and 4.95% Senior Notes due 2041. (Filed as an exhibit to Form 8-K onSeptember 17, 2010 and incorporated herein by reference.)
4.17 Officers’ Certificate of Amgen Inc., dated as of June 30, 2011, including forms of the Company’s 2.30%Senior Notes due 2016, 4.10% Senior Notes due 2021 and 5.65% Senior Notes due 2042. (Filed as anexhibit to Form 8-K on June 30, 2011 and incorporated herein by reference.)
4.18 Officers’ Certificate of Amgen Inc., dated as of November 10, 2011, including forms of the Company’s1.875% Senior Notes due 2014, 2.50% Senior Notes due 2016, 3.875% Senior Notes due 2021 and 5.15%
Senior Notes due 2041. (Filed as an exhibit to Form 8-K on November 10, 2011 and incorporated herein by reference.)
4.19 Officers’ Certificate of Amgen Inc., dated as of December 5, 2011, including forms of the Company’s4.375% Senior Notes due 2018 and 5.50% Senior Notes due 2026. (Filed as an exhibit to Form 8-K onDecember 5, 2011 and incorporated herein by reference.)
4.20 Officers' Certificate of Amgen Inc., dated as of May 15, 2012, including forms of the Company's2.125% Senior Notes due 2017, 3.625% Senior Notes due 2022 and 5.375% Senior Notes due 2043.(Filed as an exhibit to Form 8-K on May 15, 2012 and incorporated herein by reference.)
4.21 Officers' Certificate of Amgen Inc., dated as of September 13, 2012, including forms of the Company's2.125% Senior Notes due 2019 and 4.000% Senior Notes due 2029. (Filed as an exhibit to Form 8-K onSeptember 13, 2012 and incorporated herein by reference.)
10.1+ Amgen Inc. 2009 Equity Incentive Plan. (Filed as Appendix A to the Definitive Proxy Statement on Schedule14A on March 26, 2009 and incorporated herein by reference.)
10.2+ Form of Stock Option Agreement for the Amgen Inc. 2009 Equity Incentive Plan. (As Amended onOctober 10, 2012.) (Filed as an exhibit to Form 10-Q for the quarter ended September 30, 2012 on November 6, 2012 and incorporated herein by reference.)
10.3+ Form of Restricted Stock Unit Agreement for the Amgen Inc. 2009 Equity Incentive Plan. (As Amendedon October 10, 2012.) (Filed as an exhibit to Form 10-Q for the quarter ended September 30, 2012 on November 6, 2012 and incorporated herein by reference.)
10.4+* Amgen Inc. 2009 Performance Award Program. (As Amended on December 13, 2012.)
10.5+ Form of Performance Unit Agreement for the Amgen Inc. 2009 Performance Award Program. (AsAmended on March 14, 2012.) (Filed as an exhibit to Form 10-Q for the quarter ended March 31, 2012on May 8, 2012 and incorporated herein by reference.)
10.6+* Amgen Inc. 2009 Director Equity Incentive Program. (As Amended and Restated on December 13, 2012.)
10.7+ Form of Grant of Non-Qualified Stock Option Agreement for the Amgen Inc. 2009 Director Equity IncentiveProgram. (Filed as an exhibit to Form 8-K on May 8, 2009 and incorporated herein by reference.)
10.8+* Form of Restricted Stock Unit Agreement for the Amgen Inc. 2009 Director Equity Incentive Program.(As Amended and Restated on December 13, 2012.)

7/27/2019 Amgen Inc 2012 Annual Report
http://slidepdf.com/reader/full/amgen-inc-2012-annual-report 91/150
84
ExhibitNo. Description
10.9+ Amgen Supplemental Retirement Plan. (As Amended and Restated effective January 1, 2009.) (Filed asan exhibit to Form 10-Q for the quarter ended September 30, 2008 on November 7, 2008 and incorporatedherein by reference.)
10.10+ First Amendment to the Amgen Supplemental Retirement Plan, effective April 11, 2011. (Filed as an exhibitto Form 10-Q for the quarter ended June 30, 2011 on August 8, 2011 and incorporated herein by reference.)
10.11+ Second Amendment to the Amgen Supplemental Retirement Plan, effective October 12, 2011. (Filed as an
exhibit to Form 10-K for the year ended December 31, 2011 on February 29, 2012 and incorporated herein by reference.)
10.12+ Third Amendment to the Amgen Supplemental Retirement Plan, effective January 1, 2012. (Filed as anexhibit to Form 10-K for the year ended December 31, 2011 on February 29, 2012 and incorporatedherein by reference.)
10.13+ Fourth Amendment to the Amgen Supplemental Retirement Plan, effective June 18, 2012. (Filed as anexhibit to Form 10-Q for the quarter ended June 30, 2012 on August 8, 2012 and incorporated herein byreference.)
10.14+ Fifth Amendment to the Amgen Supplemental Retirement Plan, effective August 27, 2012. (Filed as anexhibit to Form 10-Q for the quarter ended September 30, 2012 on November 6, 2012 and incorporatedherein by reference.)
10.15+ Amended and Restated Amgen Change of Control Severance Plan. (As Amended and Restated effectiveDecember 9, 2010 and subsequently amended effective March 2, 2011.) (Filed as an exhibit to Form 10-Q for the quarter ended March 31, 2011 on May 10, 2011 and incorporated herein by reference.)
10.16+ Amgen Inc. Executive Incentive Plan. (As Amended and Restated effective January1, 2009.) (Filed as anexhibit to Form 10-Q for the quarter ended September30, 2008 on November7, 2008 and incorporatedherein by reference.)
10.17+* First Amendment to the Amgen Inc. Executive Incentive Plan, effective December 13, 2012.
10.18+ Amgen Inc. Executive Nonqualified Retirement Plan. (As Amended and Restated effective January 1,2009.) (Filed as an exhibit to Form 10-Q for the quarter ended September 30, 2008 on November 7, 2008and incorporated herein by reference.)
10.19+ First Amendment to the Amgen Inc. Executive Nonqualified Retirement Plan, effective July 21, 2010.(Filed as an exhibit to Form 10-Q for the quarter ended June 30, 2010 on August 9, 2010 and incorporatedherein by reference.)
10.20+ Amgen Nonqualified Deferred Compensation Plan. (As Amended and Restated effective January 1, 2009.)(Filed as an exhibit to Form 10-Q for the quarter ended September 30, 2008 on November 7, 2008 andincorporated herein by reference.)
10.21+ First Amendment to the Amgen Nonqualified Deferred Compensation Plan, effective April 11, 2011. (Filedas an exhibit to Form 10-Q for the quarter ended June 30, 2011 on August 8, 2011 and incorporated herein by reference.)
10.22+ Second Amendment to the Amgen Nonqualified Deferred Compensation Plan, effective October 12, 2011.(Filed as an exhibit to Form 10-K for the year ended December 31, 2011 on February 29, 2012 and
incorporated herein by reference.)
10.23+ Third Amendment to the Amgen Nonqualified Deferred Compensation Plan, effective June 18, 2012. (Filedas an exhibit to Form 10-Q for the quarter ended June 30, 2012 on August 8, 2012 and incorporated herein by reference.)
10.24+ Fourth Amendment to the Amgen Nonqualified Deferred Compensation Plan, effective August 27, 2012.(Filed as an exhibit to Form 10-Q for the quarter ended September 30, 2012 on November 6, 2012 andincorporated herein by reference.)
7/27/2019 Amgen Inc 2012 Annual Report
http://slidepdf.com/reader/full/amgen-inc-2012-annual-report 92/150
85
ExhibitNo. Description
10.25+ Agreement between Amgen Inc. and Mr. Jonathan M. Peacock, dated July 5, 2010. (Filed as an exhibit toForm 10-Q for the quarter ended September 30, 2010 on November 8, 2010 and incorporated herein byreference.)
10.26+ Agreement between Amgen Inc. and Mr. Anthony C. Hooper, dated October 12, 2011. (Filed as an exhibitto Form 10-K for the year ended December 31, 2011 on February 29, 2012 and incorporated herein byreference.)
10.27+ Consulting Services Agreement, effective February 13, 2012, between Amgen Inc., Perlmutter Consulting,Inc. and Dr. Roger M. Perlmutter. (Filed as an exhibit to Form 8-K on March 1, 2012 and incorporatedherein by reference.)
10.28+ Grant Agreement, dated December 3, 2012, between Amgen Inc., and Reed College. (Filed as an exhibitto Form 8-K on December 7, 2012 and incorporated herein by reference.)
10.29+ Restricted Stock Unit Agreement, dated April 27, 2012, between Amgen Inc. and Kevin W. Sharer. (Filedas an exhibit to Form 10-Q for the quarter ended June 30, 2012 on August 8, 2012 and incorporated herein by reference.)
10.30+ Performance Unit Agreement, dated April 27, 2012, between Amgen Inc. and Kevin W. Sharer. (Filed asan exhibit to Form 10-Q for the quarter ended June 30, 2012 on August 8, 2012 and incorporated herein by reference.)
10.31 Product License Agreement, dated September 30, 1985, and Technology License Agreement, dated,September 30, 1985 between Amgen and Ortho Pharmaceutical Corporation. (Filed as an exhibit to Form10-Q for the quarter ended June 30, 2000 on August 1, 2000 and incorporated herein by reference.)
10.32 Shareholders’ Agreement, dated May 11, 1984, among Amgen, Kirin Brewery Company, Limited andKirin-Amgen, Inc. (Filed as an exhibit to Form 10-K for the year ended December 31, 2000 on March 7,2001 and incorporated herein by reference.)
10.33 Amendment No. 1 dated March 19, 1985, Amendment No. 2 dated July 29, 1985 (effective July 1, 1985),and Amendment No. 3, dated December 19, 1985, to the Shareholders’ Agreement dated May 11, 1984.(Filed as an exhibit to Form 10-Q for the quarter ended June 30, 2000 on August 1, 2000 and incorporatedherein by reference.)
10.34 Amendment No. 4 dated October 16, 1986 (effective July 1, 1986), Amendment No. 5 dated December 6,
1986 (effective July 1, 1986), Amendment No. 6 dated June 1, 1987, Amendment No. 7 dated July 17,1987 (effective April 1, 1987), Amendment No. 8 dated May 28, 1993 (effective November 13, 1990),Amendment No. 9 dated December 9, 1994 (effective June 14, 1994), Amendment No. 10 effective March1, 1996, and Amendment No. 11 effective March 20, 2000 to the Shareholders’ Agreement, dated May 11,1984. (Filed as exhibits to Form 10-K for the year ended December 31, 2000 on March 7, 2001 andincorporated herein by reference.)
10.35 Amendment No. 12 to the Shareholders’ Agreement, dated January 31, 2001. (Filed as an exhibit to Form10-Q for the quarter ended June 30, 2005 on August 8, 2005 and incorporated herein by reference.)
10.36 Amendment No. 13 to the Shareholders’ Agreement, dated June 28, 2007 (with certain confidentialinformation deleted therefrom). (Filed as an exhibit to Form 10-Q for the quarter ended June 30, 2007 onAugust 9, 2007 and incorporated herein by reference.)
10.37 Product License Agreement, dated September 30, 1985, and Technology License Agreement, datedSeptember 30, 1985, between Kirin-Amgen, Inc. and Ortho Pharmaceutical Corporation. (Filed as anexhibit to Form 10-Q for the quarter ended June 30, 2000 on August 1, 2000 and incorporated herein byreference.)
10.38 Research, Development Technology Disclosure and License Agreement: PPO, dated January 20, 1986, byand between Kirin Brewery Co., Ltd. and Amgen Inc. (Filed as an exhibit to Amendment No. 1 to FormS-1 Registration Statement on March 11, 1986 and incorporated herein by reference.)
10.39 Assignment and License Agreement, dated October 16, 1986 (effective July 1, 1986), between Amgen andKirin-Amgen, Inc. (Filed as an exhibit to Form 10-K for the year ended December 31, 2000 on March 7,2001 and incorporated herein by reference.)

7/27/2019 Amgen Inc 2012 Annual Report
http://slidepdf.com/reader/full/amgen-inc-2012-annual-report 93/150
86
ExhibitNo. Description
10.40 G-CSF United States License Agreement, dated June1, 1987 (effective July1, 1986), Amendment No. 1,dated October20, 1988, and Amendment No. 2, dated October17, 1991 (effective November13, 1990), between Kirin-Amgen, Inc. and Amgen Inc. (Filed as exhibits to Form 10-K for the year ended December31,2000 on March7, 2001 and incorporated herein by reference.)
10.41 G-CSF European License Agreement, dated December 30, 1986, between Kirin-Amgen and Amgen,Amendment No. 1 to Kirin-Amgen, Inc. / Amgen G-CSF European License Agreement, dated June 1, 1987,Amendment No. 2 to Kirin-Amgen, Inc. / Amgen G-CSF European License Agreement, dated March 15,1998, Amendment No. 3 to Kirin-Amgen, Inc. / Amgen G-CSF European License Agreement, dated October 20, 1988, and Amendment No. 4 to Kirin-Amgen, Inc. / Amgen G-CSF European License Agreement,dated December 29, 1989, between Kirin-Amgen, Inc. and Amgen Inc. (Filed as exhibits to Form 10-K for the year ended December 31, 2000 on March 7, 2001 and incorporated herein by reference.)
10.42 Agreement Regarding Governance and Commercial Matters, dated December 16, 2001, by and amongAmerican Home Products Corporation, American Cyanamid Company and Amgen Inc. (with certainconfidential information deleted therefrom). (Filed as an exhibit to Amendment No. 1 to Form S-4Registration Statement on March 22, 2002 and incorporated herein by reference.)
10.43 Amended and Restated Promotion Agreement, dated as of December 16, 2001, by and among ImmunexCorporation, American Home Products Corporation and Amgen Inc. (with certain confidential informationdeleted therefrom). (Filed as an exhibit to Amendment No. 1 to Form S-4 Registration Statement on March22, 2002 and incorporated herein by reference.)
10.44 Description of Amendment No. 1 to Amended and Restated Promotion Agreement, effective as of July 8,2003, among Wyeth, Amgen Inc. and Immunex Corporation (with certain confidential information deletedtherefrom). (Filed as an exhibit to Form 10-K for the year ended December 31, 2003 on March 11, 2004and incorporated herein by reference.)
10.45 Description of Amendment No. 2 to Amended and Restated Promotion Agreement, effective as of April20, 2004, by and among Wyeth, Amgen Inc. and Immunex Corporation. (Filed as an exhibit to Amendment No. 1 to Form S-4 Registration Statement on June 29, 2004 and incorporated herein by reference.)
10.46 Amendment No. 3 to Amended and Restated Promotion Agreement, effective as of January 1, 2005, byand among Wyeth, Amgen Inc. and Immunex Corporation (with certain confidential information deletedtherefrom). (Filed as an exhibit to Form 10-Q for the quarter ended March 31, 2005 on May 4, 2005 andincorporated herein by reference.)
10.47 Confirmation of OTC Convertible Note Hedge related to 2013 Notes, dated February 14, 2006, to AmgenInc. from Merrill Lynch International related to 0.375% Convertible Senior Notes Due 2013. (Filed as anexhibit to Form 10-K for the year ended December 31, 2005 on March 10, 2006 and incorporated herein by reference.)
10.48 Confirmation of OTC Warrant Transaction, dated February 14, 2006, to Amgen Inc. from Merrill LynchInternational for warrants expiring in 2013. (Filed as an exhibit to Form 10-K for the year ended December 31, 2005 on March 10, 2006 and incorporated herein by reference.)
10.49 Credit Agreement, dated as of December 2, 2011, among Amgen Inc., with Citibank, N.A., as administrativeagent, JPMorgan Chase Bank, N.A., as syndication agent, Citigroup Global Markets Inc. and J.P. MorganSecurities LLC as joint lead arrangers and joint book runners, and the other banks party thereto. (Filed asan exhibit to Form 8-K filed on December 2, 2011 and incorporated herein by reference.)
10.50 Multi-product License Agreement with Respect to Japan between Amgen Inc. and Takeda Pharmaceutical
Company Limited dated February 1, 2008 (with certain confidential information deleted therefrom). (Filedas an exhibit to Form 10-Q for the quarter ended March 31, 2008 on May 12, 2008 and incorporated herein by reference.)
10.51* Amendment No. 1 dated as of June 25, 2010 to the License Agreement dated February 1, 2008 betweenAmgen Inc. and Takeda Pharmaceutical Company Limited.
10.52* Amendment No. 2 dated as of June 29, 2012 to the License Agreement dated February 1, 2008 betweenAmgen Inc. and Takeda Pharmaceutical Company Limited.
7/27/2019 Amgen Inc 2012 Annual Report
http://slidepdf.com/reader/full/amgen-inc-2012-annual-report 94/150
87
ExhibitNo. Description
10.53 Supply Agreement between Amgen Inc. and Takeda Pharmaceutical Company Limited dated February 1,2008 (with certain confidential information deleted therefrom). (Filed as an exhibit to Form 10-Q for thequarter ended March 31, 2008 on May 12, 2008 and incorporated herein by reference.)
10.54* Collaboration and License Agreement between Amgen Inc. and Celltech R&D Limited dated May 10, 2002(with certain confidential information deleted therefrom) and Amendment No. 1, effective as of June 9,2003, to Collaboration and License Agreement between Amgen Inc. and Celltech R&D Limited (withcertain confidential information deleted therefrom).
10.55 Integrated Facilities Management Services Agreement, dated February4, 2009, between Amgen Inc. andJones Lang LaSalle Americas, Inc. (with certain confidential information deleted therefrom) (Previouslyfiled as an exhibit to Form 10-K for the year ended December31, 2008 on February27, 2009.), as amended by Amendment Number 1 dated March31, 2010 (with certain confidential information deleted therefrom),Amendment Number 2 dated May12, 2011 (as corrected by the Letter Agreement) (with certain confidentialinformation deleted therefrom), and Letter Agreement dated July19, 2011. (Filed as an exhibit to Form10-Q for the quarter ended June30, 2011 on August8, 2011 and incorporated herein by reference.)
10.56 Amendment Number 3, dated July 1, 2011, to the Integrated Facilities Management Services Agreement,dated February 4, 2009, between Amgen Inc. and Jones Lang LaSalle Americas, Inc. (Filed as an exhibitto Form 10-Q for the quarter ended September 30, 2011 on November 4, 2011 and incorporated herein byreference.)
10.57 Collaboration Agreement dated July 27, 2009 between Amgen Inc. and Glaxo Group Limited, a wholly
owned subsidiary of GlaxoSmithKline plc (with certain confidential information deleted therefrom). (Filedas an exhibit to Form 10-Q for the quarter ended September 30, 2009 on November 6, 2009 and incorporatedherein by reference.)
10.58* Amendment Number 1, dated as of January 24, 2012, to Collaboration Agreement dated July 27, 2009 between Amgen Inc. and Glaxo Group Limited, a wholly owned subsidiary of GlaxoSmithKline plc.
10.59 Expansion Agreement dated July 27, 2009 between Amgen Inc. and Glaxo Group Limited, a wholly ownedsubsidiary of GlaxoSmithKline plc (with certain confidential information deleted therefrom). (Filed as anexhibit to Form 10-Q for the quarter ended September 30, 2009 on November 6, 2009 and incorporatedherein by reference.)
10.60 Amendment Number 1, dated September 20, 2010, to Expansion Agreement dated July 27, 2009 betweenAmgen Inc. and Glaxo Group Limited, a wholly owned subsidiary of GlaxoSmithKline plc (with certain
confidential information deleted therefrom). (Filed as an exhibit to Form 10-Q for the quarter endedSeptember 30, 2010 on November 8, 2010 and incorporated herein by reference.)
10.61* Amendment Number 2, dated as of January 24, 2012, to Expansion Agreement dated July 27, 2009 betweenAmgen Inc. and Glaxo Group Limited, a wholly owned subsidiary of GlaxoSmithKline plc.
10.62 Sourcing and Supply Agreement, dated November 15, 2011, by and between Amgen USA Inc, a whollyowned subsidiary of Amgen Inc., and DaVita Inc. (with certain confidential information deletedtherefrom). (Filed as an exhibit to Form 10-K for the year ended December 31, 2011 on February 29,2012 and incorporated herein by reference.)
10.63* Amendment Number 1 to Sourcing and Supply Agreement, effective as of January 1, 2013, by and between Amgen USA Inc., a wholly owned subsidiary of Amgen Inc., and DaVita Healthcare PartnersInc. f/k/a DaVita Inc. (with certain confidential information deleted therefrom).
10.64 Collaboration Agreement dated March 30, 2012 by and between Amgen Inc. and AstraZenecaCollaboration Ventures, LLC, a wholly owned subsidiary of AstraZeneca Pharmaceuticals LP (withcertain confidential information deleted therefrom). (Filed as an exhibit to Form 10-Q for the quarter ended March 31, 2012 on May 8, 2012 and incorporated herein by reference.)
21* Subsidiaries of the Company.
23 Consent of the Independent Registered Public Accounting Firm. The consent is set forth on pages 90and 91 of this Annual Report on Form 10-K.
24 Power of Attorney. The Power of Attorney is set forth on page 92 of this Annual Report on Form 10-K.

7/27/2019 Amgen Inc 2012 Annual Report
http://slidepdf.com/reader/full/amgen-inc-2012-annual-report 95/150
88
ExhibitNo. Description
31* Rule 13a-14(a) Certifications.
32** Section 1350 Certifications.
101.INS* XBRL Instance Document.
101.SCH* XBRL Taxonomy Extension Schema Document.
101.CAL* XBRL Taxonomy Extension Calculation Linkbase Document.
101.DEF* XBRL Taxonomy Extension Definition Linkbase Document.
101.LAB* XBRL Taxonomy Extension Label Linkbase Document.
101.PRE* XBRL Taxonomy Extension Presentation Linkbase Document.
(* = filed herewith)
(** = furnished herewith and not “filed” for purposes of Section18 of the Securities Exchange Act of 1934, as amended)
(+ = management contract or compensatory plan, contract or arrangement)

7/27/2019 Amgen Inc 2012 Annual Report
http://slidepdf.com/reader/full/amgen-inc-2012-annual-report 96/150
89
SIGNATURES
Pursuant to the requirements of the Securities Exchange Act of 1934, the registrant has duly caused this Annual Report to
be signed on its behalf by the undersigned, thereunto duly authorized.
AMGEN INC.
(Registrant)
Date: 02/27/2013 By: /S/JONATHAN M. PEACOCK Jonathan M. Peacock
Executive Vice President
and Chief Financial Officer
7/27/2019 Amgen Inc 2012 Annual Report
http://slidepdf.com/reader/full/amgen-inc-2012-annual-report 97/150
90
EXHIBIT 23
CONSENT OF INDEPENDENT REGISTERED PUBLIC ACCOUNTING FIRM
We consent to the incorporation by reference in the following Registration Statements:
• Registration Statement (Form S-8 No.333-159377) pertaining to the Amgen Inc. 2009 Equity Incentive Plan;
• Registration Statement (Form S-8 No.33-39183) pertaining to the Amended and Restated Employee Stock Purchase
Plan;
• Registration Statements (Form S-8 No.33-39104, as amended by Form S-8 No.333-144581) pertaining to the Amended
and Restated Amgen Retirement and Savings Plan (formerly known as the Amgen Retirement and Savings Plan);
• Registration Statements (Form S-8 Nos.33-42072 and 333-144579) pertaining to the Amgen Inc. Amended and Restated
1991 Equity Incentive Plan;
• Registration Statements (Form S-8 Nos.33-47605 and 333-144580) pertaining to the Retirement and Savings Plan for
Amgen Manufacturing, Limited (formerly known as the Retirement and Savings Plan for Amgen Manufacturing, Inc.);
• Registration Statements (Form S-8 Nos.333-44727, 333-62735, 333-56672 and 333-83824) pertaining to the Amgen
Inc. Amended and Restated 1997 Special Non-Officer Equity Incentive Plan (formerly known as the Amgen Inc. 1997
Special Non-Officer Equity Incentive Plan);
• Registration Statement (Form S-3 No.333-19931) pertaining to debt securities of Amgen Inc.;
• Registration Statement (FormS-3 No.333-40405) pertaining to debt securities of Amgen Inc.;
• Registration Statement (Form S-3 No.333-53929) pertaining to the Amgen Inc. 1997 Special Non-Officer Equity
Incentive Plan, the Amgen Inc. Amended and Restated 1991 Equity Incentive Plan, the Amended and Restated 1988
Stock Option Plan of Amgen Inc. and the Amended and Restated 1987 Directors’ Stock Option Plan;
• Registration Statements (Form S-8 Nos.333-81284 and 333-177868) pertaining to the Amgen Nonqualified Deferred
Compensation Plan;
• Registration Statements (Form S-3 No.333-56664 and Amendment No.1 thereto) pertaining to the Amgen Inc. 1997
Special Non-Officer Equity Incentive Plan, the Amgen Inc. Amended and Restated 1991 Equity Incentive Plan;
• Registration Statement (Form S-3 No.333-88834) pertaining to Amgen Inc.’s Liquid Yield Option™ Notes due 2032;
• Registration Statements (Form S-3 No.333-92450 and Amendment No.1 thereto) pertaining to Amgen Inc.’s Common
Stock;
• Registration Statements (Form S-8 No.333-92424 and Amendment No.1 thereto) pertaining to the Amgen Inc. Amended
and Restated 1993 Equity Incentive Plan (formerly known as the Immunex Corporation 1993 Stock Option Plan), the
Amgen Inc. Amended and Restated 1999 Equity Incentive Plan (formerly known as the Immunex Corporation 1999
Stock Option Plan);
• Registration Statements (Form S-3 No.333-107639 and Amendment 1 thereto) relating to debt securities, common stock
and associated preferred share repurchase rights, preferred stock, warrants to purchase debt securities, common stock
or preferred stock, securities purchase contracts, securities purchase units and depositary shares of Amgen Inc. and in
the related Prospectuses;
• Registration Statement (Form S-8 No.333-118254) pertaining to the Amgen Inc. Amended and Restated 1997 EquityIncentive Plan (formerly known as the Tularik Inc. 1997 Equity Incentive Plan, as amended);
• Registration Statement (Form S-3 No.333-132286) relating to the potential resale of securities acquired from Amgen
Inc. by selling security holders in unregistered private offerings;
• Registration Statement (Form S-8 No.333-132932) pertaining to the Amgen Inc. Amended and Restated 1996 Incentive
Stock Plan (formerly known as Abgenix, Inc. 1996 Incentive Stock Plan, as amended and restated), the Amgen Inc.
Amended and Restated 1999 Incentive Stock Plan (formerly known as Abgenix, Inc. 1999 Nonstatutory Stock Option
Plan, as amended and restated);
• Registration Statement (Form S-8 No.333-133002) pertaining to the Amgen Inc. Amended and Restated 1999 Incentive
Stock Plan (formerly known as Abgenix, Inc. 1999 Nonstatutory Stock Option Plan, as amended and restated);

7/27/2019 Amgen Inc 2012 Annual Report
http://slidepdf.com/reader/full/amgen-inc-2012-annual-report 98/150
91
• Registration Statement (Form S-8 No.333-138325) pertaining to the Amgen Inc. Amended and Restated Assumed Avidia
Equity Incentive Plan (formerly known as the Avidia, Inc. Amended and Restated 2003 Equity Incentive Plan);
• Registration Statement (Form S-4 No.333-147482) relating to the possible exchange of unregistered Senior Floating
Notes for registered Senior Floating Notes relating to the Prospectus of Amgen Inc. for the registration of Senior Floating
Rate Notes due 2008, 5.85% Senior Notes due 2017, 6.375% Senior Notes Due 2037;
• Registration Statements (Form S-3 Nos. 333-150290 and 333-172617) relating to debt securities, common stock,
preferred stock, warrants to purchase debt securities, common stock, preferred stock or depositary shares, rights to
purchase common stock or preferred stock, securities purchase contracts, securities purchase units and depositary shares
of Amgen Inc. and in the related Prospectuses; and
• Registration Statement (Form S-8 No.333-176240) pertaining to the Amgen Profit Sharing Plan for Employees in
Ireland;
of our reports dated February27, 2013, with respect to the consolidated financial statements and schedule of Amgen Inc.
and the effectiveness of internal control over financial reporting of Amgen Inc. included in this Annual Report (Form 10-K) for
the year ended December31, 2012.
/s/ Ernst& Young LLP
Los Angeles, California
February27, 2013

7/27/2019 Amgen Inc 2012 Annual Report
http://slidepdf.com/reader/full/amgen-inc-2012-annual-report 99/150
92
EXHIBIT 24
POWER OF ATTORNEY
KNOW ALL MEN AND WOMEN BY THESE PRESENTS, that each person whose signature appears below constitutes
and appoints Jonathan M. Peacock and Thomas J.W. Dittrich, or either of them, his or her attorney-in-fact, each with the power
of substitution, for him or her in any and all capacities, to sign any amendments to this Report, and to file the same, with exhibits
thereto and other documents in connection therewith, with the Securities and Exchange Commission, hereby ratifying and
confirming all that each of said attorneys-in-fact, or his or her substitute or substitutes, may do or cause to be done by virtue hereof.
Pursuant to the requirements of the Securities Exchange Act of 1934, this report has been signed below by the following
persons on behalf of the registrant and in the capacities and on the dates indicated:
Signature Title Date
/S/ROBERT A. BRADWAY Chairman of the Board, President andChief Executive Officer, and Director
(Principal Executive Officer)
2/27/2013
Robert A. Bradway
/S/JONATHAN M. PEACOCK Executive Vice President andChief Financial Officer
(Principal Financial Officer)
2/27/2013
Jonathan M. Peacock
/S/THOMAS J.W. DITTRICH Vice President Finance andChief Accounting Officer
(Principal Accounting Officer)
2/27/2013
Thomas J.W. Dittrich
/S/DAVID BALTIMORE Director 2/27/2013
David Baltimore
/S/FRANK J. BIONDI, JR. Director 2/27/2013
Frank J. Biondi, Jr.
/S/FRANÇOIS DE CARBONNEL Director 2/27/2013
François de Carbonnel
/S/VANCE D. COFFMAN Director 2/27/2013
Vance D. Coffman
/S/ROBERT A. ECKERT Director 2/27/2013
Robert A. Eckert
/S/REBECCA M. HENDERSON Director 2/27/2013
Rebecca M. Henderson
/S/FRANK C. HERRINGER Director 2/27/2013
Frank C. Herringer
/S/TYLER JACKS Director 2/27/2013
Tyler Jacks
/S/GILBERT S. OMENN Director 2/27/2013
Gilbert S. Omenn
/S/JUDITH C. PELHAM Director 2/27/2013Judith C. Pelham
/S/J. PAUL REASON Director 2/27/2013
J. Paul Reason
/S/LEONARD D. SCHAEFFER Director 2/27/2013
Leonard D. Schaeffer
/S/RONALD D. SUGAR Director 2/27/2013
Ronald D. Sugar
7/27/2019 Amgen Inc 2012 Annual Report
http://slidepdf.com/reader/full/amgen-inc-2012-annual-report 100/150
F-1
Report of Independent Registered Public Accounting Firm
The Board of Directors and Stockholders of Amgen Inc.
We have audited the accompanying Consolidated Balance Sheets of Amgen Inc. (the “Company”) as of December31, 2012
and 2011, and the related Consolidated Statements of Income, Comprehensive Income, Stockholders’ Equity and Cash Flows for
each of the three years in the period ended December31, 2012. Our audits also included the financial statement schedule listed
in the Index at Item15(a) 2. These financial statements and schedule are the responsibility of the Company’s management. Our
responsibility is to express an opinion on these financial statements and schedule based on our audits.
We conducted our audits in accordance with the standards of the Public Company Accounting Oversight Board (UnitedStates). Those standards require that we plan and perform the audit to obtain reasonable assurance about whether the financial
statements are free of material misstatement. An audit includes examining, on a test basis, evidence supporting the amounts and
disclosures in the financial statements. An audit also includes assessing the accounting principles used and significant estimates
made by management, as well as evaluating the overall financial statement presentation. We believe that our audits provide a
reasonable basis for our opinion.
In our opinion, the financial statements referred to above present fairly, in all material respects, the consolidated financial
position of Amgen Inc. at December31, 2012 and 2011, and the consolidated results of its operations and its cash flows for each
of the three years in the period ended December31, 2012, in conformity with U.S. generally accepted accounting principles. Also,
in our opinion, the related financial statement schedule, when considered in relation to the basic financial statements taken as a
whole, presents fairly in all material respects the information set forth therein.
We also have audited, in accordance with the standards of the Public Company Accounting Oversight Board (United States),Amgen Inc.’s internal control over financial reporting as of December31, 2012, based on criteria established in Internal
Control—Integrated Framework issued by the Committee of Sponsoring Organizations of the Treadway Commission and our
report dated February27, 2013 expressed an unqualified opinion thereon.
/s/ Ernst& Young LLP
Los Angeles, California
February27, 2013
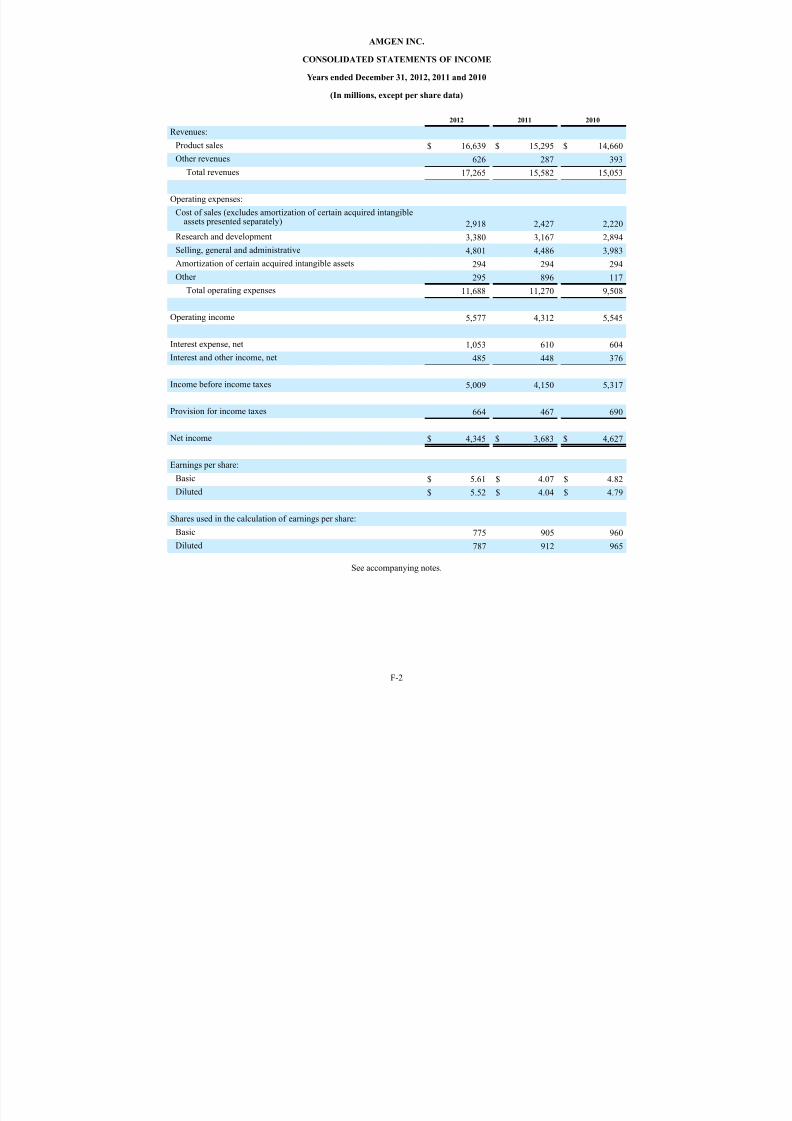
7/27/2019 Amgen Inc 2012 Annual Report
http://slidepdf.com/reader/full/amgen-inc-2012-annual-report 101/150
F-2
AMGEN INC.
CONSOLIDATED STATEMENTS OF INCOME
Years ended December31, 2012, 2011 and 2010
(In millions, except per share data)
2012 2011 2010
Revenues:
Product sales $ 16,639 $ 15,295 $ 14,660
Other revenues 626 287 393
Total revenues 17,265 15,582 15,053
Operating expenses:
Cost of sales (excludes amortization of certain acquired intangibleassets presented separately) 2,918 2,427 2,220
Research and development 3,380 3,167 2,894
Selling, general and administrative 4,801 4,486 3,983
Amortization of certain acquired intangible assets 294 294 294
Other 295 896 117
Total operating expenses 11,688 11,270 9,508
Operating income 5,577 4,312 5,545
Interest expense, net 1,053 610 604
Interest and other income, net 485 448 376
Income before income taxes 5,009 4,150 5,317
Provision for income taxes 664 467 690
Net income $ 4,345 $ 3,683 $ 4,627
Earnings per share:
Basic $ 5.61 $ 4.07 $ 4.82
Diluted $ 5.52 $ 4.04 $ 4.79
Shares used in the calculation of earnings per share:
Basic 775 905 960
Diluted 787 912 965
See accompanying notes.

7/27/2019 Amgen Inc 2012 Annual Report
http://slidepdf.com/reader/full/amgen-inc-2012-annual-report 102/150
F-3
AMGEN INC.
CONSOLIDATED STATEMENTS OF COMPREHENSIVE INCOME
Years ended December31, 2012, 2011 and 2010
(In millions)
2012 2011 2010
Net income$ 4,345 $ 3,683 $ 4,627
Other comprehensive income (loss), net of reclassificationadjustments and taxes:
Foreign currency translation losses (9) (1) (18)
Gains (losses) on the effective portion of cash flow hedges (78) 40 85
Net unrealized gains (losses) on available-for-sale securities 63 (15) 40
Other gains (losses) (1) (6) 1
Other comprehensive income (loss), net of tax (25) 18 108
Comprehensive income $ 4,320 $ 3,701 $ 4,735
See accompanying notes.

7/27/2019 Amgen Inc 2012 Annual Report
http://slidepdf.com/reader/full/amgen-inc-2012-annual-report 103/150
F-4
AMGEN INC.
CONSOLIDATED BALANCE SHEETS
December31, 2012 and 2011
(In millions, except per share data)
2012 2011
ASSETS
Current assets:
Cash and cash equivalents $ 3,257 $ 6,946
Marketable securities 20,804 13,695
Trade receivables, net 2,518 2,896
Inventories 2,744 2,484
Other current assets 1,886 1,572
Total current assets 31,209 27,593
Property, plant and equipment, net 5,326 5,420
Intangible assets, net 3,968 2,584
Goodwill 12,662 11,750
Other assets 1,133 1,524
Total assets $ 54,298 $ 48,871
LIABILITIES AND STOCKHOLDERS’ EQUITY
Current liabilities:
Accounts payable $ 905 $ 642
Accrued liabilities 4,791 5,028
Current portion of long-term debt 2,495 84
Total current liabilities8,191 5,754
Long-term debt 24,034 21,344
Other noncurrent liabilities 3,013 2,744
Contingencies and commitments
Stockholders’ equity:
Common stock and additional paid-in capital; $0.0001 par value; 2,750.0 sharesauthorized; outstanding — 756.3 shares in 2012 and 795.6 shares in 2011 29,337 27,777
Accumulated deficit (10,423) (8,919)
Accumulated other comprehensive income 146 171
Total stockholders’ equity 19,060 19,029
Total liabilities and stockholders’ equity $ 54,298 $ 48,871
See accompanying notes.

7/27/2019 Amgen Inc 2012 Annual Report
http://slidepdf.com/reader/full/amgen-inc-2012-annual-report 104/150
F-5
AMGEN INC.
CONSOLIDATED STATEMENTS OF STOCKHOLDERS’ EQUITY
Years ended December31, 2012, 2011 and 2010
(In millions)
Numberofshares
ofcommonstock
Commonstock and
additionalpaid-incapital Accumulateddeficit
Accumulatedother
comprehensiveincome Total
Balance at December 31, 2009 994.6 $ 26,944 $ (4,322) $ 45 $ 22,667
Net income — — 4,627 — 4,627
Other comprehensive income, net of tax — — — 108 108
Issuance of common stock in connectionwith the Company’s equity award programs 4.0 69 — — 69
Stock-based compensation — 357 — — 357
Tax impact related to employee stock-basedcompensation — (71) — — (71)
Repurchases of common stock (66.5) — (3,800) — (3,800)
Other — — (13) — (13)
Balance at December 31, 2010 932.1 27,299 (3,508) 153 23,944
Net income — — 3,683 — 3,683
Other comprehensive income, net of tax — — — 18 18
Dividends — — (787) — (787)
Issuance of common stock in connectionwith the Company’s equity award programs 7.8 230 — — 230
Stock-based compensation — 337 — — 337
Tax impact related to employee stock-basedcompensation — (89) — — (89)
Repurchases of common stock (144.3) — (8,307) — (8,307)Balance at December 31, 2011 795.6 27,777 (8,919) 171 19,029
Net income — — 4,345 — 4,345
Other comprehensive loss, net of tax — — — (25) (25)
Dividends — — (1,187) — (1,187)
Issuance of common stock in connectionwith the Company’s equity award programs 23.0 1,288 — — 1,288
Stock-based compensation — 359 — — 359
Tax impact related to employee stock-basedcompensation — (87) — — (87)
Repurchases of common stock (62.3) — (4,662) — (4,662)Balance at December 31, 2012 756.3 $ 29,337 $ (10,423) $ 146 $ 19,060
See accompanying notes.

7/27/2019 Amgen Inc 2012 Annual Report
http://slidepdf.com/reader/full/amgen-inc-2012-annual-report 105/150
F-6
AMGEN INC.
CONSOLIDATED STATEMENTS OF CASH FLOWS
Years ended December31, 2012, 2011 and 2010
(In millions)
2012 2011 2010
Cash flows from operating activities:
Net income $ 4,345 $ 3,683 $ 4,627
Depreciation and amortization 1,088 1,060 1,017
Stock-based compensation expense 362 341 353
Deferred income taxes 28 (328) (151)
Property, plant and equipment impairments 178 6 118
Other items, net (74) 63 140
Changes in operating assets and liabilities, net of acquisitions:
Trade receivables, net 348 (557) (210)
Inventories (150) (383) 153
Other assets 124 (204) 20
Accounts payable 161 (95) 142
Accrued income taxes 87 (20) (656)
Legal reserve (780) 780 —
Other liabilities 165 773 234
Net cash provided by operating activities 5,882 5,119 5,787
Cash flows from investing activities:
Purchases of property, plant and equipment (689) (567) (580)
Cash paid for acquisitions, net of cash acquired (2,390) (701) —
Purchases of marketable securities (26,241) (21,183) (14,602)
Proceeds from sales of marketable securities 17,372 20,871 10,485
Proceeds from maturities of marketable securities 1,994 749 642
Other (36) 45 (97)
Net cash used in investing activities (9,990) (786) (4,152)
Cash flows from financing activities:
Net proceeds from issuance of debt 4,933 10,387 2,471
Repayment of debt (123) (2,500) —
Net proceeds from issuance of commercial paper — 762 —
Repayments of commercial paper — (762) —
Repurchases of common stock (4,607) (8,315) (3,786)
Dividends paid (1,118) (500) —
Net proceeds from issuance of common stock in connection withthe Company's equity award programs 1,288 242 80
Other 46 12 3
Net cash provided by (used in) financing activities 419 (674) (1,232)
Increase (decrease) in cash and cash equivalents (3,689) 3,659 403
Cash and cash equivalents at beginning of period 6,946 3,287 2,884
Cash and cash equivalents at end of period $ 3,257 $ 6,946 $ 3,287
See accompanying notes.
7/27/2019 Amgen Inc 2012 Annual Report
http://slidepdf.com/reader/full/amgen-inc-2012-annual-report 106/150
F-7
AMGEN INC.
NOTES TO CONSOLIDATED FINANCIAL STATEMENTS
December31, 2012
1. Summary of significant accounting policies
Business
Amgen Inc. (including its subsidiaries, referred to as “Amgen,” “the Company,” “we,” “our” or “us”) is a global biotechnology
pioneer that discovers, develops, manufactures and delivers innovative human therapeutics. Our medicines help millions of patients
in the fight against cancer, kidney disease, rheumatoid arthritis, bone disease, and other serious illnesses. We operate in one
business segment: human therapeutics.
Principles of consolidation
The consolidated financial statements include the accounts of Amgen as well as its majority-owned subsidiaries. We do not
have any significant interests in variable interest entities that require consolidation. All material intercompany transactions and
balances have been eliminated in consolidation.
Use of estimates
The preparation of consolidated financial statements in conformity with accounting principles generally accepted in the
United States requires management to make estimates and assumptions that affect the amounts reported in the consolidated financial
statements and accompanying notes. Actual results may differ from those estimates.
Product sales
Sales of our products are recognized when shipped and title and risk of loss have passed. Product sales are recorded net of
accruals for estimated rebates, wholesaler chargebacks, discounts and other deductions (collectively “sales deductions”) and returns.
Taxes collected from customers and remitted to government authorities related to the sales of the Company’s products, primarily
in Europe, are excluded from revenues.
With regard to EPOGEN® (epoetin alfa), we have the exclusive right to sell epoetin alfa for dialysis, certain diagnostics and
all non-human, non-research uses in the United States. We granted to Ortho Pharmaceutical Corporation (which has assigned its
rights under the product license agreement to Janssen Biotech, Inc., formerly known as Centocor Ortho Biotech Products, L.P.),a subsidiary of Johnson& Johnson (J&J), a license relating to epoetin alfa for sales in the United States for all human uses except
dialysis and diagnostics. This license agreement, which is perpetual, may be terminated for various reasons, including upon mutual
agreement of the parties, or default. The parties are required to compensate each other for epoetin alfa sales that either party makes
into the other party’s exclusive market, sometimes referred to as “spillover.” Accordingly, we do not recognize product sales we
make into the exclusive market of J&J and do recognize product sales made by J&J into our exclusive market. Sales in our exclusive
market are derived from our sales to our customers, as adjusted for spillover. We are employing an arbitrated audit methodology
to measure each party’s spillover based on estimates of and subsequent adjustments thereto of third-party data on shipments to
and usage by end users.
Other revenues
Other revenues consist primarily of royalty income and corporate partner revenues. Royalties from licensees are based on
third-party sales of licensed products and are recorded in accordance with contract terms when third-party results are reliably
measurable and collectability is reasonably assured. Royalty estimates are made in advance of amounts collected using historical
and forecasted trends. Corporate partner revenues are comprised of amounts earned from Kirin-Amgen, Inc. (K-A) for certain
research and development (R&D) activities, which are earned as the R&D activities are performed. Corporate partner revenues
also include license fees and milestone payments earned from K-A and from third parties. See Multiple-deliverable revenue
arrangements, discussed below, Note 6, Collaborative arrangements, and Note 7, Related party transactions.
Multiple-deliverable revenue arrangements
From time to time, we enter into arrangements for the R&D, manufacture and/or commercialization of products and product
candidates. These arrangements may require us to deliver various rights, services and/or goods across the entire life cycle of a
product or product candidate, including (i)intellectual property rights/licenses, (ii)R&D services, (iii)manufacturing services
and/or (iv)commercialization services. The underlying terms of these arrangements generally provide for consideration to Amgen
7/27/2019 Amgen Inc 2012 Annual Report
http://slidepdf.com/reader/full/amgen-inc-2012-annual-report 107/150
F-8
in the form of non-refundable upfront license payments, R&D and commercial performance milestone payments, cost sharing
and/or royalty payments.
Effective January1, 2011, we adopted a new accounting standard that amends the guidance on the accounting for arrangements
involving the delivery of more than one element. Pursuant to the new standard, each required deliverable is evaluated to determine
whether it qualifies as a separate unit of accounting. For Amgen this determination is generally based on whether the deliverable
has “stand-alone value” to the customer. The arrangement’s consideration that is fixed and determinable is then allocated to each
separate units of accounting based on the relative selling price of each deliverable. The estimated selling price of each deliverableis determined using the following hierarchy of values: (i)vendor-specific objective evidence of fair value, (ii)third-party evidence
of selling price (TPE) and (iii)best estimate of selling price (BESP). The BESP reflects our best estimate of what the selling price
would be if the deliverable was regularly sold by us on a stand-alone basis. In most cases we expect to use TPE or BESP for
allocating consideration to each deliverable. In general, the consideration allocated to each unit of accounting is recognized as
the related goods or services are delivered, limited to the consideration that is not contingent upon future deliverables. The Company
adopted this new accounting standard on a prospective basis for all multiple-deliverable revenue arrangements (MDRAs) entered
into on or after January1, 2011, and for any MDRAs that were entered into prior to January1, 2011, but materially modified on
or after that date. Had the standard been adopted January 1, 2010, the impact on our consolidated financial statements would have
been immaterial.
For MDRAs entered into prior to January1, 2011, and not materially modified thereafter, we continue to apply our prior
accounting policy with respect to such arrangements. Under this policy, in general, revenue from non-refundable, up-front fees
related to intellectual property rights/licenses where we have continuing involvement is recognized ratably over the estimated period of ongoing involvement. In general, the consideration with respect to the other deliverables is recognized when the goods
or services are delivered.
Under all of our MDRAs, consideration associated with at-risk substantive performance milestones is recognized as revenue
upon the achievement of the related milestone, as defined in the respective contracts.
Research and development costs
R&D costs are expensed as incurred and include primarily salaries, benefits and other staff-related costs; facilities and
overhead costs; clinical trial and related clinical manufacturing costs; contract services and other outside costs; information systems’
costs and amortization of acquired technology used in R&D with alternative future uses. R&D expenses also include costs and
cost recoveries associated with third-party R&D arrangements such as with K-A, including upfront fees and milestones paid to
third parties in connection with technologies which had not reached technological feasibility and did not have an alternative future
use. Net payment or reimbursement of R&D costs is recognized when the obligations are incurred or as we become entitled to the
cost recovery. See Note 6, Collaborative arrangements, and Note 7, Related party transactions.
Selling, general and administrative costs
Selling, general and administrative (SG&A) expenses are comprised primarily of salaries, benefits and other staff-related
costs associated with sales and marketing, finance, legal and other administrative personnel; facilities and overhead costs; outside
marketing, advertising and legal expenses; and other general and administrative costs. Advertising costs are expensed as incurred.
SG&A expenses also include costs and cost recoveries associated with marketing and promotion efforts under certain collaboration
arrangements. Net payment or reimbursement of SG&A costs is recognized when the obligations are incurred or we become entitled
to the cost recovery. See Note 6, Collaborative arrangements.
Beginning January1, 2011, SG&A expenses also include amortization of the annual fee mandated by the Patient Protection
and Affordable Care Act and the companion Health Care and Education Reconciliation Act (the U.S. healthcare reform federalexcise fee). The liability for the annual U.S. healthcare reform federal excise fee is estimated and recorded in full upon the first
qualifying sale of our covered products with a corresponding deferred cost established that is amortized on a straight-line basis
over the calendar year that it is payable.
Stock-based compensation
We have stock-based compensation plans under which various types of equity-based awards are granted, including restricted
stock units (RSUs), performance units and stock options. The estimated fair values of RSUs and stock option awards which are
subject only to service conditions with graded vesting are generally recognized as compensation expense on a straight-line basis
over the service period. The estimated fair values of performance unit awards are generally recognized as compensation expense
as the awards vest ratably from the grant date to the end of the performance period. See Note 3, Stock-based compensation.
7/27/2019 Amgen Inc 2012 Annual Report
http://slidepdf.com/reader/full/amgen-inc-2012-annual-report 108/150
F-9
Income taxes
We provide for income taxes based on pretax income, applicable tax rates and tax planning opportunities available in the
various jurisdictions in which we operate.
We recognize the tax benefit from an uncertain tax position only if it is more likely than not that the tax position will be
sustained upon examination by the taxing authorities based on the technical merits of the position. The tax benefit recognized in
the financial statements for a particular tax position is based on the largest benefit that is more likely than not to be realized. Theamount of unrecognized tax benefits (UTBs) is adjusted as appropriate for changes in facts and circumstances, such as significant
amendments to existing tax law, new regulations or interpretations by the taxing authorities, new information obtained during a
tax examination, or resolution of an examination. We recognize both accrued interest and penalties, where appropriate, related to
UTBs in income tax expense. See Note 4, Income taxes.
Business combinations
Business combinations are accounted for using the acquisition method of accounting. Under the acquisition method, assets
acquired, including in-process research and development (IPR&D) projects, and liabilities assumed are recorded at their respective
fair values as of the acquisition date in our consolidated financial statements. The excess of the fair value of consideration transferred
over the fair value of the net assets acquired is recorded as goodwill. Contingent consideration obligations incurred in connection
with a business combination are recorded at their fair values on the acquisition date and remeasured at their fair values each
subsequent reporting period until the related contingencies are resolved. The resulting changes in fair values are recorded in
earnings. See Note 2, Business combinations, and Note 16, Fair value measurement.
Cash equivalents
We consider cash equivalents to be only those investments which are highly liquid, readily convertible to cash and which
mature within three months from the date of purchase.
Available-for-sale investments
We consider our investment portfolio available-for-sale and, accordingly, these investments are recorded at fair value with
unrealized gains and losses generally recorded in other comprehensive income. See Note 9, Available-for-sale investments, and
Note 16, Fair value measurement.
Inventories
Inventories are stated at the lower of cost or market. Cost, which includes amounts related to materials, labor and overhead,
is determined in a manner that approximates the first-in, first-out method. Cost also includes the Puerto Rico excise tax enacted
in 2011 related to our manufacturing operations in Puerto Rico. See Note 10, Inventories.
Derivatives
We recognize all of our derivative instruments as either assets or liabilities at fair value in the Consolidated Balance Sheets.
The accounting for changes in the fair value of a derivative instrument depends upon whether it has been formally designated and
qualifies as part of a hedging relationship under the applicable accounting standards and, further, on the type of hedging relationship.
For derivatives formally designated as hedges, we assess both at inception and quarterly thereafter, whether the hedging derivatives
are highly effective in offsetting changes in either the fair value or cash flows of the hedged item. Our derivatives that are not
designated and do not qualify as hedges are adjusted to fair value through current earnings. See Note 16, Fair value measurement,
and Note 17, Derivative instruments.
Property, plant and equipment, net
Property, plant and equipment is recorded at historical cost, net of accumulated depreciation, amortization and, if applicable,
impairment charges. We review our property, plant and equipment assets for impairment whenever events or changes in
circumstances indicate that the carrying amount of an asset may not be recoverable. Depreciation is provided over the assets’ useful
lives on a straight-line basis. Leasehold improvements are amortized on a straight-line basis over the shorter of their estimated
useful lives or lease terms. See Note 11, Property, plant and equipment.

7/27/2019 Amgen Inc 2012 Annual Report
http://slidepdf.com/reader/full/amgen-inc-2012-annual-report 109/150
F-10
Goodwill and other intangible assets
Finite-lived intangible assets are recorded at cost, net of accumulated amortization and, if applicable, impairment charges.
Amortization of finite-lived intangible assets is provided over their estimated useful lives on a straight-line basis. We review our
finite-lived intangible assets for impairment whenever events or changes in circumstances indicate that the carrying amount of an
asset may not be recoverable. See Note 12, Goodwill and other intangible assets.
The estimated fair values of IPR&D projects acquired in a business combination which have not reached technologicalfeasibility are capitalized and accounted for as indefinite-lived intangible assets until completion or abandonment of the related
R&D efforts. Upon successful completion of the project, the capitalized amount is amortized over its estimated useful life. If a
project is abandoned, all remaining capitalized amounts are written-off immediately. There are often major risks and uncertainties
associated with IPR&D projects as we are required to obtain regulatory approvals in order to be able to market these products.
Such approvals require completing clinical trials that demonstrate a product candidate is safe and effective. Consequently, the
eventual realized value of the acquired IPR&D project may vary from its estimated fair value at the date of acquisition, and IPR&D
impairment charges may occur in future periods.
Capitalized IPR&D projects are tested for impairment annually and whenever events or changes in circumstances indicate
that the carrying amount may not be recoverable. We consider various factors for potential impairment including the current legal
and regulatory environment and the competitive landscape. Adverse clinical trial results, significant delays in obtaining market
approval and the inability to bring a product to market could result in the related intangible assets to be partially or fully impaired.
We perform an impairment test of goodwill annually and whenever events or changes in circumstances indicate that the
carrying amount may not be recoverable. To date, an impairment of goodwill has not been recorded. See Note 12, Goodwill and
other intangible assets.
Contingencies
In the ordinary course of business, we are involved in various legal proceedings and other matters such as intellectual property
disputes, contractual disputes, governmental investigations and class action suits which are complex in nature and have outcomes
that are difficult to predict. Certain of these proceedings are discussed in Note 18, Contingencies and commitments. We record
accruals for loss contingencies to the extent that we conclude that it is probable that a liability has been incurred and the amount
of the related loss can be reasonably estimated. We consider all relevant factors when making assessments regarding these
contingencies.
While it is not possible to accurately predict or determine the eventual outcomes of these items, an adverse determinationin one or more of these items currently pending could have a material adverse effect on our consolidated results of operations,
financial position or cash flows.
Convertible debt
The debt and equity components of convertible debt instruments that may be partially or wholly cash settled (cash settleable
convertible notes), including our 0.375% 2013 Convertible Notes, are bifurcated and accounted for separately. The debt component
of cash settleable convertible notes, which excludes the associated equity conversion option, is recorded at fair value as of the
issuance date. The difference between the amount allocated to the debt component and the proceeds received upon issuance of the
debt is allocated to the equity component and recorded in Common stock and additional paid-in capital in the Consolidated Balance
Sheets. The reduced or discounted carrying value of cash settleable convertible notes resulting from bifurcation is subsequently
accreted back to its principal amount through the recognition of non-cash interest expense. This results in recognizing interest
expense on the borrowing at an effective rate approximating what would have been incurred had nonconvertible debt with otherwise
similar terms been issued. See Note 14, Financing arrangements.
Foreign currency translation
The net assets of international subsidiaries where the local currencies have been determined to be the functional currencies
are translated into U.S. dollars using current exchange rates. The U.S. dollar effects that arise from translating net assets of these
subsidiaries at changing rates are recognized in other comprehensive income. The earnings of these subsidiaries are translated into
U.S. dollars using average exchange rates.
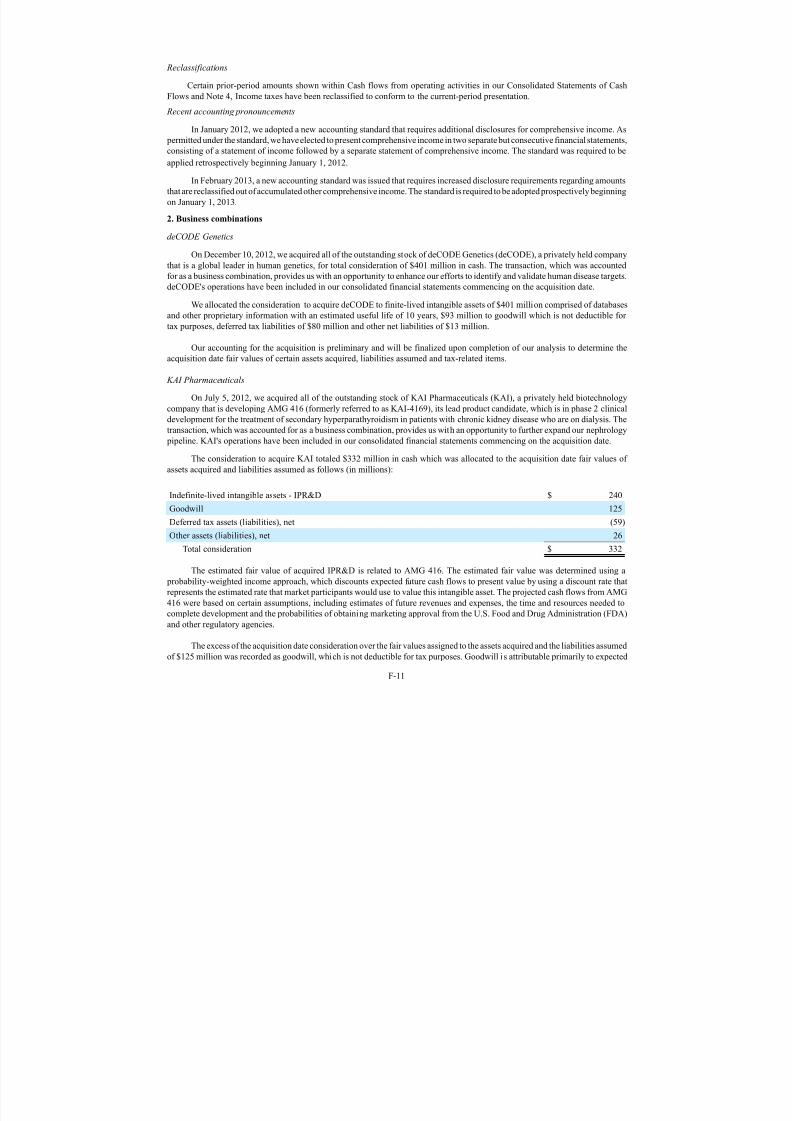
7/27/2019 Amgen Inc 2012 Annual Report
http://slidepdf.com/reader/full/amgen-inc-2012-annual-report 110/150
F-11
Reclassifications
Certain prior-period amounts shown within Cash flows from operating activities in our Consolidated Statements of Cash
Flows and Note 4, Income taxes have been reclassified to conform to the current-period presentation.
Recent accounting pronouncements
In January 2012, we adopted a new accounting standard that requires additional disclosures for comprehensive income. As
permitted under the standard, we have elected to present comprehensive income in two separate but consecutive financial statements,
consisting of a statement of income followed by a separate statement of comprehensive income. The standard was required to be
applied retrospectively beginning January1, 2012.
In February 2013, a new accounting standard was issued that requires increased disclosure requirements regarding amounts
that are reclassified out of accumulated other comprehensive income. The standard is required to be adopted prospectively beginning
on January 1, 2013.
2. Business combinations
deCODE Genetics
On December 10, 2012, we acquired all of the outstanding stock of deCODE Genetics (deCODE), a privately held company
that is a global leader in human genetics, for total consideration of $401 million in cash. The transaction, which was accounted
for as a business combination, provides us with an opportunity to enhance our efforts to identify and validate human disease targets.deCODE's operations have been included in our consolidated financial statements commencing on the acquisition date.
We allocated the consideration to acquire deCODE to finite-lived intangible assets of $401 million comprised of databases
and other proprietary information with an estimated useful life of 10 years, $93 million to goodwill which is not deductible for
tax purposes, deferred tax liabilities of $80 million and other net liabilities of $13 million.
Our accounting for the acquisition is preliminary and will be finalized upon completion of our analysis to determine the
acquisition date fair values of certain assets acquired, liabilities assumed and tax-related items.
KAI Pharmaceuticals
On July5, 2012, we acquired all of the outstanding stock of KAI Pharmaceuticals (KAI), a privately held biotechnology
company that is developing AMG 416 (formerly referred to as KAI-4169), its lead product candidate, which is in phase 2 clinicaldevelopment for the treatment of secondary hyperparathyroidism in patients with chronic kidney disease who are on dialysis. The
transaction, which was accounted for as a business combination, provides us with an opportunity to further expand our nephrology
pipeline. KAI's operations have been included in our consolidated financial statements commencing on the acquisition date.
The consideration to acquire KAI totaled $332 million in cash which was allocated to the acquisition date fair values of
assets acquired and liabilities assumed as follows (in millions):
Indefinite-lived intangible assets - IPR&D $ 240
Goodwill 125
Deferred tax assets (liabilities), net (59)
Other assets (liabilities), net 26
Total consideration $ 332
The estimated fair value of acquired IPR&D is related to AMG 416. The estimated fair value was determined using a
probability-weighted income approach, which discounts expected future cash flows to present value by using a discount rate that
represents the estimated rate that market participants would use to value this intangible asset. The projected cash flows from AMG
416 were based on certain assumptions, including estimates of future revenues and expenses, the time and resources needed to
complete development and the probabilities of obtaining marketing approval from the U.S. Food and Drug Administration (FDA)
and other regulatory agencies.
The excess of the acquisition date consideration over the fair values assigned to the assets acquired and the liabilities assumed
of $125 million was recorded as goodwill, which is not deductible for tax purposes. Goodwill is attributable primarily to expected

7/27/2019 Amgen Inc 2012 Annual Report
http://slidepdf.com/reader/full/amgen-inc-2012-annual-report 111/150
F-12
synergies and other benefits from combining KAI with our nephrology development and commercialization activities and the
deferred tax consequences of indefinite-lived intangible assets recorded for financial statement purposes.
Our accounting for this acquisition is preliminary and will be finalized upon completion of our analysis to determine the
acquisition date fair values of certain assets acquired, liabilities assumed and tax-related items.
Mustafa Nevzat PharmaceuticalsOn June12, 2012, we acquired substantially all of the outstanding stock of Mustafa Nevzat Pharmaceuticals (MN), a
privately held company that is a leading supplier of pharmaceuticals to the hospital sector and a major supplier of injectable
medicines in Turkey. The transaction, which was accounted for as a business combination, provides us with the opportunity to
expand our presence in Turkey and the surrounding region. MN's operations have been included in our consolidated financial
statements commencing on the acquisition date.
The consideration to acquire MN totaled $677 million in cash which was allocated to the acquisition date fair values of
assets acquired and liabilities assumed as follows (in millions):
Finite-lived intangible assets $ 163
Property, plant and equipment 100
Trade receivables 79Inventories 52
Goodwill 380
Deferred tax assets (liabilities), net (45)
Other assets (liabilities), net (52)
Total consideration $ 677
The finite-lived intangible assets acquired are related primarily to the fair values of MN's regulatory approvals and customer
relationships with regard to the marketing of pharmaceutical products and are being amortized on a straight-line basis over their
estimated useful lives. The weighted-average useful life of these intangible assets is eight years.
The excess of the acquisition date consideration over the fair values assigned to the assets acquired and the liabilities assumed
of $380 million was recorded as goodwill, which is not deductible for tax purposes. Goodwill is attributable primarily to MN'sexpected continued commercial presence in Turkey and other benefits.
Our accounting for the acquisition is preliminary and will be finalized upon completion of our analysis to determine the
acquisition date fair values of certain assets acquired, liabilities assumed and tax-related items.
Micromet, Inc.
On March7, 2012, we acquired Micromet, Inc. (Micromet), a publicly held biotechnology company focused on the discovery,
development and commercialization of innovative antibody-based therapies for the treatment of cancer, which became a wholly
owned subsidiary of Amgen. This transaction, which was accounted for as a business combination, provides us with an opportunity
to further expand our oncology pipeline. Micromet's operations have been included in our consolidated financial statements
commencing on the acquisition date.

7/27/2019 Amgen Inc 2012 Annual Report
http://slidepdf.com/reader/full/amgen-inc-2012-annual-report 112/150
F-13
The consideration to acquire Micromet totaled $1,146 million in cash which was allocated to the acquisition date fair values
of assets acquired and liabilities assumed as follows (in millions):
Indefinite-lived intangible assets:
IPR&D $ 440
Contract assets 170
Finite-lived intangible assets — Developed technology 350
Goodwill 330
Cash and marketable securities 154
Deferred tax assets (liabilities), net (274)
Other assets (liabilities), net (24)
Total consideration $ 1,146
The estimated fair value of acquired IPR&D is related to blinatumomab, which is in phase 2 clinical development for the
treatment of acute lymphoblastic leukemia. The estimated fair value was determined using a probability-weighted income approach,
which discounts expected future cash flows to present value by using a discount rate that represents the estimated rate that market
participants would use to value this intangible asset. The projected cash flows from blinatumomab were based on certain
assumptions, including estimates of future revenues and expenses, the time and resources needed to complete development andthe probabilities of obtaining marketing approval from the FDA and other regulatory agencies.
Contract assets acquired represent the aggregate estimated fair values of receiving future milestone and royalty payments
associated with various outlicensing arrangements entered into by Micromet prior to our acquisition of the company. The fair
values of these contracts were determined by estimating the probability-weighted net cash flows associated with the agreements
that may be received from the other parties discounted to present value by using a discount rate that represents the estimated rate
that market participants would use to value these intangible assets. These contract assets are considered indefinite-lived intangible
assets and their assigned values will be expensed when the related revenues are earned or the associated R&D efforts are abandoned
by the licensees. During 2012, a non-key program under one of these outlicensing arrangements was terminated and resulted in
an impairment charge of $19 million which was included in Other operating expenses.
The developed technology acquired relates to Micromet's bi-specific T-cell engager technology platform which has produced
various product candidates that are currently being developed as cancer treatments by Micromet and others and may lead to thedevelopment of additional product candidates. The fair value of this technology was determined by estimating the probability-
weighted net cash flows attributable to this technology discounted to present value by using a discount rate that represents the
estimated rate that market participants would use to value this intangible asset. The fair value of this technology is being amortized
on a straight-line basis over its estimated useful life of 10 years.
The excess of the acquisition date consideration over the fair values assigned to the assets acquired and the liabilities assumed
of $330 million was recorded as goodwill, which is not deductible for tax purposes. Goodwill is attributable primarily to expected
synergies and other benefits from combining Micromet with our oncology development and commercialization activities and the
deferred tax consequences of indefinite-lived and finite-lived intangible assets recorded for financial statement purposes.
BioVex Group, Inc.
On March4, 2011, we acquired all of the outstanding stock of BioVex Group, Inc. (BioVex), a privately held biotechnology
company developing treatments for cancer and for the prevention of infectious disease, including talimogene laherparepvec, anovel oncolytic vaccine in phase 3 clinical development for the treatment of malignant melanoma. The transaction, which was
accounted for as a business combination, provides us with an opportunity to expand our efforts to bring novel therapeutics to
market. Upon its acquisition, BioVex became a wholly owned subsidiary of Amgen, and its operations have been included in our
consolidated financial statements commencing on the acquisition date.
The aggregate acquisition date consideration to acquire BioVex consisted of (in millions):
Cash paid to former shareholders of BioVex $ 407
Fair value of contingent consideration obligations 190
Total consideration $ 597

7/27/2019 Amgen Inc 2012 Annual Report
http://slidepdf.com/reader/full/amgen-inc-2012-annual-report 113/150
F-14
In connection with this acquisition, we are obligated to make additional payments to the former shareholders of BioVex of
up to $575 million contingent upon the achievement of various regulatory and sales milestones with regard to talimogene
laherparepvec, including the filing of a Biologics License Application (BLA) with the FDA; the first commercial sale in each of
the United States and the European Union (EU) following receipt of marketing approval, which includes use of the product in
specified patient populations; and upon achieving specified levels of sales. The estimated fair values of the contingent consideration
obligations aggregated $190 million as of the acquisition date and were determined using a combination of valuation techniques.
(See Note 16, Fair value measurement for information regarding the estimated fair values of these obligations as of December 31,2012.) The contingent consideration obligations to make regulatory milestone payments were valued based on assumptions
regarding the probability of achieving the milestones and making the related payments, with such amounts discounted to present
value based on our credit risk. The contingent consideration obligations to make sales milestone payments were valued based on
assumptions regarding the probability of achieving specified product sales thresholds to determine the required payments, with
such amounts discounted to present value based on our credit risk.
We allocated the total consideration to the acquisition date fair values of assets acquired and liabilities assumed as follows
(in millions):
Indefinite-lived intangible assets — IPR&D $ 675
Goodwill 170
Deferred tax assets (liabilities), net (246)
Other assets (liabilities), net (2)
Total consideration $ 597
The estimated fair value of acquired IPR&D is related to talimogene laherparepvec. The estimated fair value was determined
using a probability-weighted income approach, which discounts expected future cash flows to present value by using a discount
rate that represents the estimated rate that market participants would use to value this intangible asset. The projected cash flows
from talimogene laherparepvec were based on certain assumptions, including estimates of future revenue and expenses, the time
and resources needed to complete development and the probabilities of obtaining marketing approval from the FDA and other
regulatory agencies.
The excess of the acquisition date consideration over the fair values assigned to the assets acquired and the liabilities assumed
of $170 million was recorded as goodwill, which is not deductible for tax purposes. Goodwill is attributable primarily to the
deferred tax consequences of acquired IPR&D recorded for financial statement purposes.
Other acquisitions
We also acquired the businesses described below, which were accounted for as business combinations, and accordingly, their
operations have been included in our consolidated financial statements commencing on their respective acquisition dates.
On April7, 2011, we acquired all of the outstanding stock of Laboratório Químico Farmacêutico Bérgamo Ltda (Bergamo),
a privately held Brazilian pharmaceutical company. Upon its acquisition, Bergamo became a wholly owned subsidiary of Amgen.
On May16, 2011, we acquired a manufacturing facility in Dun Laoghaire, Ireland, from Pfizer Inc. (Pfizer) (Dun Laoghaire).
Under the terms of the agreement, most staff at the facility became Amgen employees, and we agreed to manufacture certain
products for Pfizer at the facility for a certain period.
On June15, 2011, we reacquired rights to distribute certain of our products in the Brazilian pharmaceutical market from our
local distributor in Brazil and its parent company, Hypermarcas, and in connection therewith acquired all business operationsrelated to these products in Brazil.
The aggregate acquisition date consideration for these businesses was approximately $453 million, composed primarily of
cash paid to the former owners of the businesses. The aggregate acquisition date consideration was allocated to (i)goodwill of
$265 million, of which $130 million related to Bergamo was tax deductible: (ii)property, plant and equipment of $99 million;
(iii)amortizable intangible assets composed primarily of licenses to distribute products and customer contracts of $58 million;
and (iv)other assets, net of $31 million. Goodwill resulting from these acquisitions is attributable primarily to the benefits of
immediate, direct access to the Brazilian market for expediting our international expansion efforts and geographic diversification
to assist in risk mitigation efforts related to our manufacturing operations.

7/27/2019 Amgen Inc 2012 Annual Report
http://slidepdf.com/reader/full/amgen-inc-2012-annual-report 114/150
F-15
The estimated incremental R&D costs to be incurred to obtain necessary regulatory approvals for the IPR&D projects in the
acquisitions discussed above, including AMG 416, blinatumomab and talimogene laherparepvec, are individually immaterial in
any given year. The major risks and uncertainties associated with the timely and successful completion of development and
commercialization of these product candidates include our ability to confirm their safety and efficacy based on data from clinical
trials, our ability to obtain necessary regulatory approvals and our ability to successfully complete these tasks within budgeted
costs. We are not able to market a human therapeutic without obtaining regulatory approvals, and such approvals require completing
clinical trials that demonstrate a product candidate is safe and effective. Consequently, the eventual realized value, if any, of theseacquired IPR&D projects may vary from their estimated fair values at the dates of acquisition.
The preliminary fair value estimates of assets acquired and liabilities assumed with respect to the acquisitions of deCODE,
KAI, and MN were based on preliminary calculations and valuations. Our estimates and assumptions for each of these acquisitions,
particularly with respect to identifiable intangible assets acquired and tax-related items, are subject to change as we obtain additional
information for our estimates during the respective measurement periods (up to one year from the respective acquisition dates).
The operations of each of the acquired businesses discussed above were not material individually or in the aggregate to our
consolidated financial statements. Pro forma supplemental consolidated results of operations for the years ended December31,
2012, 2011 and 2010, that assumes the acquisitions of the businesses discussed above all occurred on January1 of the year prior
to the year of acquisition are not provided because the impact would not be material to our consolidated results of operations either
individually or in the aggregate.
3. Stock-based compensation
Our 2009 Equity Incentive Plan (the 2009 Plan) authorizes the issuance of 100 million shares of our common stock through
grants of equity-based awards, including RSUs, stock options and performance units to employees and consultants of Amgen, its
subsidiaries and non-employee members of our Board of Directors. The 2009 Plan, which was approved by our stockholders on
May 6, 2009, replaced our prior equity plans (the Prior Plans), and no further awards may be made under these Prior Plans. Under
the terms of the 2009 Plan, the pool of available shares that may be used for all types of awards, including those issued under our
Prior Plans after December 31, 2008, and before May 6, 2009 (the stub period), is reduced by one share for each stock option
granted and by 1.9 shares for other types of awards granted, including RSUs and performance units. If any shares subject to an
award granted under our Prior Plans during the stub period or any awards granted under the 2009 Plan expire, or are forfeited,
terminated or cancelled without the issuance of shares, the shares subject to such awards are added back to the pool of available
shares under the 2009 Plan on the same basis that they were removed. As of December31, 2012, the 2009 Plan provides for future
grants and/or issuances of up to approximately 48 million shares of our common stock. Stock-based awards under our employee
compensation plans are made with newly issued shares reserved for this purpose.
The following table reflects the components of stock-based compensation expense recognized in our Consolidated Statements
of Income for the years ended December31, 2012, 2011 and 2010 (in millions):
2012 2011 2010
Stock options $ 59 $ 85 $ 124
RSUs 186 188 182
Performance units 117 68 47
Total stock-based compensation expense, pretax 362 341 353
Tax benefit from stock-based compensation expense (134) (124) (120)
Total stock-based compensation expense, net of tax $ 228 $ 217 $ 233
Restricted stock units and stock options
Eligible employees generally receive a grant of RSUs annually with the size and type of award generally determined by the
employee’s salary grade and performance level. In addition, certain management and professional level employees typically receive
RSU grants upon commencement of employment. Prior to 2012, eligible employees also received a grant of stock options annually.
Prior to February 2013, non-employee members of our Board of Directors (outside directors) received a grant of RSUs and stock
options annually and received a grant of stock options in connection with their appointment to the Board of Directors. Beginning
in April 2013, outside directors will receive only annual grants of RSUs.
Our RSU and stock option grants provide for accelerated or continued vesting in certain circumstances as defined in the
plans and related grant agreements, including upon death, disability, a change in control, termination in connection with a change

7/27/2019 Amgen Inc 2012 Annual Report
http://slidepdf.com/reader/full/amgen-inc-2012-annual-report 115/150
F-16
in control and the retirement of employees who meet certain service and/or age requirements. RSUs and stock options granted
prior to April25, 2011, generally vest in equal amounts on each of the first four anniversaries of the grant date. Stock options and
RSUs granted on and after April25, 2011, generally vest in approximately equal amounts on the second, third and fourth
anniversaries of the grant date. RSUs granted on and after April 27, 2012, accrue dividend equivalents which are typically payable
in shares only when and to the extent the underlying RSUs vest and are issued to the recipient.
Stock options
The exercise price for stock options is set at the closing price of our common stock on the date of grant and the related
number of shares granted is fixed at that point in time. Awards granted to employees on and after April26, 2010, expire 10 years
from the date of grant; options granted to employees prior to that date expire seven years from the date of grant.
We use an option valuation model to estimate the grant date fair value of stock options. The weighted-average assumptions
used in the option valuation model and the resulting weighted-average estimated grant date fair values of stock options were as
follows for the years ended December 31, 2012, 2011 and 2010:
2012 2011 2010
Closing price of our common stock on grant date $ 74.56 $ 54.66 $ 58.32
Expected volatility 22.2% 23.5% 28.0%
Expected life (in years) 8.1 5.9 6.6Risk-free interest rate 1.6% 2.5% 3.2%
Expected dividend yield 2.1% 2.0% 0%
Fair value of stock options granted $ 14.65 $ 11.39 $ 20.97
The expected volatility reflects consideration of the implied volatility in publicly traded instruments associated with Amgen’s
common stock during the period the options were granted. We believe implied volatility in these instruments is more indicative
of expected future volatility than the historical volatility in the price of our common stock. We use historical data to estimate the
expected life of the options. The risk-free interest rates for periods within the expected life of the option are based on the U.S.
Treasury yield curve in effect during the period the options were granted. The expected dividend yield for options granted on and
after April25, 2011, was based on expectations regarding our policy of paying dividends announced in April 2011.
The following summarizes select information regarding our stock options during the year ended December 31, 2012:
Options(inmillions)
Weighted-average
exerciseprice
Weighted-average
remainingcontractuallife (years)
Aggregateintrinsic
value(inmillions)
Balance unexercised at December 31, 2011 34.2 $ 59.11
Granted 0.1 $ 74.56
Exercised (20.9) $ 60.67
Expired/forfeited (1.1) $ 63.97
Balance unexercised at December 31, 2012 12.3 $ 56.09 4.9 $ 371
Vested or expected to vest at December 31, 2012 12.2 $ 56.10 4.9 $ 367
Exercisable at December 31, 2012 6.3 $ 56.59 3.1 $ 187
The total intrinsic values of options exercised during the years ended December 31, 2012, 2011 and 2010, were $320 million,
$47 million and $15 million, respectively. The actual tax benefits realized from tax deductions from option exercises during the
three years ended December 31, 2012, 2011 and 2010, were $117 million, $14 million and $5 million, respectively.
Restricted stock units
The grant date fair value of an RSU equaled the closing price of our common stock on the grant date for RSUs granted prior
to April 25, 2011, and on and after April 27, 2012. Prior to April 2011, we did not have a policy of paying dividends, and beginning
April 27, 2012, RSUs granted accrue dividend equivalents during the vesting period. The fair values of RSUs granted on April25,
2011 through April 26, 2012, are based on the closing price of our common stock on the grant date reduced by the weighted-
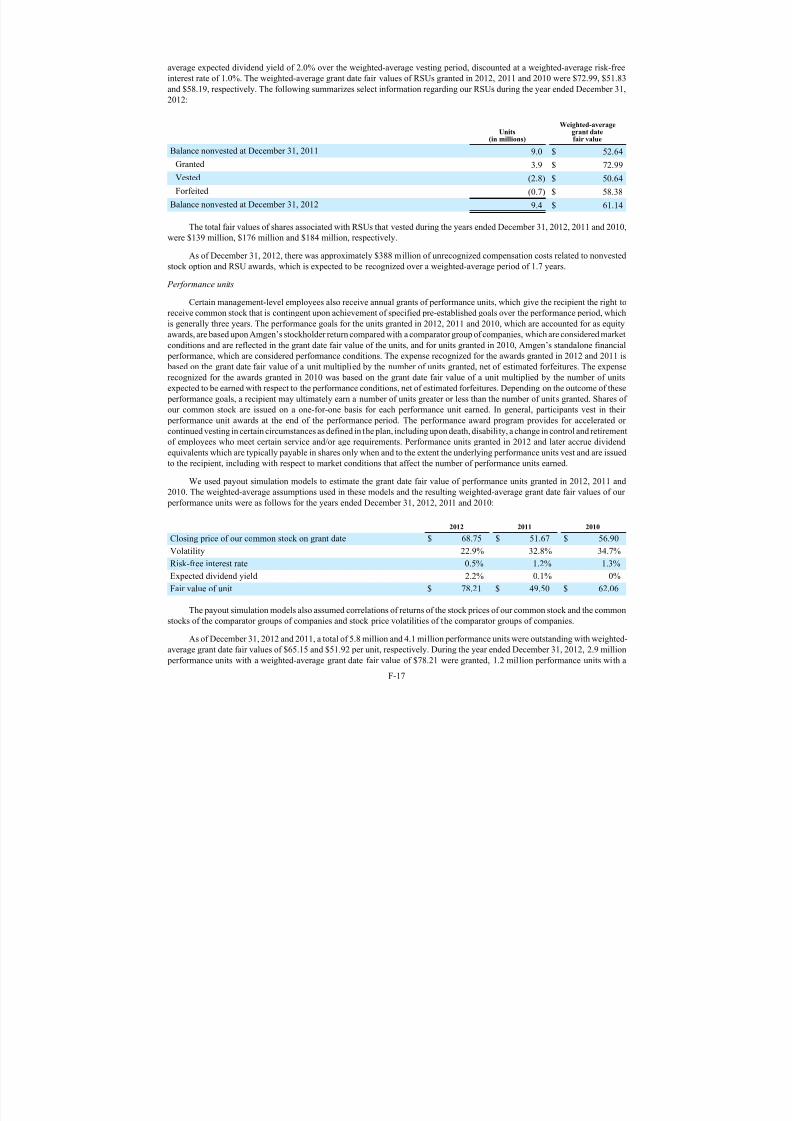
7/27/2019 Amgen Inc 2012 Annual Report
http://slidepdf.com/reader/full/amgen-inc-2012-annual-report 116/150
F-17
average expected dividend yield of 2.0% over the weighted-average vesting period, discounted at a weighted-average risk-free
interest rate of 1.0%. The weighted-average grant date fair values of RSUs granted in 2012, 2011 and 2010 were $72.99, $51.83
and $58.19, respectively. The following summarizes select information regarding our RSUs during the year ended December31,
2012:
Units(inmillions)
Weighted-averagegrantdatefairvalue
Balance nonvested at December 31, 2011 9.0 $ 52.64
Granted 3.9 $ 72.99
Vested (2.8) $ 50.64
Forfeited (0.7) $ 58.38
Balance nonvested at December 31, 2012 9.4 $ 61.14
The total fair values of shares associated with RSUs that vested during the years ended December 31, 2012, 2011 and 2010,
were $139 million, $176 million and $184 million, respectively.
As of December 31, 2012, there was approximately $388 million of unrecognized compensation costs related to nonvested
stock option and RSU awards, which is expected to be recognized over a weighted-average period of 1.7 years.
Performance units
Certain management-level employees also receive annual grants of performance units, which give the recipient the right to
receive common stock that is contingent upon achievement of specified pre-established goals over the performance period, which
is generally three years. The performance goals for the units granted in 2012, 2011 and 2010, which are accounted for as equity
awards, are based upon Amgen’s stockholder return compared with a comparator group of companies, which are considered market
conditions and are reflected in the grant date fair value of the units, and for units granted in 2010, Amgen’s standalone financial
performance, which are considered performance conditions. The expense recognized for the awards granted in 2012 and 2011 is
based on the grant date fair value of a unit multiplied by the number of units granted, net of estimated forfeitures. The expense
recognized for the awards granted in 2010 was based on the grant date fair value of a unit multiplied by the number of units
expected to be earned with respect to the performance conditions, net of estimated forfeitures. Depending on the outcome of these
performance goals, a recipient may ultimately earn a number of units greater or less than the number of units granted. Shares of
our common stock are issued on a one-for-one basis for each performance unit earned. In general, participants vest in their performance unit awards at the end of the performance period. The performance award program provides for accelerated or
continued vesting in certain circumstances as defined in the plan, including upon death, disability, a change in control and retirement
of employees who meet certain service and/or age requirements. Performance units granted in 2012 and later accrue dividend
equivalents which are typically payable in shares only when and to the extent the underlying performance units vest and are issued
to the recipient, including with respect to market conditions that affect the number of performance units earned.
We used payout simulation models to estimate the grant date fair value of performance units granted in 2012, 2011 and
2010. The weighted-average assumptions used in these models and the resulting weighted-average grant date fair values of our
performance units were as follows for the years ended December31, 2012, 2011 and 2010:
2012 2011 2010
Closing price of our common stock on grant date $ 68.75 $ 51.67 $ 56.90
Volatility 22.9% 32.8% 34.7%
Risk-free interest rate 0.5% 1.2% 1.3%
Expected dividend yield 2.2% 0.1% 0%
Fair value of unit $ 78.21 $ 49.50 $ 62.06
The payout simulation models also assumed correlations of returns of the stock prices of our common stock and the common
stocks of the comparator groups of companies and stock price volatilities of the comparator groups of companies.
As of December31, 2012 and 2011, a total of 5.8 million and 4.1 million performance units were outstanding with weighted-
average grant date fair values of $65.15 and $51.92 per unit, respectively. During the year ended December31, 2012, 2.9 million
performance units with a weighted-average grant date fair value of $78.21 were granted, 1.2 million performance units with a

7/27/2019 Amgen Inc 2012 Annual Report
http://slidepdf.com/reader/full/amgen-inc-2012-annual-report 117/150
F-18
grant date fair value of $62.06 vested and 0.4 million performance units with a weighted-average grant date fair value of $62.60
were forfeited.
The total fair values of performance units that vested during 2012, 2011 and 2010 were $100 million, $25 million and $34
million, respectively, based upon the number of performance units earned multiplied by the closing stock price of our common
stock on the last day of the performance period.
As of December31, 2012, there was approximately $179 million of unrecognized compensation cost related to the 2012and 2011 performance unit grants that is expected to be recognized over a weighted-average period of approximately 1.0 years.
4. Income taxes
The provision for income taxes includes the following for the years ended December31, 2012, 2011 and 2010 (in millions):
2012 2011 2010
Current provision:
Federal $ 438 $ 551 $ 620
State 47 54 52
Foreign 158 148 153
Total current provision 643 753 825Deferred provision (benefit):
Federal 83 (273) (180)
State (43) (12) 43
Foreign (19) (1) 2
Total deferred provision (benefit) 21 (286) (135)
Total provision $ 664 $ 467 $ 690
Deferred income taxes reflect the tax effect of temporary differences between the carrying amounts of assets and liabilities
for financial reporting purposes and the amounts used for income tax purposes, tax credit carryforwards and the tax effects of net
operating loss (NOL) carryforwards.
In 2012, we reclassified the prepaid taxes associated with intercompany profit in ending inventory from current deferred
income tax assets to current prepaid tax. This change resulted in a reclassification of approximately $71 million and $16 million
for 2011 and 2010, respectively, from the deferred provision to the current provision.
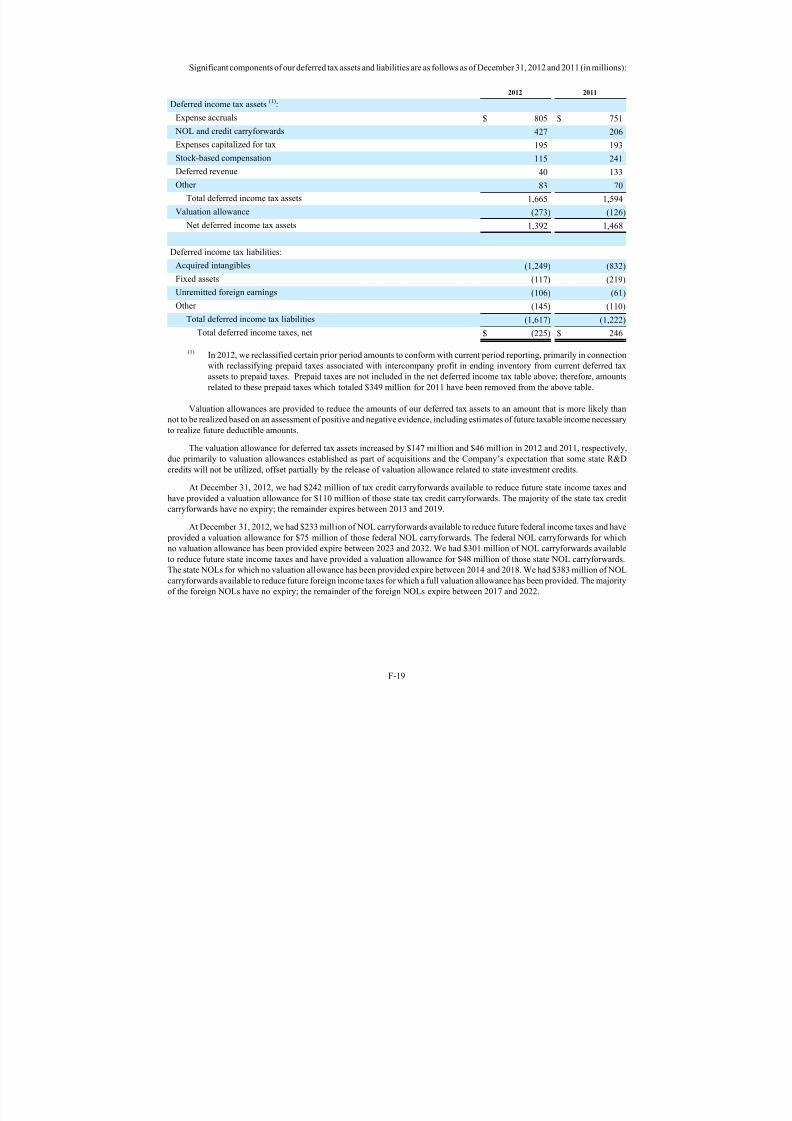
7/27/2019 Amgen Inc 2012 Annual Report
http://slidepdf.com/reader/full/amgen-inc-2012-annual-report 118/150
F-19
Significant components of our deferred tax assets and liabilities are as follows as of December31, 2012 and 2011 (in millions):
2012 2011
Deferred income tax assets (1):
Expense accruals $ 805 $ 751
NOL and credit carryforwards 427 206
Expenses capitalized for tax 195 193
Stock-based compensation 115 241
Deferred revenue 40 133
Other 83 70
Total deferred income tax assets 1,665 1,594
Valuation allowance (273) (126)
Net deferred income tax assets 1,392 1,468
Deferred income tax liabilities:
Acquired intangibles (1,249) (832)
Fixed assets (117) (219)
Unremitted foreign earnings (106) (61)
Other (145) (110)
Total deferred income tax liabilities (1,617) (1,222)
Total deferred income taxes, net $ (225) $ 246
(1) In 2012, we reclassified certain prior period amounts to conform with current period reporting, primarily in connection
with reclassifying prepaid taxes associated with intercompany profit in ending inventory from current deferred tax
assets to prepaid taxes. Prepaid taxes are not included in the net deferred income tax table above; therefore, amounts
related to these prepaid taxes which totaled $349 million for 2011 have been removed from the above table.
Valuation allowances are provided to reduce the amounts of our deferred tax assets to an amount that is more likely thannot to be realized based on an assessment of positive and negative evidence, including estimates of future taxable income necessary
to realize future deductible amounts.
The valuation allowance for deferred tax assets increased by $147 million and $46 million in 2012 and 2011, respectively,
due primarily to valuation allowances established as part of acquisitions and the Company’s expectation that some state R&D
credits will not be utilized, offset partially by the release of valuation allowance related to state investment credits.
At December31, 2012, we had $242 million of tax credit carryforwards available to reduce future state income taxes and
have provided a valuation allowance for $110 million of those state tax credit carryforwards. The majority of the state tax credit
carryforwards have no expiry; the remainder expires between 2013 and 2019.
At December31, 2012, we had $233 million of NOL carryforwards available to reduce future federal income taxes and have
provided a valuation allowance for $75 million of those federal NOL carryforwards. The federal NOL carryforwards for which
no valuation allowance has been provided expire between 2023 and 2032. We had $301 million of NOL carryforwards availableto reduce future state income taxes and have provided a valuation allowance for $48 million of those state NOL carryforwards.
The state NOLs for which no valuation allowance has been provided expire between 2014 and 2018. We had $383 million of NOL
carryforwards available to reduce future foreign income taxes for which a full valuation allowance has been provided. The majority
of the foreign NOLs have no expiry; the remainder of the foreign NOLs expire between 2017 and 2022.

7/27/2019 Amgen Inc 2012 Annual Report
http://slidepdf.com/reader/full/amgen-inc-2012-annual-report 119/150
F-20
The reconciliation of the total gross amounts of UTBs (excluding interest, penalties, foreign tax credits and the federal tax
benefit of state taxes related to UTBs) for the years ended December31, 2012, 2011 and 2010 is as follows (in millions):
2012 2011 2010
Balance at beginning of year $ 975 $ 920 $ 1,140
Additions based on tax positions related to the current year 300 283 305
Reductions for tax positions of prior years (45) (7) (110)
Settlements (30) (221) (415)
Balance at end of year $ 1,200 $ 975 $ 920
Substantially all of the UTBs as of December31, 2012, if recognized, would affect our effective tax rate.
During the year ended December31, 2012, we settled examinations with various state and foreign tax authorities for prior
tax years. As a result of these developments, we remeasured our UTBs accordingly.
During the year ended December31, 2011, we settled our examination with the Internal Revenue Service (IRS) related to
certain transfer pricing tax positions for the years ended December31, 2007, 2008 and 2009. As a result of these developments,
we remeasured our UTBs accordingly.
During the year ended December31, 2010, we settled our examination with the IRS related to certain transfer pricing tax
positions for the years ended December31, 2007 and 2008. In addition, we also settled issues under appeal with the IRS for the
years ended December31, 2005 and 2006, primarily related to the impact of transfer pricing adjustments on the repatriation of
funds. During the year ended December31, 2010, the IRS also agreed to Competent Authority relief for certain transfer pricing
tax positions for the years ended December31, 2002, through December31, 2006. As a result of these developments, we remeasured
our UTBs accordingly.
As of December31, 2012, we believe it is reasonably possible that our gross liabilities for UTBs may decrease by
approximately $280 million within the succeeding twelve months due to the resolution of federal and state audits, including a
decrease related to the IRS settlement described below.
Interest and penalties related to UTBs are included in our provision for income taxes. During 2012, 2011 and 2010, we
accrued approximately $30 million, $23 million and $41 million, respectively, of interest and penalties through the income tax
provision in the Consolidated Statements of Income. At December31, 2012 and 2011, accrued interest and penalties associatedwith UTBs totaled approximately $102 million and $105 million, respectively.
The reconciliation between the federal statutory tax rate applied to income before income taxes and our effective tax rate
for the years ended December31, 2012, 2011 and 2010, is as follows:
2012 2011 2010
Federal statutory tax rate 35.0 % 35.0 % 35.0 %
Foreign earnings, including earnings invested indefinitely (17.8)% (19.4)% (19.1)%
State taxes 0.6 % 0.7 % 1.6 %
Credits, Puerto Rico Excise Tax (5.2)% (6.5)% 0.0 %
Credits, primarily federal R&D 0.0 % (1.5)% (0.9)%
Legal settlements (0.2)% 2.2 % 0.0 %Audit settlements (federal, state, foreign) 0.3 % 0.0 % (3.1)%
Other, net 0.6 % 0.8 % (0.5)%
Effective tax rate 13.3 % 11.3 % 13.0 %

7/27/2019 Amgen Inc 2012 Annual Report
http://slidepdf.com/reader/full/amgen-inc-2012-annual-report 120/150
F-21
Because the American Taxpayer Relief Act of 2012 was not enacted until 2013, certain provisions of the Act benefiting the
Company's 2012 federal taxes, including the retroactive extension of the R&D tax credit for 2012, cannot be recognized in the
Company's 2012 financial results and instead will be reflected in the Company's 2013 financial results for the first quarter.The
tax benefit of the retroactive extension of the 2012 R&D tax credit that will be recognized in the first quarter of 2013 is approximately
$65 million.
The effective tax rates for the years ended December31, 2012, 2011 and 2010, are different from the federal statutory rates
primarily as a result of indefinitely invested earnings of our foreign operations. We do not provide for U.S. income taxes onundistributed earnings of our foreign operations that are intended to be invested indefinitely outside the United States. Substantially
all of the benefit from foreign earnings on our effective tax rate results from foreign income associated with the Company’s
operation conducted in Puerto Rico that is subject to a tax incentive grant that expires in 2020. At December31, 2012, the cumulative
amount of these earnings was approximately $22.2 billion. If these earnings were repatriated to the United States, we would be
required to accrue and pay approximately $7.9 billion of additional income taxes based on the current tax rates in effect.
Our total foreign income before income taxes was approximately $3.3 billion, $3.0 billion and $3.5 billion for the years
ended December31, 2012, 2011 and 2010, respectively.
Commencing January1, 2011, Puerto Rico imposes a temporary excise tax on the purchase of goods and services from a
related manufacturer in Puerto Rico. The excise tax is imposed on the gross intercompany purchase price of the goods and services
and is effective for a six-year period beginning in 2011, with the excise tax rate declining in each year (4% in 2011, 3.75% in
2012, 2.75% in 2013, 2.5% in 2014, 2.25% in 2015 and 1% in 2016). In February 2013, the Puerto Rico government proposed an
amendment to the excise tax legislation which, if approved, would increase the excise tax rate to 4% effective July 1, 2013 through
2017. We account for the excise tax as a manufacturing cost that is capitalized in inventory and expensed in cost of sales when
the related products are sold. For U.S. income tax purposes, the excise tax results in foreign tax credits that are generally recognized
in our provision for income taxes when the excise tax is incurred.
Income taxes paid during the years ended December31, 2012, 2011 and 2010, totaled $502 million, $595 million and $1,344
million, respectively.
One or more of our legal entities file income tax returns in the U.S. federal jurisdiction, various U.S. state jurisdictions and
certain foreign jurisdictions. Our income tax returns are routinely audited by the tax authorities in those jurisdictions. Significant
disputes may arise with these tax authorities involving issues of the timing and amount of deductions, the use of tax credits and
allocations of income among various tax jurisdictions because of differing interpretations of tax laws and regulations. We are nolonger subject to U.S. federal income tax examinations for tax years ending on or before December31, 2009, or to California state
income tax examinations for tax years ending on or before December31, 2005.
Subsequent to December 31, 2012, we settled the examination of our U.S. tax returns with the IRS relating to years ended
December 31, 2007, 2008, and 2009. We will remeasure our UTBs and recognize the tax impact of this settlement in the first
quarter of 2013. We expect the settlement to result in a tax benefit of approximately $185 million.
5. Earnings per share
The computation of basic earnings per share (EPS) is based on the weighted-average number of our common shares
outstanding. The computation of diluted EPS is based on the weighted-average number of our common shares outstanding and
dilutive potential common shares, which include principally shares that may be issued under: our stock option, restricted stock
and performance unit awards, determined using the treasury stock method; our outstanding convertible notes, as discussed below;
and our outstanding warrants (collectively “dilutive securities”). The convertible note hedges purchased in connection with theissuance of our convertible notes are excluded from the calculation of diluted EPS because their impact is always anti-dilutive.
For further information regarding our convertible notes and warrants, see Note 14, Financing arrangements.
Prior to the conversion/maturity of our 0.375% 2013 Convertible Notes in February 2013 (see Note 14, Financing
arrangements), the principal amount of the notes had to be settled in cash, and the excess of the conversion value, as defined, over
the principal amount could have been settled in cash and/or shares of our common stock upon conversion. Therefore, only the
shares of our common stock potentially issuable with respect to the excess of the notes’ conversion value over their principal
amount, if any, are considered as dilutive potential common shares for purposes of calculating diluted EPS. For the year ended
December31, 2012, the conversion value of our convertible notes due in 2013 exceeded the related principal amount resulting in
the assumed issuance of an additional one million shares calculated on a weighted-average basis for purposes of computing diluted
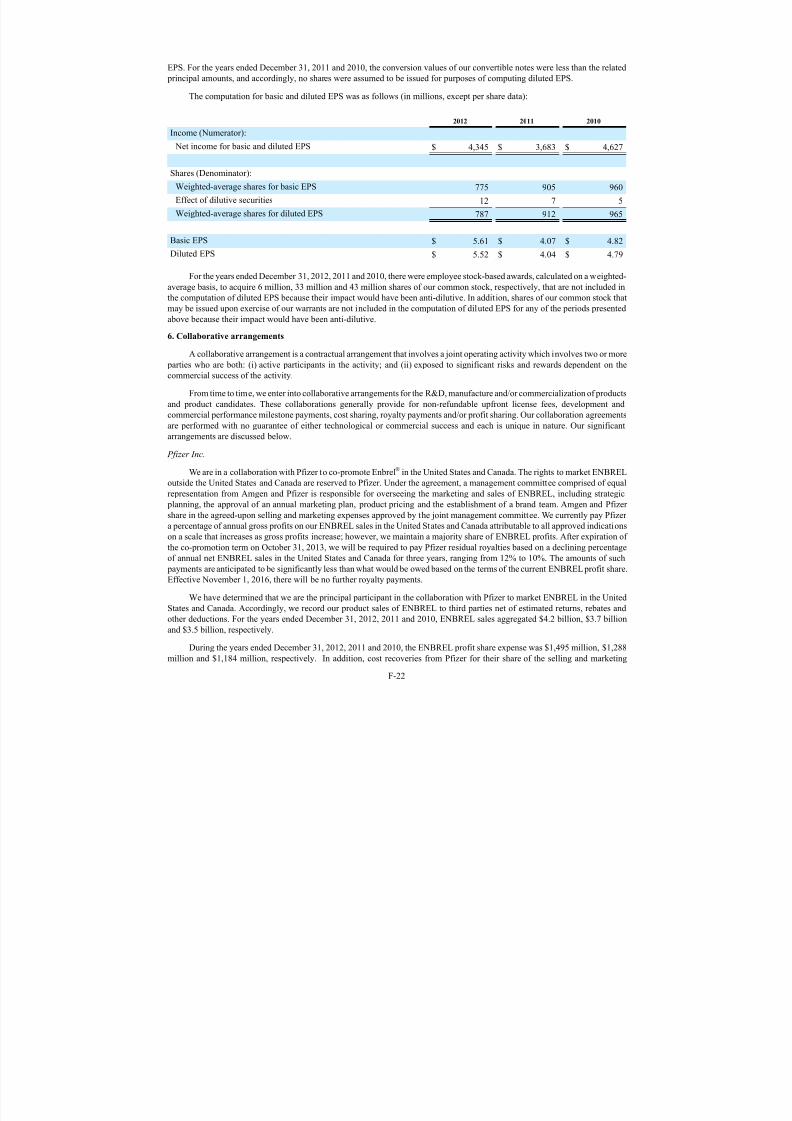
7/27/2019 Amgen Inc 2012 Annual Report
http://slidepdf.com/reader/full/amgen-inc-2012-annual-report 121/150
F-22
EPS. For the years ended December31, 2011 and 2010, the conversion values of our convertible notes were less than the related
principal amounts, and accordingly, no shares were assumed to be issued for purposes of computing diluted EPS.
The computation for basic and diluted EPS was as follows (in millions, except per share data):
2012 2011 2010
Income (Numerator): Net income for basic and diluted EPS $ 4,345 $ 3,683 $ 4,627
Shares (Denominator):
Weighted-average shares for basic EPS 775 905 960
Effect of dilutive securities 12 7 5
Weighted-average shares for diluted EPS 787 912 965
Basic EPS $ 5.61 $ 4.07 $ 4.82
Diluted EPS $ 5.52 $ 4.04 $ 4.79
For the years ended December31, 2012, 2011 and 2010, there were employee stock-based awards, calculated on a weighted-average basis, to acquire 6 million, 33 million and 43 million shares of our common stock, respectively, that are not included in
the computation of diluted EPS because their impact would have been anti-dilutive. In addition, shares of our common stock that
may be issued upon exercise of our warrants are not included in the computation of diluted EPS for any of the periods presented
above because their impact would have been anti-dilutive.
6. Collaborative arrangements
A collaborative arrangement is a contractual arrangement that involves a joint operating activity which involves two or more
parties who are both: (i)active participants in the activity; and (ii)exposed to significant risks and rewards dependent on the
commercial success of the activity.
From time to time, we enter into collaborative arrangements for the R&D, manufacture and/or commercialization of products
and product candidates. These collaborations generally provide for non-refundable upfront license fees, development and
commercial performance milestone payments, cost sharing, royalty payments and/or profit sharing. Our collaboration agreements
are performed with no guarantee of either technological or commercial success and each is unique in nature. Our significant
arrangements are discussed below.
Pfizer Inc.
We are in a collaboration with Pfizer to co-promote Enbrel® in the United States and Canada. The rights to market ENBREL
outside the United States and Canada are reserved to Pfizer. Under the agreement, a management committee comprised of equal
representation from Amgen and Pfizer is responsible for overseeing the marketing and sales of ENBREL, including strategic
planning, the approval of an annual marketing plan, product pricing and the establishment of a brand team. Amgen and Pfizer
share in the agreed-upon selling and marketing expenses approved by the joint management committee. We currently pay Pfizer
a percentage of annual gross profits on our ENBREL sales in the United States and Canada attributable to all approved indications
on a scale that increases as gross profits increase; however, we maintain a majority share of ENBREL profits. After expiration of
the co-promotion term on October 31, 2013, we will be required to pay Pfizer residual royalties based on a declining percentageof annual net ENBREL sales in the United States and Canada for three years, ranging from 12% to 10%. The amounts of such
payments are anticipated to be significantly less than what would be owed based on the terms of the current ENBREL profit share.
Effective November 1, 2016, there will be no further royalty payments.
We have determined that we are the principal participant in the collaboration with Pfizer to market ENBREL in the United
States and Canada. Accordingly, we record our product sales of ENBREL to third parties net of estimated returns, rebates and
other deductions. For the years ended December31, 2012, 2011 and 2010, ENBREL sales aggregated $4.2 billion, $3.7 billion
and $3.5 billion, respectively.
During the years ended December31, 2012, 2011 and 2010, the ENBREL profit share expense was $1,495 million, $1,288
million and $1,184 million, respectively. In addition, cost recoveries from Pfizer for their share of the selling and marketing
7/27/2019 Amgen Inc 2012 Annual Report
http://slidepdf.com/reader/full/amgen-inc-2012-annual-report 122/150
F-23
expense were $35 million, $84 million and $87 million for the years ended December31, 2012, 2011 and 2010, respectively. Both
the profit share expenses and the cost recoveries are included in Selling, general and administrative expense in the Consolidated
Statements of Income.
Glaxo Group Limited
We are in a collaboration with Glaxo Group Limited (Glaxo), a wholly owned subsidiary of GlaxoSmithKline plc, for the
commercialization of denosumab for osteoporosis indications in Europe, Australia, New Zealand and Mexico (the PrimaryTerritories). We have retained the rights to commercialize denosumab for all indications in the United States and Canada and for
oncology indications in the Primary Territories. Under a related agreement, Glaxo will commercialize denosumab for all indications
in countries, excluding Japan, where we did not have a commercial presence at the commencement of the agreement, including
China, Brazil, India, Taiwan and South Korea (the Expansion Territories). In the Expansion Territories, Glaxo is responsible for
all development and commercialization costs and will purchase denosumab from us to meet demand. We have the option of
expanding our role in the commercialization of denosumab in the Primary Territories and certain of the Expansion Territories.
In the Primary Territories, we share equally in the commercialization profits and losses related to the collaboration after
accounting for expenses, including an amount payable to us in recognition of our discovery and development of denosumab. Glaxo
is also responsible for bearing a portion of the cost of certain specified development activities in the Primary Territories.
The collaboration agreement with Glaxo for the Primary Territories will expire in 2022 and the related agreement for the
Expansion Territories will expire in 2024, unless either agreement is terminated earlier in accordance with its terms.
As the principal participant in the Primary Territories, Amgen records related product sales to third parties net of estimated
returns, rebates and other deductions. During the years ended December31, 2012, 2011 and 2010, product sales in the Primary
Territories for osteoporosis indications were $139 million, $62 million and $5 million, respectively. In the Expansion Territories,
we record product sales to Glaxo. During the years ended December31, 2012, 2011 and 2010, product sales of denosumab to
Glaxo for the Expansion Territories were not material.
During the years ended December31, 2012, 2011 and 2010, the net cost recoveries from Glaxo were $10 million, $30 million
and $46 million, respectively, and are included in Selling, general and administrative expense in the Consolidated Statements of
Income. In addition, during 2010, we received payments from Glaxo aggregating $75 million for the achievement of certain
commercial milestones, which were recognized as Other revenues in our Consolidated Statement of Income.
AstraZeneca Plc.
We are in a collaboration with AstraZeneca Plc. (AstraZeneca) to jointly develop and commercialize certain monoclonal
antibodies from Amgen's clinical inflammation portfolio, including brodalumab, AMG 139, AMG 157, AMG 181 and AMG 557.
The agreement covers the worldwide development and commercialization, except for certain Asian countries for brodalumab and
Japan for AMG 557, that are licensed to other third parties.
Under the terms of the agreement, approximately 65% of related development costs for the 2012-2014 periods will be
funded by AstraZeneca, thereafter, the companies will share costs equally. If approved for sale, Amgen would receive a low-single-
digit royalty rate for brodalumab and a mid-single-digit royalty rate for the rest of the portfolio, after which the worldwide
commercialization profits and losses related to the collaboration products would be shared equally. In 2012, we received a payment
of $50 million, in connection with the transfer of technology rights, which was recognized in Other revenues in the Consolidated
Statement of Income. During the year ended December 31, 2012, cost recoveries recognized for development costs were $28
million, which are included in Research and development expense in the Consolidated Statement of Income.
The collaboration agreement will continue in effect unless terminated in accordance with its terms.
Takeda Pharmaceutical Company Limited
In 2008, we entered into an arrangement with Takeda Pharmaceutical Company Limited (Takeda), that provided Takeda
both: (i) the exclusive rights to develop and commercialize for the Japanese market up to 12 molecules from our portfolio across
a range of therapeutic areas, including oncology and inflammation (collectively the “Japanese market products”) and (ii) the right
to collaborate with us on the worldwide (outside Japan) development and commercialization of our product candidate, motesanib.
The Japanese market products include Vectibix® and certain product candidates. In connection with this 2008 arrangement, we
received upfront payments of $300 million that were deferred and were being recognized as Other revenues in our Consolidated
Statements of Income over the estimated period of continuing involvement of approximately 20 years. Additionally, during 2010,
7/27/2019 Amgen Inc 2012 Annual Report
http://slidepdf.com/reader/full/amgen-inc-2012-annual-report 123/150
F-24
we received payments aggregating $55 million for the achievement of certain regulatory milestones which were recognized as
Other revenues in our Consolidated Statement of Income upon the achievement of the related milestone events.
In 2011, we announced that the motesanib pivotal phase 3 trial (MONET1) had not met its primary objective of demonstrating
an improvement in overall survival in patients with advanced non-squamous non small cell lung cancer (NSCLC).
In June 2012, the parties materially modified this arrangement such that Amgen licensed all of its rights to motesanib to
Takeda which now has control over the worldwide development and commercialization of motesanib. Takeda subsequentlyannounced initiation of a new phase 3 clinical trial in non-squamous NSCLC patients in Japan, Hong Kong, South Korea and
Taiwan based on the prospectively-defined Asian subgroup analysis of the MONET1 data. Based on the modification of the parties'
arrangement, we will no longer participate in the development of motesanib and our obligations with respect to motesanib are
limited primarily to closing the MONET1 clinical trial and transitioning certain existing development data and manufacturing
capabilities (collectively “transition services”) from our contract manufacturer to Takeda. In exchange for licensing motesanib to
Takeda, we received an additional upfront payment of $3 million and will receive incremental cost recoveries of approximately
$21 million. We may also receive substantive success-based regulatory approval milestones and royalties on global sales of
motesanib, if approved for sale, that are substantially lower than those under the 2008 arrangement. As of the date of modification,
$230 million of the up-front payment we received in 2008 remained in deferred revenue on the Consolidated Balance Sheet.
Upon the modification of the arrangement, we determined that the remaining deliverables are: (i)the additional license
rights to motesanib granted to Takeda and related transition services, (ii)commercial supply of Vectibix® and (iii)clinical and
commercial supply and data relating to certain development activities, to the extent undertaken by Amgen, for the Japanese market products other than Vectibix®. We considered several factors in determining whether stand-alone value exists for each deliverable,
including the rights and ability to perform the R&D activities, as well as the ability of parties to use a third party to perform their
respective designated activities under the arrangement. The estimated selling prices for the undelivered items were determined by
using third party evidence and BESP where applicable as of the date of modification. BESP was determined primarily using a
probability-weighted discounted cash flow analysis. The fixed or determinable arrangement consideration was allocated to the
undelivered items based on the relative selling price method and will be recognized as the services are performed or product is
delivered. This amount was deducted from the sum of the consideration to be received in the future plus deferred revenue from
the original 2008 arrangement as of the date of the modification of $230 million with the remainder of $206 million recognized
as Other revenues in our Consolidated Statements of Income upon modification. Subsequently during 2012, deferred revenue of
$24 million was recognized as the related services were completed. In addition, the arrangement allows for the receipt of royalties
and milestone payments upon the achievement of various substantive success-based development and regulatory approval
milestones which are immaterial, individually and in the aggregate, with regard to product candidates that remain under
development. The receipt of these amounts, however, is contingent upon the occurrence of various future events that have a highdegree of uncertainty of occurring.
During the years ended December31, 2012, 2011 and 2010, cost recoveries from Takeda were $74 million, $83 million and
$91 million, respectively, and are included in Research and development expense in the Consolidated Statements of Income. In
addition, for the years December31, 2012, 2011 and 2010, we recognized royalties on sales of Vectibix® in Japan of $21 million,
$20 million and $7 million respectively, in Other revenues in the Consolidated Statements of Income.
UCB
We are in a collaboration with UCB for the development and commercialization of romosozumab. We have the rights to
commercialize romosozumab for all indications in the United States, Canada, Mexico and Japan. UCB has the rights for all EU
members at the time of first regulatory approval, Australia and New Zealand. Prior to commercialization, countries that have not
been initially designated will be designated to Amgen or UCB in accordance with the terms of the agreement.
Generally, development costs are shared equally and we will share equally in the worldwide commercialization profits and
losses related to the collaboration after accounting for expenses.
The collaboration agreements will continue in effect unless terminated earlier in accordance with their terms.
During the years ended December 31, 2012, 2011 and 2010, the net costs recovered from UCB were $71 million, $35 million,
and $28 million, respectively, and are included in Research and development expense in the Consolidated Statements of Income.
7/27/2019 Amgen Inc 2012 Annual Report
http://slidepdf.com/reader/full/amgen-inc-2012-annual-report 124/150
F-25
Other
In addition to the collaborations discussed above, we have various others that are not individually significant to our business
at this time. Pursuant to the terms of those agreements, we may be required to pay or we may receive additional amounts upon
the achievement of various development and commercial milestones which in the aggregate could be significant. We may also
incur or have reimbursed to us significant R&D costs if the related product candidate were to advance to late stage clinical trials.
In addition, if any products related to these collaborations are approved for sale, we may be required to pay or we may receive
significant royalties on future sales. The payment of these amounts, however, is contingent upon the occurrence of various futureevents, which have a high degree of uncertainty of occurring.
7. Related party transactions
We own a 50% interest in K-A, a corporation formed in 1984 with Kirin Holdings Company, Limited (Kirin) for the
development and commercialization of certain products based on advanced biotechnology. All of our rights to manufacture and
market certain products including pegfilgrastim, granulocyte colony-stimulating factor, darbepoetin alfa, recombinant human
erythropoietin and romiplostim are pursuant to exclusive licenses from K-A, which we currently market under the brand names
Neulasta®, NEUPOGEN®, Aranesp®, EPOGEN®, and Nplate®, respectively.
We account for our interest in K-A using the equity method and include our share of K-A’s profits or losses in Selling, general
and administrative expense in the Consolidated Statements of Income. Our share of K-A’s profits and losses was a loss of $24
million, and profits of $47 million and $71 million, for the years ended December31, 2012, 2011 and 2010, respectively. At both
December31, 2012 and 2011, the carrying value of our equity method investment in K-A, net of dividends received, was
approximately $0.4 billion and is included in noncurrent Other assets in the Consolidated Balance Sheets.
K-A’s revenues consist of royalty income related to its licensed technology rights. K-A receives royalty income from us, as
well as from Kirin, J&J and F. Hoffmann-La Roche Ltd. under separate product license contracts for certain geographic areas
outside the United States. During the years ended December31, 2012, 2011 and 2010, K-A earned royalties from us of $274
million, $298 million and $322 million, respectively. These amounts are included in Cost of sales (excludes amortization of certain
acquired intangible assets) in the Consolidated Statements of Income.
K-A’s expenses consist primarily of costs related to R&D activities conducted on its behalf by Amgen and Kirin. K-A pays
Amgen and Kirin for such services at negotiated rates. During the years ended December31, 2012, 2011 and 2010, we earned
revenues from K-A of $115 million, $130 million and $96 million, respectively, for certain R&D activities performed on K-A’s
behalf. These amounts are recognized as Other revenues in the Consolidated Statements of Income. We may also receive numerous
individually immaterial milestones aggregating $85 million upon the achievement of various substantive success-baseddevelopment and regulatory approval milestones contingent upon the occurrence of various future events, most of which have a
high degree of uncertainty of occurring. During the years ended December31, 2012, 2011 and 2010, we recorded cost recoveries
from K-A of $142 million, $85 million and $88 million, respectively, related to certain third-party costs. These amounts are included
in Research and development expense in the Consolidated Statements of Income.
As of December31, 2012 and 2011, we owed K-A $31 million and $75 million, respectively, which are included in Accrued
liabilities in the Consolidated Balance Sheets.
8. Cost savings initiatives
Manufacturing operations optimization
In order to optimize our network of manufacturing facilities and improve cost effectiveness, we determined that certain
manufacturing facilities located in Boulder, Colorado, were no longer needed and accordingly, they were abandoned during thefourth quarter of 2012. This resulted in the write-off of the carrying value of the facility, which aggregated $118 million, during
the year ended December 31, 2012. The amount is included in Cost of sales (excludes amortization of certain acquired intangible
assets) in the Consolidated Statement of Income.
On January18, 2011, we entered into an agreement whereby Boehringer Ingelheim (BI) agreed to acquire our rights in and
substantially all assets at our manufacturing facility located in Fremont, California. The transaction closed in March 2011. In
connection with the closing of the transaction, BI assumed our obligations under certain of the facility’s operating lease contracts
and entered into an agreement to manufacture certain quantities of our marketed product Vectibix® for us at this facility through
December31, 2012 (the supply period).

7/27/2019 Amgen Inc 2012 Annual Report
http://slidepdf.com/reader/full/amgen-inc-2012-annual-report 125/150
F-26
As a result of the transaction with BI, an impairment analysis was performed on this facility which determined that a
manufacturing line that had not yet been completed was impaired, and we wrote off its entire carrying value, which aggregated
$118 million, during the year ended December31, 2010. This amount is included in Other operating expenses in the Consolidated
Statement of Income.
Due to the lack of sufficient initial investment by BI in the acquisition of this facility and our ongoing involvement with
these operations, the transaction did not meet the accounting requirements to be treated as a sale involving real estate. As a result,
the related assets continued to be carried on our Consolidated Balance Sheets with reduced estimated useful lives of the remainingfixed assets to coincide with the supply period. During each of the years ended December 31, 2012 and 2011, we recorded
incremental depreciation of approximately $42 million in excess of what otherwise would have been recorded. In addition, due
to the assignment to BI of the obligations under certain of the facility’s operating leases, we recorded charges of approximately
$23 million during the year ended December31, 2011, with respect to the lease period beyond the end of the supply period. These
amounts are recorded in Cost of sales (excludes amortization of certain acquired intangible assets) in the Consolidated Statements
of Income.
Other cost savings initiatives
As part of our continuing efforts to improve cost efficiencies in our operations, we recorded certain charges aggregating
approximately $175 million and $109 million during the years ended December31, 2012 and 2011, respectively, which are included
in Other operating expenses in the Consolidated Statements of Income. The 2012 expenses are primarily severance-related and
charges related to exiting leased facilities, and the 2011 expenses are primarily severance-related.
9. Available-for-sale investments
The amortized cost, gross unrealized gains, gross unrealized losses and estimated fair values of available-for-sale investments
by type of security were as follows (in millions):
Type of security as of December 31, 2012Amortized
cost
Grossunrealized
gains
Grossunrealized
lossesEstimatedfair value
U.S. Treasury securities $ 4,443 $ 15 $ — $ 4,458
Other government-related debt securities:
U.S. 1,018 12 — 1,030
Foreign and other 1,549 60 (1) 1,608Corporate debt securities:
Financial 3,266 96 (1) 3,361
Industrial 4,283 100 (3) 4,380
Other 441 11 — 452
Residential mortgage-backed securities 1,828 9 (8) 1,829
Other mortgage- and asset-backed securities 1,769 7 (9) 1,767
Money market mutual funds 2,620 — — 2,620
Other short-term interest-bearing securities 2,186 — — 2,186
Total interest-bearing securities 23,403 310 (22) 23,691
Equity securities 52 2 — 54Total available-for-sale investments $ 23,455 $ 312 $ (22) $ 23,745

7/27/2019 Amgen Inc 2012 Annual Report
http://slidepdf.com/reader/full/amgen-inc-2012-annual-report 126/150
F-27
Type of security as of December 31, 2011Amortized
cost
Grossunrealized
gains
Grossunrealized
lossesEstimatedfair value
U.S. Treasury securities $ 3,878 $ 68 $ — $ 3,946
Other government-related debt securities:
U.S. 1,548 23 — 1,571
Foreign and other 441 9 — 450Corporate debt securities:
Financial 2,493 30 (15) 2,508
Industrial 3,077 79 (10) 3,146
Other 280 9 — 289
Residential mortgage-backed securities 518 3 (3) 518
Other mortgage- and asset-backed securities 1,271 3 (7) 1,267
Money market mutual funds 6,266 — — 6,266
Total interest-bearing securities 19,772 224 (35) 19,961
Equity securities 42 — — 42
Total available-for-sale investments $ 19,814 $ 224 $ (35) $ 20,003
The fair values of available-for-sale investments by classification in the Consolidated Balance Sheets were as follows as of
December31, 2012 and 2011 (in millions):
Classification in the Consolidated Balance Sheets 2012 2011
Cash and cash equivalents $ 2,887 $ 6,266
Marketable securities 20,804 13,695
Other assets — noncurrent 54 42
Total available-for-sale investments $ 23,745 $ 20,003
Cash and cash equivalents in the table above excludes cash of $370 million and $680 million as of December31, 2012 and
2011, respectively.
The fair values of available-for-sale interest-bearing security investments by contractual maturity, except for mortgage- and
asset-backed securities that do not have a single maturity date, were as follows as of December31, 2012 and 2011 (in millions):
Contractual maturity 2012 2011
Maturing in one year or less $ 7,175 $ 6,791
Maturing after one year through three years 5,014 5,855
Maturing after three years through five years 6,286 5,379
Maturing after five years through ten years 1,620 151
Mortgage- and asset-backed securities 3,596 1,785
Total interest-bearing securities $ 23,691 $ 19,961
For the years ended December31, 2012, 2011 and 2010, realized gains totaled $186 million, $191 million and $115 million,
respectively, and realized losses totaled $54 million, $37 million and $25 million, respectively. The cost of securities sold is based
on the specific identification method.
The primary objective of our investment portfolio is to enhance overall returns in an efficient manner while maintaining
safety of principal, prudent levels of liquidity and acceptable levels of risk. Our investment policy limits interest-bearing security
investments to certain types of debt and money market instruments issued by institutions with primarily investment grade credit
ratings and places restrictions on maturities and concentration by asset class and issuer.
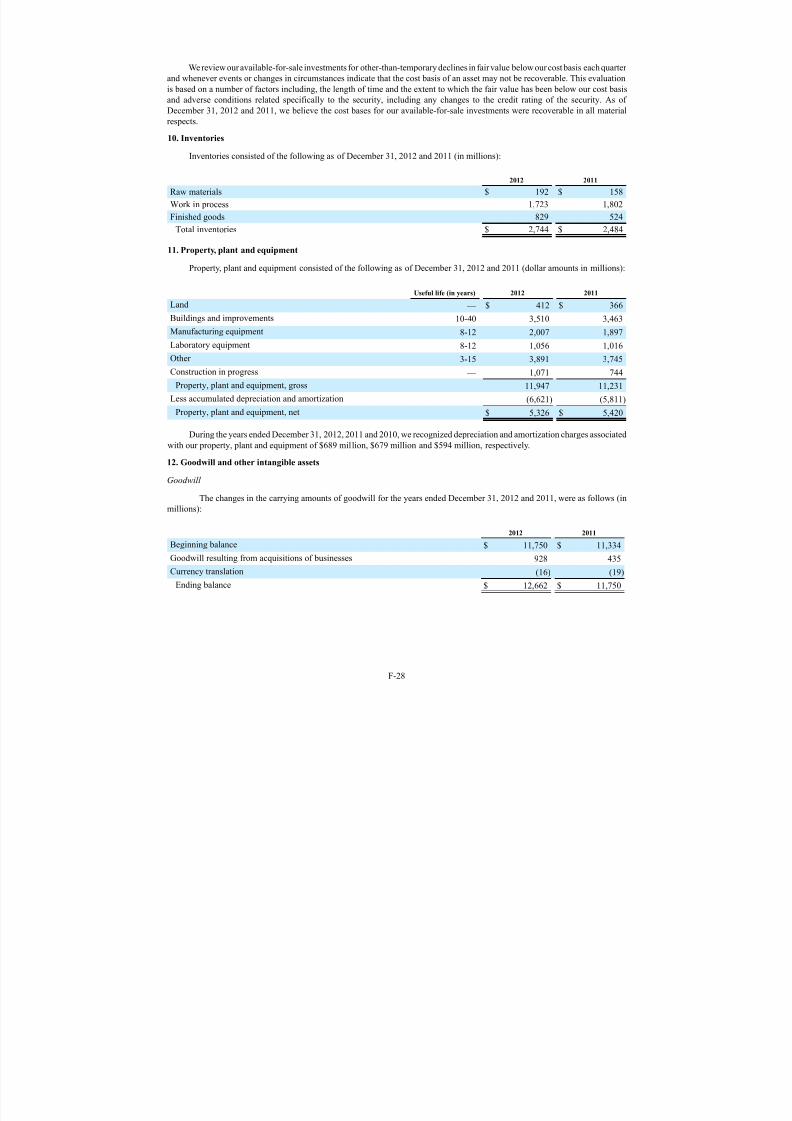
7/27/2019 Amgen Inc 2012 Annual Report
http://slidepdf.com/reader/full/amgen-inc-2012-annual-report 127/150
F-28
We review our available-for-sale investments for other-than-temporary declines in fair value below our cost basis each quarter
and whenever events or changes in circumstances indicate that the cost basis of an asset may not be recoverable. This evaluation
is based on a number of factors including, the length of time and the extent to which the fair value has been below our cost basis
and adverse conditions related specifically to the security, including any changes to the credit rating of the security. As of
December31, 2012 and 2011, we believe the cost bases for our available-for-sale investments were recoverable in all material
respects.
10. Inventories
Inventories consisted of the following as of December31, 2012 and 2011 (in millions):
2012 2011
Raw materials $ 192 $ 158
Work in process 1,723 1,802
Finished goods 829 524
Total inventories $ 2,744 $ 2,484
11. Property, plant and equipment
Property, plant and equipment consisted of the following as of December31, 2012 and 2011 (dollar amounts in millions):
Usefullife(inyears) 2012 2011
Land — $ 412 $ 366
Buildings and improvements 10-40 3,510 3,463
Manufacturing equipment 8-12 2,007 1,897
Laboratory equipment 8-12 1,056 1,016
Other 3-15 3,891 3,745
Construction in progress — 1,071 744
Property, plant and equipment, gross 11,947 11,231
Less accumulated depreciation and amortization (6,621) (5,811)
Property, plant and equipment, net $ 5,326 $ 5,420
During the years ended December31, 2012, 2011 and 2010, we recognized depreciation and amortization charges associated
with our property, plant and equipment of $689 million, $679 million and $594 million, respectively.
12. Goodwill and other intangible assets
Goodwill
The changes in the carrying amounts of goodwill for the years ended December 31, 2012 and 2011, were as follows (in
millions):
2012 2011
Beginning balance $ 11,750 $ 11,334Goodwill resulting from acquisitions of businesses 928 435
Currency translation (16) (19)
Ending balance $ 12,662 $ 11,750
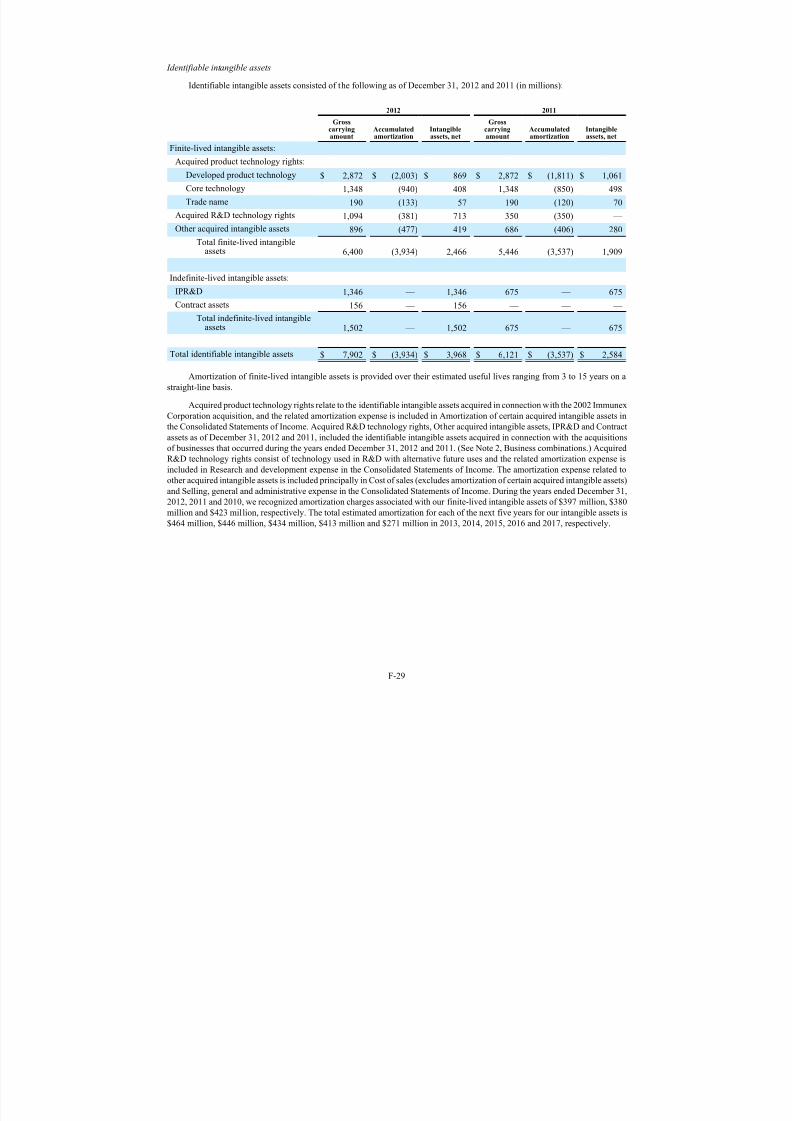
7/27/2019 Amgen Inc 2012 Annual Report
http://slidepdf.com/reader/full/amgen-inc-2012-annual-report 128/150
F-29
Identifiable intangible assets
Identifiable intangible assets consisted of the following as of December31, 2012 and 2011 (in millions):
2012 2011
Grosscarrying
amount
Accumulated
amortization
Intangible
assets, net
Grosscarrying
amount
Accumulated
amortization
Intangible
assets, net
Finite-lived intangible assets:
Acquired product technology rights:
Developed product technology $ 2,872 $ (2,003) $ 869 $ 2,872 $ (1,811) $ 1,061
Core technology 1,348 (940) 408 1,348 (850) 498
Trade name 190 (133) 57 190 (120) 70
Acquired R&D technology rights 1,094 (381) 713 350 (350) —
Other acquired intangible assets 896 (477) 419 686 (406) 280
Total finite-lived intangibleassets 6,400 (3,934) 2,466 5,446 (3,537) 1,909
Indefinite-lived intangible assets:
IPR&D 1,346 — 1,346 675 — 675
Contract assets 156 — 156 — — —
Total indefinite-lived intangibleassets 1,502 — 1,502 675 — 675
Total identifiable intangible assets $ 7,902 $ (3,934) $ 3,968 $ 6,121 $ (3,537) $ 2,584
Amortization of finite-lived intangible assets is provided over their estimated useful lives ranging from 3 to 15 years on a
straight-line basis.
Acquired product technology rights relate to the identifiable intangible assets acquired in connection with the 2002 Immunex
Corporation acquisition, and the related amortization expense is included in Amortization of certain acquired intangible assets in
the Consolidated Statements of Income. Acquired R&D technology rights, Other acquired intangible assets, IPR&D and Contract
assets as of December31, 2012 and 2011, included the identifiable intangible assets acquired in connection with the acquisitions
of businesses that occurred during the years ended December 31, 2012 and 2011. (See Note 2, Business combinations.) Acquired
R&D technology rights consist of technology used in R&D with alternative future uses and the related amortization expense is
included in Research and development expense in the Consolidated Statements of Income. The amortization expense related to
other acquired intangible assets is included principally in Cost of sales (excludes amortization of certain acquired intangible assets)
and Selling, general and administrative expense in the Consolidated Statements of Income. During the years ended December31,
2012, 2011 and 2010, we recognized amortization charges associated with our finite-lived intangible assets of $397 million, $380
million and $423 million, respectively. The total estimated amortization for each of the next five years for our intangible assets is
$464 million, $446 million, $434 million, $413 million and $271 million in 2013, 2014, 2015, 2016 and 2017, respectively.
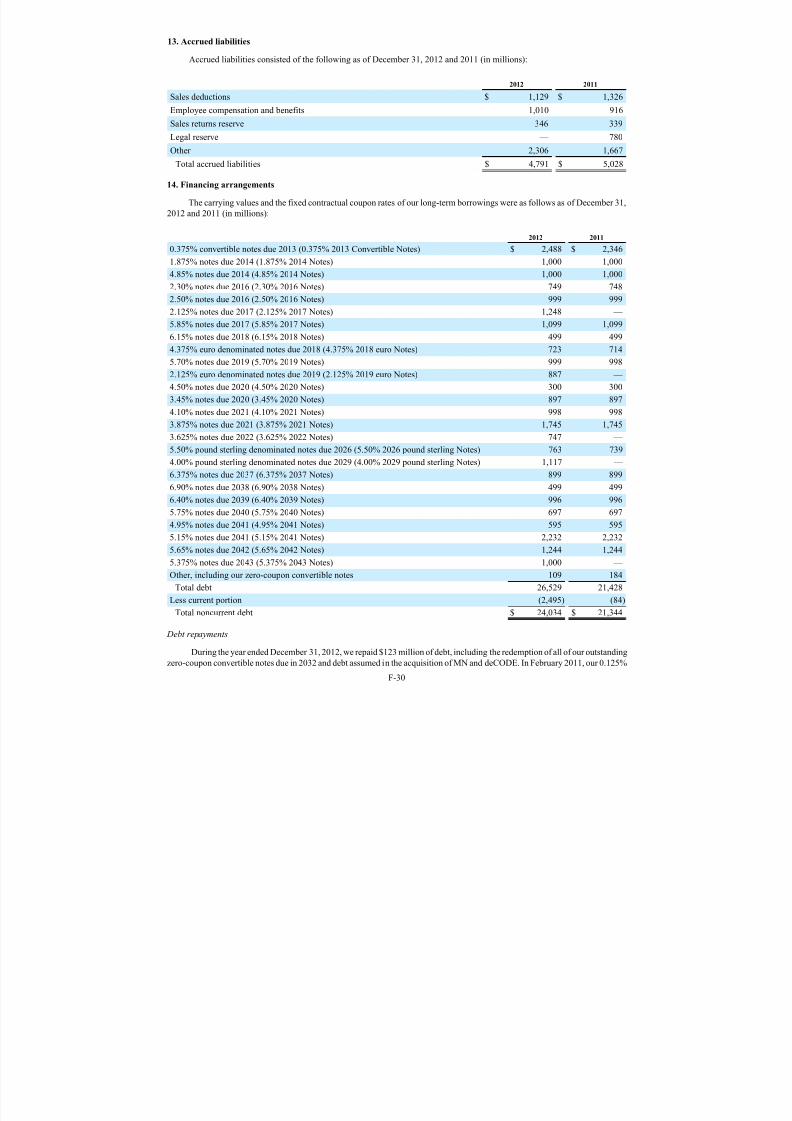
7/27/2019 Amgen Inc 2012 Annual Report
http://slidepdf.com/reader/full/amgen-inc-2012-annual-report 129/150
F-30
13. Accrued liabilities
Accrued liabilities consisted of the following as of December31, 2012 and 2011 (in millions):
2012 2011
Sales deductions $ 1,129 $ 1,326
Employee compensation and benefits 1,010 916
Sales returns reserve 346 339
Legal reserve — 780Other 2,306 1,667
Total accrued liabilities $ 4,791 $ 5,028
14. Financing arrangements
The carrying values and the fixed contractual coupon rates of our long-term borrowings were as follows as of December31,
2012 and 2011 (in millions):
2012 2011
0.375% convertible notes due 2013 (0.375% 2013 Convertible Notes) $ 2,488 $ 2,346
1.875% notes due 2014 (1.875% 2014 Notes) 1,000 1,000
4.85% notes due 2014 (4.85% 2014 Notes) 1,000 1,0002.30% notes due 2016 (2.30% 2016 Notes) 749 748
2.50% notes due 2016 (2.50% 2016 Notes) 999 999
2.125% notes due 2017 (2.125% 2017 Notes) 1,248 —
5.85% notes due 2017 (5.85% 2017 Notes) 1,099 1,099
6.15% notes due 2018 (6.15% 2018 Notes) 499 499
4.375% euro denominated notes due 2018 (4.375% 2018 euro Notes) 723 714
5.70% notes due 2019 (5.70% 2019 Notes) 999 998
2.125% euro denominated notes due 2019 (2.125% 2019 euro Notes) 887 —
4.50% notes due 2020 (4.50% 2020 Notes) 300 300
3.45% notes due 2020 (3.45% 2020 Notes) 897 897
4.10% notes due 2021 (4.10% 2021 Notes) 998 998
3.875% notes due 2021 (3.875% 2021 Notes) 1,745 1,745
3.625% notes due 2022 (3.625% 2022 Notes) 747 —
5.50% pound sterling denominated notes due 2026 (5.50% 2026 pound sterling Notes) 763 739
4.00% pound sterling denominated notes due 2029 (4.00% 2029 pound sterling Notes) 1,117 —
6.375% notes due 2037 (6.375% 2037 Notes) 899 899
6.90% notes due 2038 (6.90% 2038 Notes) 499 499
6.40% notes due 2039 (6.40% 2039 Notes) 996 996
5.75% notes due 2040 (5.75% 2040 Notes) 697 697
4.95% notes due 2041 (4.95% 2041 Notes) 595 595
5.15% notes due 2041 (5.15% 2041 Notes) 2,232 2,232
5.65% notes due 2042 (5.65% 2042 Notes) 1,244 1,244
5.375% notes due 2043 (5.375% 2043 Notes) 1,000 —
Other, including our zero-coupon convertible notes 109 184
Total debt 26,529 21,428
Less current portion (2,495) (84)
Total noncurrent debt $ 24,034 $ 21,344
Debt repayments
During the year ended December31, 2012, we repaid $123 million of debt, including the redemption of all of our outstanding
zero-coupon convertible notes due in 2032 and debt assumed in the acquisition of MN and deCODE. In February 2011, our 0.125%
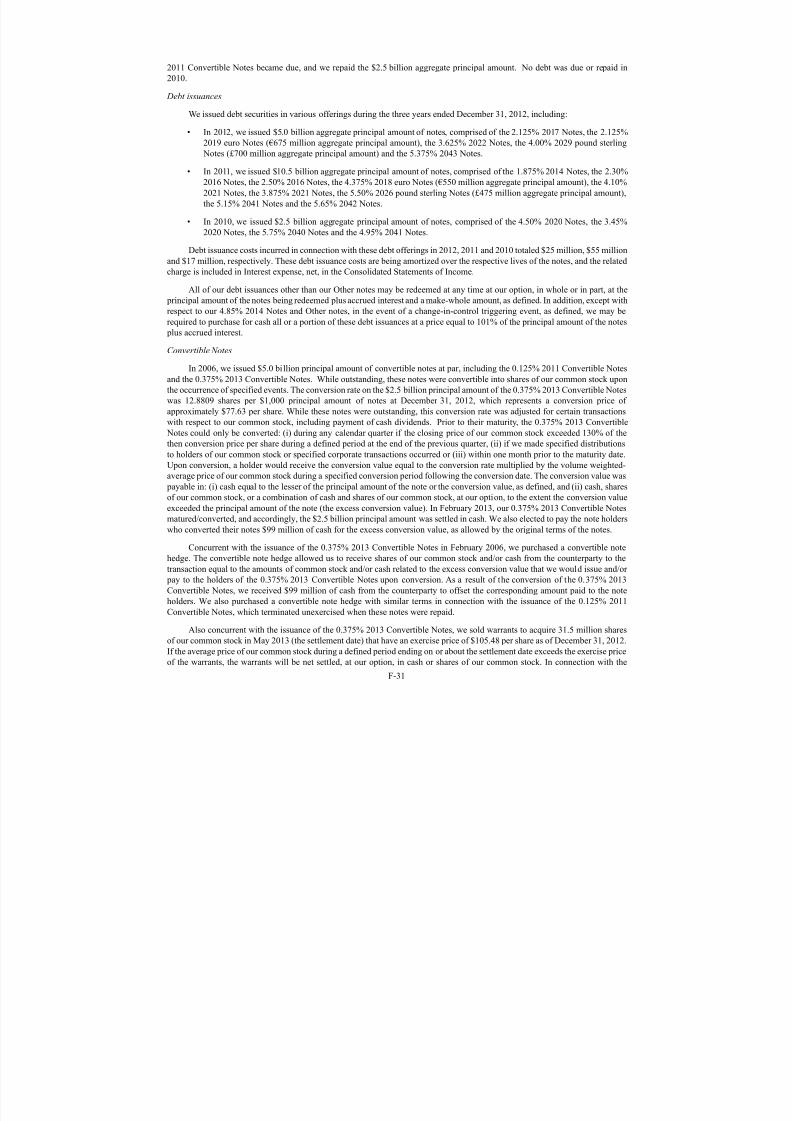
7/27/2019 Amgen Inc 2012 Annual Report
http://slidepdf.com/reader/full/amgen-inc-2012-annual-report 130/150
F-31
2011 Convertible Notes became due, and we repaid the $2.5 billion aggregate principal amount. No debt was due or repaid in
2010.
Debt issuances
We issued debt securities in various offerings during the three years ended December31, 2012, including:
• In 2012, we issued $5.0 billion aggregate principal amount of notes, comprised of the 2.125% 2017 Notes, the 2.125%2019 euro Notes (€675 million aggregate principal amount), the 3.625% 2022 Notes, the 4.00% 2029 pound sterling
Notes (£700 million aggregate principal amount) and the 5.375% 2043 Notes.
• In 2011, we issued $10.5 billion aggregate principal amount of notes, comprised of the 1.875% 2014 Notes, the 2.30%
2016 Notes, the 2.50% 2016 Notes, the 4.375% 2018 euro Notes (€550 million aggregate principal amount), the 4.10%
2021 Notes, the 3.875% 2021 Notes, the 5.50% 2026 pound sterling Notes (£475 million aggregate principal amount),
the 5.15% 2041 Notes and the 5.65% 2042 Notes.
• In 2010, we issued $2.5 billion aggregate principal amount of notes, comprised of the 4.50% 2020 Notes, the 3.45%
2020 Notes, the 5.75% 2040 Notes and the 4.95% 2041 Notes.
Debt issuance costs incurred in connection with these debt offerings in 2012, 2011 and 2010 totaled $25 million, $55 million
and $17 million, respectively. These debt issuance costs are being amortized over the respective lives of the notes, and the related
charge is included in Interest expense, net, in the Consolidated Statements of Income.
All of our debt issuances other than our Other notes may be redeemed at any time at our option, in whole or in part, at the
principal amount of the notes being redeemed plus accrued interest and a make-whole amount, as defined. In addition, except with
respect to our 4.85% 2014 Notes and Other notes, in the event of a change-in-control triggering event, as defined, we may be
required to purchase for cash all or a portion of these debt issuances at a price equal to 101% of the principal amount of the notes
plus accrued interest.
Convertible Notes
In 2006, we issued $5.0 billion principal amount of convertible notes at par, including the 0.125% 2011 Convertible Notes
and the 0.375% 2013 Convertible Notes. While outstanding, these notes were convertible into shares of our common stock upon
the occurrence of specified events. The conversion rate on the $2.5 billion principal amount of the 0.375% 2013 Convertible Notes
was 12.8809 shares per $1,000 principal amount of notes at December31, 2012, which represents a conversion price of
approximately $77.63 per share. While these notes were outstanding, this conversion rate was adjusted for certain transactionswith respect to our common stock, including payment of cash dividends. Prior to their maturity, the 0.375% 2013 Convertible
Notes could only be converted: (i)during any calendar quarter if the closing price of our common stock exceeded 130% of the
then conversion price per share during a defined period at the end of the previous quarter, (ii)if we made specified distributions
to holders of our common stock or specified corporate transactions occurred or (iii)within one month prior to the maturity date.
Upon conversion, a holder would receive the conversion value equal to the conversion rate multiplied by the volume weighted-
average price of our common stock during a specified conversion period following the conversion date. The conversion value was
payable in: (i)cash equal to the lesser of the principal amount of the note or the conversion value, as defined, and (ii)cash, shares
of our common stock, or a combination of cash and shares of our common stock, at our option, to the extent the conversion value
exceeded the principal amount of the note (the excess conversion value). In February 2013, our 0.375% 2013 Convertible Notes
matured/converted, and accordingly, the $2.5 billion principal amount was settled in cash. We also elected to pay the note holders
who converted their notes $99 million of cash for the excess conversion value, as allowed by the original terms of the notes.
Concurrent with the issuance of the 0.375% 2013 Convertible Notes in February 2006, we purchased a convertible notehedge. The convertible note hedge allowed us to receive shares of our common stock and/or cash from the counterparty to the
transaction equal to the amounts of common stock and/or cash related to the excess conversion value that we would issue and/or
pay to the holders of the 0.375% 2013 Convertible Notes upon conversion. As a result of the conversion of the 0.375% 2013
Convertible Notes, we received $99 million of cash from the counterparty to offset the corresponding amount paid to the note
holders. We also purchased a convertible note hedge with similar terms in connection with the issuance of the 0.125% 2011
Convertible Notes, which terminated unexercised when these notes were repaid.
Also concurrent with the issuance of the 0.375% 2013 Convertible Notes, we sold warrants to acquire 31.5 million shares
of our common stock in May 2013 (the settlement date) that have an exercise price of $105.48 per share as of December 31, 2012.
If the average price of our common stock during a defined period ending on or about the settlement date exceeds the exercise price
of the warrants, the warrants will be net settled, at our option, in cash or shares of our common stock. In connection with the
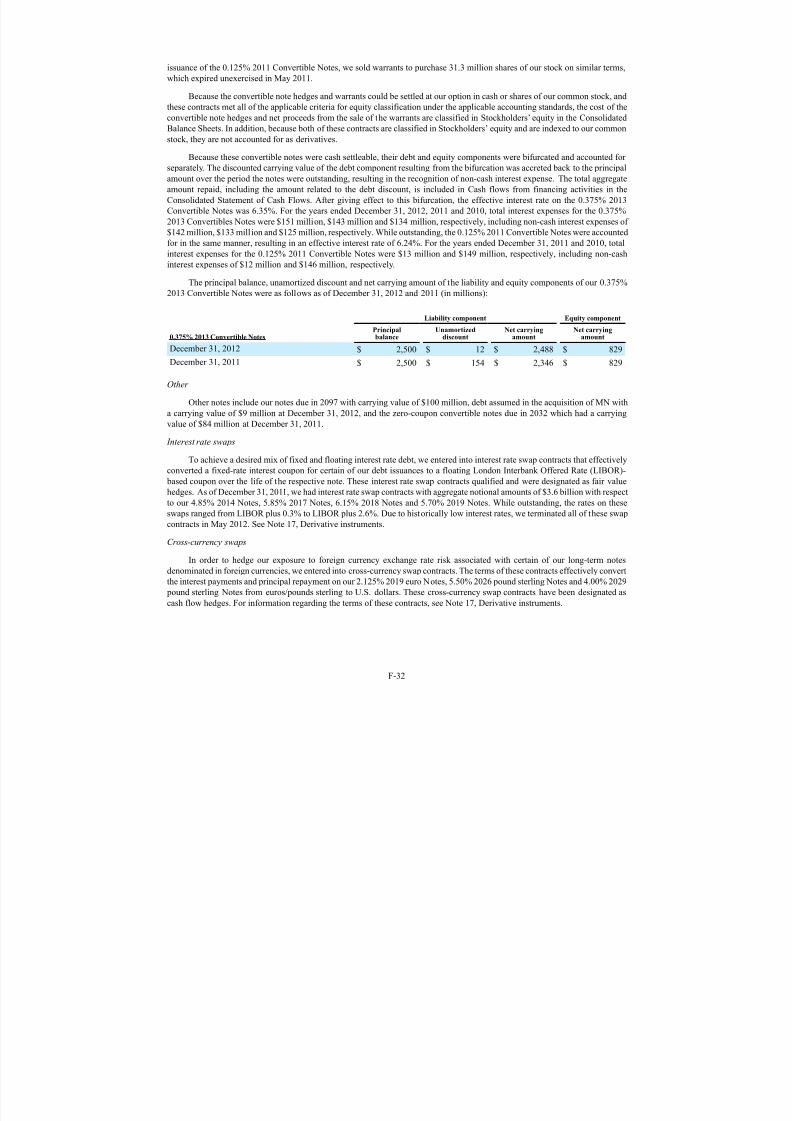
7/27/2019 Amgen Inc 2012 Annual Report
http://slidepdf.com/reader/full/amgen-inc-2012-annual-report 131/150
F-32
issuance of the 0.125% 2011 Convertible Notes, we sold warrants to purchase 31.3 million shares of our stock on similar terms,
which expired unexercised in May 2011.
Because the convertible note hedges and warrants could be settled at our option in cash or shares of our common stock, and
these contracts met all of the applicable criteria for equity classification under the applicable accounting standards, the cost of the
convertible note hedges and net proceeds from the sale of the warrants are classified in Stockholders’ equity in the Consolidated
Balance Sheets. In addition, because both of these contracts are classified in Stockholders’ equity and are indexed to our common
stock, they are not accounted for as derivatives.
Because these convertible notes were cash settleable, their debt and equity components were bifurcated and accounted for
separately. The discounted carrying value of the debt component resulting from the bifurcation was accreted back to the principal
amount over the period the notes were outstanding, resulting in the recognition of non-cash interest expense. The total aggregate
amount repaid, including the amount related to the debt discount, is included in Cash flows from financing activities in the
Consolidated Statement of Cash Flows. After giving effect to this bifurcation, the effective interest rate on the 0.375% 2013
Convertible Notes was 6.35%. For the years ended December31, 2012, 2011 and 2010, total interest expenses for the 0.375%
2013 Convertibles Notes were $151 million, $143 million and $134 million, respectively, including non-cash interest expenses of
$142 million, $133 million and $125 million, respectively. While outstanding, the 0.125% 2011 Convertible Notes were accounted
for in the same manner, resulting in an effective interest rate of 6.24%. For the years ended December31, 2011 and 2010, total
interest expenses for the 0.125% 2011 Convertible Notes were $13 million and $149 million, respectively, including non-cash
interest expenses of $12 million and $146 million, respectively.
The principal balance, unamortized discount and net carrying amount of the liability and equity components of our 0.375%
2013 Convertible Notes were as follows as of December31, 2012 and 2011 (in millions):
Liability component Equitycomponent
0.375% 2013 Convertible NotesPrincipalbalance
Unamortizeddiscount
Netcarryingamount
Netcarryingamount
December 31, 2012 $ 2,500 $ 12 $ 2,488 $ 829
December 31, 2011 $ 2,500 $ 154 $ 2,346 $ 829
Other
Other notes include our notes due in 2097 with carrying value of $100 million, debt assumed in the acquisition of MN with
a carrying value of $9 million at December31, 2012, and the zero-coupon convertible notes due in 2032 which had a carryingvalue of $84 million at December31, 2011.
Interest rate swaps
To achieve a desired mix of fixed and floating interest rate debt, we entered into interest rate swap contracts that effectively
converted a fixed-rate interest coupon for certain of our debt issuances to a floating London Interbank Offered Rate (LIBOR)-
based coupon over the life of the respective note. These interest rate swap contracts qualified and were designated as fair value
hedges. As of December 31, 2011, we had interest rate swap contracts with aggregate notional amounts of $3.6 billion with respect
to our 4.85% 2014 Notes, 5.85% 2017 Notes, 6.15% 2018 Notes and 5.70% 2019 Notes. While outstanding, the rates on these
swaps ranged from LIBOR plus 0.3% to LIBOR plus 2.6%. Due to historically low interest rates, we terminated all of these swap
contracts in May 2012. See Note 17, Derivative instruments.
Cross-currency swaps
In order to hedge our exposure to foreign currency exchange rate risk associated with certain of our long-term notes
denominated in foreign currencies, we entered into cross-currency swap contracts. The terms of these contracts effectively convert
the interest payments and principal repayment on our 2.125% 2019 euro Notes, 5.50% 2026 pound sterling Notes and 4.00% 2029
pound sterling Notes from euros/pounds sterling to U.S. dollars. These cross-currency swap contracts have been designated as
cash flow hedges. For information regarding the terms of these contracts, see Note 17, Derivative instruments.
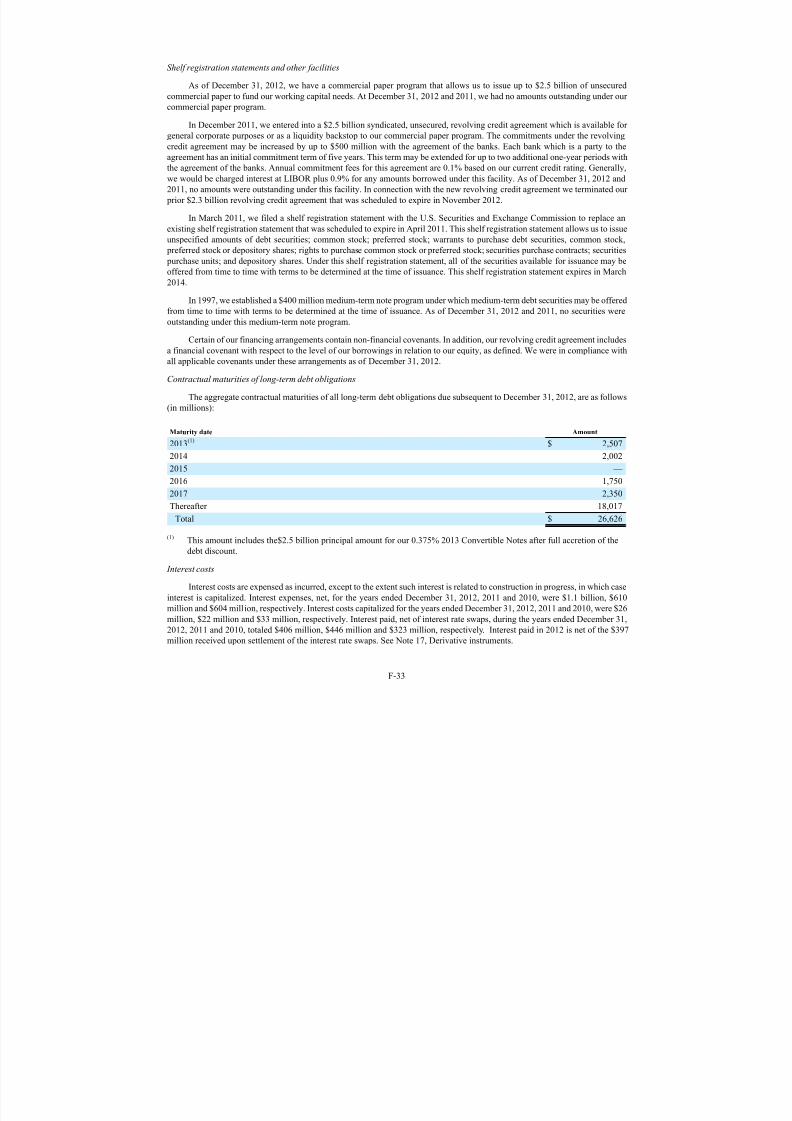
7/27/2019 Amgen Inc 2012 Annual Report
http://slidepdf.com/reader/full/amgen-inc-2012-annual-report 132/150
F-33
Shelf registration statements and other facilities
As of December31, 2012, we have a commercial paper program that allows us to issue up to $2.5 billion of unsecured
commercial paper to fund our working capital needs. At December31, 2012 and 2011, we had no amounts outstanding under our
commercial paper program.
In December 2011, we entered into a $2.5 billion syndicated, unsecured, revolving credit agreement which is available for
general corporate purposes or as a liquidity backstop to our commercial paper program. The commitments under the revolvingcredit agreement may be increased by up to $500 million with the agreement of the banks. Each bank which is a party to the
agreement has an initial commitment term of five years. This term may be extended for up to two additional one-year periods with
the agreement of the banks. Annual commitment fees for this agreement are 0.1% based on our current credit rating. Generally,
we would be charged interest at LIBOR plus 0.9% for any amounts borrowed under this facility. As of December31, 2012 and
2011, no amounts were outstanding under this facility. In connection with the new revolving credit agreement we terminated our
prior $2.3 billion revolving credit agreement that was scheduled to expire in November 2012.
In March 2011, we filed a shelf registration statement with the U.S. Securities and Exchange Commission to replace an
existing shelf registration statement that was scheduled to expire in April 2011. This shelf registration statement allows us to issue
unspecified amounts of debt securities; common stock; preferred stock; warrants to purchase debt securities, common stock,
preferred stock or depository shares; rights to purchase common stock or preferred stock; securities purchase contracts; securities
purchase units; and depository shares. Under this shelf registration statement, all of the securities available for issuance may be
offered from time to time with terms to be determined at the time of issuance. This shelf registration statement expires in March2014.
In 1997, we established a $400 million medium-term note program under which medium-term debt securities may be offered
from time to time with terms to be determined at the time of issuance. As of December31, 2012 and 2011, no securities were
outstanding under this medium-term note program.
Certain of our financing arrangements contain non-financial covenants. In addition, our revolving credit agreement includes
a financial covenant with respect to the level of our borrowings in relation to our equity, as defined. We were in compliance with
all applicable covenants under these arrangements as of December31, 2012.
Contractual maturities of long-term debt obligations
The aggregate contractual maturities of all long-term debt obligations due subsequent to December31, 2012, are as follows
(in millions):
Maturity date Amount
2013(1) $ 2,507
2014 2,002
2015 —
2016 1,750
2017 2,350
Thereafter 18,017
Total $ 26,626
(1) This amount includes the$2.5 billion principal amount for our 0.375% 2013 Convertible Notes after full accretion of the
debt discount.
Interest costs
Interest costs are expensed as incurred, except to the extent such interest is related to construction in progress, in which case
interest is capitalized. Interest expenses, net, for the years ended December31, 2012, 2011 and 2010, were $1.1 billion, $610
million and $604 million, respectively. Interest costs capitalized for the years ended December31, 2012, 2011 and 2010, were $26
million, $22 million and $33 million, respectively. Interest paid, net of interest rate swaps, during the years ended December31,
2012, 2011 and 2010, totaled $406 million, $446 million and $323 million, respectively. Interest paid in 2012 is net of the $397
million received upon settlement of the interest rate swaps. See Note 17, Derivative instruments.
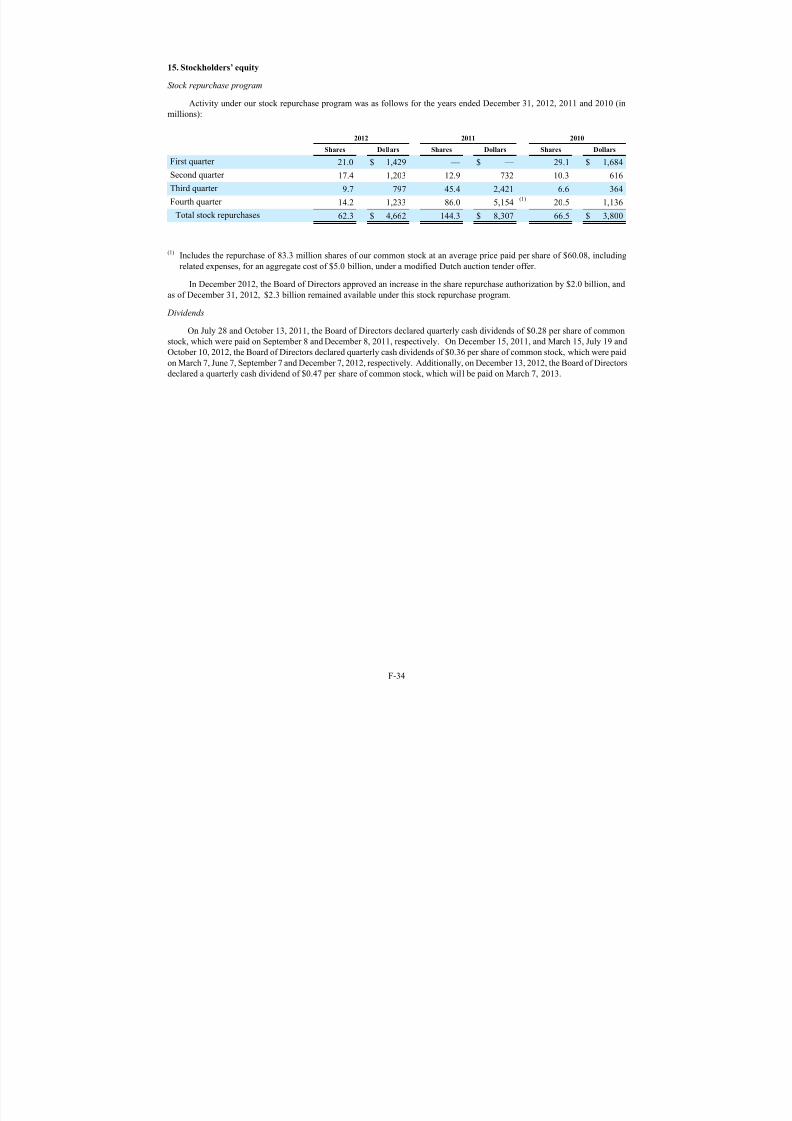
7/27/2019 Amgen Inc 2012 Annual Report
http://slidepdf.com/reader/full/amgen-inc-2012-annual-report 133/150
F-34
15. Stockholders’ equity
Stock repurchase program
Activity under our stock repurchase program was as follows for the years ended December31, 2012, 2011 and 2010 (in
millions):
2012 2011 2010
Shares Dollars Shares Dollars Shares Dollars
First quarter 21.0 $ 1,429 — $ — 29.1 $ 1,684
Second quarter 17.4 1,203 12.9 732 10.3 616
Third quarter 9.7 797 45.4 2,421 6.6 364
Fourth quarter 14.2 1,233 86.0 5,154(1)
20.5 1,136
Total stock repurchases 62.3 $ 4,662 144.3 $ 8,307 66.5 $ 3,800
___________
(1) Includes the repurchase of 83.3 million shares of our common stock at an average price paid per share of $60.08, including
related expenses, for an aggregate cost of $5.0 billion, under a modified Dutch auction tender offer.
In December 2012, the Board of Directors approved an increase in the share repurchase authorization by $2.0 billion, and
as of December 31, 2012, $2.3 billion remained available under this stock repurchase program.
Dividends
On July 28 and October 13, 2011, the Board of Directors declared quarterly cash dividends of $0.28 per share of common
stock, which were paid on September 8 and December 8, 2011, respectively. On December15, 2011, and March 15, July 19 and
October 10, 2012, the Board of Directors declared quarterly cash dividends of $0.36 per share of common stock, which were paid
on March7, June 7, September 7 and December 7, 2012, respectively. Additionally, on December 13, 2012, the Board of Directors
declared a quarterly cash dividend of $0.47 per share of common stock, which will be paid on March 7, 2013.
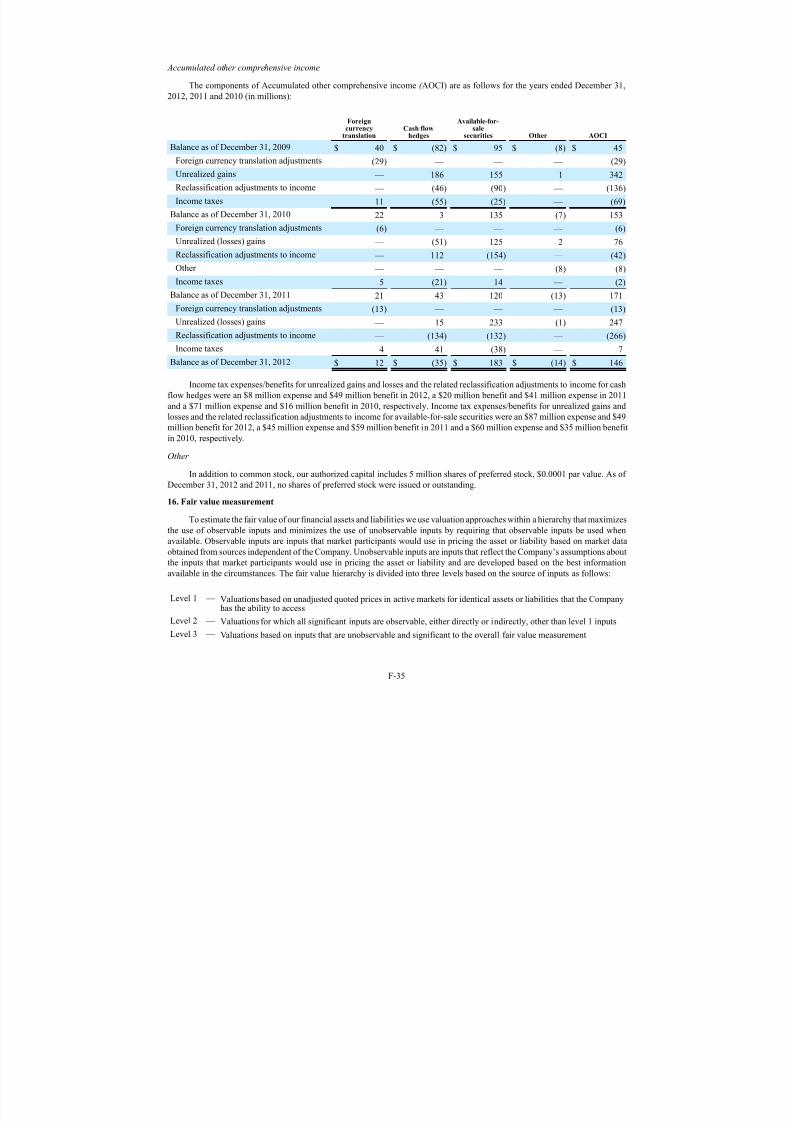
7/27/2019 Amgen Inc 2012 Annual Report
http://slidepdf.com/reader/full/amgen-inc-2012-annual-report 134/150
F-35
Accumulated other comprehensive income
The components of Accumulated other comprehensive income ( AOCI) are as follows for the years ended December31,
2012, 2011 and 2010 (in millions):
Foreigncurrency
translation
Cashflow
hedges
Available-for-sale
securities Other AOCI
Balance as of December 31, 2009 $ 40 $ (82) $ 95 $ (8) $ 45
Foreign currency translation adjustments (29) — — — (29)
Unrealized gains — 186 155 1 342
Reclassification adjustments to income — (46) (90) — (136)
Income taxes 11 (55) (25) — (69)
Balance as of December 31, 2010 22 3 135 (7) 153
Foreign currency translation adjustments (6) — — — (6)
Unrealized (losses) gains — (51) 125 2 76
Reclassification adjustments to income — 112 (154) — (42)
Other — — — (8) (8)
Income taxes 5 (21) 14 — (2)
Balance as of December 31, 2011 21 43 120 (13) 171
Foreign currency translation adjustments (13) — — — (13)
Unrealized (losses) gains — 15 233 (1) 247
Reclassification adjustments to income — (134) (132) — (266)
Income taxes 4 41 (38) — 7
Balance as of December 31, 2012 $ 12 $ (35) $ 183 $ (14) $ 146
Income tax expenses/benefits for unrealized gains and losses and the related reclassification adjustments to income for cash
flow hedges were an $8 million expense and $49 million benefit in 2012, a $20 million benefit and $41 million expense in 2011
and a $71 million expense and $16 million benefit in 2010, respectively. Income tax expenses/benefits for unrealized gains andlosses and the related reclassification adjustments to income for available-for-sale securities were an $87 million expense and $49
million benefit for 2012, a $45 million expense and $59 million benefit in 2011 and a $60 million expense and $35 million benefit
in 2010, respectively.
Other
In addition to common stock, our authorized capital includes 5 million shares of preferred stock, $0.0001 par value. As of
December31, 2012 and 2011, no shares of preferred stock were issued or outstanding.
16. Fair value measurement
To estimate the fair value of our financial assets and liabilities we use valuation approaches within a hierarchy that maximizes
the use of observable inputs and minimizes the use of unobservable inputs by requiring that observable inputs be used when
available. Observable inputs are inputs that market participants would use in pricing the asset or liability based on market data
obtained from sources independent of the Company. Unobservable inputs are inputs that reflect the Company’s assumptions about
the inputs that market participants would use in pricing the asset or liability and are developed based on the best information
available in the circumstances. The fair value hierarchy is divided into three levels based on the source of inputs as follows:
Level1 — Valuations based on unadjusted quoted prices in active markets for identical assets or liabilities that the Companyhas the ability to access
Level2 — Valuations for which all significant inputs are observable, either directly or indirectly, other than level 1 inputs
Level3 — Valuations based on inputs that are unobservable and significant to the overall fair value measurement
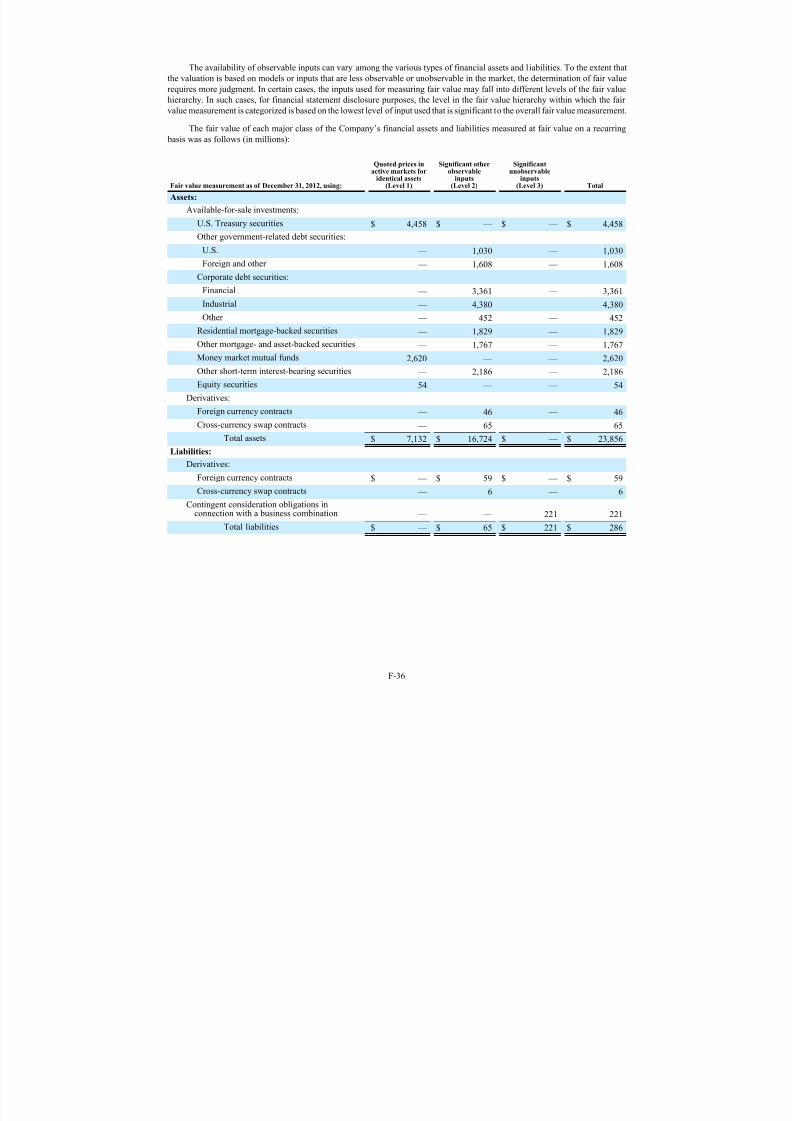
7/27/2019 Amgen Inc 2012 Annual Report
http://slidepdf.com/reader/full/amgen-inc-2012-annual-report 135/150
F-36
The availability of observable inputs can vary among the various types of financial assets and liabilities. To the extent that
the valuation is based on models or inputs that are less observable or unobservable in the market, the determination of fair value
requires more judgment. In certain cases, the inputs used for measuring fair value may fall into different levels of the fair value
hierarchy. In such cases, for financial statement disclosure purposes, the level in the fair value hierarchy within which the fair
value measurement is categorized is based on the lowest level of input used that is significant to the overall fair value measurement.
The fair value of each major class of the Company’s financial assets and liabilities measured at fair value on a recurring
basis was as follows (in millions):
Fairvaluemeasurementasof December 31, 2012, using:
Quotedpricesinactivemarketsfor
identical assets(Level 1)
Significantotherobservable
inputs(Level 2)
Significantunobservable
inputs(Level 3) Total
Assets:
Available-for-sale investments:
U.S. Treasury securities $ 4,458 $ — $ — $ 4,458
Other government-related debt securities:
U.S. — 1,030 — 1,030
Foreign and other — 1,608 — 1,608
Corporate debt securities:
Financial — 3,361 — 3,361
Industrial — 4,380 — 4,380
Other — 452 — 452
Residential mortgage-backed securities — 1,829 — 1,829
Other mortgage- and asset-backed securities — 1,767 — 1,767
Money market mutual funds 2,620 — — 2,620
Other short-term interest-bearing securities — 2,186 — 2,186
Equity securities 54 — — 54
Derivatives:
Foreign currency contracts — 46 — 46
Cross-currency swap contracts — 65 — 65
Total assets $ 7,132 $ 16,724 $ — $ 23,856
Liabilities:
Derivatives:
Foreign currency contracts $ — $ 59 $ — $ 59
Cross-currency swap contracts — 6 — 6
Contingent consideration obligations inconnection with a business combination — — 221 221
Total liabilities $ — $ 65 $ 221 $ 286
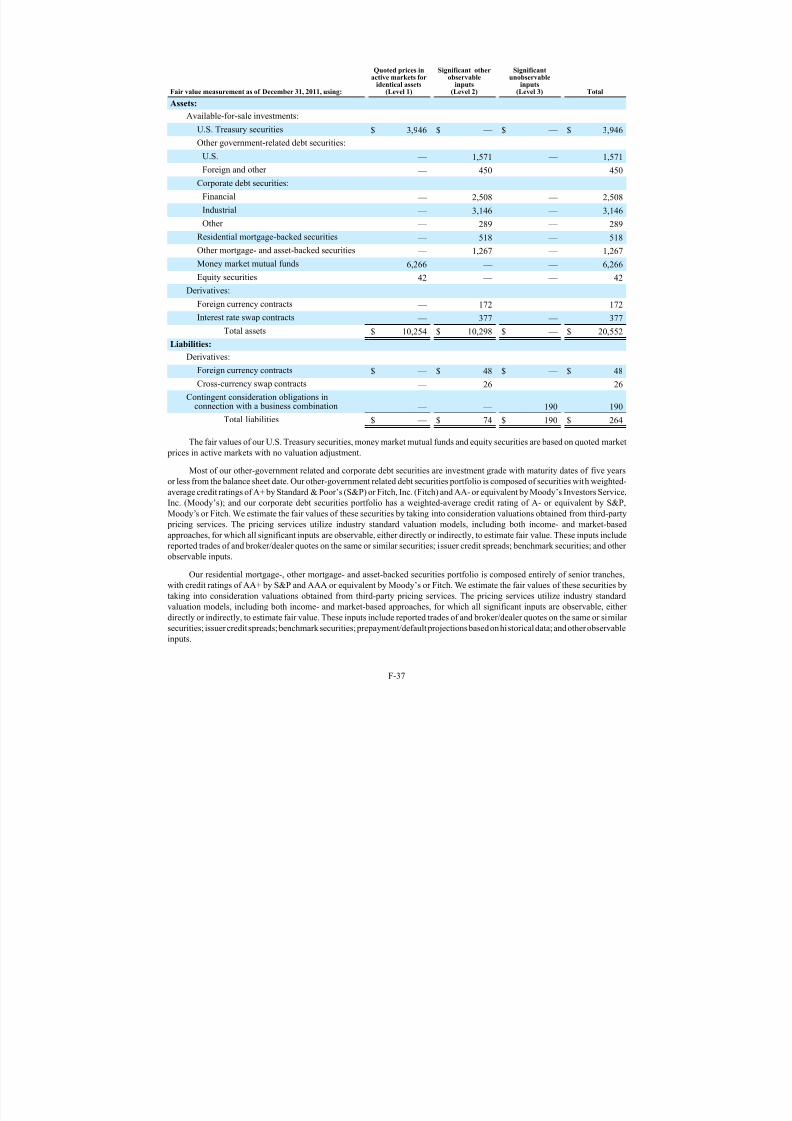
7/27/2019 Amgen Inc 2012 Annual Report
http://slidepdf.com/reader/full/amgen-inc-2012-annual-report 136/150
F-37
Fairvaluemeasurementasof December 31, 2011, using:
Quotedpricesinactive marketsfor
identical assets(Level 1)
Significant otherobservable
inputs(Level 2)
Significantunobservable
inputs(Level 3) Total
Assets:
Available-for-sale investments:
U.S. Treasury securities $ 3,946 $ — $ — $ 3,946
Other government-related debt securities:
U.S. — 1,571 — 1,571
Foreign and other — 450 — 450
Corporate debt securities:
Financial — 2,508 — 2,508
Industrial — 3,146 — 3,146
Other — 289 — 289
Residential mortgage-backed securities — 518 — 518
Other mortgage- and asset-backed securities — 1,267 — 1,267
Money market mutual funds 6,266 — — 6,266
Equity securities 42 — — 42
Derivatives:
Foreign currency contracts — 172 — 172
Interest rate swap contracts — 377 — 377
Total assets $ 10,254 $ 10,298 $ — $ 20,552
Liabilities:
Derivatives:
Foreign currency contracts $ — $ 48 $ — $ 48
Cross-currency swap contracts — 26 — 26
Contingent consideration obligations in
connection with a business combination — — 190 190Total liabilities $ — $ 74 $ 190 $ 264
The fair values of our U.S. Treasury securities, money market mutual funds and equity securities are based on quoted market
prices in active markets with no valuation adjustment.
Most of our other-government related and corporate debt securities are investment grade with maturity dates of five years
or less from the balance sheet date. Our other-government related debt securities portfolio is composed of securities with weighted-
average credit ratings of A+ by Standard& Poor’s (S&P) or Fitch, Inc. (Fitch) and AA- or equivalent by Moody’s Investors Service,
Inc. (Moody’s); and our corporate debt securities portfolio has a weighted-average credit rating of A- or equivalent by S&P,
Moody’s or Fitch. We estimate the fair values of these securities by taking into consideration valuations obtained from third-party
pricing services. The pricing services utilize industry standard valuation models, including both income- and market-based
approaches, for which all significant inputs are observable, either directly or indirectly, to estimate fair value. These inputs include
reported trades of and broker/dealer quotes on the same or similar securities; issuer credit spreads; benchmark securities; and other observable inputs.
Our residential mortgage-, other mortgage- and asset-backed securities portfolio is composed entirely of senior tranches,
with credit ratings of AA+ by S&P and AAA or equivalent by Moody’s or Fitch. We estimate the fair values of these securities by
taking into consideration valuations obtained from third-party pricing services. The pricing services utilize industry standard
valuation models, including both income- and market-based approaches, for which all significant inputs are observable, either
directly or indirectly, to estimate fair value. These inputs include reported trades of and broker/dealer quotes on the same or similar
securities; issuer credit spreads; benchmark securities; prepayment/default projections based on historical data; and other observable
inputs.

7/27/2019 Amgen Inc 2012 Annual Report
http://slidepdf.com/reader/full/amgen-inc-2012-annual-report 137/150
F-38
We value our other short-term interest-bearing securities at amortized cost, which approximates fair value given their near
term maturity dates.
Substantially all of our foreign currency forward and option derivatives contracts have maturities of three years or less and
all are with counterparties that have minimum credit ratings of A- or equivalent by S&P, Moody’s or Fitch. We estimate the fair
values of these contracts by taking into consideration valuations obtained from a third-party valuation service that utilizes an
income-based industry standard valuation model for which all significant inputs are observable, either directly or indirectly. These
inputs include foreign currency rates, LIBOR cash and swap rates and obligor credit default swap rates. In addition, inputs for our foreign currency option contracts also include implied volatility measures. These inputs, where applicable, are at commonly quoted
intervals. See Note 17, Derivative instruments.
Our cross-currency swap contracts are with counterparties that have minimum credit ratings of A- or equivalent by S&P,
Moody’s or Fitch. We estimate the fair values of these contracts by taking into consideration valuations obtained from a third-
party valuation service that utilizes an income-based industry standard valuation model for which all significant inputs are
observable either directly or indirectly. These inputs include foreign currency exchange rates, LIBOR, swap rates, obligor credit
default swap rates and cross-currency basis swap spreads. See Note 17, Derivative instruments.
All of our interest rate swap contracts were terminated in May 2012. (See Note 17, Derivative instruments.) While
outstanding, our interest rate swap contracts were with counterparties that had minimum credit ratings of A- or equivalent by S&P,
Moody’s or Fitch. We estimated the fair values of these contracts by using an income-based industry standard valuation model
for which all significant inputs were observable either directly or indirectly. These inputs included LIBOR, swap rates and obligor credit default swap rates.
As a result of our acquisition of BioVex in March 2011, we are obligated to pay its former shareholders up to $575 million
of additional consideration contingent upon achieving up to eight separate regulatory and sales-related milestones with regard to
talimogene laherparepvec, which was acquired in the acquisition and is currently in phase 3 clinical development for the treatment
of malignant melanoma. The three largest of these potential payments are $125 million each, including the amount due upon
completion of the filing of a BLA with the FDA. Potential payments are also due upon the first commercial sale in each of the
United States and the EU following receipt of marketing approval which includes use of the product in specified patient populations
and upon achievement of specified levels of sales within specified periods of time.
These contingent consideration obligations are recorded at their estimated fair values with any changes in fair value
recognized in earnings. The fair value measurements of these obligations are based on significant unobservable inputs, including
the estimated probabilities and timing of achieving the related regulatory events in connection with these milestones and, as
applicable, estimated annual sales. Significant changes (increases or decreases) in these inputs would result in corresponding
changes in the fair values of the contingent consideration obligations.
We revalue these contingent consideration obligations each reporting period until the related contingencies are resolved.
We estimate the fair values of these obligations by using a combination of probability-adjusted discounted cash flows, option
pricing techniques and a simulation model of expected annual sales. Quarterly, management in our R&D and commercial sales
organizations review key assumptions used in the fair value measurements of these obligations. In the absence of any significant
changes in key assumptions, the changes in fair values of these contingent consideration obligations reflect the passage of time
and changes in our credit risk adjusted rate used to discount obligations to present value. During the year ended December31,
2012, the increase in the estimated aggregate fair value of these obligations was $31 million, which was recorded in Other operating
expenses in the Consolidated Statement of Income.
There have been no transfers of assets or liabilities between the fair value measurement levels, and there were no material
remeasurements to fair value during the years ended December31, 2012 and 2011, of assets and liabilities that are not measuredat fair value on a recurring basis, except as discussed in Note 2, Business combinations, regarding an impairment of an indefinite-
lived intangible asset and Note 8, Cost savings initiatives, regarding an impairment of fixed assets which were recognized during
the year ended December31, 2012.
Summary of the fair value of other financial instruments
Cash equivalents
The estimated fair values of cash equivalents approximate their carrying values due to the short-term nature of these financial
instruments.
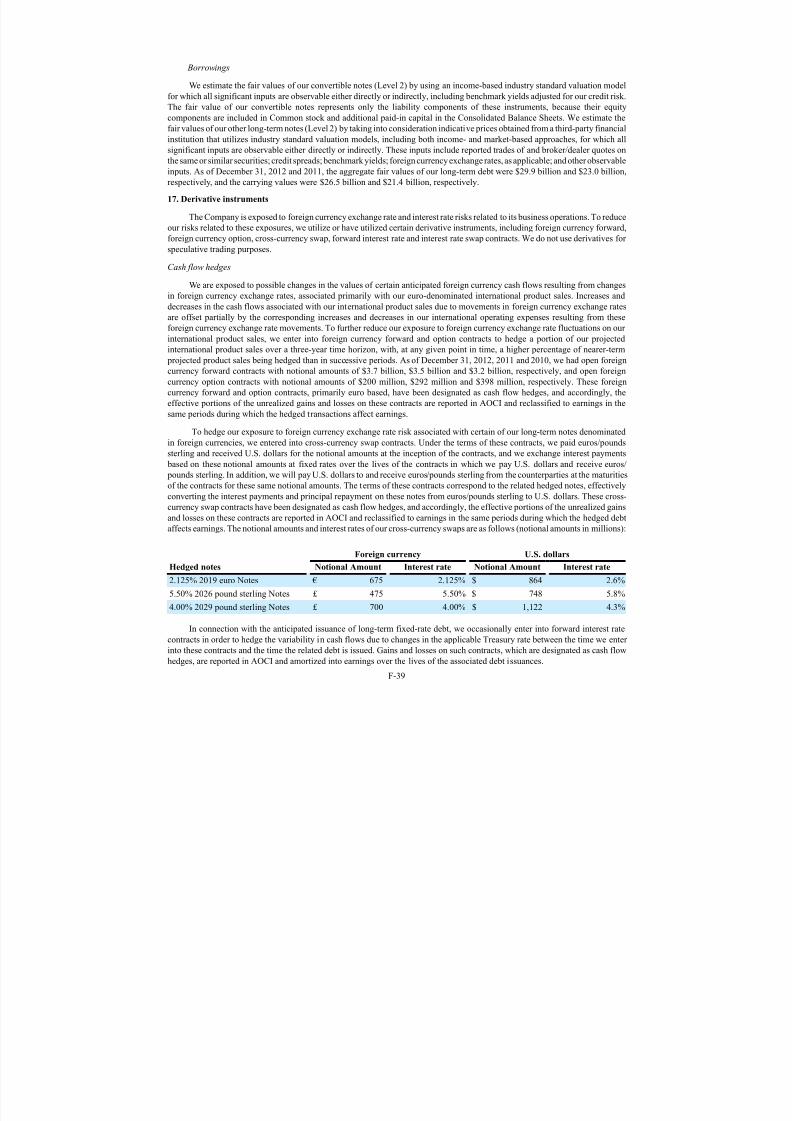
7/27/2019 Amgen Inc 2012 Annual Report
http://slidepdf.com/reader/full/amgen-inc-2012-annual-report 138/150
F-39
Borrowings
We estimate the fair values of our convertible notes (Level 2) by using an income-based industry standard valuation model
for which all significant inputs are observable either directly or indirectly, including benchmark yields adjusted for our credit risk.
The fair value of our convertible notes represents only the liability components of these instruments, because their equity
components are included in Common stock and additional paid-in capital in the Consolidated Balance Sheets. We estimate the
fair values of our other long-term notes (Level 2) by taking into consideration indicative prices obtained from a third-party financial
institution that utilizes industry standard valuation models, including both income- and market-based approaches, for which allsignificant inputs are observable either directly or indirectly. These inputs include reported trades of and broker/dealer quotes on
the same or similar securities; credit spreads; benchmark yields; foreign currency exchange rates, as applicable; and other observable
inputs. As of December31, 2012 and 2011, the aggregate fair values of our long-term debt were $29.9 billion and $23.0 billion,
respectively, and the carrying values were $26.5 billion and $21.4 billion, respectively.
17. Derivative instruments
The Company is exposed to foreign currency exchange rate and interest rate risks related to its business operations. To reduce
our risks related to these exposures, we utilize or have utilized certain derivative instruments, including foreign currency forward,
foreign currency option, cross-currency swap, forward interest rate and interest rate swap contracts. We do not use derivatives for
speculative trading purposes.
Cash flow hedges
We are exposed to possible changes in the values of certain anticipated foreign currency cash flows resulting from changes
in foreign currency exchange rates, associated primarily with our euro-denominated international product sales. Increases and
decreases in the cash flows associated with our international product sales due to movements in foreign currency exchange rates
are offset partially by the corresponding increases and decreases in our international operating expenses resulting from these
foreign currency exchange rate movements. To further reduce our exposure to foreign currency exchange rate fluctuations on our
international product sales, we enter into foreign currency forward and option contracts to hedge a portion of our projected
international product sales over a three-year time horizon, with, at any given point in time, a higher percentage of nearer-term
projected product sales being hedged than in successive periods. As of December31, 2012, 2011 and 2010, we had open foreign
currency forward contracts with notional amounts of $3.7 billion, $3.5 billion and $3.2 billion, respectively, and open foreign
currency option contracts with notional amounts of $200 million, $292 million and $398 million, respectively. These foreign
currency forward and option contracts, primarily euro based, have been designated as cash flow hedges, and accordingly, the
effective portions of the unrealized gains and losses on these contracts are reported in AOCI and reclassified to earnings in the
same periods during which the hedged transactions affect earnings.
To hedge our exposure to foreign currency exchange rate risk associated with certain of our long-term notes denominated
in foreign currencies, we entered into cross-currency swap contracts. Under the terms of these contracts, we paid euros/pounds
sterling and received U.S. dollars for the notional amounts at the inception of the contracts, and we exchange interest payments
based on these notional amounts at fixed rates over the lives of the contracts in which we pay U.S. dollars and receive euros/
pounds sterling. In addition, we will pay U.S. dollars to and receive euros/pounds sterling from the counterparties at the maturities
of the contracts for these same notional amounts. The terms of these contracts correspond to the related hedged notes, effectively
converting the interest payments and principal repayment on these notes from euros/pounds sterling to U.S. dollars. These cross-
currency swap contracts have been designated as cash flow hedges, and accordingly, the effective portions of the unrealized gains
and losses on these contracts are reported in AOCI and reclassified to earnings in the same periods during which the hedged debt
affects earnings. The notional amounts and interest rates of our cross-currency swaps are as follows (notional amounts in millions):
Foreign currency U.S. dollars
Hedged notes Notional Amount Interest rate Notional Amount Interest rate
2.125% 2019 euro Notes € 675 2.125% $ 864 2.6%
5.50% 2026 pound sterling Notes £ 475 5.50% $ 748 5.8%
4.00% 2029 pound sterling Notes £ 700 4.00% $ 1,122 4.3%
In connection with the anticipated issuance of long-term fixed-rate debt, we occasionally enter into forward interest rate
contracts in order to hedge the variability in cash flows due to changes in the applicable Treasury rate between the time we enter
into these contracts and the time the related debt is issued. Gains and losses on such contracts, which are designated as cash flow
hedges, are reported in AOCI and amortized into earnings over the lives of the associated debt issuances.
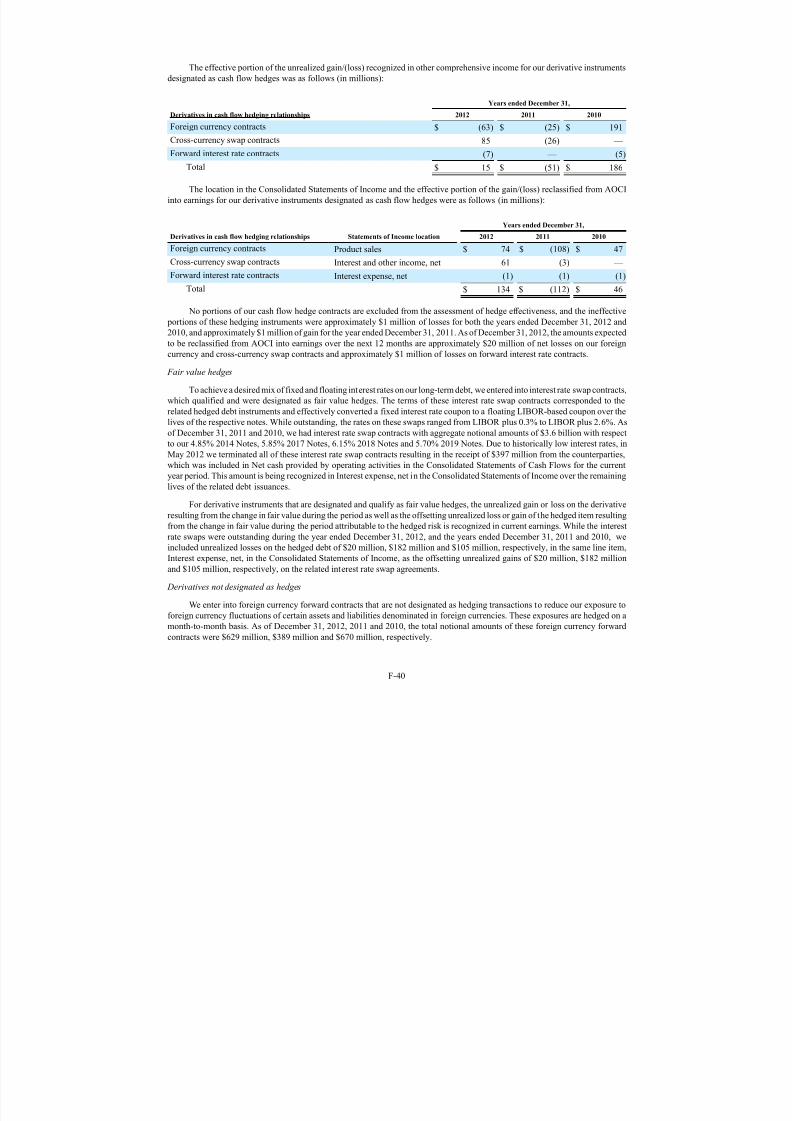
7/27/2019 Amgen Inc 2012 Annual Report
http://slidepdf.com/reader/full/amgen-inc-2012-annual-report 139/150
F-40
The effective portion of the unrealized gain/(loss) recognized in other comprehensive income for our derivative instruments
designated as cash flow hedges was as follows (in millions):
YearsendedDecember31,
Derivatives in cash flow hedging relationships 2012 2011 2010
Foreign currency contracts $ (63) $ (25) $ 191
Cross-currency swap contracts 85 (26) —
Forward interest rate contracts (7) — (5)
Total $ 15 $ (51) $ 186
The location in the Consolidated Statements of Income and the effective portion of the gain/(loss) reclassified from AOCI
into earnings for our derivative instruments designated as cash flow hedges were as follows (in millions):
YearsendedDecember31,
Derivatives in cash flow hedging relationships StatementsofIncomelocation 2012 2011 2010
Foreign currency contracts Product sales $ 74 $ (108) $ 47
Cross-currency swap contracts Interest and other income, net 61 (3) —
Forward interest rate contracts Interest expense, net (1) (1) (1)
Total $ 134 $ (112) $ 46
No portions of our cash flow hedge contracts are excluded from the assessment of hedge effectiveness, and the ineffective
portions of these hedging instruments were approximately $1 million of losses for both the years ended December31, 2012 and
2010, and approximately $1 million of gain for the year ended December31, 2011. As of December31, 2012, the amounts expected
to be reclassified from AOCI into earnings over the next 12 months are approximately $20 million of net losses on our foreign
currency and cross-currency swap contracts and approximately $1 million of losses on forward interest rate contracts.
Fair value hedges
To achieve a desired mix of fixed and floating interest rates on our long-term debt, we entered into interest rate swap contracts,
which qualified and were designated as fair value hedges. The terms of these interest rate swap contracts corresponded to the
related hedged debt instruments and effectively converted a fixed interest rate coupon to a floating LIBOR-based coupon over thelives of the respective notes. While outstanding, the rates on these swaps ranged from LIBOR plus 0.3% to LIBOR plus 2.6%. As
of December31, 2011 and 2010, we had interest rate swap contracts with aggregate notional amounts of $3.6 billion with respect
to our 4.85% 2014 Notes, 5.85% 2017 Notes, 6.15% 2018 Notes and 5.70% 2019 Notes. Due to historically low interest rates, in
May 2012 we terminated all of these interest rate swap contracts resulting in the receipt of $397 million from the counterparties,
which was included in Net cash provided by operating activities in the Consolidated Statements of Cash Flows for the current
year period. This amount is being recognized in Interest expense, net in the Consolidated Statements of Income over the remaining
lives of the related debt issuances.
For derivative instruments that are designated and qualify as fair value hedges, the unrealized gain or loss on the derivative
resulting from the change in fair value during the period as well as the offsetting unrealized loss or gain of the hedged item resulting
from the change in fair value during the period attributable to the hedged risk is recognized in current earnings. While the interest
rate swaps were outstanding during the year ended December31, 2012, and the years ended December 31, 2011 and 2010, we
included unrealized losses on the hedged debt of $20 million, $182 million and $105 million, respectively, in the same line item,Interest expense, net, in the Consolidated Statements of Income, as the offsetting unrealized gains of $20 million, $182 million
and $105 million, respectively, on the related interest rate swap agreements.
Derivatives not designated as hedges
We enter into foreign currency forward contracts that are not designated as hedging transactions to reduce our exposure to
foreign currency fluctuations of certain assets and liabilities denominated in foreign currencies. These exposures are hedged on a
month-to-month basis. As of December31, 2012, 2011 and 2010, the total notional amounts of these foreign currency forward
contracts were $629 million, $389 million and $670 million, respectively.

7/27/2019 Amgen Inc 2012 Annual Report
http://slidepdf.com/reader/full/amgen-inc-2012-annual-report 140/150
F-41
The location in the Consolidated Statements of Income and the amount of gain/(loss) recognized in earnings for our derivative
instruments not designated as hedging instruments were as follows (in millions):
YearsendedDecember31,
Derivatives not designated as hedginginstruments Statements of Income location 2012 2011 2010
Foreign currency contracts Interest and other income, net $ 19 $ (1) $ 32
The fair values of derivatives included in the Consolidated Balance Sheets were as follows (in millions):
Derivative assets Derivative liabilities
December 31, 2012 BalanceSheetlocation Fairvalue BalanceSheetlocation Fairvalue
Derivatives designated as hedging instruments:
Cross-currency swap contracts Othercurrentassets/Other noncurrentassets $ 65
Accrued liabilities/Othernoncurrentliabilities $ 6
Foreign currency contracts Othercurrentassets/Other noncurrentassets 45
Accrued liabilities/Othernoncurrentliabilities 58
Total derivatives designated as
hedging instruments 110 64Derivatives not designated as hedginginstruments:
Foreign currency contracts Other current assets 1 Accrued liabilities 1
Total derivatives not designated ashedging instruments 1 1
Total derivatives $ 111 $ 65
Derivative assets Derivative liabilities
December 31, 2011 BalanceSheetlocation Fairvalue BalanceSheetlocation Fairvalue
Derivatives designated as hedging instruments:
Interest rate swap contracts Othercurrentassets/
Other noncurrentassets $ 377
Accrued liabilities/
Othernoncurrentliabilities $ —
Cross-currency swap contracts Othercurrentassets/Other noncurrentassets —
Accrued liabilities/Othernoncurrentliabilities 26
Foreign currency contracts Othercurrentassets/Other noncurrentassets 172
Accrued liabilities/Othernoncurrentliabilities 48
Total derivatives designated ashedging instruments 549 74
Derivatives not designated as hedginginstruments:
Foreign currency contracts Other current assets — Accrued liabilities —
Total derivatives not designated as
hedging instruments — —
Total derivatives $ 549 $ 74
Our derivative contracts that were in liability positions as of December31, 2012, contain certain credit-risk-related contingent
provisions that would be triggered if: (i)we were to undergo a change in control and (ii)our or the surviving entity’s creditworthiness
deteriorates, which is generally defined as having either a credit rating that is below investment grade or a materially weaker
creditworthiness after the change in control. If these events were to occur, the counterparties would have the right, but not the
obligation, to close the contracts under early-termination provisions. In such circumstances, the counterparties could request
immediate settlement of these contracts for amounts that approximate the then current fair values of the contracts.
7/27/2019 Amgen Inc 2012 Annual Report
http://slidepdf.com/reader/full/amgen-inc-2012-annual-report 141/150
F-42
The cash flow effects of our derivatives contracts for the three years ended December31, 2012, are included within Net
cash provided by operating activities in the Consolidated Statements of Cash Flows.
18. Contingencies and commitments
Contingencies
In the ordinary course of business, we are involved in various legal proceedings and other matters, including those discussed
in this Note, that are complex in nature and have outcomes that are difficult to predict.
We record accruals for loss contingencies to the extent that we conclude that it is probable that a liability has been incurred
and the amount of the related loss can be reasonably estimated. We evaluate, on a quarterly basis, developments in legal proceedings
and other matters that could cause an increase or decrease in the amount of the liability that has been accrued previously.
Our legal proceedings range from cases brought by a single plaintiff to a class action with thousands of putative class
members. These legal proceedings, as well as other matters, involve various aspects of our business and a variety of claims
(including but not limited to patent infringement, marketing, pricing and trade practices and securities law), some of which present
novel factual allegations and/or unique legal theories. In each of the matters described in this filing, plaintiffs seek an award of a
not-yet-quantified amount of damages or an amount that is not material. In addition, a number of the matters pending against us
are at very early stages of the legal process (which in complex proceedings of the sort faced by us often extend for several years).
As a result, none of the matters described in these filings have progressed sufficiently through discovery and/or development of important factual information and legal issues to enable us to estimate a range of possible loss, if any, or such amounts are not
material. While it is not possible to accurately predict or determine the eventual outcomes of these items, an adverse determination
in one or more of these items currently pending could have a material adverse effect on our consolidated results of operations,
financial position or cash flows.
Certain of our legal proceedings and other matters are discussed below:
Federal Securities Litigation - In re Amgen Inc. Securities Litigation
The six federal class action stockholder complaints filed against Amgen Inc., Kevin W. Sharer, Richard D. Nanula, Dennis
M. Fenton, Roger M. Perlmutter, Brian M. McNamee, George J. Morrow, Edward V. Fritzky, Gilbert S. Omenn and Franklin P.
Johnson, Jr., (the Federal Defendants) in the U.S. District Court for the Central District of California (the California Central District
Court) on April17, 2007 ( Kairalla v. Amgen Inc., et al.), May1, 2007 ( Mendall v. Amgen Inc., et al.,& Jaffe v. Amgen Inc., et al.),May11, 2007 ( Eldon v. Amgen Inc., et al.), May21, 2007 ( Rosenfield v. Amgen Inc., et al.) and June18, 2007 ( Public Employees'
Retirement Association of Colorado v. Amgen Inc., et al.) were consolidated by the California Central District Court into one action
captioned In re Amgen Inc. Securities Litigation. The consolidated complaint was filed with the California Central District Court
on October2, 2007. The consolidated complaint alleges that Amgen and these officers and directors made false statements that
resulted in: (i)deceiving the investing public regarding Amgen's prospects and business; (ii)artificially inflating the prices of
Amgen's publicly traded securities and (iii)causing plaintiff and other members of the class to purchase Amgen publicly traded
securities at inflated prices. The complaint also makes off-label marketing allegations that, throughout the class period, the Federal
Defendants improperly marketed Aranesp® and EPOGEN® for off-label uses while aware that there were alleged safety signals
with these products. The plaintiffs seek class certification, compensatory damages, legal fees and other relief deemed proper. The
Federal Defendants filed a motion to dismiss on November8, 2007. On February4, 2008, the California Central District Court
granted in part, and denied in part, the Federal Defendants' motion to dismiss the consolidated amended complaint. Specifically,
the California Central District Court granted the Federal Defendants' motion to dismiss as to individual defendants Fritzky, Omenn,
Johnson, Fenton and McNamee, but denied the Federal Defendants' motion to dismiss as to individual defendants Sharer, Nanula,Perlmutter and Morrow.
A class certification hearing before the California Central District Court, was held on July 17, 2009 and on August 12, 2009,
the California Central District Court granted plaintiffs' motion for class certification. On August 28, 2009, Amgen filed a petition
for permission to appeal with the U.S. Court of Appeals for the Ninth Circuit (the Ninth Circuit Court) under Rule 23(f), regarding
the Order on Class Certification and the Ninth Circuit Court granted Amgen's permission to appeal on December 11, 2009. On
February 2, 2010, the California Central District Court granted Amgen's motion to stay the underlying action pending the outcome
of the Ninth Circuit Court 23(f) appeal. On October 14, 2011, the appeal under Rule 23(f) was argued before the Ninth Circuit
Court and on December 28, 2011, the Ninth Circuit Court denied the appeal. Amgen filed a petition for certiorari with the U.S.
Supreme Court on March 3, 2012, and on June 11, 2012, the Court granted Amgen's petition. Oral argument occurred on November

7/27/2019 Amgen Inc 2012 Annual Report
http://slidepdf.com/reader/full/amgen-inc-2012-annual-report 142/150
F-43
5, 2012. On February 27, 2013, the U.S. Supreme Court affirmed the decision of the Ninth Circuit Court and remanded the case
back to the California Central District Court for further proceedings.
State Derivative Litigation
Larson v. Sharer, et al.
The three state stockholder derivative complaints filed against Amgen Inc., Kevin W. Sharer, George J. Morrow, Dennis M.
Fenton, Brian M. McNamee, Roger M. Perlmutter, David Baltimore, Gilbert S. Omenn, Judith C. Pelham, Frederick W. Gluck,
Jerry D. Choate, J. Paul Reason, Frank J. Biondi, Jr., Leonard D. Schaeffer, Frank C. Herringer, Richard D. Nanula, Willard H.
Dere, Edward V. Fritzky, Franklin P. Johnson, Jr. and Donald B. Rice as defendants (the State Defendants) on May1, 2007 ( Larson
v. Sharer, et al.,& Anderson v. Sharer, et al.), and August13, 2007 (Weil v. Sharer, et al.) in the Superior Court of the State of
California, Ventura County (the Superior Court) were consolidated by the Superior Court under one action captioned Larson v.
Sharer, et al . The consolidated complaint was filed on July5, 2007. The complaint alleges that the State Defendants breached their
fiduciary duties, wasted corporate assets, were unjustly enriched and violated the California Corporations Code. Plaintiffs allege
that the State Defendants failed to disclose and/or misrepresented results of Aranesp ® clinical studies, marketed both Aranesp®
and EPOGEN® for off-label uses and that these actions or inactions caused stockholders to suffer damages. The complaints also
allege insider trading by the State Defendants. The plaintiffs seek treble damages based on various causes of action, reformed
corporate governance, equitable and/or injunctive relief, restitution, disgorgement of profits, benefits and other compensation, and
legal costs.
An amended consolidated complaint was filed on March 13, 2008, adding Anthony Gringeri as a State Defendant and
removing the causes of action for insider selling and misappropriation of information, violation of California Corporations Code
Section 25402 and violation of California Corporations Code Section 25403. On July 14, 2008, the Superior Court dismissed
without prejudice the consolidated state derivative class action. The judge also ordered a stay of any re-filing of an amended
complaint until the federal court has determined in the In re Amgen Inc. Securities Litigation action whether any securities fraud
occurred.
Birch v. Sharer, et al.
On January 23, 2009, a stockholder derivative lawsuit titled Birch v. Sharer, et al. was filed in the Superior Court of the
State of California, Los Angeles County (the Los Angeles Superior Court) naming Amgen Inc., Kevin W. Sharer, David Baltimore,
Frank J. Biondi, Jr., Jerry D. Choate, Vance D. Coffman, Frederick W. Gluck, Frank C. Herringer, Gilbert S. Omenn, Judith C.Pelham, J. Paul Reason, Leonard D. Schaeffer and Tom Zindrick as defendants. The complaint alleges derivative claims for breach
of fiduciary duty based on a purported failure to implement adequate internal controls and to oversee the Company's operations,
which plaintiff claims resulted in numerous lawsuits and investigations over a number of years. Plaintiff seeks damages on behalf
of Amgen, including costs and expenses, allegedly incurred, among other things, in connection with wrongful termination lawsuits
and potential violations of the Health Insurance Portability and Accountability Act. On February 25, 2009, the case was reassigned
to a judge in the Complex Department of the Los Angeles Superior Court. Amgen and the individual defendants filed motions to
dismiss on June 23, 2009.
Oral argument on Amgen and the individual defendants' motions to dismiss were heard on September 25, 2009 before the
Los Angeles Superior Court and the court granted the motions to dismiss but allowed the plaintiff an opportunity to amend her
complaint by October 21, 2009. Plaintiff filed a request for dismissal without prejudice with the court on October 23, 2009. On
October 29, 2009, Amgen received from plaintiff a stockholder demand on the Board of Directors to take action to remedy breaches
of fiduciary duties by the directors and certain executive officers of the Company. Ms. Birch alleged that the directors and certain
executive officers violated their core fiduciary principles, causing Amgen to suffer damages. She demanded that the Board of
Directors take action against each of the officers and directors to recover damages and to correct deficiencies in the Company's
internal controls that allowed the misconduct to occur. The Board of Directors completed its investigation and determined in its
business judgment that it was not in the best interests of the Company to pursue the claims made in the demand against any of the
individuals mentioned in the demand. Therefore, the Board voted to reject the demand and communicated this to Ms. Birch on
May 19, 2010.
On February 8, 2010, plaintiff filed another stockholder demand lawsuit in the Los Angeles Superior Court against the same
defendants in the original lawsuit but also added Board of Director members François de Carbonnel and Rebecca Henderson. The
allegations in the new complaint are nearly identical to those in the previously filed complaint. The case filed on February8, 2010
7/27/2019 Amgen Inc 2012 Annual Report
http://slidepdf.com/reader/full/amgen-inc-2012-annual-report 143/150
F-44
by plaintiff Birch was assigned to the Complex Division of the Los Angeles Superior Court. On June30, 2010, Amgen filed its
demurrer to plaintiff's complaint with the Complex Division of the Los Angeles Superior Court. On September29, 2010, the
Complex Division of the Los Angeles Superior Court denied Amgen's and the individual defendants' demurrers finding that the
plaintiff had adequately pled wrongful refusal. Amgen and the individual defendants filed answers on October29, 2010. On
December 9, 2010, the Complex Division of the Los Angeles Superior Court stayed the underlying action and Amgen and the
individual defendants filed a motion for judgment on the pleadings/motion for summary judgment. The motion for the judgment
on the pleadings was heard on January 31, 2011 and the Complex Division of the Los Angeles Superior Court dismissed the entirelawsuit with prejudice against both Amgen and the individual defendants without leave to amend. Following an appeal by plaintiff,
on June 21, 2012, the California State Appellate Court reversed the decision of the Complex Division of the Los Angeles Superior
Court. The case has been re-assigned to Judge Kenneth Freeman and Amgen and the individual defendants filed motions for
summary judgment on November 19, 2012. The motions for summary judgment will be heard on April 16, 2013.
Purnell v. Sharer, et al.
On January 24, 2013, a stockholder derivative lawsuit titled Purnell v. Sharer, et al. was filed in the Superior Court against
Amgen Inc., Kevin W. Sharer, Robert A. Bradway, David Baltimore, Frank J. Biondi, Jr., Vance D. Coffman, François de Carbonnel,
Rebecca M. Henderson, Frank C. Herringer, Leroy M. Hood, Tyler Jacks, Gilbert S. Omenn, Judith C. Pelham, J. Paul Reason,
Leonard D. Schaeffer and Ronald D. Sugar as defendants. The lawsuit alleges that the individual defendants breached their fiduciary
duties by failing to implement adequate internal controls which resulted on December 19, 2012 in the civil settlement, corporate
integrity agreement and criminal misdemeanor plea in connection with the Federal Investigations (see Government Investigationsand Qui Tam Actions below).
Federal Derivative Litigation
On May7, 2007, the stockholder derivative lawsuit of Durgin v. Sharer, et al., was filed in the California Central District
Court and named Amgen Inc., Kevin W. Sharer, George J. Morrow, Dennis M. Fenton, Brian M. McNamee, Roger M. Perlmutter,
David Baltimore, Gilbert S. Omenn, Judith C. Pelham, Frederick W. Gluck, Jerry D. Choate, J. Paul Reason, Frank J. Biondi, Jr.,
Leonard D. Schaeffer, Frank C. Herringer, Richard D. Nanula, Edward V. Fritzky and Franklin P. Johnson, Jr. as defendants. The
complaint alleges the same claims and requests the same relief as in the three state stockholder derivative complaints now
consolidated as Larson v. Sharer, et al . The case has been stayed for all purposes until thirty days after a final ruling on the motion
to dismiss by the California Central District Court in the In re Amgen Inc. Securities Litigation action.
On September21, 2007, the stockholder derivative lawsuit of Rosenblum v. Sharer, et al., was filed in the California CentralDistrict Court. This lawsuit was brought by a stockholder who previously made a demand on the Amgen Board on May 14, 2007.
The complaint alleges that the defendants breached their fiduciary duties, wasted corporate assets and were unjustly enriched.
Plaintiffs allege that the defendants failed to disclose and/or misrepresented results of Aranesp® clinical studies, marketed both
Aranesp® and EPOGEN® for off-label uses and that these actions or inactions as well as the Amgen market strategy caused damage
to the Company resulting in several inquiries, investigations and lawsuits that are costly to defend. The complaint also alleges
insider trading by the defendants. The plaintiffs seek treble damages based on various causes of action, reformed corporate
governance, equitable and/or injunctive relief, restitution, disgorgement of profits, benefits and other compensation, and legal
costs. The case was stayed for all purposes until thirty days after a final ruling on the motion to dismiss by the California Central
District Court in the In re Amgen Inc. Securities Litigation action.
Thereafter, on May 1, 2008, plaintiff in Rosenblum v. Sharer, et al., filed an amended complaint which removed Dennis
Fenton as a defendant and also eliminated the claims for insider selling by defendants. On July 28, 2008, the California CentralDistrict Court heard Amgen and the defendants' motion to dismiss and motion to stay. On July 30, 2008, the California Central
District Court granted Amgen and the defendants' motion to dismiss without prejudice and also granted a stay of the case pending
resolution of the In re Amgen Inc. Securities Litigation action.
ERISA Litigation
On August20, 2007, the ERISA class action lawsuit of Harris v. Amgen Inc., et al., was filed in the California Central District
Court and named Amgen Inc., Kevin W. Sharer, Frank J. Biondi, Jr., Jerry Choate, Frank C. Herringer, Gilbert S. Omenn, David
Baltimore, Judith C. Pelham, Frederick W. Gluck, Leonard D. Schaeffer, Jacqueline Allred, Raul Cermeno, Jackie Crouse, Lori
Johnston, Michael Kelly and Charles Bell as defendants. Plaintiffs claim that Amgen and the individual defendants breached their
fiduciary duties by failing to inform current and former employees who participated in the Amgen Retirement and Savings Plan

7/27/2019 Amgen Inc 2012 Annual Report
http://slidepdf.com/reader/full/amgen-inc-2012-annual-report 144/150
F-45
and the Retirement and Savings Plan for Amgen Manufacturing Limited of the alleged off-label promotion of both Aranesp® and
EPOGEN® while a number of studies allegedly demonstrated safety concerns in patients using ESAs. On February4, 2008, the
California Central District Court dismissed the complaint with prejudice as to plaintiff Harris, who had filed claims against Amgen
Inc. The claims alleged by the second plaintiff, Ramos, were also dismissed but the court granted the plaintiff leave to amend his
complaint. On February 1, 2008, the plaintiffs appealed the decision by the California Central District Court to dismiss the claims
of both plaintiffs Harris and Ramos to the Ninth Circuit Court. On May 19, 2008, plaintiff Ramos in the Harris v. Amgen Inc., et
al., action filed another lawsuit captioned Ramos v. Amgen Inc., et al., in the California Central District Court. The lawsuit isanother ERISA class action. The Ramos v. Amgen Inc., et al ., matter names the same defendants in the Harris v. Amgen Inc., et
al., matter plus four new defendants: Amgen Manufacturing Limited, Richard Nanula, Dennis Fenton and the Fiduciary Committee.
On July 14, 2009, the Ninth Circuit Court reversed the California Central District Court's decision in the Harrismatter and remanded
the case back to the California Central District Court. In the meantime, a third ERISA class action was filed by Don Hanks on
June 2, 2009 in the California Central District Court alleging the same ERISA violations as in the Harris and Ramos lawsuits.
On August 10, 2009, the Harris, Ramos and Hanks matters were consolidated by the California Central District Court into
one action captioned Harris, et. al. v. Amgen Inc. On October 13, 2009, the California Central District Court granted plaintiffs
Harris' and Ramos' motion to be appointed interim co-lead counsel. Plaintiffs filed an amended complaint on November 11, 2009
and added two additional plaintiffs, Jorge Torres and Albert Cappa. Amgen filed a motion to dismiss the amended/consolidated
complaint, and on March2, 2010, the California Central District Court dismissed the entire lawsuit without prejudice. Plaintiffs
filed an amended complaint on March23, 2010. Amgen then filed another motion to dismiss on April20, 2010. On June16, 2010,
the California Central District Court entered an order dismissing the entire lawsuit with prejudice. On June24, 2010, the plaintiffsfiled a notice of appeal with the Ninth Circuit Court. Petitioner's opening brief was served on December 20, 2010 and Amgen's
answering brief was filed on February 2, 2011. Oral argument occurred on February 17, 2012.
Government Investigations and Qui Tam Actions
On May 10, 2007, Amgen received a subpoena from the Attorney General of the State of New York seeking documents
related to Amgen's promotional activities, sales and marketing activities, medical education, clinical studies, pricing and contracting,
license and distribution agreements and corporate communications. Amgen fully cooperated in responding to the subpoena.
Beginning in late 2007, Amgen received a number of subpoenas from the U.S. Attorney's Offices for the Eastern District of
New York and the Western District of Washington, pursuant to the Health Insurance Portability and Accountability Act (18 U.S.C.
3486), for broad production of documents relating to its products and clinical trials. Amgen fully cooperated with the government's
document requests. Over the next several years, numerous current and former Amgen employees received civil and grand jurysubpoenas to provide testimony on a wide variety of subjects. We refer herein to these investigations conducted by the U.S.
Attorney's Offices for the Eastern District of New York and the Western District of Washington as the Federal Investigations.
On January14, 2008, Amgen received a subpoena from the New Jersey Attorney General's Office for production of documents
relating to one of its products. Amgen completed its response per the terms of the subpoena.
A U.S. government filing in the U.S. District Court for the District of Massachusetts (the Massachusetts District Court)
concerning the partially unsealed complaint filed pursuant to the Qui Tam provisions of the Federal Civil False Claims Act and
on behalf of 17 named states and the District of Columbia under their respective State False Claims Acts (the Massachusetts Qui
Tam Action) became public on or about May 7, 2009. The filing represented that, in addition to the Massachusetts Qui Tam Action,
there were nine other actions under the False Claim Act pending under seal against Amgen, including eight pending in the U.S.
District Court for the Eastern District of New York (the New York Eastern District Court) and one pending in the U.S. District
Court for the Western District of Washington. Together, with the Massachusetts Qui Tam Action, we refer to these actions as the
Original Qui Tam Actions. In the filing made public on May 7, 2009, the U.S. government represented that these ten Original Qui
Tam Actions alleged that Amgen engaged in a wide variety of illegal marketing practices with respect to various Amgen products
and that these were joint civil and criminal investigations being conducted by a wide variety and large number of federal and state
agencies.
On September 1, 2009, the U.S. government filed a notice of non-intervention and 14 states and the District of Columbia
filed notices of intervention in the Massachusetts Qui Tam Action. On October 30, 2009, 14 states and the District of Columbia
filed an amended complaint in the Massachusetts District Court entitled The United States of America, States of California,
Delaware, Florida, Georgia, Hawaii, Illinois, Indiana, Louisiana, Michigan, Nevada, New Hampshire, New Mexico, New York,
Tennessee and Texas and the Commonwealths of Massachusetts and Virginia and the District of Columbia, ex rel Kassie

7/27/2019 Amgen Inc 2012 Annual Report
http://slidepdf.com/reader/full/amgen-inc-2012-annual-report 145/150
F-46
Westmoreland v. Amgen Inc., Integrated Nephrology Network, AmerisourceBergen Specialty Group, ASD Healthcare and
AmerisourceBergen Corporation.The relator, Kassie Westmoreland, also filed a second amended complaint with the Massachusetts
District Court on the same day. The complaints alleged violations of the federal Anti-Kickback Statute and violations of state false
claims act statutes with regard to Amgen's marketing of overfill in vials of Aranesp® and with regard to Amgen's relationship with
the Integrated Nephrology Network (INN), a group purchasing organization. The relator's seconded amended complaint also
alleged that Amgen retaliated against and wrongfully terminated Ms. Westmoreland.
On January 20, 2010, the states of Florida and Texas voluntarily dismissed their complaints against Amgen. On February
12, 2010, February 16, 2010 and February 18, 2010, respectively, the states of New Hampshire, Louisiana and Nevada voluntarily
dismissed their complaints against Amgen. On February 23, 2010, the state of Delaware voluntarily dismissed its complaint against
Amgen. Also, on February 23, 2010, the Massachusetts District Court granted Amgen's motion to stay and sever the relator's
employment claims.
On April23, 2010, the Massachusetts District Court dismissed all of the claims of the relator, on behalf of the federal
government and the states of New Mexico and Georgia, and all of the claims of the remaining states, for failure to state valid legal
grounds upon which relief could be granted. On May26, 2010, the Massachusetts District Court granted leave for the relator to
file a fourth amended complaint. On May24, 2010, the states of New York, Massachusetts, Michigan, California, Illinois, and
Indiana filed notices of intent to appeal the Massachusetts District Court's judgment to the U.S. Court of Appeals for the First
Circuit (the First Circuit Court).
On September20, 2010, the Massachusetts District Court entered a written ruling denying Amgen's motions to dismiss the
relator's fourth amended complaint. On April 11, 2011, the Massachusetts District Court heard summary judgment arguments on
the fourth amended complaint from Amgen, INN and the relator. On July 22, 2011, the First Circuit Court issued a written decision
reversing the Massachusetts District Court's dismissal of the claims of the states of California, Illinois, Indiana, Massachusetts,
New Mexico, and New York and affirming the dismissal of the claims of Georgia.
In March 2011, the U.S. Attorney's Office of the Western District of Washington informed Amgen that the subject matter of
its investigation would be transferred to the U.S. Attorney's Office of the Eastern District of New York.
In October 2011, Amgen announced it had reached an agreement in principle to settle allegations relating to its sales and
marketing practices arising out of the Federal Investigations, and on December 19, 2012, Amgen announced that it had finalized
a settlement agreement (the Settlement Agreement), with the U.S. government, 49 states and the District of Columbia. The
Settlement Agreement resolved the Federal Investigations, the related state Medicaid claims (except for those of the State of SouthCarolina) and the claims of nine of the ten Original Qui Tam Actions. The Settlement Agreement also resolved the claims of one
of the other civil qui tam actions that had not been included in the agreement in principle but of which Amgen was made aware
during settlement discussions (see below). This additional qui tam action resolved by the Settlement Agreement (the Additional
Qui Tam) included allegations that Amgen's promotional, contracting, sales and marketing activities and arrangements relating to
ENBREL caused the submission of various false claims under the Federal Civil False Claims Act and various State False Claims
Acts. Under the Settlement Agreement, Amgen paid approximately $612 million to resolve its civil liability related to certain
promotional practices related to the drugs Aranesp®, EPOGEN®, NEUPOGEN®, Neulasta®, ENBREL and Sensipar ® as alleged
in the unsealed qui tam complaints and $150 million to resolve its criminal liability relating to the marketing of Aranesp®, as well
as accrued interest.
As part of the Settlement Agreement, Amgen pled guilty to a single misdemeanor count of misbranding Aranesp® by
promoting it in a way that was different from the dosages in the label. The plea was entered on December 18, 2012 in the New
York Eastern District Court and was accepted by the court on December 19, 2012. In connection with entering into the Settlement
Agreement, Amgen also entered into a corporate integrity agreement with the Office of Inspector General of the U.S. Department
of Health and Human Services that requires Amgen to maintain its corporate compliance program and to undertake a set of defined
corporate integrity obligations for a period of five years. In February 2013, Amgen resolved the state Medicaid claims of the State
of South Carolina related to the Federal Investigations for an immaterial amount. Amgen has accrued an immaterial amount to
resolve the remaining Original Qui Tam Action, which remains pending in the New York Eastern District Court.
As part of the settlement described above, Amgen was made aware that it was a defendant in several other civil qui tam
actions (the Other Qui Tams) in addition to those included in the October 2011 agreement in principle. As stated above, the
Additional Qui Tam was resolved by the Settlement Agreement. Amgen has been dismissed from two of the Other Qui Tams: U.S.
ex rel. May v. Amgen, et al. and another matter that continues under seal against other defendants. Amgen has reached a separate
7/27/2019 Amgen Inc 2012 Annual Report
http://slidepdf.com/reader/full/amgen-inc-2012-annual-report 146/150
F-47
agreement in principle and continues to expect to enter into a written settlement agreement to resolve a fourth Other Qui Tam, for
which Amgen has accrued an immaterial amount; that matter will remain under seal in the U.S. federal court where it was filed
until the settlement agreement is signed. The fifth and final Other Qui Tam action remains under seal in the U.S. federal court in
which it was filed and includes allegations that Amgen's promotional, contracting, sales and marketing activities and arrangements
relating to Aranesp®, NEUPOGEN®, Neulasta®, XGEVA®, Prolia®, Vectibix® and Nplate® caused the submission of various false
claims under the Federal Civil False Claims Act and various State False Claims Acts. Amgen continues to cooperate fully with
the government in its investigation of these allegations.
Commitments
We lease certain facilities and equipment related primarily to administrative, R&D, sales and marketing activities under non-
cancelable operating leases that expire through 2032. The following table summarizes the minimum future rental commitments
under non-cancelable operating leases as of December31, 2012 (in millions):
2013 $ 121
2014 97
2015 90
2016 79
2017 67
Thereafter 287
Total minimum operating lease commitments $ 741
Included in the table above are future rental commitments for abandoned leases in the amount of $331 million. Rental expense
on operating leases for the years ended December31, 2012, 2011 and 2010, was $117 million, $131 million and $115 million,
respectively.
In addition, we have minimum contractual purchase commitments with third-party manufacturers through 2014 that total
$39 million as of December31, 2012. Amounts purchased under these contractual purchase commitments for the years ended
December31, 2012, 2011 and 2010, were $123 million, $87 million and $68 million, respectively.
7/27/2019 Amgen Inc 2012 Annual Report
http://slidepdf.com/reader/full/amgen-inc-2012-annual-report 147/150
F-48
19. Segment information
We operate in one business segment — human therapeutics. Therefore, results of our operations are reported on a consolidated
basis for purposes of segment reporting, consistent with internal management reporting. Enterprise-wide disclosures about product
sales; revenues and long-lived assets by geographic area; and revenues from major customers are presented below.
Revenues
Revenues were as follows for the years ended December31, 2012, 2011 and 2010 (in millions):
2012 2011 2010
Product sales:
Neulasta® $ 4,092 $ 3,952 $ 3,558
NEUPOGEN® 1,260 1,260 1,286
ENBREL 4,236 3,701 3,534
Aranesp® 2,040 2,303 2,486
EPOGEN® 1,941 2,040 2,524
Sensipar ®/Mimpara® 950 808 714
Vectibix® 359 322 288
Nplate® 368 297 229
XGEVA® 748 351 8
Prolia® 472 203 33
Other 173 58 —
Total product sales 16,639 15,295 14,660
Other revenues 626 287 393
Total revenues $ 17,265 $ 15,582 $ 15,053
Geographic information
Outside the United States, we sell products principally in Europe and Canada. The geographic classification of product saleswas based on the location of the customer. The geographic classification of all other revenues was based on the domicile of the
entity from which the revenues were earned.
Certain geographic information with respect to revenues and long-lived assets (consisting of property, plant and equipment)
was as follows (in millions):
Years ended December31,
2012 2011 2010
Revenues:
United States $ 13,415 $ 11,985 $ 11,636
ROW 3,850 3,597 3,417
Total revenues $ 17,265 $ 15,582 $ 15,053
December31,
2012 2011
Long-lived assets:
United States $ 2,906 $ 3,144
Puerto Rico 1,908 1,993
ROW 512 283
Total long-lived assets $ 5,326 $ 5,420
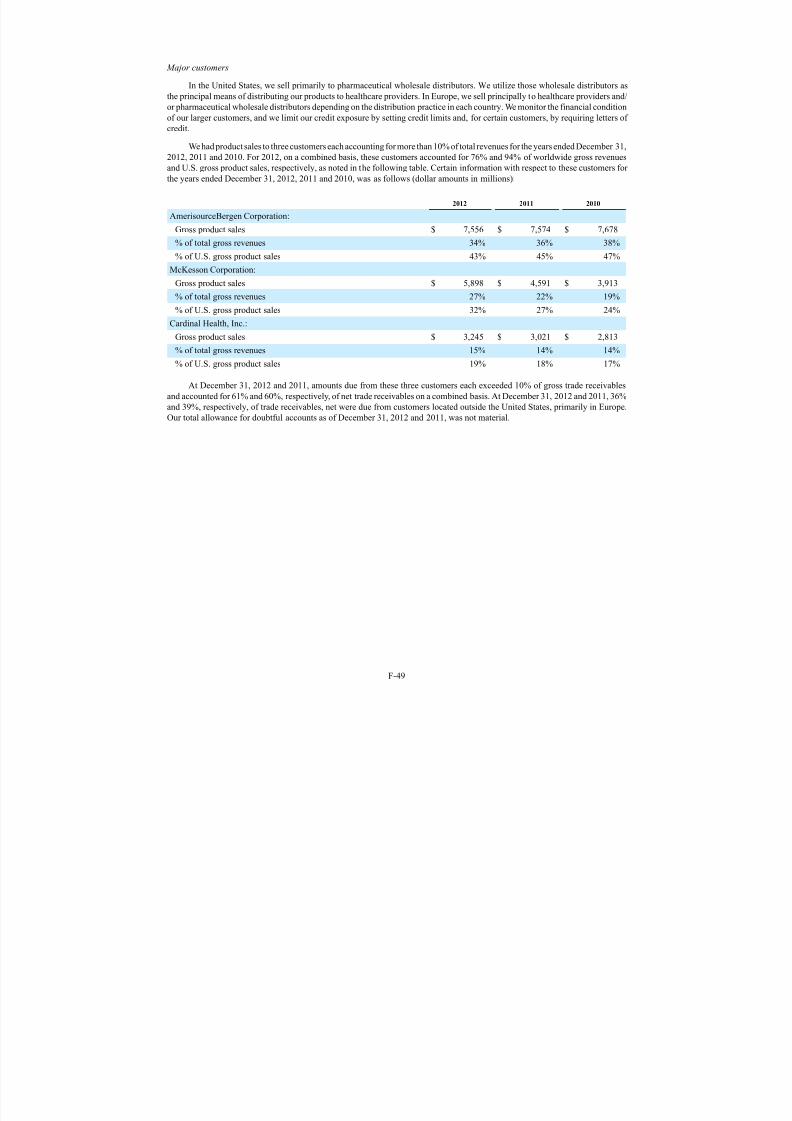
7/27/2019 Amgen Inc 2012 Annual Report
http://slidepdf.com/reader/full/amgen-inc-2012-annual-report 148/150
F-49
Major customers
In the United States, we sell primarily to pharmaceutical wholesale distributors. We utilize those wholesale distributors as
the principal means of distributing our products to healthcare providers. In Europe, we sell principally to healthcare providers and/
or pharmaceutical wholesale distributors depending on the distribution practice in each country. We monitor the financial condition
of our larger customers, and we limit our credit exposure by setting credit limits and, for certain customers, by requiring letters of
credit.
We had product sales to three customers each accounting for more than 10% of total revenues for the years ended December31,
2012, 2011 and 2010. For 2012, on a combined basis, these customers accounted for 76% and 94% of worldwide gross revenues
and U.S. gross product sales, respectively, as noted in the following table. Certain information with respect to these customers for
the years ended December31, 2012, 2011 and 2010, was as follows (dollar amounts in millions):
2012 2011 2010
AmerisourceBergen Corporation:
Gross product sales $ 7,556 $ 7,574 $ 7,678
% of total gross revenues 34% 36% 38%
% of U.S. gross product sales 43% 45% 47%
McKesson Corporation:Gross product sales $ 5,898 $ 4,591 $ 3,913
% of total gross revenues 27% 22% 19%
% of U.S. gross product sales 32% 27% 24%
Cardinal Health, Inc.:
Gross product sales $ 3,245 $ 3,021 $ 2,813
% of total gross revenues 15% 14% 14%
% of U.S. gross product sales 19% 18% 17%
At December31, 2012 and 2011, amounts due from these three customers each exceeded 10% of gross trade receivables
and accounted for 61% and 60%, respectively, of net trade receivables on a combined basis. At December31, 2012 and 2011, 36%
and 39%, respectively, of trade receivables, net were due from customers located outside the United States, primarily in Europe.Our total allowance for doubtful accounts as of December31, 2012 and 2011, was not material.
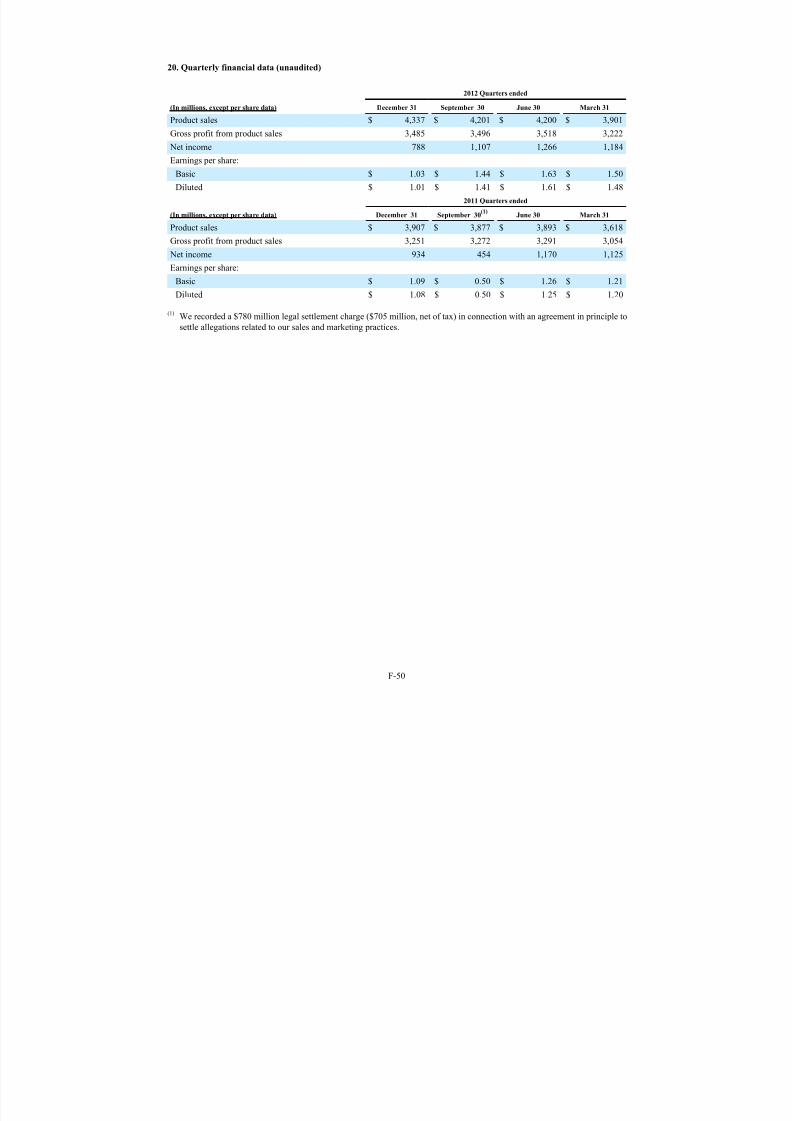
7/27/2019 Amgen Inc 2012 Annual Report
http://slidepdf.com/reader/full/amgen-inc-2012-annual-report 149/150
F-50
20. Quarterly financial data (unaudited)
2012 Quarters ended
(In millions, except per share data) December31 September 30 June30 March31
Product sales $ 4,337 $ 4,201 $ 4,200 $ 3,901
Gross profit from product sales 3,485 3,496 3,518 3,222 Net income 788 1,107 1,266 1,184
Earnings per share:
Basic $ 1.03 $ 1.44 $ 1.63 $ 1.50
Diluted $ 1.01 $ 1.41 $ 1.61 $ 1.48
2011 Quarters ended
(In millions, except per share data) December 31 September 30(1)
June30 March31
Product sales $ 3,907 $ 3,877 $ 3,893 $ 3,618
Gross profit from product sales 3,251 3,272 3,291 3,054
Net income 934 454 1,170 1,125
Earnings per share:
Basic $ 1.09 $ 0.50 $ 1.26 $ 1.21
Diluted $ 1.08 $ 0.50 $ 1.25 $ 1.20
(1) We recorded a $780 million legal settlement charge ($705 million, net of tax) in connection with an agreement in principle to
settle allegations related to our sales and marketing practices.

7/27/2019 Amgen Inc 2012 Annual Report
http://slidepdf.com/reader/full/amgen-inc-2012-annual-report 150/150
SCHEDULE II
AMGEN INC.
VALUATION AND QUALIFYING ACCOUNTS
Years ended December 31, 2012, 2011 and 2010
(In millions)
Allowance for doubtful accounts
Balanceatbeginningof period
Additionschargedtocosts andexpenses
Otheradditions Deductions
Balanceat end
of period
Year ended December 31, 2012 $ 54 $ 7 $ — $ — $ 61
Year ended December 31, 2011 $ 42 $ 17 $ — $ 5 $ 54
Year ended December 31, 2010 $ 32 $ 10 $ — $ — $ 42