america’s hospitals: improving quality and safety · america’s hospitals: improving quality and...
TRANSCRIPT

1America’s Hospitals: Improving Quality and Safety – The Joint Commission’s Annual Report 2014
®
®
Top Performer on Key Quality Measures®®
America’s Hospitals: Improving Quality and SafetyThe Joint Commission’s Annual Report
2014
2 America’s Hospitals: Improving Quality and Safety – The Joint Commission’s Annual Report 2014
Table of Contents
Letter from The Joint Commission President and CEO ................................................................................................3
Executive Summary ..................................................................................................................................................4-10
Graph 1: Percent of hospitals with overall accountability composite greater than 95 percent .........................................9
The Top Performer on Key Quality Measures® program ............................................................................................11-12
Accountability Measures Summary ........................................................................................................................13-14
Table 1: Measure set composite results for accountability measures .............................................................................13
Table 2: Percentage of hospitals achieving composite rates greater than 95 percent for
accountability measure sets ..........................................................................................................................................14
National Performance Summary ............................................................................................................................15-25
Table 3: Heart attack care measure results ...................................................................................................................15
Table 4: Heart failure care measure results ..................................................................................................................16
Table 5: Pneumonia care measure results ....................................................................................................................16
Table 6: Surgical care measure results ..........................................................................................................................17
Table 7: Children’s asthma care measure results ..........................................................................................................18
Table 8: Inpatient psychiatric services measure results .................................................................................................19
Table 9: Inpatient psychiatric services ratio measure results ....................................................................................20-21
Table 10: Venous thromboembolism (VTE) care measure results................................................................................22
Table 11: Stroke care measure results ..........................................................................................................................22
Table 12: Perinatal care measure results .......................................................................................................................23
Table 13: Immunization measure results .....................................................................................................................23
Table 14: Percentage of hospitals achieving 95 percent or greater performance ......................................................24-25
Understanding the Quality of Care Measures .........................................................................................................26-29
Glossary .................................................................................................................................................................30-33
Appendix................................................................................................................................................................34-40
Appendix 1: Short and original measure names ......................................................................................................34-35
Appendix 2: 2013 accountability measures ..................................................................................................................36
Appendix 3: 2013 core measures being tested or evaluated against accountability measure criteria ..............................37
Appendix 4: Timeline for development of America’s Hospitals: Improving Quality and Safety annual report .................38
Appendix 5: Number of hospitals that submit accountability measure data and number of
Top Performer hospitals for each state .....................................................................................................................39-40
List of 2013 Top Performer on Key Quality Measures® hospitals ...............................................................................41-72
List of 2013 Top Performer on Key Quality Measures® hospitals exceeding measure requirements ............................73-74

3America’s Hospitals: Improving Quality and Safety – The Joint Commission’s Annual Report 2014
Letter from The Joint Commission President and CEOAmerica’s hospitals continue to make dramatic strides toward the highly reliable use of evidence-based interventions that increase the chances of healthy outcomes. Their improvements are documented in this year’s America’s Hospitals: Improving Quality and Safety –The Joint Commission’s Annual Report 2014.
Delivering the right treatment in the right way at the right time is a cornerstone of health care. By working collaboratively with health care leaders to identify evidence-based treatments and to measure hospital performance in delivering them, The Joint Commission has been able to track fundamental health care quality improvement over the past 12 years.
Each year, the quality standards’ bar is raised and hospitals have responded to the challenge. This year, 1,224 hospitals have earned recognition by the Top Performer on Key Quality Measures® program – an 11 percent increase from last year. Now, 36.9 percent of all Joint
Commission-accredited hospitals reporting accountability measure performance data for 2013 are Top Performer hospitals – the highest percentage achieving Top Performer status ever. Representing rural and urban locations, all U.S. regions and all sizes and types of hospitals, the Top Performer hospitals are highlighted at www.jointcommission.org and on The Joint Commission’s Quality Check® website – www.qualitycheck.org.
Just as important is the collective performance of more than 3,300 American hospitals on 46 individual accountability measures of evidence-based care. Three new perinatal care accountability measures were introduced in 2013. On the other 43 measures, hospitals have shown steady improvement over the past few years, demonstrating the nationwide implementation of evidence-based quality improvement processes.
Effective January 1, 2014, to encourage further quality improvement, The Joint Commission increased from four to six the required number of selected core measure sets for which hospitals must submit data. A group of 44 Top Performer hospitals took steps toward this requirement a year early by collecting and reporting data on five or more core measure sets in 2013 and achieving Top Performer thresholds on all of those sets. These hospitals deserve special congratulations for their initiative.
As readers peruse the national performance tables in this report, they will notice the regularity at which hospitals are achieving performance of 95 percent or above on many measures. It’s important to remember that improving to this level was not easy and took many years, and that we still have a long way to go on these and other measures of quality health care.
Broadly sharing our solutions and our challenges will shorten the path to further improvement. The Joint Commission recognizes the extraordinary efforts that Top Performer hospitals have made to significantly improve the quality of health care. We encourage all hospitals to continue to strive for continuous excellence in the care they provide.
Sincerely,
Mark R. Chassin, M.D., F.A.C.P., M.P.P, M.P.H.
President and Chief Executive Officer
The Joint Commission

4 America’s Hospitals: Improving Quality and Safety – The Joint Commission’s Annual Report 2014
Executive SummaryAs a result of their commitment to continual quality improvement, 1,224 hospitals have achieved the outstanding
accountability measure performance required to be included in the Top Performer on Key Quality Measures® program for 2014
(using 2013 data). These hospitals represent 36.9 percent of all Joint Commission-accredited hospitals reporting accountability
measure performance data for 2013, and include general, children’s, psychiatric, surgical and cardiac specialty, and critical
access hospitals.
An accountability measure is a quality measure that meets four criteria designed to identify measures that produce the greatest
positive impact on patient outcomes when hospitals demonstrate improvement. (For more information, see accountability
process measure in the Glossary, and Appendices 2 and 3.)
America’s Hospitals: Improving Quality and Safety –The Joint Commission’s Annual Report 2014. recognizes hospitals for their
exemplary performance in providing evidence-based interventions in the right way and at the right time. This report also
summarizes the performance of all Joint Commission-accredited hospitals on 46 accountability measures (see Appendix 2) of
evidence-based care processes closely linked to positive patient outcomes.
Accountability measures for heart attack care, heart failure care, pneumonia care, surgical care, children’s asthma care, and
inpatient psychiatric services have been followed for five years or more, with results dating back to 2009 included in this
report. Accountability measures for venous thromboembolism (VTE) care, stroke care, perinatal care, and immunization have
been compiled from two, three or four years, with all years’ results included in this report.
The magnitude of improvement on overall composite accountability measure performance has been 15.8 percentage points
since 2002 and 2.2 percentage points since 2009. Improvement on individual measures since 2009 has ranged from a small
fraction of a percentage point (for a measure that improved from 99.9 percent to 100.0 percent) to 28.6 percentage points.
However, relatively small percentage-point improvements in measures for which performance is already strong can often
require as much or even more diligence than large percentage-point improvements where much room for improvement exists.
All improvements are important and contribute to better care for patients.
While the data show impressive gains in hospital quality performance, improvements can still be made. Some hospitals
perform better than others in treating particular conditions. Quality and safety results for specific hospitals can be found at
www.qualitycheck.org.
More than 3,300 Joint Commission-accredited hospitals contributed data. See the Glossary for definitions.

5America’s Hospitals: Improving Quality and Safety – The Joint Commission’s Annual Report 2014
Key Findings
1. The number of hospitals recognized by the Top Performer on Key Quality Measures® program has increased by
11 percent from last year, with 1,224 hospitals earning this achievement for 2014. These hospitals represent
36.9 percent of all Joint Commission-accredited hospitals reporting accountability measure performance data for 2013.
There is at least one Top Performer hospital in each state.
Each of the 1,224 Top Performer hospitals met three performance criteria based on 2013 accountability measure data. A
recognized hospital must: 1) achieve cumulative performance of 95 percent or above across all reported accountability
measures; 2) achieve performance of 95 percent or above on each and every reported accountability measure where there are
at least 30 denominator cases; and 3) have at least one core measure set that has a composite rate of 95 percent or above, and
(within that measure set) all applicable individual accountability measures have a performance rate of 95 percent or above. See
the specific eligibility criteria.
A 95 percent score means a hospital provided an evidence-based practice 95 times out of every 100 opportunities to provide
the practice. Each accountability measure represents an evidence-based practice – for example, giving aspirin at arrival for heart
attack patients, giving antibiotics one hour before surgery, and providing a home management plan for children with asthma.
The nation’s 124 academic medical centers continue to increase their presence in the Top Performer ranks, with the number
rising from four in 2011, to 24 in 2012, to 35 in 2013. This performance is particularly impressive given their size and the
complexity of their care delivery processes. Also increasing their Top Performer percentages from 2012 to 2013 are hospitals in
virtually every demographic category: rural, urban, for-profit, not-for-profit, teaching, and non-teaching. All bed-size categories
and all U.S. geographical regions have also achieved continual annual improvement.
2. Of the 1,224 Top Performer hospitals, 712 achieved the distinction for the past two years in a row, 314 for the past
three consecutive years, and 147 for the past four years.
In addition to the 1,224 hospitals (36.9 percent of all Joint Commission-accredited hospitals reporting accountability measure
performance data for 2013) achieving Top Performer status, another 718 hospitals (21.6 percent) fell slightly short by missing
95 percent performance on only one measure. These 718 hospitals are “on track” to potentially achieve Top Performer status
next year. Well over half of Joint Commission-accredited hospitals are Top Performer hospitals or on track to become one soon.
In last year’s report, there were 673 on-track hospitals; this year, 258, or 38 percent, of those on-track hospitals attained Top
Performer status.
This improvement is supported by numerous efforts of The Joint Commission, including accreditation itself, the
accountability measures, and the structured and audited data process. In addition, to help accredited hospitals improve core
measure performance – and perhaps achieve Top Performer status – The Joint Commission provides an online Core Measure
Solution Exchange®, available through the Joint Commission Connect extranet. This exchange promotes the sharing of success
stories among hospitals. To date, 249 core measure solutions have been posted by hospitals that have dramatically improved
and sustained their performance. Hospitals are encouraged to post to the exchange solutions their peers would find useful.
Executive Summary (Cont’d)

6 America’s Hospitals: Improving Quality and Safety – The Joint Commission’s Annual Report 2014
Executive Summary (Cont’d)Increase in Top Performer hospitals
in 2010, 2011, 2012 and 2013
1300
1200
1000
800
600
400
200
02010 2011 2012 2013
406
1224
620
1099
3. A group of 44 Top Performer hospitals exceeded 2013 expectations by collecting and reporting data on five or more
core measure sets – more than the required number of four – and achieving Top Performer thresholds on all of those
sets.
This achievement is notable because the required number of selected core measure sets for which a hospital must submit data
increased from four to six, effective January 1, 2014. Increasing the required number is expected to encourage further quality
improvement.
4. Hospital performance on accountability measures has improved significantly over time, greatly enhancing the quality
of care provided in Joint Commission-accredited hospitals. Still, more improvement is needed and is expected to
continue.
The Joint Commission illustrates improvement with a “composite” result, which sums up the results of all individual
accountability measures into a single summary score. In 2013, Joint Commission-accredited hospitals achieved 97.6 percent
composite accountability measure performance on 17.5 million opportunities to perform care processes closely linked to
positive patient outcomes – an improvement of 2.2 percentage points since 2009 and 15.8 percentage points since 2002, when
hospitals achieved 81.8 percent composite performance on 957,000 opportunities.
The 2013 overall composite includes 44 of the 46 accountability measures. For more information, see Appendix 2 or the
applicable table in the National Performance Summary section of this report.

7America’s Hospitals: Improving Quality and Safety – The Joint Commission’s Annual Report 2014
Executive Summary (Cont’d)While hospitals achieved 95 percent or better performance on most individual measures, more improvement is needed. For
example, hospitals can improve their performance on these measures relating to providing care plans or discharge instructions:
creating home management care plans for child asthma patients (88.9 percent performance), transmitting continuing
care plans for psychiatric patients (88.3 percent performance), and providing warfarin discharge instructions for venous
thromboembolism (VTE) patients (85.9 percent performance).
Composite accountability measure performance of 85 percent is a performance requirement in The Joint Commission’s
hospital accreditation program (standard PI.02.01.03, Element of Performance 1), and 95.4 percent of Joint Commission-
accredited hospitals met this requirement in 2013. This requirement is intended to help improve performance on selected
ORYX® core measures of patient care. (This standard does not apply to the critical access hospital program.) The Joint
Commission’s ORYX initiative integrates outcomes and other performance measurement data into the accreditation process.
5. Joint Commission-accredited hospitals have significantly improved the quality of care provided to heart attack,
pneumonia, surgical care, children’s asthma care, inpatient psychiatric, venous thromboembolism (VTE), stroke, and
immunization patients, according to composite accountability measure results.
Composite accountability measures for heart attack and pneumonia care have been compiled since 2002, surgical care since
2005, children’s asthma care since 2008, inpatient psychiatric services since 2009, venous thromboembolism (VTE) and
stroke care since 2010, and immunization since 2012. The measures for perinatal care have been compiled since 2011, but
this is the first year these measures have been calculated into the accountability composite results. For more information about
accountability composite results versus composite results, see “Note on Calculations and Methodology” on page 28.
Note: The composites for each year are calculated on measures active for the year; active measures can change from year to year. The
two measures in the immunization set were formerly a part of the pneumonia care set. There is no accountability composite for heart
failure care since there is only one heart failure accountability measure. A composite must have at least two measures. However, the
overall accountability composite results (see graph 1) include the one heart failure measure.
See the tables in the National Performance Summary section of this report for the list of measures included in the
composite results for each measure set.
• The 2013 heart attack care result is 99.0 percent, up from 97.7 percent in 2009 – an improvement of 1.3 percentage
points. A 99.0 percent score means that hospitals provided an evidence-based heart attack treatment 990 times for every
1,000 opportunities to do so.
• The 2013 pneumonia care result is 97.6 percent, up from 92.9 percent in 2009 – an improvement of 4.7 percentage
points.
• The 2013 surgical care result is 98.7 percent, up from 95.8 percent in 2009 – an improvement of 2.9 percentage points.
• The 2013 children’s asthma care result is 96.2 percent, up from 88.1 percent in 2009 – an improvement of 8.1
percentage points.
• The 2013 inpatient psychiatric services result is 90.3 percent, up from 80.5 percent in 2009 – an improvement of 9.8
percentage points.
• The 2013 venous thromboembolism (VTE) care result is 92.9 percent, up from 82.7 when measurement began in
2010 – an improvement of 10.2 percentage points.

8 America’s Hospitals: Improving Quality and Safety – The Joint Commission’s Annual Report 2014
Executive Summary (Cont’d)
• The 2013 stroke care result is 97.0 percent, up from 92.7 percent when measurement began in 2010 – an
improvement of 4.3 percentage points.
• The 2013 perinatal care result is 74.1 percent, up from 53.2 percent when measurement began in 2011 – an
improvement of 20.9 percentage points.
• The 2013 immunization result is 91.3 percent up from 88.6 percent when measurement began in 2012 – an
improvement of 2.7 percentage points.
6. The percentage of Joint Commission-accredited hospitals achieving composite accountability measure performance
greater than 95 percent in 2013 was 81.1 percent, down from 83.0 percent in 2012.
This decline is primarily due to the addition of the perinatal care accountability measure set, on which only 5.6 percent of
hospitals achieved composite rates of more than 95 percent. The result of the accountability measure for exclusive breast milk
feeding considering mother’s choice (69.2 percent) was the main factor lowering the perinatal care composite result. There is
much room for improvement on this and other perinatal care measures, which more hospitals will be required to report next
year.
In 2009, only 53.6 percent of Joint Commission-accredited hospitals achieved 95 percent performance on measures in five sets
– heart attack care, pneumonia care, surgical care, children’s asthma care, and inpatient psychiatric services.
The result of 81.1 percent of hospitals achieving composite measure performance greater than 95 percent is different than
the 97.6 percent overall accountability composite measure performance. The first result measures the percent of hospitals
achieving overall composite performance greater than 95 percent. The second result identifies the rate at which evidence-based
core measure practice is provided – combined over all hospitals – for every 100 opportunities to do so.

9America’s Hospitals: Improving Quality and Safety – The Joint Commission’s Annual Report 2014
Executive Summary (Cont’d)
Graph 1: Percent of hospitals with overall accountability composite greater than 95 percent
2002 2003 2004 2005 2006 2007 2008 2009 2010 2011 2012 2013
100
75
50
25
0
Perc
ent E
xcee
ding
95
perc
ent
Since implementation in 2002, the average number of hospitals reporting data was 3,245, and ranged from 3,073 to 3,419.

10 America’s Hospitals: Improving Quality and Safety – The Joint Commission’s Annual Report 2014
What’s new this year
• The Top Performer on Key Quality Measures® program recognized 1,224 Joint Commission-accredited hospitals
achieving excellence in accountability measure performance.
• A group of 44 Top Performer hospitals exceeded expectations by collecting and reporting data on five or more core
measure sets – more than the required number of four sets – and achieving Top Performer thresholds on all of those
sets.
• For the first time, a perinatal care measure set consisting of five measures was used in the calculation of the composite
accountability measures. Also, the pneumonia care antibiotics to ICU measure was reactivated, effective with January
1, 2013 discharges, after being temporarily deactivated for calendar year 2012 due to an algorithm error. This measure,
the inpatient psychiatric justification for multiple antipsychotic medications measure, and the three perinatal measures
were added this year to the calculation of composite rates.
Executive Summary (Cont’d)

11America’s Hospitals: Improving Quality and Safety – The Joint Commission’s Annual Report 2014
The Top Performer on Key Quality Measures® program recognizes Joint
Commission-accredited hospitals that attain and sustain excellence in
accountability measure performance. This annual recognition program
occurs in the fall of each year and coincides with the publication
of America’s Hospitals: Improving Quality and Safety –The Joint
Commission’s Annual Report 2014.
There are 1,224 hospitals being recognized for 2013 – an 11 percent
increase from last year; they represent 36.9 percent of all Joint
Commission-accredited hospitals reporting accountability measure performance data for 2013. Of the 1,224 Top Performer
hospitals, 712 achieved the distinction for the past two years in a row, 314 for the past three consecutive years and 147 for the
past four consecutive years. Each year, the percentage of Top Performer hospitals will vary. (Most Joint Commission-accredited
hospitals are required to report performance measure data to The Joint Commission while many critical access hospitals
voluntarily report these data.)
How Top Performer hospitals are determined
Recognition in The Joint Commission’s Top Performer on Key Quality Measures® program is based on an aggregation of
accountability measure data reported to The Joint Commission during the previous calendar year. This year’s program
results are based on data that were reported for 2013. A recognized hospital must meet three performance criteria based on
accountability data: 1) achieve cumulative performance of 95 percent or above across all reported accountability measures;
2) achieve performance of 95 percent or above on each and every reported accountability measure where there are at least 30
denominator cases; and 3) have at least one core measure set that has a composite rate of 95 percent or above, and (within that
measure set) all applicable individual accountability measures have a performance rate of 95 percent or above. See the specific
eligibility criteria.
Why the Top Performer program was developed
The Top Performer on Key Quality Measures® program is designed to inspire better performance on accountability measures
and to serve as an incentive for all hospitals to improve and provide the best care possible. The program also provides an
opportunity for recognized hospitals to celebrate their achievement of excellence in accountability measure performance.
The Top Performer on Key Quality Measures® program is consistent with pay-for-performance trends being enacted by federal
and state government and many private payers. In addition, the program is a way to provide transparency to the public in the
reporting of performance at the hospitals where they receive care.
Since 2002, hospitals have been reporting data to The Joint Commission and have continuously shown improvement in
performance on core measures. Most hospitals not recognized among the 1,224 Top Performer hospitals are performing well
on accountability measures but have room for improvement. For example, 718 hospitals (21.6 percent) narrowly missed Top
Performer recognition by having sub-95 percent performance on only one measure. To assist hospitals in improving their
accountability measure performance, The Joint Commission provides the Core Measure Solution Exchange ®, available on
The Joint Commission’s secure extranet site, Joint Commission Connect™.
The Top Performer on Key Quality Measures® program
LIST OF 2013 TOP PERFORMER HOSPITALS
See pages 41-74 for this year’s list of Top
Performer on Key Quality Measures® hospitals,
including hospitals that exceed measure
requirements (pages 73-74).

12 America’s Hospitals: Improving Quality and Safety – The Joint Commission’s Annual Report 2014
The Top Performer on Key Quality Measures® program
To date, 249 core measure solutions have been posted on the Core Measure Solution Exchange. Each solution provides a description of the steps to success that individual hospitals have used to reach and sustain high performance levels on a broad range of core measures. The Core Measure Solution Exchange is intended to serve as a resource for accredited hospitals seeking to improve their performance – and perhaps en route to achieving Top Performer status.
Number of Top Performer hospitals by state
This report’s Appendix 5 includes a table that shows the number of Joint Commission-accredited hospitals within each state
(and the District of Columbia, Puerto Rico and Department of Defense international locations) that have achieved Top
Performer status at least once since 2010. The table also shows the number of Joint Commission-accredited hospitals within
each state that submit data to The Joint Commission and, therefore, are eligible to become Top Performer recognized hospitals.
Core Measure Solution Exchange®

13America’s Hospitals: Improving Quality and Safety – The Joint Commission’s Annual Report 2014
Accountability Measures Summary Accountability measures are evidence-based care processes closely linked to positive patient outcomes. These measures are most
suitable for use in programs that hold providers accountable for their performance to external oversight entities and to the
public.
Composite measures combine the results of related measures into a single percentage rating calculated by adding up the
number of times recommended evidence-based care was provided to patients (measure numerator) and dividing this sum by
the total number of opportunities to provide this care (measure denominator).
Composite for accountability measures: The 2013 overall accountability composite calculation is derived from a total of
44 accountability measures: measures from 10 sets (heart attack care, heart failure care, pneumonia care, surgical care,
children’s asthma care, inpatient psychiatric services, venous thromboembolism (VTE) care, stroke care, immunization and
perinatal care). Two ratio measures from the inpatient psychiatric services set are not included in the overall accountability
composite. There is no heart failure care measure set composite because a measure set composite must have at least two
measures and the heart failure set is comprised of only one accountability measure. For more information, see “Note on
Calculations and Methodology” on page 28.
The overall 2013 composite calculation corresponds to the fourth quarter 2013 data on the ORYX Performance Measure
Report (PMR).
See Glossary for definitions.
Accountability composite measure sets 2009 2010 2011 2012 2013
Heart attack care composite 97.7% 98.4% 98.5% 98.8% 99.0%
Pneumonia care composite 92.9% 95.2% 96.2% 97.4% 97.6%
Surgical care composite 95.8% 96.4% 97.6% 98.3% 98.7%
Children’s asthma care composite 88.1% 92.4% 94.7% 95.5% 96.2%
Inpatient psychiatric services composite 80.5% 88.1% 87.3% 89.7% 90.3%
Venous thromboembolism (VTE) care composite N/A 82.7% 89.9% 91.0% 92.9%
Stroke care composite N/A 92.7% 94.9% 96.2% 97.0%
Immunization composite N/A N/A N/A 88.6% 91.3%
Perinatal care composite N/A N/A N/A N/A 74.1%
Overall 95.4% 95.6% 96.6% 97.6% 97.6%
Table 1: Measure set composite results for accountability measures

14 America’s Hospitals: Improving Quality and Safety – The Joint Commission’s Annual Report 2014
Table 2: Percentage of hospitals achieving composite rates greater than 95 percent for accountability measure sets
Note: The number of accountability measures used in the overall composite rate
varies each year.
Accountability Measures Summary (Cont’d)
Accountability composite measure sets 2009 2010 2011 2012 2013
Heart attack care composite 81.0% 87.9% 86.7% 89.2% 91.9%
Pneumonia care composite 39.3% 60.8% 70.6% 85.3% 85.7%
Surgical care composite 64.1% 71.4% 86.5% 91.6% 94.6%
Children’s asthma care composite 27.8% 46.7% 51.0% 63.6% 73.4%
Inpatient psychiatric services composite 13.9% 28.2% 22.9% 51.4% 41.9%
Venous thromboembolism (VTE) care composite N/A 5.5% 25.8% 45.5% 50.7%
Stroke care composite N/A 35.9% 55.4% 68.1% 78.4%
Immunization composite N/A N/A N/A 17.9% 38.0%
Perinatal care composite N/A N/A NA NA 5.6%
Overall 53.6% 65.3% 74.6% 83.0% 81.1%

15America’s Hospitals: Improving Quality and Safety – The Joint Commission’s Annual Report 2014
National Performance Summary Results are determined by the number of times the hospital met the measure (such as giving aspirin at arrival for heart attack
patients) divided by the number of opportunities (eligible patients for the measure) the hospital had during the year. Results
are expressed as a percentage.
All improvements or decreases in performance are statistically significant. Many of the smaller percentage improvements
occurred within large patient populations, meaning that significantly more patients received a treatment. In some cases,
performance was already quite high and there was less room for improvement.
Composite measures combine the results of all individual process measures on a similar medical condition into a single
percentage rating calculated by adding up the number of times recommended evidence-based care was provided to patients
and dividing this sum by the total number of opportunities to provide this care.
Composite for all measures: The composite for all measures calculation is derived from the accountability measures for each
measure set. These composite results have historically been provided in previous annual reports, allowing them to be tracked
from year-to-year. Any exclusions to the composite are noted with the tables.
See Glossary for definitions.
Performance measure 2009 2010 2011 2012 2013 Improvement since 2009 (percentage
points)
Heart attack care composite 97.7% 98.4% 98.5% 98.8% 99.0% 1.3%
Aspirin at arrival 98.4% 98.9% 99.2% 99.3% 99.4% 1.0%
Aspirin at discharge 98.4% 98.8% 99.1% 99.3% 99.3% 0.9%
ACEI or ARB at discharge 95.5% 96.6% 97.5% 97.8% 98.1% 2.6%
Beta-blocker at discharge 98.3% 98.6% 99.0% 99.2% 99.2% 0.9%
Fibrinolytic therapy within 30 minutes 55.2% 60.5% 60.2% 65.4% 60.3% 5.1%
PCI therapy within 90 minutes 87.4% 91.2% 93.7% 95.1% 96.0% 8.6%
Statin prescribed at discharge N/A N/A 97.5% 98.3% 98.6% 1.1%
Table 3: Heart attack care measure results
Since implementation in 2002, the average number of hospitals reporting data was 2,348 and ranged from 1,576 to 2,788.

16 America’s Hospitals: Improving Quality and Safety – The Joint Commission’s Annual Report 2014
Performance measure 2009 2010 2011 2012 2013
Pneumonia care composite 92.9% 95.2% 96.2% 97.4% 97.6% 4.7%
Blood cultures in ICU 95.5% 96.9% 97.7% 98.2% 98.4% 2.9%
Blood cultures in ED 95.0% 96.4% 97.1% 97.7% 98.0% 3.0%
Antibiotics to non-ICU patients 94.5% 95.2% 96.1% 96.5% 97.0% 2.5%
Antibiotics to ICU patients 67.5% 77.2% 89.2% N/A 92.8% 25.3%
National Performance Summary (Cont’d)
Table 5: Pneumonia care measure results
Note: The composites for 2009-2011 included two additional measures: influenza vaccination and pneumococcal vaccination. The antibiotics to ICU patients measure was temporarily inactivated for calendar year 2012 due to an algorithm error; it was reactivated, effective with January 1, 2013 discharges. The influenza vaccination and pneumococcal vaccination measures were pulled from the pneumonia care measure set to create the new immunization measure set.
Table 4: Heart failure care measure results
Performance measure 2009 2010 2011 2012 2013
Heart failure care
ACEI or ARB at discharge 94.3% 95.5% 96.6% 97.1% 97.4% 3.1%
Improvement since 2009 (percentage
points)
Improvement since 2009 (percentage
points)
Since implementation in 2002, the average number of hospitals reporting data was 2,601 and ranged from 2,062 to 3,012.
Since implementation in 2002, the average number of hospitals reporting data was 2,738 and ranged from 1,935 to 2,962.

17America’s Hospitals: Improving Quality and Safety – The Joint Commission’s Annual Report 2014
National Performance Summary (Cont’d)Table 6: Surgical care measure results
The overall measure and rates are indicated in bold; the stratified measures (by specific surgical procedures) are indicated in regular type. The first three measures listed (antibiotics within one hour before the first surgical cut, appropriate prophylactic antibiotics, and stopping antibiotics within 24 hours) report rates on seven specific surgical procedures, as well as the overall measure rate.
Performance measure 2009 2010 2011 2012 2013
Surgical care composite 95.8% 96.4% 97.6% 98.3% 98.7% 2.9%
Antibiotics within one hour before the first surgical cut 96.2% 97.4% 98.2% 98.6% 98.9% 2.7%
For CABG surgery 96.8% 97.8% 98.4% 98.9% 98.9% 2.1%
For cardiac surgery (other than CABG) 96.6% 97.6% 98.4% 98.8% 98.9% 2.3%
For colon surgery 91.8% 94.7% 96.5% 97.2% 97.9% 6.1%
For hip joint replacement surgery 96.3% 97.5% 98.2% 98.7% 99.0% 2.7%
For hysterectomy surgery 96.4% 97.5% 98.3% 98.6% 98.8% 2.4%
For knee joint replacement surgery 97.2% 98.0% 98.6% 99.0% 99.2% 2.0%
For vascular surgery 94.6% 96.0% 96.9% 97.6% 97.9% 3.3%
Appropriate prophylactic antibiotics 97.7% 97.8% 98.5% 98.9% 99.2% 1.5%
For CABG surgery 99.5% 99.6% 99.7% 99.8% 99.9% 0.4%
For cardiac surgery (other than CABG) 99.7% 99.8% 99.8% 99.9% 99.9% 0.2%
For colon surgery 87.8% 91.4% 93.2% 94.9% 96.0% 8.2%
For hip joint replacement surgery 99.2% 99.5% 99.6% 99.7% 99.7% 0.5%
For hysterectomy surgery 96.3% 94.5% 96.3% 97.3% 97.9% 1.6%
For knee joint replacement surgery 99.3% 99.5% 99.7% 99.7% 99.8% 0.5%
For vascular surgery 97.8% 98.2% 98.6% 99.0% 99.1% 1.3%
Stopping antibiotics within 24 hours 93.5% 95.7% 97.0% 97.6% 98.2% 4.7%
For CABG surgery 95.5% 97.1% 97.9% 98.4% 98.8% 3.3%
For cardiac surgery (other than CABG) 94.8% 96.5% 97.6% 98.2% 98.7% 3.9%
For colon surgery 84.9% 90.8% 93.6% 95.1% 96.3% 11.4%
For hip joint replacement surgery 93.6% 95.9% 97.2% 97.8% 98.3% 4.7%
For hysterectomy surgery 94.8% 96.3% 97.2% 97.7% 98.1% 3.3%
For knee joint replacement surgery 94.7% 96.7% 97.7% 98.1% 98.6% 3.9%
For vascular surgery 88.2% 91.9% 93.8% 95.3% 96.3% 8.1%
Cardiac patients with controlled postoperative blood glucose 92.7% 94.1% 95.3% 96.4% 96.9% 4.2%
Patients with appropriate hair removal 99.2% 99.7% 99.8% 99.9% 99.9% 0.7%
Beta-blocker patients who received beta-blocker perioperatively 91.5% 94.4% 96.4% 97.3% 98.1% 6.6%
Receiving VTE medicine/treatment 91.9% 93.7% 96.9% 97.9% 98.4% 6.5%
Urinary catheter removed N/A 91.3% 94.1% 96.3% 97.9% 6.6%
Improvement since 2009 (percentage
points)
Since implementation in 2005, the average number of hospitals reporting data was 1,979 and ranged from 258 to 2,766.

18 America’s Hospitals: Improving Quality and Safety – The Joint Commission’s Annual Report 2014
National Performance Summary (Cont’d)
Table 7: Children’s asthma care measure results
The overall measure and rates are indicated in bold; the stratified measures (by specific age ranges of patients) are indicated in regular type.
Performance measure 2009 2010 2011 2012 2013
Children’s asthma care composite 88.1% 92.4% 94.7% 95.5% 96.2% 8.1%
Relievers for inpatient asthma 99.9% 100.0% 99.9% 100.0% 100.0% 0.1%
For age 2-4 years 99.9% 100.0% 99.9% 100.0% 100.0% 0.1%
For age 5-12 years 99.9% 100.0% 100.0% 100.0% 100.0% 0.1%
For age 13-17 years 99.9% 99.9% 100.0% 99.9% 99.9% 0.0%
Systemic corticosteroids for inpatient asthma 99.5% 99.6% 99.6% 99.7% 99.8% 0.3%
For age 2-4 years 99.4% 99.6% 99.5% 99.6% 99.8% 0.4%
For age 5-12 years 99.5% 99.7% 99.7% 99.8% 99.8% 0.3%
For age 13-17 years 99.5% 99.4% 99.7% 99.6% 99.8% 0.3%
Home management plan of care 64.9% 77.1% 84.3% 86.7% 88.9% 24.0%
Improvement since 2009 (percentage
points)
Since implementation in 2008, the average number of hospitals reporting data was 173 and ranged from 110 to 231.

19America’s Hospitals: Improving Quality and Safety – The Joint Commission’s Annual Report 2014
National Performance Summary (Cont’d)
Table 8: Inpatient psychiatric services measure results
As in the other measure sets, high rates are preferred in this measure set for four of the measures. However, a lower score reflects better performance on the multiple antipsychotic medications measure, as well as on the two ratio measures included in Table 9. The overall measure and rates are indicated in bold; the stratified measures (by specific age ranges of patients) are indicated in regular type.
Performance measure 2009 2010 2011 2012 2013
Inpatient psychiatric services composite 80.5% 88.1% 87.3% 89.7% 90.3% 9.8%
Admission screening 88.4% 92.0% 93.5% 96.4% 96.7% 8.3%
For age 1-12 years 90.4% 93.7% 96.9% 98.1% 98.1% 7.7%
For age 13-17 years 91.2% 94.3% 96.4% 98.2% 98.4% 7.2%
For age 18-64 years 87.2% 90.8% 92.0% 95.6% 96.1% 8.9%
For age 65 and above 87.4% 92.7% 94.1% 95.9% 95.3% 7.9%
Multiple antipsychotic medications* 11.8% 11.2% 11.6% 10.5% 10.1% -1.7%
For age 1-12 years* 5.1% 4.4% 3.3% 2.8% 2.2% -2.9%
For age 13-17 years* 5.9% 5.7% 4.6% 3.8% 3.5% -2.4%
For age 18-64 years* 14.8% 14.2% 14.5% 13.3% 12.9% -1.9%
For age 65 and above* 9.4% 8.7% 9.8% 8.8% 8.9% -0.5%
Justification for multiple antipsychotic medications 28.3% 39.5% 38.8% 46.7% 52.7% 24.4%
For age 1-12 years 30.8% 37.1% 49.1% 51.5% 57.5% 26.7%
For age 13-17 years 29.4% 33.9% 43.8% 46.5% 50.5% 21.1%
For age 18-64 years 28.4% 40.5% 38.5% 46.7% 53.7% 25.3%
For age 65 and above 25.6% 37.5% 35.8% 47.0% 46.3% 20.7%
Continuing care plan created 85.7% 90.8% 92.2% 93.3% 94.4% 8.7%
For age 1-12 years 87.1% 91.4% 92.3% 93.7% 95.1% 8.0%
For age 13-17 years 86.1% 91.5% 93.3% 94.3% 95.7% 9.6%
For age 18-64 years 85.9% 91.0% 92.2% 93.1% 94.4% 8.5%
For age 65 and above 82.4% 87.3% 90.1% 92.2% 90.9% 8.5%
Continuing care plan transmitted 74.1% 82.8% 83.5% 86.1% 88.3% 14.2%
For age 1-12 years 76.2% 83.7% 82.9% 85.5% 89.6% 13.4%
For age 13-17 years 73.0% 82.8% 83.0% 85.5% 89.3% 16.3%
For age 18-64 years 74.4% 83.0% 83.8% 86.3% 88.3% 13.9%
For age 65 and above 72.2% 80.6% 82.8% 86.1% 85.5% 13.3%
Since implementation in 2009, the average number of hospitals reporting data was 368 and ranged from 244 to 469.
*A lower score reflects better performance for this measure, so the negative percentage point improvement is favorable.
n This measure is not included in the calculations for the Top Performer on Key Quality Measures® program nor in the composite.
n Test measure; not included in the composite.
Improvement since 2009 (percentage points)

20 America’s Hospitals: Improving Quality and Safety – The Joint Commission’s Annual Report 2014
National Performance Summary (Cont’d)Table 9: Inpatient psychiatric services ratio measure results
The following table includes a different kind of measure type – a ratio measure. A ratio tells how one number is related to another. For example, one can count a group of people and then refer to the ratio of men to women. This table contains two ratio measures: physical restraint hours per 1,000 patient hours and seclusion hours per 1,000 patient hours. In addition, these two measures are stratified by age groups 1-12 years, 13-17 years, 18-64 years, and age 65 and above. Lower ratios reflect better performance.
The overall measure and rates are indicated in bold; the stratified measures (by specific age ranges of patients) are indicated in regular type.
Performance measure Inpatient psychiatric services – ratio measures
Physical restraint (minutes per 1,000 patient hours)* 0.11 10.27 8.6% 0.09 5.29 5.8%
For age 1-12 years 0.14 7.02 13.2% 0.18 5.19 8.2%
For age 13-17 years 0.16 7.08 9.3% 0.14 3.30 5.9%
For age 18-64 years 0.07 10.27 10.6% 0.06 3.85 7.6%
For age 65 and above 0.00 22.93 51.0% 0.00 23.14 49.3%
Seclusion (minutes per 1,000 patient hours)* 0.07 2.87 16.7% 0.06 10.06 16.8%
For age 1-12 years 0.21 6.50 17.9% 0.18 3.98 16.7%
For age 13-17 years 0.07 8.29 24.2% 0.08 7.65 20.3%
For age 18-64 years 0.04 2.26 22.6% 0.04 10.83 22.1%
For age 65 and above 0.00 3.23 73.2% 0.00 9.75 76.0%
2009 Median Maximum Percent of hospitals with 0 hours
2010 Median Maximum Percent of hospitals with 0 hours
Performance measure
2011 Median Maximum Percent of hospitals with 0 hours
2012 Median Maximum Percent of hospitals with 0 hours
Inpatient psychiatric services – ratio measures
Physical restraint (minutes per 1,000 patient hours)* 0.09 4.46 7.4% 0.09 9.91 6.4%
For age 1-12 years 0.17 5.72 8.4% 0.21 6.79 8.2%
For age 13-17 years 0.12 16.58 7.5% 0.09 7.03 6.9%
For age 18-64 years 0.06 4.84 9.6% 0.07 9.91 8.7%
For age 65 and above 0.00 8.50 44.8% 0.00 17.44 42.8%
Seclusion (minutes per 1,000 patient hours)* 0.06 9.55 16.8% 0.05 15.34 15.1%
For age 1-12 years 0.22 5.97 22.1% 0.23 6.34 22.0%
For age 13-17 years 0.08 4.43 22.5% 0.06 4.44 21.7%
For age 18-64 years 0.04 9.72 20.3% 0.04 15.84 19.0%
For age 65 and above 0.00 3.45 71.5% 0.00 2.93 72.1%
* A lower ratio is preferred for this measure; therefore, it is not included in the composite results.

21America’s Hospitals: Improving Quality and Safety – The Joint Commission’s Annual Report 2014
National Performance Summary (Cont’d)Table 9: Inpatient psychiatric services ratio measure results (Cont’d)
Performance measure
2013 Median Maximum Percent of hospitals with 0 hours
Inpatient psychiatric services – ratio measures
Physical restraint (minutes per 1,000 patient hours)* 0.10 9.29 5.6%
For age 1-12 years 0.17 3.85 9.5%
For age 13-17 years 0.10 12.90 4.3%
For age 18-64 years 0.07 11.09 7.7%
For age 65 and above 0.00 7.88 44.7%
Seclusion (minutes per 1,000 patient hours)* 0.05 11.30 17.3%
For age 1-12 years 0.17 11.41 21.1%
For age 13-17 years 0.06 14.20 18.8%
For age 18-64 years 0.04 11.90 22.3%
For age 65 and above 0.00 6.13 73.3%
Since implementation in 2009, the average number of hospitals reporting data was 368 and ranged from 244 to 485.
* A lower ratio is preferred for this measure; therefore, it is not included in the composite results.
22 America’s Hospitals: Improving Quality and Safety – The Joint Commission’s Annual Report 2014
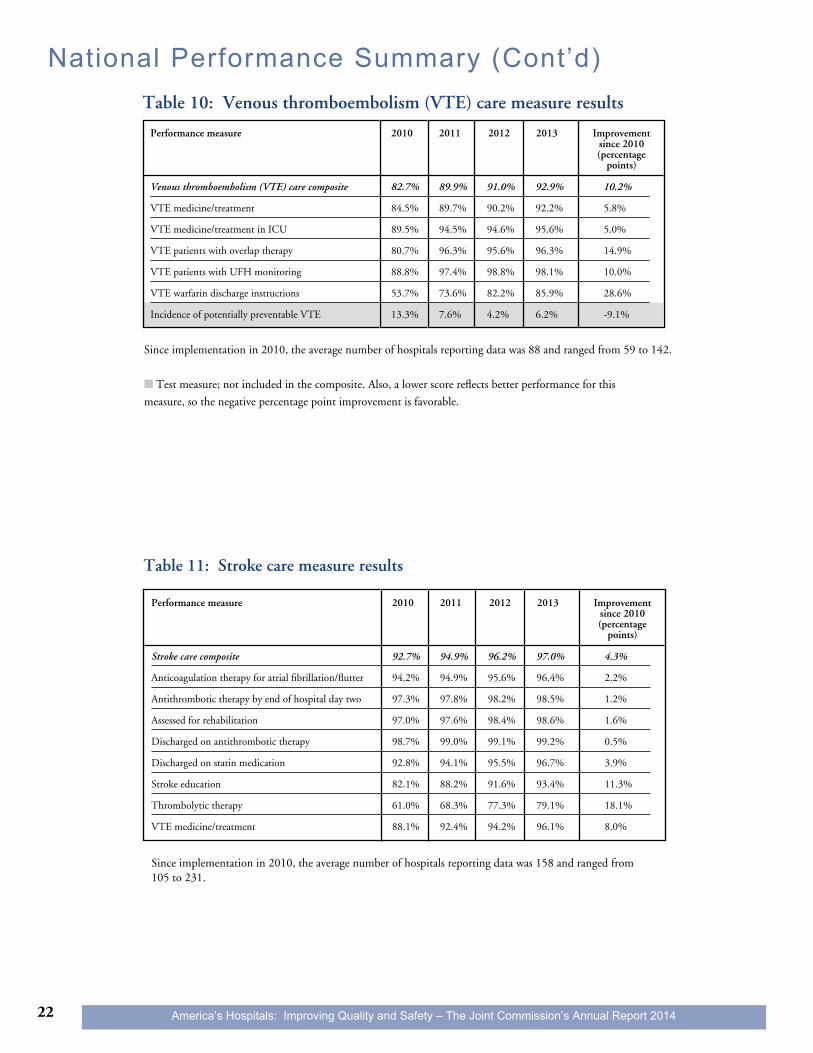
National Performance Summary (Cont’d)Table 10: Venous thromboembolism (VTE) care measure results
Table 11: Stroke care measure results
Since implementation in 2010, the average number of hospitals reporting data was 88 and ranged from 59 to 142.
n Test measure; not included in the composite. Also, a lower score reflects better performance for this
measure, so the negative percentage point improvement is favorable.
Since implementation in 2010, the average number of hospitals reporting data was 158 and ranged from 105 to 231.
Performance measure 2010 2011 2012 2013
Performance measure 2010 2011 2012 2013
Venous thromboembolism (VTE) care composite 82.7% 89.9% 91.0% 92.9% 10.2%
VTE medicine/treatment 84.5% 89.7% 90.2% 92.2% 5.8%
VTE medicine/treatment in ICU 89.5% 94.5% 94.6% 95.6% 5.0%
VTE patients with overlap therapy 80.7% 96.3% 95.6% 96.3% 14.9%
VTE patients with UFH monitoring 88.8% 97.4% 98.8% 98.1% 10.0%
VTE warfarin discharge instructions 53.7% 73.6% 82.2% 85.9% 28.6%
Incidence of potentially preventable VTE 13.3% 7.6% 4.2% 6.2% -9.1%
Stroke care composite 92.7% 94.9% 96.2% 97.0% 4.3%
Anticoagulation therapy for atrial fibrillation/flutter 94.2% 94.9% 95.6% 96.4% 2.2%
Antithrombotic therapy by end of hospital day two 97.3% 97.8% 98.2% 98.5% 1.2%
Assessed for rehabilitation 97.0% 97.6% 98.4% 98.6% 1.6%
Discharged on antithrombotic therapy 98.7% 99.0% 99.1% 99.2% 0.5%
Discharged on statin medication 92.8% 94.1% 95.5% 96.7% 3.9%
Stroke education 82.1% 88.2% 91.6% 93.4% 11.3%
Thrombolytic therapy 61.0% 68.3% 77.3% 79.1% 18.1%
VTE medicine/treatment 88.1% 92.4% 94.2% 96.1% 8.0%
Improvement since 2010 (percentage
points)
Improvement since 2010 (percentage
points)

23America’s Hospitals: Improving Quality and Safety – The Joint Commission’s Annual Report 2014
National Performance Summary (Cont’d)
Table 12: Perinatal care measure results
As in the other measure sets, high rates are preferred in this measure set for three of the measures. However, a lower score reflects better performance on the Cesarean section, elective delivery, and newborn bloodstream infections measures. Of the two measures addressing breast milk feeding, exclusive breast milk feeding considering mother’s choice is the designated accountability measure used in the composite.
Since implementation in 2011, the average number of hospitals reporting data was 167 and ranged from 151 to 180.
* This measure is an outcome measure and is not included in the composite. Only proportion process measures are included in the composite.
† For this measure, a decrease in the rate is desired, so the negative percentage point improvement is favorable.
Since implementation in 2012, the average number of hospitals reporting data was 108 and ranged from 78 to 138.
Table 13: Immunization measure results
Note: Only influenza immunization and pneumococcal immunization are included in the
composite.
Performance measure 2011 2012 2013
Performance measure 2012 2013
Perinatal care composite 53.2% 57.6% 74.1% 20.9%
Antenatal steroids 73.6% 81.8% 89.7% 16.1%
Cesarean section*† 26.3% 26.3% 25.9% -0.4%
Elective delivery† 13.6% 8.2% 4.3% -9.3%
Exclusive breast milk feeding* 46.2% 50.8% 53.6% 7.4%
Exclusive breast milk feeding considering mother’s choice N/A N/A 69.2% N/A
Newborn bloodstream infections*† N/A N/A 2.5% N/A
Immunization composite 88.6% 91.3% 2.7%
Influenza immunization 86.2% 89.9% 3.7%
Pneumococcal immunization 90.6% 92.5% 1.9%
For ages 65 and above 94.1% 95.1% 1.0%
For high risk populations (age 5-65 years) 81.5% 86.4% 4.9%
Improvement since 2011 (percentage
points)
Improvement since 2012 (percentage
points)

24 America’s Hospitals: Improving Quality and Safety – The Joint Commission’s Annual Report 2014
* For this measure, a decrease in the rate is desired, so the percentage represented is the percent of hospitals with percentage of 5 percent or less.
National Performance Summary (Cont’d)
Table 14: Percentage of hospitals achieving 95 percent or greater performanceThe following table shows percentage of hospitals achieving the annual targeted performance of 95 percent or more compliance on a measure. The last column is reported as percentage points – the difference on a percentage scale between two rates, in this case 2012 performance versus 2013 performance. Test measures are shaded in gray.
Performance measure 2011 High 2012 High 2013 High 2012-2013 (percentage (percentage (percentage difference >95) >95) >95 ) (percentage points)
Antenatal steroids (Perinatal) 25.0% 50.0% 83.3% 33.3%
Influenza immunization (Immunization) N/A 16.9% 40.4% 23.6%
Pneumococcal immunization (Immunization) N/A 25.7% 46.8% 21.1%
Elective delivery (Perinatal)* 22.5% 47.8% 66.4% 18.6%
VTE medicine/treatment (Stroke) 50.4% 58.3% 74.4% 16.1%
Stroke education (Stroke) 35.3% 45.3% 59.8% 14.5%
Urinary catheter removed (Surgical Care) 51.4% 70.9% 84.3% 13.4%
Discharged on statin medication (Stroke) 48.0% 66.7% 79.3% 12.6%
VTE warfarin discharge instructions (VTE) 20.0% 30.4% 42.9% 12.4%
Cardiac patients with controlled postoperative blood glucose (Surgical Care) 60.1% 71.2% 78.7% 7.6%
Beta-blocker patients who received beta-blocker perioperatively (Surgical Care) 72.2% 79.4% 86.9% 7.5%
PCI therapy within 90 minutes (Heart Attack) 57.3% 67.3% 73.7% 6.4%
Antibiotics to non-ICU patients (Pneumonia) 72.3% 75.4% 80.8% 5.4%
Assessed for rehabilitation (Stroke) 85.3% 91.4% 96.5% 5.1%
Receiving VTE medicine/treatment (Surgical Care) 76.7% 85.3% 90.3% 5.0%
Stopping antibiotics within 24 hours (Surgical Care) 80.0% 86.4% 91.3% 5.0%
Admission screening (Inpatient Psychiatric) 63.1% 74.9% 78.6% 3.6%
VTE medicine/treatment (VTE) 28.8% 47.4% 50.7% 3.4%
Anticoagulation therapy for atrial fibrillation/flutter (Stroke) 68.0% 77.8% 80.7% 2.9%
VTE patients with UFH monitoring (VTE) 90.0% 91.7% 94.4% 2.8%
Statin at discharge (Heart Attack) 83.0% 90.2% 92.3% 2.1%
Antibiotics within one hour before the first surgical cut (Surgical Care) 90.8% 93.3% 95.4% 2.0%
n Test measure

25America’s Hospitals: Improving Quality and Safety – The Joint Commission’s Annual Report 2014
Performance measure 2011 High 2012 High 2013 High 2012-2013 (percentage (percentage (percentage difference >95) >95) >95 ) (percentage points)
Performance measure 2011 High 2012 High 2013 High 2012-2013 (percentage (percentage (percentage difference >95) >95) >95 ) (percentage points)
National Performance Summary (Cont’d)
Table 14: Percentage of hospitals achieving 95 percent or greater performance (Cont’d)
ACEI or ARB at discharge (Heart Attack) 83.2% 87.0% 89.0% 2.0%
Appropriate prophylactic antibiotics (Surgical Care) 92.4% 94.6% 96.6% 2.0%
Justification for multiple antipsychotic medications (Inpatient Psychiatric) 6.8% 9.7% 11.7% 1.9%
Blood cultures in ED (Pneumonia) 80.8% 87.3% 89.1% 1.9%
Home management plan of care (Children’s Asthma) 20.0% 28.3% 30.2% 1.8%
Multiple antipsychotic medications (Inpatient Psychiatric)* 24.8% 30.5% 31.7% 1.1%
Antithrombotic therapy by end of hospital day two (Stroke) 90.0% 93.7% 94.5% 0.9%
ACEI or ARB at discharge (Heart Failure) 74.4% 80.0% 80.8% 0.8%
Aspirin at arrival (Heart Attack) 96.8% 97.4% 98.0% 0.6%
Aspirin at discharge (Heart Attack) 95.4% 96.3% 96.8% 0.5%
Discharged on antithrombotic therapy (Stroke) 93.8% 96.1% 96.5% 0.4%
Continuing care plan transmitted (Inpatient Psychiatric) 34.8% 40.7% 40.8% 0.2%
Patients with appropriate hair removal (Surgical Care) 99.2% 99.5% 99.6% 0.1%
Blood cultures in ICU (Pneumonia) 87.2% 91.2% 91.4% 0.1%
Relievers for inpatient asthma (Children’s Asthma) 100.0% 100.0% 100.0% 0.0%
Systemic corticosteroids for inpatient asthma (Children’s Asthma) 99.2% 100.0% 100.0% 0.0%
Beta-blocker at discharge (Heart Attack) 95.7% 96.5% 96.5% 0.0%
E1clusive breast milk feeding (Perinatal) 2.0% 2.0% 1.7% -0.3%
Continuing care plan created (Inpatient Psychiatric) 64.8% 71.3% 70.7% -0.6%
VTE medicine/treatment in ICU (VTE) 63.2% 69.2% 68.4% -0.8%
VTE patients with overlap therapy (VTE) 71.4% 79.2% 76.3% -2.9%
Thrombolytic therapy (Stroke) 18.8% 35.3% 25.0% -10.3%
Incidence of potentially preventable VTE (VTE)* 40.0% 100.0% 57.1% -42.9%
Antibiotics to ICU patients (Pneumonia) 43.2% N/A 56.5% N/A
Exclusive breast milk feeding considering mother’s choice (Perinatal) N/A N/A 5.1% N/A
* For this measure, a decrease in the rate is desired, so the percentage represented is the percent of hospitals with percentage of 5 percent or less.
n Test measure
26 America’s Hospitals: Improving Quality and Safety – The Joint Commission’s Annual Report 2014
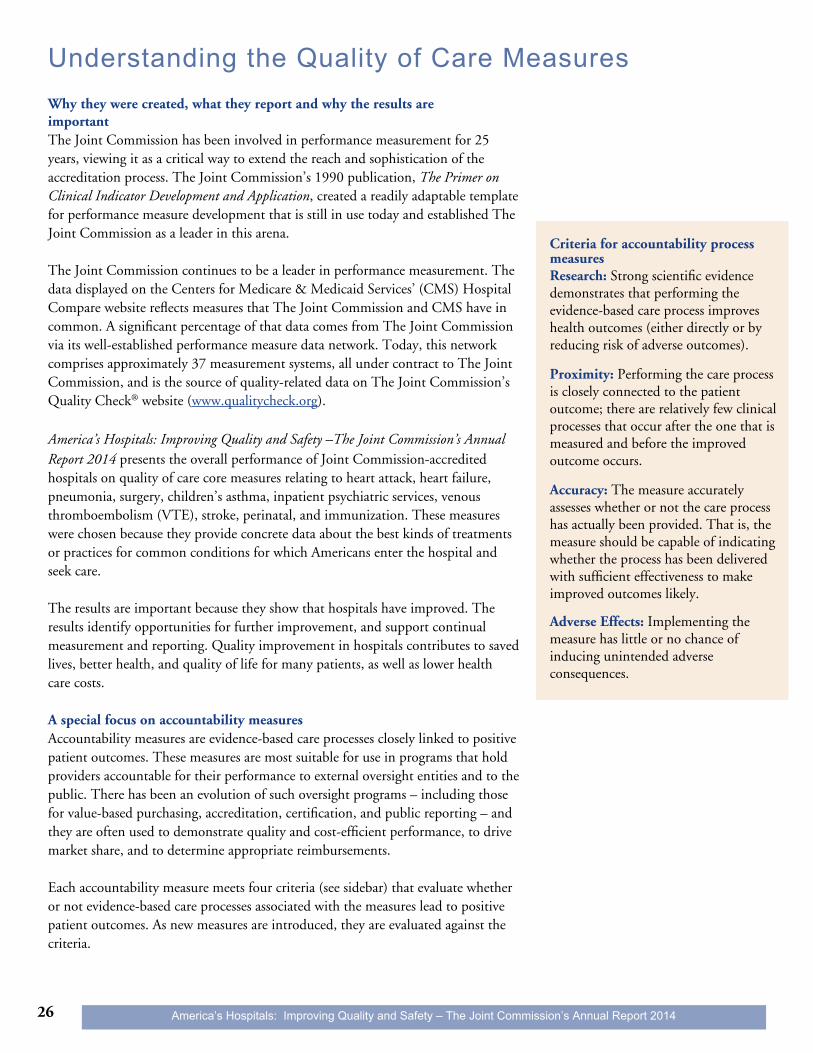
Why they were created, what they report and why the results are importantThe Joint Commission has been involved in performance measurement for 25 years, viewing it as a critical way to extend the reach and sophistication of the accreditation process. The Joint Commission’s 1990 publication, The Primer on Clinical Indicator Development and Application, created a readily adaptable template for performance measure development that is still in use today and established The Joint Commission as a leader in this arena.
The Joint Commission continues to be a leader in performance measurement. The data displayed on the Centers for Medicare & Medicaid Services’ (CMS) Hospital Compare website reflects measures that The Joint Commission and CMS have in common. A significant percentage of that data comes from The Joint Commission via its well-established performance measure data network. Today, this network comprises approximately 37 measurement systems, all under contract to The Joint Commission, and is the source of quality-related data on The Joint Commission’s Quality Check® website (www.qualitycheck.org).
America’s Hospitals: Improving Quality and Safety –The Joint Commission’s Annual Report 2014 presents the overall performance of Joint Commission-accredited hospitals on quality of care core measures relating to heart attack, heart failure, pneumonia, surgery, children’s asthma, inpatient psychiatric services, venous thromboembolism (VTE), stroke, perinatal, and immunization. These measures were chosen because they provide concrete data about the best kinds of treatments or practices for common conditions for which Americans enter the hospital and seek care.
The results are important because they show that hospitals have improved. The results identify opportunities for further improvement, and support continual measurement and reporting. Quality improvement in hospitals contributes to saved lives, better health, and quality of life for many patients, as well as lower health care costs.
A special focus on accountability measuresAccountability measures are evidence-based care processes closely linked to positive patient outcomes. These measures are most suitable for use in programs that hold providers accountable for their performance to external oversight entities and to the public. There has been an evolution of such oversight programs – including those for value-based purchasing, accreditation, certification, and public reporting – and they are often used to demonstrate quality and cost-efficient performance, to drive market share, and to determine appropriate reimbursements.
Each accountability measure meets four criteria (see sidebar) that evaluate whether or not evidence-based care processes associated with the measures lead to positive patient outcomes. As new measures are introduced, they are evaluated against the criteria.
Criteria for accountability process measuresResearch: Strong scientific evidence demonstrates that performing the evidence-based care process improves health outcomes (either directly or by reducing risk of adverse outcomes).
Proximity: Performing the care process is closely connected to the patient outcome; there are relatively few clinical processes that occur after the one that is measured and before the improved outcome occurs.
Accuracy: The measure accurately assesses whether or not the care process has actually been provided. That is, the measure should be capable of indicating whether the process has been delivered with sufficient effectiveness to make improved outcomes likely.
Adverse Effects: Implementing the measure has little or no chance of inducing unintended adverse consequences.
Understanding the Quality of Care Measures
27America’s Hospitals: Improving Quality and Safety – The Joint Commission’s Annual Report 2014
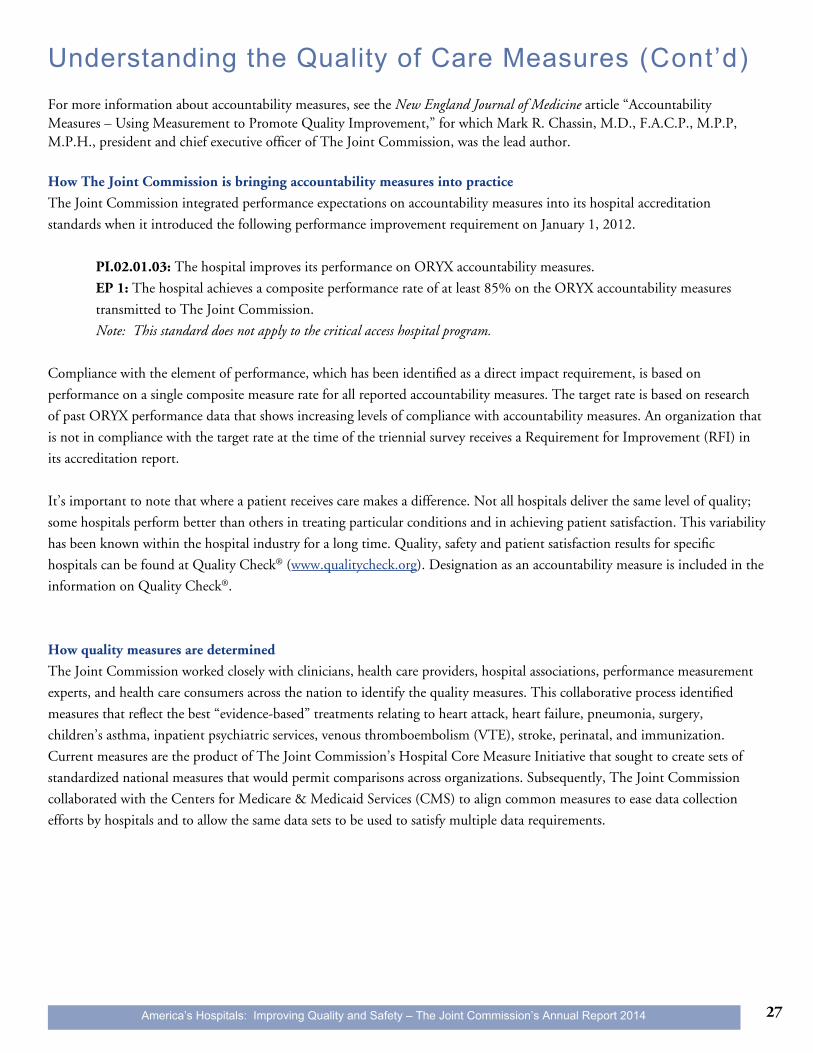
Understanding the Quality of Care Measures (Cont’d)For more information about accountability measures, see the New England Journal of Medicine article “Accountability Measures – Using Measurement to Promote Quality Improvement,” for which Mark R. Chassin, M.D., F.A.C.P., M.P.P, M.P.H., president and chief executive officer of The Joint Commission, was the lead author.
How The Joint Commission is bringing accountability measures into practice
The Joint Commission integrated performance expectations on accountability measures into its hospital accreditation
standards when it introduced the following performance improvement requirement on January 1, 2012.
PI.02.01.03: The hospital improves its performance on ORYX accountability measures.
EP 1: The hospital achieves a composite performance rate of at least 85% on the ORYX accountability measures
transmitted to The Joint Commission.
Note: This standard does not apply to the critical access hospital program.
Compliance with the element of performance, which has been identified as a direct impact requirement, is based on
performance on a single composite measure rate for all reported accountability measures. The target rate is based on research
of past ORYX performance data that shows increasing levels of compliance with accountability measures. An organization that
is not in compliance with the target rate at the time of the triennial survey receives a Requirement for Improvement (RFI) in
its accreditation report.
It’s important to note that where a patient receives care makes a difference. Not all hospitals deliver the same level of quality;
some hospitals perform better than others in treating particular conditions and in achieving patient satisfaction. This variability
has been known within the hospital industry for a long time. Quality, safety and patient satisfaction results for specific
hospitals can be found at Quality Check® (www.qualitycheck.org). Designation as an accountability measure is included in the
information on Quality Check®.
How quality measures are determined
The Joint Commission worked closely with clinicians, health care providers, hospital associations, performance measurement
experts, and health care consumers across the nation to identify the quality measures. This collaborative process identified
measures that reflect the best “evidence-based” treatments relating to heart attack, heart failure, pneumonia, surgery,
children’s asthma, inpatient psychiatric services, venous thromboembolism (VTE), stroke, perinatal, and immunization.
Current measures are the product of The Joint Commission’s Hospital Core Measure Initiative that sought to create sets of
standardized national measures that would permit comparisons across organizations. Subsequently, The Joint Commission
collaborated with the Centers for Medicare & Medicaid Services (CMS) to align common measures to ease data collection
efforts by hospitals and to allow the same data sets to be used to satisfy multiple data requirements.

28 America’s Hospitals: Improving Quality and Safety – The Joint Commission’s Annual Report 2014
Understanding the Quality of Care Measures (Cont’d)Related quality reporting efforts of other organizations
The CMS Hospital Compare website (www.hospitalcompare.hhs.gov) reports quality information from U.S. hospitals,
including treatments relating to heart attack, heart failure, pneumonia, surgical care, preventative care (immunization),
and childhood asthma. Hospital Compare also includes information on Medicare readmissions, complications and deaths.
Hospitals voluntarily submit these data abstracted from their medical records about the treatments that their patients receive,
including patients with Medicare and those who do not have Medicare.
In addition, CMS in 2013 began receiving data on the Joint Commission’s perinatal care elective delivery measure, which
was adopted for use in the CMS Hospital Inpatient Quality Reporting Program, and now more than 3,300 hospitals are
submitting data to CMS on this measure.
Joint Commission-developed measures have also been adopted into a number of CMS quality reporting programs. Today,
Joint Commission/CMS common measures and Joint Commission-only measures are used in the CMS Hospital Inpatient
Quality Reporting Program, Hospital Outpatient Quality Reporting Program, Hospital Value-Based Purchasing Program,
Inpatient Psychiatric Facility Quality Reporting (IPFQR) Program and the Medicare & Medicaid EHR Incentive Program
for eligible Hospitals/Critical Access Hospitals (both Stage 1 and Stage 2). The Joint Commission developed hospital-based
inpatient psychiatric services (HBIPS) measures were adopted as the initial set of measures for the CMS IPFQR Program with
other Joint Commission-developed measures subsequently adopted (i.e., substance use and tobacco treatment).
Consumers can use Hospital Compare to compare care of local hospitals to state and national averages. Unlike Quality Check,
Hospital Compare includes data from organizations accredited by CMS-recognized accrediting organizations other than The
Joint Commission and some unaccredited organizations. Hospital Compare does not currently include Department of Defense
and Indian Health Service hospitals.
The National Quality Forum’s National Priorities Partnership (NPP) is a coalition of 52 major organizations including
The Joint Commission. The NPP has established dedicated “action teams” to develop and act on specific goals aligned with
national safety priorities. The Maternity Action Team, through close collaboration with The Joint Commission, is addressing
inappropriate and unsafe maternity care and demonstrated its commitment to increased use of the perinatal care core measure
set.
Data collection and reporting requirements
As of January 1, 2014, The Joint Commission requires most hospitals to select six measure sets. Hospitals choose sets best
reflecting their patient population and report on all the applicable measures in each of the sets they choose. Hospitals submit
monthly data on a quarterly basis on all measures of performance within specific sets they choose to third-party vendors, which
compile and provide data to The Joint Commission. Hospitals can obtain feedback reports through The Joint Commission’s
extranet.
Note on calculations and methodology
This report includes a composite for accountability measures: the sum of all the numerator counts for accountability process
measures across all measure sets divided by the sum of all the denominator counts from across the same accountability
measures.

29America’s Hospitals: Improving Quality and Safety – The Joint Commission’s Annual Report 2014
Understanding the Quality of Care Measures (Cont’d)In addition, a composite measure for a measure set is calculated by adding or “rolling up” the number of times recommended
care was provided over all the process measures in the given measure set and dividing this sum by the total number of
opportunities for providing this recommended care, determined by summing up all of the process measure populations for this
same set of measures. The composite measure shows the percentage of the time that recommended care was provided.
For example, if a heart attack patient receives each treatment included in the heart attack measure set, that’s a total of seven
treatments in seven opportunities. If 60 patients receive all seven treatments, that’s 420 treatments in 420 opportunities -
100 percent composite performance. However, if some of the 60 patients don’t receive all seven treatments, and the treatments
given to the 60 patients add to a total of 378, the heart attack composite score is 92 percent.
Composite performance measures are useful in integrating performance measure information in an easily understood format
that gives a summary assessment of performance for a given area of care in a single rate. The composite measures in this report
are based on combining all of the process rate-based measures in the measure set or the accountability measures across the
10 measure sets. For a performance measure, each patient identified as falling in the measure population can be considered an
opportunity to provide recommended care.
Inclusions and exclusions
This report only includes data about patients considered “eligible” for one of the evidence-based treatments or measures. It’s
important to understand that not every patient gets – or should get – a treatment. Often, patients have health conditions or
factors that influence the effectiveness of treatments, or whether or not a provider orders a particular treatment. Also, a patient
may choose to refuse treatment or not follow the instructions of his or her care plan.
Links for more information
The Joint Commission: www.jointcommission.org
Quality Check: www.qualitycheck.org

30 America’s Hospitals: Improving Quality and Safety – The Joint Commission’s Annual Report 2014
GlossaryAccountability process measure. An accountability process measure is a quality measure that meets four criteria designed to identify measures that produce the greatest positive impact on patient outcomes when hospitals demonstrate improvement. The four criteria are: research, proximity, accuracy and adverse effects (see page 26 for an explanation of the criteria). Accountability measures are a subset of core measures (see core measure).
ACEI (ACE inhibitors). ACE stands for “angiotensin converting enzyme.” ACE inhibitors are medicines that are used to treat heart failure, high blood pressure, and patients with left ventricular systolic dysfunction following a heart attack. These medicines block an enzyme in the body that is responsible for causing the blood vessels to narrow. If the blood vessels are relaxed, blood pressure is lowered and more oxygen-rich blood can reach the heart. ACE inhibitors also lower the amount of salt and water in the body, which helps to lower blood pressure.
Admission screening. Evaluating a patient for violence risk, substance use, psychological trauma history and patient strengths within the first three days of admission to an inpatient psychiatric facility.
Antenatal steroids. Medication given to a mother in premature labor before delivery to promote lung development in the baby.
Antibiotic timing. The length of time from arrival at the hospital until antibiotics are given. Antibiotics are generally given as soon as possible to pneumonia patients to speed their recovery.
Antithrombotic therapy. Pharmacologic agents (oral or parenteral) that prevent or interfere with the formation of a blood clot.
ARB. ARB stands for “angiotensin receptor blocker.” An ARB is a medicine taken by mouth that reduces blood pressure and strengthens the heart beat. ARBs are useful in the treatment of cardiac diseases such as heart attack and heart failure.
Beta-blocker. This type of medicine blocks the action of certain hormones on the heart. By blocking these hormones, beta-blockers help to reduce the heart rate and blood pressure, thereby reducing the amount of oxygen needed by the heart.
Blood cultures. Blood tests that look for bacteria in the blood. These tests are given to pneumonia patients before antibiotics are administered.
CABG. CABG stands for coronary artery bypass graft surgery – an operation in which a section of vein or artery is used to bypass a blockage in a coronary artery, allowing enough blood to flow to deliver oxygen and nutrients to the heart muscles. CABG is performed to prevent damage from a myocardial infarction (heart attack) or to relieve angina.
Cesarean section. A surgical procedure in which an abdominal incision is made to deliver the infant.
Composite measure. A measure that combines the results of two or more process measures into a single rating. A composite is a summary of a related set of measures, which could be a condition specific set, all accountability measures, or accountability and non-accountability measures. However, accountability composites are restricted to accountability measures; non-accountability measures are excluded.

31America’s Hospitals: Improving Quality and Safety – The Joint Commission’s Annual Report 2014
Glossary (Cont’d)Core measure. A core measure is a standardized quality measure with precisely defined specifications that can be uniformly embedded in different systems for data collection and reporting. A core measure must meet Joint Commission established attributes, such as: targets improvement in population health, precisely defined and specified, reliable, valid, interpretable, useful in accreditation, under provider control, and public availability. Elective delivery. A delivery occurring between 37 and 39 weeks of gestation, without a medical reason.
Evidence-based care. Using current best evidence in making decisions about the care of individual patients or in the delivery
of health services.
Exclusive breast milk feeding. An infant receives only breast milk during the hospital stay, with no additional food or drink,
including water.
Fibrinolytic therapy. Medication that dissolves blood clots. Breaking up blood clots increases blood flow to the heart. If blood
flow is returned to the heart muscle quickly during a heart attack, the risk of death is decreased.
Hair removal, appropriate. Removing hair with clippers or depilatory is considered appropriate. Shaving is considered
inappropriate.
Health care-associated infections in newborns. An infection acquired during a newborn’s stay in a hospital.
Heart failure. A condition in which the heart loses its ability to efficiently pump blood throughout the body.
Immunocompetent. An immunocompetent person is one whose immune system is able to fight infection.
Inpatient psychiatric services. Inpatient psychiatric services include care provided to a patient for a mental disorder while
hospitalized in a psychiatric unit of an acute care hospital or a free-standing psychiatric hospital. Services rendered to
outpatients or “day treatment” patients are not considered inpatient psychiatric services.
LVS assessment. An in-depth evaluation of heart muscle function that helps determine the correct treatment for heart failure.
LVS stands for “left ventricular systolic.” An LVS assessment evaluates how well the left ventricle – the heart’s main pumping
chamber – is functioning. Left ventricular diastolic dysfunction results when this heart chamber is not pumping all the blood
out before it refills for the next heart beat. This results in high pressure within the heart and can produce heart failure.
Multiple antipsychotic medications. Antipsychotic medications are drugs prescribed to treat mental disorders; if two or more
medications are routinely administered or prescribed, it is considered multiple medications.
Multiple antipsychotic medications. Antipsychotic medications are drugs prescribed to treat mental disorders; if two or more
medications are routinely administered or prescribed, it is considered multiple medications.

32 America’s Hospitals: Improving Quality and Safety – The Joint Commission’s Annual Report 2014
Glossary (Cont’d)ORYX Performance Measure Report (PMR) The ORYX Performance Measure Report is designed to support and help
guide Joint Commission-accredited hospitals in their performance assessment and improvement activities through the use of
summary dashboards and comprehensive measure details depicting the organization’s performance on each core measure set
and measure on which The Joint Commission receives data for the organization. The report also highlights an organization’s
compliance with Standard PI.02.01.03 that sets an 85 percent accountability composite rate threshold based on the past
four quarters of accountability measure data. ORYX PMRs are updated quarterly and made available to accredited hospitals
through the secure Joint Commission Connect extranet site.
Outcomes measure. A measure that focuses on the results of the performance or nonperformance of a process. (See process
measure.)
Overlap therapy. Administration of parenteral (intravenous or subcutaneous) anticoagulation therapy and warfarin to treat
patients with VTE.
PCI therapy. PCI stands for “percutaneous coronary interventions.” PCI therapy is a coronary angioplasty procedure
performed by a doctor who threads a small device into a clogged artery to open it, thereby improving blood flow to the heart.
A lack of blood supply to the heart muscle can cause lasting heart damage. PCI therapy is used as an alternative treatment to
coronary artery bypass surgery (CABG).
Percentage points. This is the difference on a percentage scale between two rates e1pressed as percents. For example, the difference between a performance rate of 85 percent and a performance rate of 92 percent is 7 percentage points.
Perinatal. The period shortly before and after birth.
Perioperative. This generally refers to 24 hours before surgery and lasts until the patient leaves the recovery area.
Physical restraint. A physical restraint is any manual or physical or mechanical device, material, or equipment that immobilizes a patient or reduces the ability of a patient to move his or her arms, legs, body or head freely. A physical restraint is used as a restriction to manage a patient’s behavior or restrict the patient’s freedom of movement and is not a standard treatment for the patient’s medical or psychiatric condition.
Pneumonia. An acute infection of lung tissue that is associated with at least some symptoms of acute infection, such as altered or abnormal breathing sounds.
Pneumococcal vaccination. A vaccination that helps to prevent pneumonia.
Post discharge continuing care plan. Communication from the hospital to the next health provider after a patient is discharged from the hospital. The plan must contain the reason for hospitalization, main diagnosis at discharge, a list of medications at discharge, and recommendations for the next level of care.
Process measure. A measure that focuses on one or more steps that lead to a particular outcome. (See outcomes measure.)
Prophylaxis. Any medical intervention designed to preserve health and prevent disease.

33America’s Hospitals: Improving Quality and Safety – The Joint Commission’s Annual Report 2014
Glossary (Cont’d)Rehabilitation assessment. Evaluation of the need for or receipt of rehabilitation services. Rehabilitation is a treatment or treatments designed to facilitate the process of recovery from injury, illness or disease to as normal a condition as possible.
Reliever, for asthma. A medicine that reduces narrowing in the lung’s airways, providing quick relief from asthma symptoms.
Seclusion. Seclusion is the involuntary confinement of a patient alone in a room or an area where the patient is physically prevented from leaving.
Statin. A class of pharmaceutical agents that lower blood cholesterol. Specifically, the agents modify LDL-cholesterol by blocking the action of an enzyme in the liver which is needed to synthesize cholesterol, thereby decreasing the level of cholesterol in the blood. Statins are also called HMG-CoA reductase inhibitors.
Systemic corticosteroid, for asthma. A medication that helps control asthma symptoms by controlling swelling, inflammation, and the buildup of mucous in the lung’s airways.
Thrombolytic therapy. Administration of a pharmacological agent intended to cause lysis of a thrombus (destruction or dissolution of a blood clot).
UFH monitoring. Using a protocol or nomogram to ensure that UFH (unfractionated heparin) achieves a sufficient level of anti-coagulation.
VTE. VTE stands for venous thromboembolism and is when a blood clot forms in a deep vein in the body, such as in the leg. VTE is a common complication at surgery, and hospitalized medical patients – particularly those who have decreased mobility – are at risk for development of VTE.

34 America’s Hospitals: Improving Quality and Safety – The Joint Commission’s Annual Report 2014
Appendix Appendix 1: Short and original measure namesNote: This is not a complete list of measures. The short name is the name used in this report.
Short measure name used in this report Original measure name
Heart attack care
Aspirin at discharge Aspirin prescribed at discharge
ACEI or ARB at discharge ACEI or ARB for LVSD
Beta-blocker at discharge Beta-blocker prescribed at discharge
Fibrinolytic therapy within 30 minutes Fibrinolytic therapy received within 30 minutes of hospital arrival
PCI therapy within 90 minutes Primary PCI received within 90 minutes of hospital arrival (timing of receipt of primary PCI)
Heart failure care
ACEI or ARB at discharge ACEI or ARB for LVSD (left ventricular systolic
dysfunction)
Pneumonia care
Blood cultures in ICU Blood cultures performed within 24 hours prior to or 24 hours after hospital arrival for patients who were transferred or admitted to the ICU (intensive care unit) within 24 hours of hospital arrival
Blood cultures in ED Blood cultures performed in the emergency department prior to initial antibiotic received in hospital
Antibiotics to non-ICU patients Initial antibiotic selection for CAP in immunocompetent – non-ICU patient
Surgical care
Antibiotics within one hour before the first surgical cut Prophylactic antibiotic received within one hour prior to surgical incision – overall rate
Appropriate prophylactic antibiotics Prophylactic antibiotic selection for surgical patients – overall rate
Stopping antibiotics within 24 hours Prophylactic antibiotics discontinued within 24 hours after surgery end time – overall rate
Beta-blocker patients who received beta-blocker perioperatively Surgery patients on beta-blocker therapy prior to arrival who received a beta-blocker during the perioperative period
Cardiac patients with controlled postoperative blood glucose Cardiac surgery patients with controlled postoperative blood glucose
Patients with appropriate hair removal Surgery patients with appropriate hair removal
Receiving VTE medicine/treatment Surgery patients who received appropriate venous thromboembolism prophylaxis within 24 hours prior to surgery to 24 hours after surgery
Urinary catheter removed Urinary catheter removed on postoperative day 1 (POD 1) or postoperative day 2 (POD 2) with day of surgery being day zero
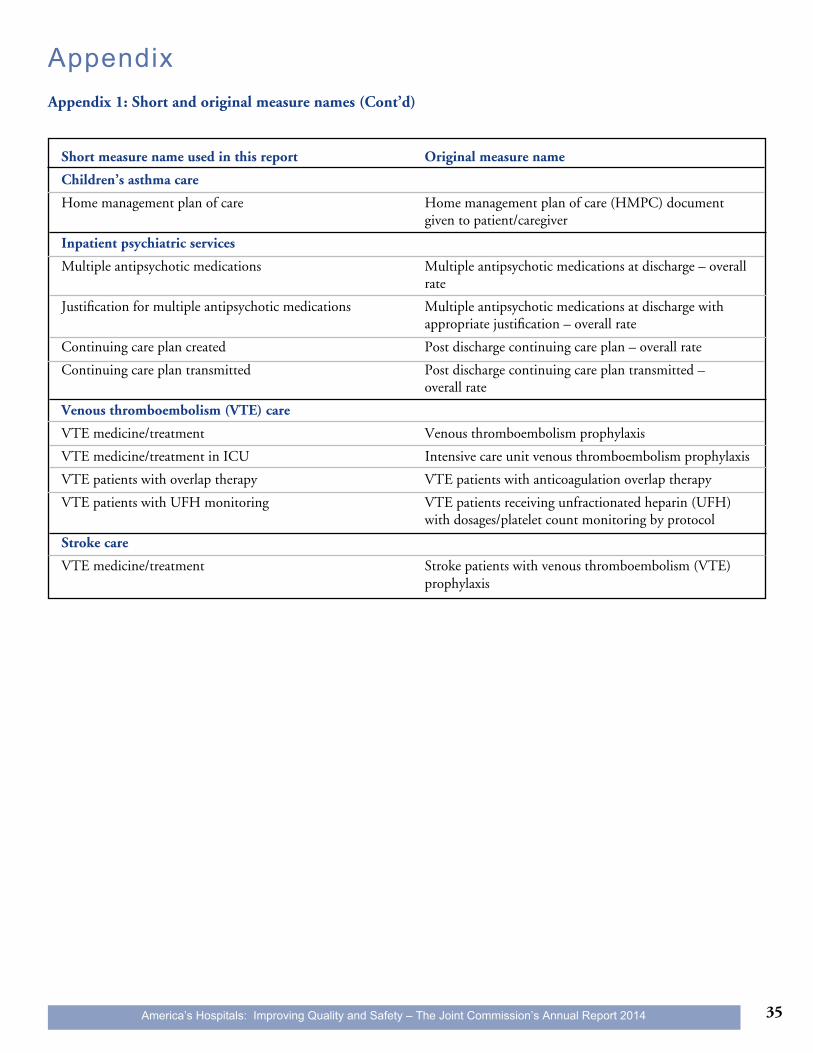
35America’s Hospitals: Improving Quality and Safety – The Joint Commission’s Annual Report 2014
Appendix Appendix 1: Short and original measure names (Cont’d)
Short measure name used in this report Original measure name
Children’s asthma care
Home management plan of care Home management plan of care (HMPC) document given to patient/caregiver
Inpatient psychiatric services
Multiple antipsychotic medications Multiple antipsychotic medications at discharge – overall rate
Justification for multiple antipsychotic medications Multiple antipsychotic medications at discharge with appropriate justification – overall rate
Continuing care plan created Post discharge continuing care plan – overall rate
Continuing care plan transmitted Post discharge continuing care plan transmitted – overall rate
Venous thromboembolism (VTE) care
VTE medicine/treatment Venous thromboembolism prophylaxis
VTE medicine/treatment in ICU Intensive care unit venous thromboembolism prophylaxis
VTE patients with overlap therapy VTE patients with anticoagulation overlap therapy
VTE patients with UFH monitoring VTE patients receiving unfractionated heparin (UFH) with dosages/platelet count monitoring by protocol
Stroke care
VTE medicine/treatment Stroke patients with venous thromboembolism (VTE) prophylaxis

36 America’s Hospitals: Improving Quality and Safety – The Joint Commission’s Annual Report 2014
Inpatient psychiatric services• Justification for multiple antipsychiotic medications• Continuing care plan created• Continuing care plan transmitted• Physical restraint*• Seclusion*
Venous thromboembolism (VTE) care• VTE medicine/treatment• VTE medicine/treatment in ICU• VTE patients with overlap therapy• VTE patients with UFH monitoring• VTE warfarin discharge instructions
Stroke care• VTE medicine/treatment• Discharged on antithrombotic therapy• Anticoagulation therapy for atrial fibrillation/flutter• Thrombolytic therapy• Antithrombotic therapy by end of hospital day two• Discharged on statin medication• Stroke education • Assessed for rehabilitation
Perinatal care• Elective delivery• Antenatal steroids• Exclusive breast milk feeding considering mother’s choice
Immunization• Pneumococcal immunization• Influenza immunization
Appendix 2: 2013 accountability measures
Heart attack care• Aspirin at arrival• Aspirin at discharge• ACEI or ARB at discharge• Beta-blocker at discharge• Fibrinolytic therapy within 30 minutes• PCI therapy within 90 minutes• Statin prescribed at discharge
Heart failure care• ACEI or ARB at discharge
Pneumonia care• Blood cultures in ICU• Blood cultures in ED• Antibiotics to ICU patients • Antibiotics to non-ICU patients
Surgical care• Antibiotics within one hour before the first
surgical cut• Appropriate prophylactic antibiotics• Stopping antibiotics within 24 hours• Beta-blocker patients who received beta-blocker
perioperatively• Cardiac patients with controlled postoperative
blood glucose• Patients with appropriate hair removal• Receiving VTE medicine/treatment• Urinary catheter removed
Children’s asthma care• Relievers for inpatient asthma• Systemic corticosteroids for inpatient asthma• Home management plan of care
Appendix
* This measure was not included in the composite results because it is a ratio measure. Only proportion measures are included in the composite.

37America’s Hospitals: Improving Quality and Safety – The Joint Commission’s Annual Report 2014
Appendix
Appendix 3: 2013 core measures being tested or evaluated against accountability measure criteria
Inpatient psychiatric servicesAdmission screening
Venous thromboembolism (VTE) careIncidence of potentially preventable VTE

38 America’s Hospitals: Improving Quality and Safety – The Joint Commission’s Annual Report 2014
Appendix
Appendix 4: Timeline for development of America’s Hospital’s: Improving Quality and Safety annual report
May Jun Oct NovJul Aug Sep
Analyses ofprevious year’s
data
Development of Top
Performer materials
Development
of annual report

39America’s Hospitals: Improving Quality and Safety – The Joint Commission’s Annual Report 2014
Appendix
State or TerritoryN
umbe
r of
hos
pita
ls
subm
itti
ng d
ata
in 2
010
Num
ber
of h
ospi
tals
su
bmit
ting
dat
a in
201
1
Num
ber
of h
ospi
tals
su
bmit
ting
dat
a in
201
2
Num
ber
of h
ospi
tals
su
bmit
ting
dat
a in
201
3
Num
ber
of T
op P
erfo
rmer
ho
spit
als
for
2010
Num
ber
of T
op P
erfo
rmer
ho
spit
als
for
2011
Num
ber
of T
op P
erfo
rmer
ho
spit
als
for
2012
Num
ber
of T
op P
erfo
rmer
ho
spit
als
for
2013
Alabama 69 10 76 19 72 33 74 35
Alaska 11 1 12 2 12 5 12 2
Arizona 33 4 39 5 43 13 45 17
Arkansas 33 7 42 9 42 13 38 16
California 278 34 302 55 305 93 305 97
Colorado 45 5 52 8 54 20 52 19
Connecticut 31 1 36 0 35 8 36 6
Delaware 7 0 12 2 12 5 12 2
District of Columbia 10 0 10 0 10 1 10 1
Florida 159 51 176 60 180 103 180 107
Georgia 112 13 124 23 116 35 109 33
Hawaii 16 0 16 2 16 4 15 7
Idaho 13 2 15 4 15 6 15 4
Illinois 122 18 138 17 123 35 125 56
Indiana 60 5 72 11 71 30 73 34
Iowa 26 2 28 2 28 11 29 10
Kansas 30 3 34 8 34 10 33 18
Kentucky 67 10 75 18 75 25 76 24
Louisiana 67 8 82 15 82 21 82 22
Maine 18 3 22 4 22 11 21 10
Maryland 46 1 54 2 51 16 54 18
Massachusetts 61 6 70 10 70 18 71 25
Michigan 83 11 92 13 91 27 92 39
Minnesota 51 4 52 11 60 16 59 22
Mississippi 42 14 47 16 43 16 42 15
Missouri 71 8 86 13 84 26 84 33
Montana 10 0 10 3 11 5 11 3
Nebraska 23 4 25 7 24 6 24 11
Nevada 21 4 27 8 30 15 29 15
New Hampshire 11 4 13 4 11 7 12 7
Appendix 5: Number of hospitals that submit accountability measure data and number of Top Performer hospitals for each state

40 America’s Hospitals: Improving Quality and Safety – The Joint Commission’s Annual Report 2014
Appendix
State or TerritoryN
umbe
r of
hos
pita
ls
subm
itti
ng d
ata
in 2
010
Num
ber
of h
ospi
tals
su
bmit
ting
dat
a in
201
1
Num
ber
of h
ospi
tals
su
bmit
ting
dat
a in
201
2
Num
ber
of h
ospi
tals
su
bmit
ting
dat
a in
201
3
Num
ber
of T
op P
erfo
rmer
ho
spit
als
for
2010
Num
ber
of T
op P
erfo
rmer
ho
spit
als
for
2011
Num
ber
of T
op P
erfo
rmer
ho
spit
als
for
2012
Num
ber
of T
op P
erfo
rmer
ho
spit
als
for
2013
Appendix 5: Number of hospitals that submit accountability measure data and number of Top Performer hospitals for each state
* Domestic DoD locations are included with the states.
**Total number of Department of Defense (DoD) locations worldwide submitting data.
New Jersey 58 12 72 14 71 26 71 26
New Mexico 22 2 23 5 23 7 20 7
New York 145 8 173 16 171 45 160 45
North Carolina 95 14 100 18 102 32 101 37
North Dakota 11 0 13 0 13 4 13 2
Ohio 132 14 138 20 135 36 138 42
Oklahoma 43 5 45 10 44 9 47 11
Oregon 32 2 34 5 34 6 30 10
Pennsylvania 126 20 136 23 138 47 141 57
Puerto Rico 31 0 35 1 34 2 38 2
Rhode Island 10 0 12 1 12 3 13 1
South Carolina 50 10 56 14 57 20 56 20
South Dakota 9 2 9 0 9 1 9 4
Tennessee 94 20 102 29 100 32 97 38
Texas 219 34 257 69 253 97 253 96
Utah 24 1 28 6 29 12 29 18
Vermont 7 1 8 3 7 3 7 2
Virgin Islands 0 0 0 0 0 0 1 0
Virginia 81 12 95 11 85 26 82 33
Washington 55 5 60 6 59 10 55 17
West Virginia 36 3 38 5 39 12 39 11
Wisconsin 78 7 80 12 81 31 82 33
Wyoming 10 1 11 1 10 3 11 4
Department of Defense International Locations*
Europe 2 0 5 0 14** 1 6** 0
Pacific 2 0 5 0 0 0 7** 0

Improving America’s Hospitals: The Joint Commission’s Annual Report on Quality and Safety 2014 41
Hospitals by State City
The Joint Commission’s Top Performer on Key Quality Measures® for 2013The checkmark (3) indicates the measure set(s) for which the hospital or critical access hospital is being recognized.
Hea
rt A
ttac
k
Hea
rt F
ailu
re
Pne
umon
ia
Surg
ical
Car
e
Chi
ldre
n’s
Ast
hma
VT
E
Stro
ke
Hos
p-B
ased
Inp
t P
sych
Imm
uniz
atio
n
Per
inat
al C
are
Alabama
Shelby Baptist Medical Center Alabaster 3 3 3 3
Community Hospital of Andalusia, Inc. Andalusia 3 3
The Healthcare Authority of Athens and
Limestone County Athens 3 3
Affinity Hospital, LLC Birmingham 3 3 3 3
Hill Crest Behavioral Health Services Birmingham 3
St. Vincent’s Birmingham Birmingham 3 3 3 3
Marshall Medical Center South Boaz 3 3 3
Cherokee Medical Center Centre 3
Cullman Regional Medical Center Cullman 3 3 3 3
Laurel Oaks Behavioral Health Center Dothan 3
Triad of Alabama, LLC Dothan 3 3 3 3
QHG of Enterprise, Inc. Enterprise 3 3
Gulf Health Hospitals, Inc. Fairhope 3 3 3 3
Fayette Medical Center Fayette 3
RCHP - Florence, LLC Florence 3 3 3 3
South Baldwin Regional Medical Center Foley 3 3 3 3
DeKalb Regional Medical Center Fort Payne 3 3 3
Greenville Hospital Corporation Greenville 3 3 3
Lakeland Community Hospital Haleyville 3
Marion Regional Medical Center, Inc. Hamilton 3
Crestwood Medical Center Huntsville 3 3 3 3
Walker Baptist Medical Center Jasper 3 3 3 3
St. Vincent’s Blount Oneonta 3 3
East Alabama Medical Center Opelika 3 3 3 3
St. Vincent’s St. Clair Hospital Pell City 3
Russell County Community Hospital, LLC Phenix City 3
Russellville Hospital Russellville 3 3
Vaughan Regional Medical Center, LLC Selma 3 3 3 3
Colbert County NW Alabama Healthcare Authority Sheffield 3 3
Sylacauga Healthcare Authority Sylacauga 3 3 3
Citizens Baptist Medical Center Talladega 3 3 3
DCH Regional Medical Center Tuscaloosa 3 3 3 3
Mary Starke Harper Geriatric Psychiatry Center Tuscaloosa 3
Taylor Hardin Secure Medical Facility Tuscaloosa 3
Northwest Medical Center Winfield 3 3
Alaska
Providence Alaska Medical Center Anchorage 3 3 3 3
Mat-Su Regional Medical Center Palmer 3 3 3
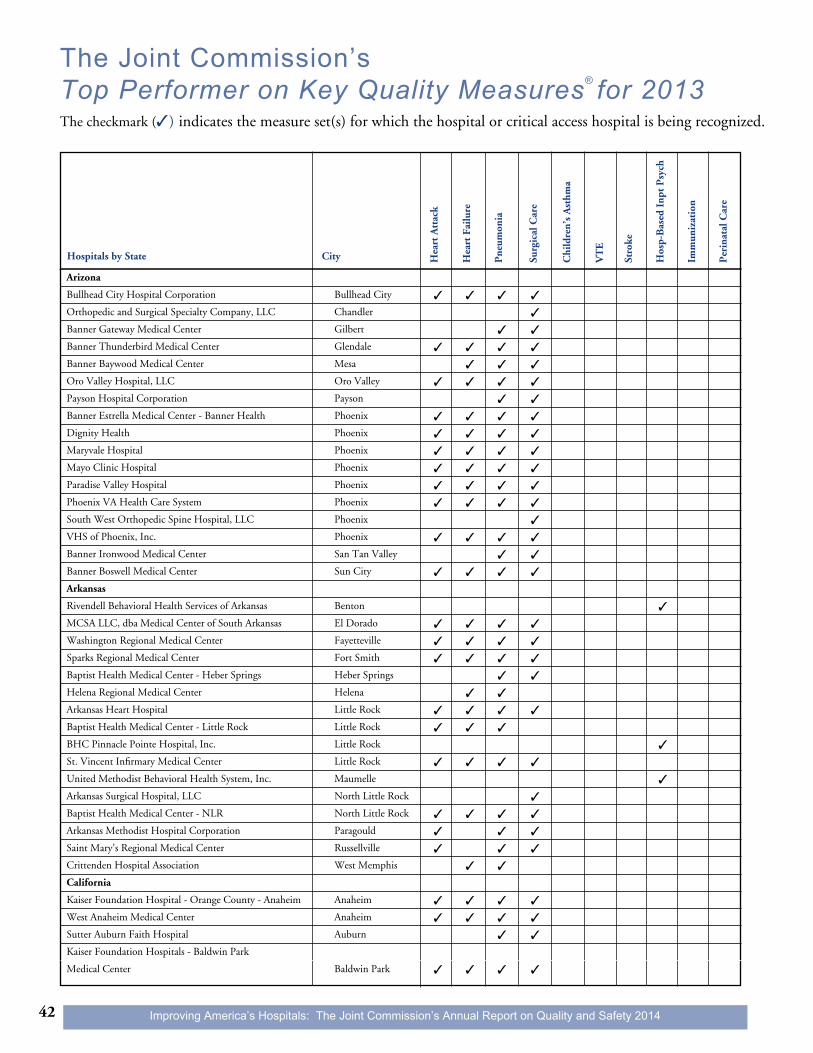
Improving America’s Hospitals: The Joint Commission’s Annual Report on Quality and Safety 201442
Hospitals by State City
The Joint Commission’s Top Performer on Key Quality Measures® for 2013The checkmark (3) indicates the measure set(s) for which the hospital or critical access hospital is being recognized.
Hea
rt A
ttac
k
Hea
rt F
ailu
re
Pne
umon
ia
Surg
ical
Car
e
Chi
ldre
n’s
Ast
hma
VT
E
Stro
ke
Hos
p-B
ased
Inp
t P
sych
Imm
uniz
atio
n
Per
inat
al C
are
Arizona
Bullhead City Hospital Corporation Bullhead City 3 3 3 3
Orthopedic and Surgical Specialty Company, LLC Chandler 3
Banner Gateway Medical Center Gilbert 3 3
Banner Thunderbird Medical Center Glendale 3 3 3 3
Banner Baywood Medical Center Mesa 3 3 3
Oro Valley Hospital, LLC Oro Valley 3 3 3 3
Payson Hospital Corporation Payson 3 3
Banner Estrella Medical Center - Banner Health Phoenix 3 3 3 3
Dignity Health Phoenix 3 3 3 3
Maryvale Hospital Phoenix 3 3 3 3
Mayo Clinic Hospital Phoenix 3 3 3 3
Paradise Valley Hospital Phoenix 3 3 3 3
Phoenix VA Health Care System Phoenix 3 3 3 3
South West Orthopedic Spine Hospital, LLC Phoenix 3
VHS of Phoenix, Inc. Phoenix 3 3 3 3
Banner Ironwood Medical Center San Tan Valley 3 3
Banner Boswell Medical Center Sun City 3 3 3 3
Arkansas
Rivendell Behavioral Health Services of Arkansas Benton 3
MCSA LLC, dba Medical Center of South Arkansas El Dorado 3 3 3 3
Washington Regional Medical Center Fayetteville 3 3 3 3
Sparks Regional Medical Center Fort Smith 3 3 3 3
Baptist Health Medical Center - Heber Springs Heber Springs 3 3
Helena Regional Medical Center Helena 3 3
Arkansas Heart Hospital Little Rock 3 3 3 3
Baptist Health Medical Center - Little Rock Little Rock 3 3 3
BHC Pinnacle Pointe Hospital, Inc. Little Rock 3
St. Vincent Infirmary Medical Center Little Rock 3 3 3 3
United Methodist Behavioral Health System, Inc. Maumelle 3
Arkansas Surgical Hospital, LLC North Little Rock 3
Baptist Health Medical Center - NLR North Little Rock 3 3 3 3
Arkansas Methodist Hospital Corporation Paragould 3 3 3
Saint Mary’s Regional Medical Center Russellville 3 3 3
Crittenden Hospital Association West Memphis 3 3
California
Kaiser Foundation Hospital - Orange County - Anaheim Anaheim 3 3 3 3
West Anaheim Medical Center Anaheim 3 3 3 3
Sutter Auburn Faith Hospital Auburn 3 3
Kaiser Foundation Hospitals - Baldwin Park
Medical Center Baldwin Park 3 3 3 3

Improving America’s Hospitals: The Joint Commission’s Annual Report on Quality and Safety 2014 43
Hospitals by State City
The Joint Commission’s Top Performer on Key Quality Measures® for 2013The checkmark (3) indicates the measure set(s) for which the hospital or critical access hospital is being recognized.
Hea
rt A
ttac
k
Hea
rt F
ailu
re
Pne
umon
ia
Surg
ical
Car
e
Chi
ldre
n’s
Ast
hma
VT
E
Stro
ke
Hos
p-B
ased
Inp
t P
sych
Imm
uniz
atio
n
Per
inat
al C
are
Hospital of Barstow, Incorporated Barstow 3 3 3 3
Providence Saint Joseph Medical Center Burbank 3 3 3 3
Mills - Peninsula Health Services Burlingame 3 3 3 3
Eden Medical Center Castro Valley 3 3 3 3
Clovis Community Medical Center Clovis 3 3 3 3
John Muir Behavioral Health Concord 3
John Muir Medical Center - Concord Campus Concord 3 3 3 3 3
Sharp Coronado Hospital Coronado 3 3 3
CHCM, Inc. Costa Mesa 3
Aurora Charter Oak - Los Angeles, LLC Covina 3
Sutter Coast Hospital Crescent City 3 3
Sutter Davis Hospital Davis 3 3
Kaiser Foundation Hospital - Downey Medical Center Downey 3 3 3 3
Encino Hospital Medical Center Encino 3
NorthBay Healthcare Group Fairfield 3 3 3 3
Mercy Hospital of Folsom Folsom 3 3 3
Kaiser Foundation Hospital - Fontana Fontana 3 3 3 3
Fresno Heart Hospital, LLC Fresno 3 3
Garden Grove Hospital and Medical Center Garden Grove 3 3 3
Marin General Hospital Greenbrae 3 3 3 3
Kaiser Foundation Hospital - South Bay Harbor City 3 3 3 3
Hayward Sisters Hospital Hayward 3 3 3 3
The Huntington Beach Hospital Huntington Beach 3 3 3
Centinela Hospital Medical Center Inglewood 3 3 3 3
Scripps Green Hospital La Jolla 3 3 3 3
Scripps Memorial Hospital - La Jolla La Jolla 3 3 3 3
Grossmont Hospital Corporation La Mesa 3 3 3 3
La Palma Intercommunity Hospital La Palma 3 3 3
VA Loma Linda Healthcare System Loma Linda 3 3 3 3
Los Alamitos Medical Center, Inc. Los Alamitos 3 3 3 3
Cedars - Sinai Medical Center Los Angeles 3 3 3 3
Good Samaritan Hospital Los Angeles 3 3 3 3
Kaiser Foundation Hospital - Los Angeles Medical Center Los Angeles 3 3 3 3
Kaiser Foundation Hospital - West Los Angeles Los Angeles 3 3 3 3
Keck Hospital of USC Los Angeles 3 3 3
Ronald Reagan UCLA Medical Center Los Angeles 3 3 3 3
Temple Community Hospital Los Angeles 3 3
Memorial Hospital Los Banos Los Banos 3
Doctors Medical Center of Modesto Modesto 3 3 3 3
Memorial Medical Center Modesto 3 3 3 3
Montclair Hospital Medical Center Montclair 3 3

Improving America’s Hospitals: The Joint Commission’s Annual Report on Quality and Safety 201444
Hospitals by State City
The Joint Commission’s Top Performer on Key Quality Measures® for 2013The checkmark (3) indicates the measure set(s) for which the hospital or critical access hospital is being recognized.
Hea
rt A
ttac
k
Hea
rt F
ailu
re
Pne
umon
ia
Surg
ical
Car
e
Chi
ldre
n’s
Ast
hma
VT
E
Stro
ke
Hos
p-B
ased
Inp
t P
sych
Imm
uniz
atio
n
Per
inat
al C
are
Community Hospital of the Monterey Peninsula Monterey 3 3 3 3
Kaiser Foundation Hospital - Moreno Valley
Medical Center Moreno Valley 3 3 3 3
El Camino Hospital Mountain View 3 3 3 3
Queen of the Valley Medical Center Napa 3 3 3 3
Prime Healthcare Paradise Valley, LLC National City 3 3 3 3
Sutter West Bay Hospitals Novato 3
Children’s Hospital of Orange County Orange 3
St. Joseph Hospital Orange 3 3 3 3
University of California Irvine Orange 3 3 3 3
Kaiser Foundation Hospitals - Panorama City
Medical Center Panorama City 3 3 3 3
Aurora Las Encinas, LLC Pasadena 3
Placentia - Linda Hospital Placentia 3 3 3
Marshall Medical Center Placerville 3 3 3
Prime Healthcare Services - Shasta, LLC Redding 3 3 3 3
Sequoia Hospital Redwood City 3 3 3
Kaiser Foundation Hospital - Riverside Riverside 3 3 3 3
Riverside Community Hospital Riverside 3 3 3 3
BHC Alhambra Hospital Rosemead 3
Kaiser Foundation Hospital - Sacramento Sacramento 3 3 3 3 3
Salinas Valley Memorial Hospital Salinas 3 3 3
Kaiser Foundation Hospital - San Diego San Diego 3 3 3 3
Sharp Memorial Hospital San Diego 3 3 3 3
VA San Diego Healthcare System San Diego 3 3 3 3
Dignity Health St. Mary’s Medical Center San Francisco 3 3 3 3
Saint Francis Memorial Hospital San Francisco 3 3 3
San Gabriel Valley Medical Center San Gabriel 3 3 3 3
Good Samaritan Hospital, LP San Jose 3 3 3 3
French Hospital Medical Center San Luis Obispo 3 3 3 3
San Mateo Medical Center San Mateo 3 3 3 3
Providence Little Company of Mary Medical
Center San Pedro San Pedro 3 3 3
San Ramon Regional Medical Center, LLC San Ramon 3 3 3
Coastal Communities Hospital Santa Ana 3 3
Mills Peninsula Health Services Santa Cruz 3
Saint John’s Health Center Santa Monica 3 3 3 3
Santa Monica - UCLA Medical Center and
Orthopaedic Hospital Santa Monica 3 3 3 3
Sutter Medical Center of Santa Rosa Santa Rosa 3 3 3 3
Simi Valley Hospital and Health Care Services Simi Valley 3 3

Improving America’s Hospitals: The Joint Commission’s Annual Report on Quality and Safety 2014 45
Hospitals by State City
The Joint Commission’s Top Performer on Key Quality Measures® for 2013The checkmark (3) indicates the measure set(s) for which the hospital or critical access hospital is being recognized.
Hea
rt A
ttac
k
Hea
rt F
ailu
re
Pne
umon
ia
Surg
ical
Car
e
Chi
ldre
n’s
Ast
hma
VT
E
Stro
ke
Hos
p-B
ased
Inp
t P
sych
Imm
uniz
atio
n
Per
inat
al C
are
Sonora Community Hospital Sonora 3
Barton Memorial Hospital South Lake Tahoe 3 3 3
Kaiser Foundation Hospital - South San Francisco South San Francisco 3 3 3 3 3
St. Joseph’s Medical Center of Stockton Stockton 3 3 3 3
Twin Cities Community Hospital Templeton 3 3 3
Los Robles Hospital and Medical Center Thousand Oaks 3 3 3 3
Providence Little Company of Mary Medical
Center Torrance Torrance 3 3 3 3
Torrance Memorial Medical Center Torrance 3 3 3 3
Sutter Central Valley Hospitals Tracy 3 3 3 3
Sutter Solano Medical Center Vallejo 3 3 3
Watsonville Community Hospital Watsonville 3 3
Citrus Valley Medical Center West Covina 3 3 3 3
Presbyterian Intercommunity Hospital Whittier 3 3 3 3
Woodland Memorial Hospital Woodland 3 3 3
Kaiser Foundation Hospital - Woodland Hills Woodland Hills 3 3 3 3
Colorado
The Medical Center of Aurora Aurora 3 3 3 3
Platte Valley Medical Center Brighton 3 3 3 3
Centura Health - Porter Adventist Hospital Denver 3 3 3 3
Exempla, Inc. Denver 3 3 3 3
Presbyterian/St. Luke’s Medical Center Denver 3 3 3
Rose Medical Center Denver 3 3 3 3
Mercy Regional Medical Center Durango 3 3 3
Colorado Plains Medical Center Fort Morgan 3 3
Valley View Hospital Association Glenwood Springs 3 3 3
Grand Junction Veterans Affairs Medical Center Grand Junction 3 3 3
North Colorado Medical Center Greeley 3 3 3 3
Exempla Good Samaritan Medical Center, LLC Lafayette 3 3 3 3
OrthoColorado Hospital at St. Anthony Medical Campus Lakewood 3
Littleton Adventist Hospital - Centura Health Littleton 3 3 3 3
McKee Medical Center Loveland 3 3 3
Haven Behavioral War Heroes Hospital @
St. Mary - Corwin Pueblo 3
Yampa Valley Medical Center Steamboat Springs 3
North Suburban Medical Center Thornton 3 3 3
Exempla Lutheran Medical Center Wheat Ridge 3 3 3 3
Connecticut
The Danbury Hospital Danbury 3 3 3 3
Griffin Hospital Derby 3 3 3 3
Milford Hospital, Inc. Milford 3 3 3

Improving America’s Hospitals: The Joint Commission’s Annual Report on Quality and Safety 201446
Hospitals by State City
The Joint Commission’s Top Performer on Key Quality Measures® for 2013The checkmark (3) indicates the measure set(s) for which the hospital or critical access hospital is being recognized.
Hea
rt A
ttac
k
Hea
rt F
ailu
re
Pne
umon
ia
Surg
ical
Car
e
Chi
ldre
n’s
Ast
hma
VT
E
Stro
ke
Hos
p-B
ased
Inp
t P
sych
Imm
uniz
atio
n
Per
inat
al C
are
The William W. Backus Hospital Norwich 3 3 3 3
Stamford Hospital Stamford 3 3 3 3
Saint Mary’s Hospital, Inc. Waterbury 3 3 3 3
Delaware
Bayhealth - Kent General Hospital Dover 3 3 3 3
UHS of Dover, LLC Dover 3
District of Columbia
Sibley Memorial Hospital Washington 3 3
Florida
JFK Medical Center Limited Partnership Atlantis 3 3 3 3
Aventura Hospital and Medical Center Aventura 3 3 3 3
Bartow HMA, LLC Bartow 3 3
Bay Pines VA Healthcare System Bay Pines 3 3 3 3
District Hospital Holdings, Inc., dba Lakeside
Medical Center Belle Glade 3 3 3 3
Boca Raton Regional Hospital, Inc. Boca Raton 3 3 3 3
West Boca Medical Center, Inc. Boca Raton 3 3 3 3
Blake Medical Center Bradenton 3 3 3 3
Manatee Memorial Hospital Bradenton 3 3 3 3
Brandon Regional Hospital Brandon 3 3 3 3
Bayfront Health Brooksville & Bayfront
Health Spring Hill Brooksville 3 3 3 3
Oak Hill Hospital Brooksville 3 3 3 3
Morton Plant Hospital Association Clearwater 3 3 3 3
Windmoor Healthcare of Clearwater, Inc. Clearwater 3
Cape Canaveral Hospital, Inc. Cocoa Beach 3 3 3 3
Coral Gables Hospital Coral Gables 3 3 3 3
Doctors Hospital, Inc. Coral Gables 3 3 3 3 3
Broward Health Coral Springs Coral Springs 3 3 3
Halifax Health Daytona Beach 3 3 3 3
Florida Hospital Deland Deland 3 3 3 3
Delray Medical Center, Inc. Delray Beach 3 3 3 3 3
Mease Dunedin Hospital Dunedin 3 3 3 3
Englewood Community Hospital Englewood 3 3 3
South Florida Evaluation and Treatment Center (SFETC) Florida City 3
Broward Health Imperial Point Fort Lauderdale 3 3 3
Broward Health Medical Center Fort Lauderdale 3 3 3 3
Fort Lauderdale Hospital Management, LLC Fort Lauderdale 3
Holy Cross Hospital, Inc. Fort Lauderdale 3 3 3 3
Lawnwood Regional Medical Center & Heart Institute Fort Pierce 3 3 3 3 3
Fort Walton Beach Medical Center, Inc. Fort Walton Beach 3 3 3 3

Improving America’s Hospitals: The Joint Commission’s Annual Report on Quality and Safety 2014 47
Hospitals by State City
The Joint Commission’s Top Performer on Key Quality Measures® for 2013The checkmark (3) indicates the measure set(s) for which the hospital or critical access hospital is being recognized.
Hea
rt A
ttac
k
Hea
rt F
ailu
re
Pne
umon
ia
Surg
ical
Car
e
Chi
ldre
n’s
Ast
hma
VT
E
Stro
ke
Hos
p-B
ased
Inp
t P
sych
Imm
uniz
atio
n
Per
inat
al C
are
North Florida Regional Medical Center Gainesville 3 3 3 3
Shands Teaching Hospitals & Clinics, Inc. Gainesville 3 3 3 3
Gulf Breeze Hospital Gulf Breeze 3 3
Palmetto General Hospital Hialeah 3 3 3 3
Memorial Regional Hospital Hollywood 3 3 3 3 3 3
Homestead Hospital, Inc. Homestead 3 3 3 3
Regional Medical Center Bayonet Point Hudson 3 3 3 3
Memorial Healthcare, Inc. Jacksonville 3 3 3 3
St. Vincent’s Medical Center, Inc. Jacksonville 3 3 3 3
St. Vincent’s Southside - St. Vincent’s HealthCare, Inc. Jacksonville 3 3 3 3
Wekiva Springs Center, LLC Jacksonville 3
Jupiter Medical Center Jupiter 3 3 3 3
Osceola Regional Medical Center Kissimmee 3 3 3 3
Lake City Medical Center Lake City 3 3 3 3
Largo Medical Center Largo 3 3 3 3
Lehigh Regional Medical Center Lehigh Acres 3 3 3 3
Palms West Hospital Loxahatchee 3 3 3 3
Northwest Medical Center Margate 3 3 3 3
Holmes Regional Medical Center, Inc. Melbourne 3 3 3 3
Viera Hospital, Inc. Melbourne 3 3
Baptist Hospital of Miami Miami 3 3 3 3 3 3 3
Kendall Regional Medical Center Miami 3 3 3 3
South Miami Hospital Miami 3 3 3 3
Variety Children’s Hospital Miami 3
West Kendall Baptist Hospital Miami 3 3 3 3 3 3
Mount Sinai Medical Center of Florida, Inc. Miami Beach 3 3 3 3
Santa Rosa Medical Center Milton 3 3
Memorial Hospital Miramar Miramar 3 3 3
Morton Plant North Bay Hospital New Port Richey 3 3 3 3
Twin Cities Hospital Niceville 3 3
Ocala Regional Medical Center Ocala 3 3 3 3
Orlando Health Central Ocoee 3 3 3 3 3
Raulerson Hospital Okeechobee 3 3 3 3
Florida Hospital Fish Memorial Orange City 3 3 3 3
Orange Park Medical Center Orange Park 3 3 3 3
Holmes Regional Medical Center, Inc., dba Palm
Bay Hospital Palm Bay 3 3 3 3
Palm Beach Gardens Medical Center Palm Beach Gardens 3 3 3 3
Bay Medical Center Sacred Heart Health System Panama City 3 3 3 3
Gulf Coast Regional Medical Center Panama City 3 3 3 3
Memorial Hospital Pembroke Pembroke Pines 3 3 3 3

Improving America’s Hospitals: The Joint Commission’s Annual Report on Quality and Safety 201448
Hospitals by State City
The Joint Commission’s Top Performer on Key Quality Measures® for 2013The checkmark (3) indicates the measure set(s) for which the hospital or critical access hospital is being recognized.
Hea
rt A
ttac
k
Hea
rt F
ailu
re
Pne
umon
ia
Surg
ical
Car
e
Chi
ldre
n’s
Ast
hma
VT
E
Stro
ke
Hos
p-B
ased
Inp
t P
sych
Imm
uniz
atio
n
Per
inat
al C
are
Memorial Hospital West Pembroke Pines 3 3 3 3
South Florida State Hospital Pembroke Pines 3
Baptist Hospital, Inc. Pensacola 3 3 3 3
West Florida Regional Medical Center, Inc. Pensacola 3 3 3 3
South Florida Baptist Hospital, Inc. Plant City 3 3 3 3
Westside Regional Medical Center Plantation 3 3 3 3
Broward Health North Pompano Beach 3 3 3 3
Fawcett Memorial Hospital Port Charlotte 3 3 3 3
St. Lucie Medical Center Port Saint Lucie 3 3 3 3
St. Cloud Regional Medical Center Saint Cloud 3 3 3 3
Edward White Hospital Saint Petersburg 3 3
Northside Hospital Saint Petersburg 3 3 3 3
St. Anthony’s Hospital Saint Petersburg 3 3 3 3
St. Petersburg General Hospital Saint Petersburg 3 3
Central Florida Regional Hospital Sanford 3 3 3 3
Doctors Hospital of Sarasota Sarasota 3 3 3 3
Sebastian River Medical Center Sebastian 3 3 3 3
Florida Hospital Heartland Medical Center Sebring 3 3 3 3
Shands Starke Regional Medical Center Starke 3 3
South Bay Hospital Sun City Center 3 3 3 3
University Hospital, Ltd. Tamarac 3 3 3 3
Florida Hospital Tampa Tampa 3 3 3 3
James A. Haley Veterans’ Hospital Tampa 3 3 3 3
St. Joseph’s Hospital, Inc. Tampa 3 3 3 3
Florida Hospital North Pinellas Tarpon Springs 3 3 3
Florida Hospital Waterman, Inc. Tavares 3 3 3 3
Mariners Hospital, Inc. Tavernier 3
North Brevard County Hospital District Titusville 3 3 3 3
Medical Center of Trinity Trinity 3 3 3 3
Venice HMA, LLC Venice 3 3 3 3 3
Wellington Regional Medical Center Wellington 3 3 3 3
St. Mary’s Medical Center West Palm Beach 3 3 3
Tenet Good Samaritan West Palm Beach 3 3 3 3
VA Medical Center - West Palm Beach West Palm Beach 3 3 3
West Palm Hospital West Palm Beach 3 3
Cleveland Clinic Florida Weston 3 3 3 3
Florida Hospital Zephyrhills Zephyrhills 3 3 3 3
Georgia
Emory University Hospital Atlanta 3 3 3 3
Wesley Woods Center of Emory University Atlanta 3
Augusta Hospital, LLC Augusta 3 3 3 3

Improving America’s Hospitals: The Joint Commission’s Annual Report on Quality and Safety 2014 49
Hospitals by State City
The Joint Commission’s Top Performer on Key Quality Measures® for 2013The checkmark (3) indicates the measure set(s) for which the hospital or critical access hospital is being recognized.
Hea
rt A
ttac
k
Hea
rt F
ailu
re
Pne
umon
ia
Surg
ical
Car
e
Chi
ldre
n’s
Ast
hma
VT
E
Stro
ke
Hos
p-B
ased
Inp
t P
sych
Imm
uniz
atio
n
Per
inat
al C
are
Doctors Hospital of Augusta Augusta 3 3 3 3
Blue Ridge Georgia Hospital Company, LLC Blue Ridge 3 3
Higgins General Hospital Bremen 3
Gordon Hospital Calhoun 3 3 3 3 3
Tanner Medical Center, Inc. Carrollton 3 3 3 3
Doctors Hospital Columbus 3
Restoration Healthcare of Commerce, LLC Commerce 3
Rockdale Hospital, LLC Conyers 3 3 3 3
Crisp Regional Hospital, Inc. Cordele 3 3 3 3
Hamilton Medical Center Dalton 3 3 3 3
DeKalb Medical Center, Inc. Decatur 3 3 3 3
Coffee Regional Medical Center Douglas 3 3 3
Fairview Park Hospital, LP Dublin 3 3 3 3
Hutcheson Medical Center Fort Oglethorpe 3 3
Tenet Healthsystem Spalding, Inc. Griffin 3 3 3 3
WellStar Paulding Hospital Hiram 3 3
EHCA Johns Creek, LLC Johns Creek 3 3 3 3
DeKalb Medical Center, Inc. Lithonia 3 3 3 3
Coliseum Medical Center, LLC Macon 3 3 3 3
Coliseum Psychiatric Center, LLC Macon 3
Colquitt Regional Medical Center Moultrie 3 3 3
Redmond Regional Medical Center Rome 3 3 3 3
Southeast Georgia Health System Camden Campus Saint Marys 3
Saint Joseph’s Hospital Savannah 3 3 3 3
Emory - Adventist Hospital Smyrna 3 3 3
Ridgeview Institute, Inc. Smyrna 3
Eastside Medical Center Snellville 3 3 3 3
Tift Regional Medical Center Tifton 3 3 3 3
Tanner Medical Center - Villa Rica Villa Rica 3 3 3
Barrow Regional Medical Center Winder 3 3
Hawaii
Sutter Health Pacific Ewa Beach 3
Kaiser Foundation Hospital Honolulu 3 3 3 3 3
Straub Clinic and Hospital Honolulu 3 3 3 3
The Queen’s Medical Center Honolulu 3 3 3 3
Castle Medical Center Kailua 3 3 3
Wilcox Memorial Hospital Lihue 3 3 3
Maui Memorial Medical Center Wailuku 3 3 3 3
Idaho
West Valley Medical Center Caldwell 3 3 3
Saint Alphonsus Medical Center - Nampa Nampa 3 3 3 3
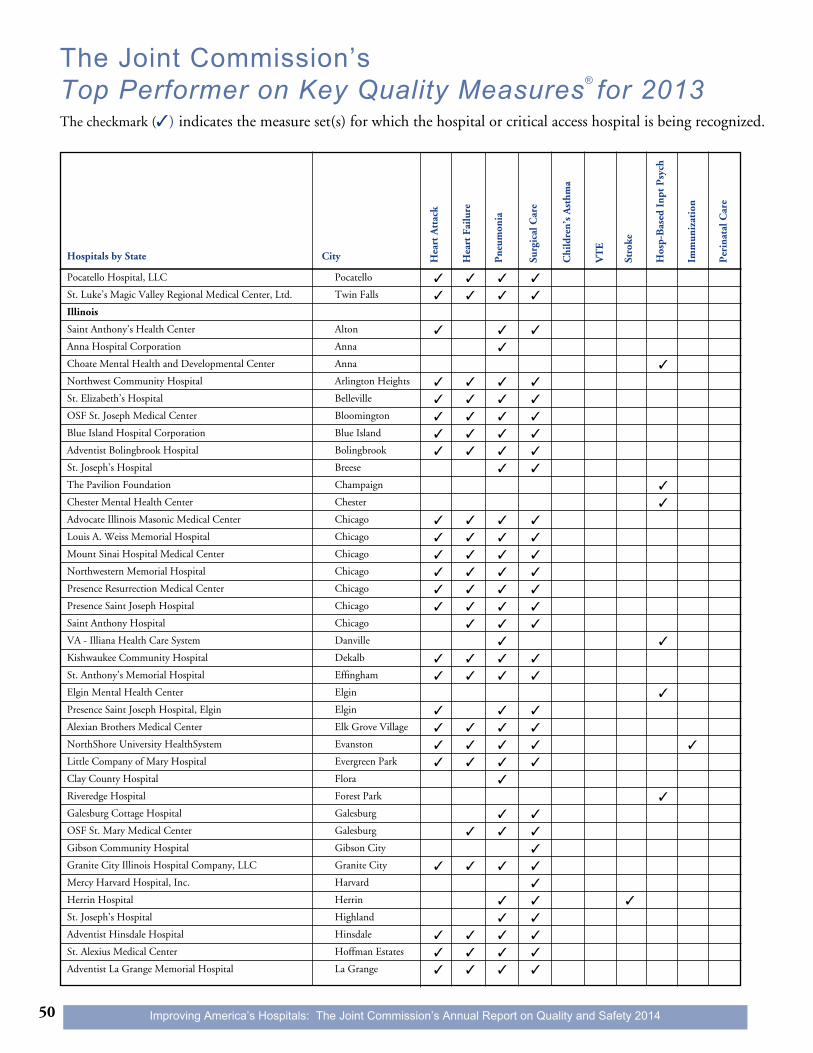
Improving America’s Hospitals: The Joint Commission’s Annual Report on Quality and Safety 201450
Hospitals by State City
The Joint Commission’s Top Performer on Key Quality Measures® for 2013The checkmark (3) indicates the measure set(s) for which the hospital or critical access hospital is being recognized.
Hea
rt A
ttac
k
Hea
rt F
ailu
re
Pne
umon
ia
Surg
ical
Car
e
Chi
ldre
n’s
Ast
hma
VT
E
Stro
ke
Hos
p-B
ased
Inp
t P
sych
Imm
uniz
atio
n
Per
inat
al C
are
Pocatello Hospital, LLC Pocatello 3 3 3 3
St. Luke’s Magic Valley Regional Medical Center, Ltd. Twin Falls 3 3 3 3
Illinois
Saint Anthony’s Health Center Alton 3 3 3
Anna Hospital Corporation Anna 3
Choate Mental Health and Developmental Center Anna 3
Northwest Community Hospital Arlington Heights 3 3 3 3
St. Elizabeth’s Hospital Belleville 3 3 3 3
OSF St. Joseph Medical Center Bloomington 3 3 3 3
Blue Island Hospital Corporation Blue Island 3 3 3 3
Adventist Bolingbrook Hospital Bolingbrook 3 3 3 3
St. Joseph’s Hospital Breese 3 3
The Pavilion Foundation Champaign 3
Chester Mental Health Center Chester 3
Advocate Illinois Masonic Medical Center Chicago 3 3 3 3
Louis A. Weiss Memorial Hospital Chicago 3 3 3 3
Mount Sinai Hospital Medical Center Chicago 3 3 3 3
Northwestern Memorial Hospital Chicago 3 3 3 3
Presence Resurrection Medical Center Chicago 3 3 3 3
Presence Saint Joseph Hospital Chicago 3 3 3 3
Saint Anthony Hospital Chicago 3 3 3
VA - Illiana Health Care System Danville 3 3
Kishwaukee Community Hospital Dekalb 3 3 3 3
St. Anthony’s Memorial Hospital Effingham 3 3 3 3
Elgin Mental Health Center Elgin 3
Presence Saint Joseph Hospital, Elgin Elgin 3 3 3
Alexian Brothers Medical Center Elk Grove Village 3 3 3 3
NorthShore University HealthSystem Evanston 3 3 3 3 3
Little Company of Mary Hospital Evergreen Park 3 3 3 3
Clay County Hospital Flora 3
Riveredge Hospital Forest Park 3
Galesburg Cottage Hospital Galesburg 3 3
OSF St. Mary Medical Center Galesburg 3 3 3
Gibson Community Hospital Gibson City 3
Granite City Illinois Hospital Company, LLC Granite City 3 3 3 3
Mercy Harvard Hospital, Inc. Harvard 3
Herrin Hospital Herrin 3 3 3
St. Joseph’s Hospital Highland 3 3
Adventist Hinsdale Hospital Hinsdale 3 3 3 3
St. Alexius Medical Center Hoffman Estates 3 3 3 3
Adventist La Grange Memorial Hospital La Grange 3 3 3 3

Improving America’s Hospitals: The Joint Commission’s Annual Report on Quality and Safety 2014 51
The Joint Commission’s Top Performer on Key Quality Measures® for 2013The checkmark (3) indicates the measure set(s) for which the hospital or critical access hospital is being recognized.
St. Francis Hospital of the Hospital Sisters Litchfield 3
Sarah Bush Lincoln Health Center Mattoon 3 3 3 3 3
Northern Illinois Medical Center McHenry 3 3 3 3
National Healthcare of Mt. Vernon, Inc. Mount Vernon 3 3
Edward Hospital Naperville 3 3 3 3
Pekin Memorial Hospital Pekin 3 3 3
OSF Saint Francis Medical Center Peoria 3 3 3 3
Saint James Hospital Pontiac 3 3
Blessing Hospital Quincy 3 3 3 3
Red Bud Regional Hospital, LLC Red Bud 3
Valley West Community Hospital Sandwich 3 3
Genesis Medical Center, Silvis Silvis 3 3 3
Lincoln Prairie Behavioral Health Center Springfield 3
BHC Streamwood Hospital, Inc. Streamwood 3
St. Mary’s Hospital Streator 3 3
Waukegan IL Hospital Company, LLC Waukegan 3 3 3 3
Memorial Medical Center Woodstock 3 3
CTCA at Midwestern Regional Medical Center Zion 3
Indiana
Community Hospital of Anderson and Madison County Anderson 3 3 3 3
St. Vincent Anderson Regional Hospital, Inc. Anderson 3 3 3 3
Indiana University Health Bedford Hospital Bedford 3 3
Bloomington Meadows Hospital Bloomington 3
Bluffton Health Systems Bluffton 3 3
Whitley Memorial Hospital, Inc. Columbia City 3
St. Catherine Hospital, Inc. East Chicago 3 3 3 3 3
Evansville State Hospital Evansville 3
Dupont Hospital, LLC Fort Wayne 3 3
Orthopaedic Hospital at Parkview North Fort Wayne 3
The Orthopedic Hospital of Lutheran Health Network Fort Wayne 3
St. Vincent Frankfort Hospital Frankfort 3
Valle Vista Hospital, LLC Greenwood 3
St. Mary Medical Center Hobart 3 3 3 3
Huntington Memorial Hospital Huntington 3 3
Health and Hospital Corporation Indianapolis 3 3 3 3
St. Vincent Hospital and Health Care Services, Inc. Indianapolis 3 3 3 3
The Indiana Heart Hospital, LLC Indianapolis 3 3 3
Memorial Hospital and Health Care Center Jasper 3 3 3 3
St. Joseph Hospital & Health Center, Inc. Kokomo 3 3 3
Community Hospital of Lagrange County, Inc., dba
Lagrange Hospital Lagrange 3
Logansport State Hospital Logansport 3
Hea
rt A
ttac
k
Per
inat
al C
are
Imm
uniz
atio
n
Hos
p-B
ased
Inp
t P
sych
Stro
ke
VT
E
Chi
ldre
n’s
Ast
hma
Surg
ical
Car
e
Pne
umon
ia
Hea
rt F
ailu
re
Hospitals by State City

Improving America’s Hospitals: The Joint Commission’s Annual Report on Quality and Safety 201452
Hospitals by State City
The Joint Commission’s Top Performer on Key Quality Measures® for 2013The checkmark (3) indicates the measure set(s) for which the hospital or critical access hospital is being recognized.
Hea
rt A
ttac
k
Hea
rt F
ailu
re
Pne
umon
ia
Surg
ical
Car
e
Chi
ldre
n’s
Ast
hma
VT
E
Stro
ke
Hos
p-B
ased
Inp
t P
sych
Imm
uniz
atio
n
Per
inat
al C
are
Madison State Hospital Madison 3
Saint Joseph Regional Medical Center Mishawaka 3 3 3 3
Brentwood Meadows, LLC Newburgh 3
Dukes Health System, LLC Peru 3 3
HHC Indiana, Inc. Plymouth 3
Saint Joseph Regional Medical Center Plymouth 3 3 3
Jackson County Schneck Memorial Hospital Seymour 3 3
Terre Haute Regional Hospital Terre Haute 3 3 3 3
Indiana University Health Tipton Hospital, Inc. Tipton 3 3
Porter Hospital Company, LLC Valparaiso 3 3 3 3
Wabash County Hospital Wabash 3 3
Kosciusko Community Hospital Warsaw 3 3
Iowa
Mary Greeley Medical Center Ames 3 3 3 3
Sartori Memorial Hospital - Wheaton Franciscan
Healthcare Cedar Falls 3 3
Mercy Medical Center - Clinton Clinton 3 3 3
Alegent Creighton Health Mercy Hospital Council Bluffs 3 3 3 3
Jennie Edmundson Memorial Hospital Council Bluffs 3 3 3 3
Genesis Medical Center, Davenport Davenport 3 3 3 3
Mercy Medical Center Des Moines 3 3 3 3
Mercy Health Services - Iowa Dubuque 3 3 3
Fort Madison Community Hospital Fort Madison 3 3
Mental Health Institute Independence 3
Kansas
Susan B. Allen Memorial Hospital El Dorado 3 3
Mercy Hospital Fort Scott Fort Scott 3 3
The University of Kansas Hospital Authority Kansas City 3 3 3 3
Lawrence Memorial Hospital Lawrence 3 3 3 3
Saint Luke’s Cushing Hospital Leavenworth 3 3
Prairie View, Inc. Newton 3
Menorah Medical Center Overland Park 3 3 3
Overland Park Regional Medical Center Overland Park 3 3 3 3
Saint Luke’s South Hospital, Inc. Overland Park 3 3 3
The Children’s Mercy Hospital Overland Park 3
Miami County Medical Center, Inc. Paola 3
Via Christi Hospital Pittsburg, Inc. Pittsburg 3 3 3
Shawnee Mission Medical Center Shawnee Mission 3 3 3 3
St. Francis Health Topeka 3 3 3 3
Stormont-Vail HealthCare, Inc. Topeka 3 3 3 3
VA Eastern Kansas Health Care System Topeka 3

Improving America’s Hospitals: The Joint Commission’s Annual Report on Quality and Safety 2014 53
Hospitals by State City
The Joint Commission’s Top Performer on Key Quality Measures® for 2013The checkmark (3) indicates the measure set(s) for which the hospital or critical access hospital is being recognized.
Hea
rt A
ttac
k
Hea
rt F
ailu
re
Pne
umon
ia
Surg
ical
Car
e
Chi
ldre
n’s
Ast
hma
VT
E
Stro
ke
Hos
p-B
ased
Inp
t P
sych
Imm
uniz
atio
n
Per
inat
al C
are
Via Christi Hospital Wichita St. Teresa, Inc. Wichita 3 3
Wesley Medical Center, LLC Wichita 3 3 3 3 3
Kentucky
Ashland Hospital Corporation Ashland 3 3 3 3
Flaget Healthcare, Inc. Bardstown 3 3
Greenview Regional Hospital Bowling Green 3 3 3
UHS of Bowling Green, LLC Bowling Green 3
Harrison Memorial Hospital Cynthiana 3 3
Saint Elizabeth Medical Center, Inc. Edgewood 3 3 3 3 3
Fleming County Hospital District Flemingsburg 3
St. Elizabeth Medical Center, Inc. Florence 3 3 3 3 3
St. Elizabeth Medical Center, Inc. Fort Thomas 3 3 3 3 3
Frankfort Regional Medical Center Frankfort 3 3 3 3
Hospital of Fulton, Inc. Fulton 3 3
Harlan Appalachian Regional Hospital Harlan 3 3
Western State Hospital Hopkinsville 3
Jackson Hospital Corporation Jackson 3 3
Twin Lakes Regional Medical Center Leitchfield 3
Baptist Healthcare Systems Lexington 3 3 3 3
University of Kentucky Hospital Lexington 3 3 3 3 3
Hospital of Louisa, Inc. Louisa 3 3
Saint Joseph Health System, Inc. Martin 3
Rockcastle Regional Hospital and Respiratory Care Center Mount Vernon 3
Mercy Health Partners-Lourdes Hospital, Inc. Paducah 3 3 3
Paul B. Hall Regional Medical Center Paintsville 3
Pikeville Medical Center Pikeville 3 3 3 3
Logan Memorial Hospital Russellville 3
Louisiana
Abbeville General Hospital Service District #2 Abbeville 3 3
Oceans Behavioral Hospital of Alexandria Alexandria 3
Rapides Regional Medical Center Alexandria 3 3 3 3
Liberty HealthCare Systems, LLC Bastrop 3
Baton Rouge General Medical Center Baton Rouge 3 3 3 3
Franciscan Missionaries of Our Lady Health System Baton Rouge 3 3 3 3
Oceans Behavioral Hospital of Lafayette, LLC Broussard 3
Lakeview Regional Medical Center Covington 3 3 3 3
Oceans Behavioral Hospital - Deridder Deridder 3
Compass Behavioral Center of Houma, Inc. Houma 3
River Parishes Hospital La Place 3 3 3
Heart Hospital of Lafayette Lafayette 3 3
The Regional Medical Center of Acadiana Lafayette 3 3 3 3

Improving America’s Hospitals: The Joint Commission’s Annual Report on Quality and Safety 201454
Hospitals by State City
The Joint Commission’s Top Performer on Key Quality Measures® for 2013The checkmark (3) indicates the measure set(s) for which the hospital or critical access hospital is being recognized.
Hea
rt A
ttac
k
Hea
rt F
ailu
re
Pne
umon
ia
Surg
ical
Car
e
Chi
ldre
n’s
Ast
hma
VT
E
Stro
ke
Hos
p-B
ased
Inp
t P
sych
Imm
uniz
atio
n
Per
inat
al C
are
Minden Medical Center Minden 3 3 3
St. Francis Medical Center Monroe 3 3 3 3 3
Progressive Acute Care Dauterive, LLC New Iberia 3 3 3
Oceans Behavioral Hospital of Opelousas Opelousas 3
Phoenix Behavioral Hospital of Eunice Rayne 3
Ruston Louisiana Hospital Company, LLC Ruston 3 3 3 3
St. Tammany Parish Hospital Service District #2 Slidell 3 3 3 3 3
Hospital Service District #3 of Lafourche Parish, Louisiana Thibodaux 3 3 3 3
Lane Regional Medical Center Zachary 3 3 3 3
Maine
MaineGeneral Medical Center Augusta 3 3 3 3
Cary Medical Center Caribou 3 3
Maine Coast Memorial Hospital Ellsworth 3 3 3
Franklin Memorial Hospital Farmington 3 3
Northern Maine Medical Center Fort Kent 3
Central Maine Medical Center Lewiston 3 3 3 3
St. Mary’s Regional Medical Center Lewiston 3 3 3
Maine Medical Center Portland 3 3 3 3
Mercy Hospital Portland 3 3 3
The Aroostook Medical Center Presque Isle 3 3 3 3
Maryland
Greater Baltimore Medical Center Baltimore 3 3 3
Maryland General Hospital Baltimore 3 3 3
Sinai Hospital of Baltimore Baltimore 3 3 3 3
The Johns Hopkins Hospital Baltimore 3 3 3 3
Upper Chesapeake Medical Center Bel Air 3 3 3 3
Atlantic General Hospital Corporation Berlin 3 3
Suburban Hospital System, Incorporated Bethesda 3 3 3 3
The Union Hospital of Cecil County, Inc. Elkton 3 3 3
Frederick Memorial Hospital Frederick 3 3 3 3
Harford Memorial Hospital Havre De Grace 3 3 3
Civista Medical Center, Inc. La Plata 3 3 3
Doctors Community Hospital Lanham 3 3 3 3
St. Mary’s Hospital of St. Mary’s County, Inc. Leonardtown 3 3 3 3 3
MedStar Montgomery Medical Center Olney 3 3 3 3
Calvert Memorial Hospital Prince Frederick 3 3 3 3
Shady Grove Adventist Hospital Rockville 3 3 3 3
Holy Cross Hospital of Silver Spring, Inc. Silver Spring 3 3 3 3
Washington Adventist Hospital Takoma Park 3 3 3 3
Massachusetts
Sturdy Memorial Hospital, Inc. Attleboro 3 3 3 3

Improving America’s Hospitals: The Joint Commission’s Annual Report on Quality and Safety 2014 55
Hospitals by State City
The Joint Commission’s Top Performer on Key Quality Measures® for 2013The checkmark (3) indicates the measure set(s) for which the hospital or critical access hospital is being recognized.
Hea
rt A
ttac
k
Hea
rt F
ailu
re
Pne
umon
ia
Surg
ical
Car
e
Chi
ldre
n’s
Ast
hma
VT
E
Stro
ke
Hos
p-B
ased
Inp
t P
sych
Imm
uniz
atio
n
Per
inat
al C
are
Northeast Hospital Corporation Beverly 3 3 3 3
Beth Israel Deaconess Medical Center Boston 3 3 3 3
Brigham and Women’s Faulkner Hospital Boston 3 3 3
Franciscan Hospital for Children, Inc. Boston 3
New England Baptist Hospital Boston 3
Tufts Medical Center Boston 3 3 3 3
Signature - Healthcare Brockton Hospital Brockton 3 3 3 3
Mount Auburn Hospital Cambridge 3 3 3 3
Steward Carney Hospital, Inc. Dorchester 3 3 3
Southcoast Hospitals Group, Inc. Fall River 3 3 3 3
MetroWest Medical Center Framingham 3 3 3 3
Fairview Hospital Great Barrington 3 3
Lowell General Hospital Lowell 3 3 3 3
Marlborough Hospital Marlborough 3 3 3
Anna Jaques Hospital Newburyport 3 3
Newton - Wellesley Hospital Newton Lower Falls 3 3 3 3
Cooley Dickinson Hospital Northampton 3 3 3 3
Wing Memorial Hospital and Medical Centers Palmer 3 3
Berkshire Medical Center Pittsfield 3 3 3 3
South Shore Hospital, Inc. South Weymouth 3 3 3 3
Mercy Hospital, Inc. Springfield 3 3 3 3
Baystate Mary Lane Hospital Corporation Ware 3 3
Winchester Hospital Winchester 3 3 3 3
Vhs Acquisition Subsidiary Number 7, Inc. Worcester 3 3 3 3
Michigan
St. Joseph Mercy Hospital Ann Arbor 3 3 3 3
University of Michigan Health System Ann Arbor 3 3 3 3
Battle Creek VA Medical Center Battle Creek 3
Bronson Battle Creek Hospital Battle Creek 3 3 3 3
Mecosta County Medical Center Big Rapids 3 3
Caro Center Caro 3
Chelsea Community Hospital Chelsea 3 3 3
Henry Ford Macomb Hospital Clinton Township 3 3 3 3
Community Health Center of Branch County Coldwater 3 3
Huron Valley - Sinai Hospital Commerce Township 3 3 3 3
Children’s Hospital of Michigan Detroit 3
Detroit Receiving Hospital and University Health Center Detroit 3 3 3 3
Harper University Hospital Detroit 3 3 3 3
Sinai-Grace Hospital Detroit 3 3 3 3
OSF - St. Francis Hospital and Medical Group Escanaba 3 3
MidMichigan Medical Center - Gladwin Gladwin 3

Improving America’s Hospitals: The Joint Commission’s Annual Report on Quality and Safety 201456
Hospitals by State City
The Joint Commission’s Top Performer on Key Quality Measures® for 2013The checkmark (3) indicates the measure set(s) for which the hospital or critical access hospital is being recognized.
Hea
rt A
ttac
k
Hea
rt F
ailu
re
Pne
umon
ia
Surg
ical
Car
e
Chi
ldre
n’s
Ast
hma
VT
E
Stro
ke
Hos
p-B
ased
Inp
t P
sych
Imm
uniz
atio
n
Per
inat
al C
are
Genesys Regional Medical Center Grand Blanc 3 3 3 3
Forest View Psychiatric Hospital Grand Rapids 3
Mercy Hospital Grayling Grayling 3 3 3
Spectrum Health United and Kelsey Hospitals Greenville 3 3
Beaumont Hospital, Grosse Pointe Grosse Pointe 3 3 3 3
Portage Hospital, LLC Hancock 3 3
Dickinson County Healthcare System Iron Mountain 3 3
Oscar G. Johnson VA Medical Center Iron Mountain 3
Aspirus Keweenaw Hospital Laurium 3 3
DLP Marquette General Hospital, LLC Marquette 3 3 3
Mercy Memorial Hospital System Monroe 3 3 3 3
Bronson LakeView Hospital Paw Paw 3
McLaren Northern Michigan Petoskey 3 3 3 3
St. Joseph Mercy Oakland Pontiac 3 3 3 3 3
Port Huron Hospital Port Huron 3 3 3 3
St. Joseph Mercy Port Huron Port Huron 3 3 3
Spectrum Health Reed City Hospital Reed City 3
Crittenton Hospital Medical Center Rochester 3 3 3 3
William Beaumont Hospital Royal Oak 3 3 3 3
Oakwood Hospital - Taylor Taylor 3 3 3
William Beaumont Hospital Troy 3 3 3 3
Oakwood Hospital - Wayne Wayne 3 3 3 3
Zeeland Community Hospital Zeeland 3 3
Minnesota
Mayo Clinic Health System - Albert Lea and Austin Albert Lea 3 3 3 3
Fairview Ridges Hospital Burnsville 3 3 3 3
Cambridge Medical Center Cambridge 3 3
Fairview Southdale Hospital Edina 3 3 3 3
Mayo Clinic Health System in Fairmont Fairmont 3 3
Unity Hospital Fridley 3 3 3 3
Range Regional Health Services Hibbing 3 3
Hutchinson Health Hutchinson 3 3
PrairieCare Maple Grove 3
St. John’s Hospital Maplewood 3 3 3 3
CentraCare Health - NR, LLC Monticello 3
New Ulm Medical Center New Ulm 3 3
Owatonna Hospital Owatonna 3 3
Fairview Northland Health Services Princeton 3 3
HealthEast St. Joseph’s Hospital Saint Paul 3 3 3 3
Regions Hospital Saint Paul 3 3 3 3
St. Francis Regional Medical Center Shakopee 3 3

Improving America’s Hospitals: The Joint Commission’s Annual Report on Quality and Safety 2014 57
Hospitals by State City
The Joint Commission’s Top Performer on Key Quality Measures® for 2013The checkmark (3) indicates the measure set(s) for which the hospital or critical access hospital is being recognized.
Hea
rt A
ttac
k
Hea
rt F
ailu
re
Pne
umon
ia
Surg
ical
Car
e
Chi
ldre
n’s
Ast
hma
VT
E
Stro
ke
Hos
p-B
ased
Inp
t P
sych
Imm
uniz
atio
n
Per
inat
al C
are
Lakeview Memorial Hospital Stillwater 3
Tri-County Hospital Wadena 3 3
Child and Adolescent Behavioral Health Services Willmar 3
Woodwinds Health Campus Woodbury 3 3
Fairview Lakes Medical Center Wyoming 3 3
Mississippi
Biloxi HMA, LLC Biloxi 3 3 3
Baptist Memorial Hospital - Booneville Booneville 3
Crossgates River Oaks Hospital Brandon 3 3
PHC - Cleveland, Inc. Cleveland 3 3 3
Baptist Memorial Hospital - Golden Triangle Columbus 3 3 3 3
Magnolia Regional Health Center Corinth 3 3 3 3
Brentwood Behavioral Healthcare of Mississippi, LLC Flowood 3
Garden Park Medical Center Gulfport 3 3
Wesley Health System, LLC Hattiesburg 3 3 3 3
River Oaks Hospital, LLC Jackson 3 3
VA Medical Center - G. V. (Sonny) Montgomery Jackson 3 3 3 3
Alliance Health Center, Inc. Meridian 3
Baptist Memorial Hospital - North Mississippi Oxford 3 3 3 3
Pontotoc Health Services, Inc. Pontotoc 3
River Region Medical Center Vicksburg 3 3 3 3
Missouri
Belton Regional Medical Center Belton 3 3
St. Mary’s Medical Center Blue Springs 3 3 3 3
The Skaggs Community Hospital Association Branson 3 3 3 3
SSM DePaul Health Center Bridgeton 3 3 3 3
Mercy Hospital Cassville Cassville 3
St. Luke’s Episcopal - Presbyterian Hospital Chesterfield 3 3 3 3
Saint Lukes Hospital of Chillicothe Chillicothe 3
Golden Valley Memorial Healthcare Clinton 3 3
Boone Hospital Center Columbia 3 3 3 3
SSM St. Clare Health Center Fenton 3 3 3 3
Centerpoint Medical Center of Independence, LLC Independence 3 3 3 3
SSM Regional Health Services Jefferson City 3 3 3 3
Research Medical Center Kansas City 3 3 3 3
Saint Luke’s Hospital of Kansas City Kansas City 3 3 3 3
Twin Rivers Regional Medical Center Kennett 3 3
Lee’s Summit Medical Center Lees Summit 3 3 3 3
Saint Luke’s East Hospital Lees Summit 3 3 3 3
Lafayette Regional Health Center Lexington 3
St. Francis Hospital and Health Services Maryville 3

Improving America’s Hospitals: The Joint Commission’s Annual Report on Quality and Safety 201458
Hospitals by State City
The Joint Commission’s Top Performer on Key Quality Measures® for 2013The checkmark (3) indicates the measure set(s) for which the hospital or critical access hospital is being recognized.
Hea
rt A
ttac
k
Hea
rt F
ailu
re
Pne
umon
ia
Surg
ical
Car
e
Chi
ldre
n’s
Ast
hma
VT
E
Stro
ke
Hos
p-B
ased
Inp
t P
sych
Imm
uniz
atio
n
Per
inat
al C
are
Moberly Hospital Company, LLC Moberly 3 3 3
North Kansas City Hospital North Kansas City 3 3 3 3
Progress West Hospital O Fallon 3 3 3
John J. Pershing VA Medical Center Poplar Bluff 3 3
SSM St. Mary’s Health Center Richmond Heights 3 3 3 3 3
SSM St. Joseph Health Center Saint Charles 3 3 3 3
Heartland Regional Medical Center Saint Joseph 3 3 3 3
Barnes - Jewish West County Hospital Saint Louis 3
Christian Hospital Northeast - Northwest Saint Louis 3 3 3 3
Missouri Baptist Medical Center Saint Louis 3 3 3 3
Barnes - Jewish St. Peters Hospital Saint Peters 3 3 3 3
Missouri Delta Medical Center Sikeston 3 3 3
Lakeland Hospital Acquisition Corporation Springfield 3
Royal Oaks Hospital Windsor 3
Montana
Billings Clinic Billings 3 3 3 3
St. Vincent Healthcare Billings 3 3 3 3
Holy Rosary Healthcare Miles City 3 3
Nebraska
Bellevue Medical Center Bellevue 3 3 3
Columbus Community Hospital, Inc. Columbus 3 3
Fremont Area Medical Center Fremont 3 3 3
Lincoln Regional Center Lincoln 3
Community Hospital McCook 3
Faith Regional Health Services Norfolk 3 3 3
North Platte Nebraska Hospital Corporation North Platte 3 3 3
Alegent Creighton Health - Creighton University
Medical Center Omaha 3 3 3 3
Alegent Creighton Health Lakeside Hospital Omaha 3 3 3
Nebraska Medical Center Omaha 3 3 3 3
CHI Health Midlands Papillion 3 3 3
Nevada
Carson Tahoe Regional Healthcare Carson City 3 3 3 3
Banner Churchill Community Hospital Fallon 3 3
St. Rose Dominican Hospitals - Siena Campus Henderson 3 3 3 3
Centennial Hills Hospital Medical Center Las Vegas 3 3 3 3
Red Rock Behavioral Health Hospital Las Vegas 3
SBH - Montevista Hospital Las Vegas 3
Southern Hills Medical Center, LLC Las Vegas 3 3 3 3
Spring Mountain Treatment Center Las Vegas 3
Sunrise Hospital and Medical Center Las Vegas 3 3 3 3

Improving America’s Hospitals: The Joint Commission’s Annual Report on Quality and Safety 2014 59
Hospitals by State City
The Joint Commission’s Top Performer on Key Quality Measures® for 2013The checkmark (3) indicates the measure set(s) for which the hospital or critical access hospital is being recognized.
Hea
rt A
ttac
k
Hea
rt F
ailu
re
Pne
umon
ia
Surg
ical
Car
e
Chi
ldre
n’s
Ast
hma
VT
E
Stro
ke
Hos
p-B
ased
Inp
t P
sych
Imm
uniz
atio
n
Per
inat
al C
are
Sunrise MountainView Hospital Las Vegas 3 3 3 3
Mesa View Regional Hospital Mesquite 3 3
Renown Regional Medical Center Reno 3 3 3 3 3
Renown South Meadows Medical Center Reno 3 3
VA Sierra Nevada Health Care System Reno 3 3 3 3
Northern Nevada Medical Center Sparks 3 3 3 3
New Hampshire
Valley Regional Hospital Claremont 3 3
Parkland Medical Center Derry 3 3 3 3
Hampstead Hospital Hampstead 3
Cheshire Medical Center Keene 3 3
Catholic Medical Center Manchester 3 3 3 3
St. Joseph Hospital of Nashua New Hampshire Nashua 3 3 3 3
Portsmouth Regional Hospital Portsmouth 3 3 3 3
New Jersey
Clara Maass Medical Center Belleville 3 3 3 3
Northbrook Behavioral Health Hospital Blackwood 3
Our Lady of Lourdes Medical Center Camden 3 3 3 3
The Cooper Health System Camden 3 3 3 3
CentraState Medical Center Freehold 3 3 3 3
Hackettstown Regional Medical Center Hackettstown 3 3 3 3
Hoboken University Medical Center Hoboken 3 3 3 3
Bayshore Community Hospital Holmdel 3 3 3 3
Monmouth Medical Center, Inc. Lakewood 3 3 3 3
Monmouth Medical Center Long Branch 3 3 3 3
Jersey Shore University Medical Center Neptune 3 3 3 3
Robert Wood Johnson University Hospital New Brunswick 3 3 3 3
Saint Peter’s University Hospital New Brunswick 3 3 3 3 3
St. Mary’s Hospital Passaic 3 3 3 3
Capital Health Medical Center - Hopewell Pennington 3 3 3 3
St. Luke’s Warren Hospital, Inc. Phillipsburg 3 3
Riverview Medical Center Red Bank 3 3 3 3
Valley Health System Ridgewood 3 3 3 3
The Memorial Hospital of Salem County Salem 3 3 3
Shore Memorial Hospital Somers Point 3 3 3 3
Kennedy University Hospital - Stratford Division Stratford 3 3 3 3
Ann Klein Forensic Center Trenton 3
St. Francis Medical Center Trenton 3 3 3 3
Lourdes Medical Center of Burlington County Willingboro 3 3 3 3
Inspira Medical Center Woodbury Woodbury 3 3 3 3
Christian Health Care Center Wyckoff 3

Improving America’s Hospitals: The Joint Commission’s Annual Report on Quality and Safety 201460
Hospitals by State City
The Joint Commission’s Top Performer on Key Quality Measures® for 2013The checkmark (3) indicates the measure set(s) for which the hospital or critical access hospital is being recognized.
Hea
rt A
ttac
k
Hea
rt F
ailu
re
Pne
umon
ia
Surg
ical
Car
e
Chi
ldre
n’s
Ast
hma
VT
E
Stro
ke
Hos
p-B
ased
Inp
t P
sych
Imm
uniz
atio
n
Per
inat
al C
are
New Mexico
Presbyterian Hospital Albuquerque 3 3 3 3
Carlsbad Medical Center, LLC Carlsbad 3 3 3
Las Cruces Medical Center, LLC Las Cruces 3 3 3 3
Memorial Medical Center Las Cruces 3 3 3
Roswell Hospital Corporation Roswell 3 3 3 3
Lincoln County Medical Center Ruidoso 3 3
Strategic Behavioral Health El Paso, LLC Santa Teresa 3
New York
Samuel S. Stratton VA Medical Center Albany 3 3 3
Lincoln Medical and Mental Health Center Bronx 3 3 3 3
North Central Bronx Hospital Bronx 3 3 3
Kingsboro Psychiatric Center Brooklyn 3
Kingsbrook Jewish Medical Center Brooklyn 3 3 3 3
Lutheran Medical Center Brooklyn 3 3 3 3
New York Community Hospital Brooklyn 3 3 3 3
The Brooklyn Hospital Center Brooklyn 3 3 3 3
Sisters of Charity Hospital Buffalo 3 3 3 3
F. F. Thompson Hospital Canandaigua 3 3 3 3
Putnam Hospital Center Carmel 3 3 3 3
Hudson Valley Hospital Center Cortlandt Manor 3 3 3 3
Elmira Psychiatric Center Elmira 3
Geneva General Hospital Geneva 3 3
Jamaica Hospital Medical Center (JHMC) Jamaica 3 3 3 3
United Health Services Hospitals, Inc. Johnson City 3 3 3
HealthAlliance of the Hudson Valley, Mary’s
Avenue Campus Kingston 3
Alice Hyde Medical Center Malone 3 3
Central New York Psychiatric Center Marcy 3
Massena Memorial Hospital Massena 3 3
Orange Regional Medical Center Middletown 3 3 3 3
VA Hudson Valley Health Care System Montrose 3 3
Northern Westchester Hospital Mount Kisco 3 3 3 3
Bellevue Hospital Center New York 3 3 3 3
Beth Israel Medical Center New York 3 3 3 3
Mt. Sinai St. Luke’s and Mt. Sinai Roosevelt
Hospital Center New York 3 3 3 3
New York State Psychiatric Institute New York 3
NewYork - Presbyterian Hospital New York 3 3 3 3 3
NYU Hospitals Center New York 3 3 3 3
Newark Wayne Community Hospital Newark 3 3 3
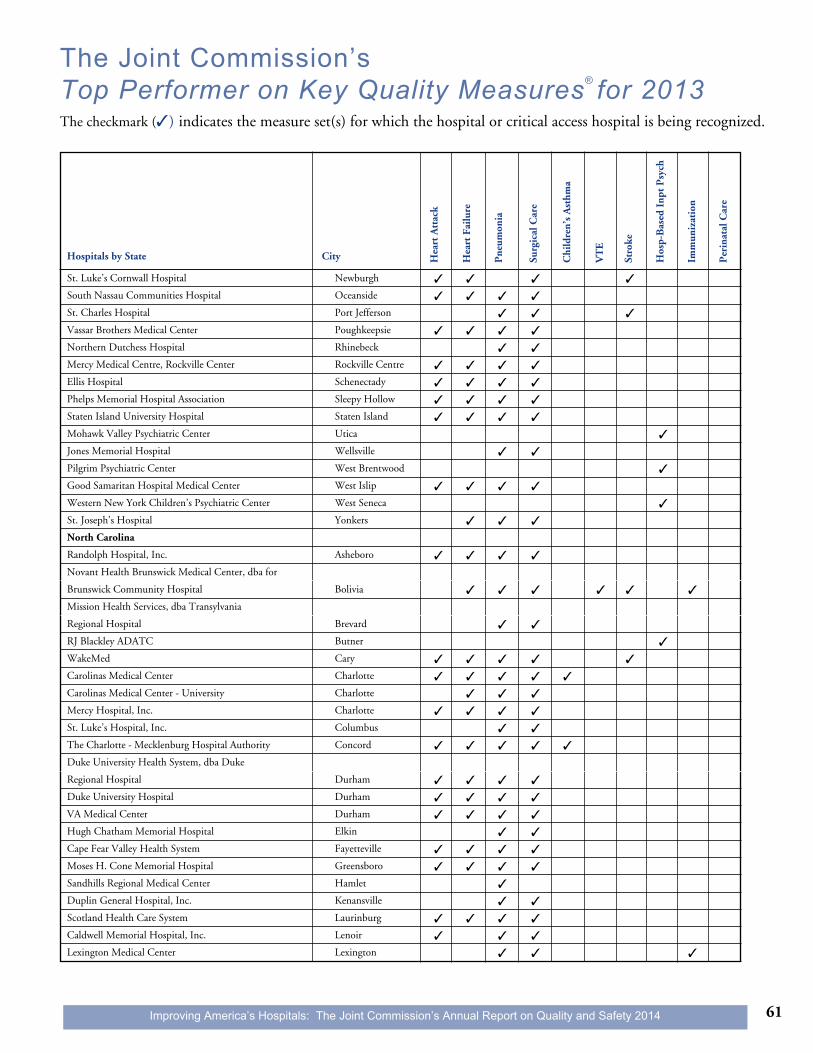
Improving America’s Hospitals: The Joint Commission’s Annual Report on Quality and Safety 2014 61
Hospitals by State City
The Joint Commission’s Top Performer on Key Quality Measures® for 2013The checkmark (3) indicates the measure set(s) for which the hospital or critical access hospital is being recognized.
Hea
rt A
ttac
k
Hea
rt F
ailu
re
Pne
umon
ia
Surg
ical
Car
e
Chi
ldre
n’s
Ast
hma
VT
E
Stro
ke
Hos
p-B
ased
Inp
t P
sych
Imm
uniz
atio
n
Per
inat
al C
are
St. Luke’s Cornwall Hospital Newburgh 3 3 3 3
South Nassau Communities Hospital Oceanside 3 3 3 3
St. Charles Hospital Port Jefferson 3 3 3
Vassar Brothers Medical Center Poughkeepsie 3 3 3 3
Northern Dutchess Hospital Rhinebeck 3 3
Mercy Medical Centre, Rockville Center Rockville Centre 3 3 3 3
Ellis Hospital Schenectady 3 3 3 3
Phelps Memorial Hospital Association Sleepy Hollow 3 3 3 3
Staten Island University Hospital Staten Island 3 3 3 3
Mohawk Valley Psychiatric Center Utica 3
Jones Memorial Hospital Wellsville 3 3
Pilgrim Psychiatric Center West Brentwood 3
Good Samaritan Hospital Medical Center West Islip 3 3 3 3
Western New York Children’s Psychiatric Center West Seneca 3
St. Joseph’s Hospital Yonkers 3 3 3
North Carolina
Randolph Hospital, Inc. Asheboro 3 3 3 3
Novant Health Brunswick Medical Center, dba for
Brunswick Community Hospital Bolivia 3 3 3 3 3 3
Mission Health Services, dba Transylvania
Regional Hospital Brevard 3 3
RJ Blackley ADATC Butner 3
WakeMed Cary 3 3 3 3 3
Carolinas Medical Center Charlotte 3 3 3 3 3
Carolinas Medical Center - University Charlotte 3 3 3
Mercy Hospital, Inc. Charlotte 3 3 3 3
St. Luke’s Hospital, Inc. Columbus 3 3
The Charlotte - Mecklenburg Hospital Authority Concord 3 3 3 3 3
Duke University Health System, dba Duke
Regional Hospital Durham 3 3 3 3
Duke University Hospital Durham 3 3 3 3
VA Medical Center Durham 3 3 3 3
Hugh Chatham Memorial Hospital Elkin 3 3
Cape Fear Valley Health System Fayetteville 3 3 3 3
Moses H. Cone Memorial Hospital Greensboro 3 3 3 3
Sandhills Regional Medical Center Hamlet 3
Duplin General Hospital, Inc. Kenansville 3 3
Scotland Health Care System Laurinburg 3 3 3 3
Caldwell Memorial Hospital, Inc. Lenoir 3 3 3
Lexington Medical Center Lexington 3 3 3

Improving America’s Hospitals: The Joint Commission’s Annual Report on Quality and Safety 201462
Hospitals by State City
The Joint Commission’s Top Performer on Key Quality Measures® for 2013The checkmark (3) indicates the measure set(s) for which the hospital or critical access hospital is being recognized.
Novant Health Franklin Medical Center,
dba for Franklin Regional Medical Center Louisburg 3 3 3 3
The McDowell Hospital, Inc. Marion 3 3 3
Carolinas Medical Center - Union Monroe 3 3 3 3
Lake Norman Regional Medical Center Mooresville 3 3 3 3
Blue Ridge HealthCare Hospitals, Inc. Morganton 3 3 3 3
Northern Hospital District of Surry County Mount Airy 3 3 3
The Outer Banks Hospital Nags Head 3 3
Duke University Health System, dba Duke
Raleigh Hospital Raleigh 3 3 3 3
Rex Hospital, Inc., dba Rex Healthcare Raleigh 3 3 3 3
Cleveland Regional Medical Center Shelby 3 3 3 3
Johnston Memorial Hospital Authority Smithfield 3 3 3 3
Davis Regional Medical Center Statesville 3 3 3 3
East Carolina Health - Heritage, Inc. Tarboro 3 3 3
Columbus Regional Healthcare System Whiteville 3 3
New Hanover Regional Medical Center Wilmington 3 3 3 3
Novant Health Medical Park Hospital, dba for
Medical Park Hospital Winston Salem 3 3 3
North Dakota
Fargo VA Health Care System Fargo 3
St. Joseph’s Hospital and Health Center Dickinson 3 3
Ohio
Samaritan Regional Health System Ashland 3 3
Ashtabula County Medical Center Ashtabula 3 3 3
O’Bleness Memorial Hospital Athens 3 3 3
University Hospitals Ahuja Medical Center Beachwood 3 3 3 3
Olgethorpe of Cambridge, LLC Cambridge 3
University Hospitals Geauga Medical Center Chardon 3 3 3 3
Christ Hospital Cincinnati 3 3 3 3
Mercy Health - Anderson Hospital, LLC Cincinnati 3 3 3 3
Berger Hospital Circleville 3 3
Lutheran Hospital Cleveland 3 3
The MetroHealth System Cleveland 3 3 3 3
UH Regional Hospitals Cleveland 3 3 3 3
Mercer County Joint Township Community Hospital Coldwater 3 3
Doctors Hospital Columbus 3 3 3 3
Grant Medical Center Columbus 3 3 3 3
Ohio Hospital for Psychiatry Columbus 3
Riverside Methodist Hospital Columbus 3 3 3 3
The Ohio State University Hospital Columbus 3 3 3 3
University Hospital Conneaut Medical Center Conneaut 3 3
Per
inat
al C
are
Imm
uniz
atio
n
Hos
p-B
ased
Inp
t P
sych
Stro
ke
VT
E
Chi
ldre
n’s
Ast
hma
Surg
ical
Car
e
Pne
umon
ia
Hea
rt F
ailu
re
Hea
rt A
ttac
k

Improving America’s Hospitals: The Joint Commission’s Annual Report on Quality and Safety 2014 63
Hospitals by State City
The Joint Commission’s Top Performer on Key Quality Measures® for 2013The checkmark (3) indicates the measure set(s) for which the hospital or critical access hospital is being recognized.
Hea
rt A
ttac
k
Hea
rt F
ailu
re
Pne
umon
ia
Surg
ical
Car
e
Chi
ldre
n’s
Ast
hma
VT
E
Stro
ke
Hos
p-B
ased
Inp
t P
sych
Imm
uniz
atio
n
Per
inat
al C
are
Good Samaritan Hospital Dayton 3 3 3 3
Miami Valley Hospital (Main Site), Dayton Dayton 3 3 3 3
Mercy Health - Defiance Hospital, LLC Defiance 3 3
Dublin Methodist Hospital Dublin 3 3
East Liverpool City Hospital East Liverpool 3 3 3
Mercy Health - Fairfield Hospital, LLC Fairfield 3 3 3 3
Blanchard Valley Health System Findlay 3 3 3 3 3 3
University Hospitals Geneva Medical Center Geneva 3 3
Southwest Healthcare of Brown County Ohio, LLC Georgetown 3 3
Marion General Hospital, Inc. Marion 3 3 3 3
Craig and Frances Lindner Center of HOPE Mason 3
Arrowhead Behavioral Health Maumee 3
Southwest General Health Center Middleburg Heights 3 3 3 3
Atrium Medical Center Middletown 3 3 3 3 3
Joel Pomerene Memorial Hospital Millersburg 3 3
Licking Memorial Hospital Newark 3 3 3 3
Southern Ohio Medical Center Portsmouth 3 3 3 3
South Pointe Hospital Warrensville Heights 3 3 3
St. Ann’s Hospital of Columbus, Inc. Westerville 3 3 3 3
RCHP - Wilmington Wilmington 3 3
Belmont Pines Hospital Youngstown 3
Northside Medical Center Youngstown 3 3 3 3
The Surgery Center at Southwoods, LLC Youngstown 3
Oklahoma
Blackwell HMA, LLC Blackwell 3
PHS Comprehensive Indian Health Facility Claremore 3
Clinton HMA, LLC Clinton 3
Duncan Regional Hospital, Inc. Duncan 3 3 3
St. Mary’s Regional Medical Center Enid 3 3 3
Deaconess Hospital Oklahoma City 3 3 3 3
Mercy Hospital Oklahoma City Oklahoma City 3 3
St. Anthony Hospital Oklahoma City 3 3 3 3
St. Anthony Shawnee Hospital Shawnee 3 3 3 3
Shadow Mountain Behavioral Health Tulsa 3
Woodward Regional Hospital Woodward 3 3
Oregon
Kaiser Sunnyside Medical Center Clackamas 3 3 3 3
Willamette Valley Medical Center McMinnville 3 3
Providence Milwaukie Hospital Milwaukie 3 3 3
Providence Health & Services Oregon Newberg 3 3
Saint Alphonsus Medical Center - Ontario Ontario 3 3

Improving America’s Hospitals: The Joint Commission’s Annual Report on Quality and Safety 201464
Hospitals by State City
The Joint Commission’s Top Performer on Key Quality Measures® for 2013The checkmark (3) indicates the measure set(s) for which the hospital or critical access hospital is being recognized.
Hea
rt A
ttac
k
Hea
rt F
ailu
re
Pne
umon
ia
Surg
ical
Car
e
Chi
ldre
n’s
Ast
hma
VT
E
Stro
ke
Hos
p-B
ased
Inp
t P
sych
Imm
uniz
atio
n
Per
inat
al C
are
OHSU Hospitals and Clinics Portland 3 3 3 3
Portland Adventist Medical Center Portland 3 3 3 3
McKenzie - Willamette Regional Medical Center
Associates, LLC Springfield 3 3 3 3
Northwest Medical Foundation of Tillamook Tillamook 3 3
Legacy Meridian Park Medical Center Tualatin 3 3 3 3
Pennsylvania
Abington Memorial Hospital Abington 3 3 3 3
Sacred Heart Hospital Allentown 3 3 3
VA Medical Center - James E. Van Zandt Altoona 3 3
Lehigh Valley Hospital - Muhlenberg Bethlehem 3 3 3 3
St. Luke’s Hospital Bethlehem 3 3 3 3
Holy Spirit Hospital Camp Hill 3 3 3 3
Carlisle Regional Medical Center Carlisle 3 3
The Meadows Psychiatric Center Centre Hall 3
St. Luke’s Hospital - Miners Campus Coaldale 3 3
Coatesville Hospital Corporation Coatesville 3 3 3 3
Charles Cole Memorial Hospital Coudersport 3 3
Mercy Fitzgerald Hospital Darby 3 3 3 3 3
Delaware County Memorial Hospital Drexel Hill 3 3 3 3
Northampton Hospital Company, LLC Easton 3 3 3 3
Ephrata Community Hospital Ephrata 3 3 3
Pinnacle Health Hospitals Harrisburg 3 3 3 3
Penn State Hershey Medical Center Hershey 3 3 3 3
First Hospital Kingston 3
St. Mary Medical Center Langhorne 3 3 3 3
The Good Samaritan Hospital Lebanon 3 3 3 3
Heart of Lancaster Regional Medical Center Lititz 3 3
Lock Haven Hospital and Haven Skilled Rehab
& Nursing Lock Haven 3
UPMC McKeesport McKeesport 3 3 3 3
Riddle Memorial Hospital Media 3 3 3 3
Monongahela Valley Hospital Monongahela 3 3 3 3
Alle - Kiski Medical Center Natrona Heights 3 3 3 3
Mercy Suburban Hospital Norristown 3 3 3
Main Line Hospital Paoli Paoli 3 3 3 3
Friends Behavioral Health System, LP Philadelphia 3
Hahnemann University Hospital Philadelphia 3 3 3 3 3
Nazareth Hospital Philadelphia 3 3 3 3
Presbyterian Medical Center of the UPHS Philadelphia 3 3 3 3
St. Christopher’s Hospital for Children Philadelphia 3
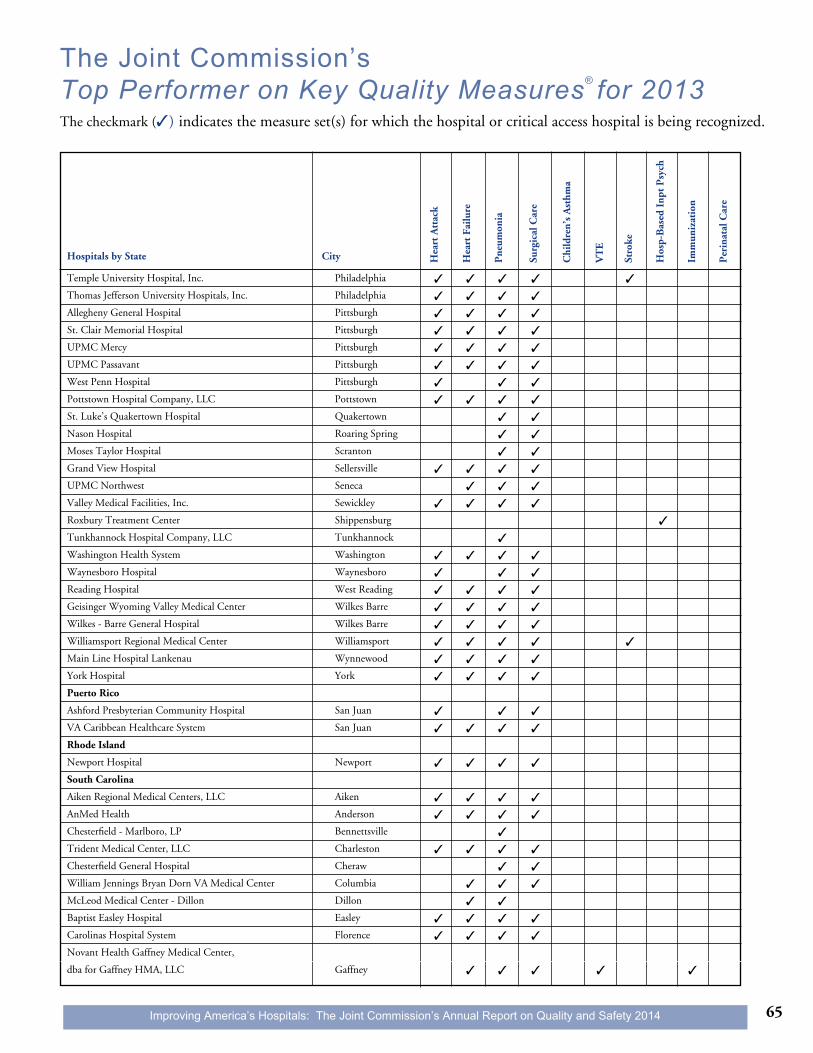
Improving America’s Hospitals: The Joint Commission’s Annual Report on Quality and Safety 2014 65
Hospitals by State City
The Joint Commission’s Top Performer on Key Quality Measures® for 2013The checkmark (3) indicates the measure set(s) for which the hospital or critical access hospital is being recognized.
Hea
rt A
ttac
k
Hea
rt F
ailu
re
Pne
umon
ia
Surg
ical
Car
e
Chi
ldre
n’s
Ast
hma
VT
E
Stro
ke
Hos
p-B
ased
Inp
t P
sych
Imm
uniz
atio
n
Per
inat
al C
are
Temple University Hospital, Inc. Philadelphia 3 3 3 3 3
Thomas Jefferson University Hospitals, Inc. Philadelphia 3 3 3 3
Allegheny General Hospital Pittsburgh 3 3 3 3
St. Clair Memorial Hospital Pittsburgh 3 3 3 3
UPMC Mercy Pittsburgh 3 3 3 3
UPMC Passavant Pittsburgh 3 3 3 3
West Penn Hospital Pittsburgh 3 3 3
Pottstown Hospital Company, LLC Pottstown 3 3 3 3
St. Luke’s Quakertown Hospital Quakertown 3 3
Nason Hospital Roaring Spring 3 3
Moses Taylor Hospital Scranton 3 3
Grand View Hospital Sellersville 3 3 3 3
UPMC Northwest Seneca 3 3 3
Valley Medical Facilities, Inc. Sewickley 3 3 3 3
Roxbury Treatment Center Shippensburg 3
Tunkhannock Hospital Company, LLC Tunkhannock 3
Washington Health System Washington 3 3 3 3
Waynesboro Hospital Waynesboro 3 3 3
Reading Hospital West Reading 3 3 3 3
Geisinger Wyoming Valley Medical Center Wilkes Barre 3 3 3 3
Wilkes - Barre General Hospital Wilkes Barre 3 3 3 3
Williamsport Regional Medical Center Williamsport 3 3 3 3 3
Main Line Hospital Lankenau Wynnewood 3 3 3 3
York Hospital York 3 3 3 3
Puerto Rico
Ashford Presbyterian Community Hospital San Juan 3 3 3
VA Caribbean Healthcare System San Juan 3 3 3 3
Rhode Island
Newport Hospital Newport 3 3 3 3
South Carolina
Aiken Regional Medical Centers, LLC Aiken 3 3 3 3
AnMed Health Anderson 3 3 3 3
Chesterfield - Marlboro, LP Bennettsville 3
Trident Medical Center, LLC Charleston 3 3 3 3
Chesterfield General Hospital Cheraw 3 3
William Jennings Bryan Dorn VA Medical Center Columbia 3 3 3
McLeod Medical Center - Dillon Dillon 3 3
Baptist Easley Hospital Easley 3 3 3 3
Carolinas Hospital System Florence 3 3 3 3
Novant Health Gaffney Medical Center,
dba for Gaffney HMA, LLC Gaffney 3 3 3 3 3

Improving America’s Hospitals: The Joint Commission’s Annual Report on Quality and Safety 201466
Hospitals by State City
The Joint Commission’s Top Performer on Key Quality Measures® for 2013The checkmark (3) indicates the measure set(s) for which the hospital or critical access hospital is being recognized.
Hea
rt A
ttac
k
Hea
rt F
ailu
re
Pne
umon
ia
Surg
ical
Car
e
Chi
ldre
n’s
Ast
hma
VT
E
Stro
ke
Hos
p-B
ased
Inp
t P
sych
Imm
uniz
atio
n
Per
inat
al C
are
GHS Patewood Memorial Hospital Greenville 3
Greenville Hospital System University Medical Center Greenville 3 3 3
St. Francis Hospital, Inc. Greenville 3 3 3
GHS Greer Memorial Hospital Greer 3
UHS of Greenville, LLC Greer 3
Springs Memorial Hospital Lancaster 3 3 3 3
Grand Strand Medical Center, LLC Myrtle Beach 3 3 3 3
Newberry County Memorial Hospital Newberry 3 3
Mary Black Health System, LLC Spartanburg 3 3
Colleton Medical Center Walterboro 3 3 3
South Dakota
VA Black Hills Health Care System - Fort Meade -
Hot Springs Fort Meade 3
Avera Queen of Peace Mitchell 3 3
Avera St. Mary’s Hospital Pierre 3 3
Avera Sacred Heart Hospital Yankton 3 3
Tennessee
Western Mental Health Institute Bolivar 3
Wellmont Bristol Regional Medical Center Bristol 3 3 3 3
Riverview Medical Center, LLC Carthage 3
Clarksville Health System, GP Clarksville 3 3 3 3
Cleveland Tennessee Hospital Company, LLC Cleveland 3 3 3 3
Tristar Horizon Medical Center Dickson 3 3 3 3
Dyersburg Hospital Corporation Dyersburg 3 3
Laughlin Memorial Hospital, Inc. Greeneville 3 3 3 3
Roane Medical Center Harriman 3 3
TriStar Hendersonville Medical Center Hendersonville 3 3 3 3
TriStar Summit Medical Center Hermitage 3 3 3 3
Baptist Memorial Hospital Huntingdon Huntingdon 3
Jackson, Tennessee Hospital Company, LLC Jackson 3 3 3 3
Jefferson County HMA, LLC Jefferson City 3
Wellmont Holston Valley Medical Center Kingsport 3 3 3 3
Fort Sanders Regional Medical Center Knoxville 3 3 3 3
Parkwest Medical Center Knoxville 3 3 3 3
Tennova Lafollette Medical Center La Follette 3
Fort Loudoun Medical Center Lenoir City 3 3
Lexington Hospital Corporation Lexington 3
Livingston Regional Hospital, LLC Livingston 3 3
Blount Memorial Hospital, Inc. Maryville 3 3 3 3 3
McKenzie Tennessee Hospital Company, LLC Mc Kenzie 3 3
Lakeside Behavioral Health System, LLC Memphis 3

Improving America’s Hospitals: The Joint Commission’s Annual Report on Quality and Safety 2014 67
Hospitals by State City
The Joint Commission’s Top Performer on Key Quality Measures® for 2013The checkmark (3) indicates the measure set(s) for which the hospital or critical access hospital is being recognized.
Hea
rt A
ttac
k
Hea
rt F
ailu
re
Pne
umon
ia
Surg
ical
Car
e
Chi
ldre
n’s
Ast
hma
VT
E
Stro
ke
Hos
p-B
ased
Inp
t P
sych
Imm
uniz
atio
n
Per
inat
al C
are
Milan General Hospital Milan 3
Morristown - Hamblen Hospital Association Morristown 3 3 3 3
Middle Tennessee Mental Health Institute Nashville 3
Southern Hills Medical Center Nashville 3 3 3 3
TriStar Centennial Medical Center Nashville 3 3 3 3
TriStar Skyline Medical Center Nashville 3 3 3 3
Methodist Medical Center of Oak Ridge Oak Ridge 3 3 3 3
Henry County Medical Center Paris 3 3
Hillside Hospital, LLC Pulaski 3
McNairy Regional Hospital Selmer 3
Shelbyville Hospital Corporation Shelbyville 3 3
StoneCrest Medical Center Smyrna 3 3 3 3
NorthCrest Medical Center Springfield 3 3 3 3
Baptist Memorial Hospital - Union City Union City 3 3 3
Texas
Texas Health Presbyterian Hospital - Allen Allen 3 3
Northwest Texas Healthcare System, Inc. Amarillo 3 3 3 3
Arlington Orthopedic and Spine Hospital, LLC Arlington 3
Medical Center Arlington Arlington 3 3 3 3
Millwood Hospital, LP Arlington 3
SAS Healthcare, Inc. Arlington 3
Texas Health Heart & Vascular Hospital Arlington Arlington 3 3 3
Dell Children’s Medical Center of Central Texas Austin 3
Seton Northwest Hospital Austin 3 3
St. David’s Medical Center Austin 3 3 3 3
St. David’s North Austin Medical Center Austin 3 3 3 3
St. David’s South Austin Medical Center Austin 3 3 3 3
University Medical Center Brackenridge Austin 3 3 3 3
Texas Health Harris Methodist Hospital - Azle Azle 3
Scott & White Hospital -Brenham Brenham 3 3
Valley Regional Medical Center Brownsville 3 3 3 3
Seton Highland Lakes Hospital Burnet 3 3
Baylor Medical Center at Carrollton Carrollton 3 3 3 3
Texas Health Harris Methodist Hospital - Cleburne Cleburne 3 3 3
College Station Medical Center College Station 3 3 3 3
Conroe Regional Medical Center Conroe 3 3 3 3
Montgomery County Mental Health Treatment Facility Conroe 3
Corpus Christi Medical Center (Bay Area)
Healthcare Group, LTD Corpus Christi 3 3 3 3
Baylor Heart and Vascular Center, LLP Dallas 3 3 3
Baylor University Medical Center (BUMC) Dallas 3 3 3 3
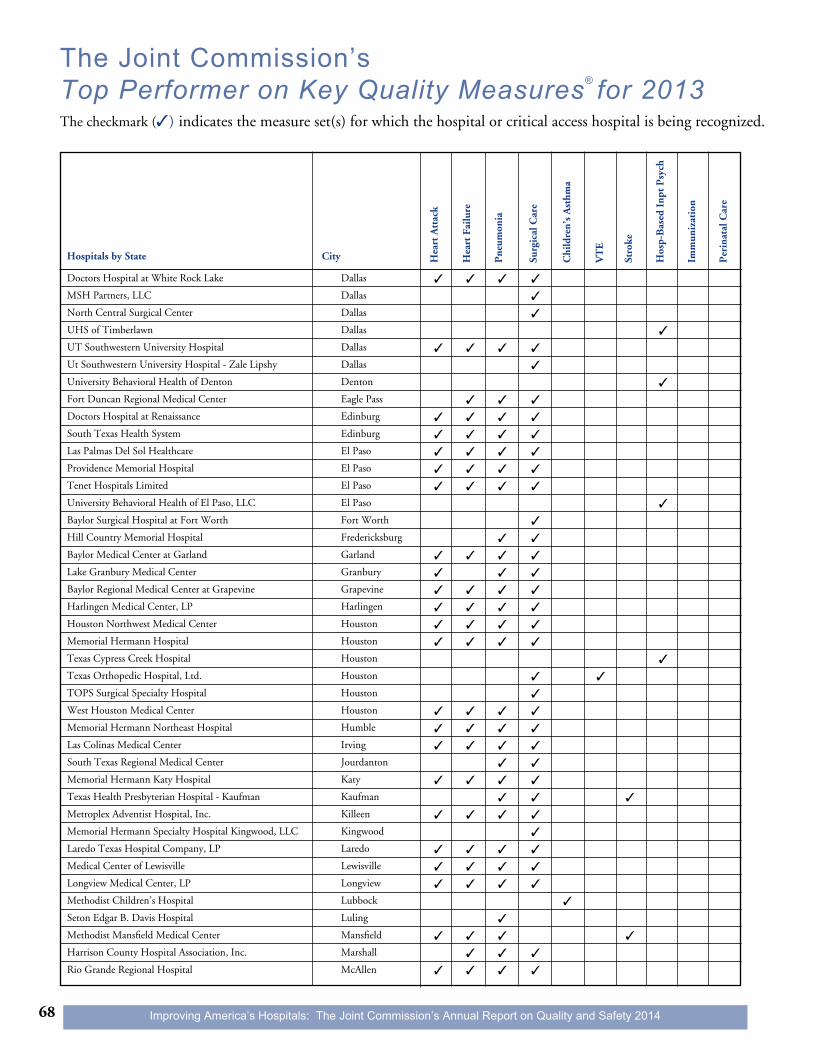
Improving America’s Hospitals: The Joint Commission’s Annual Report on Quality and Safety 201468
Hospitals by State City
The Joint Commission’s Top Performer on Key Quality Measures® for 2013The checkmark (3) indicates the measure set(s) for which the hospital or critical access hospital is being recognized.
Hea
rt A
ttac
k
Hea
rt F
ailu
re
Pne
umon
ia
Surg
ical
Car
e
Chi
ldre
n’s
Ast
hma
VT
E
Stro
ke
Hos
p-B
ased
Inp
t P
sych
Imm
uniz
atio
n
Per
inat
al C
are
Doctors Hospital at White Rock Lake Dallas 3 3 3 3
MSH Partners, LLC Dallas 3
North Central Surgical Center Dallas 3
UHS of Timberlawn Dallas 3
UT Southwestern University Hospital Dallas 3 3 3 3
Ut Southwestern University Hospital - Zale Lipshy Dallas 3
University Behavioral Health of Denton Denton 3
Fort Duncan Regional Medical Center Eagle Pass 3 3 3
Doctors Hospital at Renaissance Edinburg 3 3 3 3
South Texas Health System Edinburg 3 3 3 3
Las Palmas Del Sol Healthcare El Paso 3 3 3 3
Providence Memorial Hospital El Paso 3 3 3 3
Tenet Hospitals Limited El Paso 3 3 3 3
University Behavioral Health of El Paso, LLC El Paso 3
Baylor Surgical Hospital at Fort Worth Fort Worth 3
Hill Country Memorial Hospital Fredericksburg 3 3
Baylor Medical Center at Garland Garland 3 3 3 3
Lake Granbury Medical Center Granbury 3 3 3
Baylor Regional Medical Center at Grapevine Grapevine 3 3 3 3
Harlingen Medical Center, LP Harlingen 3 3 3 3
Houston Northwest Medical Center Houston 3 3 3 3
Memorial Hermann Hospital Houston 3 3 3 3
Texas Cypress Creek Hospital Houston 3
Texas Orthopedic Hospital, Ltd. Houston 3 3
TOPS Surgical Specialty Hospital Houston 3
West Houston Medical Center Houston 3 3 3 3
Memorial Hermann Northeast Hospital Humble 3 3 3 3
Las Colinas Medical Center Irving 3 3 3 3
South Texas Regional Medical Center Jourdanton 3 3
Memorial Hermann Katy Hospital Katy 3 3 3 3
Texas Health Presbyterian Hospital - Kaufman Kaufman 3 3 3
Metroplex Adventist Hospital, Inc. Killeen 3 3 3 3
Memorial Hermann Specialty Hospital Kingwood, LLC Kingwood 3
Laredo Texas Hospital Company, LP Laredo 3 3 3 3
Medical Center of Lewisville Lewisville 3 3 3 3
Longview Medical Center, LP Longview 3 3 3 3
Methodist Children’s Hospital Lubbock 3
Seton Edgar B. Davis Hospital Luling 3
Methodist Mansfield Medical Center Mansfield 3 3 3 3
Harrison County Hospital Association, Inc. Marshall 3 3 3
Rio Grande Regional Hospital McAllen 3 3 3 3

Improving America’s Hospitals: The Joint Commission’s Annual Report on Quality and Safety 2014 69
Hospitals by State City
The Joint Commission’s Top Performer on Key Quality Measures® for 2013The checkmark (3) indicates the measure set(s) for which the hospital or critical access hospital is being recognized.
Hea
rt A
ttac
k
Hea
rt F
ailu
re
Pne
umon
ia
Surg
ical
Car
e
Chi
ldre
n’s
Ast
hma
VT
E
Stro
ke
Hos
p-B
ased
Inp
t P
sych
Imm
uniz
atio
n
Per
inat
al C
are
Baylor Medical Centers at Garland and McKinney McKinney 3 3 3 3
Medical Center of McKinney McKinney 3 3 3 3
Dallas Regional Medical Center Mesquite 3 3 3 3
North Hills Hospital Subsidiary, LP North Richland Hills 3 3 3 3
Pampa Regional Medical Center Pampa 3 3
Bayshore Medical Center Pasadena 3 3 3 3
Baylor Regional Medical Center at Plano Plano 3 3
Texas Heart Hospital of the Southwest Plano 3 3 3
The Medical Center of Plano Plano 3 3 3 3
Methodist Richardson Medical Center Richardson 3 3 3 3
St. David’s Round Rock Medical Center Round Rock 3 3 3 3
Lake Pointe Medical Center Rowlett 3 3 3 3
San Angelo Community Medical Center San Angelo 3 3 3
Shannon Medical Center San Angelo 3 3 3 3
Methodist Ambulatory Surgery Hospital - Northwest San Antonio 3 3 3
Methodist Hospital San Antonio 3 3 3 3 3
Methodist Stone Oak Hospital San Antonio 3 3 3 3
Texas Laurel Ridge Hospital, LP San Antonio 3
Central Texas Medical Center San Marcos 3 3
Texas Health Harris Methodist Hospital Stephenville Stephenville 3 3
Memorial Hermann Sugar Land Hospital Sugar Land 3 3 3 3
Memorial Hermann Sugar Land Surgical Hospital Sugar Land 3
Rolling Plains Memorial Hospital Sweetwater 3
CHRISTUS Health, Ark - La - Tex Texarkana 3 3 3 3
East Texas Medical Center - Tyler Tyler 3 3 3 3
DeTar Healthcare System Victoria 3 3 3 3
Baylor Medical Center at Waxahachie Waxahachie 3 3 3
Weatherford Regional Medical Center Weatherford 3 3 3
Knapp Medical Center Weslaco 3 3 3 3
Kell West Regional Hospital, LLC Wichita Falls 3
Utah
American Fork Hospital American Fork 3 3
Lakeview Hospital Bountiful 3 3 3
Brigham City Community Hospital Brigham City 3
IHC Health Services, Inc. Cedar City 3 3
Logan Regional Hospital Logan 3 3
Intermountain Medical Center Murray 3 3 3
The Orthopedic Specialty Hospital Murray 3
Orem Community Hospital Orem 3
Timpanogos Regional Hospital Orem 3 3 3
Intermountain Park City Medical Center Park City 3 3

Improving America’s Hospitals: The Joint Commission’s Annual Report on Quality and Safety 201470
Hospitals by State City
The Joint Commission’s Top Performer on Key Quality Measures® for 2013The checkmark (3) indicates the measure set(s) for which the hospital or critical access hospital is being recognized.
Hea
rt A
ttac
k
Hea
rt F
ailu
re
Pne
umon
ia
Surg
ical
Car
e
Chi
ldre
n’s
Ast
hma
VT
E
Stro
ke
Hos
p-B
ased
Inp
t P
sych
Imm
uniz
atio
n
Per
inat
al C
are
Mountain View Hospital Payson 3 3 3
Utah Valley Regional Medical Center Provo 3 3 3 3
IHC Health Services, Inc. Richfield 3 3
Riverton Hospital Riverton 3 3
LDS Hospital Salt Lake City 3 3
St. Mark’s Hospital Salt Lake City 3 3 3 3
Alta View Hospital Sandy 3 3
Mountain West Medical Center Tooele 3 3
Vermont
Rutland Regional Medical Center Rutland 3 3 3
Northwestern Medical Center, Inc. Saint Albans 3
Virginia
Inova Alexandria Hospital Alexandria 3 3 3 3
Virginia Hospital Center Arlington 3 3 3 3
Bedford Memorial Hospital Bedford 3
LewisGale Hospital Montgomery Blacksburg 3 3 3 3
Commonwealth of Virginia, Piedmont Geriatric Hospital Burkeville 3
Catawba Hospital Catawba 3
Emporia Hospital Corporation Emporia 3 3 3
Dominion Hospital Falls Church 3
Spotsylvania Regional Medical Center Fredericksburg 3 3 3 3
Warren Memorial Hospital Front Royal 3 3
Riverside Walter Reed Hospital Gloucester 3 3 3 3
Buchanan General Hospital Grundy 3
Riverside Behavioral Health Center Hampton 3
John Randolph Medical Center Hopewell 3 3 3 3
LewisGale Hospital Alleghany Low Moor 3 3
Riverside Shore Memorial Hospital Nassawadox 3 3 3 3
Mary Immaculate Hospital, Inc. Newport News 3 3 3 3
Riverside Regional Medical Center Newport News 3 3 3 3
Poplar Springs Hospital Petersburg 3
Pulaski Community Hospital, Inc. Pulaski 3 3 3
Reston Hospital Center, LLC Reston 3 3 3 3
Clinch Valley Medical Center Richlands 3 3 3
Bon Secours - St. Mary’s Hospital Richmond 3 3 3 3
Bon Secours Richmond Community Hospital Richmond 3
CJW Medical Center Richmond 3 3 3 3
Henrico Doctors’ Hospital Richmond 3 3 3 3
Carilion Medical Center Roanoke 3 3 3 3
LewisGale Medical Center, LLC Salem 3 3 3 3
Community Memorial Healthcenter South Hill 3 3 3

Improving America’s Hospitals: The Joint Commission’s Annual Report on Quality and Safety 2014 71
Hospitals by State City
The Joint Commission’s Top Performer on Key Quality Measures® for 2013The checkmark (3) indicates the measure set(s) for which the hospital or critical access hospital is being recognized.
Hea
rt A
ttac
k
Hea
rt F
ailu
re
Pne
umon
ia
Surg
ical
Car
e
Chi
ldre
n’s
Ast
hma
VT
E
Stro
ke
Hos
p-B
ased
Inp
t P
sych
Imm
uniz
atio
n
Per
inat
al C
are
Riverside Tappahannock Hospital Tappahannock 3 3
Carilion Tazewell Community Hospital Tazewell 3
Eastern State Hospital Williamsburg 3
Wythe County Community Hospital, LLC Wytheville 3 3
Washington
Overlake Hospital Medical Center Bellevue 3 3 3 3
Highline Medical Center Burien 3 3 3 3 3
Providence Centralia Hospital Centralia 3 3 3 3
Tri-State Memorial Hospital Clarkston 3 3
Providence Regional Medical Center Everett 3 3 3 3
Kadlec Regional Medical Center Richland 3 3 3 3
Navos Seattle 3
Swedish Medical Center Seattle 3 3 3
University of Washington Medical Center Seattle 3 3 3 3
UW Medicine/Northwest Seattle 3 3 3 3
VA Medical Center Spokane 3
Spokane Valley Washington Hospital Company, LLC Spokane Valley 3 3
Toppenish Community Hospital Toppenish 3
Providence St. Mary Medical Center Walla Walla 3 3 3
Walla Walla General Hospital Walla Walla 3 3 3
Central Washington Health Services Association Wenatchee 3 3 3 3
Yakima Valley Memorial Hospital Yakima 3 3 3 3
West Virginia
United Hospital Center Bridgeport 3 3 3 3
Fairmont General Hospital, Inc. Fairmont 3 3 3 3
Cabell Huntington Hospital, Inc. Huntington 3 3 3 3
River Park Hospital Huntington 3
Wetzel County Hospital New Martinsville 3
Oak Hill Hospital Corporation Oak Hill 3 3
Pleasant Valley Hospital Point Pleasant 3 3
Jefferson Memorial Hospital Ranson 3
Community Health Association Ripley 3 3 3
Stonewall Jackson Memorial Hospital Company Weston 3 3
Ohio Valley Medical Center Wheeling 3 3
Wisconsin
Langlade Hospital Antigo 3 3
St. Elizabeth Hospital Appleton 3 3 3 3 3
St. Clare Hospital Baraboo 3 3
Aurora Health Care Southern Lakes, Inc. Burlington 3 3 3
St. Joseph’s Hospital Chippewa Falls 3 3
Aurora Health Care Southern Lakes, Inc. Elkhorn 3 3

Improving America’s Hospitals: The Joint Commission’s Annual Report on Quality and Safety 201472
The checkmark (3) indicates the measure set(s) for which the hospital or critical access hospital is being recognized.
The Joint Commission’s Top Performer on Key Quality Measures® for 2013
St. Agnes Hospital Fond Du Lac 3 3 3 3
Aurora BayCare Medical Center Green Bay 3 3 3
St. Mary’s Hospital Medical Center Green Bay 3 3
Aurora Medical Center of Washington County Hartford 3 3
Hudson Hospital & Clinics Hudson 3
Mercy Health System Corporation Janesville 3 3 3 3
Aurora Health Care Southern Lakes, Inc. Kenosha 3 3
William S. Middleton Memorial Veterans Hospital Madison 3 3 3 3
Holy Family Memorial, Inc. Manitowoc 3 3 3
Community Memorial Hospital of Menomonee Falls, Inc. Menomonee Falls 3 3 3 3
Aurora Health Care Metro, Inc. Milwaukee 3 3 3 3
Columbia St. Mary’s Hospital Milwaukee, Inc. Milwaukee 3 3 3 3
The Monroe Clinic, Inc. Monroe 3 3 3
Oconomowoc Memorial Hospital Oconomowoc 3 3 3
Aurora Medical Center of Oshkosh Oshkosh 3 3 3
Divine Savior Healthcare, Inc. Portage 3 3
Prairie du Chien Memorial Hospital Association, Inc. Prairie Du Chien 3 3
Wheaton Franciscan Healthcare - All Saints, Inc. Racine 3 3 3 3
Sacred Heart - St. Mary’s Hospitals Rhinelander 3 3
Lakeview Medical Center Rice Lake 3 3
River Falls Area Hospital River Falls 3
Aurora Health Care Central, Inc. Sheboygan 3 3 3
Aurora Health Care Southern Lakes, Inc. Summit 3 3 3
Waukesha Memorial Hospital, Inc. Waukesha 3 3 3 3
Waupun Memorial Hospital Waupun 3 3
Aurora West Allis Medical Center West Allis 3 3 3
Howard Young Medical Center, Inc. Woodruff 3 3
Wyoming
Wyoming Medical Center Casper 3 3 3 3
Memorial Hospital of Laramie County Cheyenne 3 3 3 3
Evanston Regional Hospital Evanston 3
St. John’s Medical Center Jackson 3 3 3
Per
inat
al C
are
Imm
uniz
atio
n
Hos
p-B
ased
Inp
t P
sych
Stro
ke
VT
E
Chi
ldre
n’s
Ast
hma
Surg
ical
Car
e
Pne
umon
ia
Hea
rt F
ailu
re
Hospitals by State City Hea
rt A
ttac
k
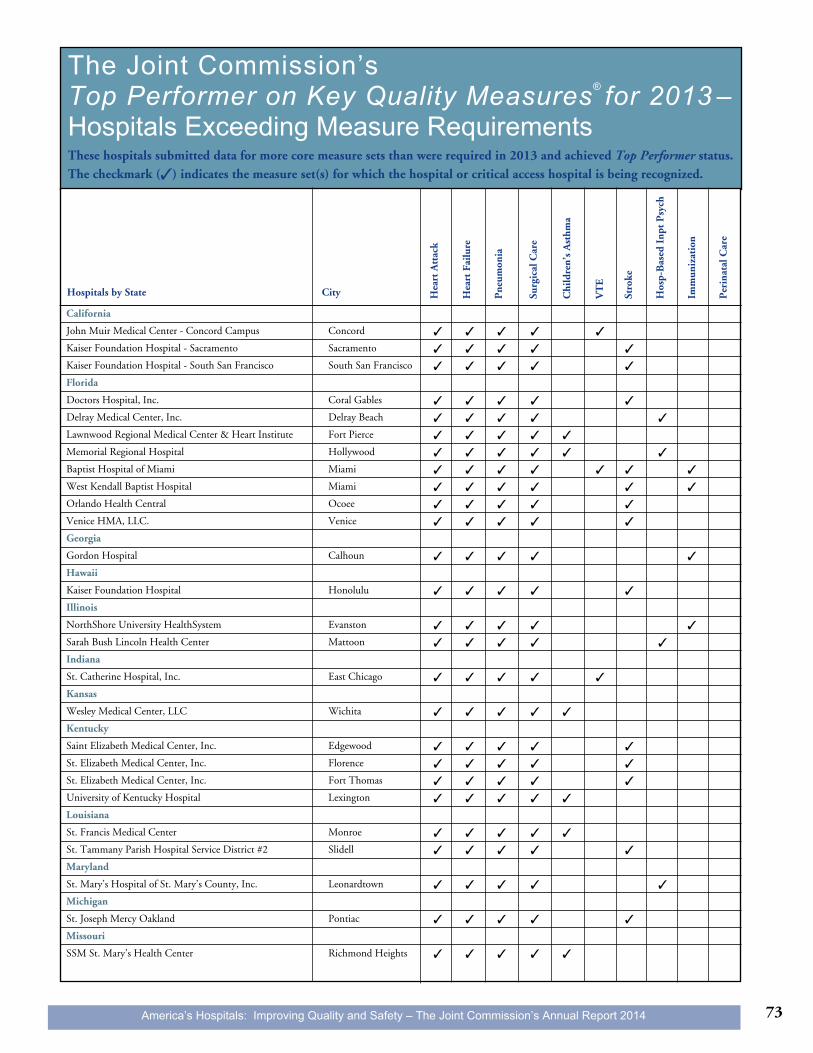
73America’s Hospitals: Improving Quality and Safety – The Joint Commission’s Annual Report 2014
Hospitals by State City Hea
rt A
ttac
k
Hea
rt F
ailu
re
Pne
umon
ia
Surg
ical
Car
e
Chi
ldre
n’s
Ast
hma
VT
E
Stro
ke
Hos
p-B
ased
Inp
t P
sych
Imm
uniz
atio
n
Per
inat
al C
are
California
John Muir Medical Center - Concord Campus Concord 3 3 3 3 3
Kaiser Foundation Hospital - Sacramento Sacramento 3 3 3 3 3
Kaiser Foundation Hospital - South San Francisco South San Francisco 3 3 3 3 3
Florida
Doctors Hospital, Inc. Coral Gables 3 3 3 3 3
Delray Medical Center, Inc. Delray Beach 3 3 3 3 3
Lawnwood Regional Medical Center & Heart Institute Fort Pierce 3 3 3 3 3
Memorial Regional Hospital Hollywood 3 3 3 3 3 3
Baptist Hospital of Miami Miami 3 3 3 3 3 3 3
West Kendall Baptist Hospital Miami 3 3 3 3 3 3
Orlando Health Central Ocoee 3 3 3 3 3
Venice HMA, LLC. Venice 3 3 3 3 3
Georgia
Gordon Hospital Calhoun 3 3 3 3 3
Hawaii
Kaiser Foundation Hospital Honolulu 3 3 3 3 3
Illinois
NorthShore University HealthSystem Evanston 3 3 3 3 3
Sarah Bush Lincoln Health Center Mattoon 3 3 3 3 3
Indiana
St. Catherine Hospital, Inc. East Chicago 3 3 3 3 3
Kansas
Wesley Medical Center, LLC Wichita 3 3 3 3 3
Kentucky
Saint Elizabeth Medical Center, Inc. Edgewood 3 3 3 3 3
St. Elizabeth Medical Center, Inc. Florence 3 3 3 3 3
St. Elizabeth Medical Center, Inc. Fort Thomas 3 3 3 3 3
University of Kentucky Hospital Lexington 3 3 3 3 3
Louisiana
St. Francis Medical Center Monroe 3 3 3 3 3
St. Tammany Parish Hospital Service District #2 Slidell 3 3 3 3 3
Maryland
St. Mary’s Hospital of St. Mary’s County, Inc. Leonardtown 3 3 3 3 3
Michigan
St. Joseph Mercy Oakland Pontiac 3 3 3 3 3
Missouri
SSM St. Mary’s Health Center Richmond Heights 3 3 3 3 3
The Joint Commission’s Top Performer on Key Quality Measures® for 2013 – Hospitals Exceeding Measure Requirements
These hospitals submitted data for more core measure sets than were required in 2013 and achieved Top Performer status. The checkmark (3) indicates the measure set(s) for which the hospital or critical access hospital is being recognized.
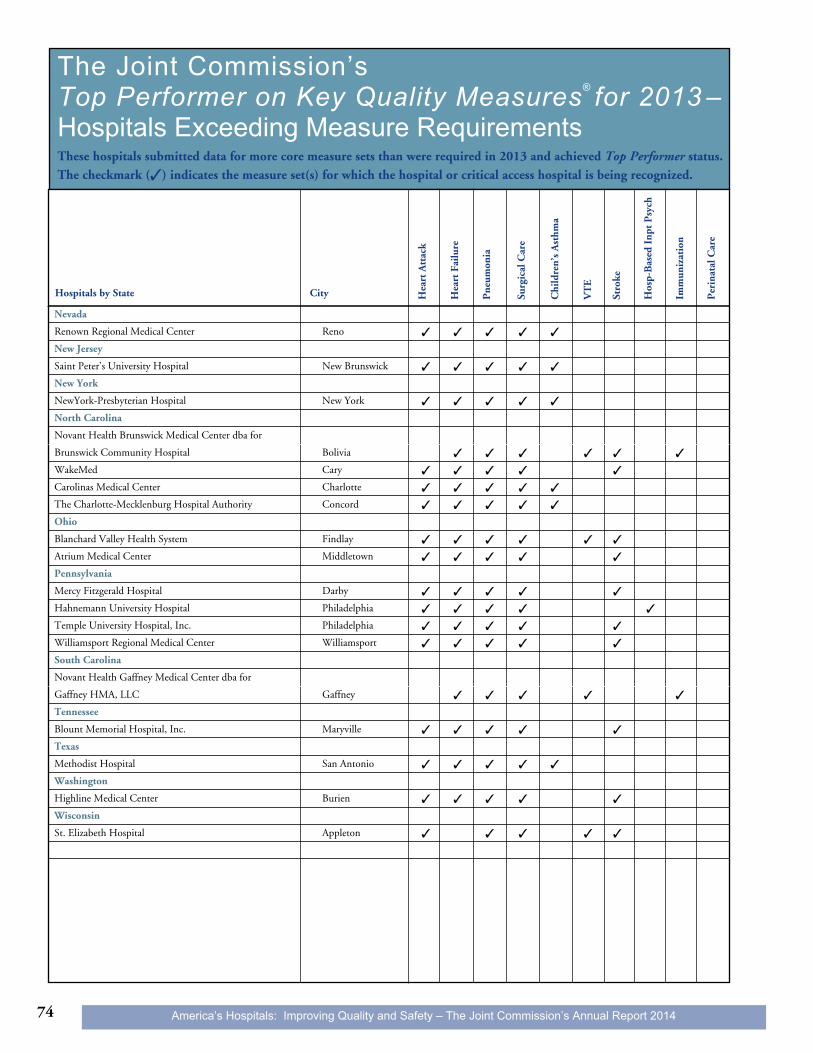
74 America’s Hospitals: Improving Quality and Safety – The Joint Commission’s Annual Report 2014
Hospitals by State City Hea
rt A
ttac
k
Hea
rt F
ailu
re
Pne
umon
ia
Surg
ical
Car
e
Chi
ldre
n’s
Ast
hma
VT
E
Stro
ke
Hos
p-B
ased
Inp
t P
sych
Imm
uniz
atio
n
Per
inat
al C
are
Nevada
Renown Regional Medical Center Reno 3 3 3 3 3
New Jersey
Saint Peter’s University Hospital New Brunswick 3 3 3 3 3
New York
NewYork-Presbyterian Hospital New York 3 3 3 3 3
North Carolina
Novant Health Brunswick Medical Center dba for
Brunswick Community Hospital Bolivia 3 3 3 3 3 3
WakeMed Cary 3 3 3 3 3
Carolinas Medical Center Charlotte 3 3 3 3 3
The Charlotte-Mecklenburg Hospital Authority Concord 3 3 3 3 3
Ohio
Blanchard Valley Health System Findlay 3 3 3 3 3 3
Atrium Medical Center Middletown 3 3 3 3 3
Pennsylvania
Mercy Fitzgerald Hospital Darby 3 3 3 3 3
Hahnemann University Hospital Philadelphia 3 3 3 3 3
Temple University Hospital, Inc. Philadelphia 3 3 3 3 3
Williamsport Regional Medical Center Williamsport 3 3 3 3 3
South Carolina
Novant Health Gaffney Medical Center dba for
Gaffney HMA, LLC Gaffney 3 3 3 3 3
Tennessee
Blount Memorial Hospital, Inc. Maryville 3 3 3 3 3
Texas
Methodist Hospital San Antonio 3 3 3 3 3
Washington
Highline Medical Center Burien 3 3 3 3 3
Wisconsin
St. Elizabeth Hospital Appleton 3 3 3 3 3
The Joint Commission’s Top Performer on Key Quality Measures® for 2013 – Hospitals Exceeding Measure Requirements
These hospitals submitted data for more core measure sets than were required in 2013 and achieved Top Performer status. The checkmark (3) indicates the measure set(s) for which the hospital or critical access hospital is being recognized.