american society for public administration state and local fiscal challenges april 12, 2010 santa...
TRANSCRIPT

American Society forPublic Administration
State and Local Fiscal Challenges
April 12, 2010Santa Clara County, California
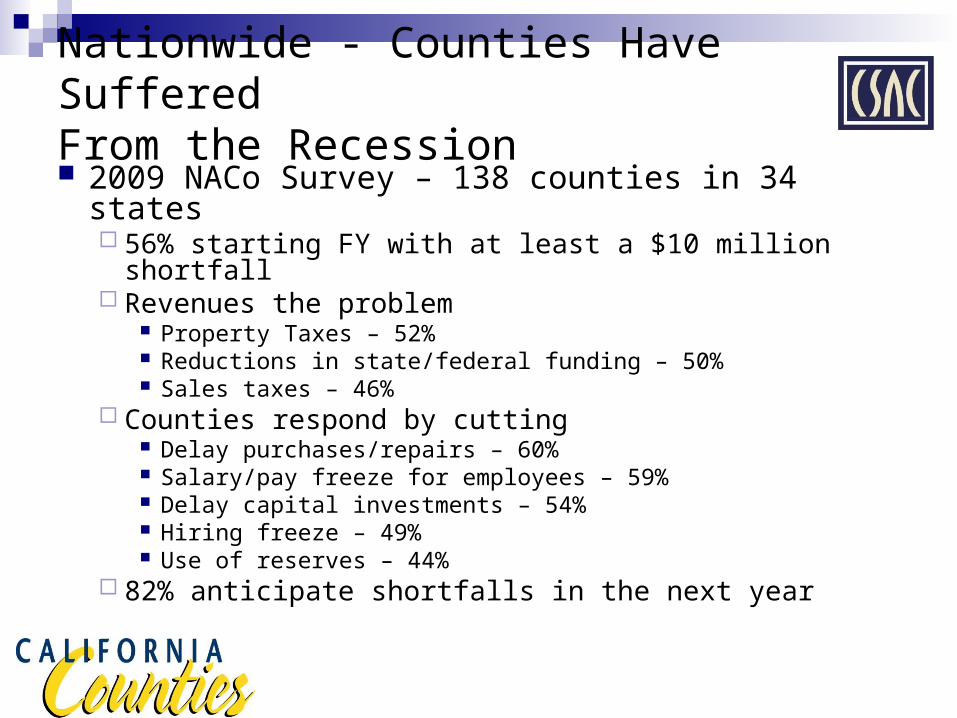
Nationwide - Counties Have SufferedFrom the Recession 2009 NACo Survey – 138 counties in 34 states
56% starting FY with at least a $10 million shortfall Revenues the problem
Property Taxes – 52% Reductions in state/federal funding – 50% Sales taxes – 46%
Counties respond by cutting Delay purchases/repairs – 60% Salary/pay freeze for employees – 59% Delay capital investments – 54% Hiring freeze – 49% Use of reserves – 44%
82% anticipate shortfalls in the next year

National Impacts Significant
National Center for the Study of Counties Balancing the budget in 2009 was more difficult – 59%
Montgomery County, MD Mecklenburg County, NC States continue to erode local revenues
Maryland Montana New Mexico Florida Nevada

California – the REAL Horror StoryProperty Tax Revenue Slump
Percent Growth in Property Tax Revenues
Source: Beacon Economics

California – the REAL Horror Story 58 Counties
Alpine (1,201) – Los Angeles (10 million) 38 million people served $55.6 billion in expenditures
Los Angeles County > 36 states San Diego County > 12 states Orange County > 11 states Riverside County > 7 states Kern County > 3 states Severe cuts
5,500 lay offs 29% furlough employees 29% reduce new employee benefits 5% reduce existing employee benefits

Sacramento County, CA
Population nearly 1.5 million Total budget $2.5 billion County employees – about 9,000
2009-10 Property taxes down 6% Sales Taxes down 14% Cut $256 million from General Fund laid off 835 employees
2010-11 Facing $118 million shortfall ($2b Gen Fund) Looking at 630 layoffs and cutting 170 vacant positions Reduction of Public Health nurses nearly 60% since 2007 Reduction in Probation 43% since 2008

California – the REAL Horror Story State-Local Relationship Dysfunctional
1910 Separation of Sources Act Counties would tax property
Govt that imposed tax determined use 1930s – Counties take over safety net programs 1978 – Proposition 13
Billons in property tax reductions, state back fills State Legislature responsible for allocating property taxes
1980s – fiscal roller coaster, counties get indigent health programs 1991 – Program Realignment
$2 billion in health, mental health & social service programs 1992/93 – ERAF – $1 billion, 1993/94 – ERAF $3 billion
Prop 1A (2004) stopped the hemorrhaging but did not solve the problem
Fiscal Reforms needed – Constitutional Convention?

California – the REAL Horror Story
State Government Dysfunction 2008-09 budget adopted on Sept 23, 2008 Budget stalemate lasted 44 days On Nov 6, 2008, Gov declares fiscal emergency – budget $10
billion in red Legislature failed to act, expired on Nov 30 New Legislature formed Dec 1, Gov calls another emergency
session Combined 2008-09 and 2009-10 deficit totaled $45.3 billion
Special Session combines cuts ($14.9 billion) and new revenues ($12.6 billion) – adopts 2009-10 budget
Relies upon special election ballot measures to balance budget Ballot measures all FAIL miserably
July 2009 – Legislature makes series of cuts, borrows $2 billion in local property tax dollars – Proposition 1A (2004)

California – the REAL Horror Story
2010-11 Budget Proposed Jan 2010 $20.6 billion deficit
$6.6 billion in current year $14 billion in budget year
Gov proposes to shift significant burden to counties Social services program cuts Prison inmate reductions
Relies on $7 billion of new funds from feds Calls another Special Session (#8)
Special Session #8 Legislature send Gov $4 billion in cuts; signs almost $2 billion
Guts gas tax and replaces it with excise tax (short cuts constitutional protection)
Hoping on revenue improvement before new fiscal year

California – the REAL Horror Story
Physical Infrastructure failing Water system Freeways Streets and Highways County facilities
Social Infrastructure failing as well Overcrowded jails/prisons Education failing Social services stretched beyond capacity University system in disarray

Cuts & Revenue Decline Come at a Time of Increasing Demand
0%5%
10%15%20%25%30%35%40%
Percentage Increasesin Caseloads and Applications
September 2007 - September 2008California Statewide
Caseload Applications

California – the REAL Horror Story No light at the end of the tunnel
Unemployment statewide 12.5% Colusa and Imperial County 27.4% Trinity County 25.8% Central Valley – 50%
Los Angeles County – 636,000 unemployed Only 4 cities in CA with higher population
Foreclosures still high San Joaquin, Riverside, San Bernardino, Contra
Costa