american participation in theater · american participation in theater is report #35 in a series on...
TRANSCRIPT

AMERICAN PARTICIPATION
IN THEATER
~,MS Planning & Research Corp.
~esearch Division Report #35
NATIONAL ENDOWMENT FOR THE ARTS

American Participation in Theater

American Participation in Theater
AMS Planning & Research Corp.
Research Division Report #35
National Endowment for the Arts Seven Locks Press
Santa Ana, California

American Participation in Theater is Report #35 in a series on matters of interest to the arts community commissioned by the Research Division of the National Endowment for the Arts.
Cover: Oregon Shakespeare Festival. Photo by Gregory Leiber.
First printed 1996
Library of Congress Cataloging-in-Publication Data American participation in theater / AMS Planning & Research Corp.
p. cm. -- (Research Division report / National Endowment for the Arts: 35)
ISBN 0-929765-46-X (paperback) 1. Theater audiences--United States. 2. Theater audiences--United
States--Statistics. 3. Theater--United States--Statistics. I. AMS Planning & Research Corp. II. Series: Research Division report (National Endowment for the Arts., Research Division) ; 35. PN2270.A89A45 1996 306.4’84--dc20
96-7842 CIP
Manufactured in the United States of America
Seven Locks Press Santa Ana, California 1-800-354-5348

Table of Contents
List of Tables
List of Figures
Executive Summary
Introduction The Surveys of Public Participation in the Arts
PART I: Theater Participation in the United States Interest in Attending More Often Crossover Participation Participation via Mass Media Theater Attendance and Other Leisure Activities
PART I1: The Theater Audience Education Income
Race/Ethnicity Gender Marital Status Residency Region Presence of Children
PART II1: Producing Activity, 1982-1992 Nontouring Productions Touring Productions Ticket Prices
PART IV: Artistic Focus Culturally Specific Work Evolution of Performance Art
PART V: Marketing Programs
vi
vi
1
7 8
11 12 12 13 15
17 17 18 20 21 22 23 24 24 25
29 30 31 32
33 33 33
35

vi I American Participation in Theater
PART Vl: Future Participation in Theater 37
Appendix A: 1992 Survey of Public Participation in the Arts 39
Notes 46
About the Author 47
Other Reports on Arts Participation 48
Tables
Table 1. Theater Participation in the U.S., 1982-1992 11 Table 2. Cross-Discipline Participation Rates 13 Table 3. Participation Rates via Mass Media (%) 14 Table 4. Participation in Other Leisure Activities, 1982-1992
(Hours and %) 16 Table 5. Theater Audience Composition by Age Cohort 21 Table 6. Theater Participation Rates by Age Cohort 21 Table 7. Audience Composition by Demographic Segment (%) 26 Table 8. Theater Participation Rates by Demographic
Characteristics (%) 27 Table 9. Theater Participation Rates by Presence of Children 28 Table 10. Supply vs. Attendance at 42 Theaters, 1982-1992 29
Figures
Figure 1. Theater Participation Rates by Highest Level of Education Completed (%) 18
Figure 2. 1992 Theater Audience, Percentage Composition by Income Level 19
Figure 3. Theater Participation Rates by Race/Ethnicity 22 Figure 4. Theater Participation Rates by Marital Status 23

Executive Summary
A ccording to nationwide surveys of arts participation sponsored by the National Endowment for the Arts, American participation in theater or
"non-musical stage plays" increased from 11.9 percent of all adults in 1982 to 13.5 percent in 1992--an increase of 13.4 percent and the largest increase among the six benchmark categories studied (jazz, classical music, opera, musicals, plays, and performing arts). For purposes of this survey, a non-musical stage play is a theatrical production consisting of spoken dialogue.
In similar studies conducted in 1982, 1985, and 1992 by the U.S. Census Bureau, randomly selected interview subjects (aged 18+) were asked a series of questions relating to their participation in the arts through attendance at live performances, exposure via mass media, personal participation in the arts, interest in attending more often, childhood exposure to the arts, and related topics. The numbers of completed interviews were 17,254, 13,675, and 12,736, respectively. Results from these Surveys of Public Participation in the Arts (SPPAs) have been analyzed extensively in numerous research reports and monographs commissioned by the National Endowment for the Arts. This analysis focuses exclusively on participation in stage plays. The approach taken is first to examine the theater audience and its characteristics and then to explore the dynamic forces shaping theater participation. Changes in producing and touring activity are discussed, as well as the evolving nature of the art form itself.
Theater Participation
Based on an adult population (18+) of 185.8 million, an estimated 25.1 million U.S. adults attended live stage plays in 1992, compared to 20 million in 1982 when the adult population was 164 million. Accounting for sampling error at the 95 percent confidence level, the true size of the 1992 theater audience was between 24 and 26.2 million adults.
Among those reporting theater attendance, an average frequency of 2.4 times was reported (in the preceding 12-month period), yielding a total of 60.2 gross attendances at live stage plays. About 27.4 percent of the theater audience attends 3 or more times per year, compared to 22.4 percent of the audience for musicals, and 15.2 percent of the opera audience.
A third of all survey respondents expressed an interest in attending stage

2 I American Participation in Theater
plays more frequently than they do now, an increase of 9.4 percentage points since 1982 and the biggest increase for any of the benchmark activities. The potential audience for stage plays is composed of 10 percent current theatergoers who do not wish to increase their participation, 25 percent current theatergoers who u, auld like to attend more often, and 65 percent nonattenders with an expressed interest in going. A relatively large untapped audience for stage plays is suggested. Creating marketing and artistic "points of entry" for nonattenders is the implied challenge.
Over half of all stage play attenders (53.2 percent) also reported attending musical theater in the preceding year, although only 41.1 percent of the musical theater audience also reported attending stage plays--indicative of the relatively broader appeal of musicals. Stage play audiences are most likely to be drawn from opera audiences (48.1 percent crossover), while only 11.7 percent of theatergoers "feed" the opera audience.
Like other types of arts attenders, theatergoers are more active in other leisure activities compared to the general population. In 1992, 53.8 percent of theatergoers also attended sports events, down from 68.3 percent in 1982. The average theatergoer watches 2.4 hours of TV every day, compared to 3.0 hours for the average American. With the exception of exercise and charity work, participation by theatergoers in all other leisure activities declined between 1982 and 1992.
Audience Characteristics
Education remains the single most important predictor of stage play participation. While 35 percent of those with graduate school education reported theater attendance, only 4 percent of those with high school education did so. Frequency of attendance also increases with education level.
Income is also highly correlated with frequent attendance at stage plays. Households with incomes over $75,000 account for 17 percent of the theater audience compared to 26 percent of the opera audience, but only 9.5 percent of the general population.
With respect to age, theater participation is somewhat more constant across age groups compared to other benchmark activities. The highest theater participation rate (17.2 percent) was observed among respondents aged 45-54, compared to a rate of just 6.7 percent for those aged 75 and over. An analysis of theater participation by age cohort (i.e., following those born between certain years) suggests that participation has increased evenly across all cohorts except for those born before 1918 (the pre-World War I cohort), whose participation declined sharply.

Executive Summary I 3
Increased theater participation among African Americans and Hispanics is one of the most significant findings of this analysis. Participation rates for African Americans more than doubled from 5.8 percent in 1982 to 12.0 percent in 1992. Similarly, Hispanic participation in stage plays also rose from 5.5 percent to 8.6 percent. Audience diversification efforts in the nonprofit theater field appear to have made a significant impact since 1982.
Adults with no children comprise 81.4 percent of the audience for stage plays. Adults with children under age 6 are substantially less likely to participate in theater compared to adults with older children. Participation rises to near-average levels for adults with children aged 6-11, suggesting that the theater field is adept at recapturing parents into the audience. Increases in the levels of children’s programming since 1982 help account for this phenomenon.
Producing Activity
Data provided by Theater Communications Group (TCG) suggest a small increase in the number of mainstage and other nontouring productions by nonprofit theaters. For a sample of 42 theaters, the number of performances rose slightly from 13,304 in 1982 to 13,659 in 1992, while attendance rose from 6.4 million to 6.8 million, or 6.7 percent. Thus it may be inferred that the 42 theaters became more proficient at filling their houses, although population growth between 1982 and 1992 should have driven attendance up by 13 percent, holding all else constant.
The League of American Theaters and Producers (LATP) tracks commercial producing and touring activity. Commercial touring of stage plays decreased from 23 productions in 1982 (an average of 10.6 weeks each), to 10 productions in 1992 (an average of 21.4 weeks each). The shift to longer tours of fewer commercial productions may have resulted from several factors, including a decline in the number of new plays and play revivals on Broadway, the increasing costs of touring, and the opening of new commercial venues in cities like Palm Beach, Ft. Lauderdale, Cleveland, and Minneapolis/St. Paul.
Among nonprofit theaters, a renewed focus on ethnically and culturally specific works strongly corroborates the audience diversification observed since 1982, particularly among the African American and Hispanic populations. Increased responsiveness to diverse constituencies became a major thrust of the funding community during this period. The growing popularity of performance art and solo performance (i.e., storytelling and monologue) undoubtedly had a positive impact on theater participation, particularly among young audiences.
The observed increase in theater participation between 1982 and 1992 is

4 I American Participation in Theater
a gross measure--a broad representation of many underlying factors, some consistent with increasing attendance, some contradictory to it. Nevertheless, an attempt to reconcile demand for stage play programming (as measured by participation rates and frequency) with the supply of theater programming is a valuable, if inconclusive pursuit.
Local Context to Theater Participation
Another study conducted by the NEA in 1992 revealed some of the complex patterns of arts participation at the local level, adding rich context to data from the national surveys.1 In each of twelve areas studied (ranging from San Jose to Chicago), arts participation rates were examined in light of the local supply of arts programs and facilities. Theater participation was highest in Seattle/King County (WA) where a thriving theater community was observed, including playwrights, actors, and a plethora of small, experimental ensembles known collectively as "Seattle’s fringe theaters." The study concluded that the relationship between the supply of and demand for arts programming is anything but predictable. Dynamic forces shape participation patterns in each community, including characteristics of the resident and nonresident markets, the supply of producing and presenting activity, the availability of suitable performance facilities, as well as local traditions and history. Further research at the local level will add valuable context to theater participation in the United States and perhaps stimulate the transfer of audience development strategies across communities.
The Future Audience
Will public participation in non-musical stage plays continue to grow? Ten years from now the field will have endured another decade of change. New theaters will open and others will fold; playwrights, directors, and actors will speak out in new ways; the funding climate will inevitably change; and new communications technology will create possibilities for both theaters and audiences.
How will the theater make itself relevant to an increasingly diverse public? Much depends on the resources made available to theaters, playwrights, and performers to develop new work and attract new audiences. Most likely, the rising costs of producing and touring professional theater--coupled with changes in the funding mix for nonprofit theaters--will create even more pressure on earned income. However, it is the developmental component of

Executive Summary I 5
theater, free from commercial expectations, that ultimately creates renewal. Audiences will continue to change and grow as new works (and old works infused with new relevancy) bring the lives of more Americans closer to the theater. Responsibility for creating new work rests not only with the nonprofit theater but also with commercial producers, the funding community, and ultimately the audience itself.

Introduction
F or nearly 20 years the arts participation patterns of Americans have been studied through a series of research efforts sponsored by the National Endowment for the Arts (NEA), including three nationwide Surveys of Pub
lic Participation in the Arts (SPPAs) conducted in 1982, 1985, and most recently in 1992. Results from these and other research efforts have advanced our understanding of the complex patterns of arts participation in the United States. With data available from three surveys spanning a decade, broad trends in arts participation can be monitored, adding a new dimension to the collective knowledge of arts participation in the United States.
This analysis focuses on participation in non-musical theater or stage plays, only one of the eight benchmark arts activities defined by the NEA. The goal of the analysis is to offer perspective on theater participation in the United States in terms of the demand for theater programming, the supply or availability of theater programming, and other forces impacting theater participation.
In terms of demand, a variety of quantitative measures have been developed through NEA-sponsored research, including attendance rates, frequency of attendance, and the demographic and other characteristics associated with attendance. On the supply side, measurement is substantially more difficult due to the diversity and constant state of flux of the theater field. Providers of theatrical programming include resident theaters, commercial producers, children’s theater companies, presenters, broadcast media, and other types of organizations.
The rapid evolution of the "theater delivery system" in the United States is driven by a number of interrelated forces:
¯ a constantly changing arts public, both demographically and culturally ¯ artistic developments in the theater field ¯ management and organizational changes among producers and presenters ¯ a changing funding and political climate ¯ technological advances ¯ economic forces that impact both consumers and producers
Thus the simple observation that theater attendance increased 13 percent between 1982 and 1992 belies a panoply of underlying forces, some correlative and some contradictory. Ultimately, the changing patterns of theater par

8 I American Participation in Theater
ticipation are as rich, subtle, and complex as the art form itself. Theater (unlike the more wieldy artistic disciplines of opera, ballet, and even musical theater) easily speaks to contemporary audiences, not only through new plays but also through new interpretations of older works. The traditionally smaller scale of theater productions affords the art form an element of spontaneity (if not portability) and a facility for relevance that opera, ballet, and musical theater do not enjoy. If theater as an art form reflects our society and its search for identity and understanding, then the study of theater participation is a window looking into the cultural development of America.
The Surveys of Public Participation in the Arts
In response to a growing need to understand the changing arts participation patterns of Americans, the National Endowment for the Arts commissioned a series of nationwide surveys called the Surveys of Public Participation in the Arts (SPPA). Conducted by the U.S. Bureau of the Census, the first survey in 1982 established benchmark data from which trend analysis is now possible, with data from the second and third SPPAs in 1985 and 1992, respectively.
In terms of survey design, the SPPAs addressed these primary topic areas:
¯ rate and frequency of attendance at live performances of jazz, opera, classical music, musical theater, museums, ballet, other dance, and non-musical stage plays (the eight benchmark arts activities), as well as several other types of arts programs
¯ arts participation through electronic media, including television, video, and radio
¯ interest in attending different types of arts activities more often ¯ participation in other leisure activities ¯ personal participation in the arts (e.g., painting, writing, playing an in
strument) ¯ music preferences ¯ childhood exposure to the arts
Respondents to the SPPA were part of a larger, continuously rotating panel of randomly selected respondents who had agreed to participate in the research. Census Bureau population counts were used to draw the sample in such a way that all individuals living in households in the United States had a known and equal chance of selection.
The sampling flame used in 1992 was essentially the same as those used

Introduction I 9
in the 1982 and 1985 surveys. All individuals aged 18 and older in the selected households were eligible for inclusion in the survey. Less than 20 percent of all eligible individuals were unable to be interviewed. Approximately 75 percent of the 1992 interviews were conducted by telephone, unlike the 1982 and 1985 SPPA surveys for which only 25 percent were conducted by telephone. Face-to-face interviews were conducted with respondents who could not be reached by telephone. Each interview took about 8 minutes to complete for the first six months (January through June) and 16 minutes for the second six months, when a longer survey instrument was used.
This report analyzes a subset of 1,716 respondents who reported attending at least one non-musical stage play in the preceding 12 months. Roughly 81 percent of those theatergoers were interviewed over the telephone, while the remaining 19 percent of the interviews were conducted in person at the respondents’ homes. The majority (54.3 percent) of the interviews with stage play attenders were conducted in the first six months using the short form. The analysis of leisure activities, arts lessons/classes taken, and interest in attending more often is based on yet another subset of 785 respondents who completed interviews during the last six months of the 1992 SPPA.
To facilitate analysis, additional research was conducted on trends in the theater field since 1982. Sources of data included the Theater Communications Group, the League of American Theaters and Producers, and numerous other agencies and individuals with perspective on the field.

Theater Participation in the United States
An estimated 13.5 percent of the U.S. adult population attended live dramatic theater at least once in a 12-month period preceding the 1992
study, compared to a rate of 11.9 percent from the 1982 study. Accounting for sampling error, the actual participation rate for live non-musical stage plays falls between 12.9 percent and 14.1 percent of the adult population at the 95 percent level of confidence. Data in Table 1 summarize stage play participation levels.
Over the decade between 1982 and 1992, attendance at stage plays increased by 1.6 percentage points (or 13 percent), the largest increase of any of the benchmark arts activities, with the exception of art museum audiences.2 Considering a decrease in musical theater attendance of 1.2 percentage points, the sum of attendance at both musical and non-musical theater changed little over the 10-year period.
TABLE 1. Theater Participation in the U.S., 1982-1992
1982 1985 1992 % Change
(millions) (millions) (millions) 1982-1992
Overall U.S. adult population (18+) 164.0 170.6 185.8 +13.3
Overall participation rate for live theater 11.9% 11.6% 13.5% +13.4
Number of adults 19.5 19.7 25.1 +28.7
Frequency of attendance (times per year) N/A N/A 2.4 N/A
Overall number of attendances N/A N/A 60.2 N/A
Based on an adult population of 185.8 million, between 24 million and 26.2 million adults reported attending live stage plays in 1992. The average frequency of attendance reported in 1992 was 2.4 times per year, yielding a total of 60.2 million attendances.
11

12 I American Participation in Theater
Interest in Attending More Often
A third of all 1992 SPPA respondents indicated that they desire to attend stage plays more often than they do now, an increase of 9.4 percent since 1982 and the largest increase for any of the benchmark arts activities. Only musical theater claims a larger percentage of interested respondents (36.2 percent), although the increase since 1982 has been only 3.8 percent.
Among non-theatergoers, 28.6 percent said they would like to attend more often, compared to 68 percent of current theatergoers--the majority being infrequent or moderate attenders (1 to 3 times annually). Based on these data, the potential audience for non-musical theater may be projected as follows:
% of % of All Adults Potential Audience Potential Audience Segment
4.0 10.0 Current theatergoers who do not wish to increase their participation
9.5 25.0 Current theatergoers who would like to attend more often
24.7 65.0 Nonattenders with an interest in attending stage plays
While some respondents may overstate their interest in attending more often, a relatively large untapped audience for stage plays is suggested, the majority of whom are nonattenders and may be new to the theater.
Reasons for not attending more often were studied in the 1982 and 1985 SPPAs as well as in the 1992 Local Area Arts Participation Surveys (LAAPS), a 12-city study focusing on local participation. Respondents in all three studies reported that the primary barrier to increased participation was lack of time, followed by cost issues (categories were predefined). Difficulty in ascertaining the more complex internal and external forces inhibiting arts attendance prompted the NEA to drop this topic area from the 1992 survey instrument. As an alternative to studying what keeps people out of the theater, some researchers are directing more attention to the circumstances surrounding flrst-time attendance)
Crossover Participation
Over 85 percent of the stage play audience also reports participating in at least one other benchmark arts activity (see Table 2); only opera attenders (93

Theater Participation in the United States I 13
percent), ballet attenders (92 percent), and classical music attenders (89 percent) participate in other arts activities at a greater rate. More than half of all stage play attenders (53.2 percent) also reported attending musical theater, the second highest correlation among arts activities surveyed, following museum attendance. Conversely, only 41 percent of musical theater attenders also attended stage plays, reflecting a broader-based audience for musical theater. Opera attenders represent the largest source of crossover attenders for stage plays (48.1 percent), while just 11 percent of play attenders also attend opera.
TABLE 2. Cross-Discipline Participation Rates
% of Stage Play Attenders % of__ Attenders Who Who Also Attend __ Also Attend Stage Plays
Museums 63.4 32.0
Musical Theater 53.2 41.1
Classical Music 40.0 43.2
Jazz 31.3 39.7
Other Dance 19.4 36.5 Ballet 15.7 45.5 Opera 11.7 48.1
SOURCE: 1992 Survey of Public Participation in the Arts
Analysis of crossover participation is useful in understanding the interrelationships of different arts audiences. At a tactical level, such information may be used by arts managers in the development of marketing strategies, particularly in the area of direct mail and telemarketing. For example, results suggest that mailing lists from opera and ballet companies should be the most productive for marketing stage plays.
Participation via Mass Media
Participation in stage plays through various forms of electronic media declined significantly between 1982 and 1992. In 1982 over a quarter of respondents (26 percent) reported viewing dramatic theater broadcast on television. This has declined steadily to its current level of 17 percent, reaching an audience of 33.4 million annual viewers (television and videocassette). The

14 I American Participation in Theater
average number of annual viewings of dramatic theater performances through TV or VCR is 8 per viewer, increasing the total number of viewings nationally to 267.2 million.
Demographically, electronic media audiences for stage plays differ significantly from audiences who attend live performances. Notably, the education levels of media audiences are lower than the education levels of those who attend live theater. A quarter of live theater audiences (25.4 percent) attained a high school education or less, compared to over a third of video/radio theater audiences (36.7 percent). Income levels were lower for video/radio theater audiences as well, but not as significantly as education. With respect to age, video audiences also tend to be older: whereas one-fourth (25.6 percent) of live theater audiences are 55 and older, slightly over one-third (33.7 percent) of video participants are age 55 and older.
The video audience for non-musical theater is made up of both attenders and nonattenders of live performances. Among the respondents who reported attendance at a live performance, 42 percent also watched a stage play performance on TV or VCR. Interestingly, respondents who did not attend live theater in the last 12 months viewed theatrical performances on TV and VCR more frequently than those who did attend live theater--8.8 times annually vs. 6.2 times, respectively. Only 3 percent of respondents who did not attend live dramatic theater in the last 12 months reported viewing a stage play" via video.
TABLE 3. Participation Rates via Mass Media (%)
Difference 1982 1985 1992 1982-1992
Participation Rate via Television 25.9 21.0 14.8 -11.1
Participation Rate via Video N/A N/A 1.3 N/A Participation Rate via Radio 3.8 4.0 2.8 -1.0
Dramatic radio broadcasts reach a very small audience, 3 percent in 1992 compared to 4 percent in 1982. The audience reached through this form of media is 5.6 million adults, the smallest radio audience measured.
Radio audiences for theater differ significantly from both live theater and video audiences with regard to gender and racial/ethnic composition. Over 52 percent of the radio audience is male, compared to 43.6 percent of live audiences and 45.3 percent of video audiences. Racially, the radio audience for

Theater Participation in the United States I 15
theater is more diverse than the audience for live theater, with 14 percent fewer whites and more African Americans, Hispanics, and Asian Americans. As with video audiences, radio audiences for theater are less educated and have lower household incomes.
The decrease in participation via electronic media appears to contradict the audience potential implied by a growth in U.S. household VCR ownership and cable subscription levels. Among households with televisions, over 70 percent also own a VCR and nearly 60 percent subscribe to cable television-huge increases over 1980 levels. One explanation for the decrease in theater participation via electronic media may be a decline in theater programming on public television. Two series broadcast on PBS, Great Performances and American Playhouse, have decreased their programming of stage plays significantly in the last decade. In 1985 Great Perfarmances offered 9 different productions of dramatic theater; that number declined to 3 in 1992. As recently as 1990 American Playhouse offered a total of 18 programs, of which 7 were non-musical theater. Out of a total of 11 programs, American Playhouse presented only 3 non-musical productions in 1992. The precipitous decline in the supply of theater programming on public television may be due to lower interest (or ratings) among viewers, lack of funding, or other reasons. The proliferation of cable programming may also account for declining participation in theater on television.
Theater Attendance and Other Leisure Activities
In order to gain perspective on arts participation in the larger context of leisure activity, the SPPA measures participation in a number of leisure activities. Findings suggest that people who participate in non-musical theater (and other arts activities) are also more likely to participate in unrelated leisure activities at a greater rate than the general population. For example, 83 percent of stage play attenders also went to the movies in the last 12 months, compared to only 58.5 percent of the total population. This pattern remains consistent for other leisure activities.
Theoretically, participation in other activities should reduce the amount of leisure time available for arts participation of any type. This notion is disproved, however, by the finding that respondents who engage in other leisure activities are in fact more likely than average to attend arts programs. This was referred to as "the more, the more" principle by John Robinson in his analysis of the 1982 and 1985 SPPA surveys.4
There has been a general decline in participation in leisure activities among dramatic theater attenders over the last ten years. The most significant

16 I American Participation in Theater
declines were experienced in home-based activities and amusement events, particularly home improvement activity (down 15 percent) and attending professional sporting events (down 14 percent). The only leisure activity for which participation increased was exercise: 78 percent of non-musical theater attenders report exercising in 1992, an increase of 5.2 percent from 1982.
TABLE 4. Participation in Other Leisure Activities, 1982-1992 (Hours and %)
1982 1992 % 1992 Total Stage Stage Change
Sample Play Play 1982-Attenders Attenders 1992
Amusement
TV Hours 3.0 2.2 2.4 9.1 Movies 58.5% 87.6% 83.4% 4.8% Attend Sports 36.4 68.3 53.8 -21.2 Visit Amusement Park 49.8 63.7 60.2 -5.5
Exercise/Sports Activities
Exercise 59.3 72.7 77.9 6.8 Play Sports 38.5 60.2 55.0 -8.6 Outdoor Activity 33.8 48.4 48.0 -0.8
Charitable Activities
Volunteer at Charity 32.3 52.2 54.1 3.6 Home-Based Activities
Home Improvements 47.2 70.4 55.4 -21.3 Gardening 54.2 74.3 62.7 -15.6
Arts & Crafts Activities
Ceramics 8.3 17.6 12.7 -27.8 Textile Work 21.1 39.6 31.1 -21.5 Photography 11.7 18.9 19.2 1.6 Painting 9.7 17.3 15.4 -11.0 Creative Writing 8.7 18.7 Compose Music 2.2 3.3

The Theater Audience
S urvey results suggest that the demographic characteristics of theatergoers have not changed significantly since 1982, with some notable exceptions.
Five key demographic variables are examined in this section: education, income, age, race/ethnicity, gender, and marital status. Two geographical characteristics--type of area (e.g., urban, rural) and region--are also explored, as well as the impact of family life cycle (i.e., presence of children) on theater participation.
Education
As illustrated in Figure 1, education remains the strongest demographic predictor of theater participation.
A college graduate is twice as likely to attend a non-musical stage play as the average adult. The likelihood of theater participation increases by over 2.5 times the average rate for people with graduate degrees. Interestingly, participation rates have declined for respondents whose highest level of education is "some college" or more. Most notably, college graduates’ participation rate decreased over 10 percent from 25.9 percent in 1982 to 23.2 percent in 1992. Conversely, participation rates for those with high school diplomas increased by 10 percent between 1982 and 1992.
Audience composition, on the other hand, reflects a significant increase for those with college or postgraduate degrees. Half of the stage play audience (49.9 percent) consists of people with at least a bachelor’s degree, a more than 7 percent increase. A quarter of the audience (25.4 percent) is made up of respondents whose highest education level is high school or less, a decrease of 8.6 percent over 10 years.
The decreased participation rate and the increased audience presence of those whose highest education level is a bachelor’s degree or more are explained in part by the general trend towards higher educational attainment in the United States. According to the U.S. Bureau of the Census, between 1980 and 1990 the percentage of people 25 years old and over who had completed four years of college or more increased from 17 percent in 1980 to 21.2 percent in 1992, a growth rate of nearly 25 percent. By comparison, the SPPA growth rate during that period for those graduates who attended at least one
]7

18 I American Participation in Theater
FIGURE 1. Theater Participation Rates by Highest Level of Education Completed (%)
[] 1982 SPPA [] 1985 SPPA [] 1992 SPPA
40.0
35.0
30.0
25.0
20.0
15.0
10.0
5.0
0.0
Grade School
Some High
School
High School
Graduate
Some College
Bachelor’s Degree
Graduate School
stage play is 13.4 percent. Frequency of attendance increases significantly for those with bachelor’s or
postgraduate degrees. Those who have earned a bachelor’s degree attend nonmusical stage plays an average of 2.6 times annually, while those whose highest level of education is "some college" fall below the average of 2.4 times (ranging from a low of 1.7 times for those with some high school to 2.3 times for those with some college).
Income
Income has the greatest single effect on frequency of attendance. Based on a multiple regression model, income proved to be the strongest predictor of frequent attendance (six or more times). When controlling for outliers, individuals with household incomes of $75,000 or more are the most frequent
The Theater Audience I 19
theater attenders at 2.6 times annually. Frequency of attendance decreases proportionately with declining income levels.
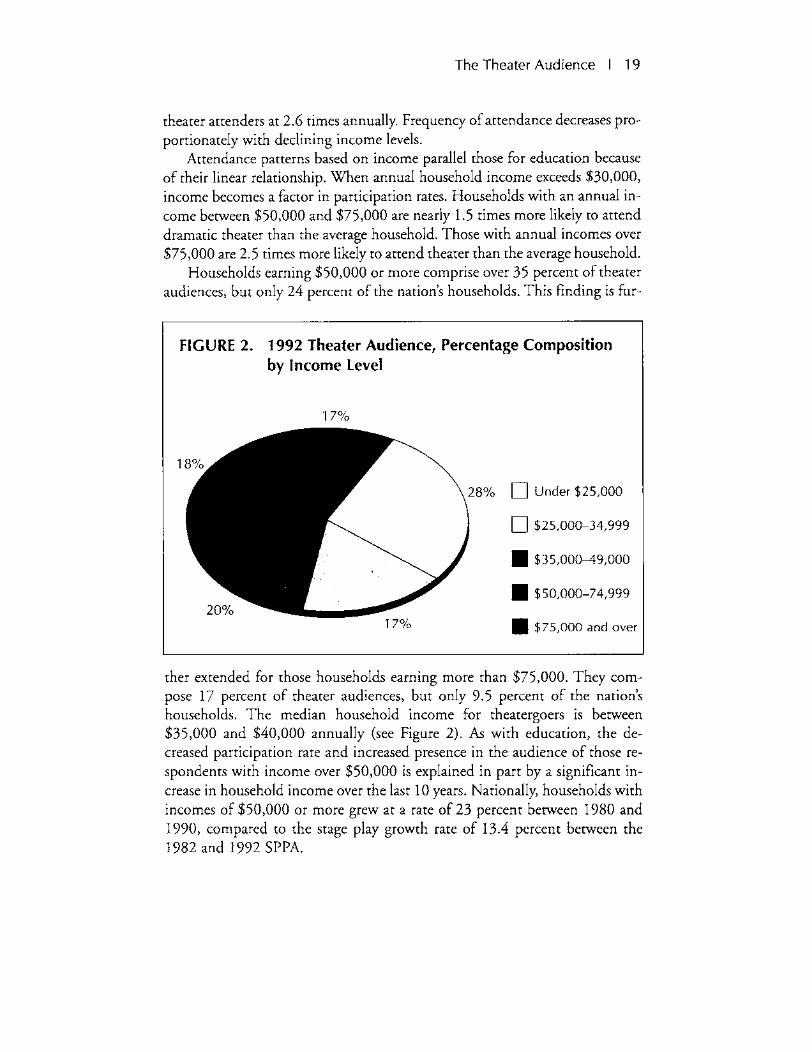
Attendance patterns based on income parallel those for education because of their linear relationship. When annual household income exceeds $30,000, income becomes a factor in participation rates. Households with an annual income between $50,000 and $75,000 are nearly 1.5 times more likely to attend dramatic theater than the average household. Those with annual incomes over $75,000 are 2.5 times more likely to attend theater than the average household.
Households earning $50,000 or more comprise over 35 percent of theater audiences, but only 24 percent of the nation’s households. This finding is fur-
FIGURE 2. 1992 Theater Audience, Percentage Composition by Income Level
1 7%
28% [--I Under $25,000
[--1 $25,000-34,999
¯ $35,000-49,000
¯ $50,000-74,999 20%
1 7% ~ $75,000 and over
ther extended for those households earning more than $75,000. They compose 17 percent of theater audiences, but only 9.5 percent of the nation’s households. The median household income for theatergoers is between $35,000 and $40,000 annually (see Figure 2). As with education, the decreased participation rate and increased presence in the audience of those respondents with income over $50,000 is explained in part by a significant increase in household income over the last 10 years. Nationally, households with incomes of $50,000 or more grew at a rate of 23 percent between 1980 and 1990, compared to the stage play growth rate of 13.4 percent between the 1982 and 1992 SPPA.
20 I American Participation in Theater
Age
With the exception of respondents between ages 25 and 44, participation rates increased by nearly 25 percent since 1982. Respondents between ages 65 and 74 reported the highest increase in participation--34 percent. Meanwhile, those in the baby boom age brackets reported an overall decrease in theater participation. Among respondents aged 35 to 44, theater participation decreased by 9.2 percent, while no change was observed among those aged 25 to 34.
Respondents between ages 35 and 64 attend live theater at a rate greater than the national mean (13.5 percent), with the highest participation coming from those aged 45 to 54--17.2 percent. The lowest participation rate for any age category is 6.7 percent for respondents aged 75 and older. However, this was nearly a 30 percent increase over their 1982 participation rate of 5.2 percent.
An alternative way to examine age data is through cohort analysis which compares the years respondents were born rather than the ages of the respondents. For instance, responses of those between 25 and 34 in 1982 are compared to those between 35 and 44 in 1992. This analysis helps show the changes in participation and audience composition within a specific cohort group.
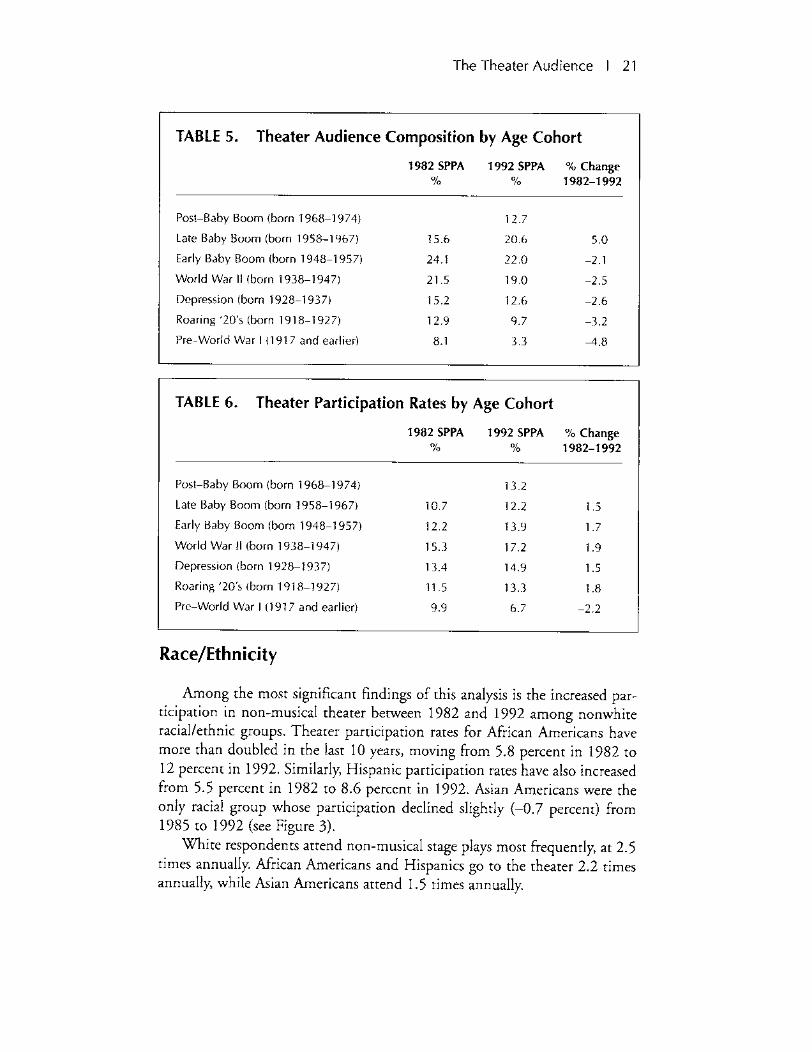
The age composition of theater audiences follows generational lines, growing older over the last 10 years (see Table 5). In 1992 people between the ages of 35 and 44--those classified as Early Baby Boomers--made up the largest portion of the theater audience (22 percent). This was also true of Early Baby Boomers in 1982, who composed 24 percent of the theater audience. When age cohorts were compared based on generational categories over the 10year period, audience composition changed significantly. All age cohorts experienced a significant decline in participation except Late Baby Boomers, which increased 5 percent. This is partly because those born between 1965 and 1967 were under age 18 in 1982 and therefore not eligible to answer the survey.
Participation rates also cluster around generational lines. With the exception of respondents born prior to World War I, participation rates have increased between 1982 and 1992 for all age cohorts (see Table 6). The greatest increase occurred for those cohorts classified as World War II (aged 45 to 54 in 1992), moving from 15.3 percent to 17.2 percent.
Overall, results suggest that a major challenge for the theater field is to increase attendance among Late Baby Boomers and Post-Baby Boomers. People under the age of 35 comprise a greater proportion of the U.S. adult population (37.7 percent according to the 1990 census) than are present in the nonmusical theater audience (33.3 percent).
The Theater Audience I 21
TABLE 5. Theater Audience Composition by Age Cohort
1982 SPPA 1992 SPPA %Change % % 1982-1992
Post-Baby Boom (born 1968-1974) 12.7
Late Baby Boom (born 1958-1967) 15.6 20.6 5.0 Early Baby Boom (born 1948-1957) 24.1 22.0 -2.1
World War II (born 1938-1947 21.5 19.0 -2.5 Depression (born 1928-1937) 15.2 12.6 -2.6 Roaring ’20’s (born 1918-1927 12.9 9.7 -3.2
Pre-World War I (1917 and earlier) 8.1 3.3 4.8
TABLE 6. Theater Participation Rates by Age Cohort
1982 SPPA 1992 SPPA %Change % % 1982-1992
Post-Baby Boom (born 1968-1974) 13.2 Late Baby Boom (born 1958-1967) 10.7 12.2 1.5 Early Baby Boom (born 1948-1957) 12.2 13.9 1.7 World War II (born 1938-1947) 15.3 17.2 1.9 Depression (born 1928-1937) 13.4 14.9 1.5 Roaring ’20’s (born 1918-1927) 11.5 13.3 1.8 Pre-World War I (1917 and earlier) 9.9 6.7 -2.2
Race/Ethnicity
Among the most significant findings of this analysis is the increased participation in non-musical theater between 1982 and 1992 among nonwhite racial/ethnic groups. Theater participation rates for African Americans have more than doubled in the last 10 years, moving from 5.8 percent in 1982 to 12 percent in 1992. Similarly, Hispanic participation rates have also increased from 5.5 percent in 1982 to 8.6 percent in 1992. Asian Americans were the only racial group whose participation declined slightly (-0.7 percent) from 1985 to 1992 (see Figure 3).
White respondents attend non-musical stage plays most frequently, at 2.5 times annually. African Americans and Hispanics go to the theater 2.2 times annually, while Asian Americans attend 1.5 times annually.

22 I American Participation in Theater
FIGURE 3. Theater Participation Rates by Race/Ethnicity
¯ 1982 SPPA ¯ 1985 SPPA D1992 SPPA
16.0
14.0
12.0
10.0
8.0
6.0
4.0
2.0
White African American Asian American Hispanic Other 1982 N/A
Audience composition by race/ethnicity also changed significantly between 1982 and 1992. White patrons comprise 82.4 percent of the 1992 theater audience, a decrease of 8.3 percent from 1982. The largest increase in audience composition was for African Americans, increasing almost by a factor of two since 1982, from 5.2 percent of the audience to 10 percent in 1992. A similar increase in percentage composition among Hispanic respondents was observed, rising from 2.8 percent to 5.3 percent in 1992.
Gender
Women are slightly overrepresented in the theater audience (56.4 percent compared to 51.3 percent of all U.S. adults), a slight decrease from 57.3 percent in 1982. Participation rates in non-musical theater have increased for both women and men to 14.6 percent and 12.3 percent, respectively, in 1992,

The Theater Audience I 23
a noticeable increase from 1982 participation levels of 12.9 percent and 10.8 percent, respectively.
Marital Status
Respondents who are single or divorced attend theater at the highest rates, 15.8 percent and 15.4 percent, respectively. Between 1982 and 1992 participation rates increased among all categories except "separated," which declined significantly. The largest increase in participation was for those who are widowed, rising by 3.6 percent the current participation rate of 11.2 percent. The largest portion of the theater audience, married couples, participates at a rate of only 12.9 percent, below the 13.5 percent average (see Figure 4).
With respect to frequency of attendance, similar patterns are observed. Divorced respondents also attend at a higher frequency of 2.8 times annually,
FIGURE 4. Theater Participation Rates by Marital Status
[] 1982 SPPA [] 1985 SPPA [--1 1992 SPPA
14.q
¯
Married Widowed Divorced Separated Never Married

24 I American Participation in Theater
as well as those who are widowed (2.7 times annually). Single respondents attend theater an average of 2.4 times annually, while married couples attend 2.3 times annually.
The composition of dramatic theater audiences closely resembles the nation with respect to marital status. Married respondents account for 56.3 percent of the theater audience compared to slightly more than the 55 percent of all U.S. adults. Singles represent 26.5 percent of the theater audience, while divorced respondents account for 10 percent.
Residency
The type of area in which respondents live has a major impact on theater attendance. Once an individual is a theatergoer, type of area is the most significant determinant of participation. Residents of urban areas have the highest rate of attendance (15.9 percent) and the highest frequency (2.7 times annually). They make up 38.4 percent of dramatic theater audiences, up from 31.9 percent in 1982.
In many cases, the type of area in which a person lives (e.g., central city, suburb, or rural area) is directly associated with the availability of and access to theatrical programming. Generally the supply of dramatic theater offerings is greater in urban areas than it is in suburban or rural areas, creating increased opportunity for residents of urban areas to attend.
People living in suburban areas (within a Metropolitan Statistical Area or MSA) comprise 47.4 percent of theater audiences and have a participation rate of 14.2 percent. Center city residents constitute a somewhat smaller portion of the theater audience, 38.4 percent, but attend at a higher rate (15.9 percent) compared to their suburban counterparts. Only 8.5 percent of people living in rural areas attend non-musical theater. They make up 14.2 percent of the total audience, a decrease of over 9 percent since 1982.
Region
The geographical distribution of non-musical theater audiences may also be related to the supply of programming. Residents of the Northeast region, which includes cities such as New York, Boston, and Philadelphia (each with a long history of theater programming) have a higher participation rate, 15.8 percent, compared to residents of other regions.
A relatively high participation rate in the West (15 percent) can be associated with the nation’s highest educational attainment: nearly half of all adults

The Theater Audience I 25
in the West have completed at least some college. Significantly higher theater participation by African Americans (17.7 percent) is also observed in the West, compared to 15.5 percent among whites.
Participation rates in the Midwest (14.4 percent) are slightly above the national mean of 13.5 percent. Again, participation rates for African Americans (17.6 percent) and other races (29.6 percent) are significantly higher than for whites (13.9 percent) in the Midwest.
The South has the lowest overall theater participation rate, 10.6 percent, which can be associated with a lack of theater programming in rural areas. Of the four geographic regions, the South has the largest rural population (31.4 percent), according to 1990 census figures.
Presence of Children
Three aspects of family life cycle impact theater participation:
1. the presence of children in the household 2. the number of children in the household 3. the children’s ages
Children under the age of 12 are present in only 18.6 percent of stage play attender households. Participation among these individuals is below average at 10.6 percent, compared to 13.8 percent for those with no children at home. For stage play attenders with children, the strongest correlation to attendance relates to the children’s ages. Generally, individuals living in households with children under the age of 6 have a lower rate of participation, between 7 to 10 percent, depending on the number of children in this age group. Participation rates increase substantially for households with children between the ages of 6 and 11, unless more than one child under 6 is present. Surprisingly, the highest participation rates are for individuals living in households with one child under 6 and more than one child between 6 and 11 (see Table 9).
The presence of children in a household has a somewhat greater effect on frequency of attendance than it has on participation rates. Although individuals with one child under 6 and one child between 6 and 11 have a participation rate of 12.3 percent, their frequency of attendance is only 1.8 times annually. Frequency of attendance rates for individuals with children under 6 are all below the mean frequency of 2.4 times annually. Annual frequency of attendance for all other theatergoers is greater than 2.4 times annually.

26 I American Participation in Theater
TABLE 7. Audience Composition by Demographic Segment (%)
1982 1985 1992 1990 % Change SPPA SPPA SPPA Census 1982-1992
Gender Male 42.7 43.3 43.6 48.7 2.1 Female 57.3 56.7 56.4 51.3 -1.6
Race/Ethnicity White 90.7 89.7 82.4 80.3 -9.2 African American 5.2 5.6 10.0 12.1 92.3 Asian American N/A 1.3 1.6 2.9 23.0 Hispanic 2.5 3.4 5.3 N/A 112.0 Other 1.5 0.0 0.7 3.9 -53.3
Age 18-24 15.6 14.4 12.7 14.4 -18.6 25-34 24.1 24.6 20.6 23.3 -14.5 35-44 21.5 22.3 22.0 20.3 2.3 45-54 15.2 15.1 19.0 13.6 25.0 55-64 12.9 11.7 12.6 11.4 -2.3 65-74 8.1 8.1 9.7 9.8 19.8 75+ 2.6 3.8 3.3 7.9 26.9
Education Grade school 1.8 1.4 1.0 10.4 -44.4 Some high school 3.8 4.0 2.7 14.4 -28.9 High school graduate 22.2 19.4 21.7 30.0 -2.3 Some college 26.9 25.7 24.9 24.9 -7.4 College graduate 22.6 25.3 24.2 13.1 7.1 Graduate school 22.7 24.2 25.5 7.2 12.3
Income Under $5,000 5.6 5.6 2.9 6.2 -48.2 $5,000-$9,000 6.9 5.0 3.8 N/A -44.9 $10,000-$14,999 11.8 10.3 5.9 N/A -50.0 $15,000-$24,999 24.2 19.1 15.7 1 7.5 -35.1 $25,000-$49,999 37.6 37.2 37.4 33.7 -0.5 $50,000+ 13.8 22.8 34.2 24.5 147.8
Marital Status Married 60.2 58.4 56.3 55.0 -6.5 Widowed 4.9 5.6 7.1 7.1 44.9 Divorced 7.6 8.2 10.0 8.1 31.6 Separated 2.1 2.7 1.7 3.3 -19.0 Never married 25.1 25.1 26.1 26.5 4.0
Residency Central city 31.9 30.5 38.4 20.4 Suburbs 44.8 50.2 47.4 5.8 Rural area 23.4 19.3 14.2 -39.3

The Theater Audience I 27
TABLE 8. Theater Participation Rates by Demographic Characteristics (%)
1982 1985 1992 % Change SPPA SPPA SPPA 1982-1992
Gender Male 10.8 10.7 12.3 13.9 Female 12.9 12.4 14.6 13.2
Race/Ethnicity White 12.7 12.5 14.4 13.4 African American 5.8 6.1 12.0 106.9 Asian American N/A 8.8 8.1 -8.0 Hispanic 5.5 6.4 8.6 56.4 Other 8.0 7.8 9.7 21.3
Age 18-24 10.7 10.4 13.2 23.3 25-34 12.2 11.9 12.2 0.0 35 -44 15.3 14.3 13.9 -9.2 45-54 13.4 13.4 1 7.2 28.3 55-64 11.5 10.5 14.9 29.6 65-74 9.9 9.8 13.3 34.3 75+ 5.2 7.2 6.7 28.8
Education Grade school 1.7 1.5 1.7 0.0 Some high school 3.6 3.9 3.7 2.8 High school graduate 7.1 6.0 7.8 9.9 Some col lege 16.5 14.8 15.9 -3.6 College graduate 25.9 26.7 23.2 -10.4 Graduate school 36.7 35.4 35.4 -3.5
Income Under $5,000 7.2 8.1 7.6 5.6 $5,000-$9,000 5.5 4.3 5.7 3.6 $10,000-$14,999 8.1 8.4 7.0 -13.6 $15,000-$24,999 10.3 9.1 10.9 5.8 $25,000-$49,999 17.9 14.2 13.7 -23.5 $50,000+ 33.8 28.4 24.2 -28.4
Marital Status Married 11.4 11.0 12.9 13.2 Widowed 7.6 9.0 11.2 47.4 Divorced 14.5 13.7 15.4 6.2 Separated 9.9 11.0 7.9 -20.2 Never married 14.5 14.3 15.8 9.0
Residency Central city 14.1 13.1 15.9 12.8 Suburbs 13.2 14.2 14.2 7.6 Rural area 8.5 7.1 8.5 0.0

28 I American Participation in Theater
TABLE 9. Theater Participation Rates by Presence of Children
No children
One under 6
Two+ under 6
One 6-11
Two+ 6-11
One under 6, One 6-11
Two+ under 6, One 6-11
One under 6, Two+ 6-11
Two+ under 6, Two+ 6-11
1992 Participation Rate (%)
13.8
9.9
6.9
10.5
12.4
12.3
9.6
14.0
6.9
1992 % of 1992 Frequency Audience of Attendance
81.4 2.5
4.3 1.8
1.6 1.3
4.3 2.5
2.8 3.3
3.3 1.8
0.7 1.9 1.2 2.3
0.2 1.0

Producing Activity, 1982-1992
In addition to changing demographic and cultural forces, theater participa
tion is also influenced by the amount and types of theater programming available to the public. At the national level, the availability of live, professional non-musical theater programming is difficult to quantify, although two service organizations, Theater Communications Group (TCG) and the League of American Theaters and Producers (LATP), compile supply-side data from certain theater companies and Broadway producers. Two categories of supply are discussed in this section: touring and nontouring productions. While there are many different forces at play, the observed increase in live theater participation between 1982 and 1992 may be attributed to supply factors, changes in audience characteristics, or most likely a combination of the two.
At the local level, reconciling attendance levels with the supply of theatrical programming becomes feasible, particularly in smaller communities. Such was the goal of a 1992 study of arts participation in 12 communities across the United States, commissioned by the NEA and sponsors in each area. A great deal was learned about the dynamic forces that shape arts participation in different communities. To date, however, researchers have yet to reconcile the number of reported attendances (by survey respondents) in a community with the actual number of attendances.
TABLE 10. Supply vs. Attendance at 42 Theaters, 1982-1992
% Change1982 1985 1992
1982-1992
Total attendance 6,408,252 6,669,051 6,835,247 6.66
Number of performances 13,304 14,812 13,659 2.67
Number of productions 762 754 655 -14.04
Average length of run 17.46 19.64 20.85 19.44
Source: Theater Communications Group
29

30 I American Participation in Theater
What has been learned from existing research is that the traditional economic principle of supply and demand has little bearing on the production and consumption of non-musical theater. Rather, research has shown that increases in the supply of theater can also stimulate new demand, sometimes leading to an upward spiraling relationship. Seattle’s thriving theater community-with theater participation rates over twice those of other large markets--provides an excellent example of the nontraditional marriage between theater and its public.5
A variety of factors impact the supply of live theatrical programming in any given area, including:
¯ the availability of suitable venues. ¯ the existence of theater companies, producers, and presenters--and their
effectiveness as organizations. ¯ artistic vision (i.e., selection of works to be offered) and quality. ¯ competitive forces, both in terms of the arts and other leisure activities. ¯ political, economic, geographical, and other characteristics of the area.
Additional research at the local level is needed to gain important context on the complex relationship between theater participation and the availability of programs.
Nontouring Productions
In cooperation with Theater Communications Group, the national organization for the professional nonprofit theater, a sample group of 42 theaters was established. These theaters were selected from TCG’s Theater Facts, an annual survey of TCG members that analyzes data relating to attendance, production schedules, earned and contributed income, and expenses. The composition of the sample group included only those theaters that completed surveys each year between 1982 and 1992.
Aggregate attendance for the sample of theater companies increased from 6.4 million in 1982 to 6.8 million in 1992--an increase of 6.7 percent over the 10-year period. Several factors may have contributed to this gain. While the number of productions actually decreased among the sample theaters, the number of performances per production rose. In 1982, 13,304 performances of 760 productions were reported. By 1992 the ratio increased significantly to 13,659 performances of just 655 productions. The most dramatic change was

Producing Activity, 1982-1992 I 31
observed for mainstage productions, for which the number of performances per production increased from 28.6 in 1982 to 42.2 in 1992.
Thus, while the number of performances increased just 2.7 percent between 1982 and 1992, attendance rose by 6.7 percent, suggesting an overall increase in "percentage capacity filled" by the theaters, assuming capacity (i.e., seat count/venue size) remained constant.
The supply of theater programming also increased in several other areas. Children’s programming increased by nearly 22 percent over the 10-year period, while special productions increased by over 45 percent. Only bookedqn events experienced a decline, falling to one-third of the level of 10 years ago.
The League of American Theaters and Producers, Inc., the national trade association for Broadway theater producers and presenters, tracks producing activity and attendance figures for both Broadway and touring commercial shows.6 Unlike nonprofit professional theater, overall attendance for commercial theater declined by 2.7 million between 1982 and 1992, which many attribute to a decrease in the number of new shows. From 1982 to 1992, the number of new plays and play revivals on Broadway decreased from 29 to 19.
Touring Productions
Based on the TCG sample group of 42 theaters, the number of touring productions by nonprofit professional theaters declined sharply over the last 10 years from 66 productions at 28 theaters in 1982 to only 26 productions at 14 theaters in 1992. The economics of touring changed dramatically during this period, with longer tours needed to amortize production costs. In 1982, each touring production ran for 33 performances, rising to 44 performances per production in 1992, an increase of one-third.
The availability of commercial touring plays varies considerably from year to year and is dependent to a large extent on production activity on Broadway. In the 1982-83 season, a total of 23 productions toured an average of 10.6 weeks per production, dropping to 10 non-musical productions at an average of 21.4 weeks on tour for 1992-93.
Prior to the mid-1980s only cities with established theater communities could sustain touring commercial theater. During the economic expansion of the mid-1980s, new or renovated performing arts facilities opened across the United States in cities such as Palm Beach, Ft. Lauderdale, Costa Mesa, Cleveland, and St. Paul, increasing the length of commercial theater tours, and creating new availability of commercial non-musical theater in many areas.

32 I American Participation in Theater
Ticket Prices
Ticket prices are another factor influencing theater participation, as well as the willingness of audiences to pay them. Between 1982 and 1992 ticket prices increased substantially, generally keeping up with or exceeding the rate of inflation. According to data from the sample group provided by TCG, top ticket prices more than doubled in ten years, increasing from a high of $18.00 in 1982 to $42.00 in 1992. Commercial theater ticket prices also rose sharply from a high of $30.00 in 1982 to $50.00 in 1992 and continue to rise.
As ticket prices rise, nonprofit theaters are increasingly pressured to accommodate price-sensitive audiences. Most theaters offer discount programs for seniors, students, and persons with physical disabilities. Several nonprofit theaters designate one or more performances of each production as "pay what you can" nights. A number of cities also assist theaters in increasing earned income by brokering tickets through a half-price ticket booth, in some cases under the auspices of a local arts agency. The most notable is the TKTS booth in New York City’s Times Square, which provides a limited number of halfprice tickets to certain Broadway and off-Broadway productions.

Artistic Focus
S ince the benchmark 1982 SPPA, the artistic focus of the theater field has
changed dramatically, and the art form itself continues to evolve. The proliferation of culturally and ethnically specific work is most remarkable among these changes, as well as the evolution of performance art from the perspectives of both the artists and the public. Moreover, there has been a resurgence of traditional theatrical art forms, such as storytelling and monologue. As the nature of theater changes, so do audiences. The question is, which is changing faster, the audience or the art form?
Culturally Specific Work
Since the early 1980s many politicians, funders, artists, managers, and board members have grown increasingly sensitive to multicultural issues, encouraging theaters to redefine their constituencies and respond to the cultural diversification in the communities they serve. A range of new, culturally and ethnically specific work came into prominence, both in regional theaters throughout the country as well as on Broadway. While culturally and ethnically specific work has always been produced by theater companies serving particular communities (e.g., Jomandi Productions in Atlanta, El Teatro Campesino in the Bay Area, Pan Asian Repertory in New York, and Penumbra Theater in Minneapolis), it was not until large mainstream companies like Yale Repertory Theater began producing works like August Wilson’s Ma Rainey (1984) that culturally specific work began attracting large, nontraditional audiences. Since that time a body of new work has emerged dealing with gay and lesbian issues, feminist themes, and other culturally specific work. Among the most successful of these is Tony Kushner’s Angels in America, which toured extensively following its Broadway run, to wide acclaim.
Evolution of Performance Art
The growing supply and popularity of performance art and solo performance has undoubtedly had a positive impact on theater participation,

34 I American Participation in Theater
particularly among young audiences. It was such work in the early 1980s by monologists Spalding Gray and Eric Bogosian that helped introduce this art form to a wider audience.
Solo performance began reaching a much broader audience when performances moved out of alternative spaces to more traditional venues. People no longer had to be part of a downtown club scene to be aware of such work; traditional theatergoers were increasingly exposed to performance art. As awareness grew, so did the audience. The controversy associated with this art form in the recent past clearly raised public awareness, although the audience remains small.

Marketing Programs
O ver the past ten years commercial and nonprofit theater producers have implemented customer-centered, research-based marketing strategies in
targeting audiences for non-musical stage plays. Through the informed selection of target markets, experimentation with ticket packaging alternatives, telemarketing efforts, and production sharing, the theater field has improved its marketing effectiveness. While other types of performing arts producers and presenters (e.g., opera, classical music, dance) have made similar strides in the area of marketing, the theater field has seen the largest overall increase in participation.
With advanced degrees in arts, public, and business administration, managers entering the theater field bring a higher level of technical proficiency to their jobs. Over the past decade marketing professionals have adopted more disciplined approaches to promotion, particularly in the areas of direct marketing, packaging, and customer segmentation. Now theaters routinely establish strategic marketing plans targeting specific audiences. Many offer flexible ticket packages to attract and retain series buyers, as traditional subscription offers become less attractive.
Against the backdrop of declining leisure time and increased leisure choices both inside and outside the home, theaters are spending more time and money on marketing efforts for virtually the same return they had in the early 1980s. Audience research is one area of growing import. Research results provide theaters with an enhanced understanding of their audience’s attitudes, preferences, satisfaction levels, and buying habits. For example, one theater company learned that their audiences look for three primary attributes in considering whether or not to attend:
¯ a certain level of quality ¯ relevancy; some personal connection to the theme or subject matter of the
play (particularly the case for culturally and ethnically specific audiences) ¯ entertainment value, which is defined differently for each person (some
look for humor, while others seek education)
Under pressure to increase ticket sales, target marketing efforts became more sophisticated during the 1980s, including both direct mail and tele

36 I American Participation in Theater
marketing. Nonprofit professional theaters now routinely use telemarketing to support subscription renewal and acquisition campaigns. Direct mail efforts, as well, have become more sophisticated, with more theaters using so-called "microtargeting" or "precision-marketing" techniques based on geodemographic market segmentation schemes which permit targeting at the ZIP+4 level of geography (10-15 households).
In the early 1980s theaters generally offered one or possibly two different subscription packages, often using only one letter or brochure. Over the intervening years creative approaches have become far more sophisticated. Hartford Stage, for example, offered four different subscription packages in 1994, using nine different introductory letters depending on the target segment. The packages ranged from a traditional full-season subscription to smaller series packages with specific price options.
One packaging option that has been widely adopted by theaters is the "flex pass," which allows the selection of a number of plays in the season without committing to specific performance dates. People’s Light & Theater Company of Malvern, Pennsylvania, offers six-, eight-, and ten-pass packages. Patrons can buy two types of coupons, one redeemable for performances Tuesday through Thursday and another for performances any day of the week. Coupons may be redeemed in any combination, all at one performance or throughout the season.
"Sampler" packages (series tickets to programs offered by several different arts organizations) are increasingly used by theaters to attract new audiences and to respond to the "cultural grazing" phenomenon among the more fickle audience segments. Such a package might combine theater tickets with ballet, opera, and a six-month membership to a museum. Research at the local level points to declining audience loyalty and an increased desire among less frequent arts attenders to interact with a single source of information about arts programs.
Searching for low-cost alternatives to paid advertising and expensive brochures, many nonprofit theaters have turned to grass-roots marketing. For example, to increase word-of-mouth promotion for its shows, the Guthrie Theater in Minneapolis established a promotion inviting hairdressers to preview performances.

Future Participation in Theater
Wtill public participation in non-musical theater continue to grow? Will he notion of "traditional" theater audiences become obsolete? Ten
years from now the field will have endured another decade of change. New theaters will open and others will fold; playwrights, directors, and actors will speak out in new ways; the funding climate will inevitably change; and new communications technology will create possibilities for both theaters and audiences.
How will the theater make itself relevant to an increasingly diverse public? Continued development of culturally and ethnically specific work as well as an increased focus on arts in education are long-term responses that bode well for the field. One of the most potent findings from ten years of arts participation research is that socialization into the arts as a child is critical to future participation as an adult. Thus a successful long-term audience development strategy for the theater field necessarily includes expanded performance opportunities for children and their families through outreach, school performances, and other programs.
From a marketing perspective, the greatest challenges to managers relate to inducing first-time attendance, creating marketing and programmatic "points of entry," and targeting promotional efforts to a variety of audience segments with different interest levels and lifestyles. Adoption of improved marketing techniques--some requiring extensive technical knowledge--suggests a skills development challenge for individual managers and the field in general (including those who market touring commercial productions), as well as a commitment to learning about theater audiences through research.
Will the trend toward more performances of fewer productions continue? Much depends on the resources made available to theaters, playwrights, and performers to develop new work. Most likely the rising costs of producing and touring professional theater, coupled with changes in the funding mix for nonprofit theaters, will create even more pressure on earned income. However, it is the developmental component of theater--free of commercial expectations-that ultimately creates renewal. Audiences will continue to change and grow if new works (and old works infused with new relevancy)
37

38 I American Participation in Theater
bring the lives of more Americans closer to the theater. Responsibility for creating new plays rests not only with the nonprofit theater but also with commercial producers, the funding community, and ultimately the audience itself.

Appendix A
1992 Survey of Public Participation in the Arts
INTRODUCTION - Now I have some questions about your leisure activities. The Bureau of the Census is collecting this information for the National Endowment for the Arts. The survey isauthorized by Title 20, United States Code, section 954 and Title 13, United States Code, section 8. Your participation in this interview is voluntary and there are no penalties for not answering some or all of the questions. (If PERSONAL INTERVIEW, hand respondent the Privacy Act Statement, SPPA- 13.) ~
1. The following questions are about YOUR 5. (With the exception of elementary or highactivities during the LAST 12 months-- school performances,) Did you go to a livebetween 1, 19 __, and performance of a non-musical stage play.... 19 __. during the LAST 12 MONTHS?
~ o~3No Yes - About how many times did you doWith the exception of elementary or high this during the LAST 12 MONTHS?school performances, did YOU go to a live
jazz performance during the LAST 12 ~ MONTHS? ~ Number of times
~ o[~No 6. (With the exception of elementary or high Yes - About how many times did you do school performances,) Did you go to a live
this during the LAST 12 MONTHS? ballet performance during the LAST 12MONTHS?
~ o[~NoNumber of times Yes - About how many times did you do 2. (With the exception of elementary or high this during the LAST 12 MONTHS?
school performances,) Did you go to a live ~ classical music performance such assymphony, chamber, or choral music Number of timesduring the LAST 12 MONTHS?
~ o[]No 7. (With the exception of elementary or highschool performances,) Did you go to a live
Yes - About how many times did you do dance performance other than ballet, such this during the LAST 12 MONTHS? as modern, folk, or tap during the LAST 12
MONTHS? ~ o[]No
Number of times Yes - About how many times did you do this during the LAST 12 MONTHS?
~ 3. (With the exception of elementary or high
school performances,) Did you go to a live ~ opera during the LAST 12 MONTHS? ~ Number of times
~ 0[~}No 8. (During the LAST 12 MONTHS,) Did you Yes - About how many times did you do visit an ART museum or gallery?
this during the LAST 12 MONTHS? ~ 0[~]No ~ Yes - About how many times did you do Number of times this during the LAST 12 MONTHS?
4. (With the exception of elementary or highschool performances,) Did you go to a live ~ Number of times musical stage play or an operetta during 9. (During the LAST 12 MONTHS,) Did you the LAST 12 MONTHS? visit an ART fair or festival, or a CRAFT fair
~ o[’-INo or festival? Yes - About how many times did you do ~ 0[-~No
this during the LAST 12 MONTHS? Yes -About how many times did you do this during the LAST 12 MONTHS?
[~ Number of times ~ Number of times
39
40 I American Participation in Theater
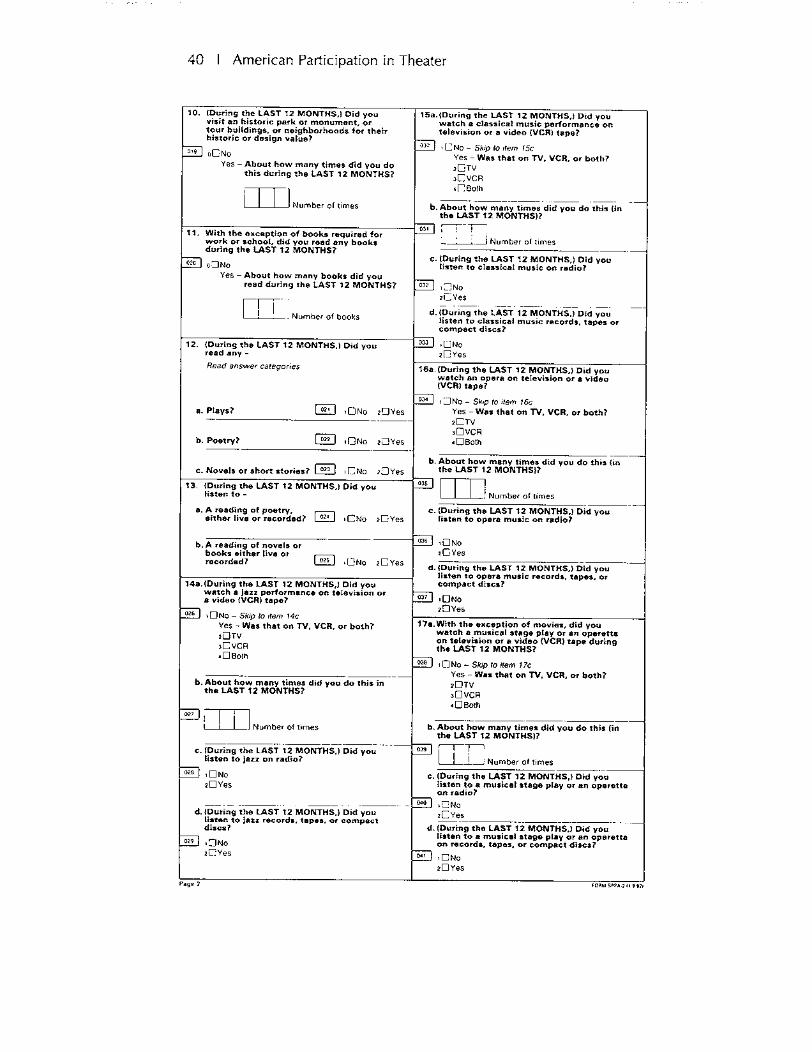
10. (During the LAST 12 MONTHS,) Did youvisit an historic park or monument, ortour buildings, or neighborhoods for their historic or design value?
~ 0r~N0 Yes - About how many times did you do
this during the LAST 12 MONTHS?
~ Number of times
11. With the exception of books required forwork or school, did you read any booksduring the LAST 12 MONTHS?
~ oE]No Yes - About how many books did you
read during the LAST 12 MONTHS?
~ Number of books
12. (During the LAST 12 MONTHS,) Did youread any -Read answer categories
a. Plays? [-~ ~E3No 2r~Yes
b. Poetry? [~ ~[]No 2[]Yes
c. Novels or short stories? ~ ~[~No 2[]Yes 13. (During the LAST 12 MONTHS,) Did you
listen to
a. A reading of poetry,either live or recorded? [~ 1r-]No 2[~Yes
b. A reading of novels orbooks either live or recorded? [-~ d~No 2[~ Yes
14a.(During the LAST 12 MONTHS,) Did youwatch a jazz performance on television ora video (VCR) tape?
d~No - Skip to item 14c Yes - Was that on W, VCR, or both? ~[]TV 3[~VCR 4E]Both
About how many times did you do this inthe LAST 12 MONTHS?
Number of times
c. (During the LAST 12 MONTHS,) Did youlisten to jazz on radio?
~ ,rnNo 2[~Yes
d.(During the LAST 12 MONTHS,) Did youlisten to jazz records, tapes, or compactdiscs?
3~]Yes
Page 2
15a.(During the LAST 12 MONTHS,) Did youwatch a classical music performance on television or a video (VCR) tape?
~[]No - Skip to item 15c Yes - Was that on TV, VCR, or both? 2r~TV 3E~VCR 4~]Both
b. About how many times did you do this (inthe LAST 12 MONTHS)?
~ Number of times
(During the LAST 12 MONTHS,) Did you listen to classical music on radio?
~]No 2~]Yes
{During the LAST 12 MONTHS,) Did youlisten to classical music records, tapes orcompact discs?
16a.(During the LAST 12 MONTHS,) Did youwatch an opera on television or a video(VCR) tape?
~]No - Skip to item 16c Yes - Was that on I"V, VCR, or both? 2[]TV ~r-IVCFI 4 [] Both
b. About how many times did you do this (in the LAST 12 MONTHS)?
~ Number of times
c. (During the LAST 12 MONTHS,) Did youlisten to opera music on radio?
~No 2[~Yes
d. (During the LAST 12 MONTHS,) Did youlisten to opera music records, tapes, orcompact discs?
,[~No 2[]Yes
17a.With the exception of movies, did youwatch a musical stage play or an operetta on television or a video (VCR) tape duringthe LAST 12 MONTHS?
l[]No - Skip to item 17c Yes - Was that on TV, VCR, or both? 2[]TV 3[]VCR 4 [] Both
b. About how many times did you do this (in the LAST 12 MONTHS)?
~ Number of times
c. (During the LAST 12 MONTHS,) Did you listen to a musical stage play or an operettaon radio?
~[]Yes d. (During the LAST 12 MONTHS,) Did you
listen to a musical stage play or an operetta on records, tapes, or compact discs?
~ ,[]No 2[]Yes

1992 Survey of Public Participation in the Arts I 41
"18a. With the exception of movies, situationcomedies, or TV series did you watch anon-musical stage play on television or a video(VCR) tape during the LAST 12 MONTHS?
Yes - Was that on TV, VCR, or both? 2r~TV 3[-]VCR 4 [] 8ot h
b. About how many times did you do this (in theLAST 12 MONTHS)?
Number of times
c. (During the LAST 12 MONTHS,) Did you listento a radio performance of a non-musical stageplay?
~ ~[]No 2 ~lYes
19a.With the exception of music videos, did youwatch on television or a video (VCR) tapedance such as ballet, modern, folk, or tap during the LAST 12 MONTHS?
Yes - Was that on TV, VCR, or both?
3[]VCR ,~ [] Both
b. About how many times did you do this (in the LAST 12 MONTHS)?
Number of times
20a¯(During the LAST 12 MONTHS,) Did you watch a program about artists, art works, or artmuseums on television or a video (VCR) tape?
Yes - Was that on TV, VCR, or both?
3t-IVCR 4[]Both
b. About how many times did you do this (inthe LAST 12 MONTHS)?
Number of times
21a.l’m going to read a list of events that somepeople like to attend. If you could go to any ofthese events as often as you wanted, whichones would you go to MORE OFTEN than youdo nov,’? I’ll read the list. Go to -
Mark (X) all that apply.
~ l~lJazz music performances 2[]Classical music performances 3 [] Operas 4 [] Musical plays or operettas s [] Non-musical plays s[] Ballet performances 7(~Dance performances other than ballet 8~)Art museums or galleries 9[]None of these - Skip to item 22a
If only one is chosen, skip to item 22a. If more than one is chosen, ask
b. Which of these would you like to do most?
~ [~Category number
0o[]No one thing most
22a.The following questions are about yourparticipation in other leisure activities.
Approximately how many hours of televisiondo you watch on an average day?
Number of hours
b. During the LAST 12 MONTHS, did YOU goout to the movies?
~[]Yes
c. With the exception of youth sports, did yougo to any amateur or professional sportsevents during the LAST 12 MONTHS?
~ ,[]No ~[]Yes
During the LAST 12 MONTHS, did you go to an amusement or theme park, a carnival, or a similar place of entertainment?
During the LAST 12 MONTHS, did you jog,lift weights, walk, or participate in any otherexercise program?
,[]No ~[]Yes
During the LAST 12 MONTHS, did youparticipate in any sports activity, such as softball, basketball, golf, bowling, skiing, ortennis?
g. Did you participate in any outdoor activities,such as camping, hiking, or canoeing during the LAST 12 MONTHS?
~-~ l[]N0 8~Yes
h. Did you do volunteer or charity work during the LAST 12 MONTHS?
~ , I-q NO 2r’qYes
Did you make repairs or improvements onyour own home during the LAST 12 MONTHS?
1[]No 2E]Yes
Did you work with indoor plants or do anygardening for pleasure during the LAST 12MONTHS?
~C]No ~[]Yes
23a.(During the LAST 12 MONTHS,) Did you workwith pottery, ceramics, jewelry, or do anyleatherwork or metalwork?
1 [] NO - Skip to item 24a 2[]Yes
b. Did you publicly display any of your works?
~ ,[]No ~[]Yes

42 I American Participation in Theater
24a.(During the LAST 12 MONTHS,) Did you doany weaving, crocheting, quilting,needlepoint, or sewing?
~ [] No - Skip to item 25a 2r~Yes
b. Did you publicly display any of your works?
~ ~[]No 2[]Yes
25a.(During the LAST 12 MONTHS,) Did youmake photographs, movies, or video tapesas an artistic activity?
~ ~[~]No - Skip toitem26a 2[~Yes
b. Did you publicly display any of your works?
~ ,[]No 2[]Yes
26a.(During the LAST 12 MONTHS,) Did you doany painting, drawing, sculpture, orprintmaking activities?
~ ~ [] NO - Skip to item 27a 21--1Yes
b. Did you publicly display any of your works?
~ ,[]No 2[]Yes
27a.With the exception of work or school, did youdo any creative writing such as stories, poems, or plays during the LAST 12 MONTHS?
~ tr~No - Skip to item 28a 2[-~Yes
b. Were any of your writings published?
~ ~I~No 2~Yes
28aoDid you write or compose any music during the LAST 12 MONTHS? ,r-lNo - Skip to item 29a 2~]Yes
b.Was your musical composition played in a public performance or rehearsed for a publicperformance?
~ ,~No 2[]Yes
29a.Do you own any original pieces of art, suchas paintings, drawings, sculpture, prints, orlithographs?
~ ~ [] No - Skip to item 30a 2[]Yes
b.Did you purchase or acquire any of these pieces during the LAST 12 MONTHS?
~ ~No 2r-]Yes
30a.During the LAST 12 MONTHS, did youperform or rehearse any jazz music?
~ d~No - Skip to item 31a 21-3Yes
Page 4
30b.Did you play any jazz in a public performanceor rehearse for a public performance?
~ ~[]No 2[]Yes
31a. During the LAST 12 MONTHS, did you playany classical music?
~ d’-]No - Skip to item 32a 271Yes
b. Did you play classical music in a publicperformance or rehearse for a public performance?
~Yes
32a. During the LAST 12 MONTHS, did you sing anymusic from an opera?
~ []No - Skip to item 33a 2[~Yes
b.Did you sing in a public opera performance or rehearse for a public performance?
~ ~[]No2[~Yes
33a.During the LAST 12 MONTHS did you lingmusic from ¯ musical play or operetta?
~ [] No - Skip to item 33c 21-]Yes
Did you sing in a public performance of amusical play or operetta or rehearse for apublic performance?
d-lNo 2~]Yes
During the LAST 12 MONTHS, did you sing ina public performance with a chorale, choir,or glee club or other type of vocal group, orrehearse for a public performance?
(During the LAST 12 MONTHS,) Did you act in apublic performance of a non-musical play or rehearse for a public performance?
~[]No 2[~]Yes
35a.(During the LAST 12 MONTHS,) Did you danceany ballet?
~-~ 1 ~No - Skip to item 36a 2[]Yes
b. Did you dance ballet in a public performance or rehearse for a public performance?
~ ,[]No ~Ye~
36a.(During the LAST 12 MONTHS,) Did you do anydancing other than ballet such as modern, folkor tap?
1[]No - Skip to item 37a 2[~Yes
b.Did you dance modern, folk, or tap in apublic performance?
~ 1[]No 2[]Yes

1992 Survey of Public Participation in the Arts I 43
37a.l’m going to read a list of some types of music. As I read the list, tell me which ofthese types of music you like to listen to? Mark (X) all that apply.
~ ~ []Classical/Chamber music 2 [] Opera 3QOperetta/Broadway musicals/Show tunes 4 [] Jazz s [] Reggae (Reg 6[]Rap music
~ 7[]soul B[~Blues/Rhythm and blues 9 [~ Lat in/Spanish/Sa Isa
~ ~0[]Big band ~ ~ [] Parade/Marchlng band ~2 [] Country-western
~ 19[] Bluegrass~[]Rock ts[]The music of a particular Ethnic/
National tradition ~6 [] Contemporary folk music~ ~7[]Mood/Easy listening ~[~New age music
~ ~9~]Choral/Glee club~0~] Hymns/Gospel 2~[]AII ~ [] None/Don’t like to ~isten to music - Skip to item 38a
If only one category is marked in 37a, enter code in37b without asking. Which of these do you likebest?
~ Category number
00[] No one type best
3Be.Have you EVER taken lessons or classes in music - either voice training or playing aninstrument?
~I~No - Skip to item 39a 2~Yes
b.Did you take these lessons when you were -Read categories. (Do not read category 4 ifrespondent is under 25 years old.) Mark (X) all that apply,
~ ~lLess than 12 years old 2[] 12-17 years old ~[]18-24 years old ~1~25 or older
Refer to item 38b Is box 1 or 2 marked in item 38b? r-1 No - Skip to Check Item B [] Yes - Ask item 38c
38c.Were these lessons or classes offered by the elementary or high school you wereattending or did you take these lessonselsewhere?
~ ~ []Elementary/high school 2 [] Elsewhere 3[]Both
Refer to item 38b
If box 4 is marked in item 38b, ASK item 38d. If not- Is box 2 or 3 marked in item 38b AND the respondent is under 25 years old? [] No - Skip to ~tem 39a []Yes - Ask item 38d
38d.Did you take any of these lessons orclasses in the past year?
~0~ ~F3No 2{~]Yes
39a.(Have you EVER taken lessons or classes) in visual arts such as sculpture, painting, print making, photography, or film making?
~ ~ ~,No - Skip to item 40a ~Yes
b. Did you take these lessons when you were -Read categories. (Do not read category 4 ifrespondent is under 25 year5 old.) Mark (X) all that apply
~ ~[]Less than 12 years old ~12-17 years old 3~ 18-24 years old 4~25 or older
Refer to item 39b Is box 1 or 2 marked m item 39b7 []No - Skip to Check Item D I~Yes - Ask item 39c
39c.Were these lessons or classes offered by the elementary or high school you wereattending or did you take these lessons elsewhere?
[]Elementary/high school [] Elsewhere [] Both
Refer to item 39b If box 4 is marked in item 39b, ASK item 39d.
If not - Is box 2 or 3 marked in item 39b AND the respondent is under 25 years old; []No - Skip to item 40a [] Yes - Ask item 39d
39d.Did you take any of these lessons or classesin the past year?
40a.(Have you EVER taken lessons or classes) in acting or theater?
~ ~[]No - Skip to item 41a 2[]Yes
Did you take these lessons when you were -Read categories. (Do not read category 4 if respondent is under 25 years old.) Mark (X) all that apply.
~-~ 1[]Less than 12 years old ~[]12-17 years old 3[] 18-24 years old 4[]25 or older
Refer to item 40b Is box 1 or 2 marked in item 40b? E~No - Skip to Check Item F []Yes - Ask item 40c
40c. Were these lessons or classes offered by theelementary or high school you were attending or did you take these lessonselsewhere?
~ ~[]Elementary/high school 2 [] Elsewhere 3 [] Both

44 I American Participation in Theater
Refer to item 40b
If box 4 is marked in item 40b, ASK item 40d. If not - Is box 2 or 3 markP, d in item 40b ANDthe respondent is under 25 years old? ~]No - Skip to item 41a [~Yes - Ask item 40d
40d.Did you take any of these lessons or classesin the past year?
41a.(Have you EVER taken lessons or classes) in ballet?
~ ~ []No - Skip to item 42a 2[]Yes
b. Did you take these lessons when you were -Read categories. (Do not read category 4 ifrespondent is under 25 years old.)Mark (X) all that apply.
~ d~Less than 12 years old 2[]12-17 years old 3[] 18-24 years old 4[]25 or older
Refer to item 41b Is box 1 or 2 marked in item 41b? [] No - Skip to Check Item H [] Yes - Ask item 41c
41c.Were these lessons or classes offered by theelementary or high school you were attending or did you take these lessonselsewhere?
~ ~ []Elementary/high school 2 [] Elsewhere 3[]Both
Refer to item 41b if box 4 is marked in item 41b, ASK item 41d.
If not - Is box 2 or 3 marked in item 41b ANDthe respondent is under 25 years old? -[] No - Skip to item 42a []Yes - Ask item 41d
41d. Did you take any of these lessons or classesin the past year?
2[]Yes
42a.(Have you EVER taken lessons or classes) indance, other than ballet such as modern, folkor tap?
~[]No - Skip to item 43a 2[]Yes
b. Did you take these lessons when you were -Read categories. (Do not read category 4 ifrespondent is under 25 years old.)Mark (X) all that apply.
~ ~[]Less than 12 years old 2[]12-17 years old 31~ t8-24 years old 4[~25 or older
Refer to item 42b Is box 1 or 2 marked in item 42b? [] No - Skip to Check Item J [~]Yes - Ask item 42c
42c. Were these lessons or classes offered by theelementary or high school you were attending or did you take these lessonselsewhere?
~ ~ []Elementary/high school 2 [] Elsewhere 3[] Both
Refer to item 42b
If box 4 is marked in item 42b, ASK item 42d.
If not - is box 2 or 3 marked in item 42b AN~D the respondent is under 25 years old? I~No - Skip to item 43a rqYes - Ask item 42d
42d. Did you take any of these lessons or classes in the past year?
~ ,[]No ~]Yes
43a.Have you EVER taken lessons or classes increative writing?
~ [] NO - Skip to item 44a 2~lYes
b. Did you take these lessons when you were -Read categories. (Do not read category 4 ifrespondent is under 25 years old.)Mark (X) all that apply.
~2~ , [] Less than 12 years old 21~12-17 years old 31~ 18-24 years old ~]25 or older
Refer to item 43b Is box 1 or 2 marked in item 43b? ~-’~No - Skip to Check Item L [~Yes - Ask item 43c
43c.Were these lessons or classes offered by the elementary or high school you wereattending or did you take these lessonselsewhere?
~ ~C]Elementary/high school ~[] Elsewhere 3[~]Both
Refer to item 43b If box 4 is marked in item 43b, ASK item 43d. If not - Is box 2 or 3 marked in item 43b AN..._~D the respondent is under 25 years old? [] No - Skip to item 44a []Yes - Ask item 43d
43d.Did you take any of these lessons or classesin the past year?
~ , F-]No 2r-IYes
44a.(Have you EVER taken a class) in artappreciation or art history?
~ [] No - Skip to item 45a 2[~Yes
b. Did you take this class when you were -Read categories. (Do not read category 4 ifrespondent is under 25 years old.)Mark (X) all that apply.
~ ~[]Less than 12 years old ~[]12-17 years old ~r~ 18-24 years old ~[-]25 or older

1992 Survey of Public Participation in the Arts [ 45
Refer to item 44b Is box 1 or 2 marked in item 44b? [] No - Skip to Check Item N []Yes - Ask item 44c
44c.Was this class offered by the elementary or high school you were attending or did youtake this class elsewhere?
~ ~[Elementa~/high school 2 [] Elsewhere 3 [] Both
Refer to item 44b
If box 4 is marked in item 44b, ASK item 44d. If not - Is box 2 or 3 marked in item 44b AND the respondent is under 25 years old? [] NO - Skip to item 45a []Yes - Ask item 44d
44d.Did you take any of these lessons or classesin the past year?
45a.(Have you EVER taken a class) in musicappreciation?
~ ~ [] NO - Skip to item 46a 2[~Yes
b. Did you take this class when you were -Read categories. (Do not read category" 4 ifrespondent is under 25 years old.)Mark (X) a/I that app/y.
~ l~]Less than 12 years old 2[]12-17 years old 3[] 18-24 years old ~[]25 or older
Refer to item 45b Is box 1 or 2 marked in item 45b? I~l NO - Skip to Check Item P [~Yes - Ask item 45c
Notes
45c.Was this class offered by the elementary orhigh school you were attending or did youtake this class elsewhere?
~[] Elementary/high school ~ [] Elsewhere 3 [] Both
Refer to item 45b
If box 4 is marked in item 45b, ASK item 45d. If not- Is box 2 or 3 marked in item 45b AND the respondent is under 25 years old? [] No - Skip to item 46a []Yes - Ask item 45d
45d.Did you take this class in the past year?
~ ~[]No ~[]Yes
46a, What is the highest grade (or year) of regular school your FATHER completed?
~ 0~ []7th grade or lees o2[]8th grade o3[]9th-1 lth grades o~[~ 12th grade os[]College (did not complete) 0~Completed college (4+ years) oT[]Post graduate degree (M.A., Ph.D., M.D., J.D., etc.) o~ Don’t know
b. What is the highest grade (or year) of regularschool your MOTHER completed?
~ o~ []7th grade or less o2[]Sth grade o3[]9th-1 lth grades o~ [] 12th grade os[~College (did not complete) ~[]Completed college (4+ years) oT[]Post graduate degree (M.A., Ph.D., M.D., J.D., etc.) c~[~ Don’t know
Is this the LAST household member to be interviewed?
~]No - Go back to the NCS-I and ~nterview the next eligible NCS household member
[]Yes - END INTERVIEW

Notes
1. Summary Report: 12 Local Surveys of Public Participation in the Arts, Research Division Report #26, National Endowment for the Arts, 1993.
2. A change in the participation rate of 1.6 percentage points is not statistically significant at the 95% level of confidence. In other words, it is possible that this change is due to random error associated with the sampling procedure employed by the Census Bureau.
3. In 1995 the NEA commissioned a study of first-time opera attenders at ten different opera companies.
4. John Robinson, Survey of Public Participation in the Arts: 1985, National Endowment for the Arts, 1987.
5. Further discussion of this idea may be found in Summary Report." 12 Local Surveys of Public Participation in the Arts, Research Division Report #26, National Endowment for the Arts, 1993.
6. LATP classifies production as new plays, play revivals, new musicals, musical revivals, special attractions, and return shows.

About the Author
AMS Planning & Research Corp. is a management consulting practice in
volved in the planning and development of arts projects and programs of all types. With offices in Connecticut, Michigan, and California, the firm provides services in the areas of cultural facility development, organizational design and development, strategic planning, program evaluation, and market research.
AMS Planning & Research Corp. 2150 Post Road, 2nd Floor Fairfield, CT 06430 (203) 256-1616
47

Other Reports on Arts Participation
T he most recent nationwide survey of arts participation was conducted in 1992. The following publications report on various aspects of the 1992
Survey of Public Participation in the Arts.
Public Participation in the Arts: 1982 and 1992, Research Division Note #50. A 10-page summary comparing the results of the 1982 and 1992 surveys.
Arts Participation in America: 1982-1992, Research Division Report #27. A more detailed discussion (100 pp) of the 1982 and 1992 surveys.
Research Division Notes #51, #52, and #55 provide brief summaries of data on demographic information for the live broadcast and recorded media audiences and on regional and metropolitan audiences. Research Division Notes and Report #27 are available from The Research Division, National Endowment for the Arts, 1100 Pennsylvania Avenue NW, Washington, DC 20506.
The Research Division of the Arts Endowment has been studying trends in the size and characteristics of arts audiences for two decades. A complete description of the Division’s work in this area through the most recent nationwide study, Survey of Public Participation in the arts, 1992, is contained in A Practical Guide to Arts Participation Research, Research Division Report #30. This report is available through the National Assembly of Local Arts Agencies, 927 15th Street NW, 12th Floor, Washington, DC 20005, (202) 371-2830.
The Division has also funded fifteen monographs that analyzed various aspects of the 1992 and 1982 surveys. Each of these documents, which are listed below, are being deposited in the Educational Research Information Center (ERIC) system to facilitate distribution.
Age Factors in Arts Participation, Richard A. Peterson and Darren E. Sherkat
American Dance 1992: Who’s Watching? Who’s Dancing? Jack Lemon/Jack Faucett Associates
American Participation in Opera and Musical Theater-1992, Joni Maya Cherbo and Monnie Peters
48

Other Reports on Arts Participation I 49
American Participation in Theater, Chris Shrum/AMS Planning and Research
Americans" Personal Participation in the Arts, Monnie Peters and Joni Maya Cherbo
Arts Participation and Race/Ethnicity, Jeffrey Love and Bramble C. Klipple
Arts Participation by the Baby Boomers, Judith Huggins Balfe and Rolf Meyersohn
Cross-Over Patterns in Arts Participation, Richard J. Orend and Carol Keegan
Education and Arts Participation: A Study of Arts Socialization and Current Arts-Related Activities, Richard J. Orend and Carol Keegan
The Effects of Education and Arts Education on Adult Participation in the Arts,: An Analysis of the 1992 Survey of Public Participation in the Arts, Louis Bergonzi and Julia Smith
Hold the Funeral March: The State of Classical Music Appreciation in the U.S., Nicholas Zill
Jazz in America: Who’s Listening? Scott DeVeaux
Patterns of Multiple Arts Participation, Jeffrey Love
Reading in the 1990s: Turning a Page or Closing the Books? Nicholas Zill
Tuning In and Turning On: Public Participation in the Arts via Media in the United States, Charles M. Gray
Seven of these have been condensed and published by Seven Locks Press as the following:
Research Division Report #31: Jazz in America: Who’s Listening? Scott DeVeaux
Research Division Report #32: American Participation in Opera and Musical Theater, 1992, Joni Maya Cherbo and Monnie Peters

50 I American Participation in Theater
Research Division Report #33: Turning On and Tuning In: Media Participation in the Arts, Charles M. Gray
Research Division Report #34: Age and Arts Participation with a Focus on the Baby Boom Cohort, Richard A. Peterson, Darren E. Sherkat, Judith Huggins Balfe, and Roll Meyersohn
Research Division Report #35: American Participation in Theater, AMS Planning & Research Corp.
Research Division Report #36: Effects of Arts Education on Participation in the Arts, Louis Bergonzi and Julia Smith

NATIONAL ISBN 0-q29765-46-XENDOWMENT FOR THE ARTS
Seven Locks Press Santa Ana, California