[american institute of aeronautics and astronautics 47th aiaa/asme/asce/ahs/asc structures,...
TRANSCRIPT

Influence of porosity on the interlaminar shear
strength of fibre-metal laminates
Claudio S. Lopes∗, Joris J.C. Remmers† and Zafer Gurdal‡
Faculty of Aerospace Engineering, Delft University of Technology, 2629HS Delft, The Netherlands
Structures made out of fibre-metal laminates (e.g. Glare) have been designed consideringideal mechanical properties determined by the Classical Laminate Theory, i.e. assuming
perfect bonding conditions between layers. However, more than often perfect interfacesare not achieved or their quality is not guaranteed. When in laboratory, high-qualityfibre-metal laminates are easily produced, but in the production line the complicated man-ufacturing process becomes difficult to control and the outcome products may not meetthe quality expected. One of the consequences may be poor adhesion of metal-prepreg orprepreg-prepreg as the result of porosity, i.e. trapped air bubbles which were not allowedto flow out during the curing process.
The Interlaminar Shear Strength (ILSS) of fibre-metal laminates decreases consider-ably as a result of insufficient adhesion between layers due to porosity. Small voids, or de-
laminations, lead to stress concentrations at the interface which may trigger delamination-propagation at the aluminum-prepreg and prepreg-prepreg interfaces at load levels signif-icantly lower than what is achievable for perfectly bonded interfaces. Mechanical experi-ments show a drop of 30% of the ILSS in the worst-case scenario tested.
In the present work, the effects of manufacturing-induced porosity on the ILSS offibre-metal laminates are studied using a numerical approach. The individual layers are
modelled by continuum elements, whereas the interfaces are modelled by cohesive elementswhich are equipped with a decohesion law to simulate debonding. Porosity is included inthe geometry of the interface by setting some of these elements to a pre-delaminated state.
I. Introduction
The influence of porosity on the ultimate strength of fibre-metal laminates could be observed in mechanicaltests (Fig. 1) Unfortunately, it is difficult to exactly control the amount and configuration of porosity
at the interfaces of the test specimen. Hence, an in-depth investigation of the effect of porosity in multipleinterfaces to the overall ILSS is not possible. Finite element analyses can be of assistance in this case. Theyrepresent a relatively fast and inexpensive tool in the analysis of structurally loaded components.
Over the last years a great effort has been made to implement fracture mechanics phenomena for thesimulation of delamination growth in laminated materials on a mesoscopic level of observation.1–3 Thiseffort has led to the development of reliable numerical tools capable of dealing with delamination onset andpropagation under a large variety of loading modes. In the present work these advanced tools are used tostudy the structural effects of interface porosity by actually including voids in the geometry of the interface.As opposed to the use of adhesion degradation parameters at a material level, this approach leads to thecorrect prediction of the location of delamination onset and a correct prediction of the ILSS.
Delamination growth in the different prepreg-prepreg and aluminum-prepreg interfaces is simulated bycohesive elements.2,3 These are a numerical implementation of the cohesive zone approach in which theenergy involved in the delamination process is being dissipated in a small ”process region” ahead of thecrack tip. The opening of the cohesive zone is governed by a mixed-mode delamination model,2,3 whichaccounts for both mode I (normal) and mode II (shear) delaminations and combinations thereof.
∗Ph.D. Student, Aerospace Structures Chair.†Assistant professor, Engineering Mechanics Chair, AIAA member.‡Aerospace Structures Chair, AIAA senior member.
1 of 14
American Institute of Aeronautics and Astronautics
47th AIAA/ASME/ASCE/AHS/ASC Structures, Structural Dynamics, and Materials Confere1 - 4 May 2006, Newport, Rhode Island
AIAA 2006-2254
Copyright © 2006 by Claudio Lopes, Joris Remmers, Zafer Gurdal. Published by the American Institute of Aeronautics and Astronautics, Inc., with permission.
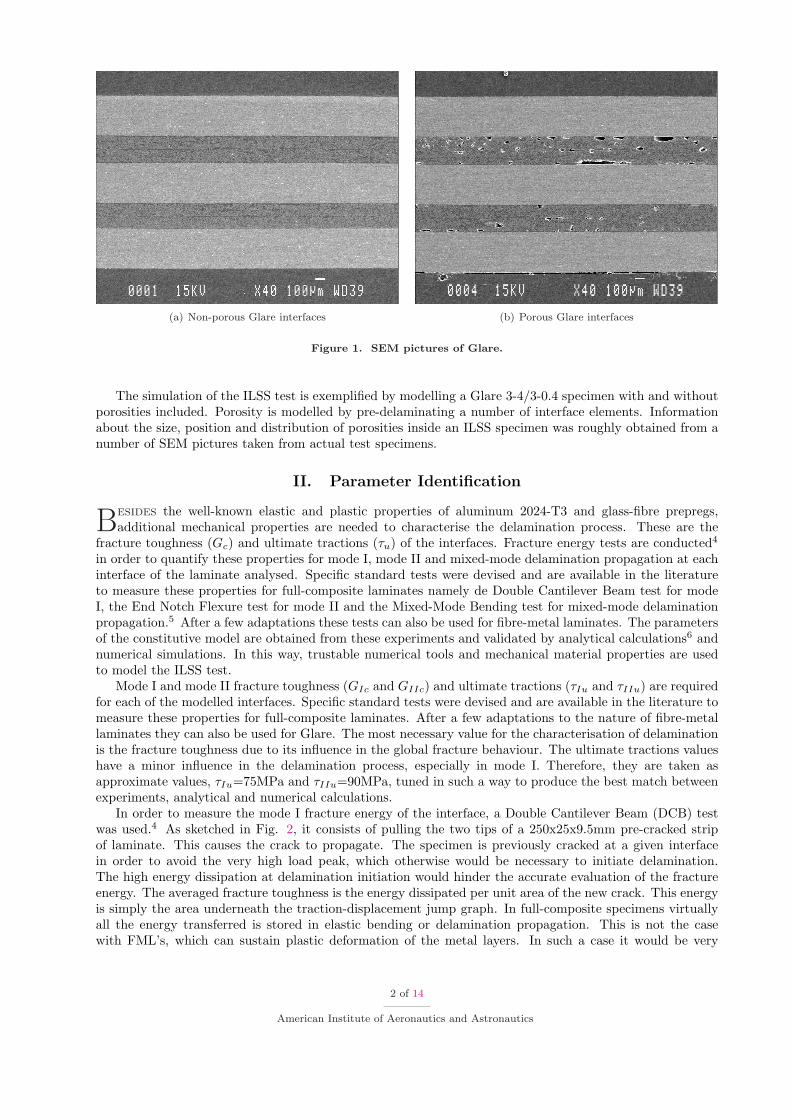
(a) Non-porous Glare interfaces (b) Porous Glare interfaces
Figure 1. SEM pictures of Glare.
The simulation of the ILSS test is exemplified by modelling a Glare 3-4/3-0.4 specimen with and withoutporosities included. Porosity is modelled by pre-delaminating a number of interface elements. Informationabout the size, position and distribution of porosities inside an ILSS specimen was roughly obtained from anumber of SEM pictures taken from actual test specimens.
II. Parameter Identification
Besides the well-known elastic and plastic properties of aluminum 2024-T3 and glass-fibre prepregs,additional mechanical properties are needed to characterise the delamination process. These are the
fracture toughness (Gc) and ultimate tractions (τu) of the interfaces. Fracture energy tests are conducted4
in order to quantify these properties for mode I, mode II and mixed-mode delamination propagation at eachinterface of the laminate analysed. Specific standard tests were devised and are available in the literatureto measure these properties for full-composite laminates namely de Double Cantilever Beam test for modeI, the End Notch Flexure test for mode II and the Mixed-Mode Bending test for mixed-mode delaminationpropagation.5 After a few adaptations these tests can also be used for fibre-metal laminates. The parametersof the constitutive model are obtained from these experiments and validated by analytical calculations6 andnumerical simulations. In this way, trustable numerical tools and mechanical material properties are usedto model the ILSS test.
Mode I and mode II fracture toughness (GIc and GIIc) and ultimate tractions (τIu and τIIu) are requiredfor each of the modelled interfaces. Specific standard tests were devised and are available in the literature tomeasure these properties for full-composite laminates. After a few adaptations to the nature of fibre-metallaminates they can also be used for Glare. The most necessary value for the characterisation of delaminationis the fracture toughness due to its influence in the global fracture behaviour. The ultimate tractions valueshave a minor influence in the delamination process, especially in mode I. Therefore, they are taken asapproximate values, τIu=75MPa and τIIu=90MPa, tuned in such a way to produce the best match betweenexperiments, analytical and numerical calculations.
In order to measure the mode I fracture energy of the interface, a Double Cantilever Beam (DCB) testwas used.4 As sketched in Fig. 2, it consists of pulling the two tips of a 250x25x9.5mm pre-cracked stripof laminate. This causes the crack to propagate. The specimen is previously cracked at a given interfacein order to avoid the very high load peak, which otherwise would be necessary to initiate delamination.The high energy dissipation at delamination initiation would hinder the accurate evaluation of the fractureenergy. The averaged fracture toughness is the energy dissipated per unit area of the new crack. This energyis simply the area underneath the traction-displacement jump graph. In full-composite specimens virtuallyall the energy transferred is stored in elastic bending or delamination propagation. This is not the casewith FML’s, which can sustain plastic deformation of the metal layers. In such a case it would be very
2 of 14
American Institute of Aeronautics and Astronautics

difficult to quantify the amount of energy actually spent on the fracture process. In order to maintain thewhole specimen in the elastic regime two 4mm thick plates of aluminium 7075-T6 were bonded to the Glare3-2/1-0.4 strip.
Figure 2. Illustration of a DCB test. For this configuration a 50mm long pre-crack is included at the prepreg-prepreg interface.
The mode II fracture energy was measured with the End Notch Flexure (ENF) test.4 A similar, initiallycracked, specimen is used but now subjected to a 3-point bending situation where the loading point issituated at 80mm of each support. The delamination in this case is not progressive, but rather catastrophicsuch that, once the delamination is started, the crack rapidly grows to the centre of the specimen. Suchevent produces a great decrease in bending stiffness, which results in a remarkable load drop. This makesthe measurement of GIIc more delicate than GIc.
Figure 3. MMB test apparatus.3
Mode I and mode II delaminations are particular examples of the wide range of loading situationsa structural component may undergo from which mixed-mode loading is the most common. Most real-lifedelaminations initiate and propagate under the influence of combined normal and shear stresses. The mixed-mode fracture propagation was investigated by means of the Mixed-Mode Bending (MMB) test (Fig. 3).4
In this test the specimen is loaded by a combination of normal and shear forces, producing a specified ratiobetween the energies dissipated, respectively, in mode I and mode II delamination. For the sake of brevityonly an even combination (50/50 ratio) of modes was considered in these experiments. This means that 50%of energy is consumed in mode I delamination and 50% in mode II delamination. The fracture toughnessvalues measured for the three types of interfaces of Glare 3-2/1-0.4 are reported in Table 1.
III. Analytical and Numerical Analysis
The experiments are simulated using two-dimensional FE models where the individual layers are modelledwith standard geometrically nonlinear continuum elements. These elements can behave according to a
plastic plane strain constitutive relation. Due to their geometrical simplicity, it is also possible to simulate thefracture energy tests analytically by using Beam Theory and fracture Mechanics Theory. In the FE modelsthe bond between each two layers is simulated by means of the cohesive zone approach. In this approach, thefracture behaviour (delamination) is lumped into a single plane, which is represented by interface elementsplaced between two layers.1 These interface elements consist of two surfaces, which are attached to the
3 of 14
American Institute of Aeronautics and Astronautics

Interface GIc GIIc GIc/IIc
J/m2 J/m2 J/m2
Al L-direction/fibres 0o 2960.8 1705.8 757.2Fibre 90o /fibres 0o 3545.5 1349.4 672.7
Al L-direction/fibres 90o 3411.9 1623.1 622.7
Table 1. Mode I, mode II and mixed-mode fracture energy values measured for the three types of interfacesin Glare 3-2/1-0.44
adjacent continuum elements that model the layers (Fig. 4). The relative displacement of the two surfacesis a measure for the opening of the delamination crack. The opening is controlled by means of a cohesiveconstitutive relation that completely characterises the delamination process.
Figure 4. Simulation of delamination in a multiply material. The individual layers of the specimen in thetop-left picture are modelled by continuum elements, the adhesive that bonds the layers by interface elements(the right-hand-side pictures). The relative displacement of the interface elements (bottom left) is a measurefor the opening of the interface.
In this study, a bi-linear cohesive relation as suggested by Camanho and Davila2,3 (Fig. 5) is used. Thismodel consists of four material parameters: mode I and mode II fracture toughnesses (GIc and GIIc) andthe corresponding ultimate tractions (τIu and τIIu) at which debonding is initiated. A fifth parameter, η,is necessary to completely define the mixed-mode propagation criterion as function of GIc and GIIc only.This value must be extracted from the correlation of the test data. When loading an interface, the cohesiveelements initially behave in a linear-elastic way (point 1 in Figure 4). When the equivalent traction exceedsa limit value, based on the pure mode I and II ultimate tractions τIu/τIIu (Point 2 in Fig. 5), damageis initiated. If the displacements are further increased, the stiffness is gradually reduced to zero and thedelamination starts to propagate. A cohesive element becomes fully delaminated when it is unable to transferany further load (points 4 and 5 in Fig. 5). However, it is necessary to avoid interpenetration of the crackfaces. The problem is addressed by reapplying the normal penalty stiffness when interpenetration is detected.
A. DCB, ENF and MMB Test Simulations
The DCB, ENF and MMB tests are simulated in ABAQUS/Standard by means of two-dimensional, planestrain models. The aluminium and prepreg solid parts are modelled with 4-node solid elements. The
interface is modelled by user developed cohesive elements. The solid elements have a linear elastic constitutivebehaviour because, as previously explained, plastic behaviour was prevented by bonding two thick plates ofstrong aluminium to each side of the Glare 3-2/1-0.4 laminate specimen (Figure 2). For both aluminiumalloys (Al 2024-T3 from the Glare laminate and Al 7075-T6 from the bonded plates) equal isotropic propertiesare defined: E=73GPa and ν=0.33. The orthotropic properties of the glass-fibre prepreg, as used in thesimulations, are reported in Table 2.
In the thickness direction of the finite element model, at least two elements are required in the aluminiumlayers to avoid the phenomenon of shear locking in the DCB simulation. Alternatively, incompatible modeelements may be used but these require more computational resources than standard elements. In the
4 of 14
American Institute of Aeronautics and Astronautics
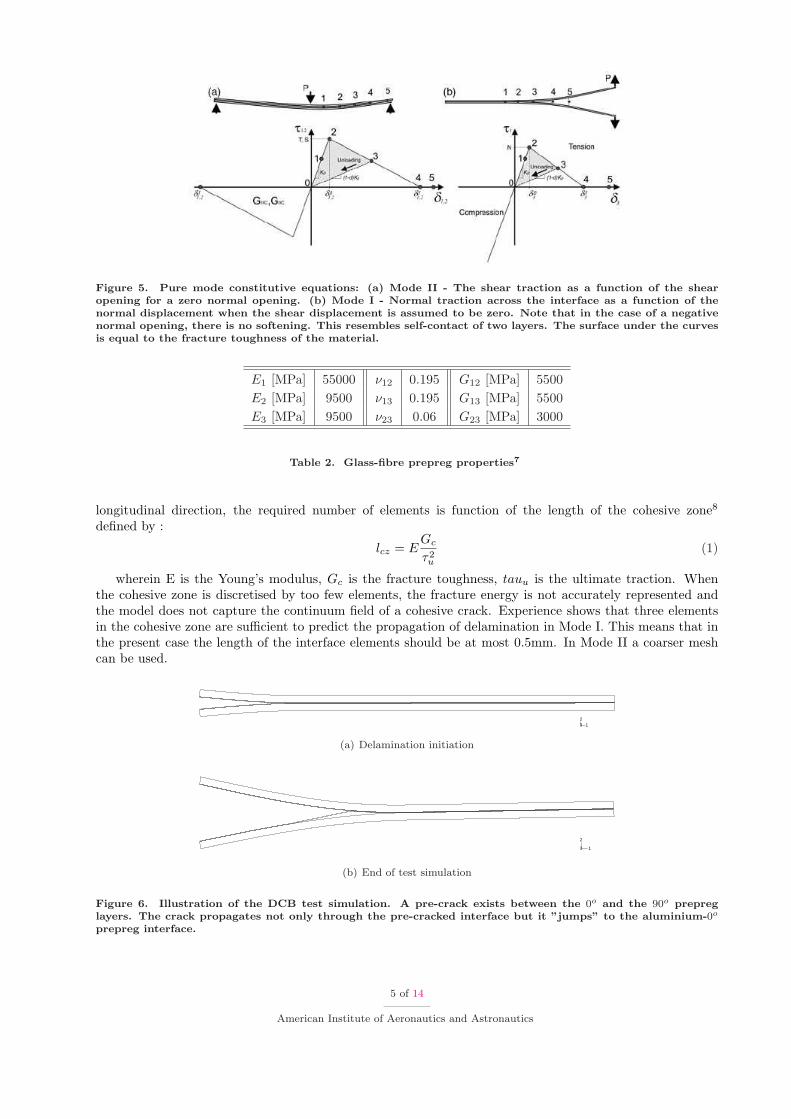
Figure 5. Pure mode constitutive equations: (a) Mode II - The shear traction as a function of the shearopening for a zero normal opening. (b) Mode I - Normal traction across the interface as a function of thenormal displacement when the shear displacement is assumed to be zero. Note that in the case of a negativenormal opening, there is no softening. This resembles self-contact of two layers. The surface under the curvesis equal to the fracture toughness of the material.
E1 [MPa] 55000 ν12 0.195 G12 [MPa] 5500E2 [MPa] 9500 ν13 0.195 G13 [MPa] 5500E3 [MPa] 9500 ν23 0.06 G23 [MPa] 3000
Table 2. Glass-fibre prepreg properties7
longitudinal direction, the required number of elements is function of the length of the cohesive zone8
defined by :
lcz = EGc
τ2u
(1)
wherein E is the Young’s modulus, Gc is the fracture toughness, tauu is the ultimate traction. Whenthe cohesive zone is discretised by too few elements, the fracture energy is not accurately represented andthe model does not capture the continuum field of a cohesive crack. Experience shows that three elementsin the cohesive zone are sufficient to predict the propagation of delamination in Mode I. This means that inthe present case the length of the interface elements should be at most 0.5mm. In Mode II a coarser meshcan be used.
123
(a) Delamination initiation
1
2
3
(b) End of test simulation
Figure 6. Illustration of the DCB test simulation. A pre-crack exists between the 0o and the 90o prepreglayers. The crack propagates not only through the pre-cracked interface but it ”jumps” to the aluminium-0o
prepreg interface.
5 of 14
American Institute of Aeronautics and Astronautics

Fig. 6 shows the stress contour plots for the DCB test simulations at two different loading stages:delamination initiation and the end of crack propagation, when a 35mm displacement is imposed to the topadherent tip while maintaining the lower adherent tip constrained in the X and Y directions. A pre-crackof 45mm in length between the 0o and the 90o prepreg layers is included in the model. This crack starts topropagate when the tip displacement is about 5mm. At a certain moment also the interface between the topaluminium layer and the 90o prepreg layer starts to debond (Fig. 6, bottom). Although fibre bridging wasobserved during the experiments, this crack ”jump” was not noticed. The computed stress values are around1150MPa in the 0o prepreg layer. It is certain that it would fail at much lower values possibly even beforethe crack has ”jumped”. The numerical models, however, did not take into account the phenomenon oftransversal matrix and fibre failure. Therefore, in the simulation the prepreg layer can sustain any load. Theexperimental and numerical results for tests with pre-cracks at different interfaces show similar behaviourto the simulations described above. The crack initiation starts approximately at a load of 300N. Once thedelamination starts to propagate the load sustained by the specimen starts to decrease gradually. Bothexperiments and simulations were stopped at an imposed tip displacement of 35mm for which the crack haspropagated about 100mm.
Fig. 7(a) shows the load-displacement behaviour of the DCB test. The crack ”jumping” and delaminationat two interfaces justify the unstable crack propagation. The maximum computed load is around 690N, 25%higher than the 550N achieved in testing. A better agreement with the experiments is obtained if the crackis not allowed to ”jump”, i.e. only the pre-cracked interface delaminates. This can be achieved by slightlyreducing the mode I ultimate traction value of such interface. The result is not only a better match of theload-displacement curves but also a more accurate prediction of the maximum load: 614N, 11% higher thanthe value obtained from experimentes. It should be realised that perfect interfaces are being simulated whilein laboratory they are virtually impossible to produce, i.e. there is always some porosity that degrades theadhesive properties. Despite porosity was globally reflected in the experimental measurement of the fracturetoughness, its local influence on the maximum load is unknown. Also, because of fibre bridging, a higher thanreal GIC may have been reported, as when this phenomenon occurs, more energy is necessary to propagatethe crack by the same length.
0
200
400
600
800
0 5 10 15 20 25 30 35
Displacement [mm]
Lo
ad
[N
]
Numerical, del. 1 interface
Fracture Mechanics Curve
Beam Theory Curve
Experimental Results
Numerical, del. 2 interfaces
(a) DCB
0
1000
2000
3000
4000
0 0.5 1 1.5 2 2.5 3 3.5
Displacement [mm]
Lo
ad
[N
]
Numerical Results
Fracture Mechanics Curve
Beam Theory Curve
Experimental Results
(b) ENF
0
200
400
600
800
1000
1200
0 1 2 3 4 5 6 7 8
Load Point Displacement [mm]
Lo
ad
[N
]Numerical Results
Fracture Mechanics Curve
Beam Theory Curve
Experimental Results
(c) MMB
Figure 7. Load-displacement curve for the DCB, ENF and MMB test simulations.
Delamination onset is predicted by the analytical models at the point of intersection between the BeamTheory curve with the Fracture Mechanics curve. Beam Theory predicts stiffer specimen behaviour thantested and numerically calculated. For the sake of simplification it is assumed that the pre-cracked part ofthe DCB deflects as a beam built-in at one of its tips (corresponding to the crack tip). This represents anover-constraint as, in reality, the pre-cracked part of the DCB forms a continuum with the bonded part, i.e. ithas finite stiffness at the crack-tip. The Fracture Mechanics Theory curve exactly matches the delaminationpropagation curve predicted by the FEA, however, because of the over-stiff linear part, delamination onsetis predicted at a higher load than experimented.
Fig. 7(b) depicts, as an example, the experimental, analytical and numerical load-displacement plotsfor mode II delamination propagation between the aluminium and the 90o prepreg layers in Glare 3-2/1-0.4. The unstable and catastrophic nature of the crack propagation is correctly captured by the analytical(notice the snap back behaviour of the Fracture Mechanics curve) and numerical simulations at very similarload and displacement values. The numerical model does not use the mixed-mode delamination energy in adirect form but rather by means of a function which interpolates the fracture toughness values for different
6 of 14
American Institute of Aeronautics and Astronautics

mixed-mode ratios, GII/GT :
GIC + (GIIC −GIC)[
GII
GI + GII
]η
, GT = GI + GII (2)
In this function, proposed by Benzeggagh and Kenane5 η should be tuned in such a way that the bestinterpolation of the experimental values is achieved. In this case, η=0.1 produces the best results. Fig. 7(c)shows the load-displacement behaviour of the MMB test for delamination propagation between aluminiumand 0o prepreg layers in Glare 3-2/1-0.4. The maximum load point is predicted with high accuracy, especiallyby the FEA.
B. ILSS Benchmark Test Simulation
The interface properties, previously determined by means of the DCB, ENF and MMB tests and correlatedwith analytical and numerical models, may be used in independent simulations of the Interlaminar Shear
Strength tests. The results may be directly compared to validate the model.
Figure 8. Left: ILSS Mechanical test set-up. Right: load boundary conditions in the FE model.
The geometry of the ILSS specimen is shown in Fig. 8. It consists of a 50x10mm strip of Glare 3-4/3-0.4.The two supports, separated by 10mm, are modelled as constraints preventing displacements in the verticaldirection only. A single discrete nodal displacement replaces the die that loads the specimen at its centreline. In order to remove rigid body modes, the displacement in the horizontal axis of the corresponding nodeis constrained. Most material properties are the same as used in the previously described models except forthe aluminium which is now simulated by a bilinear plastic behaviour with yield strength of 325MPa and ahardening curve slope of 12%. The complete behaviour is modelled in a quasi-static manner in the implicitfinite element code ABAQUS/Standard.
1
2
3
(a) Undeformed shape
1
2
3
(b) Deformed shape
Figure 9. Finite element model of ILSS test specimen.
Fig. 9(a) shows the undeformed finite element mesh of the ILSS specimen. It consists of 100 nonlinear,4 node elements in the length direction. In the thickness direction each aluminium and prepreg layer wasmodelled with just one element equipped with incompatible modes constitutive behaviour in order to preventshear locking. Experience shows that a higher number of elements in the vertical direction does not providea more accurate global solution.
The deformed mesh of a perfectly bonded ILSS specimen, for a load-point displacement of 0.3mm, isdepicted in Fig. 9(b). A close-up of one of the delaminated regions is provided in Fig. 10. Cracks start at
7 of 14
American Institute of Aeronautics and Astronautics

the shear-loaded interfacial regions between the support points and the loading point and they propagateprogressively to the specimen tips. The first delamination occurs at the inner prepreg-prepreg interface, notonly because the shear tractions are higher at the specimen midplane but also because the fracture toughnessof this interface, when loaded in shear (GIIc), is the lowest of the three different types of interfaces.
1
2
3
Figure 10. Close-up of the ILSS test specimen deformed mesh. Delaminations are visible at the inner prepreg-prepreg interface.
Shear stresses at interfaces 1 to 8 (counting from the lower surface of the model), are plotted in Fig. 11,for an imposed displacement slightly higher than the one that caused delamination onset. Shear stressesreach maximum values at the two regions between the loading point and the support points. Outside theseregions they are maintained at values close to zero. Shear stress values increase from the outer interfacesto the inner ones, e.g. from interfaces 1 to 3. The plots corresponding to the inner interfaces, speciallyinterface 5, show inflection points. In these interfaces the shear stresses started to decrease after they havereached the maximum shear traction values (τIIu=90MPa). The regions where this phenomenon is observedare delaminating. Further load increase leads to delamination propagation away from the load point.
-100
-80
-60
-40
-20
0
20
40
60
80
100
0 10 20 30 40 50
X [mm]
Sh
ea
r S
tre
ss
[M
Pa
]
(a) Interface 1
-100
-80
-60
-40
-20
0
20
40
60
80
100
0 10 20 30 40 50
X [mm]
Sh
ea
r S
tre
ss
[M
Pa
]
(b) Interface 2
-100
-80
-60
-40
-20
0
20
40
60
80
100
0 10 20 30 40 50
X [mm]
Sh
ea
r S
tre
ss
[M
Pa
]
(c) Interface 3
-100
-80
-60
-40
-20
0
20
40
60
80
100
0 10 20 30 40 50
X [mm]
Sh
ea
r S
tre
ss
[M
Pa
]
(d) Interface 4
-100
-80
-60
-40
-20
0
20
40
60
80
100
0 10 20 30 40 50
X [mm]
Sh
ea
r S
tre
ss
[M
Pa
]
(e) Interface 5
-100
-80
-60
-40
-20
0
20
40
60
80
100
0 10 20 30 40 50
X [mm]
Sh
ea
r S
tre
ss
[M
Pa
]
(f) Interface 6
-100
-80
-60
-40
-20
0
20
40
60
80
100
0 10 20 30 40 50
X [mm]
Sh
ea
r S
tre
ss
[M
Pa
]
(g) Interface 7
-100
-80
-60
-40
-20
0
20
40
60
80
100
0 10 20 30 40 50
X [mm]
Sh
ea
r S
tre
ss
[M
Pa
]
(h) Interface 8
Figure 11. Shear stress values at specimen interfaces (numbered from bottom-up). Prescribed displacement= 0.24mm, Load = 2000N
IV. Numerical Simulation of the Influence of Porosity
In this section, the model of the ILSS specimen described in the previous section is used to analyse theeffect of porosity at Glare 3-4/3-0.4 interfaces. Porosity can be modelled by reducing the ultimate strength
and/or the fracture toughness in a few elements at specific locations. Nevertheless, it is not obvious towhat extent these parameters should be reduced. In order to be on the safe side, the worst-case scenario isassumed, where the shear load carrying capability of the adhesive has locally been reduced to zero as if itwas delaminated. In the finite element model, the original cohesive constitutive relation in those interfaceelements is replaced by a traction-free relation. However, the normal compressive response is maintained in
8 of 14
American Institute of Aeronautics and Astronautics

order to simulate crack-closure effects.Three distinct cases have been considered. In the first two cases, the porosity is smeared evenly in a
single and in all model interfaces. In the third case, porosity is randomly distributed along the interfaces.The final case approximates the real situation where the size of the porous and the distance between themis variable.
A. Porosity in a Single Interface
In these analyses, each interface contains a level of porosity of 25%. Nine simulations have been carried out,each to study the interlaminar shear strength reduction caused by porosity in each interface at a time. Asmeared distribution of porosity is considered i.e., in the models, one of each group of four equally-sized,consecutive interface elements is set a priori to a delaminated state. This means that 25 out of the total100 interface elements is pre-delaminated.
The load-displacement curves corresponding to each of the nine single-interface porosity cases are plottedin Fig. 12(a). Overall, after an initial linear path, a non-linear behaviour is observed. This is due tothe delamination propagation at the porous interface. By increasing the load even further, delaminationseventually start at other interfaces and the aluminium layers start to deform plastically, overall reducingthe stiffness of the specimen. After a certain damage level the specimen is unable to sustain more load,i.e. a maximum strength point is reached. From this point on, the delaminations in the porous interfacerapidly propagate to neighbouring elements away from the centre of the specimen, drastically reducing itsstrength. However, the specimens still retain some of their strength because this sudden delamination doesnot propagate through the entire interface span.
0
500
1000
1500
2000
2500
0 0.05 0.1 0.15 0.2 0.25
Displacement [mm]
Lo
ad
[N
]
interface 1
interface 2
interface 3
interface 4
interface 5
interface 6
interface 7
interface 8
interface 9
Porosity in:
(a) Smeared porosity in discrete interfaces (level: 25%)
0
500
1000
1500
2000
2500
0 0.05 0.1 0.15 0.2 0.25
Displacement [mm]
Lo
ad
[N
]
No porosity
50% porosity
25% porosity
25% porosity in interface 5
(b) Several levels of smeared porosity in all interfaces
Figure 12. Load-displacement plots for several ILSS simulations including porosity. Interfaces with severaldegrees of porosity are characterised.
By comparing the different load-displacement curves and maximum strength points, it can be concludedthat a 25% porosity level in the outer ILSS specimen interfaces does not lead to a significative interlaminarshear strength reduction as compared with the nominal case, whereas if the porous interface is one of theinner ones, a remarkable decrease in strength is observed. This is because this level of porosity in the outerinterfaces does not trigger delamination propagation. Instead, as in the perfectly bonded case discussed inthe previous section, delamination onsets at the inner prepreg-prepreg interface where the combination of thehighest shear strain and the lowest fracture toughness occurs. When porosity is located at one of the threeinner interfaces, it triggers delamination propagation at the porous interface at a lower load level that couldbe achieved if the specimen was perfectly bonded. The maximum strength reduction (15.2%) is observedwhen porosity is located at the inner prepreg-prepreg interface, again due to the combination of the highestshear strain and the lowest fracture toughness.
9 of 14
American Institute of Aeronautics and Astronautics

B. Global Porosity
In these simulations, global smeared porosity up to a level 50% of the total interfacial area is considered.This corresponds to specimen models where up to 50% of all the cohesive elements are disabled of theirinterfacial stiffness. These 0.5mm long pre-delaminations are smeared along all the interfaces. The 50% levelporosity case is considered the worst-case scenario occurring in fibre-metal laminates.
1400
1600
1800
2000
2200
2400
2600
0 10 20 30 40 50
Porosity Level [%]
Ma
xim
um
Lo
ad
[N
]
Figure 13. Effect of the interfaceporosity level in the maximum loadsupported by an ILSS specimen.
The load-displacement curves corresponding to perfectly bonded,25% porous and 50% porous specimens are shown in Fig. 12(b). Theworst-case scenario leads to an interlaminar shear strength reductionof 30.8%. The 50% porosity case shows a very gradual decrease instrength after the maximum load-point while the cases correspond-ing to lower degrees of porosity are marked by sudden failure. Thisis explained by the way of progression of interface delaminations. Inthe 25% porosity level case, for example, the inner prepreg-prepreginterface starts to delaminate at a load level around 1500N. Thedelamination propagates at this interface alone until the maximumshear strength level is reached and another interface suddenly startsto delaminate and equilibrium is achieved a a much lower load level.In the 50% porosity level case, delaminations start at three inter-faces, barely at the same load level (1500N), and progress smoothlyfor increasing imposed displacement constraints.
It is interesting to notice that, for the 25% porosity level, thecases of global porosity and the porosity solely at the inner prepreg-prepreg interface produce similar results;around 15% reduction in shear strength. This means that, for this porosity level, the delamination of thisinterface dominates the shear failure process.
Fig. 13 is illustrative of the effect of porosity at all interfaces. The ultimate shear strength of an ILSSspecimen seems to be linearly dependent on the overall level of porosity. The maximum load computed forthe perfectly bonded ILSS is 2354N. On the other side, the worst-case porosity scenario results in a failureload of 1630N.
C. Random Porosity
In a real situation, the occurrence of porosity in a perfectly smeared fashion in one or all interfaces is ratherunlikely. Most probably, there will be small and large voids and the distance between them will vary either.The effects of this porosity randomness on the interlaminar shear strength of fibre-metal laminates may bequite significative and deviate form the results obtained for the smeared porosity cases. Therefore, for acorrect assessment of the effects of real-life porosity on the ILSS Glare, random porosity cases are considered.
27 cases of global and single interface porosity(25% and 50% porosity levels) were generated by randomlychoosing 25 or 50 of the interface elements corresponding to pre-delaminations. In the single interfacescenario, porosity is included only in the inner prepreg-prepreg interface (interface 5) since this representsthe worst case. Voids larger than the interface elements size (0.5mm) are obtained when two or moreconsecutive elements occur in the randomly generated list of element numbers. Similarly, if the differencebetween two consecutive members of that list is higher than average, it means that there will be a largeinterface area without any porous. On average, the 25% porosity level set generated 18.9 voids at eachinterface with an average length of 0.668mm, while the 50% porosity level set generated, on average, 25.7voids with a average length of 0.98mm. Naturally, the probability of the occurrence of two consecutivepre-delaminated interface elements is much higher in the 50% porosity set of cases than in the 25% set.
The load-displacement displacement curves corresponding to random porosity at the inner prepreg-prepreg interface are plotted in Fig. 14(a) and (b) for the 25% and 50% porosity levels, respectively.Similarly, the results for global porosity are depicted in Fig. 14(c) and (d) respectively for the 25% and50% porosity levels. The first important conclusion to take from these plots is that the scatter in the ILSSproduced by random porosity is remarkable. This may be explained by the scatter in the number of pre-delaminated elements in the region of the specimen between the two supports. As previously mentioned, thisis a critical shear-loaded area. The boundary and loading conditions here dominate the failure process ofthe whole specimen. As an example, in-depth observation of the single interface, 50% level porosity scenarioreveals that the specimen corresponding to the poorer results (1491.3N) has 13 pre-delaminated elements
10 of 14
American Institute of Aeronautics and Astronautics

in this region, for an average probability of having only 10 of these elements. Part of these elements aregrouped in two voids of 2mm and one of 1.5mm. The specimen that showed the highest ILSS (1872.4N)contains only 6 pre-delaminated elements in this region and most of them are dispersed except for a single1mm porous.
0
400
800
1200
1600
2000
0 0.05 0.1 0.15 0.2
Displacement [mm]
Lo
ad
[N
]
(a) Porosity in interface 5 (level: 25%)
0
400
800
1200
1600
2000
0 0.05 0.1 0.15 0.2
Displacement [mm]
Lo
ad
[N
]
(b) Porosity in interface 5 (level: 50%)
0
300
600
900
1200
1500
1800
2100
0 0.05 0.1 0.15 0.2
Displacement [mm]
Lo
ad
[N
]
(c) Global porosity (level: 25%)
0
300
600
900
1200
1500
0 0.05 0.1 0.15 0.2
Displacement [mm]
Lo
ad
[N
]
(d) Global porosity (level: 50%)
Figure 14. Load-displacement curves for 27 random porosity cases.
For the four scenarios of random porosity studied, Fig. 15 relates the probability of failure of a specimenwith failure load values, assuming that the results follow statistical normal distributions and that there isa significative number of occurrences in the universe of possible results. It can be said that, for porosity atthe inner prepreg-prepreg interface, 95% of the specimens fail at loads in the ranges [1631.6− 2194.6]N and[1473.2−1790.8]N for the 25% and 50% porosity level scenarios, respectively. Similarly, for the global porosityscenario, 95% of the specimens have a maximum interlaminar shear strength in the ranges [1532.1−1992.8]Nand [1052.4 − 1429.0]N respectively for 25% and 50% porosity levels. Curiously, the scatter for the 50%porosity level cases is greater than for the 25% porosity level ones, both for the single interface and globalporosity scenarios.
The ILSS values for the configurations analysed, as well as the amount of strength reduction due toporosity, are reported in Table 3. For the random porosity scenarios, average results are shown. The worst-case porosity configuration produces 46.5% reduction in the specimen shear strength and correspond to alevel of 50% of random porosity. Without exception, the random porosity scenarios lead to lower ILSS resultsthan the smeared porosity scenarios. Actually, for the global porosity scenarios, the results corresponding tothe smeared porosity cases do not even fall in the intervals of 95% probability of failure for the correspondingrandom porosity cases. This means that specimens with smeared porosity are a very particular case of allporosity cases and lead to failure results that highly surpass the average.
11 of 14
American Institute of Aeronautics and Astronautics

0
0.001
0.002
0.003
1490.9 1631.6 1772.4 1913.1 2053.8 2194.6 2335.3
Failure Load [N]
P(f
ailu
re)
(a) Porosity in interface 5 (level: 25%). Av. value = 1913.1N.St. deviation = 140.7N. 95% of the specimens fail at a load inthe range 1631.6-2194.6N
0
0.002
0.004
0.006
1393.8 1473.2 1552.6 1632.0 1711.4 1790.8 1870.2
Failure Load [N]
P(f
ailu
re)
(b) Porosity in interface 5 (level: 50%). Av. value = 1632.0N.St. deviation = 79.4N. 95% of the specimens fail at a load inthe range 1473.2-1790.8N
0
0.001
0.002
0.003
0.004
1416.9 1532.1 1647.3 1762.5 1877.6 1992.8 2108.0
Failure Load [N]
P(f
ailu
re)
(c) Global porosity (level: 25%). Av. value = 1762.5N. St.deviation = 115.2N. 95% of the specimens fail at a load in therange 1532.1-1992.8N
0
0.001
0.002
0.003
0.004
0.005
970.8 1062.4 1154.1 1245.7 1337.4 1429.0 1520.6
Failure Load [N]
P(f
ailu
re)
(d) Global porosity (level: 50%). Av. value = 1245.7N. St.deviation = 91.6N. 95% of the specimens fail at a load in therange 1052.4-1429.0N
Figure 15. Normal distributions of the ILSS of Glare 3-4/3-0.4 corresponding to several scenarios of porosity.
12 of 14
American Institute of Aeronautics and Astronautics

Unlike with the smeared porosity scenario, random porosity does not produce similar ILSS values forporosity only in the inner prepreg-prepreg interface or global porosity. This mays be due to the small numberof specimens analysed. This may also be the explanation for the fact that the average results for the randomporosity cases do not follow a linear dependency on the porosity level.
Specimen configuration ILSS [N] Strength reduction [%]
Perfectly bonded 2354 -25% smeared porosity in interface 5 1995 15.225% random porosity in interface 5 1913 18.7
25% global smeared porosity 2013 14.525% global random porosity 1762 (average) 25.1 (average)
50% random porosity in interface 5 1632 30.750% global smeared porosity 1630 30.850% global random porosity 1259 (average) 46.5 (average)
Table 3. Average ILSS of Glare 3-4/3-0.4 and shear strength reduction due to several porosity scenarios.
V. Conclusions and Recommendations
The existence of porosity is found to trigger delaminations at the interfaces between different layers infibre-metal laminates causing them to fail at lower loads than otherwise achievable. The present report
describes a study on the effects of such porosity on the interlaminar shear response of Glare. This workwas performed by means of analytical and numerical simulations of laboratory tests. The objective was toreplicate the ILSS experiments previously performed and quantify the decrease in Glare shear strength due toseveral degrees of porosity. Traditional finite eleent methods were used in combination with a cohesive zoneapproach developed by Camanho and Davila2,3 to simulate delamination onset and propagation at materialinterfaces. Though, its implementation in numerical models requires the input of nontrivial mechanicalmaterial properties such as the interface fracture toughness. Experiments were carried out to find theseproperties.4 Finite element simulations and simple analytical models based on Beam Theory and FractureMechanics Theory were then compared to these experiments, for the sake of model validation and fine-tuning of the interfacial ultimate traction values. Remarkable agreement was found between the mode Idelamination propagation test results and respective simulations. The catastrophic failure of the ENF andMMB tests does not allow for stable crack propagation. This unstable nature is correctly captured by theanalytical and numerical simulations at remarkably similar load-displacement points. An alternative testexists for the measurement of mode II stable delamination propagation. The Four-Point Bending experimentallows for the fracture energy to be measured with higher accuracy and a better correlation with numericalmodels.9
Perfect interfacial bonding and several porosity scenarios and levels of porosity were simulated with amodel of a Glare 3-4/3-0.4 ILSS test specimen. A remarkable agreement in the load displacement-behaviourwas achieved between these simulations and experiments previously performed, but not in the predictionof the maximum strength values. The tests reveal a failure load of 1650N for the specimens with the bestinterfacial quality, while the numerical models predict a 42% higher value (2354N). This could be explainedby the fact that perfectly bonded interfaces, as simulated, are virtually impossible to manufacture, i.e. thereis always some porosity that degrades the adhesive properties.
The inner Glare 3-4/3-0.4 prepreg-prepreg interface is the most prone to delaminate (hence the mostsensitive to porosity), since it combines the highest shear strains with the lowest fracture toughness.
Randomly generated porosity cases were simulated for a better agreement with reality. A significativedrop in the ILSS is observed when comparing these with the smeared porosity cases because of the probableexistence of larger voids located in the most critical specimen region for shear failure i.e. between thesupports. The worst-case porosity scenario simulated results in a 46.5% reduction of Glare interlaminarshear strength.
Several recommendations should be given for future work. First, the introduction of fibre and matrix
13 of 14
American Institute of Aeronautics and Astronautics

transversal failure criterions in the models. This would result in a better match with reality. Delaminationswould be allowed to propagate at any of the Glare interfaces and the phenomenon of ”crack jumping” couldbe analysed in more detail. Second, the realisation of 4-point bending test which would produce a stabledelamination in mode II, therefore leading to more accurate fracture toughness values and better correlationwith FE models. Third, the development of three dimensional models for the investigation of porosity intest specimens and in critical structural components. This would better answer the needs of the industry.Three dimensional models would also allow the modelling of voids with better geometrical resemblance withreality. Finally, a study onto the actual exact spatial distribution of voids in a porous layer would improvethe accuracy of the simulations.
VI. Acknowledgements
The funding of this work through the scholarship SFRH/BD/16238/2004 from the Portuguese Foundationfor Science and Technology is gratefully acknowledged.Special acknowledgements should be addressed at Mario Vesco for the realisation of the Fracture Energy
Tests,4 making the results available for this study and personal availability to answer to any questions relatedto the experimental work. Also Doobo Chung is acknowledge for his valuable ideas in the introduction ofprobability in the analysis of the effects of porosity in fibre-metal laminates.
References
1J.C.J. Schellekens, R. de Borst, “Free edge delamination in carbon-epoxy laminates: a novel numerical/experimentalapproach,” Composites and Structures, Vol. 28, 1994, pp. 357–373.
2P. P. Camanho, C. G. Davila, “Mixed-Mode Decohesion Finite elements for the Simulation of Delamination in CompositeMaterials,” Tech. rep., NASA, Langley Research Center, Hampton, VA, June 2002, NASA/TM-2002-211737.
3P. P. Camanho, C. G. Davila, M .F. de Moura, “Numerical Simulation of Mixed-Mode Progressive Delamination inComposite Materials,” Journal of Composite Materials, Vol. 37, No. 16, August 2003, pp. 1415–1438.
4M. Vesco, J. Sinke, “Response and damage evolution in GLARE laminates under indentation loads - Experimental results,”Tech. rep., Faculty of Aerospace Engineering, Delft University of Technology, Delft, The Netherlands, February 2005, ReportB2V-05-01.
5M.L. Benzeggagh, M. Kenane, “Measurement of Mixed-Mode Delamination Fracture Toughness of UnidirectionalGlass/Epoxy Composites with Mixed-Mode Bending Apparatus,” Composite Science and Technology, Vol. 56, 1996, pp. 439–49.
6Y. Mi, M. A. Crisfield, “Analytical Derivation of Load/Displacement relationship for the DCB and MMB and Proof ofthe FEA Formulation,” Tech. rep., Department of Aeronautics, Imperial College, London, United Kingdom, April 1996.
7Ad. Vlot, Fibre Metal Laminates (An Introduction), Kluywer Academic Publishers, 2001.8A. Turon, C. G. Davila, P. P. Camanho, J. Costa, “An Engineering Solution for using Coarse Meshes in the Simula-
tions of Delamination with Cohesive Zone Models,” Tech. rep., NASA, Langley Research Center, Hampton, VA, March 2005,NASA/TM-2005-213547.
9C. Schuecker, B. D. Davidson, “Evaluation of the accuracy of the four-point bend end-notched flexure test for mode IIdelamination toughness determination,” Composites Science and Technology, Vol. 60, 2000, pp. 2137–2146.
14 of 14
American Institute of Aeronautics and Astronautics